isbank earnings presentation 2018 q3 · 6 7 8 jan mar may jul sep usd/try bist 100 2y bm yield 10...
TRANSCRIPT

ISBANK
EARNINGS
PRESENTATION
2018 Q3

2018 Q3 Recent Developments in the Economy
Emerging markets have remained under pressuremainly due to unfavorable global funding conditions.
-50
0
50
100
150
17Q1 17Q2 17Q3 17Q4 18Q1 18Q2 18Q3 Oct
Total Portfolio Flows into Emerging Markets(billion USD)
Equity
Debt
In the third quarter, volatility was significantlyhigher in domestic markets.
40
45
50
55
60
Jan Mar May Jul Sep
Manufacturing PMI
0
10
20
30
Jan Mar May Jul Sep
Annual CPI Inflation (%)
Slowdown in the domestic economic activity hasgained momentum while price stability became thefocal point.
3
4
5
6
7
8
Jan Mar May Jul Sep
USD/TRY
BIST 100
2Y BM Yield
10
15
20
25
30
80
90
100
110
120
130
Jan Mar May Jul Sep
(%)(000)
Bin
ler
BIST 100 - 2Y Benchmark
IIF data
2

3
Period’s Highlights
Sustained strong performance in core revenue items:
8.8% QoQ growth in SWAP Adjusted NII Strong contribution of fee income continued in Q3 – YoY fee income growth
reached 27.5%
3.92% SWAP adjusted NIM for the first nine months is above the full-year guidance
TL loan – deposit spread maintained above 6% Highest share of demand deposits among peers – at 27%
Lower NPL ratio* compared to peers and average of private-sector banks
Strong FX liquidity – FX LCR at 230.8% for Q3 average, despite repayment of thesyndicated loan (1.1 bn USD) and redemption of Eurobond (750 mn USD).
Comfortable level of CAR above 14% without the impact of the current temporary measures
*Adjusted for NPL sales made by peers.

14.8%
27.2%
27.5%
35.1%
24.3%
-6.3%
8.4%
5.4%
18.6%
RoAA & RoATA
1.84%1.55%
1.85%
1.56%
2017 2018 Q3
RoAA RoATA
15.4%13.6%
16.3%
14.2%
2017 2018 Q3
RoAE RoATE
8.8%
4
Strong Growth in Major Revenue Items Maintained
2018 Q3 Revenue Growth & OPEX
RoAE & RoATE
(1) 2017 9M vs 2018 9M(2) 2018 Q3 and 9M income figures include income from participations according to IAS 27 and excludes 504 mn TL of IFRS 9 impact on other operating income(3) Tangible Equity (TE) and Tangible Assets (TA) are calculated by the deduction of M-t-M valuation differences regarding AFS (FVOCI) portfolio and real estates from shareholders’
equity and total assets. (4) Calculated using restated figures according to IAS 27(5) 9M figures are annualized.(6) Adjusted for non-recurring and other items
NII
Net F&C
QoQ YoY(1)
OPEX
(4) (4)(5) (5)
NII (Swap adj.)
Total Op. Income (2)
Profitability Ratios (3)
Cost / Income
42.3%37.6%
40.5%35.1%
2017 2018 Q3
Reported Adjusted
(4) (2) (5)
(6)

QoQ Growth. YtD Growth.
• Highest market share in total loans • Largest demand deposits
• Share of loans in total assets is at . • Share of demand deposits: 26.8% in total ( in TL, in FX deposits)
IEAs make up of total assets as of 2018 Q3.
28.9%
-8.8%
-10.4%
-2.8%
2.6%
13.9%
10.9%
Total TL FX (USD)-5.7%
-8.5%
-1.5%
-2.8%
2.7%
1.0%
3.1%
0.1%
11.5%
9.3%
8.3%
11.6%
Total TL FX (USD)
5
Selective Growth Funded with a Cost-Oriented Approach
Assets Liabilities
Deposits
Non- DepositFunding
Shareholders’Equity
(1) Interest earning assets include Central Bank reserves.(2) Non-deposit funding includes repo&money market, funds borrowed, securities issued and subordinated debt.(3) Among private sector banks(4) Excluding interbank deposits.
(1)
(2)
65.6%
89.7%
24.7%(4)
QoQ Growth.
(3) (3)
Total Assets
Total IEA
Securities
Loans
3.4%
21.7%
3.2%
-4.6%
18.1%
12.3%
-10.5%
20.3%
6.4%
-11.5%
22.7%
7.7%
-8.1%
19.3%
3.3%
-15.7%
36.4%
12.4%
-8.6%
8.4%
YtD Growth.
(4)
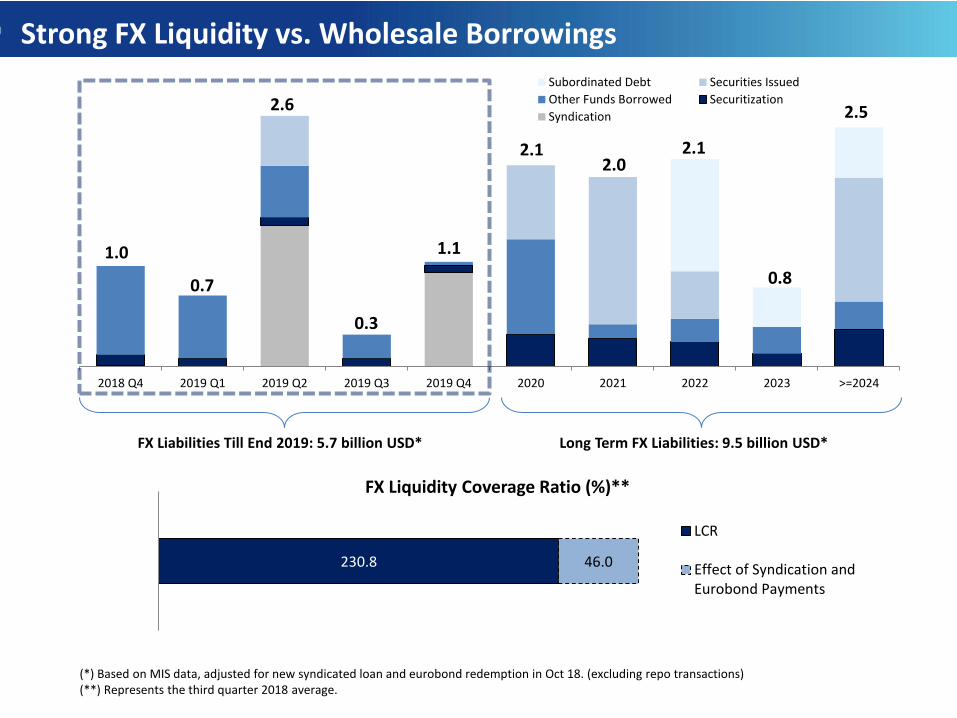
2018 Q4 2019 Q1 2019 Q2 2019 Q3 2019 Q4 2020 2021 2022 2023 >=2024
Subordinated Debt Securities Issued
Other Funds Borrowed Securitization
Syndication
1.0
0.7
2.6
0.3
2.12.0
2.1
0.8
2.5
1.1
FX Liabilities Till End 2019: 5.7 billion USD* Long Term FX Liabilities: 9.5 billion USD*
Strong FX Liquidity vs. Wholesale Borrowings
230.8 46.0
FX Liquidity Coverage Ratio (%)**
LCR
Effect of Syndication andEurobond Payments
(*) Based on MIS data, adjusted for new syndicated loan and eurobond redemption in Oct 18. (excluding repo transactions)(**) Represents the third quarter 2018 average.

4,2515,040
3,7394,329
2018 Q2 2018 Q3
NII NII (incl. swap cost)
Swap Adjusted NIM Evolution
7
Solid NIM Performance Maintained
Net Interest Income (TL mn.)
Yield/Cost (Quarterly)(1)
NIM(1)(2)
(1) Based on MIS data.(2) Interest earning assets include Central Bank reserves. NPL accruals are excluded. (3) Including demand deposits.
9,653
13,040
8,55810,626
2017 9M 2018 9M
18.6%
8.8%24.3%
35.1%
14.31% 14.67% 15.28% 15.71%17.80%
10.15% 10.87% 10.61%11.88%
14.77%
9.22% 9.20% 9.16% 9.22%
11.61%
Loan Yield
SecuritiesYield
DepositCost
7
TL
FX5.52% 5.73% 6.02% 6.56% 7.54%
4.28% 4.71% 4.76% 5.26%6.56%
1.36% 1.35% 1.41% 1.44% 1.68%
17 Q3 17 Q4 18 Q1 18 Q2 18 Q3
(3)
4.03%3.72%
+82 bps +32 bps +4 bp-55 bps
-51 bps-43 bp
Quarterly. Cumulative.
4.86% 4.97%
4.03%3.72%
18 Q2 18 Q3
NIM NIM - Swap Adjusted
4.39%4.85%
3.86% 3.92%
2017 18 9M

40.1%
99.9%
59.9%
Floating Fixed
60.2%
39.1%
86.1%
13.3%
Held fortradingAFS
HTM
(TL mn.) 2017 2018 Q2 2018 Q3 ∆ QoQ ∆ YtD
Total Securities 57,352 62,576 67,754 8.3% 18.1%
TL Securities 46,069 50,182 51,716 3.1% 12.3%
FX Securities 11,283 12,394 16,038 29.4% 42.2%
FX Securities (USD mn) 3,013 2,736 2,695 -1.5% -10.5%
8
Increasing Contribution from Securities
Securities
FX TL
• As of 2018 Q3 CPI Linkers make up 46.7% of TL securities.
• By the end of September 2018, if the current inflation rate (24.52%) was used in CPI Linker valuation:
• 9M Swap adj. NIM would stand at 4.10% vs 3.92%
• RoAA would be 1.71% vs 1.55%
• RoATE would stand at 15.6% vs 14.2%
Composition of Securities2018 Q3 2017
2018 Q3
FVTPL
FVOCI
FVMaAC
CPI Linkers
CPI Linkers 18 Q1 18 Q2 18 Q3
Quarterly Yield 11.28% 13.53% 18.05%
Quarterly Interest Income (TL mn) 551 698 1,019
Inflation 18 Q2 18 Q3
Expected-12 Months 10.47% 14.46%
Expected-24 Months 9.18% 11.42%
Actual 15.39% 24.52%

2,439
3,110
2017 9M 2018 9M
9
Robust Fee Income Performance Sustained
Net Fees & Commissions (TL mn.)
F&C Growth (2018 Q3)
• Share of net F&C income in total operatingincome* is 18.9% as of 2018 9M.
•OPEX coverage of Net F&C income reached50.2% as of 2018 9M.
Net Fees & Commissions Composition
5.4%
22.8% 20.3%
39.2% 42.2%
8.2% 7.7%
29.8% 29.8%
2017 9M 2018 9M
Lending Related Fees
Mutual Fund Man. &Other Inv. Acc. Fees
Payment Systems
Other
27.5%
* Total operating income includes income from participations according to IAS 27. IFRS 9 impact of 504 mn TL on other operating income in 2018 9M is excluded.
1,066 1,123
2018 Q2 2018 Q3
Growth ∆ QoQ ∆ YoY
Cash Loans -4.9% 9.9%
Non-Cash Loans 15.6% 39.8%
Mutual Fund Man. & Other Inv. Acc. Fees 10.8% 20.6%
Payment Systems 8.7% 37.2%
Other -7.0% 13.8%
Total F&C (Net) 5.4% 27.5%

• Specific Gross CoR (6) is 133 bps by 2018 9M.
• Share of Stage 2 Loans is 10.3%.
• Around 55% of Stage I+II provision expenses in Q3 stems from the model impact.
0.57%2.29%
3.73%
Net NPL Formation Rate
77
9 1,8
61
3,1
37
43
2
40
9
56
0
34
6
1,4
53
2,5
77
18 Q1 18 Q2 18 Q3
Additions Recoveries Net NPL Formation
Net Cost of Risk (2018 9M) (5)
3.6%
5.3%
2.4%
5.6%
3.7%
2.1%
4.6%
3.3%
4.2%
3.4%
Consumer
Credit Cards
Corp. & Comm.
SME
Total
Isbank Private-Sector Banks
(1) Adjusted for the NPL sales made by peer group banks in the period.(2) Net NPL Formation / Average Performing Loans
10
Lowest NPL Ratio Among Peers (1)
NPL Trends (Quarterly) (TL mn.)
NPL Ratios by Loan Categories (2018 Q3)
Coverage Ratios
Coverage Ratios
2018 Q1 2018 Q2 2018 Q3
PerformingLoans
Stage 1 0.7% 0.8% 0.9%
Stage 2 8.8% 9.8% 10.9%
NPLStage 3 71.7%(3) 65.8%(3) 57.5%(3)
Stage 3-Total 157.6%(4) 143.6%(4) 128.8%(4)
(3) Provisions for Stage 3 Expected Credit Losses / Non-performing Loans(4) (Provisions for Stage 1+2+3 Expected Credit Losses + Free Provisions) / Non-performing Loans(5) (Stage 1+2+3 Expected Credit Losses-Reversals) / Average Performing Loans(6) Stage 3 Expected Credit Losses / Average Performing Loans
Total
Prov. for Exp. Credit Loss. (TL mn) Q1 Q2 Q3 9M
Stage 1 7 269 664 940
Stage 2 589 357 1,065 2,011
Stage 3 532 824 1,228 2,584
Reversals (TL mn) (-) Q1 Q2 Q3 9M
Stage 1+2 504 11 3 518
Stage 3 211 303 155 669
Net CoR 223 bps
(2)

17.42%
0.36%
0.56%
0.16%
-0.30%
-2.47%
0.96%
2.27%
15.88%
2018 Q3
Net Income
Other
Real Estate Revaluation
MtM Losses in the period
Currency Depreciation Impact
BRSA Forbearance (MtM Losses)
BRSA Forbearance (Currency Fix.)
2018 Q2
(%) 2018 2019
Capital Conservation Buffer 1.875 2.5
Counter Cyclical Buffer 1.875 2.5
SIFI Buffer (4) 1.5 2
Min. Legal Requirement for CAR 8 8
CAR (Bank-only) 11.75 13.00
CAR (Consolidated) 13.25 15.00
RWAs vs. Regulatory Capital
11
Comfortable Capitalization
Capital Adequacy Ratio
(TL mn.)
(3) As of 2018 Q3, %0.04 on a bank-only basis(4) Taken into consideration only on a consolidated basis
16
.98
%
16.6
5%
16
.51
%
15
.88
%
17
.42
%
14
.06
%
13
.99
%
13
.78
%
13
.06
%
14
.26
%
17 Q3 2017 18 Q1 18 Q2 18 Q3
CAR Tier I Ratio
286,
600
303,
609
320,
567
340,
577
34
5,9
22
48,6
72
50
,56
0
52,9
27
54,0
89
60,2
47
17 Q3 2017 18 Q1 18 Q2 18 Q3
RWAs Regulatory Capital
154 bps
Change in CAR M
ax.
(3)
Max.
(1) Includes both impacts on RWA and capital (due to the general provision cap on Tier 2 capital).(2) Includes other impacts both on RWA and equity.(3) Forbearance impacts are calculated indivually. Including the combined impact, CAR stands at14.41% excluding forbearance measures.
(1)
(2)
(3)
12
Page 12 – Digitalisation
Page 13 – Asset Structure
Page 14 – Loans
Page 15 – Loan Composition
Page 16 – Securities
Page 17 – Liabilities Structure
Page 18 – Deposits
Page 19 – Income Statement Highlights
Page 20 – Fees & Commissions Income
Page 21– Market Shares
Appendix

Strong Focus on Digitalisation
13
(*) Source: TBA, as of 2018/Q2 (*) Number of sales in 2018 Q3
Evolution of Share of Transactions per Channel Digital Banking-Number of Customers (‘000)
Mobile Banking Market Shares * Share of Digital Channels in Retail Sales *
7 mndigital
customers
2071,620
5,219
2,792
5,596
2,788
5,925
2,753
6,317
2,738
Mobile Banking Internet Banking
2011 2017 2018 Q1 2018 Q2 2018 Q3
# Transactions Mobile Banking
Investment 30,2%
Credit Cards 17,9%
Money Transfer 14,5%
Payments 13,5%
37.6%
14.2%
30.3% 18.9%
2.2%
51.6%
74.8%
88.4%
2011 2014 2015 2016 2017 2018Q1
2018Q2
2018Q3
Internet Banking ATM Mobile Banking Total Non-Branch
61.0%67.4%
TL Time Deposits GPLs

91.5% 91.6% 89.7%
IEA / Total Assets
7.5% 7.5% 8.9%
66.1% 65.5% 65.6%
15.8% 15.7% 15.2%
10.6% 11.3% 10.3%
2017 2018 Q2 2018 Q3
Cash & Banks
Securities
Loans
Participations & Other Assets
14
Asset Structure
Asset Composition
Assets(TL mn.) 2017 2018 Q2 2018 Q3 ∆ QoQ ∆ YtD
Cash & Banks 38,424 44,879 45,848 2.2% 19.3%
Securities (Net) 57,352 62,576 67,754 8.3% 18.1%
Loans 239,409 261,043 291,276 11.6% 21.7%
Participations (Net) 13,802 14,838 16,837 13.5% 22.0%
Fixed Assets (Net) 5,163 5,159 5,851 13.4% 13.3%
Other Assets 8,095 9,843 16,769 70.4% 107.2%
Total Assets 362,244 398,340 444,334 11.5% 22.7%
TL Assets 221,167 232,049 238,266 2.7% 7.7%
FX Assets 141,077 166,291 206,069 23.9% 46.1%
FX Assets (USD mn.) 37,671 36,709 34,633 -5.7% -8.1%

Loans
15
Loan Portfolio
(1) Including overdraft accounts(2) (3) SME definition includes companies with number of employees < 250 and turnover or total assets <= TL 40 mn. for 2017 ; companies with number of employees < 250 andturnover or total assets <= TL 125 mn. for 2018 Q2 and 2018 Q3.
(TL mn.) 2017 2018 Q2 2018 Q3 ∆ QoQ ∆ YtD
Total Loans 239,409 261,043 291,276 11.6% 21.7%
TL Loans 147,442 151,989 152,112 0.1% 3.2%
Retail Loans 56,913 58,102 59,219 1.9% 4.1%
Housing Loans 20,852 21,372 21,304 -0.3% 2.2%
Auto Loans 676 700 688 -1.7% 1.8%
GPLs(1) 23,354 23,863 24,141 1.2% 3.4%
Credit Card Loans 12,031 12,167 13,085 7.5% 8.8%
Non-Retail Loans 90,529 93,887 92,893 -1.1% 2.6%
SME Loans(2) 51,611 59,450 56,553 -4.9% 9.6%
Commercial and Corporate Loans 38,918 34,438 36,339 5.5% -6.6%
FX Loans 91,967 109,054 139,164 27.6% 51.3%
SME Loans(2) 3,457 7,384 9,081 23.0% 162.7%
Commercial and Corporate Loans 88,510 101,670 130,083 27.9% 47.0%
FX Loans (USD mn.) 24,557 24,074 23,389 -2.8% -4.8%
SME Loans(2) 923 1,630 1,526 -6.4% 65.3%
Commercial and Corporate Loans 23,634 22,444 21,863 -2.6% -7.5%

96.2% 93.2% 93.5%
3.8% 6.8% 6.5%
2017 2018 Q2 2018 Q3
SME
Commercial& Corporate
26.4% 22.7% 23.9%
35.0% 39.1% 37.2%
38.6% 38.2% 38.9%
2017 2018 Q2 2018 Q3
Retail
SME
Commercial &Corporate
16
Loan Composition
(1) Including retail overdraft accounts(2) Shows retail credit card balances only(3) SME definition includes companies with number of employees < 250 and turnover or total assets <= TL 40 mn. for 2017 ; companies with number of employees < 250 andturnover or total assets <= TL 125 mn. for 2018 Q2 and 2018 Q3. (4) Including retail credit cards and overdraft accounts
Currency Mix
Loan Composition - FX LoansLoan Composition - TL Loans
Loan Composition - Total Loans
(3)
(2)
(3)
(3)(4)
(1)
61.6% 58.2% 52.2%
38.4% 41.8% 47.8%
2017 2018 Q2 2018 Q3
FX
TL
53.2% 52.1% 57.1%
23.0% 25.6% 22.5%5.0% 4.7% 4.5%
18.7% 17.6% 15.8%
2017 2018 Q2 2018 Q3
Consumer
Credit Cards
SME
Commercial& Corporate

Liabilities Composition
Liabilities Structure
(TL mn.) 2017 2018 Q2 2018 Q3 ∆ QoQ ∆ YtDDeposits 203,752 219,102 243,039 10.9% 19.3%
REPOs & Money Market 19,834 25,425 25,293 -0.5% 27.5%
Funds Borrowed 38,424 45,462 50,300 10.6% 30.9%
Securities Issued 25,911 30,076 37,841 25.8% 46.0%
Other 31,338 33,200 41,271 24.3% 31.7%
Equity 42,984 45,075 46,591 3.4% 8.4%
Total Liabilities & Equity 362,244 398,340 444,334 11.5% 22.7%
TL Liabilities 184,941 191,429 198,704 3.8% 7.4%
FX Liabilities 177,303 206,911 245,630 18.7% 38.5%
FX Liabilities (USD bn.) 47,344 45,676 41,282 -9.6% -12.8%
Liabilities
(*) Includes subordinated debt.
(*)
(*)
81.8% 82.8% 83.1%
IBL / Total Liabilities
17

25
.4%
25
.4%
25
.3%
26
.6%
24
.5%2
8.1
%
27
.4%
26
.0%
28
.0%
29
.0%
26
.4%
26
.3%
25
.3%
27
.0%
26
.8%
17 Q3 2017 18 Q1 18 Q2 18 Q3
TL FX Total
18
Deposit Base
Deposits
Demand Deposits / Total Deposits Demand Deposits Market Share
(*) Excluding interbank deposits
(*)(*)
15.3% 15.5% 14.7% 14.5% 14.4%
17 Q3 2017 18 Q1 18 Q2 18 Q3
(TL mn.) 2017 2018 Q2 2018 Q3 ∆ QoQ ∆ YtD
Total Deposits 203,752 219,102 243,039 10.9% 19.3%
TL Deposits 97,050 97,784 100,299 2.6% 3.3%
TL Saving Deposits 66,682 68,217 69,179 1.4% 3.7%
TL Commercial Deposits 25,045 25,258 25,572 1.2% 2.1%
Other TL Deposits 5,323 4,310 5,548 28.7% 4.2%
FX Deposits 106,702 121,317 142,740 17.7% 33.8%
FX Deposits (USD mn.) 28,492 26,781 23,990 -10.4% -15.8%
Demand Deposits 53,501 59,073 65,243 10.4% 21.9%

(TL mn.) 2018 Q2 2018 Q3 ∆ QoQ 2017 9M 2018 9M ∆ YoY
Net Interest Income 4,251 5,040 18.6% 9,653 13,040 35.1%
(-) SWAP Cost 712 1,191 67.3% 1,102 2,415 119.1%
Net Interest Income Incl. Swap Cost 3,539 3,849 8.8% 8,551 10,625 24.3%
Net Fees & Commissions 1,066 1,123 5.4% 2,439 3,110 27.5%
Net Trading Gains/Losses Excl. Swap Cost -57 -39 -31.9% -126 -261 106.7%
Other Operating Income 379 228 -39.9% 915 1,404 53.5%
Total Operating Income 4,927 5,162 4.8% 11,778 14,879 26.3%
HR Expenses 1,007 864 -14.2% 2,511 2,786 10.9%
Non-HR Expenses 1,176 1,181 0.4% 2,882 3,406 18.2%
Total Operating Expenses 2,183 2,045 -6.3% 5,393 6,192 14.8%
(-) Pre-provision for pension fund 125 150 20.0% 180 365 102.8%
Total Operating Expenses - Adj. 2,058 1,895 -7.9% 5,213 5,827 11.8%
Operating Profit 2,744 3,116 13.6% 6,385 8,687 36.0%
Operating Profit - Adj. 2,869 3,266 13.9% 6,565 9,052 37.9%
Stage 3 Expected Credit Losses 824 1,228 48.9% 1,610 2,584 60.5%
Stage 1+2 Expected Credit Losses 625 1,729 176.6% 325 2,950 807.3%
Other Provision Charges 154 -146 NM 106 11 -89.3%
Total Provision Charges 1,604 2,811 75.3% 2,041 5,545 171.7%
(-) Free Provisions 150 -150 NM 0 0 NM
Total Provision Charges - Adj. 1,454 2,961 103.7% 2,041 5,545 171.7%
Income from Participations 669 902 35.0% 1,161 2,081 79.2%
Tax Provisions 280 -31 -110.9% 948 650 -31.5%
Net Income 1,528 1,238 -19.0% 4,557 4,573 0.4%
NM: Not meaningful(1) Based on MIS data(2) 504 mn TL of this figure is resulting from IFRS 9 impact on other income. 19
Income Statement Highlights
(1)
(2)

20
Fees & Commissions Income
(TL thousand) 2018 Q2 2018 Q3 ∆ QoQ 2017 9M 2018 9M ∆ YoY
Non-Cash Loans 196,014 226,660 15.6% 420,505 587,726 39.8%
Cash Loans 114,100 108,462 -4.9% 307,431 337,976 9.9%
Mutual Fund Man. & Other Inv. Acc. Fees 76,674 84,940 10.8% 199,117 240,036 20.6%
Payment Systems 458,528 498,444 8.7% 956,594 1,312,026 37.2%
Other 220,385 204,856 -7.0% 555,389 632,204 13.8%
Total Fees & Commissions Income (Net) 1,065,700 1,123,363 5.4% 2,439,036 3,109,968 27.5%
Total Fees & Commissions Income (Gross) 1,298,465 1,413,050 8.8% 2,926,411 3,815,791 30.4%
*
* Including fund transfer, insurance, account keeping and other fees

2017 2018 Q3 2017 2018 Q3
Total Assets 11.7 11.4 1st 1st
Total Loans 11.8 11.6 1st 1st
TL Loans 11.0 10.8 1st 2nd
FX Loans 13.4 12.8 1st 1st
Consumer Loans(3) 11.7 11.5 2nd 2nd
Non-Retail Loans 11.8 11.6 1st 1st
Total Deposits 12.0 11.4 1st 2nd
TL Deposits 10.5 9.9 1st 2nd
FX Deposits 13.8 12.8 1st 1st
Demand Deposits 15.5 14.3 1st 1st
Market Shares (%) (1) Rank (2)
21
Market Shares
(1) Market share calculations are based on weekly BRSA data excluding participation banks. Total assets market share is based on monthly BRSA data.(2) Ranking among private banks. (3) Including retail overdraft accounts
Largest Private Bank…

22
Disclaimer
The information in this document has been obtained by Türkiye İş Bankası A.Ş. (“Isbank”) from sources believedto be reliable, however, Isbank cannot guarantee the accuracy, completeness, or correctness of suchinformation. This document has been issued for information purposes only. The financial reports andstatements announced by Isbank to the public and the relevant corporations are accepted to be the solematerial. Isbank does not accept any liability whatsoever for any direct, indirect or consequential loss arisingfrom any use of this document or its contents due to the misleading information in this document. Allestimations, opinion, all forward looking statements and projections expressed, implied, contained in thisdocument are the current beliefs or expectations of Isbank’s management as of the date of this document andare subject to significant risks, uncertainties and changes in circumstances. Actual results, performance orevents could differ materially from those expressed or implied in the estimations, opinions and forward-lookingstatements in this document. All estimations, opinions and forward-looking statements contained in thisdocument can be subject to change without notice. Isbank expressly disclaims any obligation or undertaking torelease publicly any updates or revisions to any estimations, opinions, forward-looking statements contained inthis document to reflect any change in Isbank’s expectations with regard thereto or any change in events,conditions or circumstances on which any such statement is based. This document can not be interpreted as anadvice to the investors or as an offer or solicitation for the purchase or sale of any financial instrument or theprovision of an offer to provide investment services and Isbank can not be held responsible for the results ofinvestment decisions made on account of this document. This document has been issued specially to the person,whom the document is concerned and may not be reproduced, distributed, published or shared with thirdparties for any purpose. All rights of Isbank are reserved.

23
Contact Information:
Türkiye İş Bankası A.Ş.Head OfficeInvestor Relations Division
Phone: + 90 212 316 16 02Fax: + 90 212 316 08 39E-mail: [email protected]