isbn 978-0-9925622-2-9 gold and islamic stocks: a … · naveed raza university malaysia terengganu...
TRANSCRIPT
Proceedings of the Asia Pacific Conference on Business and Social Sciences 2015, Kuala Lumpur
(in partnership with The Journal of Developing Areas)
ISBN 978-0-9925622-2-9
181
GOLD AND ISLAMIC STOCKS: A HEDGE AND SAFE
HAVEN COMPARISON IN TIME AND FREQUENCY
DOMAIN FOR BRICS MARKETS
Naveed Raza
University Malaysia Terengganu
Ahmad Ibn Ibrahimy
University Malaysia Terengganu
Azwadi bin Ali
University Malaysia Terengganu
ABSTRACT
This paper has investigated the role of safe haven asset in time and frequency domain while comparing returns
on gold and Dow Jones Islamic world Emerging Market index for two different crises periods by using the daily
data from January 1st 1996 to December 31st 2014. Wavelet coherency has been utilized to ascertain the best
time frequency to determine hedge and safe haven ability of gold. Our result indicates that gold maintain its
capacity as hedging instrument for BRICS in short and long-run during Asian financial crises of 1997-98 and in
2007 global financial crises gold exhibits a weak safe haven in long-run and hedge or safe haven property of
gold is market specific. Islamic stock index (DJIEM) and conventional stock markets are co-integrated except
china where low correlation is witnessed. Gold has also played a leading role in world Islamic emerging markets
and displayed negative correlation across a range of frequencies. Moreover, results of the panel co-integration
depicted that the Islamic emerging and BRICS equity markets are co-integrated and global investor should
carefully monitor the risk associated with the varying diversification benefits.
Keywords: Gold, BRICS, Islamic stocks, Wavelet Coherency, Co-integration.
Corresponding Author’s Email Address: [email protected]
1. INTRODUCTION
The role of safe haven assets, especially the Gold, to protect the portfolio during financial downturns has got
immense importance due to recent financial crises. Investors use safe haven assets because of their weak
correlation with other assets during market turmoil. Since the demise of Bretton Wood, gold has not been as
important as before for the international monetary system, but gold still have significant importance for the
researchers, media groups and the investors owing to uncertainty in financial markets. During the global
financial crises of 2007, stock prices demonstrated losses but gold prices showed an increasing pattern that
derives the attention of the investors to include gold in the portfolios for diversification purposes (Beckmann et
al., 2014). Baur and Lucey (2010) define safe haven as ―an asset having negative correlation with stock market
in the periods of extreme market declines and weak correlation on average with other asset classes offering
diversification benefits.
Gold dynamics reveal the most relevant qualities for investors i.e. as a store of wealth, low correlation
with other financial assets and hedge against uncertainties. Systemic and downside risks are irregular in nature,
difficult to predict and have profound devastating effect on investment. Therefore, gold helps to mitigate these
losses and is considered as the strategic component in asset allocation. While in extreme market shocks, gold
tend to store the portfolio value and is also a source of liquidity (World Gold Council, 2015). Gold serves both a
hedge and safe haven for stock markets and helps in diversification in emerging markets as well. However, safe
haven property of gold is market specific (Beckmann et al., 2014). Generally, gold is believed to be a good asset
for diversification of financial portfolios because of its weak correlation with the other assets. This weak
correlation of gold is due to the difference between the determinants of gold prices and the other financial assets
(Lean and Wong et al, 2015).
Islamic stock has greater potential to attract global portfolios and can also serve as a safe haven asset.
Islamic stock indices are considered more resilient to financial crises and better positioned because of the unique
characteristics of Islamic stock markets i.e. ethical investing, ratio screening, limit the intensive structured based
financial products such as derivatives and low tolerance towards interest based leverage (Saiti et al., 2014).
Application of filtering criteria of Islamic stock indices e.g. debt to equity ratio (not more than 33%) restricted

Proceedings of the Asia Pacific Conference on Business and Social Sciences 2015, Kuala Lumpur
(in partnership with The Journal of Developing Areas)
ISBN 978-0-9925622-2-9
182
the industries engaged in prohibited activities (gambling, trade in alcohol. etc.), trading cash as an asset is not
allowed and inclusion of financial sectors only relates to supportive activities (Islamic banking, modarba,
musharika businesses) results in more concentration on some productive sectors such as technology,
consumption services and industrial sectors which makes the Islamic stocks less risky (Charles et al., 2011).
Less risky characteristics of Islamic stocks and spectacular growth of Islamic stock indices increase
their demand and are considered one of the major innovations in the financial community. Investment shifts
from actively managed mutual funds to passive index (sharia’h) based investment because global Islamic
finance provides a wide range of investment opportunities to investors around the world (Walkshausl et al.,
2012). Further, portfolios screened on the basis of sharia’h rules exhibits different performance in comparison to
the conventional market portfolios. Islamic investment is becoming more attractive for all investor classes e.g.
Muslim and non-Muslims because of ethical business practices, fiscal conservatism, sense of social
responsibility and its rapid growth. Shari'ah constraint restricts the prohibited elements and unethical investment
activities that can differentiate the Islamic markets from conventional stocks markets (Imam and Kpodar, 2013),
Al-Khazali et al., (2014) and Ho et al., (2014) documented that the Islamic stock Indices are different from their
conventional counterparts especially in extreme market declines. These characteristics makes Islamic stocks safe
haven and also qualify them as the financial protector. The advocates of Islamic investment argue that the
Islamic stock indices are better positioned and a global portfolio which carries Islamic stocks is more resilient to
the financial crises (Saiti et al., 2014).
Despite the increasing attention and growth of Islamic investment empirical studies on Islamic stock
indices are scarce. This paper has investigated the role of safe haven asset in time and frequency domain while
comparing returns on gold and Dow Jones Islamic world Emerging Market index for two different crises period.
The result indicates that gold maintain its capacity as hedging instrument for BRICS in short and long-run
during Asian financial crises of 1997-98 and in 2007 global financial crises gold exhibits a weak safe haven in
long-run. DJIEM index shows low correlation with only conventional stock market of China and suggested that
investors with horizon of less than one year can reduce their risk exposure either including gold or DJIEM index
in portfolio. Wavelet coherency has been utilized to ascertain the best time frequency for gold to act as a hedge,
we found that in late 2005 gold returns starts moving with equity returns of BRICS and form a positive relation
that last for 32-128 days in short run and later changed into strong positive relation in global financial crises of
2007. However, Gold leads in world Islamic emerging markets and displayed negative relationship across a
range of frequencies and indicates safe haven effects for the returns of DJIEM index for both the crises period.
The reminder of the paper is consist of following 5 sections; section 2 provides the literature review
and section 3 presents the data and methodology utilized to ascertain hedge and safe haven properties of Gold
and Islamic stocks to safeguard against extreme negative market shocks for BRICS. The section 4 consists of
empirical findings of the paper and finally section 5 concludes the study.
2. LITERATURE REVIEW
Gold has been documented both hedge and safe haven for stock markets in this context many studies were
conducted and reported different results. Some researchers produced similar to these characteristics and few
have contrary opinion for role of gold in different market conditions. For instance, Chang et al. (2015), Ciner et
al. (2013) and Choudhry et al. (2015) depicted that gold has the characteristics, a hedge and a safe haven, for
developed stock markets. Arouri et al. (2015) and Dilip Kumar (2014) documented similar results for emerging
markets. Baur and lucey (2010) introduced the hedge and safe haven hypothesis. Is gold hedge or safe haven for
stocks and documented that the gold is most appropriate to act as hedge for stock on average and safe haven for
stock markets during market turmoil. On the other hand, Bredin et al. (2014) studied the same relationship in
developed markets and reported that the hedge and safe haven property of gold is market dependent. While,
some researchers have determined the positive relation between the gold and stock market returns. Hood et al.
(2013) and Lucey & Li (2014) indicated that the gold is a weak safe haven against stock market declines than
the silver and the volatility index. Ajmi et al. (2014) examine the nonlinear causal relationship between
conventional and Islamic stock markets and their reaction towards the global economic and financial contagion.
The result shows that the Islamic stock markets are not isolated from the different types of external shocks and
Islamic financial systems is a weak safe guard against financial shocks affecting conventional stock markets and
has less portfolio diversification benefits. Abbes et al. (2015) examine the dynamic interdependence across a
wide range of developed and emerging Islamic stock markets in turmoil (2002 to 2007) and tranquil (after crises
period) and found that the Islamic stock indices have potential diversification benefits in short-run and it is
witnessed for both developed and emerging markets during crises period.

Proceedings of the Asia Pacific Conference on Business and Social Sciences 2015, Kuala Lumpur
(in partnership with The Journal of Developing Areas)
ISBN 978-0-9925622-2-9
183
Charles et al. (2015) access the impact of sharia’h filtering criteria on the risk of DJIM index and their
conventional counterparts and documented that sharia’h constraints eliminated the large firms from the
investment universe and remaining firms tend to have more volatile returns which makes Islamic stock indices
more risky than their conventional counterparts. Shamsuddin (2014) pursue a different approach by examining
the interest rate sensitivities of DJIM industrial index and their corresponding conventional sector indices and
found different results. He demonstrate that passive managed Islamic indices yields higher returns than their
conventional counterparts because filtering criteria results in more concentration on some productive sectors
such as technology, consumption services and industrial sectors which makes the Islamic stocks less risky. Ho et
al., (2014) compared the risk-adjusted performance of 12 major global Islamic and conventional stock indices
from eight countries to ensure the valid performance and depicts that most of the conventional and Islamic stock
indices have failed to meet the performance benchmark of Morgan Stanley world index during crises period.
Dewandaru et al. (2015) applied wavelet analysis relatively a new approach to examine the risk
and returns pattern at different time scales and found that the both the conventional and Islamic stock markets
shows similar tendency towards the risk i.e. generally stronger at higher time scale. Khazali et al. (2014)
compare the performance of DJIM regional and country indices with their conventional counterparts in crises
and after crises periods. They contends that except European market conventional stock indices outperform their
Islamic counterparts in all markets and during financial crises period Islamic stock indices perform better than
their conventional peers.
Rizvi et al. (2015), Alaoui et al. (2015) and Saiti et al. (2014) investigated the diversification
benefits of Islamic stock markets by utilizing a wide range of empirical methodologies to explore the dynamic
dependence of global equities with their mainstream Islamic stock indices across different markets i.e. Islamic
developing, Islamic emerging, Islamic Asia, Saudi Islamic stock market and GCC. Their results suggest that in
comparison to conventional stock markets their Islamic counterparts provide better avenues of diversification
with strong implications for domestic as well as for international investors. Further they documented that the
Sharia’h principles enables Islamic financial system to provides safeguard against unforeseen risk and against
multiple economic and financial crises. Ghazali et al. (2014) and Mensi et al. (2015) examine the hedge and safe
haven characteristics of sharia’h compliant stocks and gold in Malaysia and GCC markets respectively and
found gold provides strong hedge during the periods of financial downturns and suggest that including gold or
Islamic stock in global portfolio will reduce the downside risk of the portfolio. Nagayev and Masih et al. (2013)
also investigated the role of gold in time and frequency domain and produced quite similar results that gold acts
as hedging instrument at higher time scale and during the crises periods gold exhibits low correlation with
Islamic stock indices of developed and emerging markets.
Due to immense importance of gold and Islamic stock indices for investors and economies there
are insufficient empirical evidences showing multidimensional relationship between the gold and stock returns
of the emerging economies like BRICS in presence of Islamic indices. The BRICS are the members of the
developing economies and is the condensation of association of five countries namely Brazil, Russia, India,
China, and South Africa. The BRICS are distinguished from the other emerging economies because of their
rapid growth and profound influence on regional and global issues. Besides this, BRICS represent a large
number of populations and have a significant impact on world GDP (Wang et al. 2013). We believe that
assessing the relationship between gold and stock markets in time and frequency domain in the presence of Dow
Jones world Islamic Emerging market index will fill the literature gap in this area using recent daily data. It will
be a better insight to discover at what time and where gold act as hedge or safe haven and for investor
perspective it will provide aid for decision making for better asset allocation in their portfolio.
3. METHODOLOGY
Wavelet coherency is considered most appropriate to identify the time and market at which market participant
gain maximum advantage from hedging. Wavelets are originated from the Fourier transformed which is known
as the foundation of modern time frequency analysis that removed the stationary requirement of time series data.
Wavelet, a multi-time scale analysis, is a powerful analytical tool that decomposes time series in different time
and frequencies by applying an appropriate transform function. The localization property of wavelet allows
analyzing time frequency dependence between two time series at any point of time (Bredin et al., 2014). The
development and applications of multi-time scale analysis have motivated empirical researchers to re-examine
the theoretical relations in finance. Wavelet coherence is a bivariate framework that helps to determine the
localized interaction between two time series by the linear transformation and it results into a good balance of
time and frequency localization (Grinsted et al., 2004). WTC is the ratio of the cross-spectrum to the product of
the spectrum which reveals the relationship between two series either positive or negative with the help of
arrows on wavelet coherency plots. Thus, the delay or synchronization is presented by the phase difference
Proceedings of the Asia Pacific Conference on Business and Social Sciences 2015, Kuala Lumpur
(in partnership with The Journal of Developing Areas)
ISBN 978-0-9925622-2-9
184
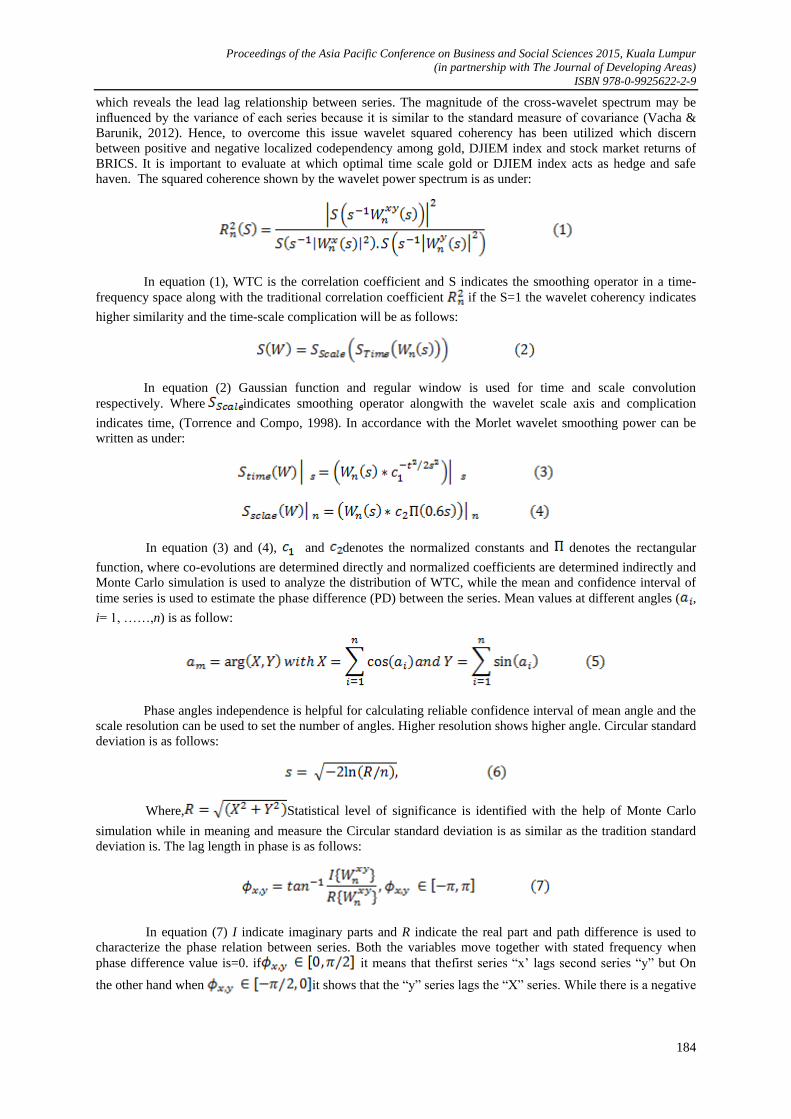
which reveals the lead lag relationship between series. The magnitude of the cross-wavelet spectrum may be
influenced by the variance of each series because it is similar to the standard measure of covariance (Vacha &
Barunik, 2012). Hence, to overcome this issue wavelet squared coherency has been utilized which discern
between positive and negative localized codependency among gold, DJIEM index and stock market returns of
BRICS. It is important to evaluate at which optimal time scale gold or DJIEM index acts as hedge and safe
haven. The squared coherence shown by the wavelet power spectrum is as under:
In equation (1), WTC is the correlation coefficient and S indicates the smoothing operator in a time-
frequency space along with the traditional correlation coefficient if the S=1 the wavelet coherency indicates
higher similarity and the time-scale complication will be as follows:
In equation (2) Gaussian function and regular window is used for time and scale convolution
respectively. Where indicates smoothing operator alongwith the wavelet scale axis and complication
indicates time, (Torrence and Compo, 1998). In accordance with the Morlet wavelet smoothing power can be
written as under:
In equation (3) and (4), and denotes the normalized constants and denotes the rectangular
function, where co-evolutions are determined directly and normalized coefficients are determined indirectly and
Monte Carlo simulation is used to analyze the distribution of WTC, while the mean and confidence interval of
time series is used to estimate the phase difference (PD) between the series. Mean values at different angles ( ,
i= 1, ……,n) is as follow:
Phase angles independence is helpful for calculating reliable confidence interval of mean angle and the
scale resolution can be used to set the number of angles. Higher resolution shows higher angle. Circular standard
deviation is as follows:
Where, Statistical level of significance is identified with the help of Monte Carlo
simulation while in meaning and measure the Circular standard deviation is as similar as the tradition standard
deviation is. The lag length in phase is as follows:
In equation (7) I indicate imaginary parts and R indicate the real part and path difference is used to
characterize the phase relation between series. Both the variables move together with stated frequency when
phase difference value is=0. if it means that thefirst series ―x’ lags second series ―y‖ but On
the other hand when it shows that the ―y‖ series lags the ―X‖ series. While there is a negative

Proceedings of the Asia Pacific Conference on Business and Social Sciences 2015, Kuala Lumpur
(in partnership with The Journal of Developing Areas)
ISBN 978-0-9925622-2-9
185
correlation between the series i.e. phase difference of ; meaning .
If then ―x‖ leads, and ―y‖ leads if .
3.1 Panel Co-integration Tests
Wavelet based methodology is sufficient to study the relationship between gold, BRICS stock markets and
Islamic emerging stock markets but to gauge the broader picture that the whole panel is co-integrated Johansen
(1995) and Kao (1999) panel co-integration tests will be applied to determine the cross-section interdependence
with different individual effects. We test the following equations to present the empirical models:
3.1.1 Johensan co-integration
Johensan co-integration test has been applied to ascertain the co-integrating relationship between the panel of
BRICS stock markets and Islamic stock index for emerging markets. Following equation will be tested:
3.1.2 Kao co-integration
DF and ADF are the two types of panel co-integration tests presented by the Kao (1999) for the panel data. For
the ADF type tests from Kao following regression can be considered:
3.1.3 The Pool Mean Group Estimates (PMG)
Recent thrust to utilize PMG approach for financial time series data motivated us to empirically investigate the
relation between Gold, BRICS stock markets and Islamic stock index to depict the causal links between them
over both the short- and long-run. Following equation will be considered for PMG estimates:
4. DATA AND FINDINGS
Data with daily frequencies from January 1st 1996 to December 31st 2014 (4958 observations) is used to study
the relationship between gold, BRICS stock markets and Dow Jones world Islamic Emerging Market index.
Stock prices of DJIEM index used as a proxy for Shariah-compliant equities in the emerging markets and
BRICS are obtained from the data stream -Thomson-Reuters. Gold prices i.e. tray/ounce are used to ascertain
the hedging effectiveness of gold in two different crises period i.e. Asian financial crises of 1997/1998 and 2007
global financial crises.
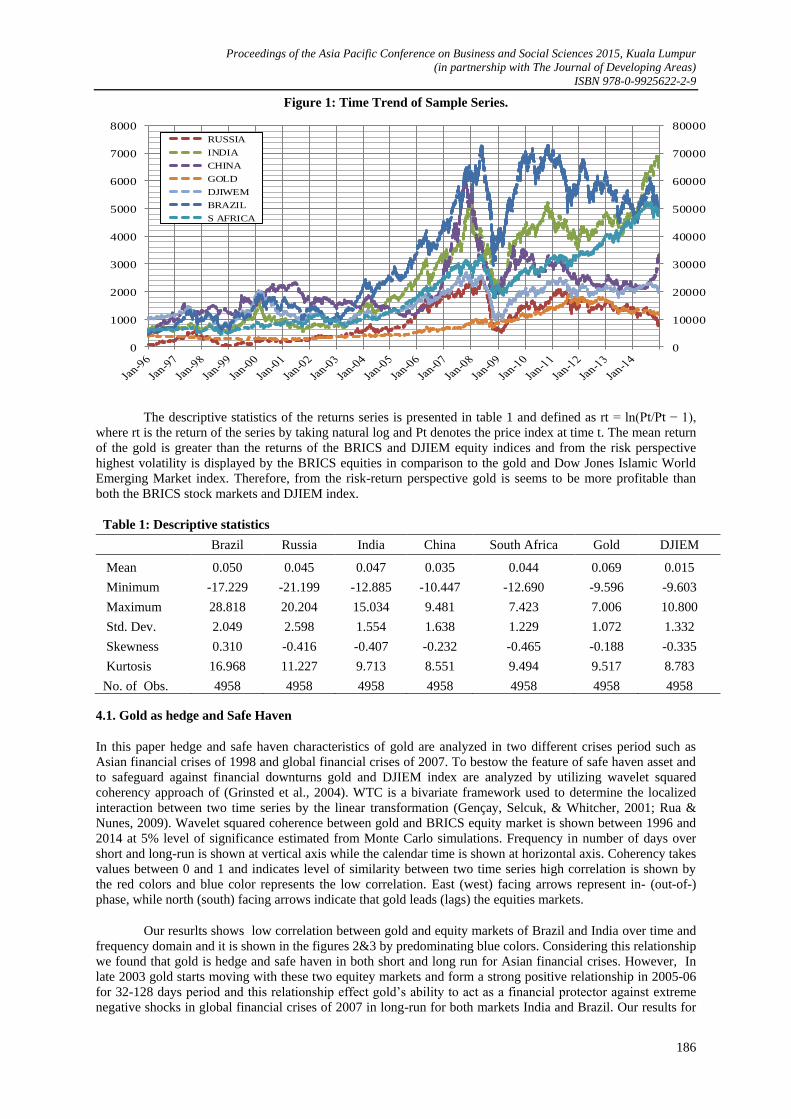
The price dynamics of gold, stock market returns of BRICS and Dow jones Islamic index from
January 1996 to June 2015 are shown in Figure 1. Both the Gold and DJIEM prices shows steady growth
throughout the sample period besides with the gold prices which shows an increasing pattern in pre and post
period of global financial crises of 2007 as earlier mentioned by the (Beckmann et al. 2014) . South African and
Russian equities are seems to be more stable than China, India, and Brazil, probably because of the better
trading strategies and market regulations.
Proceedings of the Asia Pacific Conference on Business and Social Sciences 2015, Kuala Lumpur
(in partnership with The Journal of Developing Areas)
ISBN 978-0-9925622-2-9
186
Figure 1: Time Trend of Sample Series.
0
10000
20000
30000
40000
50000
60000
70000
80000
0
1000
2000
3000
4000
5000
6000
7000
8000
RUSSIA
INDIA
CHINA
GOLD
DJIWEM
BRAZIL
S AFRICA
The descriptive statistics of the returns series is presented in table 1 and defined as rt = ln(Pt/Pt − 1),
where rt is the return of the series by taking natural log and Pt denotes the price index at time t. The mean return
of the gold is greater than the returns of the BRICS and DJIEM equity indices and from the risk perspective
highest volatility is displayed by the BRICS equities in comparison to the gold and Dow Jones Islamic World
Emerging Market index. Therefore, from the risk-return perspective gold is seems to be more profitable than
both the BRICS stock markets and DJIEM index.
Table 1: Descriptive statistics
Brazil Russia India China South Africa Gold DJIEM
Mean 0.050 0.045 0.047 0.035 0.044 0.069 0.015
Minimum -17.229 -21.199 -12.885 -10.447 -12.690 -9.596 -9.603
Maximum 28.818 20.204 15.034 9.481 7.423 7.006 10.800
Std. Dev. 2.049 2.598 1.554 1.638 1.229 1.072 1.332
Skewness 0.310 -0.416 -0.407 -0.232 -0.465 -0.188 -0.335
Kurtosis 16.968 11.227 9.713 8.551 9.494 9.517 8.783
No. of Obs. 4958 4958 4958 4958 4958 4958 4958
4.1. Gold as hedge and Safe Haven
In this paper hedge and safe haven characteristics of gold are analyzed in two different crises period such as
Asian financial crises of 1998 and global financial crises of 2007. To bestow the feature of safe haven asset and
to safeguard against financial downturns gold and DJIEM index are analyzed by utilizing wavelet squared
coherency approach of (Grinsted et al., 2004). WTC is a bivariate framework used to determine the localized
interaction between two time series by the linear transformation (Gençay, Selcuk, & Whitcher, 2001; Rua &
Nunes, 2009). Wavelet squared coherence between gold and BRICS equity market is shown between 1996 and
2014 at 5% level of significance estimated from Monte Carlo simulations. Frequency in number of days over
short and long-run is shown at vertical axis while the calendar time is shown at horizontal axis. Coherency takes
values between 0 and 1 and indicates level of similarity between two time series high correlation is shown by
the red colors and blue color represents the low correlation. East (west) facing arrows represent in- (out-of-)
phase, while north (south) facing arrows indicate that gold leads (lags) the equities markets.
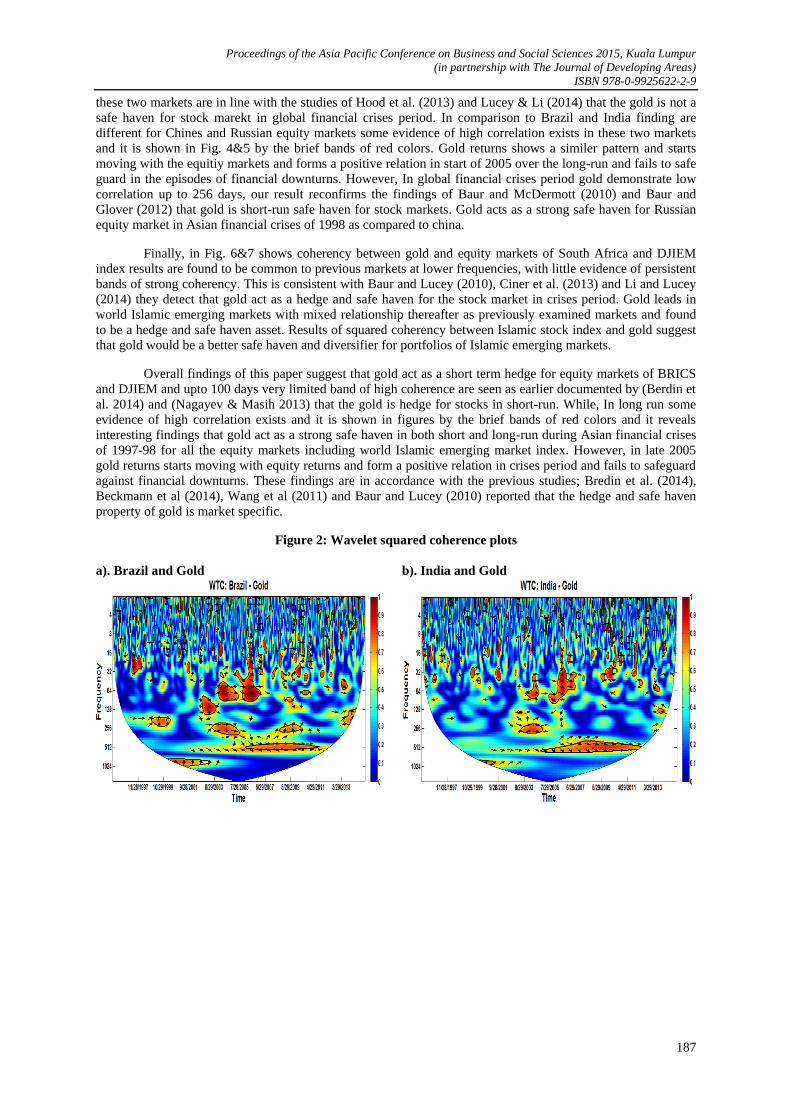
Our resurlts shows low correlation between gold and equity markets of Brazil and India over time and
frequency domain and it is shown in the figures 2&3 by predominating blue colors. Considering this relationship
we found that gold is hedge and safe haven in both short and long run for Asian financial crises. However, In
late 2003 gold starts moving with these two equitey markets and form a strong positive relationship in 2005-06
for 32-128 days period and this relationship effect gold’s ability to act as a financial protector against extreme
negative shocks in global financial crises of 2007 in long-run for both markets India and Brazil. Our results for
Proceedings of the Asia Pacific Conference on Business and Social Sciences 2015, Kuala Lumpur
(in partnership with The Journal of Developing Areas)
ISBN 978-0-9925622-2-9
187
these two markets are in line with the studies of Hood et al. (2013) and Lucey & Li (2014) that the gold is not a
safe haven for stock marekt in global financial crises period. In comparison to Brazil and India finding are
different for Chines and Russian equity markets some evidence of high correlation exists in these two markets
and it is shown in Fig. 4&5 by the brief bands of red colors. Gold returns shows a similer pattern and starts
moving with the equitiy markets and forms a positive relation in start of 2005 over the long-run and fails to safe
guard in the episodes of financial downturns. However, In global financial crises period gold demonstrate low
correlation up to 256 days, our result reconfirms the findings of Baur and McDermott (2010) and Baur and
Glover (2012) that gold is short-run safe haven for stock markets. Gold acts as a strong safe haven for Russian
equity market in Asian financial crises of 1998 as compared to china.
Finally, in Fig. 6&7 shows coherency between gold and equity markets of South Africa and DJIEM
index results are found to be common to previous markets at lower frequencies, with little evidence of persistent
bands of strong coherency. This is consistent with Baur and Lucey (2010), Ciner et al. (2013) and Li and Lucey
(2014) they detect that gold act as a hedge and safe haven for the stock market in crises period. Gold leads in
world Islamic emerging markets with mixed relationship thereafter as previously examined markets and found
to be a hedge and safe haven asset. Results of squared coherency between Islamic stock index and gold suggest
that gold would be a better safe haven and diversifier for portfolios of Islamic emerging markets.
Overall findings of this paper suggest that gold act as a short term hedge for equity markets of BRICS
and DJIEM and upto 100 days very limited band of high coherence are seen as earlier documented by (Berdin et
al. 2014) and (Nagayev & Masih 2013) that the gold is hedge for stocks in short-run. While, In long run some
evidence of high correlation exists and it is shown in figures by the brief bands of red colors and it reveals
interesting findings that gold act as a strong safe haven in both short and long-run during Asian financial crises
of 1997-98 for all the equity markets including world Islamic emerging market index. However, in late 2005
gold returns starts moving with equity returns and form a positive relation in crises period and fails to safeguard
against financial downturns. These findings are in accordance with the previous studies; Bredin et al. (2014),
Beckmann et al (2014), Wang et al (2011) and Baur and Lucey (2010) reported that the hedge and safe haven
property of gold is market specific.
Figure 2: Wavelet squared coherence plots
a). Brazil and Gold b). India and Gold

Proceedings of the Asia Pacific Conference on Business and Social Sciences 2015, Kuala Lumpur
(in partnership with The Journal of Developing Areas)
ISBN 978-0-9925622-2-9
188
c). China and Gold d). Russia and Gold
e). South Africa and Gold f). Islamic Stocks Index and Gold
4.2. Islamic Stock Index and Role of safe haven asset
Findings of this paper are contrary to the results of (Charles et al. 2011), (Imam and Kpodar, 2013) and (Saiti et
al. 2014) that the Islamic stocks are less risky and are more resilient to global financial crises. Evidence of high
similarity exists and result shows that the Islamic World Emerging Markets are highly correlated with the equity
markets of Brazil, Russia, India and South Africa. Findings are in accordance with the previous studies; Ajmi et
al. (2014) and Abbes et al. (2015) the Islamic stock markets are not isolated from the different types of external
shocks and Islamic financial systems is a weak safe guard against financial shocks and fail to own the status of
safe haven asset for the returns of the conventional stock markets.
Findings of the study depicts that the filtering criteria of Islamic stock and low tolerance towards the
interest base leverage eliminate the larger firms from the investment universe and remaining firms are small and
have more volatile results as earlier documented by Charles et al. (2015). Wavelet coherency between Islamic
stock market and BRICS suggest that Islamic stock can’t serves as the financial protector for BRICS equity
markets except China. However, coherency between Islamic stock market and Chines equity market revel
interesting findings for the portfolio investor with the horizon of less than one year. DJIEM has shown low
correlation with conventional stock market of china in short run and a portfolio will be more resilient to
financial crises if consist of both gold and DJIEM.

Proceedings of the Asia Pacific Conference on Business and Social Sciences 2015, Kuala Lumpur
(in partnership with The Journal of Developing Areas)
ISBN 978-0-9925622-2-9
189
Figures: Islamic Stock and BRICS
4.3. Panel analysis
Stationarity of data is prerequisite for time series analysis to increase the reliability of the model therefore Table
2 outlines the evidence of unit root for the series in levels and stationarity for the series in first difference by
applying recently developed test of Breitung, 2005. The test implies that all the series are non-stationary at first-
difference i.e. integrated of order one and their mean, variance and auto-covariance is not persistent. Table 3
shows panel co-integration tests suggested by Kao (1999) and Johansen (1995). Panel co-integration test has
been applied to ascertain the co-integrating relationship between the panel of BRICS stock markets and Islamic
stock index for emerging markets. We found linear relationship between them and the attributes of Islamic
emerging stock markets are not different from the conventional stock markets of BRICS. Co-integration
between panel BRICS and Islamic emerging stock markets suggests a long-run equilibrium relationship between
them.

Proceedings of the Asia Pacific Conference on Business and Social Sciences 2015, Kuala Lumpur
(in partnership with The Journal of Developing Areas)
ISBN 978-0-9925622-2-9
190
Table: 2 Results of the panel stationarity (Breitung, 2005) test.
Log-level First-difference
Intercept Trend Intercept Trend
BRICS 2.054
(0.981)
-0.348
(0.363)
-16.40*
(0.000)
-15.16*
(0.000)
GOLD 1.248
(0.894)
1.216
(0.888)
-21.33*
(0.000)
-23.92*
(0.000)
DJIEM -1.659
(0.048)
-1.238
(0.062)
-19.15*
(0.000)
-17.54*
(0.000)
Notes: The values in parentheses are the p-values.
* Non-stationarity at 1% level.
Table:3 Panel Cointegration Tests
ADF ststictics
Kao (1999) -3.818*
(0.00)
Trace test Max-eigen test
Johansen (1995) 21.94**
(0.0154)
26.27**
(0.0121)
Notes: The values in parentheses are the p-values.
* Cointegration at 1% level.
** Cointegration at 5% level.
Finally the table 4 shows Pooled Mean Group (PMG) estimates of BRICS panel with gold and Islamic stock
index in short and long-run. The PMG approach has the advantage to consider a homogeneous subset of long-
run coefficients while the others differ across groups. The results show that the Islamic emerging and BRICS
equity markets are co-integrated in short and long-run and global investor should carefully monitor the risk
associated with the diversification benefits. In the same context gold would be a better safe haven for the returns
of the Islamic stock markets as well.
Table: 4 PMG estimates.
Independent variable(s) Dependent variable - BRICS
Statistics Probability
Gold -0.23 0.239
DJIEM 1.37* 0.000
D(Gold) 0.07 0.140
D(DJIEM) 0.73* 0.000
Adj. speed -0.02 0.067
5. CONCLUSION
The objective of the paper was to empirically evaluate the hedge and safe haven characteristics of gold and Dow
Jones Islamic World Emerging Market index to bestow them status of safe haven asset for BRICS in episodes of
financial downturns by utilizing daily data of gold prices and DJIEM index ranging from 1996 to 2014 in time
and frequency domain. Wavelet coherency was utilized to ascertain best time frequency at which market
participant gain maximum diversification benefits from hedging. The results tend to indicates that the gold
maintain its role as hedge for stocks in short run for BRICS stock markets and in different crises period gold
exhibits varying relations with stock markets. Over all our results suggest that the hedge and safe haven ability
of gold is market specific, Therefore, in Asian financial crises gold was a strong safe haven for BRICS and
Islamic index and in late 2005 gold prices starts moving with BRICS equitey markets and shows evidence of
positive correlation for 32-128 days period and this relationship effect gold’s ability to act as a financial
protector against extreme negative shocks in global financial crises of 2007. In contrast to the BRICS equity
markets during the economic contractions in late 2005 and in 2007 global financial crises period gold leads in
world Islamic emerging markets and displayed negative relationship across a range of frequencies and indicates
safe haven effects for the returns of Islamic stock markets. This low correlation between gold and Islamic stock
markets indicates that gold can provide diversification in portfolios of Islamic stock markets. Panel co-
Proceedings of the Asia Pacific Conference on Business and Social Sciences 2015, Kuala Lumpur
(in partnership with The Journal of Developing Areas)
ISBN 978-0-9925622-2-9
191
integration depicted that the Islamic emerging and BRICS equity markets are co-integrated and global investor
should carefully monitor the risk associated with the varying diversification benefits.
Based on these results we can infer that there are potential benefits of gold investment in short-run to
safe guard against extreme negative market shocks and in long run gold dose not seems to be a strong safe
haven. We can infer that investors with horizon of less than one year can reduce their risk exposure by including
gold in their portfolio. Further, Dow Jones world Islamic Emerging Market index shows low correlation with
only conventional stock market of China our results suggests that the portfolio will be more resilient to financial
crises if consist of both gold and Islamic stock.
Our key contribution is that we compare hedge and safe haven characteristics of gold and Islamic stock
by simultaneously considering both time and frequency domain, we demonstrate low correlation between gold
and world emerging Islamic market index on average and in extreme market conditions. Relative to the past
studies our findings demonstrate strong implications for making better asset allocation of one’s portfolios and
this paper can also give a better understanding at which market gold can act as a hedge or a safe haven for stock
markets. Furthermore this paper has few limitations we have used only gold and Islamic stock to analyze for
role of safe haven asset, therefore it is suggested for future research to include world oil prices and U.S.
treasuries they are also considered as a safe haven assets.
REFERENCE
Abbes, M. B., & Trichilli, Y. (2015). Islamic stock markets and potential diversification benefits. Borsa Istanbul
Review, 15(2), 93-105.
Ajmi, A. N., Hammoudeh, S., Nguyen, D. K., & Sarafrazi, S. (2014). How strong are the causal relationships
between Islamic stock markets and conventional financial systems? Evidence from linear and nonlinear
tests.Journal of International Financial Markets, Institutions and Money, 28, 213-227.
Al-Khazali, O., Lean, H. H., & Samet, A. (2014). Do Islamic stock indexes outperform conventional stock
indexes? A stochastic dominance approach. Pacific-Basin Finance Journal, 28, 29-46.
Baur, D. G., & Glover, K. J. (2012). The destruction of a safe haven asset? Applied Finance Letters, 1(1), 8–15.
Baur, D. G., & Lucey, B. M. (2010). Is gold a hedge or a safe haven? An analysis of stocks, bonds and
gold. Financial Review, 45(2), 217-229.
Baur, D. G., & McDermott, T. K. (2010). Is gold a safe haven? International evidence. Journal of Banking &
Finance, 34(8), 1886–1898.
Beckmann, J., Berger, T., &Czudaj, R. (2014). Does gold act as a hedge or a safe haven for stocks? A smooth
transition approach. Economic Modelling.
Bredin, D., Conlon, T., &Potì, V. (2014). Does Gold Glitter in the Long-Run? Gold as a Hedge and Safe Haven
Across Time and Investment Horizon. Gold as a Hedge and Safe Haven Across Time and Investment Horizon
(August 20, 2014).
Breitung, J., and S. Das. 2005. Panel unit root tests under crosssectional dependence. Statistica Neerlandica 59:
414–433.
Charles, A., Darné, O., & Pop, A. (2015). Risk and ethical investment: Empirical evidence from Dow Jones
Islamic indexes. Research in International Business and Finance, 35, 33-56.
Choudhry, T., Hassan, S. S., &Shabi, S. (2015). Relationship between gold and stock markets during the global
financial crisis: Evidence from Nonlinear Causality Tests. International Review of Financial Analysis.
Ciner, C., Gurdgiev, C., &Lucey, B. M. (2013). Hedges and safe havens: An examination of stocks, bonds, gold,
oil and exchange rates. International Review of Financial Analysis, 29, 202-211.

Proceedings of the Asia Pacific Conference on Business and Social Sciences 2015, Kuala Lumpur
(in partnership with The Journal of Developing Areas)
ISBN 978-0-9925622-2-9
192
Dewandaru, G., Bacha, O. I., Masih, A. M. M., & Masih, R. (2015). Risk-return characteristics of Islamic equity
indices: Multi-timescales analysis. Journal of Multinational Financial Management, 29, 115-138.
el Alaoui, A. O., Dewandaru, G., Rosly, S. A., & Masih, M. (2015). Linkages and co-movement between
international stock market returns: Case of Dow Jones Islamic Dubai Financial Market index. Journal of
International Financial Markets, Institutions and Money, 36, 53-70.
Gençay, R., Selcuk, B., &Whitcher, B. (2001). An introduction to wavelets and other filtering methods in
finance and economics. San Diego, CA: Academic Press.
Ghazali, M. F., Lean, H. H., & Bahari, Z. (2014). Sharia compliant gold investment in Malaysia: Hedge or safe
haven?. Pacific-Basin Finance Journal.
Gold Investor: Risk management and capital preservationwww.sharpspixley.com/uploads/gold-investor-vol-
8.pdfMar 20, 2015 - Volume 8
Grinsted, A., Moore, J. C., & Jevrejeva, S. (2004). Application of the cross wavelet transform and wavelet
coherence to geophysical time series. Nonlinear Processes in Geophysics, 11(5/6), 561–566.
Ho, C. S. F., Rahman, N. A. A., Yusuf, N. H. M., & Zamzamin, Z. (2014). Performance of global Islamic versus
conventional share indices: International evidence. Pacific-Basin Finance Journal, 28, 110-121.
Hood, M., & Malik, F. (2013). Is gold the best hedge and a safe haven under changing stock market
volatility?. Review of Financial Economics, 22(2), 47-52.
Imam, P., & Kpodar, K. (2013). Islamic banking: how has it expanded? Emerging Markets Finance and Trade,
49(6), 112e137.
Johansen, S., 1995. Likelihood-based Inference in Cointegrated Vector Autoregressive Models. Oxford
University Press, Oxford.
Kao, C., 1999. Spurious regression and residual-based tests for cointegration in panel data. Journal of
Econometrics 90, 1–44.
Kumar, D. (2014). Return and volatility transmission between gold and stock sectors: Application of portfolio
management and hedging effectiveness. IIMB Management Review, 26(1), 5-16.
Lean, H. H., & Wong, W. K. (2015). Is gold good for portfolio diversification? A stochastic dominance analysis
of the Paris stock exchange. International Review of Financial Analysis.
Li, S., Lucey, B.M., 2014. What precious metals act as safe havens, and when? Some US evidence. Appl. Econ.
Lett. http://dx.doi.org/10.1080/13504851.2014.920471
Lucey, B. M., & Li, S. (2015). What precious metals act as safe havens, and when? Some US evidence. Applied
Economics Letters, 22(1), 35-45.
Mensi, W., Hammoudeh, S., Reboredo, J. C., & Nguyen, D. K. (2015). Are Sharia Stocks, Gold and US
Treasuries Hedges and Safe Havens for the Oil-Based GCC Markets?. Emerging Markets Review.
Nagayev, R., & Masih, M. (2013). The Role of Gold as a Hedge and Safe Haven in Shariah-Compliant
Portfolios. http://mpra.ub.uni-muenchen.de/58852/
Rizvi, S. A. R., Arshad, S., & Alam, N. (2015). Crises and contagion in Asia Pacific—Islamic v/s conventional
markets. Pacific-Basin Finance Journal.
Rua, A., & Nunes, L. C. (2009). International comovement of stock market returns: A wavelet analysis. Journal
of Empirical Finance, 16(4), 632–639.

Proceedings of the Asia Pacific Conference on Business and Social Sciences 2015, Kuala Lumpur
(in partnership with The Journal of Developing Areas)
ISBN 978-0-9925622-2-9
193
Saiti, B., Bacha, O. I., & Masih, M. (2014). The diversification benefits from Islamic investment during the
financial turmoil: The case for the US-based equity investors. Borsa Istanbul Review, 14(4), 196-211.
Shamsuddin, A. (2014). Are Dow Jones Islamic equity indices exposed to interest rate risk?. Economic
Modelling, 39, 273-281.
Tiwari, A. K., Dar, A. B., Bhanja, N., Arouri, M., &Teulon, F. (2015). Stock returns and inflation in
Pakistan. Economic Modelling, 47, 23-31.
Vacha, L., & Barunik, J. (2012). Co-movement of energy commodities revisited: Evidence from wavelet
coherence analysis. Energy Economics, 34(1), 241–247.
Walkshäusl, C., & Lobe, S. (2012). Islamic investing. Review of Financial Economics, 21(2), 53-62.
Wang, K. M., Lee, Y. M., &Thi, T. B. N. (2011). Time and place where gold acts as an inflation hedge: An
application of long-run and short-run threshold model. Economic Modelling, 28(3), 806-819.