ishikawa/fishbone diagram - webnodefiles.project-motivity.webnode.com/200000324... · kaoru...
TRANSCRIPT
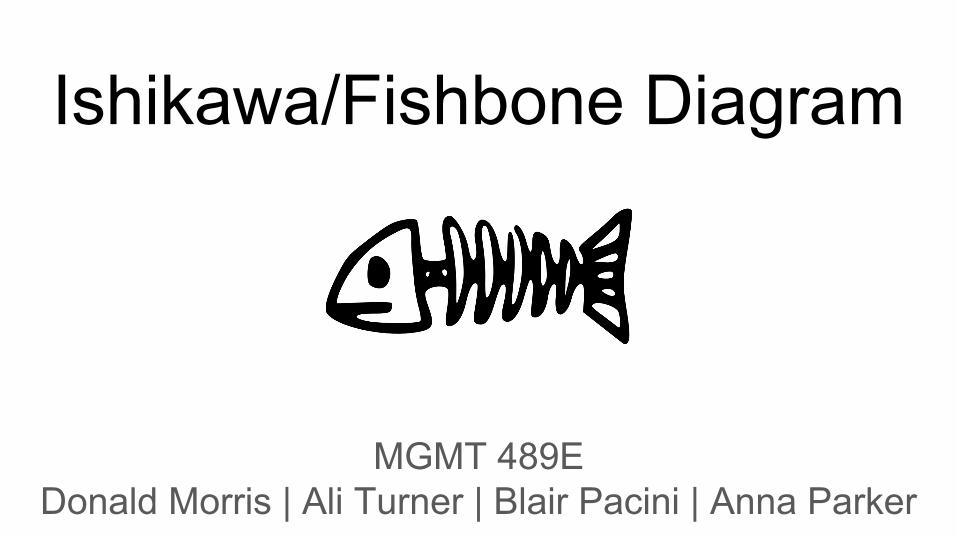
Ishikawa/Fishbone Diagram
MGMT 489EDonald Morris | Ali Turner | Blair Pacini | Anna Parker
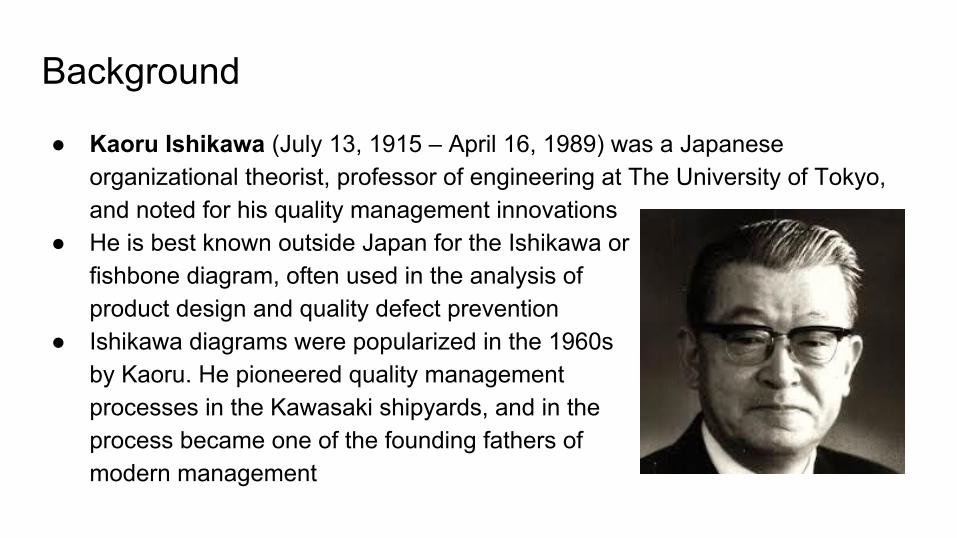
Background
● Kaoru Ishikawa (July 13, 1915 – April 16, 1989) was a Japanese organizational theorist, professor of engineering at The University of Tokyo, and noted for his quality management innovations
● He is best known outside Japan for the Ishikawa or fishbone diagram, often used in the analysis of product design and quality defect prevention
● Ishikawa diagrams were popularized in the 1960s by Kaoru. He pioneered quality management processes in the Kawasaki shipyards, and in the process became one of the founding fathers of modern management
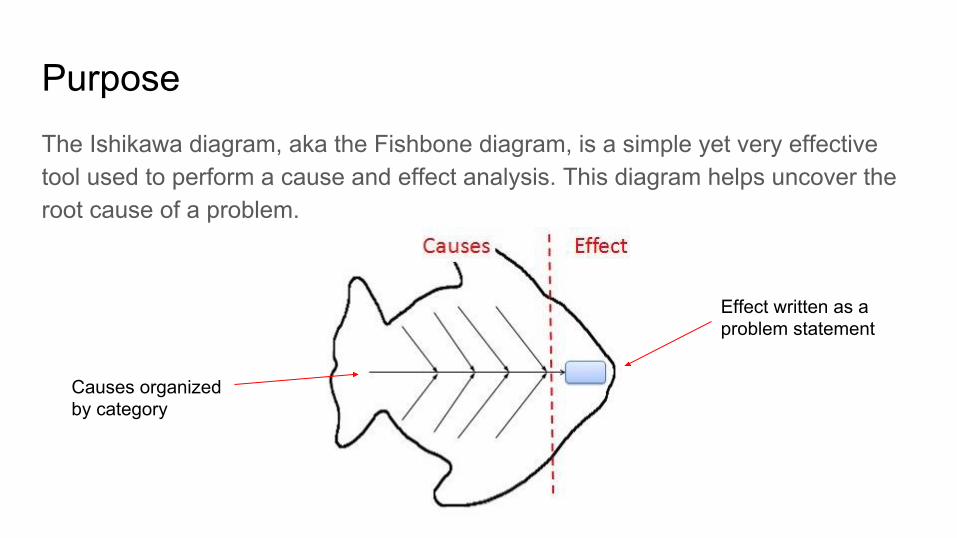
PurposeThe Ishikawa diagram, aka the Fishbone diagram, is a simple yet very effective tool used to perform a cause and effect analysis. This diagram helps uncover the root cause of a problem.
Effect written as a problem statement
Causes organized by category
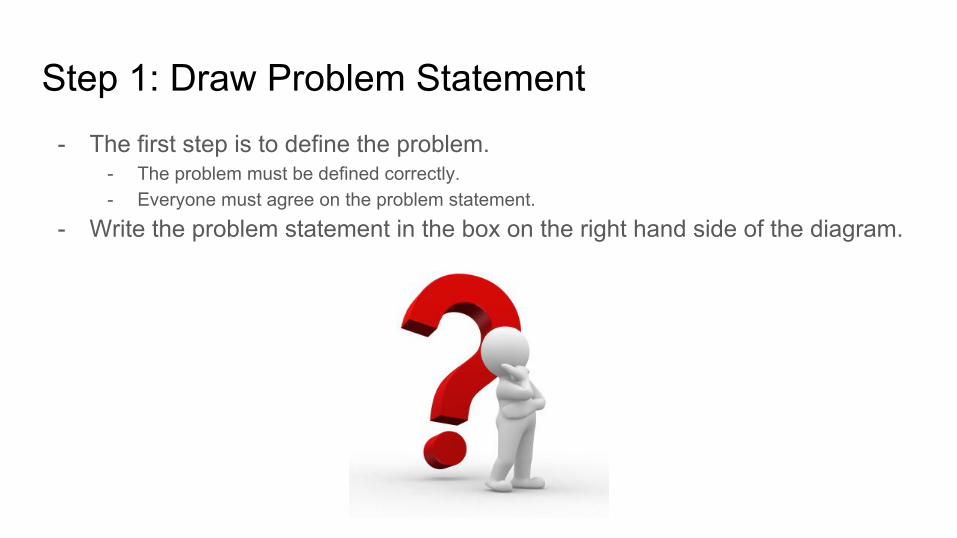
Step 1: Draw Problem Statement- The first step is to define the problem.
- The problem must be defined correctly. - Everyone must agree on the problem statement.
- Write the problem statement in the box on the right hand side of the diagram.
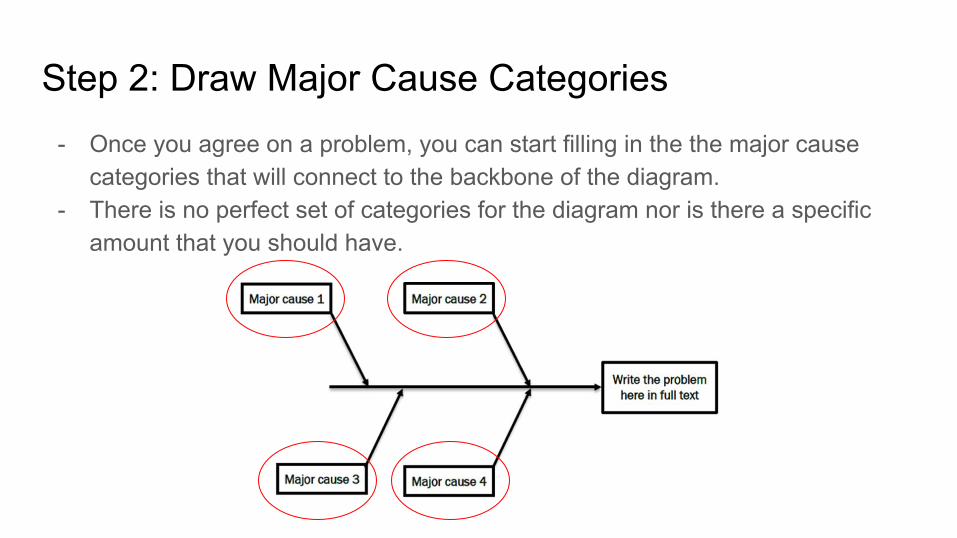
Step 2: Draw Major Cause Categories- Once you agree on a problem, you can start filling in the the major cause
categories that will connect to the backbone of the diagram. - There is no perfect set of categories for the diagram nor is there a specific
amount that you should have.
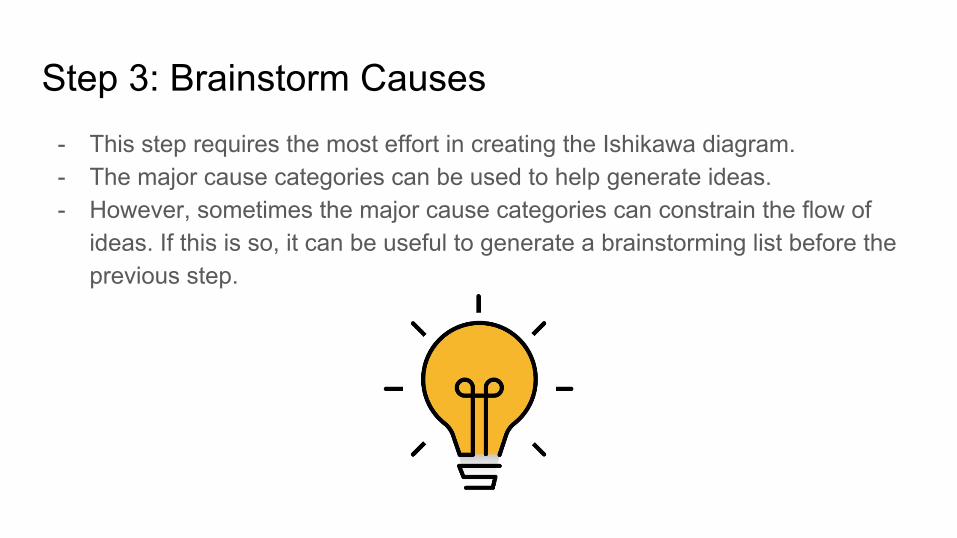
Step 3: Brainstorm Causes- This step requires the most effort in creating the Ishikawa diagram. - The major cause categories can be used to help generate ideas. - However, sometimes the major cause categories can constrain the flow of
ideas. If this is so, it can be useful to generate a brainstorming list before the previous step.
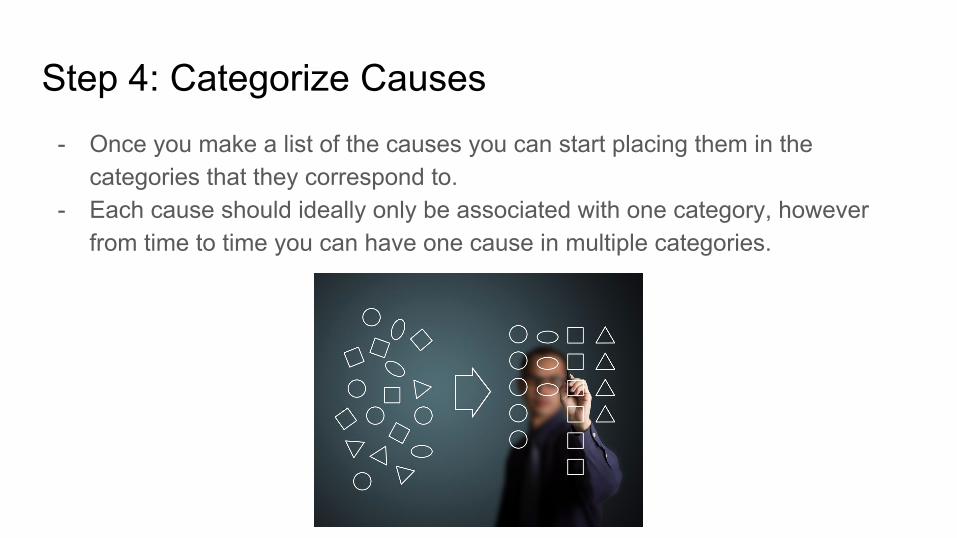
Step 4: Categorize Causes- Once you make a list of the causes you can start placing them in the
categories that they correspond to.- Each cause should ideally only be associated with one category, however
from time to time you can have one cause in multiple categories.
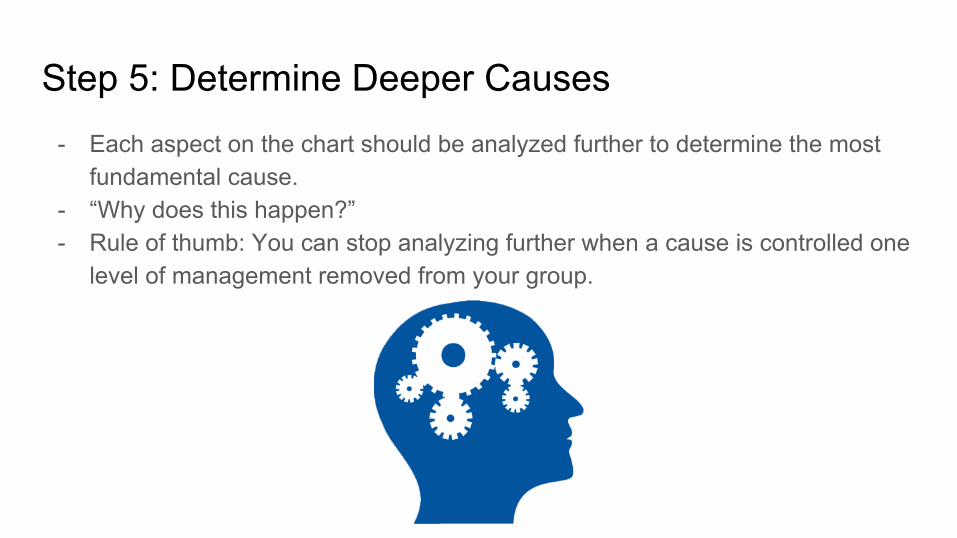
Step 5: Determine Deeper Causes- Each aspect on the chart should be analyzed further to determine the most
fundamental cause.- “Why does this happen?” - Rule of thumb: You can stop analyzing further when a cause is controlled one
level of management removed from your group.
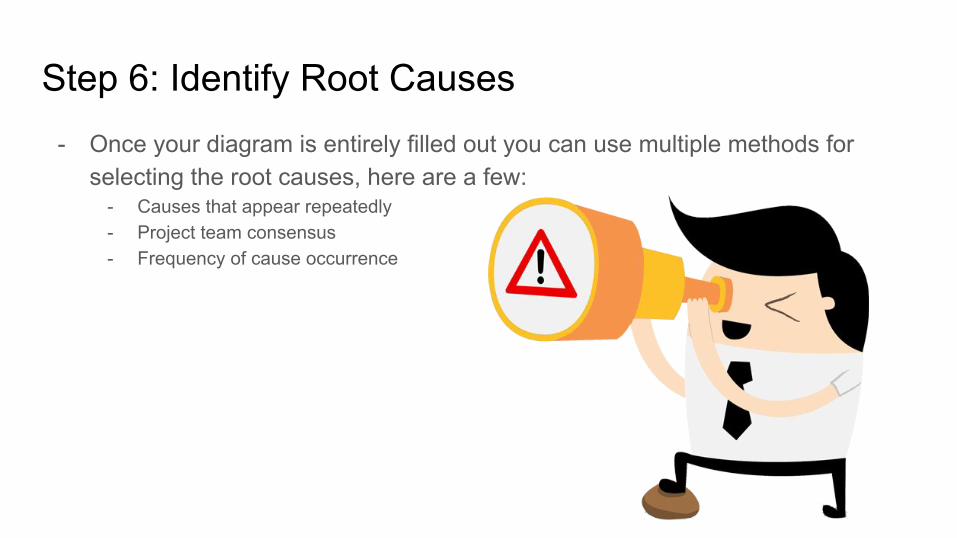
Step 6: Identify Root Causes- Once your diagram is entirely filled out you can use multiple methods for
selecting the root causes, here are a few:- Causes that appear repeatedly- Project team consensus- Frequency of cause occurrence
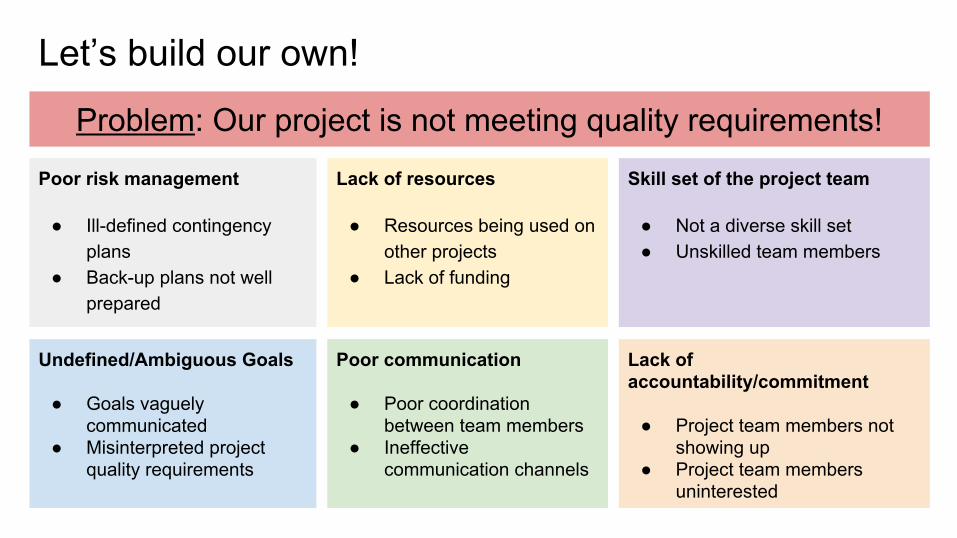
Let’s build our own!
Poor risk management
● Ill-defined contingency plans
● Back-up plans not well prepared
Lack of resources
● Resources being used on other projects
● Lack of funding
Skill set of the project team
● Not a diverse skill set● Unskilled team members
Undefined/Ambiguous Goals
● Goals vaguely communicated
● Misinterpreted project quality requirements
Poor communication
● Poor coordination between team members
● Ineffective communication channels
Lack of accountability/commitment
● Project team members not showing up
● Project team members uninterested
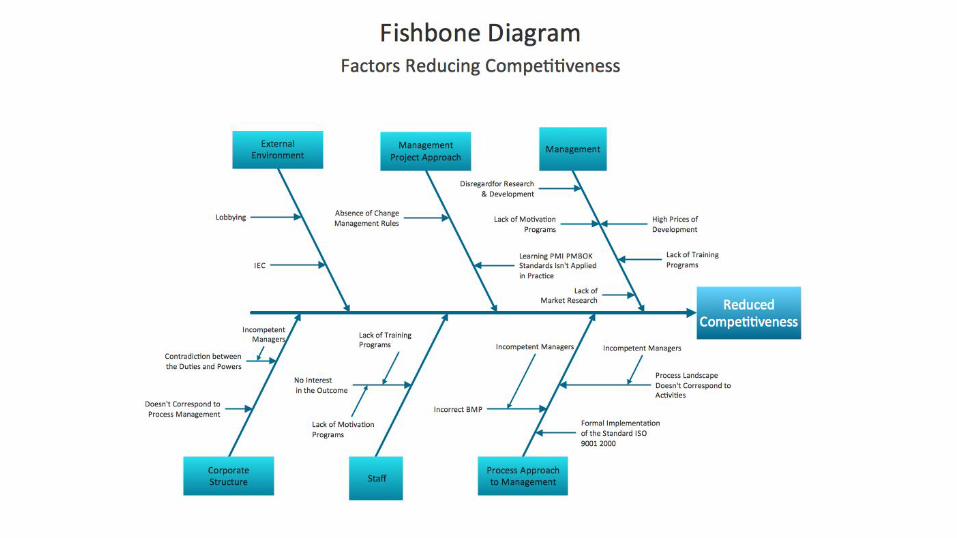
Problem: Our project is not meeting quality requirements!
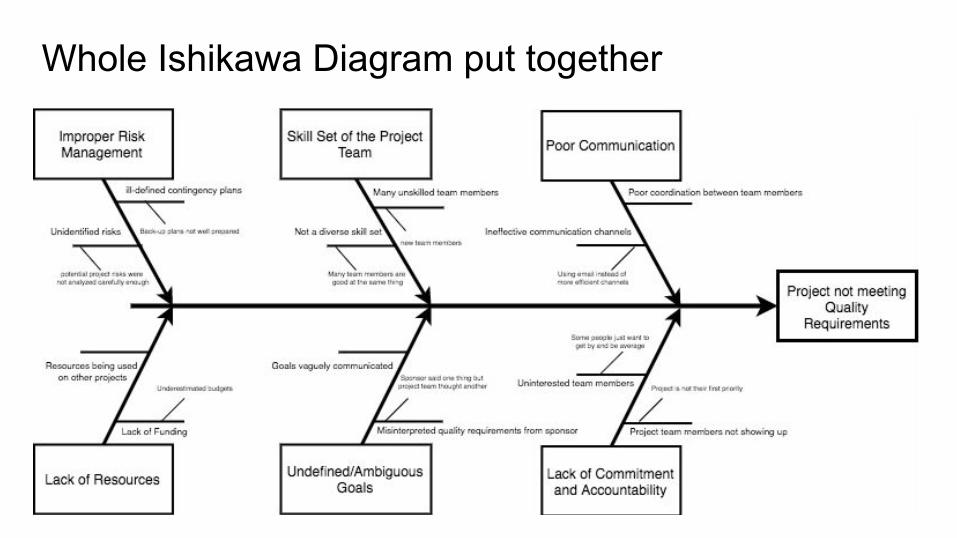
Whole Ishikawa Diagram put together