ishita final report
TRANSCRIPT
Summer Internship Project Report
On
Understanding consumers’ requirements towards a non-smelling pain relieving gel
ByIshita AroraA0101911182
MBA (G) Class of 2013
Under the Supervision of
Dr. Anita KumarAssistant Professor
Marketing department
In Partial Fulfillment of the Requirements for the Degree of Master of Business Administration
at
AMITY BUSINESS SCHOOLAMITY UNIVERSITY UTTAR PRADESH
SECTOR 125, NOIDA - 201303, UTTAR PRADESH, INDIA2012
i
DECLARATION
Title of Project Report:
To understand the consumers’ requirements towards a non-smelling or fragrance based pain relieving gel
I declare
(a) That the work presented for assessment in this Summer Internship Report is my
own, that it has not previously been presented for another assessment and that
my debts (for words, data, arguments and ideas) have been appropriately
acknowledged.
(b) That the work conforms to the guidelines for presentation and style set out in the
relevant documentation.
Date : …………… Ishita Arora
A0101911182
MBA Class of 2013
ii

CERTIFICATE
I , Dr . Anita Kumar, hereby certify that Ishita Arora student of Masters of Business Administration (G) at Amity Business School, Amity University Uttar Pradesh has completed the Project Report on “Understanding consumers’ requirements towards a non-smelling or fragrance based pain relieving gel”, under my guidance.
Dr. Anita Kumar
Assistant Professor
Department of Marketing
iii
ACKNOWLEDGEMENT
First and foremost, I would like to thank my faculty guide, Ms. Anita Kumar, and my
industrial guide, Ms. Monika Badoni (Category Manager), and Ms. Aditi Tandon
(Brand Manager, Volini), for allowing me to undergo internship under their guidance
and supervision. It gave me an opportunity to participate and learn a deal about the
various financial investments options like currencies, commodity, equity, mutual
funds, SIP, ETF etc.
I would also like to show my sincere appreciation to Ms. Monika Badoni (Category
Manager), who inspired me greatly to work on this project. Her willingness to
motivate me contributed tremendously to the project. I would also like to thank him
for guiding me with some examples that related to the topic of the project, for
suggesting alternative solutions & sharing their valuable experience & knowledge
with me, and also for facilitating me in gaining practical knowledge.
This project has been made possible through the direct and indirect cooperation of
various staff members of Ranbaxy Labs Ltd. and without whose cooperation & help
the completion of this internship was not possible.
Besides, I would like to thank the authority of Ranbaxy Labs Ltd. for providing me
with a good environment and facilities to complete this project.
Finally, an honorable mention goes to my family and friends for their understandings
and supports on me in completing this project. Without helps of the particular that
mentioned above, we would face many difficulties while doing this project.
iv

I sh i ta Arora
TO STUDY THE CONSUMERS, PERCEPTION
TOWARDS A NON-SMELLING PAIN RELIEVING GEL
ABSTRACT
The objective of the project was to carry out product test among current Volini gel
users and Moov users of a non smelling Volini formulation and collect feedback on
various efficacy parameters. For this, I have to understand the customer needs and
requirements with respect to the pain relieving gel.As the gel was new and it was yet
to be marketed to a large number of customers, it was essential to know the likes and
dislikes of the consumers w.r.t their preferred brands and their expectations from an
ideal pain reliever. So that, appropriate marketing strategies and changes can be
applied to the new gel to make it consumer friendly.The continuous visits to
households made it possible for me to measure the satisfaction of consumers with
respect to the attributes, such as efficacy, quickness of relief, sensation and most
importantly, the smell.The study was done in Delhi region for two months. The
method undertaken for the research was Marketing Research (Both primary research
& secondary research), and Questionnaire method.The questionnaire was divided into
two parts. One for the normal pain relieving gels/ointments/creams/balms/oils etc. and
the other for the Fenak gel.It had questions related to the acceptability of the pain
relieving gel wrt
a. Color
b. Smell
c. Ease of absorption
d. Pain relieving ability/ efficacy
e. Quickness of relief
f. Sensation
Once the readings were taken, the questionnaire was analysed and conclusions were
made regarding both Volini and Moov users and how they felt about the fenak gel.
v

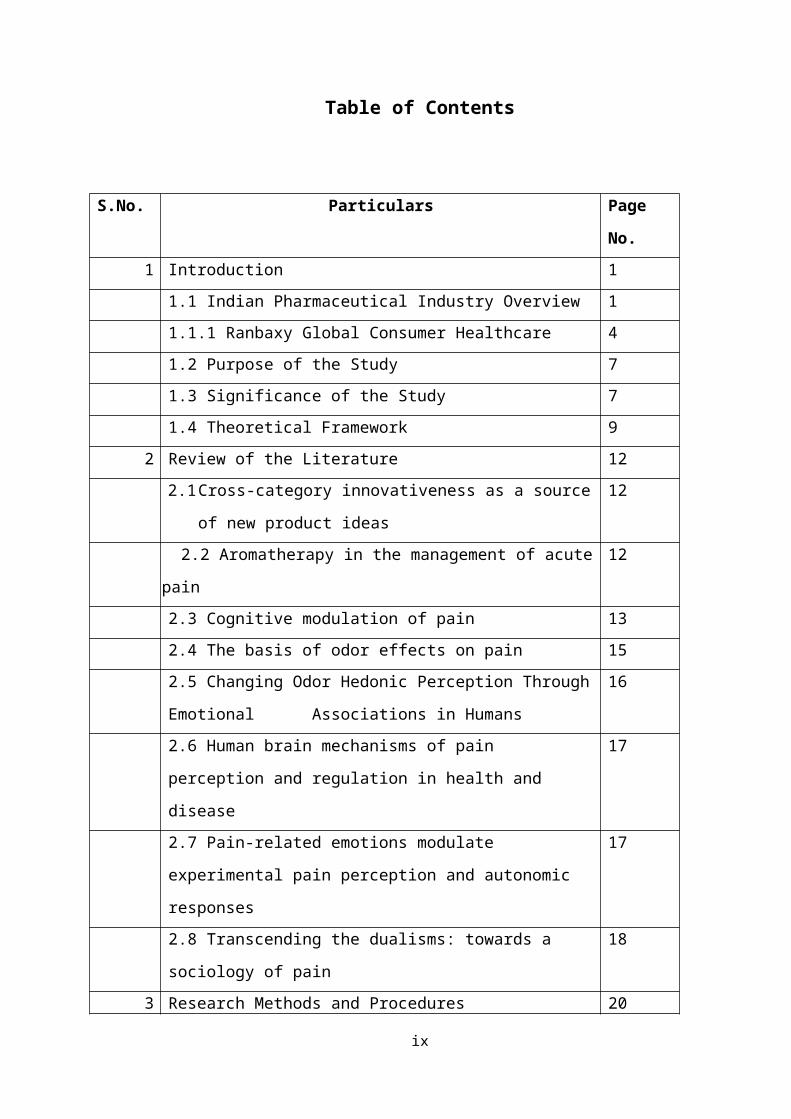
Table of Contents
S.No. Particulars Page No.
1 Introduction 1
1.1 Indian Pharmaceutical Industry Overview 1
1.1.1 Ranbaxy Global Consumer Healthcare 4
1.2 Purpose of the Study 7
1.3 Significance of the Study 7
1.4 Theoretical Framework 9
2 Review of the Literature 12
2.1 Cross-category innovativeness as a source of new product
ideas
12
2.2 Aromatherapy in the management of acute pain 12
2.3 Cognitive modulation of pain 13
2.4 The basis of odor effects on pain 15
2.5 Changing Odor Hedonic Perception Through Emotional
Associations in Humans
16
2.6 Human brain mechanisms of pain perception and regulation in
health and disease
17
2.7 Pain-related emotions modulate experimental pain perception
and autonomic responses
17
2.8 Transcending the dualisms: towards a sociology of pain 18
3 Research Methods and Procedures 20
3.1 Purpose of the Study 20
3.2 Research Design 20
3.3 Participants 20
3.4 Research Hypothesis 22
3.5 Instrument Used 22
3.6 Pilot Study 23
3.7 Data Analysis 23
3.8 Limitations 23
4 Data Analysis and Findings 24
vi
4.1 Age of the respondent 24
4.2 Gender of the respondent 24
4.3 SEC category 25
4.4 Type of pain the respondent suffers from 25
4.5 Frequency of the pain 26
4.6 what does respondent applies to overcome the pain 26
4.7 brand the respondent most often uses 27
4.8 Ranking given by the respondent towards various attributes
with respect to an ideal pain relieving gel/ cream
27
4.9 Reasons why respondents felt smell is important/ not
important in case of their ideal pain reliever
33
4.10 Respondents feeling if a non smelling product would be okay
or not?
34
4.11 Rating given for the overall brand (used brand) the
respondent currently uses
38
4.12 Strength of the smell 39
4.13 Rating given for various attributes w.r.t the Fenak gel given
to the respondents
40
4.14 Feedback of the respondents on the smell of fenak gel 43
4.15 Rank given by the respondent to Fenak Gel 44
5 Conclusions and Recommendations 59
5.1 Conclusion 59
5.2 Recommendations 59
6 References 60
7 Appendix 61
List of f igures
vii

Figure
Number
Figure Name Page
Number
4.01 Age of the Respondent 24
4.02 Gender of the Respondent 24
4.03 SEC category 25
4.04 Frequency of pain 26
4.05 Brand the respondent uses 27
4.06 Rank for an ideal pain reliever 27
4.07 Rank for an ideal pain relievers’ smell 28
4.08 Rank for an ideal pain reliever’s ease of absorption 29
4.09 Rank for ideal pain reliever’s efficacy 30
4.10 Rank for ideal pain reliever’s quickness of relief 31
4.11 Rank for an ideal pain reliever’s sensation 32
4.12 If a non smelling product is ok? 34
4.13 Color of the respondent’s pain reliever 34
4.14 Smell if the respondent’s pain reliever 35
4.15 Rating for ease of absorption 36
4.16 Rating for efficacy of the used brand 36
4.17 Rating for quickness of relief of the used brand 37
4.18 Rating for the sensation of the used brand 38
4.19 Rating for the overall brand 38
4.20 Strength of the smell 39
4.21 Rating for the color of fenak 40
4.22 Rating for the smell of Fenak 41
4.23 Rating for ease of absorption of Fenak 41
4.24 Rating for efficacy of Fenak 42
4.25 Rating for quickness of relief of Fenak 42
4.26 Rating for sensation of Fenak 43
4.27 Rank given for Fenak 44
4.28 Respondents who would like to purchase it 44
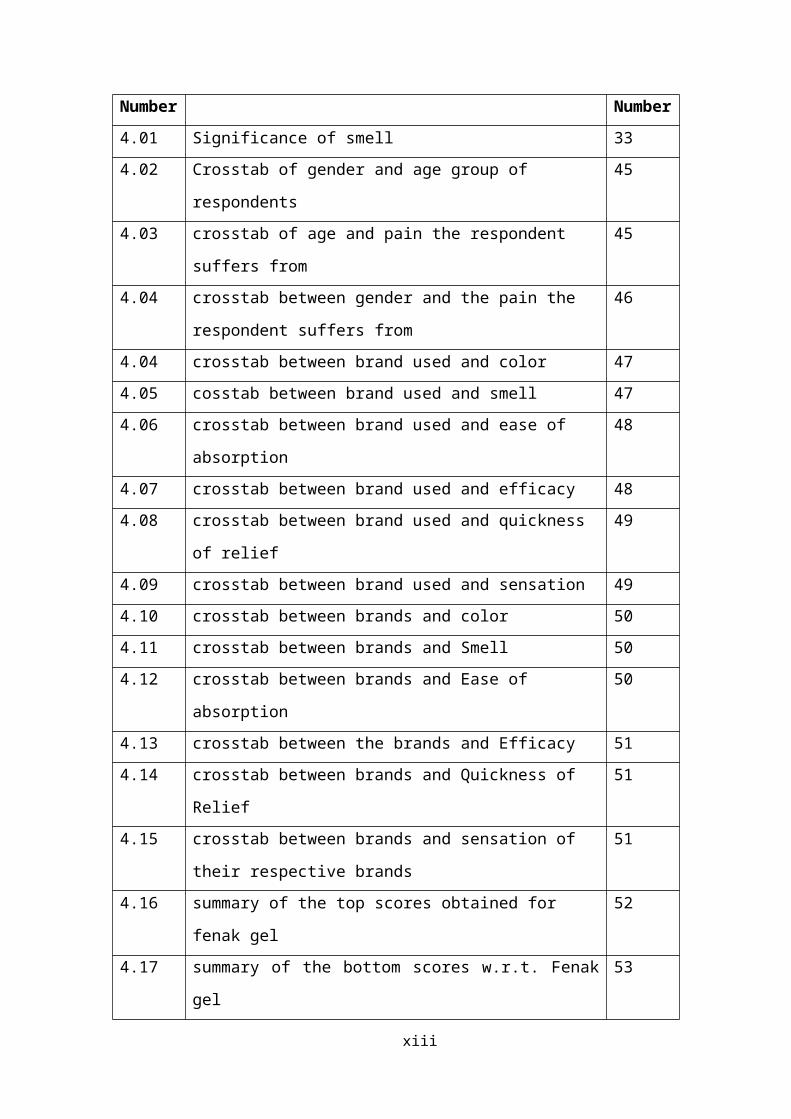
List of Tables
viii
Table
Number
Table Name Page
Number
4.01 Significance of smell 33
4.02 Crosstab of gender and age group of respondents 45
4.03 crosstab of age and pain the respondent suffers from 45
4.04 crosstab between gender and the pain the respondent suffers
from
46
4.04 crosstab between brand used and color 47
4.05 cosstab between brand used and smell 47
4.06 crosstab between brand used and ease of absorption 48
4.07 crosstab between brand used and efficacy 48
4.08 crosstab between brand used and quickness of relief 49
4.09 crosstab between brand used and sensation 49
4.10 crosstab between brands and color 50
4.11 crosstab between brands and Smell 50
4.12 crosstab between brands and Ease of absorption 50
4.13 crosstab between the brands and Efficacy 51
4.14 crosstab between brands and Quickness of Relief 51
4.15 crosstab between brands and sensation of their respective
brands
51
4.16 summary of the top scores obtained for fenak gel 52
4.17 summary of the bottom scores w.r.t. Fenak gel 53
4.18 mean scores of attributes w.r.t the Fenak gel 54
4.19 crosstab of the brand used and their opinion on the color of
fenak
55
4.20 crosstab of the brand used and their opinion on the smell of
Fenak
55
4.21 crosstab of the brand used and their opinion on the Ease of
Absorption of Fenak
56
4.22 crosstab of brand used and their opinion on the Efficacy of
Fenak
56
4.23 crosstab of the brand used and their opinion on the quickness
of relief of fenak
56
4.24 crosstab of the brand used and their opinion on the sensation of 57
ix

fenak
4.25 crosstab of brand used and if the respondents would like to
purchase Fenak or not
57
4.26 reasons to purchase Fenak 58
4.27 Reasons not to purchase fenak 58
x

CHAPTER 1: INTRODUCTION
1.1 Indian Pharmaceutical Industry Overview
The Pharmaceutical industry in India is the world's third-largest in terms of volume
and stands 14th in terms of value. According to Department of Pharmaceuticals,
Ministry of Chemicals and Fertilizers, the total turnover of India's pharmaceuticals
industry between 2008 and September 2009 was US$21.04 billion. Sale of all types of
medicines in the country is expected to reach around US$19.22 billion by 2012.
Exports of pharmaceuticals products from India increased from US$6.23 billion in
2006-07 to US$8.7 billion in 2008-09 a combined annual growth rate of 21.25%.
According to PricewaterhouseCoopers (PWC) in 2010, India joined among the league
of top 10 global pharmaceuticals markets in terms of sales by 2020 with value
reaching US$50 billion.
Some of the major pharmaceutical firms include Sun Pharmaceutical, Cadila
Healthcare and Piramal Healthcare..
The lack of patent protection made the Indian market undesirable to the multinational
companies that had dominated the market, and while they streamed out. Indian
companies carved a niche in both the Indian and world markets with their expertise in
reverse-engineering new processes for manufacturing drugs at low costs. Although
some of the larger companies have taken baby steps towards drug innovation, the
industry as a whole has been following this business model until the present.
Pharmaceutical industry today
The number of purely Indian pharma companies is fairly low. Indian pharma industry
is mainly operated as well as controlled by dominant foreign companies having
subsidiaries in India due to availability of cheap labour in India at lowest cost. In
2002, over 20,000 registered drug manufacturers in India sold $9 billion worth of
formulations and bulk drugs. 85% of these formulations were sold in India while over
60% of the bulk drugs were exported, mostly to the United States and Russia. Most of
the players in the market are small-to-medium enterprises; 250 of the largest
1

companies control 70% of the Indian market. Thanks to the 1970 Patent Act,
multinationals represent only 35% of the market, down from 70% thirty years ago.
Most pharma companies operating in India, even the multinationals, employ Indians
almost exclusively from the lowest ranks to high level management. Mirroring the
social structure, firms are very hierarchical. Homegrown pharmaceuticals, like many
other businesses in India, are often a mix of public and private enterprise. Although
many of these companies are publicly owned, leadership passes from father to son and
the founding family holds a majority share.
In terms of the global market, India currently holds a modest 1-2% share, but it has
been growing at approximately 10% per year. India gained its foothold on the global
scene with its innovatively engineered generic drugs and active pharmaceutical
ingredients (API), and it is now seeking to become a major player in outsourced
clinical research as well as contract manufacturing and research. There are 74 U.S.
FDA-approved manufacturing facilities in India, more than in any other country
outside the U.S, and in 2005, almost 20% of all Abbreviated New Drug Applications
(ANDA) to the FDA are expected to be filed by Indian companies. The Indian
pharmaceutical industry has become the third largest producer in the world and is
poised to grow into an industry of $ 20 billion in 2015 from the current turnover of $
12 billion.
Introduction to Ranbaxy Labs Ltd
Ranbaxy Laboratories Limited is an integrated, research based, international
pharmaceutical company, producing a wide range of quality, affordable generic
medicines. Ranbaxy is ranked amongst the top ten global generic companies and has a
presence in 23 of the top 25 pharma markets of the world. The company is
headquartered in India. It has presence in 49 countries, with manufacturing facilities
in 11 and a diverse product portfolio.
History
Ranbaxy was incorporated in 1961. Bhai Mohan Singh was the founder of the
company. He bought the company from his cousins Ranjit Singh and Gurbax Singh.
Ranbaxy's name is a fusion of Ranjit and Gurbax's names. Ranbaxy went public in
1973. Ranbaxy's first joint venture was set up in Lagos (Nigeria) in 1977. In 1985,
2
Ranbaxy Research Foundation was established and Stancare, Ranbaxy's second
pharmaceutical market division started functioning. In 1987, production started at
Ranbaxy's Toansa Plant (Punjab) and with this Ranbaxy became India's largest
manufacturer of antibiotics/antibacterials. In 1988, Ranbaxy's Toansa Plant got US
FDA approval. In 1990, Ranbaxy was granted its first US patent, for Doxycyline. In
1993, Ranbaxy set up a joint venture in China. In 1994, Ranbaxy established regional
headquarters in UK and USA. In the same year its GDR was listed in Luxembourgh
Stock Exchange. In 1995, Ranbaxy acquired Ohm Laboratories, a manufacturing
facility in the US and inaugurated state-of-the art new manufacturing wing at
Ranbaxy's US subsidiary Ohm Laboratories Inc. In 1997, Ranbaxy crossed a sales
turnover of Rs. 10,000 million.
In 1998, Ranbaxy entered USA, world's largest pharmaceutical market, with products
under its own name. In the same year, Ranbaxy filed its first Investigational New
Drug (IND) application with the Drugs Controller General OF India for approvals to
conduct Phase 1 Clinical trials. In 1999, Ranbaxy commenced trials for its NCE. In
2000, Ranbaxy acquired Bayer's Generic business in Germany, and entered into
Brazil, the largest pharmaceutical market in South America. In 2001, Ranbaxy set up
a manufacturing facility in Vietnam. In 2003, Ranbaxy launched Cefuroxime Axetil
after approval from USFDA. It was the first approval granted to any generic company
for this product. In 2003, Ranbaxy and Glaxo SmithKline Plc entered into an alliance
for drug discovery and development. In 2004, Ranbaxy acquired a wholly-owned
subsidiary RPG (Aventis) SA and began operations in France as a Top 10 generic
company. In 2005, Ranbaxy launched operations in Canada and acquired generic
product portfolio from EFARMES of Spain. In 2006, Ranbaxy acquired Be Tabs
pharmaceuticals of South Africa, unbranded generic business of GSK in Italy &
Spain, and Terapia of Romania.
Major Achievements of Ranbaxy
1) India's largest pharmaceutical company.
2) Received The Economic Times Award for Corporate Excellence for 'The
Company of the Year 2002-2003'.
3) Ranbaxy is among the elite club of Million Dollar Companies.
3

4) Ranbaxy received India's first approval from USFDA for an Anti Retroviral
(ARV) drug under the U.S. President's Emergency Plan for AIDS Relief.
Mission
Ranbaxy's mission is 'Enriching lives globally, with quality and affordable
pharmaceuticals'.
1.1.1 Ranbaxy Global Consumer Healthcare
An introduction to Ranbaxy Global Consumer Healthcare
Moving up the value chain, Ranbaxy identified Consumer Healthcare as its new
business area in the year 2001. Subsequently, Ranbaxy Global Consumer Healthcare
(RGCH) business was initiated with the launch of 4 brands: Revital, Pepfiz, Gesdyp
& Garlic Pearls.
These brands had a strong equity with consumers and represented the leading
common ailment categories like VMS (Vitamins & Minerals Supplement), this
portfolio was carefully crafted for the introduction of Ranbaxy's consumer healthcare
business in India.
Subsequently in 2004, RGCH launched its first herbal range of products through New
Age Herbals (NAH), with products offering remedies in categories of Cough & Cold
(Olesan Oil & Cough Syrups) and Appetite Stimulant (Eat Ease).
In 2005, another popular brand, Chericof – The complete cough formula was
introduced.During 2009, the business registered sales of US $ 44 Mn registering a
growth of 12%.Revital, the flagship brand continues to maintain leadership in its
segment.
4

Ranbaxy Volini
Figure 1.2- Ranbaxy Volini
Ranbaxy Volini is the No. 1 prescribed pain reliever in topical analgesics. It has a
quick absorb formula.
It is mainly used for the treatment of pain in lower back, back and joints.
It gives a cooling sensation so that there is no feeling of burning after applying it.
It has
1. Diclofenac Diethylamine, which relieves pain and inflammation
2. Linseed oil, which has a counter-irritant action
3. Menthol, which enhances absorption and provides a cooling action.
A 15 g pack of volini has a market price of Rs. 35 and 28g pack has a price of Rs. 62.
Volini spray, on the other hand, has a market price of Rs 65(35g bottle) and Rs 100
(55g bottle)
In 2007, volini was added to the list of OTC products and removed from the
prescribed drugs. Yet, it is the Doctor’s No. 1 preferred brand.
Volini has the best trial: adoption ratio too. It contributes the most to brand sales. The
major Volini users are the females belonging to the age group of 25-45 years, SEC
A,B and C.
5

Key Competition:
Its key competition is with the following four brands, namely,
1) Moov
2) Iodex
3) Amrutanjan
4) Himani
5) Zandu
Uses of Volini
Volini is majorly applied for the following purposes,
1) Lower back, back and joint pains
2) Tennis elbow
3) Rheumatoid arthritis, osteoarthritis
4) Thumb, knee and shoulder stiffness
5) Soft tissue disorders
6) Sprains and strains
7) Injury
8) Cervical spondolysis.
The Volini gel is composed of:-
Diclophenac Diethylamine BP:- 1.16%
Linseed oil :- 3%
Methyl Salicylate :- 10%
Menthol :- 5%
The preservatives are:-
Benzyl alcohol :- 1% w/w
Gel base : - q.s.
It is manufactured by Solrex Pharmaceuticals
Fenak gel
The fenak gel is a pure Diclophenac containing gel. It is assumed to be a non -
smelling Volini gel, as it is said to be having the same color, efficacy, sensation,
texture as that of Volini, except that it is non-smelling.
6

1 .2Purpose o f the S tudy
The main objectives and the purpose of the research paper are stated in this chapter. The main objectives are as mentioned below:
To study the consumer perception on pain relieving gels.
To study the consumer requirements towards an analgesic.
To find out if the concept of a non smelling gel would be acceptable with the
consumers.
To conduct market research on various Volini and Moov users.
To Analyze and present recommendations
1 .3S ign i f i cance o f the S tudy
When someone has muscle or arthritis pain, it can affect every aspect of their life.
They limit their activities, cancel plans, and even feel like they’re in a bad mood when
these pains strike. When trying to find relief from the pain most people think of
reaching for some sort of pill – aspirin or paracetamol. Less often, we think of a pain
relieving gel to apply to their skin.
Gels or other topically remedies have an advantage over pills. Pills or other oral (by
mouth) medications enter the bloodstream via the digestive system; therefore
everywhere the blood goes in the body, those areas will also receive the effects of the
medication, whether or not it is needed.
For systemic problems like a cold, flu or fever, oral medication is the clear choice. For
more local problems, such as sore muscles from overexertion, or a local flare up of
arthritis in the hands, may be best addressed with a topical solution such as a pain
relieving gel.
Attributes in a Pain Relieving Gel:
7
There are many formulations on the market today. Some so-called ‘natural’ remedies
contain a few herbal ingredients along with a number other ingredients, such
chemicals for thickening, fragrances, preservatives, alcohol and a lot of water. Some
are more effective than others.
Here are a few guidelines to consider when choosing the right product for the pain
relief:
1) What are the ingredients?
2) Will the ingredients give me the effect I’m seeking?
3) Are the ingredients all natural or herbal?
4) What are the effects and side effects of the ingredients?
5) Are there ingredients I’m allergic to?
6) Is the formulation pure?
7) Is it manufactured up to pharmaceutical standards?
8) Is the formulation concentrated or am I buying water?
Most of the pain relieving gels available over the counter for arthritis and muscle
pain, contain ingredients that bring on warm, then cool sensations. Some are more
effective than others. Many of these products are available only through a
professional such as a massage therapist or chiropractor.
Common Ingredients in Pain Relieving Gels:
There are three main categories of effect these ingredients will have –
1) analgesic (pain-killing),
2) anti-inflammatory,
3) Irritating (which, counter-intuitively, is not undesirable in a pain-medicine).
Some ingredients can trigger allergic reactions or unwanted side effects. Some
ingredients may have more than one of these effects –
1) aspirin, for instance, is both analgesic and anti-inflammatory.
2) ‘Irritating’ ingredients are those such as menthol and camphor, which cause a
mild, not-unpleasant stinging sensation that some people feel as heat and
others feel as a chill.
8
This causes a pain-relieving effect because the nerves are ‘distracted’ in sending the
brain the heat/chilling message, and thus can’t carry the sore-muscle message at the
same time.
The following are the common ingredients on the labels of pain medications:
1) Salicylate – this is the active ingredient of aspirin. If a patient is avoiding
aspirin for any reason, he/she should avoid topical preparations containing
salicylate. Otherwise, it is very effective applied right to the source of the pain,
and also serves to reduce inflammation that may be the cause of much of the
pain.
(Volini has Salicylate)
2) Menthol, camphor, clove oil – these are all ‘irritating’ agents that feel either
warm or icy on the skin. Most people find the sensation soothing, not
irritating. They are very effective for easing pain temporarily. Many topical
gels and patches contain one or several of these ingredients, most commonly
menthol. E.g. Volini gel.
3) Capsaicin – a special case in the ‘irritating agents’ category, capsaicin is the
substance that makes cayenne peppers taste hot, and which can burn your skin.
Used in a salve, it functions in the same way as menthol and the other irritants;
it has been used in herbal preparations for literally centuries.
Modern research has discovered that it also has the property that if used over a period
of time, it decreases the nerves’ store of ‘Substance P’, which transmits pain messages
to the brain, resulting in a reduction in the ability to feel pain.
Since it can take two weeks of application for this effect to be noticed, it is more
useful for managing chronic pain such as that associated with arthritis.
1.4 Theoretical Framework
The basis for this research was to know if the smell has any effect on the consumer
behavior towards a pain relieving gel.
9
The sensory perceptions towards the smell are broadly varied.
These perceptions can be classified as the following:-
1. Smell
Whenever a pain relieving gel is applied, a peculiar smell comes out of it. Thus, it
may become psychological for most of the people that if the smell comes, it means the
pain reliever is having an effect. This is called as a learned effect or associative
learning. Thus, due to this associative learning, patients feel that the pain reliever has
an action on their body, when applied. And thus, they feel that the pain has reduced.
On the other hand,if an associative learning does not exist, there may exist an innate
learning. Innate learning is any behavior, that is instinctive, if it is performed without
being based upon prior experience (that is, in the absence of learning), and is therefore
an expression of innate biological factors.
This innate learning is found to be less prevalent in the pain relieving gels, though, if
present, it may be classified further as
a. the respondent likes it
b. the respondent does not like it.
If the respondent likes it, then the same smell would help the respondent feel that the
pain has reduced. And if the respondent does,nt like it, it may lead to a negative effect
and patient may feel that the pain has elevated.
2. Attention
A theory says that if the patients are distracted, it would help them to feel that the pain
has reduced. The distraction may be caused by adding a burning sensation to it, giving
it a particular smell etc, such that, the patient starts to think about the other effect than
the pain.
On the other hand, if any kind of distraction is not provided, the respondent may not
feel any effect of the pain relieving gel and hence they feel that there is no effect of
the gel on pain.
10

3. Sensation
Respondents feel that a burning sensation has the ability to reduce the pain. This is
purely psychological, but the respondents do buy their product on this basis.
However, there are a set of people who do not like the burning/ cooling sensation at
all and hence it makes them feel that the pain has increased., which is again
psychological.
Thus we can say that the smell, sensation, color, apart from efficacy and quickness of
relief has an effect on the consumer’s perception towards a pain relieving gel.
11

CHAPTER 2 – REVIEW OF THE LITERATURE
2.1 J. Bouge (2009) Cross-category innovativeness as a source of new product
ideas: Consumers’ perceptions of over-the-counter pharmacological beverages
The borders between food and beverage, pharmaceutical and consumer healthcare
industries have become increasingly blurred concurrent to the development of
‘radically innovative’ health-enhancing foods and beverages within the health and
wellness market. This research investigated consumers’ attitudes and perceptions
towards cross-category innovations, and applied it to the design and strategic
marketing of novel over-the-counter (OTC) pharmacological beverages. Fifty-eight
consumers participated in 10 in-depth interviews and six focus groups. Following this,
286 respondents evaluated hypothetical OTC pharmacological beverage concepts
through conjoint analysis. The research revealed that the functional benefit attribute
accounted for over 33% of consumers’ purchase intent for OTC pharmacological
beverages, with age and OTC-related purchase behaviours strongly related to cluster
membership. Consequently, as companies move towards the extremes of the diet-
health continuum, branding, product efficacy and product positioning strategy issues
become extremely critical considerations for companies seeking new product
opportunities with medicinal-oriented products such as OTC pharmacological
beverages.
2.2 M. Ching (1999) Aromatherapy in the Management of Acute Pain?
Recent surveys indicate that people are increasingly using complementary therapies as
an adjunct or alternative to conventional treatment options as well as for general
health and well being. Whilst complementary therapies such as aromatherapy have
been utilised in clinical settings as diverse as long term care facilities and palliative
care, its application to the acute care setting has not been explored in depth. The
changes in contemporary health care practices such as post-operative pain
management and length of hospital admissions have provided nurses with the
challenge of examining the range of therapeutic interventions that can be applied to
their practice. The purpose of this paper is to examine critically the potential uses of
aromatherapy in the management of acute post-operative pain. The concept of
12

aromatherapy will be explored in relation to its effects on the pain pathways, methods
of administration and therapeutic effects. Specific reference will be made to Lavender
(Lavandula angustifolia) and its use in aromatherapy. A review of the literature points
to gaps in the knowledge related to the clinical application of aromatherapy in relation
to issues of dosage, methods of administration and therapeutic effects. The relatively
small number of studies that have looked at aromatherapy in the acute care setting
supports the literature reviewed. Issues such as small sample sizes and the difficulty in
replicating these studies make it difficult to generalize the findings. In order to
achieve best practice, further research is necessary to explore the use of aromatherapy
in the management of acute post-operative pain.
2.3 Chantal Villemure, M. Catherine Bushnell*, (2010) Cognitive modulation
of pain: How do attention and emotion influence pain processing?
The Indian Pharmaceutical Industry focuses on pharmacological control of pain. So,
majority research on pain control focuses on peripheral and spinal cord mechanisms
of opioid and anti-inflammatory analgesic therapy.
Recently, variables such as attentional state, emotional context, hypnotic suggestions,
attitudes, expectations or anesthesia-induced changes in consciousness now have been
shown to alter both pain perception and forebrain pain transmission in humans.
These techniques, at times, preferentially alter sensory and/or affective aspects of
pain perception, and the associated modulation of pain-evoked neural activity occurs
in limbic and/or sensory brain regions, suggesting multiple endogenous pain-
modulatory systems. This paper compares the modulatory influences of two principal
cognitive variables, attention and emotion, on pain perception and addresses possible
neural mechanisms underlying each of these influences.
Attentional modulation of pain
It is the most studied psychological variable that modifies pain. A lot of reports show
that lteration of pain is maximum when the patients are distracted. This distraction is
caused by achieving another sensory stimuli such as tactile, visual or auditory
stimulus.
Reports say focusing on pain enhances the pain perception.
Males, on the other hand, feel opposite. If they are exposed more to the physical
sensations, they feel less pain.
13
Modulation of pain by emotional factors
Studies show that manipulations that have a positive effect on mood or emotional
state, such as pleasant music, pleasant pictures, and humorous films, generally reduce
pain perception
Conversely, experimental manipulations that have a negative effect on mood and
emotions have been shown to increase pain, although these effects are less reliable
than those related to positive mood manipulations.
Modulation of pain by olfactory stimuli
A preliminary report by Marchand et al. (1999) suggests that, in humans, odors
influence both mood and pain in female subjects. Nevertheless, in both the animal and
human studies of the effect of olfactory stimuli on pain perception, the influence of
mood and attention has not been dissociated. Since most olfactory stimuli have clear
positive or negative hedonic value and can also serve as a target for varying degrees
of directed attention, the olfactory modality provides a useful
tool for studying the interaction between direction of attention and emotional context
on pain perception.
A study in the laboratory (Villemure et al., unpublished data) controlled and
manipulated independently direction of attention and hedonic value of an odor
distracter. It was found out that attention and odor valence independently altered pain
perception. Further, whereas attentional manipulations had no effect on mood but
altered the perception of both pain intensity and unpleasantness, odor valence altered
both mood and pain unpleasantness but did not significantly affect pain sensation.
Modulation of pain by other external stimuli
When subjects’ mood was improved by reading elative statements, pain tolerance (a
measure of the affective dimension of pain) was increased, whereas when their mood
was made worse by reading depressive statements.
14

2.4 John Prescott (2006) The Basis Of Odor Effects On Pain: A Review And
Investigation Of Conditioned Odor Effects
There is increasing evidence that odors may influence human responses to pain. Such
findings have been attributed variously either to odors directing attention away from
the pain or to the fact that odors may influence moods, which in turn may modify the
unpleasantness or intensity of pain. Neither of these explanations invoke mechanisms
that are specific to odors, however, since other sensory stimuli may produce similar
effects. Since odors may take on properties through repeated association with tastes,
for example, in foods, it is possible that reductions of pain or pain unpleasantness
during odor exposure might result from these “secondary” characteristics. In
particular, many odors are reported as smelling sweet, a consequence of their prior
association with sweet tastes. The underlying mechanism of sweet
taste palatability, and indeed the ability of tasted sweetness to act as an analgesic, is
activation of opioid reward systems in the brain. One possibility therefore is that
sweet smelling odors may have been conditioned to activate these same opioid
systems, which may result in odors themselves acting to produce inhibitory effects on
pain. This hypothesis was tested by comparing the ability of odors varying along the
dimensions of sweetness and pleasantness to influence pain induced by immersion of
the forearm in cold water. An odor that was sweet smelling produced a significant
increase in the time in which subjects kept their arm in the water. A pleasant, but not
sweet-smelling odor had no similar impact.
These data strongly suggest that as predicted sweet-smelling odors may activate
opioid systems as a result of associative conditioning. The activation of these reward
pathways may explain why sweetsmelling odors such as vanilla may be (as far as we
are aware) universally liked, and also may
act to increase liking for odor mixtures in which they are included.
Odors could be influential through:
Innate effects, in which the odor molecules directly interact in some fundamental and
quite specific way with physiological processes. If potential pheremonal effects and
the impact of many odorous compounds on trigeminal fibres, and hence on pain
15

systems, is ruled out, it is safe to say that there is little or no evidence for such
mechanisms.
Learned responses, in which an odor becomes associated with some event, process
or object that influences the responses to, or perceptions of, that odor. Here, we might
want to further distinguish –
i. Effects based on familiarity or pleasantness, both of which are based on
exposure and in some cases pairing with other liked stimuli;
ii. Effects based on odor being used, a conditioned (learned) signal for a specific
behavioural or physiological response.
2.5 RS Herz (2004) Changing Odor Hedonic Perception Through Emotional
Associations in Humans
A long-standing debate in theories of olfactory perception is whether
hedonic responses to odors are innate or learned. Hedonic perception refers to
affective evaluations that center on liking. Traditionally in odor research, the
perceptual factors of pleasantness, familiarity, and intensity have been used to
evaluate hedonic perception (Moskowitz et al., 1976; Sulmont et al., 2002).
The innate view of hedonic perception claims that we are born with a predisposition to
like or dislike various smells. Though widely held, this view has not been empirically
validated in humans and is largely due to extrapolations from animal pheromonal
communication (Rasmussen & Schulte, 1998). In contrast, the learned view states that
we are born merely with a predisposition to learn to like or dislike smells, and that
whether a smell is liked or not is due to the emotional valence of the experiences that
have been associated to it (Bartoshuk, 1991; Engen, 1991;Herz, 2001).
Associative learning, the process by which one event or item comes to be
linked to another because of an individual’s past experiences, is responsible for a
large part of human cognition and behavior (Wasserman & Miller, 1997). It is
proposed that odor hedonic responses are formed from a learned association
combining the sensory percept and the emotional experience when the percept was
16

first encountered (Bartoshuk, 1991; Engen, 1991; Herz, 2001). For example, a novel
odor is experienced in conjunction with an emotional event that induces anxiety, such
as a surgical procedure in a hospital. The odor through its association with the
emotion of anxiety then acquires the emotional significance of anxiety, which imbues
the odor with hedonic meaning, thus influencing perception (e.g., unpleasant).
Thus the reason why we like or dislike various smells is due to the associative history
of the odors in question. It is not always necessary to have direct contact with an odor
in an emotional context in order to learn its significance because cultural learning
provides meaning to many unencountered stimuli. That is, one does not need to have
been trapped in a burning house to know that the smell of smoke signals danger;
learning that where there is smoke there is fire can be sufficient.
2.6 By A. Vania Apkarian, M. Catherine Bushnell, Rolf-Detlef Treede, Jon-Kar
Zubieta,(2005) Human brain mechanisms of pain perception and regulation in
health and disease
The perception of pain due to an acute injury or in clinical pain states undergoes
substantial processing at supraspinal levels. Supraspinal, brain mechanisms are
increasingly recognized as playing a major role in the representation and modulation
of pain experience. These neural mechanisms may then contribute to interindividual
variations and disabilities associated with chronic pain conditions.
2.7 P. Rainville (2005) Pain-related emotions modulate experimental pain
perception and autonomic responses
The effect of emotions on pain perception is generally recognized but the underlying
mechanisms remain unclear. Pain increases were associated with increases in self-
rated desire for relief and decreases in expectation of relief, and with increases in
arousal, negative affective valence and decreases in perceived control.
Correlation and multiple regression analyses suggest that negative emotions and
desire for relief influence primarily pain affect and that pain-evoked autonomic
responses are strongly associated with pain affect. These results confirm the
hypothesized influence of the desire for relief on pain perception, and particularly on
pain affect, and support the functional relation between pain affect and autonomic
nociceptive responses. This study provides further experimental confirmation that
17

pain-related emotions influence pain perception and painrelated physiological
responses. There is a general agreement that emotions influence pain. However, there
is only moderate consensus about the specific conditions under which those effects
occur, their
direction and magnitude, or their underlying mechanisms.
Both the desire for, and the expectation of, relief and the valence and arousal
dimensions of emotions adequately accounted for the changes in pain. However,
although pain relief may adequately reflect the goal of patients in some acute pain
situations, the patients’ goals may be extremely diverse in chronic pain situations.
Assessing more explicitly those goals and the corresponding desire and expectation
may inform about the individual underpinnings of painrelated emotions and their
possible influence on pain and suffering.
2.8 Gillian A. Bendelow1, Simon J. Williams (2005) Transcending the dualisms:
towards a sociology of pain
Theories of pain have traditionally been dominated by biomedicine and concentrate
upon its neurophysiological aspects, both in diagnosis and treatment. Hence, scientific
medicine reduces the experience of pain to an elaborate broadcasting system of
signals, rather than seeing it as moulded and shaped both by the individual and their
particular socio-cultural context. Although pain lies at the intersection between
biology and culture, making it an obvious topic for sociological investigation, scant
attention has been paid to understanding beliefs about pain within the study of health
and illness. A major impediment to a more adequate conceptualisation of pain is due
to the manner in which it has been ‘medicalised’, resulting in the inevitable Cartesian
split between body and mind. Consequently, the dominant conceptualisation of pain
has focused upon sensation, with the subsequent inference that it is able to be
rationally and objectively measured. Yet as well as being a medical ‘problem’, pain is
an everyday experience. Moreover, sociological and phenomenological approaches to
pain would add to, and enhance, existing bodies of knowledge and help to reclaim
pain from the dominant scientific paradigm. In this paper, it is argued, firstly, that the
elevation of sensation over emotion within medico-psychological approaches to pain,
can be shown to be limiting and reductionist. Secondly, we attempt to show how
insights from the newly-emerging sociological arenas of emotions and
18

embodiment provide a framework which is able to both transcend the divide between
mind and body and to develop a phenomenological approach to pain.
19
CHAPTER-3: RESEARCH METHODS AND PROCEDURES
3.1 Purpose of the Study
1) To study the consumers’ likes and dislikes towards their preferred pain relieving
gel (Volini/Moov)
2) To study consumers perceptions towards an ideal pain relieving gel.
3) To study consumers requirements, likes and dislikes with respect to the non
smelling pain relieving gel. (non smelling Volini formulation- Fenak)
4) To analyze the results so obtained and provide recommendations such that it helps
the company to decide if to launch the product or not.
3.2 Research Design
The project uses both exploratory and descriptive research. The research method was
the questionnaire method. An intensive secondary research is also conducted to gain
insights in the pharmaceutical OTC market. This helps in understanding the various
factors affecting the OTC market and the pain relieving gels
3.3 Participants
1) Majority women belonging to the age group of 25-45 years.
Data collection technique and procedure
The area for data collection was Delhi region. Since households needed to be visited on a weekly/ biweekly basis, convenient sampling was majorly used.
1. Primary Data
The data was collected on the following parameters:
Age
Gender
SEC categories
Pain suffered
Pain relieving gel used
Frequency of pain.
20
This data formed the preliminary criteria for acceptance of the individual as a
respondent for Fenak gel. The target population being 25-45 years, SEC category
being A, B or C, pain relieving gel being Volini/Moov. If the individual fulfilled the
following criteria, he was considered as a respondent otherwise the questionnaire was
discarded.
Then, the data was collected on the following data with respect to an ideal pain
reliever and brand used. The criteria were:-
Color
Smell
Ease of absorption
Pain relieving ability/ Efficacy
Quickness of relief
Sensation
The respondent was asked to state reasons on why the smell was important/ not
important to him and what he thinks of the strength of the smell of the used brand. If
it was
Much too strong
Strong
Just okay
Mild
Too mild
After collecting the information stated, the respondent was given Fenak gel.
He was convinced to use Fenak gel whenever he suffered from pain. He was
contacted weekly and was asked if he used the gel or not. Prior to the usage, the
respondent was asked to give his rating on the same parameters, as were the
parameters of the used brand, i.e,
Color
21

Smell
Ease of absorption
Pain relieving ability/efficacy
Quickness of relief
Sensation
The respondent was asked what he thinks about the smell of the Fenak gel, weather he
liked it, or though it was too mild, or did not like it at all etc.
The respondent was also asked if he would like to purchase the gel, if it was launched
in the market, or not. He was asked to give suggestions and tell more about his key
likes and dislikes regarding the Fenak gel.
The data so collected was fed into SPSS and Excel and analyzed.
2. Secondary data
Already existing data is called secondary data. I collected them by following method:
Internet – Manta.com, Chemnet.com, worldofchemicals.com and
Linkedin.com
Published Reports
Search Engine
Official websites of manufacturers and suppliers.
3.4 Research Hypothesis
H0: Fenak gel is not acceptable to the majority of customers
H1: Fenak gel is acceptable to the majority of customers
3.5 Instrument Used
Following software’s has been used during collecting, analysis and compiling of data.
SPSS
Microsoft Excel
Google Scholar
This study was carried out through a set of self-administered questionnaires. A sample
questionnaire is attached in Appendix.
22

3.6 Pilot Study
The pilot study was done for the first 15 respondents and seen if any ambiguous or
vague question/ responses were recorded. Various alterations were done till the time a
full-fledged, clear cut questionnaire was prepared and used as the basis for data
collection.
3.7 Data Analysis
Data Analysis was done using SPSS 16.0 for Windows. SPSS is a computer program
used for survey authoring and deployment, data mining, text analytics, statistical
analysis.
Statistics used:-
Descriptive Statistics: Cross – Tabulation, Frequencies, Custom Tables
3.8 Limitations
1. Inaccessibility to all published report due to high cost.
2. Communication barrier.
3. Limited time and resources.
CHAPTER 4: DATA ANALYSIS AND FINDINGS
23

4.1 Age of the respondent
The target population was 25-45 years. So the population considered in this research
composed of 92% of the population belonging to the TG of 25-45 years
Figure 4.01- age of the respondent
The statistics were:-
<25 = 1
25-35= 35
35-45= 57
>45= 7
n=100
4.2 Gender of the respondent.
The sample considered was composed of 35% males and 65% females.
Figure 4.2- gender of the respondent
4.3 SEC category
The target population composed of people belonging to SEC A, B, C.
24

Results have shown that majority of respondents belong to SEC A category
(85%)
Figure 4.03- SEC category of the respondent
The statistics obtained were:-
SEC A1- 50%
SEC A2- 35%
SEC B1- 7%
SEC B2- 6%
SEC C- 2%
n= 100
4.4 Type of pain that the respondent suffers from:-
From the sample of 100, it was found out that
37% respondents suffered from joint pain
44% respondents suffered from back pain
24% from neck/shoulder pain
30% from sprains and strains.
25
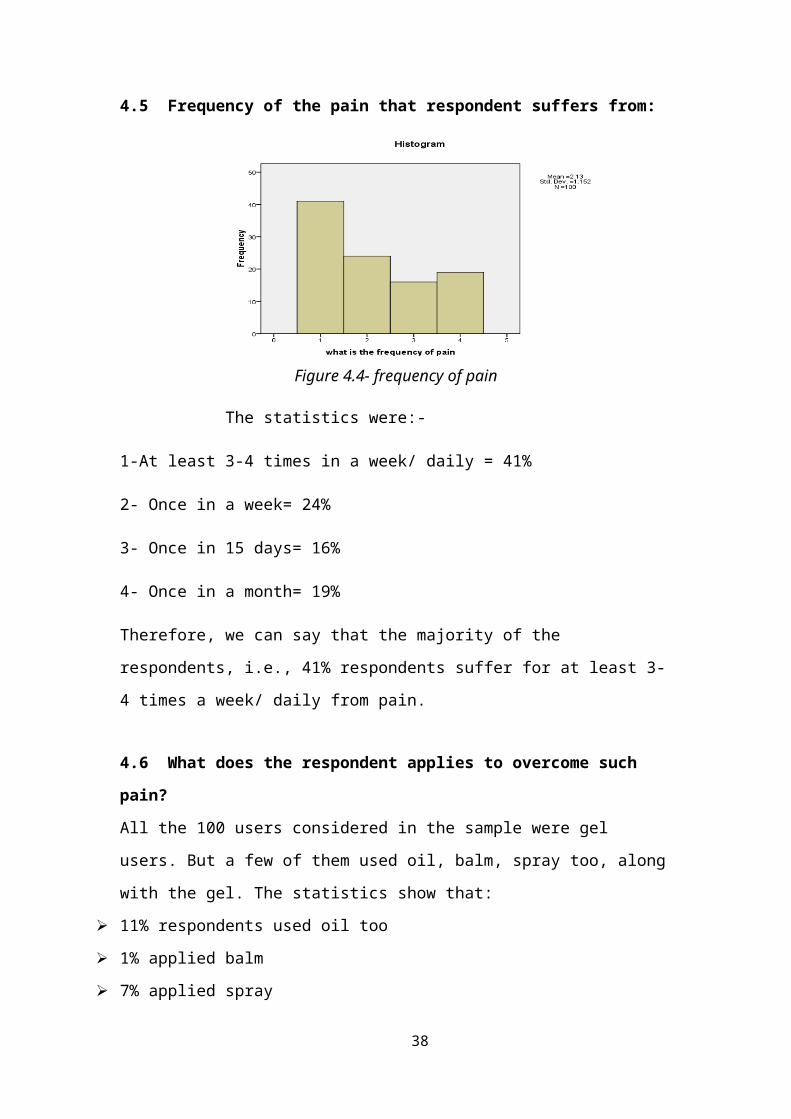
4.5 Frequency of the pain that respondent suffers from:
Figure 4.4- frequency of pain
The statistics were:-
1-At least 3-4 times in a week/ daily = 41%
2- Once in a week= 24%
3- Once in 15 days= 16%
4- Once in a month= 19%
Therefore, we can say that the majority of the respondents, i.e., 41% respondents
suffer for at least 3-4 times a week/ daily from pain.
4.6 What does the respondent applies to overcome such pain?
All the 100 users considered in the sample were gel users. But a few of them used oil,
balm, spray too, along with the gel. The statistics show that:
11% respondents used oil too
1% applied balm
7% applied spray
26
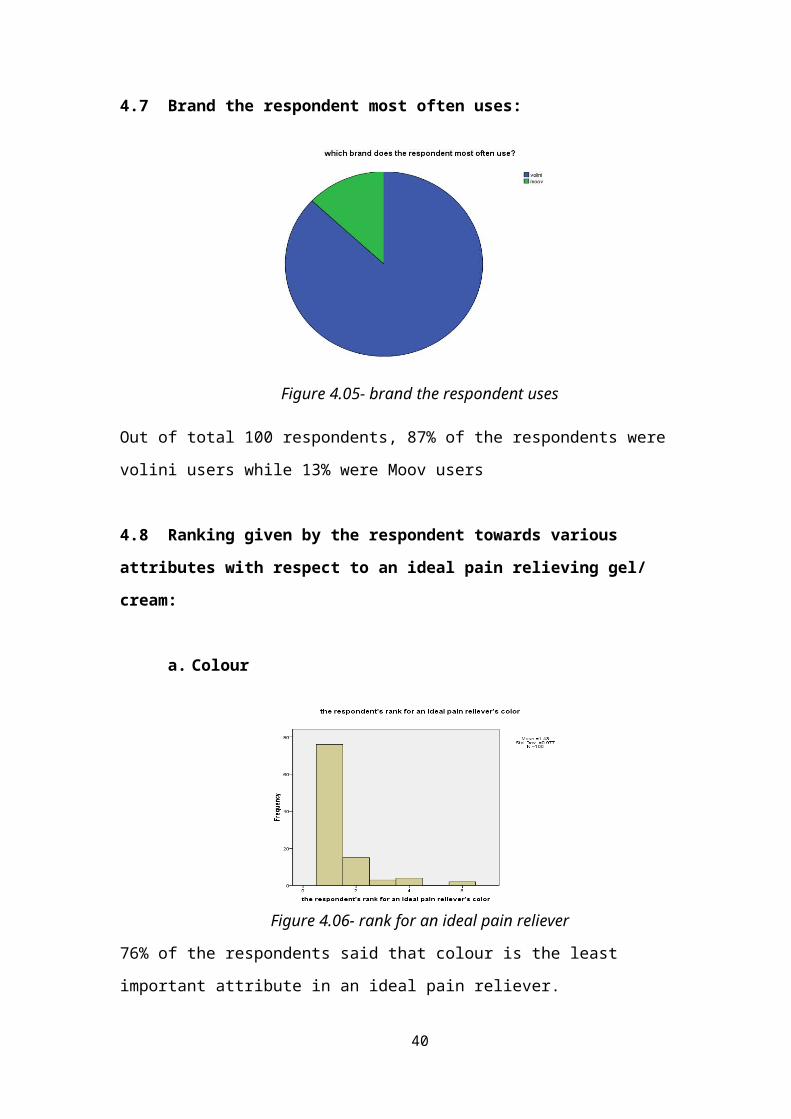
4.7 Brand the respondent most often uses:
Figure 4.05- brand the respondent uses
Out of total 100 respondents, 87% of the respondents were volini users while 13%
were Moov users
4.8 Ranking given by the respondent towards various attributes with respect
to an ideal pain relieving gel/ cream:
a. Colour
Figure 4.06- rank for an ideal pain reliever
76% of the respondents said that colour is the least important attribute in an ideal pain
reliever.
The statistics were:-
27

Top Box- 2%
Bottom Box- 76%
Mean Score- 1.43
Least Important - 76%
Less Important - 15%
Not So Important- 3%
Important - 4%
Very Important - 0%
Most Important - 2%
N=100
b. Smell
Figure 4.07- rank for an ideal pain relievers smell
The statistics show:-
Top Box= 0%
Bottom Box= 9%
Mean Score= 2.63
Least Important - 9%
Less Important - 48%
Not So Important - 21%
28
Important - 15%
Very Important - 7%
Most Important - 0%
N=100
We can say,
48% of the respondents said smell is less important wrt an ideal pain reliever
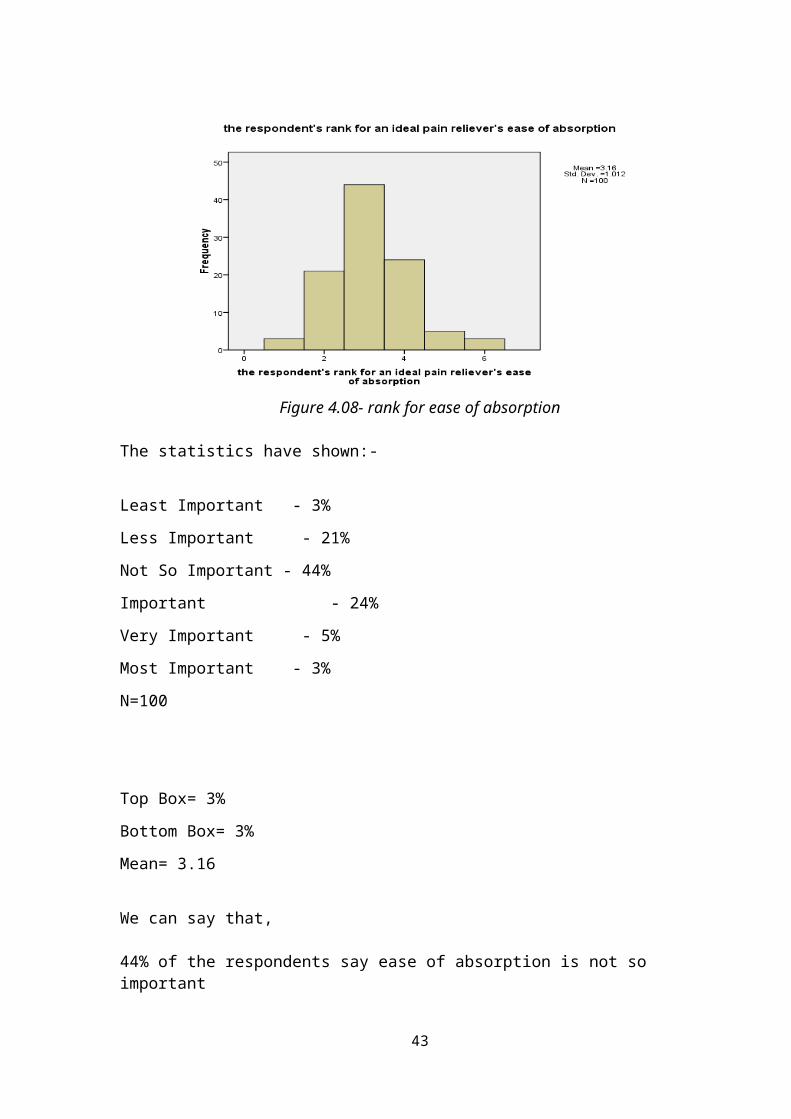
c. Ease of absorption
Figure 4.08- rank for ease of absorption
The statistics have shown:-
Least Important - 3%
Less Important - 21%
Not So Important - 44%
Important - 24%
Very Important - 5%
Most Important - 3%
N=100
29

Top Box= 3%
Bottom Box= 3%
Mean= 3.16
We can say that,
44% of the respondents say ease of absorption is not so important
d. Pain relieving ability/ efficacy
Figure 4.9- rank for ideal pain reliever’s efficacy
The statistics have shown:-
Top Box=28%
Bottom Box= 0%
Mean= 5.09
Least Important - 0%
Less Important - 4%
Not So Important - 1%
Important - 5%
Very Important - 62%
Most Important - 28%
N=100
Hence, 62% of the respondents said an ideal pain reliever’s efficacy is very important.
30
e. Quickness of relief
Figure 4.10- rank for ideal pain reliever’s quickness of relief
Top Box= 65%
Bottom Box= 2%
Mean= 5.36
Least Important - 2%
Less Important - 3%
Not So Important- 2%
Important - 8%
Very Important - 20%
Most Important - 65%
N=100
Therefore, for 65% of the respondents, quickness of relief is the most
important attribute w.r.t. an ideal pain reliever.
31

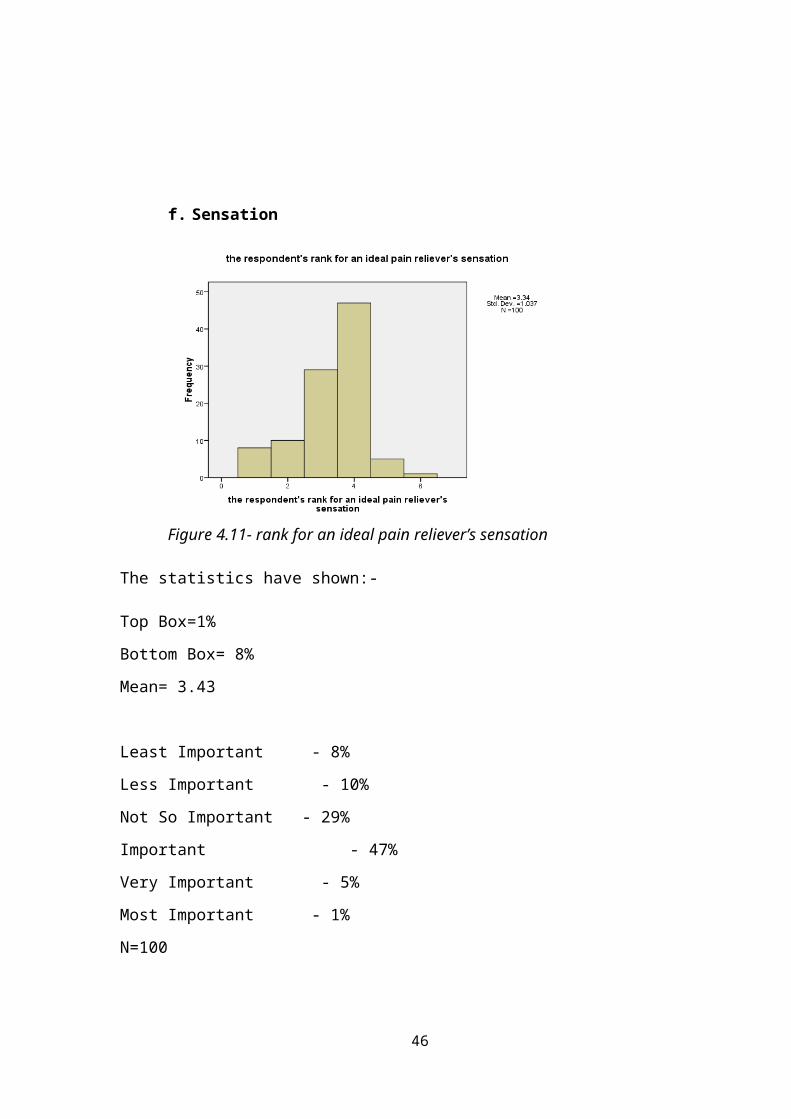
f. Sensation
Figure 4.11- rank for an ideal pain reliever’s sensation
The statistics have shown:-
Top Box=1%
Bottom Box= 8%
Mean= 3.43
Least Important - 8%
Less Important - 10%
Not So Important - 29%
Important - 47%
Very Important - 5%
Most Important - 1%
N=100
Hence, 47% respondents considered sensation to be an important factor in an ideal
pain reliever.
Observing the mean scores, we can say that, wrt an ideal pain reliever, respondents
rank
32

1) Quickness of relief- most important
2) Efficacy - very important
3) Sensation - important
4) Ease of absorption – not so important
5) Smell - less important
6) Color - least important
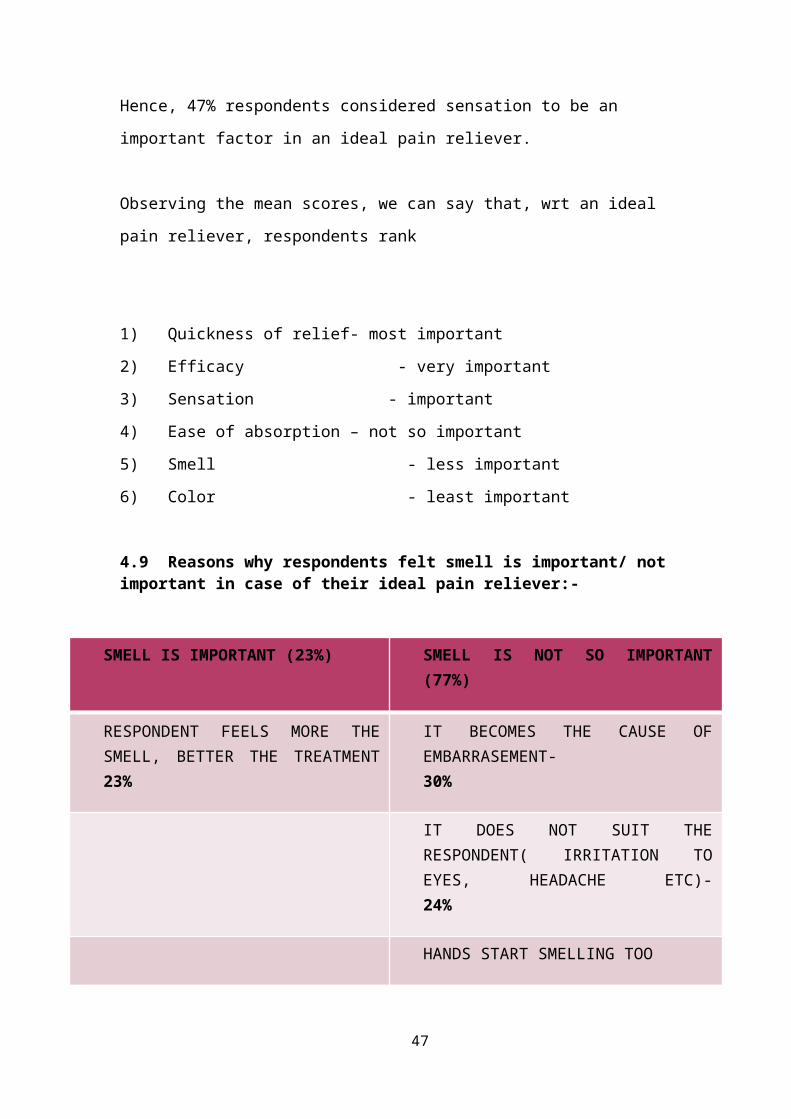
4.9 Reasons why respondents felt smell is important/ not important in case of their ideal pain reliever:-
SMELL IS IMPORTANT (23%) SMELL IS NOT SO IMPORTANT (77%)
RESPONDENT FEELS MORE THE SMELL, BETTER THE TREATMENT 23%
IT BECOMES THE CAUSE OF EMBARRASEMENT- 30%
IT DOES NOT SUIT THE RESPONDENT( IRRITATION TO EYES, HEADACHE ETC)- 24%
HANDS START SMELLING TOO
3%
SMELL IS NOT IMPORTANT, IT’S THE EFFICACY THAT MATTERS- 31%
SMELL IS NOT IMPORTANT, IT IS THE SENSATION THAT NEEDS TO BE PRESENT 4%
Table 4.1- significance of smell
Hence, the majority, i.e., 77% respondents felt that smell is not important in their
ideal pain reliever, the main reason being, that the efficacy is all that matters in a pain
reliever. Smell does not hold that much importance.
33

4.10 Respondents feeling if a non smelling product would be okay or not?
Figure 4.12- if a non-smelling product is ok?
The statistics were:-
Yes- 93%
No- 7%
The people who said non smelling product is not required are the ones who
psychologically felt smell is necessary.
93% of the respondents feel that a non smelling product would be OK.
4. Rating given by the respondents for their used brands on various attributes
a. Colour
Figure 4.13- color of the respondent’s pain reliever
The statistics show:-
34

Top Box-27%
Bottom Box-2%
Mean-2.91
1) I Do Not Like It-2
2) It’s Just About Okay-32
3) I Like It A Little-39
4) I Like It A Lot-27
N=100
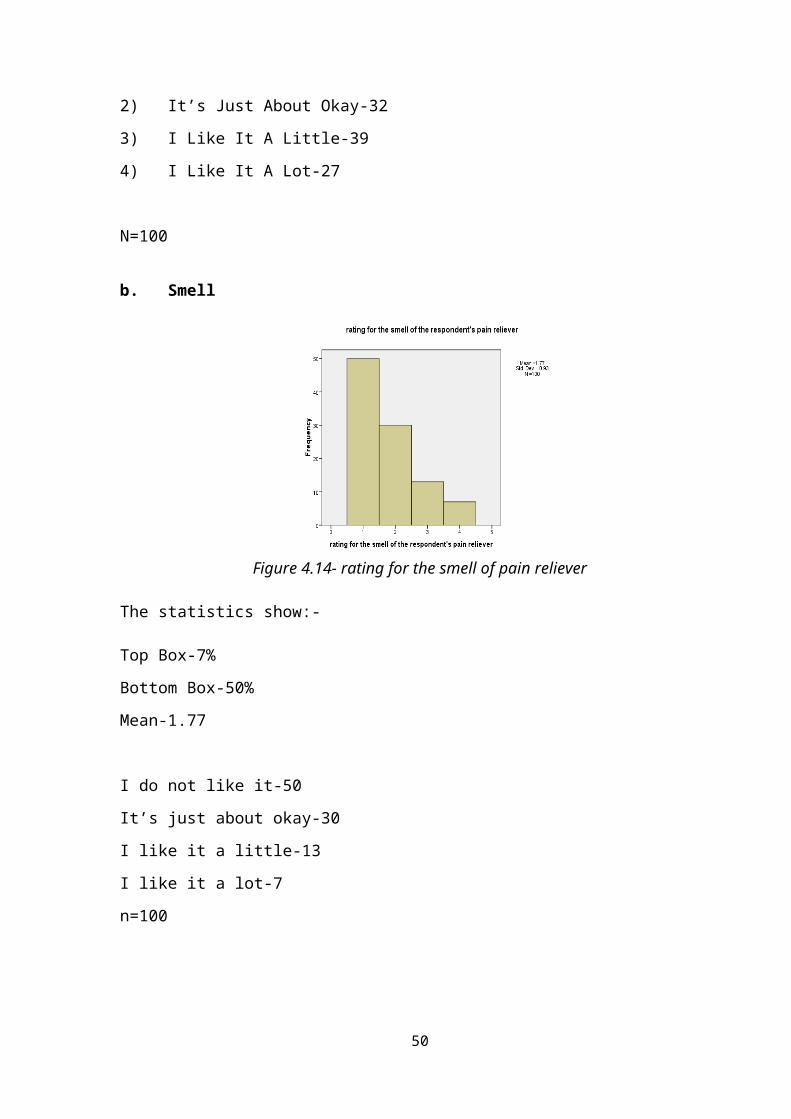
b. Smell
Figure 4.14- rating for the smell of pain reliever
The statistics show:-
Top Box-7%
Bottom Box-50%
Mean-1.77
I do not like it-50
It’s just about okay-30
I like it a little-13
I like it a lot-7
n=100
35

c. Ease of absorption
Figure 4.15- rating for ease of absorption
The statistics show:-
I Do Not Like It-23
Its Just About Okay-16
I Like It A Little-42
I Like It A Lot-19
N=100
Top Box-19%
Bottom Box-23%
Mean-2.52
Therefore, we can say, 42% respondents like the ease of absorption wrt the used brand
d. Pain relieving ability/ efficacy
36
Figure 4.16- rating for efficacy of the used brand
The statistics show:-
I do not like it-1
Its just about okay-16
I like it a little-50
I like it a lot-33
n=100
Top Box- 33%
Bottom Box- 1%
Mean- 3.15
Thus, 50% respondents like the efficacy wrt the used brand.
e. Quickness of relief
Figure 4.17- rating for quickness of relief of the used brand
The statistics were:-
I do not like it-4
Its just about okay-13
I like it a little-40
I like it a lot-43
n=100
Top Box- 43%
Bottom Box-4%
37
Mean- 3.22
43% respondents like the quickness of relief a lot wrt the used brand
f. Sensation
Figure 4.18- rating for the sensation of the used brand
The statistics were:-
Top Box-33%
Bottom Box-30%
Mean- 2.43
I Do Not Like It-30
It’s Just About Okay-20
I Like It A Little-27
I Like It A Lot-33
n=100
Thus, 33% respondents like the sensation a lot wrt the used brand
4.11 Rating given for the overall brand (used brand) the respondent currently uses
38
Figure 4.19- rating for the overall brand
The statistics show:-
I do not like it- 2
Its just about okay- 30
I like it a little- 46
I like it a lot- 22
n=100
Top Box-22%
Bottom Box-2%
Mean- 2.89
46% respondents like the overall brand.
4.12 Strength of the smell
Figure 4.20- strength of the smell
39
The statistics show:-
Much too strong- 43 (33 volini users, 10 moov users)
A little too strong- 30 (28 volini users, 2 moov users)
Just right- 25 (24 volini users, 1 moov user)
A little too mild-2 (2 volini users)
Much too mild- 0
n=100
Top Box=43
Bottom Box=0
Mean=4.96
Thus, 43% respondents feel the strength of the smell of their brand is too strong
4.13 Rating given for various attributes w.r.t the Fenak gel given to the respondents
a. Colour
Figure 4.21- rating for the color of Fenak
The statistics were:-
I do not like it-2
Its just about okay-17
I like it a little-30
I like it a lot-51
n=100
30% respondents like the colour of fenak
40

b. Smell
Figure 4.22- rating for the smell of fenak
The statistics have shown:-
Its just about okay- 15
I like it a little- 48
I like it a lot- 37
n=100
Thus, 48% respondents like the smell of fenak
c. Ease of absorption
41

Figure 4.23- rating for the ease of absorption of fenak
The statistics show the following ratings:-
I do not like it-1
Its just about okay-12
I like it a little- 48
I like it a lot- 39
n=100
48% respondents like the ease of absorption of fenak
d. Efficacy
Figure 4.24- rating for efficacy of fenak
The statistics show the following details:-
42
I do not like it- 24
Its just about okay-25
I like it a little- 30
I like it a lot- 21
n=100
e. Quickness of relief
Figure 4.25- rating for quickness of relief of fenak
The statistics were as shown:-
I do not like it-27
Its just about okay- 22
I like it a little- 34
I like it a lot- 17
f. Sensation
Figure 4.26- rating for the sensation of fenak
43

The statistics show the following details
I do not like it-28
Its just about okay- 24
I like it a little- 29
I like it a lot- 19
n=100
4.14 Feedback of the respondents on the smell of fenak gel
1) 11% respondents feel that the change of smell in a pain relieving gel doesn’t matter. It’s the pain relieving ability/ efficacy that matters the most.2) 11% respondents feel that the smell of Fenak gel is too mild.3) 78% respondents really liked the smell of Fenak gel.
4.15 Rank given by the respondent to Fenak Gel
Figure 4.27- rank given for the fenak gel
The statistics were:-
I do not like it- 13
It’s just about okay- 27
I like it a little-45
44
I like it a lot- 15
n=100
5. If the respondents would like to purchase it or not:-
Figure 4.28- respondents who would like to purchase it
The statistics were:-
Yes= 58%
No=42%
Cross tabulations:-
1. Cross-tabulation between gender of the respondent and the age group to
which they belong
Age MALES FEMALES TOTAL
BELOW 25 YRS 0 1 1
25- 35 YRS 16 19 35
35-45 YRS 16 41 57
ABOVE 45 YRS 3 4 7
Table 4.02- crosstab of gender and the age group of respondents
The majority of the respondents are females, belonging to the age group of 35-45
years. Herein,
Total Males= 35
Total Females=65
Total=100
45

2. Cross-tabulation between age of the respondent and pain he/she suffers
from
AGE OF THE
RESPONDENT
JOINT
PAIN
BACK/WAIST
PAIN
NECK/SHOULDER
PAIN
SPRAINS
AND
STRAINS
BELOW 25 YRS 0 0 0 1
25-35 YRS 9 12 8 14
35-45 YRS 24 30 13 15
ABOVE 45 YRS 4 2 2 1
Table 4.03- crosstab of age and pain the respondent suffers from
Back pain is the most common type of pain followed by joint pain and the major
sufferers belong to the age group of 35-45 years
3. Cross- tabulation between gender of the respondent and the pain he/ she
suffers from
GENDER JOINT
PAIN
BACK
PAIN
NECK/
SHOULDER PAIN
SPRAINS
AND
STRAINS
MALES 10 17 9 11
FEMALES 27 27 15 19
Table 4.04- crosstab between gender and the pain the respondent suffers from
Herein,
Males=35
Females=65
N= 100
46

This table shows that 17% males suffer from back pain while 27% of the females
suffer from joint and back pain
4. As we saw in the analysis, the respective mean scores of color, smell, ease of
absorption, efficacy, quickness of relief and sensation respectively, were, 1.43, 2.63,
3.16, 5.09, 5.36 and 3.43
Observing the mean scores, we can say that, wrt an ideal pain reliever, respondents
rank
Quickness of relief- most important
Efficacy - very important
Sensation - important
Ease of absorption – not so important
Smell - less important
Color - least important
5. Cross-tabulation between brand used and ideal pain reliever’s attributes’
a. Color
BRAND USED
LEAST IMP
LESS IMP
NOT SO IMP
IMP VERY IMP
MOST IMP
TOTAL
VOLINI 66 14 3 4 0 0 87
MOOV 10 1 0 0 0 2 13
TOTAL 76 15 3 4 0 2 100
Table 4.05- crosstab between brand used and color
Both Volini and Moov users show that color is the least important attribute in an ideal
pain reliever.
b. Smell
BRAND USED
LEAST IMP
LESS IMP
NOT SO IMP
IMP VERY IMP
MOST IMP
TOTAL
VOLINI 8 38 21 13 7 0 87
47
MOOV 1 10 0 2 0 0 13
TOTAL 9 48 21 15 7 0 100
Table 4.06- cosstab between brand used and smell
The majority of Volini and Moov users feel that the smell is a less important attribute
w.r.t an ideal pain reliever
c. Ease of absorption
BRAND USED
LEAST IMP
LESS IMP
NOT SO IMP
IMP VERY IMP
MOST IMP
TOTAL
VOLINI 3 21 34 21 5 3 87
MOOV 0 0 10 3 0 0 13
TOTAL 3 21 44 24 5 3 100
Table 4.7- crosstab between brand used and ease of absorption
The majority of Volini and Moov users think Ease of Absorption is a not so important
attribute w.r.t. an ideal pain reliever.
d. Efficacy
BRAND USED
LEAST IMP
LESS IMP
NOT SO IMP
IMP VERY IMP
MOST IMP
TOTAL
VOLINI 0 3 1 5 51 27 87
MOOV 0 1 0 0 11 1 13
TOTAL 0 4 1 5 62 28 100
Table 4.8- crosstab between brand used and efficacy
48

The majority of the respondents feel that efficacy is a very important attribute w.r.t an
ideal pain reliever
e. Quickness of relief
BRAND USED
LEAST IMP
LESS IMP
NOT SO IMP
IMP VERY IMP
MOST IMP
TOTAL
VOLINI 1 3 2 7 19 55 87
MOOV 1 0 0 1 1 10 13
TOTAL 2 3 2 8 20 65 100
Table 4.9- crosstab between brand used and quickness of relief
The majority of the Volini and Moov users feel that the Quickness of Relief is the
most important attribute w.r.t an ideal pain reliever.
f. Sensation
BRAND USED
LEAST IMP
LESS IMP
NOT SO IMP
IMP VERY IMP
MOST IMP
TOTAL
VOLINI 7 9 26 40 4 1 87
MOOV 1 1 3 7 1 0 13
TOTAL 8 10 29 47 5 1 100
Table 4.10- crosstab between brand used and sensation
The majority of the Volini and Moov users feel that sensation is an important factor
w.r.t. an ideal pain reliever.
49

6. BIFURCATION WRT THE TWO BRANDS,I.E., MOOV AND VOLINI
a. Color
BRAND I DO NOT LIKE IT
ITS JUSTABOUT OK
I LIKE ITA LITTLE
I LIKE IT A LOT
TOTAL
VOLINI 1 30 33 23 87
MOOV 1 2 6 4 13
Table 4.11- crosstab between brands and color
Majority of the Volini and Moov users feel that the color of their respective used gels
were likeable
b. Smell
BRAND I DO NOT LIKE IT
ITS JUSTABOUT OK
I LIKE ITA LITTLE
I LIKE IT A LOT
TOTAL
VOLINI 42 29 10 6 87
MOOV 8 1 3 1 13
Table 4.12- crosstab between brands and Smell
Majority of the Volini and Moov users feel that they don’t like the smell of their
respective gels.
c. Ease of absorption
BRAND I DO NOT LIKE IT
ITS JUSTABOUT OK
I LIKE ITA LITTLE
I LIKE IT A LOT
TOTAL
VOLINI 19 12 39 17 87
MOOV 4 4 3 2 13
Table 4.13- crosstab between brands and Ease of absorption
50
Majority of the Volini users find the ease of absorption of their gel likeable, whereas
the Moov users do not like the ease of absorption or find it just about okay.
d. Efficacy
4d5 I DO NOT LIKE IT
ITS JUSTABOUT OK
I LIKE ITA LITTLE
I LIKE IT A LOT
TOTAL
VOLINI 1 13 42 31 87
MOOV 0 3 8 2 13
Table 4.14- crosstab between the brands and Efficacy
Majority of the Volini and Moov users feel that Efficacy of their respective brands is
likeable
e. Quickness of relief
BRAND I DO NOT LIKE IT
ITS JUSTABOUT OK
I LIKE ITA LITTLE
I LIKE IT A LOT
TOTAL
VOLINI 3 10 33 41 87
MOOV 1 3 7 2 13
Table 4.15- crosstab between brands and Quickness of Relief
Majority of the Volini users like the quickness of Relief of their brand a lot whereas
Moov users find it just likeable
f. Sensation
BRAND I DO NOT LIKE IT
ITS JUSTABOUT OK
I LIKE ITA LITTLE
I LIKE IT A LOT
TOTAL
VOLINI 26 16 26 19 87
MOOV 4 4 1 4 13
Table 4.16- crosstab between brands and sensation of their respective brands
There exists a variation when we analyse this data, as majority percent of the Volini
users do not like the sensation while the same percent like the sensation of Volini.
51
On the other hand, equal percentage of Moov users find the sensation just about ok
and like it a lot too.
1. For the used brand,(87% volini, 13% Moov), the most liked attribute is
a) Quickness of relief
b) Efficacy
c) Ease of absorption
d) Sensation
e) Color
f) Smell
2. Summary of fenak
a. Top box
Attribute Percentage
Color 51%
Smell 37%
Ease of absorption 39%
Efficacy 21%
Quickness of relief 17%
Sensation 19%
Table 4.17- summary of the top scores obtained for fenak gel
Hence we can say, that for the fenak gel, respondents believe that color was the best,
followed by ease of absorption, smell, efficacy, sensation and then quickness of relief
It is important to note that the “quickness of relief” was the most important factor
w.r.t an ideal pain reliever, a condition which the Fenak gel does not fulfils
b. Bottom box
52

Table 4.18- summary of the bottom scores w.r.t. Fenak gel
This table of bottom box shows that “sensation” is the least liked attribute, followed
by quickness of relief which is comparatively less liked, then efficacy, color, ease of
absorption and smell.
c. Mean scores
Attribute Mean
Color 3.3
Smell 3.2
Ease of absorption 3.25
53
Attribute Percentage
Color 2%
Smell 0%
Ease of absorption 1%
Efficacy 24%
Quickness of relief 27%
Sensation 28%

Efficacy 2.48
Quickness of relief 2.31
Sensation 2.39
Table 4.19- mean scores of attributes w.r.t the Fenak gel
According to this table, we can rate the attributes of Fenak gel on a scale of
likeability, with the first being the most likeable and the last being the least likeable.
These traits are:-
a. Color
b. Ease of absorption
c. Smell
d. Efficacy
e. Sensation
f. Quickness of relief
3. Brand used*attributes of fenak cross tabulation
a. Color
Brand I do not like it
Its just about okay
I like it a little
I like it a lot Total
Volini 2 14 28 43 87
Moov 0 3 2 8 13
Total 2 17 30 51 100
Table 4.20- crosstab of the brand used and their opinion on the color of fenak
54
Majority of the Volini and Moov users liked the color of the Fenak gel a lot.
Statistically, 40.1% of volini users loved the color of fenak in comparison to 61.5% of
Moov users who feel the same.
b. Smell
Brand I do not like it
Its just about okay
I like it a little
I like it a lot Total
Volini 0 14 44 29 87
Moov 0 1 4 8 13
Total 0 15 48 37 100
Table 4.21- crosstab of the brand used and their opinion on the smell of Fenak gel
Statistically, 50.5% volini users like the smell of fenak and 61.5% moov users like the
smell a lot
c. Ease of absorption
Brand I do not like it
Its just about okay
I like it a little
I like it a lot Total
Volini 1 9 46 31 87
Moov 0 3 2 8 13
Total 1 12 48 39 100
Table 4.22- crosstab of the brand used and their opinion on the Ease of Absorption of
Fenak Gel
Statistically, 52.1% volini users find fenak as very easy to absorb as compared to
61.5% of moov users
d. Efficacy
55

Brand I do not like it
Its just about okay
I like it a little
I like it a lot Total
Volini 22 19 29 17 87
Moov 2 6 1 4 13
Total 21 25 30 21 100
Table 4.23- crosstab of brand used and their opinion on the Efficacy of Fenak gel
Statistically, 33.33% volini users like the efficacy of fenak and 46% moov users find
it to be just okay.
e. Quickness of relief
Brand I do not like it
Its just about okay
I like it a little
I like it a lot Total
Volini 23 18 32 14 87
Moov 4 4 2 3 13
Total 27 22 34 17 100
Table 4.24- crosstab of the brand used and their opinion on the quickness of relief of
fenak
Statistically, 36.7% volini users like the ability of fenak gel to give quickness of relief
as compared to 30.7% of moov users
f. Sensation
Brand I do not like it
Its just about okay
I like it a little
I like it a lot Total
Volini 25 21 27 14 87
Moov 3 3 2 5 13
Total 28 24 29 19 100
Table 4.25-crosstab of the brand used and their opinion on the sensation of fenak
Statistically, 31% volini users like the sensation of fenak, whereas, 38.4% moov users
liked the sensation of fenak gel a lot
56

4. The following crosstab shows that how much percentage of Volini and Moov
users would or would not like to purchase the Fenak gel.
BRAND YES NO TOTAL
VOLINI 53 34 87
MOOV 5 8 13
TOTAL 58 42 100
Table 4.26- crosstab of brand used and if the respondents would like to purchase
Fenak or not
This shows that Volini users do like the new Fenak gel but majority of Moov users
would like to stick to their own brands.
5. Reasons the respondents would/ would not like to purchase fenak
Respondents Would purchase Percentage (n=100)
Because of no smell 46%
Because of good efficacy 35%
Because of good absorption/ sensation 18%
Table 4.27- reasons to purchase Fenak
Respondents Would not purchase Percentage (n=100)
Because of no smell 8%
Because efficacy is not good 41%
Because of no absorption/ sensation 11%
Table 4.28- reasons for not to purchase Fenak
57

We can conclude by saying that the major reason for buying fenak, if launched, would
be the no smell attribute. On the other hand, the major reason for not buying Fenak is
that it has a poor efficacy.
CHAPTER-5: CONCLUSIONS AND RECCOMENDATIONS
5.1 Conclusion
Hence, in a nutshell, Fenak got mixed responses but majority of the people(58%) like
it. The major reason for liking it was
a) The efficacy
b) The perfumed smell
Statistically, 60.9% of volini users would like to buy Fenak gel and only 38.4% of
moov users would like to buy the fenak gel.
Those who did not like fenak,(42%), the major arguments put across were:-
a) Less (no) efficacy/ quickness of relief.
b) No sensation ( psychological)
If we see the statistics, we can say that out of the volini users, 39.1% respondents say
they do not want to purchase the Fenak gel and out of the Moov users, 61.6%
respondents say they do not want to purchase Fenak gel.
5.2 Recommendations
58

a) Fenak may be launched but before that the efficacy of the gel needs to be
checked again as 42 against 58 is not a less number.
b) The smell attribute is a very well accepted attribute among the target group
hence the idea must be taken forward
References
Journals
Gillian A. Bendelow1, Simon J. Williams (2010) Pain-related emotions
modulate experimental pain perception and autonomic responses,
Inderscience Publishers
A. Vania Apkarian, M. Catherine Bushnell, Rolf-Detlef Treede, Jon-Kar
Zubieta, ( 2008) Human brain mechanisms of pain perception and regulation
in health and disease Department of Physiology, Northwestern University
Medical School, 303 E. Chicago Avenue, Ward 5-003, Chicago, IL 60611,
USA
Moskowitz et al., (1976); Sulmont et al., (2002) Department of Anesthesia,
McGill University, Montreal, Canada Institute of Physiology and
Pathophysiology, Johannes Gutenberg University, Mainz, Germany
Department of Psychiatry and Radiology, University of Michigan, Ann Arbor,
MI, USA, “The Basis Of Odor Effects On Pain: A Review And Investigation
Of Conditioned Odor Effects”, Changing Odor Hedonic Perception Through
Emotional Associations in Humans
John Prescott, Phd School Of Pscyhology, James Cook University Cairns,
Australia, September, (2006) Cognitive modulation of pain: How do attention
and emotion influence pain processing?
59

Chantal Villemure, M. Catherine Bushnell*, Anesthesia Research Unit and
Faculty of Dentistry, McGill University, Montreal, Quebec, Canada
Internet
1) http://www.sciencedirect.com/science/article/pii/0304395986901193
2) http://www.senseofsmell.org/research/J.Prescott-White-Paper-Analgesic-
Effects-Frag.pdf
3) http://www.apkarianlab.northwestern.edu/publications/Papers/
200508_Apkarian.pdf
4) www.wikipedia.org
Append ix
Research Ques t ions
QUESTIONNAIRE FOR
MARKETING RESEARCH
Please answer the following questions by ticking the relevant number or writing down the answer in the space provided.
SECTION A
1. Name _____________________________________
2. Age of the respondent?a. Below 25 yearsb. 25-35 yearsc. 35-45 yearsd. Above 45 years
3. Gendera. Maleb. Female
60
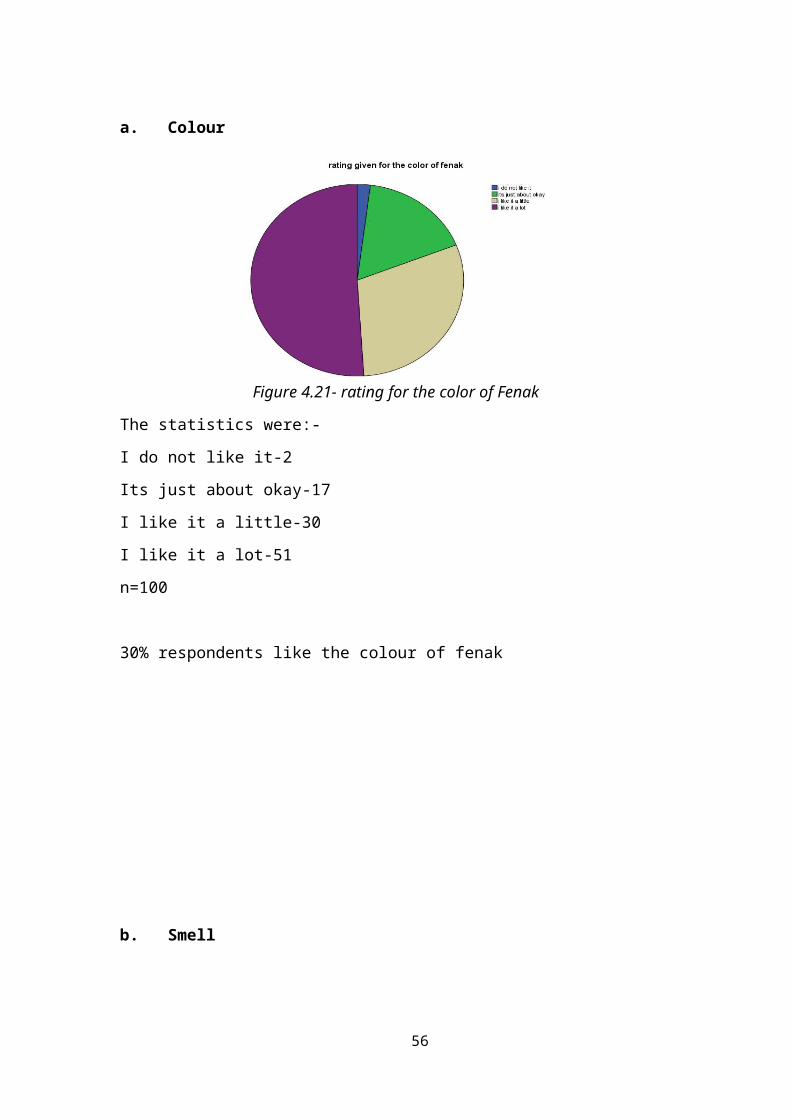
4. ASK ALL
Could you please tell me the occupation of the Chief Wage Earner of your household? By Chief Wage Earner I mean the person who contributes maximum to the income of your household
PROBE (IF RETIRED THEN ASK FOR PREVIOUS OCCUPATION) CLARIFY AND WRITE VERBATIM FIRST THEN CODE IN GRID
OCCUPATION OF CWE : _________________________________[SA
Code
(330)
Route
Unskilled worker ..................................................................................................... 01
Skilled worker .......................................................................................................... 02
Petty trader ............................................................................................................... 03
Shop owner .............................................................................................................. 04
Businessman/Industrialist with - No employees .................................................... 05
Businessman/Industrialist with - 1-9 employees .................................................... 06
Businessman/Industrialist with - 10+ employees ................................................... 07
Self-Employed Professional .................................................................................... 08
Clerical / Salesman .................................................................................................. 09
Supervisory Level .................................................................................................... 10
Officer/Executive- Junior ....................................................................................... 11
Officer/Executive- Middle / Senior ........................................................................ 12
5. ASK ALL
Could you please tell me the level of education of the Chief Wage Earner of your household? By Chief Wage Earner I mean the person who contributes
Code
Route
61

maximum to the income of your household
PROBE CLARIFY AND WRITE VERBATIM FIRST AND THEN CODE IN GRID.
EDUCATION OF CWE :__________________________________ [SA]
(332)
Illiterate ................................................................................................1
Literate but no formal schooling ..................................................................................2
School upto 4 years ..............................................................................3
School upto 5 to 9 years ......................................................................4
SSC / HSC ...........................................................................................5
Some college but not Graduate (Incl. Diploma) ..................................6
Graduate / Post graduate - General (e.g. B.A., B.Sc., B.Com., M.A., M.Com.)...............................................................................................................................7
Graduate / Post graduate - Professional (e.g. B.E., B.Tech., M.Tech., C.A., M.B.B.S., L.L.B., MBA) ....................................................................................................8
6.
EDU1 2 3 4 5 6 7 8
OCCUPATION Illiterate
Literate but no formal schooling
School upto 4 years
School 5 to 9 years
SSC / HSC
Some College but not graduate
Graduate / Post Graduate - General
Graduate / Post Graduate –Professional
Unskilled Worker 01 E2 E2 E2 E1 D D D D
Skilled Worker 02 E2 E1 E1 D C C B2 B2
Petty Trader 03 E2 D D D C C B2 B2
Shop Owner 04 D D D C B2 B1 A2 A2
Businessmen / Industrialist – Number Of
None (05) D C C B2 B1 A2 A2 A1
1-9 (06) C B2 B2 B2 B1 A2 A1 A1
62

Employees10 + (07) B1 B1 B1 A2 A2 A1 A1 A1
Self Employed
Professional08 D D D D B2 B1 A2 A1
Clerical/
Salesman09 D D D D C B2 B1 B1
Supervisory Level 10 D D D C C B2 B1 A2
Officers/
Executives –
Junior
11 C C C C B2 B1 A2 A2
Officers/
Executives –
Middle / Senior
12 B1 B1 B1 B1 B1 A2 A1 A1
7. Which type of pain do you suffer from?a. Joint painb. Back/waist painc. Neck/shoulder paind. Sprains and strainse. Any other ___________________
If headache, stomach pain, etc., then discard.
8. What is the frequency of your pain?a. At least 3-4 times in a week/ Dailyb. Once in a weekc. Once in 15 daysd. Once in a monthe. Once in 3 months
If the answer to 8th question is e. then, terminate the questionnaire, otherwise, proceed.
9. What do you apply to overcome such pain?
63
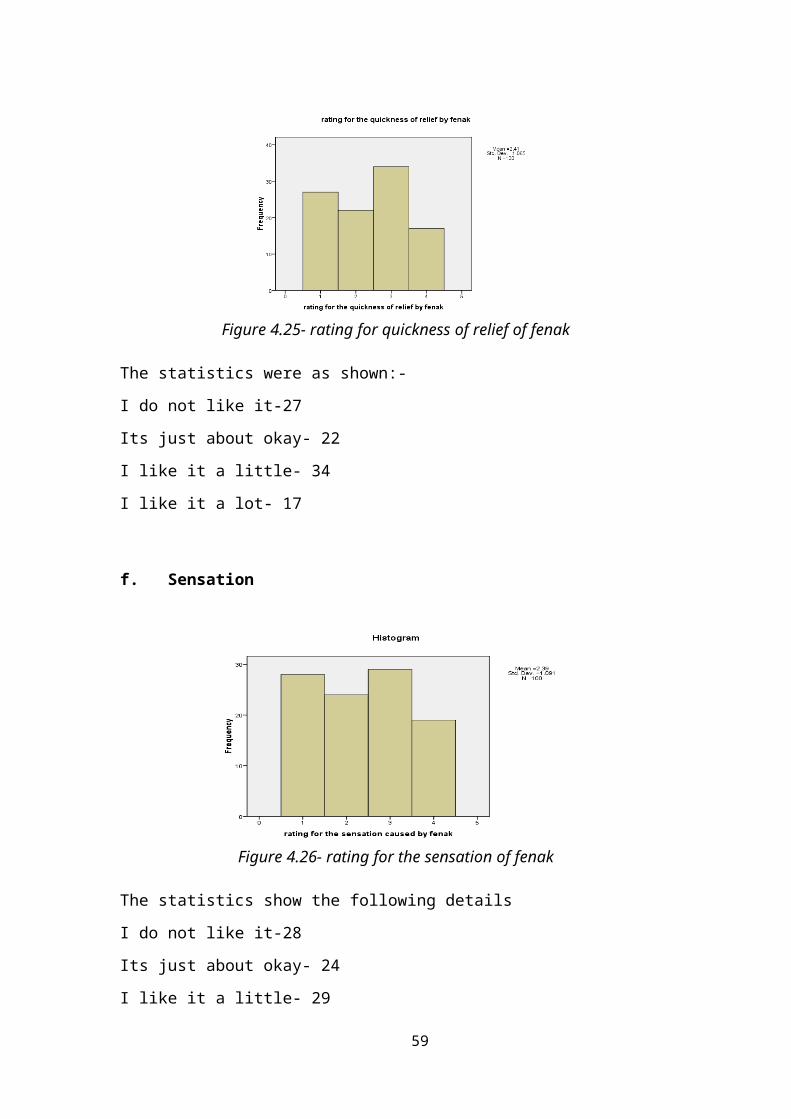
a) Gel/ Creamb) Oilc) Balmd) Spraye) Heating pad/ Hot bottlef) Do nothing g) Any other ____________________
10. Which brand do you use most often?a) Iodex (double power)b) Ranbaxy Volinic) Moov
I. Neck and shoulderII. Regular Cream
III. No massaged) Zandu e) Amrutanjan f) Any other ( please mention)
If the answer is b) or c) then proceed.
SECTION B
11. On a scale of 1-6 please rank the following attributes of an ideal pain relieving gel/cream, 1 being the least favorable and 6 being the most favorable attribute
a) Color
b) Smell
c) Easy to absorb
d) Pain relieving ability/ Efficacy
e) Quickness of relief
f) Sensation
12. Why important (4-6) or not important (1-3) is smell in case of your ideal pain reliever cream?
64

13. Would a non smelling product be ok?
14. You said that you are currently using ___________________ , On a 4 point scale, please rate the following attributes, where,1=I do not like it2=It’s just about okay3=I like it a little4=I like it a lot
Color
a. Smell
b. Easy to absorb
c. Pain relieving ability/ Efficacy
d. Quickness of relief
e. Sensation
15. On a scale of 1-4, please rank your likeability towards the overall brand _______________, where, 1=I do not like it2=It’s just about okay3=I like it a little4=I like it a lot
Answer ____
16. What do you think about the strength of the smell?a. Much too strongb. A little too strongc. Just rightd. A little too milde. Much too mild.
65
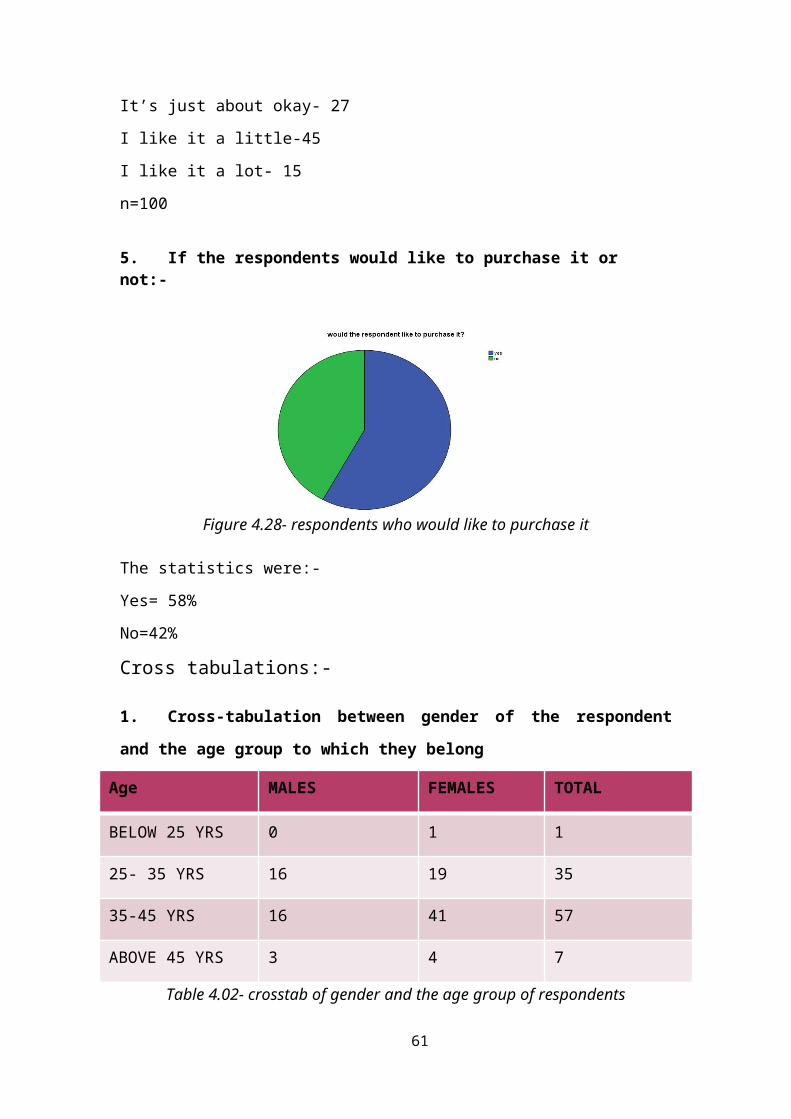
SECTION C
17. On a 4 point scale, please rate the following attributes w.r.t the SAMPLE we have provided to you, where,
1=I do not like it2=It’s just about okay3=I like it a little4=I like it a lot
Color
a. Smell
b. Easy to absorb
c. Pain relieving ability/ Efficacy
d. Quickness of relief
e. Sensation
18. Can you please tell me, why have you given a rank of _____ to the smell?
19. On a scale of 1-4, please rank your likeability towards the overall brand _______________, where, 1=I do not like it2=It’s just about okay3=I like it a little4=I like it a lot
Answer ____
20. Would you like to purchase it if we launched this in the market?a. Yesb. No
66

21. Why yes/no? (key likes/dislikes)
Thank you very much for your co-operation in completing this questionnaire. Your response is valuable to us.
67