isikawaprefectural university hiroaki arakawa ... · arctic lamprey. my study organism is arctic...
TRANSCRIPT

Instream thermal dynamics within larval lamprey habitat from Japan andEastern Washington, USA, and implications for future climate change
Isikawa Prefectural University Hiroaki Arakawa
,,· r. .. -~ ~ - .. 1
•i;• ~~· .. r.t.'f'~i:"-! ·-·~· . ' ,,,. : ... t• . - •, .. ' .. ...., .,· ~ .. ,,, , .,. ..... .. r
·. -,., .. ,. \.. '. ;· .~ . ~x· J. . ... ~ •· .... . .. .· , . .., • 'i .. . - • ., ,,
· \ . ' .. . -,.., .
~
• •
. ... _ .
• • .
•
• •
•
•
" "'- . • .. • • • • • ......
•
't. • • .. • • • .
• •
• . . • ..
f
. . •
' • . . . ' . •
• ;. . • • . . ... '" ' .
• •• • • . t . ... • . ' .. • -1 .. • .
' • • • ' • • • ,'
• • • •

Arctic Lamprey

Research Outline for Arctic Lamprey
1. Upper thermal tolerance
2. River temperatureacross Japan in August
3. Micro-habitat for larval Arctic Lamprey & 2 other lampreys in the summer
What’s ℃?
In southern limit of distribution
r-------------------------~ I I I I I I I I I I I I
•--------------------------~
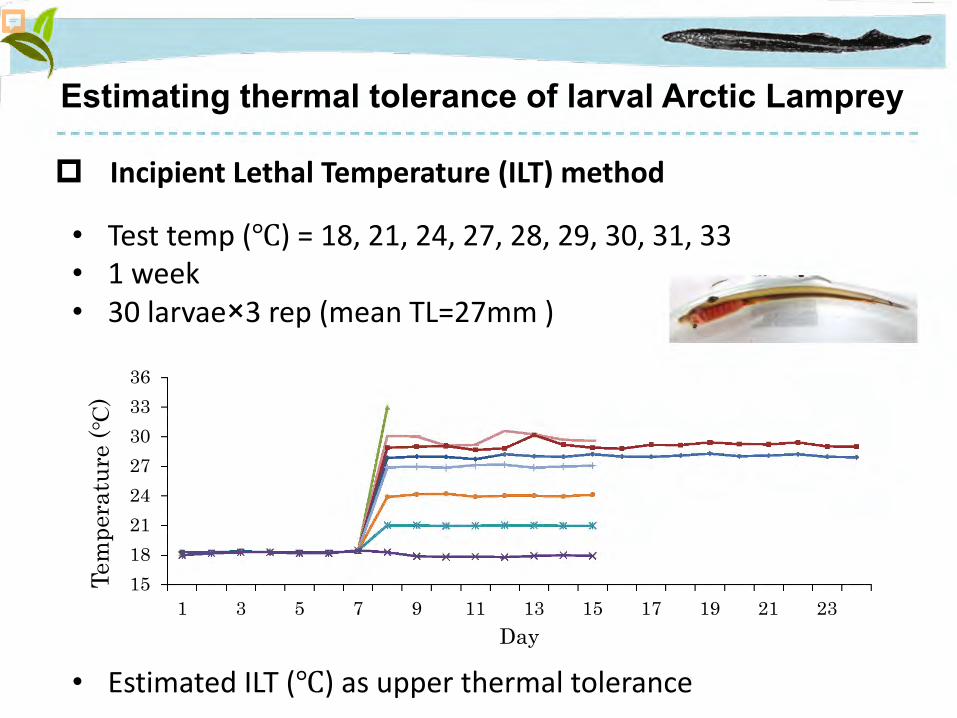
Estimating thermal tolerance of larval Arctic Lamprey
Incipient Lethal Temperature (ILT) method
1518212427303336
1 3 5 7 9 11 13 15 17 19 21 23
Tem
pera
ture
(℃)
Day
• Test temp (℃) = 18, 21, 24, 27, 28, 29, 30, 31, 33• 1 week• 30 larvae×3 rep (mean TL=27mm )
• Estimated ILT (℃) as upper thermal tolerance

0
100
200
300
400
500
600
26 28 30 32 34 36
LD50
(hou
r)Temperature (℃)
0
20
40
60
80
100
18 21 24 27 28 29 30 33
Surv
ival
rat
e (%
)
Temperature (℃)
Result ILT experiment
Upper incipient Lethal Temperature was estimated at 29.3℃
𝐿𝐿𝐿𝐿𝐿𝐿 = 3.8𝐿𝐿 ∗ 1𝐿9𝑒𝑒−0.5787∗𝑡𝑡𝑡𝑡𝑡𝑡𝑡𝑡 (𝑅𝑅2= 𝐿.66)
1 week
Survival rates

1520
2530
35°C
Max
Daily river temperature across Japan
Distribution Arctic Lamprey
Chi.
Mar.Kuz.
Mac.
Oya.
Aka.
Yon.
Tok.
Chi. Mar. Kuz. Mac. Oya. Aka Yon. Tok.
1520
2530
35°C
Average
AugustILT=29.3℃
ILT=29.3℃
(Ministry of Land, Infrastructure and Transport 2010 or 2011)
----,---- ----,----0 -,-- I I - 0
I I ----,---- ----,----
I I I -----'---___,___ ----,----~ I I -,--
I I - I I I I ___,___ I ___,___ I ___,___ I ----,---- I
0 I
; ----'---
- I ----'---
0 I ___,___
I I I I I I
-,-- -----,---
I ___,___ ~ E3 -----'--- ----,---- ----,----0
: I I ___,___ ----'--- I e
e I I ___,___ ----'---

Machino River 54 type1 habitats
Larvae・species ・TL & wet mass・Density
Habitat factors・velocity ・depth ・substrate depth・oxidation reduction potential ・DO・water temp. difference in the daytime
3 cm
Micro-habitat for larva in the summer

Freq
uenc
y
0 1 2 3 4 5 6 7 8 9 10 12 14 16 18 20
02
46
8
Freq
uenc
y
0 1 2 3 4 5 6 7 8 9 10 12 14 16 18 20
02
46
8
total length (cm)
Freq
uenc
0 1 2 3 4 5 6 7 8 9 10 12 14 16 18 20
02
46
8
YOY 1 year 2 years 3 years
Arctic Lamprey (n=47)
Far Eastern Brook Lamprey S form. (n=28)
Far Eastern Brook Lamprey N form. (n=54)
Result 3 species of TL histogram & Spatial distribution

Result Thermal range in the habitats
Arctic LampreyS form N form
1517
1921
2325
2729
3133
Tem
pera
ture
(°C
)
Occurrence (%)
I
I~

Far Eastern Brook Lamprey N form.
• Cooler sediment than river water(t-v.=-5.40, p<0.001)
• Faster current (t-v.=2.49, p<0.05)
• Deeper depth (t-v.=2.44, p<0.05)
Habitat factor selected by GLM
***
**
Natural riverbank in the uppermost stream
Occurrence (%)
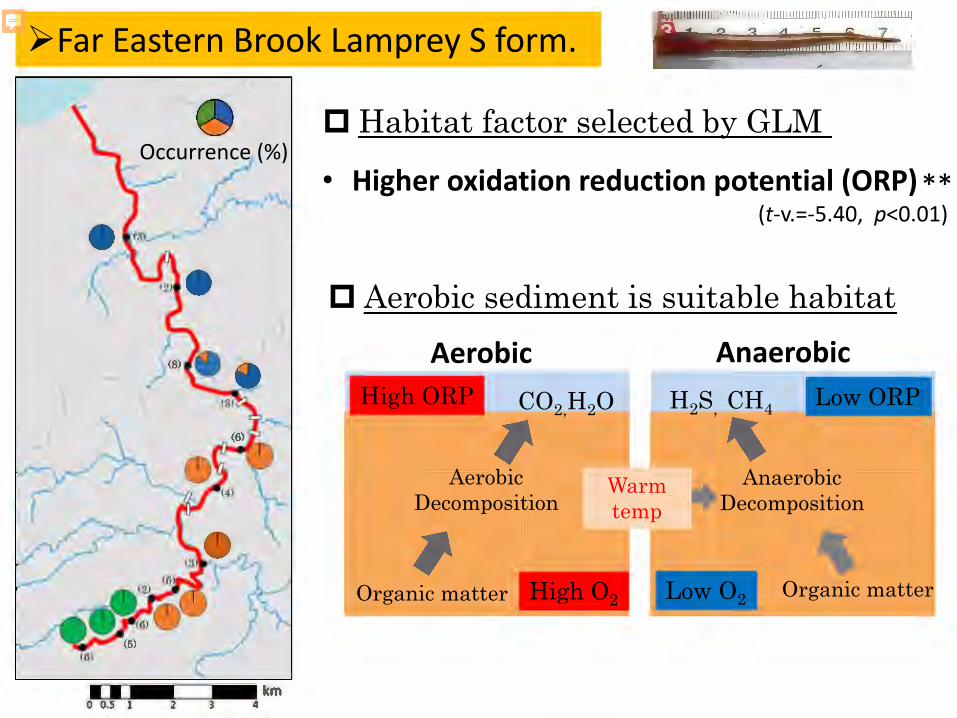
Far Eastern Brook Lamprey S form.
Habitat factor selected by GLM
• Higher oxidation reduction potential (ORP)(t-v.=-5.40, p<0.01)
**
Aerobic Anaerobic
Aerobic sediment is suitable habitat
Anaerobic Decomposition
Organic matterLow O2High O2Organic matter
Aerobic Decomposition
High ORP Low ORPCO2,H2O H2S, CH4
Warm temp
Occurrence (%)

Arctic Lamprey
• No significant factor was found
Habitat factor selected by GLM
00.5
11.5
22.5
33.5
44.5
1 - 7 8 - 14 15<
Dens
ity o
f lar
va
Substrate depth (cm)
More abundance in deeper sediment
Occurrence (%)

Difference between river temp. & substrate temp.
-20
-16
-12
-8
-4
0
-12 -10 -8 -6 -4 -2 0 2
Subs
trat
e de
pth(
cm)
Thermal difference (℃)
• • • •
• •
•
• •
•
• • •
•
... ..
•

Sediment is a refuge for larval lamprey
15 17 19 21 23 25 27 29 31 33
Temperature ( ℃)
River
Substrate(3 cm)
Substrate(bottom)
ILT=29.3℃
-
..
- 0 f---- -j
- f----------- --j
I I I I I I I I I I

Conclusion
1. Upper thermal tolerance
2. River temperatureacross Japan in August
3. Micro-habitat for larval Arctic Lamprey & 2 other lampreys in the summer
29.3 ℃No distribution
Cooler sediment(spring water, refuge)
Max Average
ORP
Southern limitation of distribution
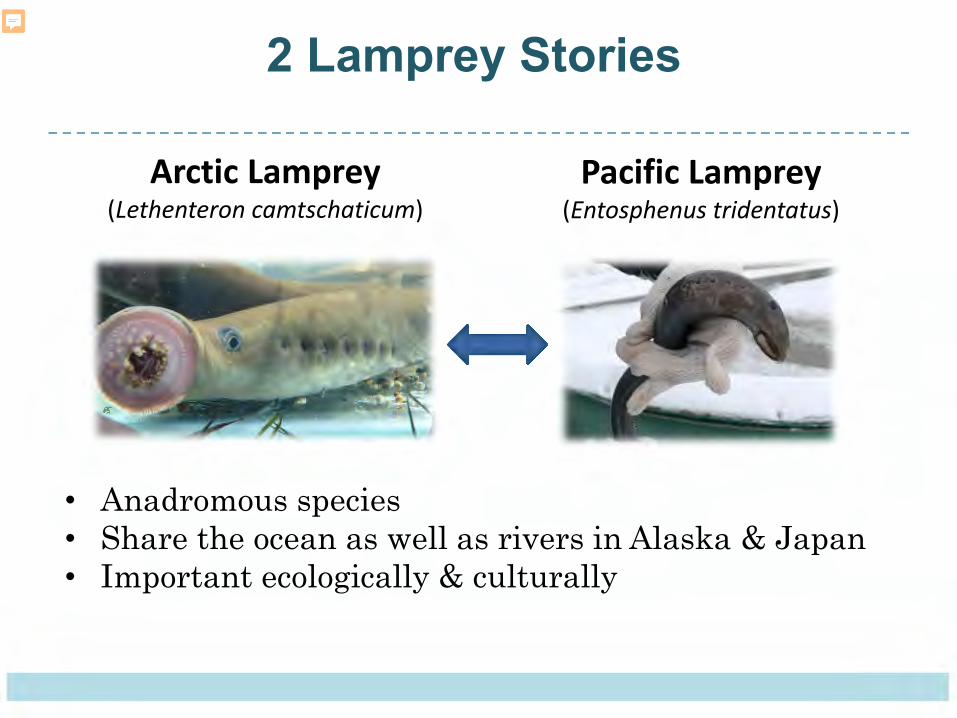
2 Lamprey Stories
Arctic Lamprey(Lethenteron camtschaticum)
• Anadromous species• Share the ocean as well as rivers in Alaska & Japan• Important ecologically & culturally
Pacific Lamprey(Entosphenus tridentatus)

River Thermal Dynamics – Annual Cycle
25
20
15
10
5
0
21
20
19
18
17
16
15
-
Ahtanum 1Creek (river km 1.2)
Ahtanum Creek (river km 1.2) Daily Fluctuation
gggggggggggggggggggggggg O..-N('<')VIOCOl'--COO>O..-N('<')VIOWl'--COO>O..-N('<')
..- ..- ..- ..- ..- ..- ..- ..- ..- ..- N N N N
6/22 6/29 7/6 7/13 7/20 7/27 8/3 8/10 8/17 8/24 8/31 9/7 9/114 9/211 9/28

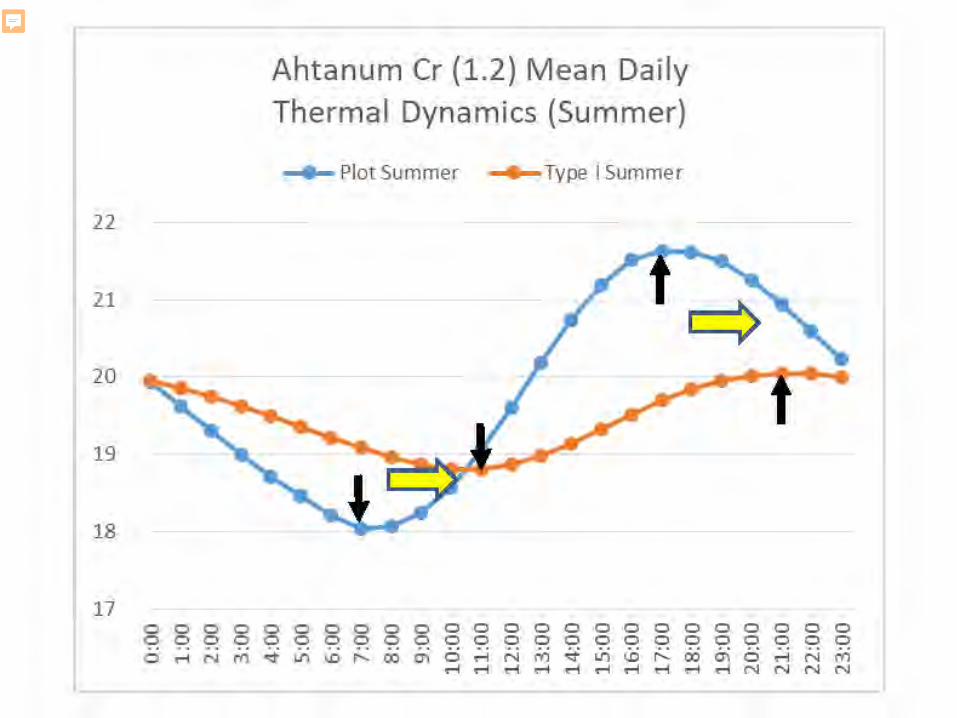
River Thermal Dynamics – Daily Cycle
Daily Max
Daily Min
Mean
River Thermal D1ynamics - Daily Cycle
21
20
19
18
17
16
15 0 0 0 0 0 0 0 0 0
.. Ci") T""" N
Ahtanum Creek (river km 1.2) Average Summer Daily Fluctuation
0 0 0 0 0 0 0 0 0 0 0 0 0 0 0 0 0 0 0 0 0 0 0 0 0 0 0 0 0 0 ~ LO (0 ~ cci m . .
0 T""" N ("') -.::t" LO (0 t-- co T""" T""" T""" T""" T""" T""" T""" T""" T"""
0 0 0 0 0 0 0 0 0 0 0) 0 T""" N ("') T""" N N N N

River/Stream Thermal DynamicsChronic Upper Lethal Temperature• Long term exposure• Gradual acclimation
Pacific Lamprey = 27.7-28.5˚C(Uh et al. 2017 – OR AFS Poster)
Pacific Lamprey = 27-30˚C(Uh et al. 2017 – OR AFS Poster)
Acute Upper Lethal Temperature• Short term exposure• High rate of change• Thermal Shock (18 F / 10 C)
iver/Stream T ermal Dynam·cs Ahtanum Creek (river km 1.2)
25
20
15
10
5
0 6/22 6/29 7/6 7/13 7/20 7/27 8/3 8/10 8/17 8/24 8/31 9/7 9/14 9/21 9/28
Ahtanum Creek (river km 1.2) Daily Fluctuation ••••••••••••••••••••
21
20
19
18
17
16
15

Temperature Preference in Nature??U.S. Forest Service, Rocky Mountain Research Station (Daniel Isaak)
12 14 17 19 22 24 26 29 Max Temperature
Max Temp ≈ ↑20%
17 28
2618
Temperature Preference ·n Nature??
> w I-C. E (C -ii
"+-0 .c 0 h C. a, u C a, !I... s.,_
:::J u u 0
1.00
OJ30
0.60
0.40
0.20
Thermal niche of Pacific lamprey in the model - . ... • .. -::,
.... • ,:s..B4:--:_: ... -.- :-: ' .. ... - .r: .. :-... ..- ·-- :;_, . • • -~·•<. .. .:;. -~~-~· .. : -... -~·-~. 3 ...__. ola' • • .. .._ ., ;I. L - ~ . ': ~ • -:li - , .. .., ~"tr;::··~ ... ~ ... .. __
.... ·-- ... - ·:aavta... - - ·:"'-o:.. .... • • • .,., -I , . .. , ~'4,_.. .......... -._,.,. - ■ .,. .. - • • ■ .. _,,,..,.,. •• - . - ... -.J ... ---=-~~.,,~-~Jt--' --:.
J;j_ .•.......... - • -~.:!:- • 1',_ __ ...... -. •
- .. .. -"O:...~!>". -■:J..""' .. , · - .... \ .-.. . ... ~ - - -.:~.. ·~i:;: _ .. .,-._ .. :. • - ---::i,.-=~:::\:• !
rt-:.-.:~ J9~---·1-:· ·- -·-.•• : • - ~~- " . • r • .d" • .- ~ ._...,.., ~ • • - "1 -::.,. .. . :.r~. -- ~ . ., .., . . . • >_ --. .. .,. • • ' ;. .. .._•-: ' .. .•
,tx;.- '1-1- - • • - ;. ':- • -- ... ■...-':""" .... .... .. ... • . , -• - ~•• -,i- r • ~ ·r ~ .. ... .._ .. 1-r . .. 2! ~
,..,.._11111 '- • • - ... • ... • .. ■ - •
1-l\;.'\;::;c:::-~. - •• -~'= .. ·.. ... ..... .. • - •• 9 .... - .... ~ - ~
- .. - ~ 111 -- -. . . - .. -.... ..
_,. - . . .
. .... ..
~.'t - .. .. .

Exploration of Sediment Thermal Dynamics(2014-2018)
Sediment Temp Lower
Sediment Temp Higher-0 u --nJ ·-...., C Cb .. Cb
~ C Cb .. ::Ii ...., nJ .. Cb ~
E Cb I-
Exploration of Sediment Thermal Dynamics (2014-20,18)
4.0
2.0
0.0
-2.0
-4.0
-6.0
-8.0
-10.0
Habitat Survey Date vs. Temp Differential 1(2017)
7/ 14
• •
' . . , ..... -•.:.:.· . . . ········· -... ........ .
• • ············r • ......... . . .. t..... .. .• . • ...... -. I • • •
•
• . .... I ...
y = 0 .051x - 2192.5 R2 = 0.2968
7 /24 8/3 8/13 8/23 9/2 9/12 9/22 10/2 10/12
Date

Type II HabitatProbe
Type I Habitat Probe
SurfaceProbe
SurfaceProbe
*Probe buried inside sediment by 10 cm
Simcoe Creek
Type IType II
DifferenceDifference
Fine & CoarseFine & OM

Interior Columbia Basin(Yakima Subbasin)
Interior Columbia Basin (Yakima S bbasin)
• --7'~
~ ~. . Google Earth

Lower Yakima Subbasin
10 SitesYakima = 4 SitesToppenish = 3 SitesSimcoe = 1 SiteSatus = 1 SiteAhtanum = 1 Site
ower Yakima S

Ahtanum Cr(river km 1.2)
June 21 – Oct 1 2018
·--Google Earth

Changes in Temp Differential over Time
Summer (June-August) FallSed.Temp
Higher
Sed.Temp
Lower
Changes in Temp D1 ifferential over Time
2
-3
Ahtanum Cr. (1.2) Daily Temp Differential
e Daily Max Diff Daily Min Diff
I I I
6/22 6/29 7 /6 7 / 13 7 /20 7 /27 8/3 8/10 8/17 8/24 8/31 9/7 9/14 9/21 9/28
Date

22
21
20
19
18
17 0 0 0 0 0 0 0 0 0 .-I N rt')
Ahtanum Cr {1.2) Mean Daily
Thermal Dynamics {Summer)
• Plot Summer • Type I Summer
0 0 0 0 0 0 0 0 0 0 0 0 0 0 0 0 0 0 0 0 0 0 0 0 0 0 0 0 0 0 '<I' L.I") IJ:> ,-.. co O"l 0 .-I N rt') ;,f L.I") IJ:> ,-.. co
.-I .-I .-I .-I .-I .-I .-I .-I .-I
0 0 0 0 0 0 0 0 0 0 O"l 0 .-I N rt') .-I N N N N
22
21
20
19
18
17 0 0
0 0
0 0
0 0
0 .-I N ('()
Ahtanum Cr {1.2) Mean Daily
Thermal Dynamics {Summer)
• Plot Summer • Type I Summer
0 0 0 0 0 0 0 0 0 0 0 0 0 0 0 0 0 0 0 0 0 0 0 0 0 0 0 0 0 0 ~ L.I") I.O ,-.. co O"l 0 .-I N ('() .,f L.I") I.O ,-.. co
.-I .-I .-I .-I .-I .-I .-I .-I .-I
0 0 0 0 0 0 0 0 0 0 O"l 0 .-I N ('() .-I N N N N

Plot vs. Type I Daily Max
Type II HabitatType I Habitat
Plot vs Type Daly Max
1
0
t SAT SIM -1 12.9 9.1
-2
-3
~4
-5
-6
-7
-8
Daily Max Temp Differential
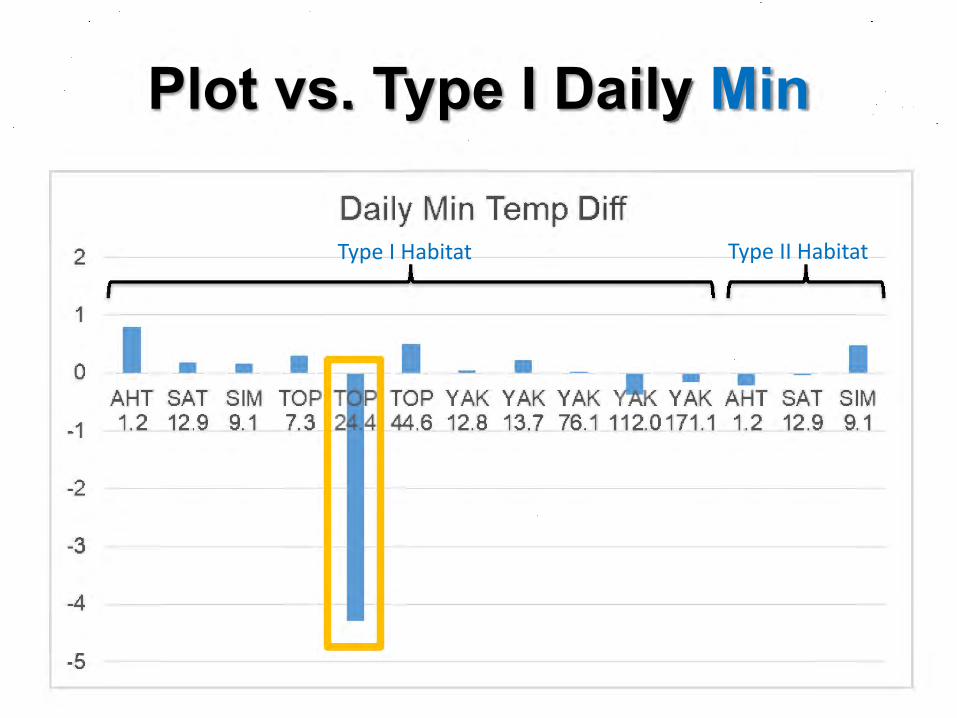
Plot vs. Type I Daily Min
Type II HabitatType I Habitat2
1
P ot vs. Type I Daily
Daily Min Temp Diff
n
I I
0 I - - - ~~- 1 - • - I AHT SAT SIM TOP T p TOP YAK YAK YAK ~ K YAK A~ T SAT SIM
-1 1.2 12.9 9.1 7.3 2 4 44.6 12.8 13.7 76.1112.0171.1 1.2 12.9 9.1
-2
-3
-4
-5
'

Toppenish Cr(river km 24.4)
June 28 – Oct 11 2018
- -'•
Google Earth

Ground Water Seepage?
-0
~ 25 -m 24 ·-~ 23 QJ 21,.,. 22 QJ ~ 21 ·-c 20
loppenish 24.4 Mean Daily
Therma l Dynamics (Summer)
e Plot e Type I
Time of Day

Causes for Temp Differential???
• Sediment Size• Water Depth• Flow Rate• Distance to Thalweg or Bank• Overhead Cover• Aquatic Veg. Cover• Vegetation Type• Habitat Type (e.g. inside meander, channel edge)
Ground Water / Subsurface Flow Regime
Causes for Temp Differential???

Relationship between larval abundance & thermal refugia? (2018 Data)
TOP 24.4 TOP
7.3
YAK 112.0
YAK 76.1
YAK 13.7
YAK 12.8
>26˚C
Relationship b,etween larval abundance & thermal refugia? (2018 Data)
16
114
2
0 ~ - -----~---------'--------'-' ----r---~------J-~,_____, -8 -6 -5 -4 -3 1
Daily Max Temperature Differential (C0
)

The Most Resilient Species on Earth(Survived 4-5 Mass Extinction Events)
Ice AgesClimate / Ocean Changes
Volcanic Eruptions
MeteoritesPiece of Cake!!!
The o Res1I e t ec e on a S rv·ved 4-5 as Ex i ct o ve t )

~100 Years of Human Development
Interaction between “Climate Change” & “Passage Barriers” / “Habitat”
#1
#2
I teractio between "Clima e Change' & "Passage Ba rie s" / "H b·tat"


Critical Areas for Pacific Lamprey
Highest Risk?
~--------------------------- ----------------------------------Ratio of Current Area of Occupancy t · ·c Distribution
'a:P"ll!i- ~ ;.,
0 W1GO 200 300 - c:::::::Jl--==:::i,Kilometers
Legend
:1/, lncomp1ele al 4th HUC
Ratio Ra11king
- Not Ran ed .z .. 01%
- A= 5%
- B =10%
C= 25%
E= 50%
- F = 75%
- H= 100%

Thanks to all of our partners!Seiji Yanai (Ishikawa Prefectural University)
Tyler Beals & Bob Rose & Lamprey Crew (Yakama Nation Fisheries)
Alexander Alexiades (Heritage University)
Any questions?
Hiroaki Arakawa [email protected]
Ralph [email protected]
il.d 6jii ~ rz:~~ - Ishikawa Prefeciural I niversitv
~~Heritage University
B * ~1;flf tfK .W~ Japan Sociery for the Promotion of Science