isle of man in numbers 2015 - isle of man government · the isle of man in numbers 2016 presents a...
TRANSCRIPT

0
The Isle of Man in Numbers 2016
Economic Affairs
Cabinet Office
March 2016
GD 2016/0013
1
Table of Contents Introduction ................................................................................................................. 2
Our Economy ................................................................................................................ 6
National Income ........................................................................................................ 6
Labour Market ........................................................................................................... 8
Inflation ................................................................................................................... 13
Company Activity ...................................................................................................... 16
Passenger Movements and Tourism............................................................................ 19
Housing Market ........................................................................................................ 22
Shipping Registries ................................................................................................... 23
Earnings .................................................................................................................. 24
Income and Expenditure ............................................................................................... 26
Government Revenue and Expenditure ....................................................................... 26
Pensions and Benefits ............................................................................................... 28
Our Society ................................................................................................................. 31
Population ................................................................................................................ 31
Education ................................................................................................................. 39
Health and Medicine ................................................................................................. 41
Keeping People Safe ................................................................................................. 45
International Aid ....................................................................................................... 54
Environment and Infrastructure ..................................................................................... 55
Climate .................................................................................................................... 55
Greenhouse Gas Emissions ........................................................................................ 57
Waste and Recycling ................................................................................................. 58
Agriculture ............................................................................................................... 61
Planning and Construction ......................................................................................... 62
Housing ................................................................................................................... 64
Freight ..................................................................................................................... 67
Energy Production .................................................................................................... 68
Water ...................................................................................................................... 72
Transport ................................................................................................................. 73

2
Introduction
The Isle of Man in Numbers 2016 presents a comprehensive range of economic and social
data relating to the Isle of Man.
The following tables and charts contain the most recent data available and cover areas of
public interest, including finance and commerce, transport and communications, population
and employment.
The information contained in this publication is provided in broadly two ways. In part it is
generated by Economic Affairs itself, through exercises such as the Census, the Passenger
Survey and the Earnings Survey. All other information is provided by a wide range of
contributors within other Departments, Boards and Offices of Government.
Data tables are available on the Isle of Man Government website at:
https://www.gov.im/about-the-government/offices/cabinet-office/economic-affairs-division/
Additional information may be obtained from:
Economic Affairs,
Cabinet Office,
Government Office,
Bucks Road,
Douglas,
Isle of Man,
IM1 3PN
Telephone: 01624 685743
Website: www.gov.im
E-mail: [email protected]
3
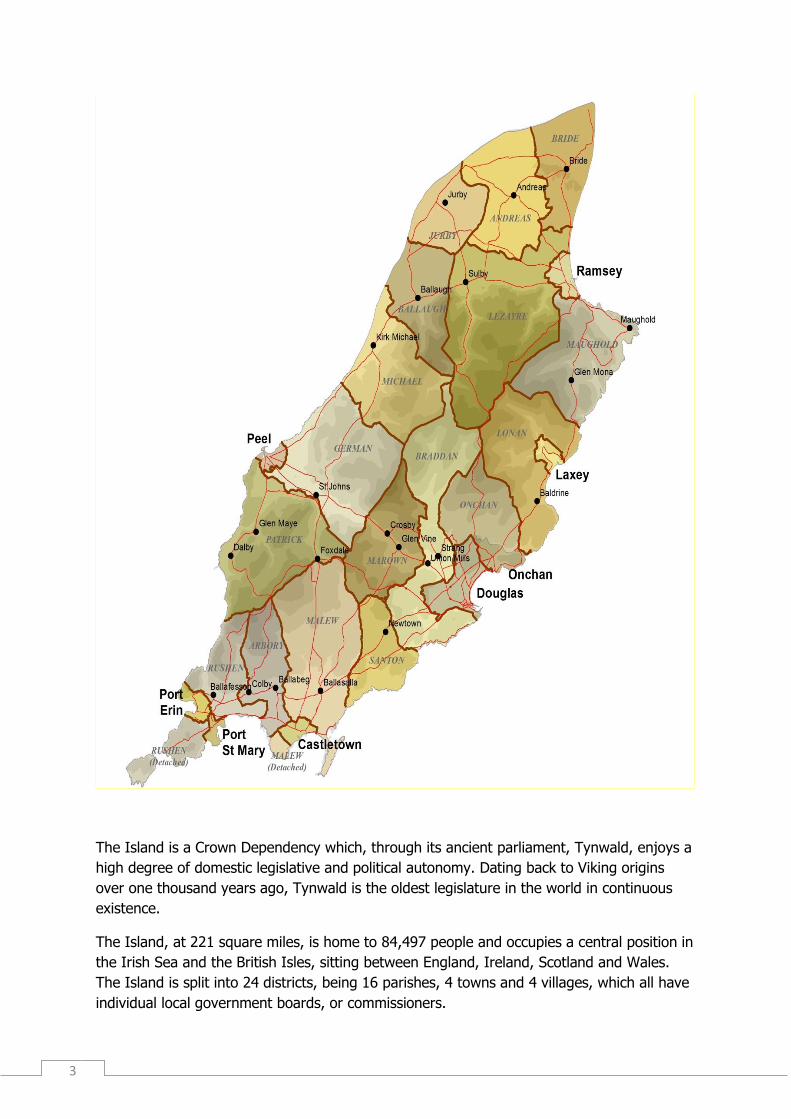
The Island is a Crown Dependency which, through its ancient parliament, Tynwald, enjoys a
high degree of domestic legislative and political autonomy. Dating back to Viking origins
over one thousand years ago, Tynwald is the oldest legislature in the world in continuous
existence.
The Island, at 221 square miles, is home to 84,497 people and occupies a central position in
the Irish Sea and the British Isles, sitting between England, Ireland, Scotland and Wales.
The Island is split into 24 districts, being 16 parishes, 4 towns and 4 villages, which all have
individual local government boards, or commissioners.
4
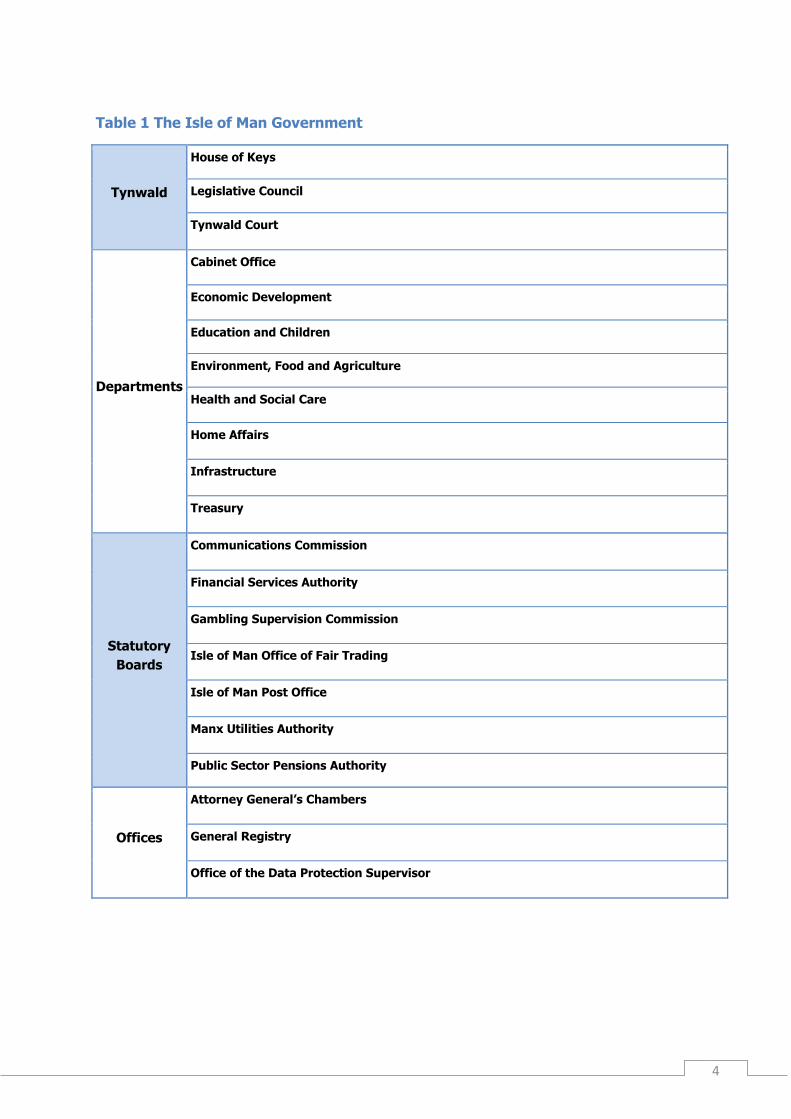
Table 1 The Isle of Man Government
Tynwald
House of Keys
Legislative Council
Tynwald Court
Departments
Cabinet Office
Economic Development
Education and Children
Environment, Food and Agriculture
Health and Social Care
Home Affairs
Infrastructure
Treasury
Statutory
Boards
Communications Commission
Financial Services Authority
Gambling Supervision Commission
Isle of Man Office of Fair Trading
Isle of Man Post Office
Manx Utilities Authority
Public Sector Pensions Authority
Offices
Attorney General’s Chambers
General Registry
Office of the Data Protection Supervisor
5
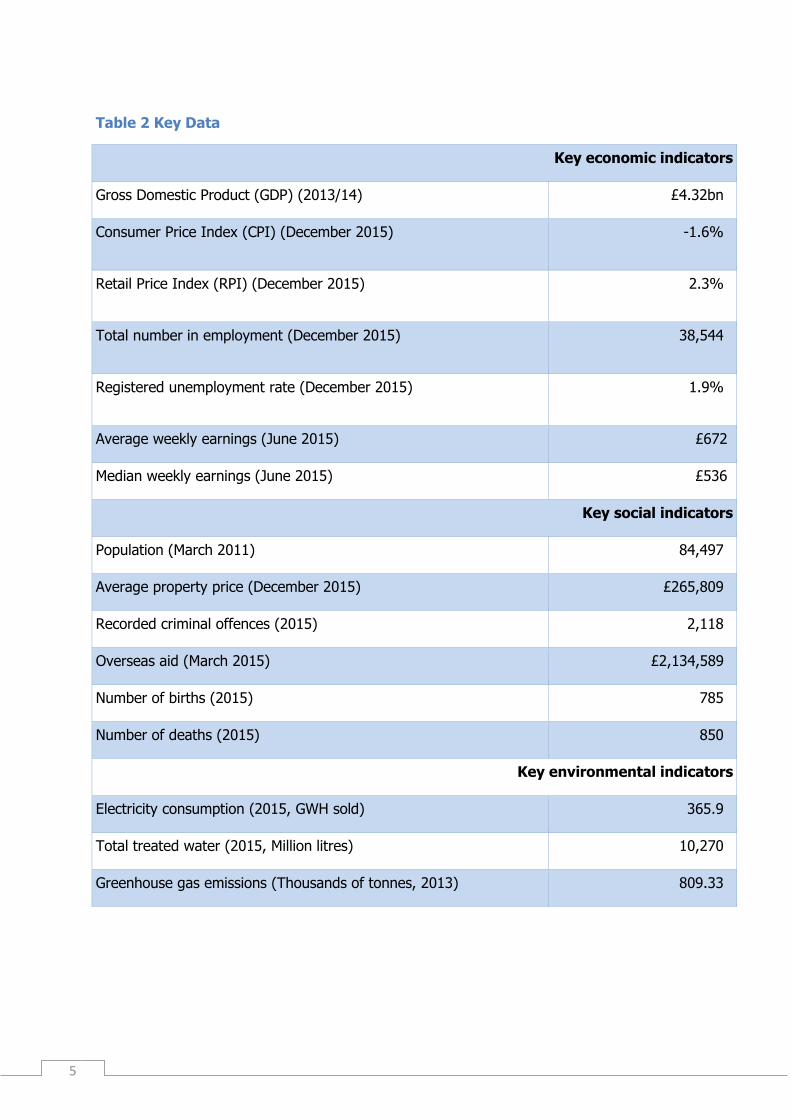
Table 2 Key Data
Key economic indicators
Gross Domestic Product (GDP) (2013/14) £4.32bn
Consumer Price Index (CPI) (December 2015) -1.6%
Retail Price Index (RPI) (December 2015) 2.3%
Total number in employment (December 2015) 38,544
Registered unemployment rate (December 2015) 1.9%
Average weekly earnings (June 2015) £672
Median weekly earnings (June 2015) £536
Key social indicators
Population (March 2011) 84,497
Average property price (December 2015) £265,809
Recorded criminal offences (2015) 2,118
Overseas aid (March 2015) £2,134,589
Number of births (2015) 785
Number of deaths (2015) 850
Key environmental indicators
Electricity consumption (2015, GWH sold) 365.9
Total treated water (2015, Million litres) 10,270
Greenhouse gas emissions (Thousands of tonnes, 2013) 809.33
6
Our Economy
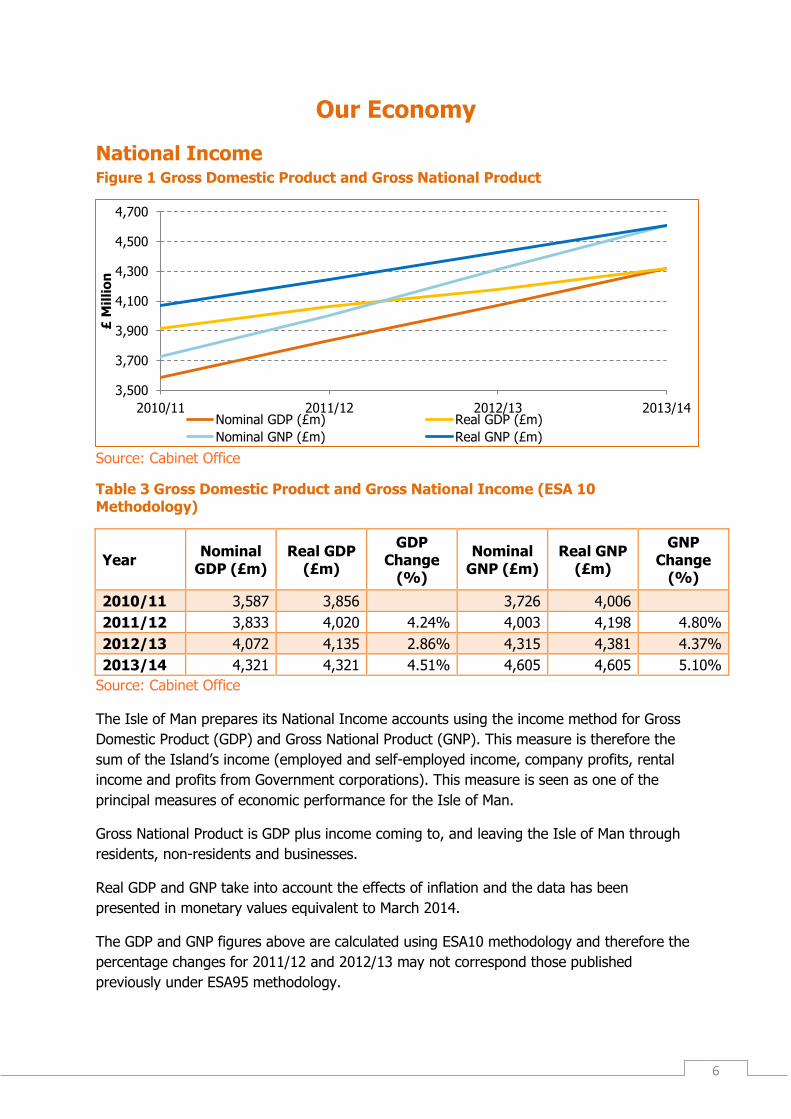
National Income Figure 1 Gross Domestic Product and Gross National Product
Source: Cabinet Office
Table 3 Gross Domestic Product and Gross National Income (ESA 10 Methodology)
Year Nominal
GDP (£m) Real GDP
(£m)
GDP Change
(%)
Nominal GNP (£m)
Real GNP (£m)
GNP Change
(%)
2010/11 3,587 3,856 3,726 4,006
2011/12 3,833 4,020 4.24% 4,003 4,198 4.80%
2012/13 4,072 4,135 2.86% 4,315 4,381 4.37%
2013/14 4,321 4,321 4.51% 4,605 4,605 5.10%
Source: Cabinet Office
The Isle of Man prepares its National Income accounts using the income method for Gross
Domestic Product (GDP) and Gross National Product (GNP). This measure is therefore the
sum of the Island’s income (employed and self-employed income, company profits, rental
income and profits from Government corporations). This measure is seen as one of the
principal measures of economic performance for the Isle of Man.
Gross National Product is GDP plus income coming to, and leaving the Isle of Man through
residents, non-residents and businesses.
Real GDP and GNP take into account the effects of inflation and the data has been
presented in monetary values equivalent to March 2014.
The GDP and GNP figures above are calculated using ESA10 methodology and therefore the
percentage changes for 2011/12 and 2012/13 may not correspond those published
previously under ESA95 methodology.
3,500
3,700
3,900
4,100
4,300
4,500
4,700
2010/11 2011/12 2012/13 2013/14
£ M
illi
on
Nominal GDP (£m) Real GDP (£m)
Nominal GNP (£m) Real GNP (£m)
7
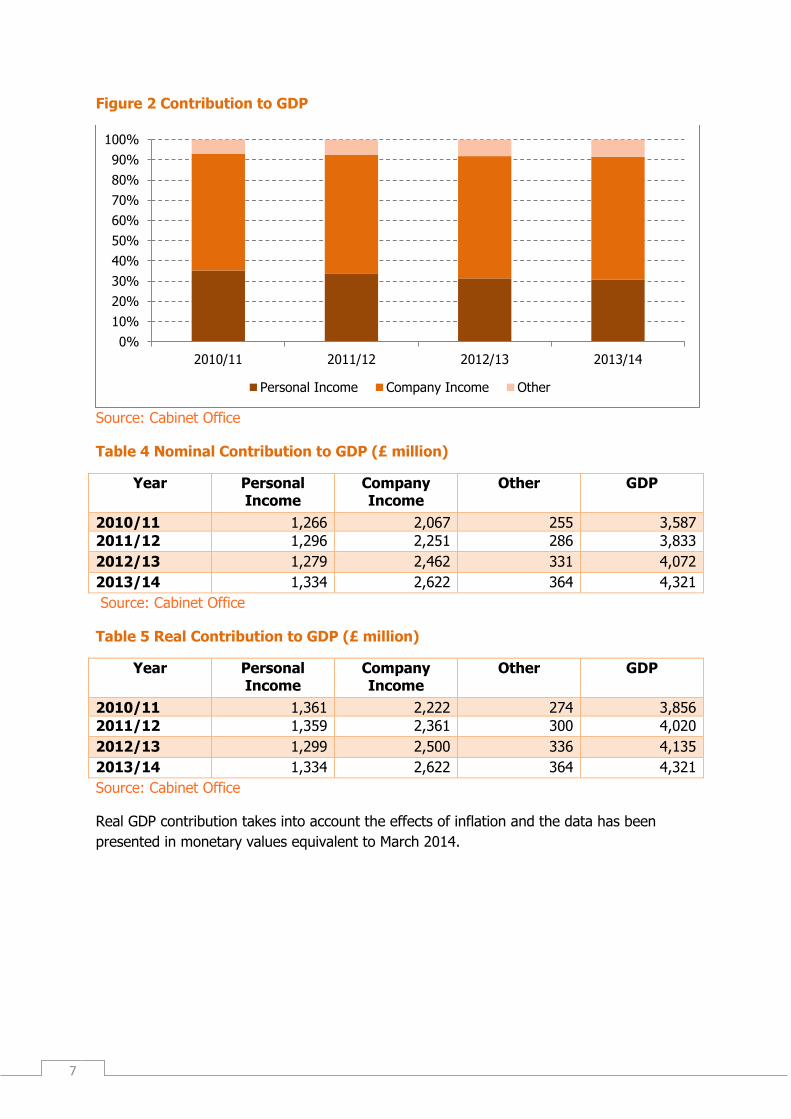
Figure 2 Contribution to GDP
Source: Cabinet Office
Table 4 Nominal Contribution to GDP (£ million)
Year Personal Income
Company Income
Other GDP
2010/11 1,266 2,067 255 3,587
2011/12 1,296 2,251 286 3,833
2012/13 1,279 2,462 331 4,072
2013/14 1,334 2,622 364 4,321
Source: Cabinet Office
Table 5 Real Contribution to GDP (£ million)
Year Personal Income
Company Income
Other GDP
2010/11 1,361 2,222 274 3,856
2011/12 1,359 2,361 300 4,020
2012/13 1,299 2,500 336 4,135
2013/14 1,334 2,622 364 4,321
Source: Cabinet Office
Real GDP contribution takes into account the effects of inflation and the data has been
presented in monetary values equivalent to March 2014.
0%
10%
20%
30%
40%
50%
60%
70%
80%
90%
100%
2010/11 2011/12 2012/13 2013/14
Personal Income Company Income Other
8
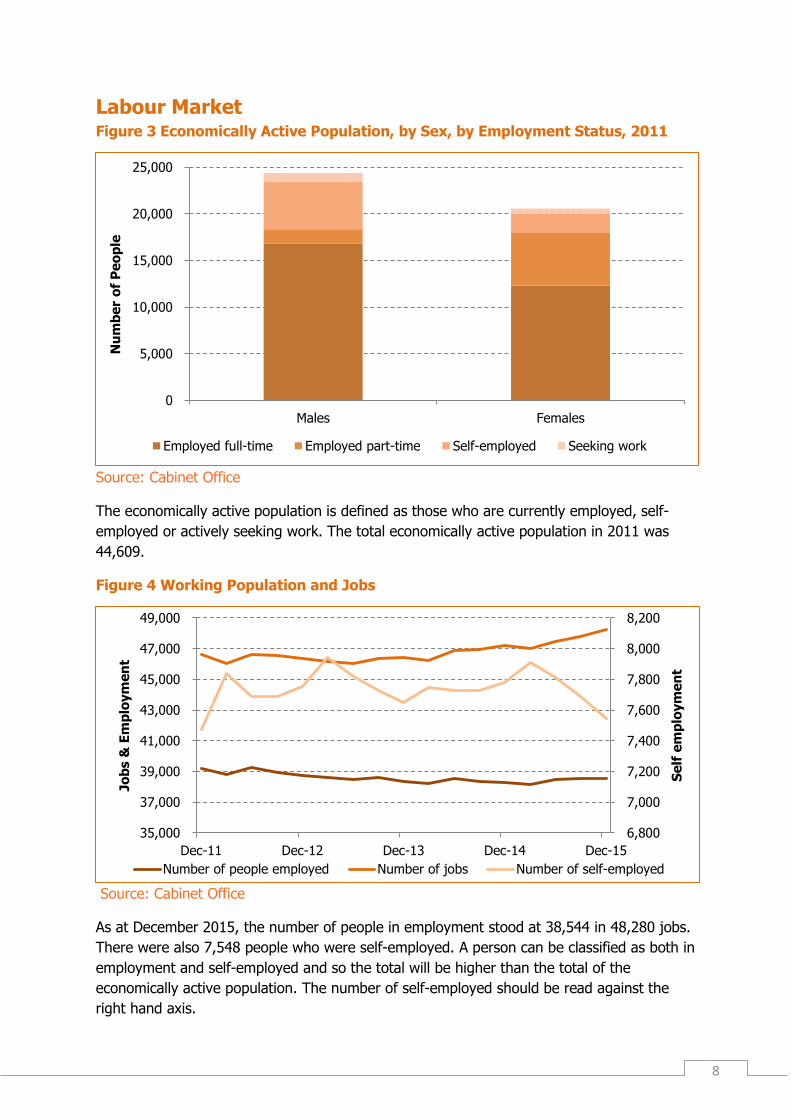
Labour Market Figure 3 Economically Active Population, by Sex, by Employment Status, 2011
Source: Cabinet Office
The economically active population is defined as those who are currently employed, self-
employed or actively seeking work. The total economically active population in 2011 was
44,609.
Figure 4 Working Population and Jobs
Source: Cabinet Office
As at December 2015, the number of people in employment stood at 38,544 in 48,280 jobs.
There were also 7,548 people who were self-employed. A person can be classified as both in
employment and self-employed and so the total will be higher than the total of the
economically active population. The number of self-employed should be read against the
right hand axis.
0
5,000
10,000
15,000
20,000
25,000
Males Females
Nu
mb
er
of
Pe
op
le
Employed full-time Employed part-time Self-employed Seeking work
6,800
7,000
7,200
7,400
7,600
7,800
8,000
8,200
35,000
37,000
39,000
41,000
43,000
45,000
47,000
49,000
Dec-11 Dec-12 Dec-13 Dec-14 Dec-15
Se
lf e
mp
loym
en
t
Jo
bs &
Em
plo
ym
en
t
Number of people employed Number of jobs Number of self-employed
9
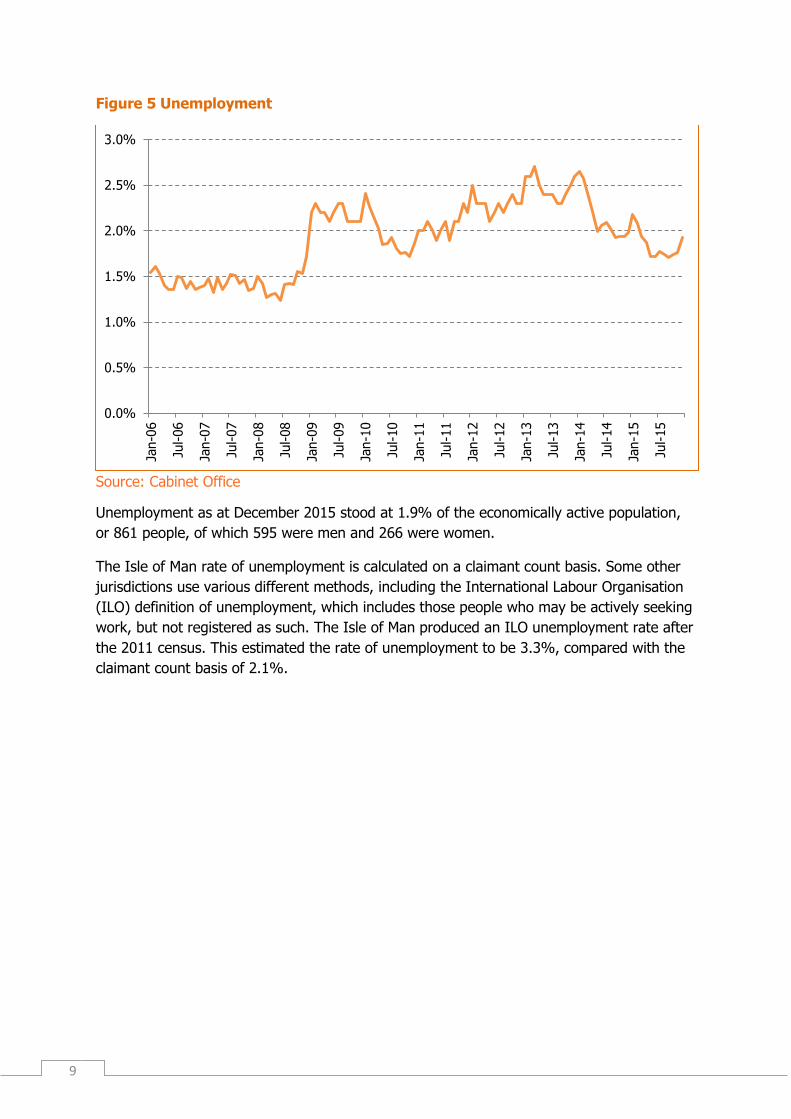
Figure 5 Unemployment
Source: Cabinet Office
Unemployment as at December 2015 stood at 1.9% of the economically active population,
or 861 people, of which 595 were men and 266 were women.
The Isle of Man rate of unemployment is calculated on a claimant count basis. Some other
jurisdictions use various different methods, including the International Labour Organisation
(ILO) definition of unemployment, which includes those people who may be actively seeking
work, but not registered as such. The Isle of Man produced an ILO unemployment rate after
the 2011 census. This estimated the rate of unemployment to be 3.3%, compared with the
claimant count basis of 2.1%.
0.0%
0.5%
1.0%
1.5%
2.0%
2.5%
3.0%Ja
n-0
6
Jul-06
Jan-0
7
Jul-07
Jan-0
8
Jul-08
Jan-0
9
Jul-09
Jan-1
0
Jul-10
Jan-1
1
Jul-11
Jan-1
2
Jul-12
Jan-1
3
Jul-13
Jan-1
4
Jul-14
Jan-1
5
Jul-15
10
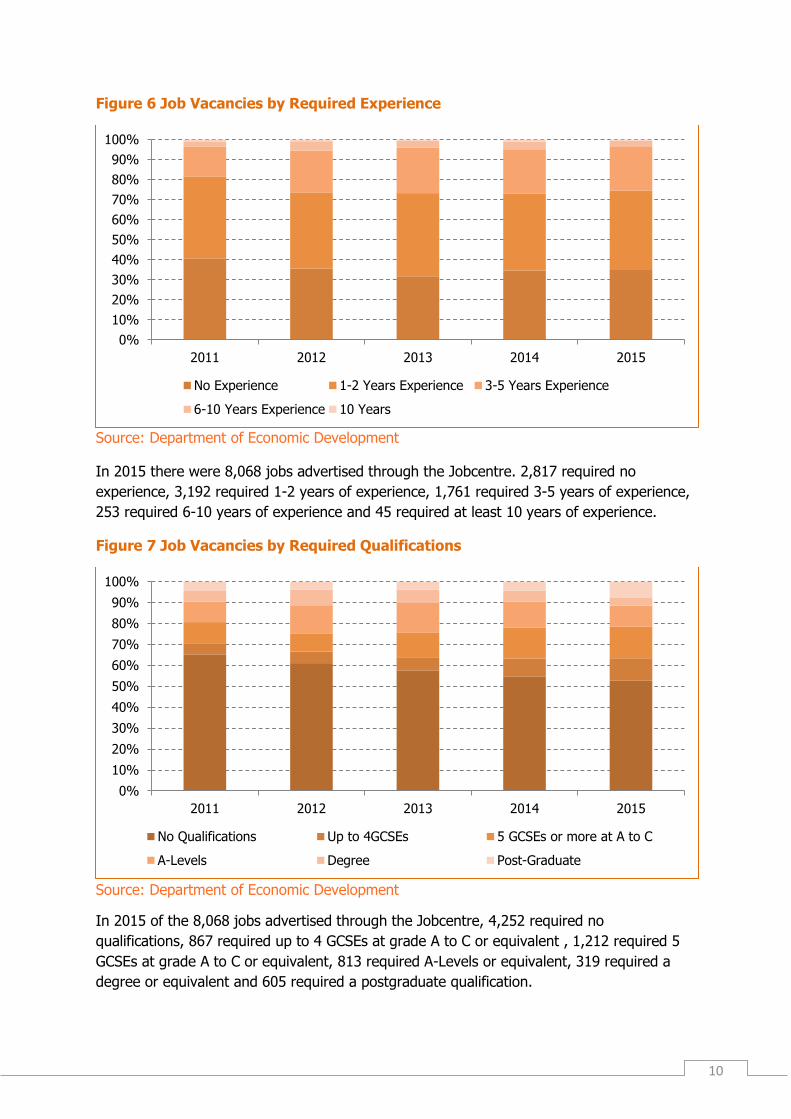
Figure 6 Job Vacancies by Required Experience
Source: Department of Economic Development
In 2015 there were 8,068 jobs advertised through the Jobcentre. 2,817 required no
experience, 3,192 required 1-2 years of experience, 1,761 required 3-5 years of experience,
253 required 6-10 years of experience and 45 required at least 10 years of experience.
Figure 7 Job Vacancies by Required Qualifications
Source: Department of Economic Development
In 2015 of the 8,068 jobs advertised through the Jobcentre, 4,252 required no
qualifications, 867 required up to 4 GCSEs at grade A to C or equivalent , 1,212 required 5
GCSEs at grade A to C or equivalent, 813 required A-Levels or equivalent, 319 required a
degree or equivalent and 605 required a postgraduate qualification.
0%
10%
20%
30%
40%
50%
60%
70%
80%
90%
100%
2011 2012 2013 2014 2015
No Experience 1-2 Years Experience 3-5 Years Experience
6-10 Years Experience 10 Years
0%
10%
20%
30%
40%
50%
60%
70%
80%
90%
100%
2011 2012 2013 2014 2015
No Qualifications Up to 4GCSEs 5 GCSEs or more at A to C
A-Levels Degree Post-Graduate

11
Table 6 Employment by Sector 1951 to 2011
Industrial Sector 1951 1961 1971 1981 1991 1996 2001 2006 2011
Agriculture, forestry, fishing 2,542 1,911 1,433 1,412 1,240 938 543 642 850
Manufacturing 694 435 3,111 3,467 3,348 3,562 3,185 2,248 2,295
Construction 3,073 1,664 2,755 2,921 3,404 3,372 2,512 3,374 3,352
Gas, electricity and water 616 465 504 496 513 462 515 603 878
Transport and communication 2,180 1,875 2,122 2,624 2,437 2,693 3,331 3,809 3,037
Wholesale distribution
672 845 867 851 781 728 905 821
Retail distribution 3,315 2,411 2,696 2,687 2,993 2,911 3,644 3,645 3,683
Insurance, banking, finance and business services 357 370 760 1,515 4,353 5,941 8,959 9,395 9,444
Professional, educational, medical and scientific services 1,576 1,702 2,690 3,737 5,438 6,081 7,296 8,060 8,917
Tourist accommodation - - 1,451 987 856 765 743 362 679
Other catering and entertainment 4,605 4,344 678 996 1,403 1,156 2,116 1,897 2,129
Miscellaneous services - - 1,954 2,530 2,849 2,768 2,373 3,075 3,382
Public administration 1,870 1,250 1,134 1,625 2,144 2,147 3,105 2,898 3,058
Not stated or inadequately described
146
609
Total 20,828 17,245 22,133 25,864 31,829 33,577 39,050 40,913 43,134
Source: Cabinet Office

12
Figure 8 Work Permits Issued
Source: Department of Economic Development
During 2015 there were 1,777 new permits issued, with 1,938 renewals also occurring
during the year.
Figure 9 Age Distribution of Working Population, 2011
Source: Cabinet Office
0
2,000
4,000
6,000
8,000
10,000
12,000
2004 2005 2006 2007 2008 2009 2010 2011 2012 2013 2014 2015
Nu
mb
er
of
Pe
rmit
s
Renewals New Permits

13
Inflation Figure 10 Annual Rate of Inflation
Source: Cabinet Office
Table 7 RPI and CPI Reflation Factors (December 2015)
Year RPI CPI
2005 1.386 2006 1.343 2007 1.292 2008 1.257 1.152
2009 1.217 1.118
2010 1.154 1.065
2011 1.102 1.014
2012 1.075 1.000
2013 1.045 0.986
2014 1.023 0.984
2015 1.000 1.000
Source: Cabinet Office
The reflation factors shown in Table 6 can be used to convert a price or monetary value into
real, or today’s money, by multiplying by the appropriate reflationary factor. For example
using the CPI as the main inflationary measure, £100 in 2010 is the equivalent to £106.50 in
2015 (£100 x 1.065). This means that to buy the same amount of goods and services in
2010, you would need £106.50 in 2015. The Isle of Man only began producing the CPI in
2008.
-1.0%
0.0%
1.0%
2.0%
3.0%
4.0%
5.0%
6.0%
7.0%
8.0%
Jan-0
6Apr-
06
Jul-06
Oct
-06
Jan-0
7Apr-
07
Jul-07
Oct
-07
Jan-0
8Apr-
08
Jul-08
Oct
-08
Jan-0
9Apr-
09
Jul-09
Oct
-09
Jan-1
0Apr-
10
Jul-10
Oct
-10
Jan-1
1Apr-
11
Jul-11
Oct
-11
Jan-1
2Apr-
12
Jul-12
Oct
-12
Jan-1
3Apr-
13
Jul-13
Oct
-13
Jan-1
4Apr-
14
Jul-14
Oct
-14
Jan-1
5Apr-
15
Jul-15
Oct
-15
RPI CPI
14
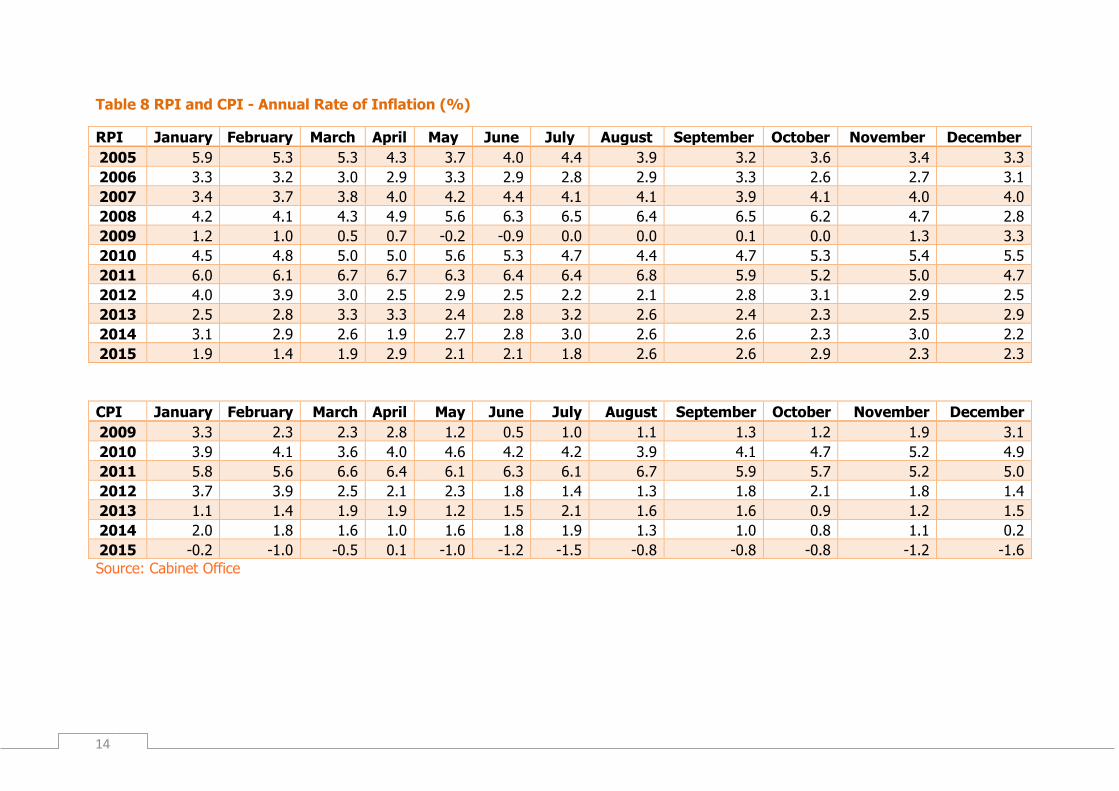
Table 8 RPI and CPI - Annual Rate of Inflation (%)
RPI January February March April May June July August September October November December
2005 5.9 5.3 5.3 4.3 3.7 4.0 4.4 3.9 3.2 3.6 3.4 3.3
2006 3.3 3.2 3.0 2.9 3.3 2.9 2.8 2.9 3.3 2.6 2.7 3.1
2007 3.4 3.7 3.8 4.0 4.2 4.4 4.1 4.1 3.9 4.1 4.0 4.0
2008 4.2 4.1 4.3 4.9 5.6 6.3 6.5 6.4 6.5 6.2 4.7 2.8
2009 1.2 1.0 0.5 0.7 -0.2 -0.9 0.0 0.0 0.1 0.0 1.3 3.3
2010 4.5 4.8 5.0 5.0 5.6 5.3 4.7 4.4 4.7 5.3 5.4 5.5
2011 6.0 6.1 6.7 6.7 6.3 6.4 6.4 6.8 5.9 5.2 5.0 4.7
2012 4.0 3.9 3.0 2.5 2.9 2.5 2.2 2.1 2.8 3.1 2.9 2.5
2013 2.5 2.8 3.3 3.3 2.4 2.8 3.2 2.6 2.4 2.3 2.5 2.9
2014 3.1 2.9 2.6 1.9 2.7 2.8 3.0 2.6 2.6 2.3 3.0 2.2
2015 1.9 1.4 1.9 2.9 2.1 2.1 1.8 2.6 2.6 2.9 2.3 2.3
CPI January February March April May June July August September October November December
2009 3.3 2.3 2.3 2.8 1.2 0.5 1.0 1.1 1.3 1.2 1.9 3.1
2010 3.9 4.1 3.6 4.0 4.6 4.2 4.2 3.9 4.1 4.7 5.2 4.9
2011 5.8 5.6 6.6 6.4 6.1 6.3 6.1 6.7 5.9 5.7 5.2 5.0
2012 3.7 3.9 2.5 2.1 2.3 1.8 1.4 1.3 1.8 2.1 1.8 1.4
2013 1.1 1.4 1.9 1.9 1.2 1.5 2.1 1.6 1.6 0.9 1.2 1.5
2014 2.0 1.8 1.6 1.0 1.6 1.8 1.9 1.3 1.0 0.8 1.1 0.2
2015 -0.2 -1.0 -0.5 0.1 -1.0 -1.2 -1.5 -0.8 -0.8 -0.8 -1.2 -1.6
Source: Cabinet Office
15
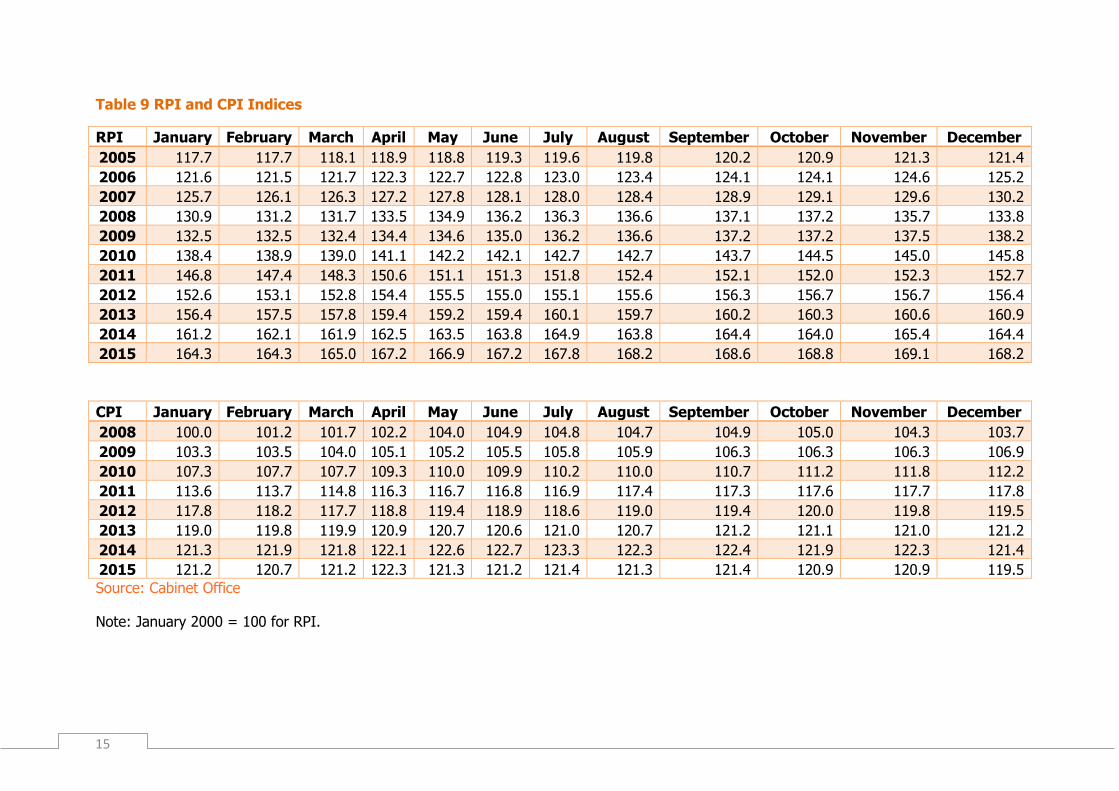
Table 9 RPI and CPI Indices
RPI January February March April May June July August September October November December
2005 117.7 117.7 118.1 118.9 118.8 119.3 119.6 119.8 120.2 120.9 121.3 121.4
2006 121.6 121.5 121.7 122.3 122.7 122.8 123.0 123.4 124.1 124.1 124.6 125.2
2007 125.7 126.1 126.3 127.2 127.8 128.1 128.0 128.4 128.9 129.1 129.6 130.2
2008 130.9 131.2 131.7 133.5 134.9 136.2 136.3 136.6 137.1 137.2 135.7 133.8
2009 132.5 132.5 132.4 134.4 134.6 135.0 136.2 136.6 137.2 137.2 137.5 138.2
2010 138.4 138.9 139.0 141.1 142.2 142.1 142.7 142.7 143.7 144.5 145.0 145.8
2011 146.8 147.4 148.3 150.6 151.1 151.3 151.8 152.4 152.1 152.0 152.3 152.7
2012 152.6 153.1 152.8 154.4 155.5 155.0 155.1 155.6 156.3 156.7 156.7 156.4
2013 156.4 157.5 157.8 159.4 159.2 159.4 160.1 159.7 160.2 160.3 160.6 160.9
2014 161.2 162.1 161.9 162.5 163.5 163.8 164.9 163.8 164.4 164.0 165.4 164.4
2015 164.3 164.3 165.0 167.2 166.9 167.2 167.8 168.2 168.6 168.8 169.1 168.2
CPI January February March April May June July August September October November December
2008 100.0 101.2 101.7 102.2 104.0 104.9 104.8 104.7 104.9 105.0 104.3 103.7
2009 103.3 103.5 104.0 105.1 105.2 105.5 105.8 105.9 106.3 106.3 106.3 106.9
2010 107.3 107.7 107.7 109.3 110.0 109.9 110.2 110.0 110.7 111.2 111.8 112.2
2011 113.6 113.7 114.8 116.3 116.7 116.8 116.9 117.4 117.3 117.6 117.7 117.8
2012 117.8 118.2 117.7 118.8 119.4 118.9 118.6 119.0 119.4 120.0 119.8 119.5
2013 119.0 119.8 119.9 120.9 120.7 120.6 121.0 120.7 121.2 121.1 121.0 121.2
2014 121.3 121.9 121.8 122.1 122.6 122.7 123.3 122.3 122.4 121.9 122.3 121.4
2015 121.2 120.7 121.2 122.3 121.3 121.2 121.4 121.3 121.4 120.9 120.9 119.5
Source: Cabinet Office
Note: January 2000 = 100 for RPI.
16
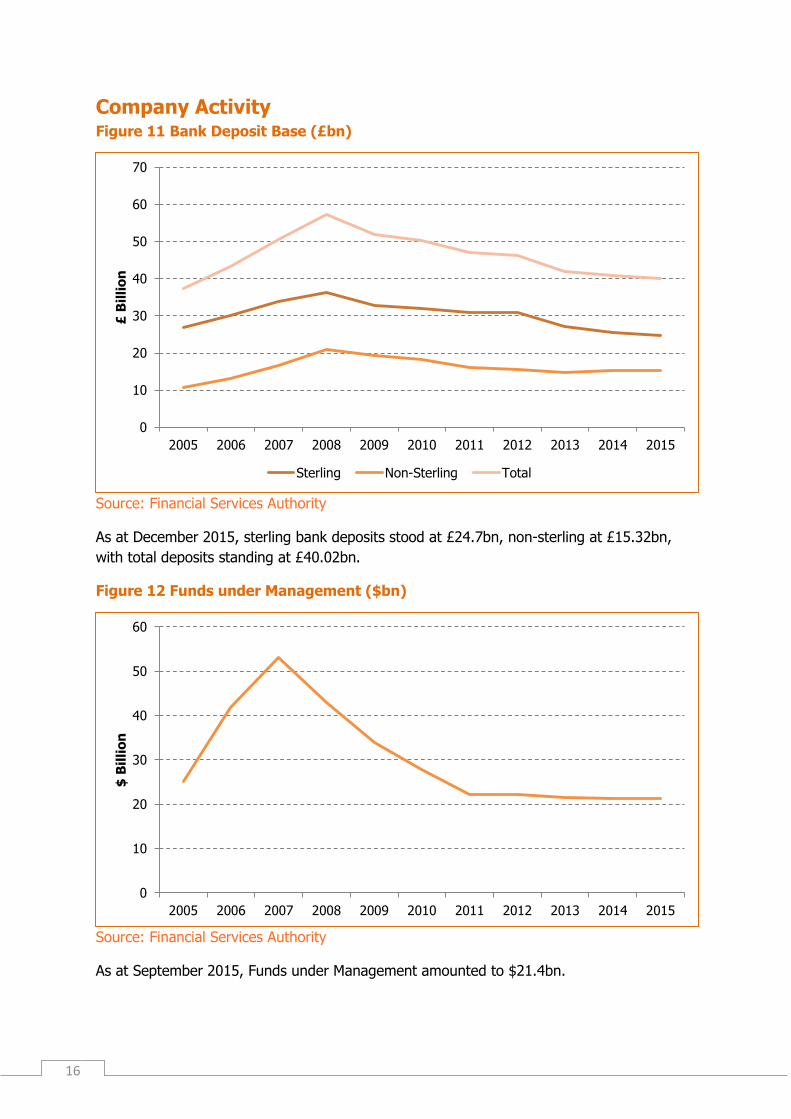
Company Activity Figure 11 Bank Deposit Base (£bn)
Source: Financial Services Authority
As at December 2015, sterling bank deposits stood at £24.7bn, non-sterling at £15.32bn,
with total deposits standing at £40.02bn.
Figure 12 Funds under Management ($bn)
Source: Financial Services Authority
As at September 2015, Funds under Management amounted to $21.4bn.
0
10
20
30
40
50
60
70
2005 2006 2007 2008 2009 2010 2011 2012 2013 2014 2015
£ B
illi
on
Sterling Non-Sterling Total
0
10
20
30
40
50
60
2005 2006 2007 2008 2009 2010 2011 2012 2013 2014 2015
$ B
illi
on
17
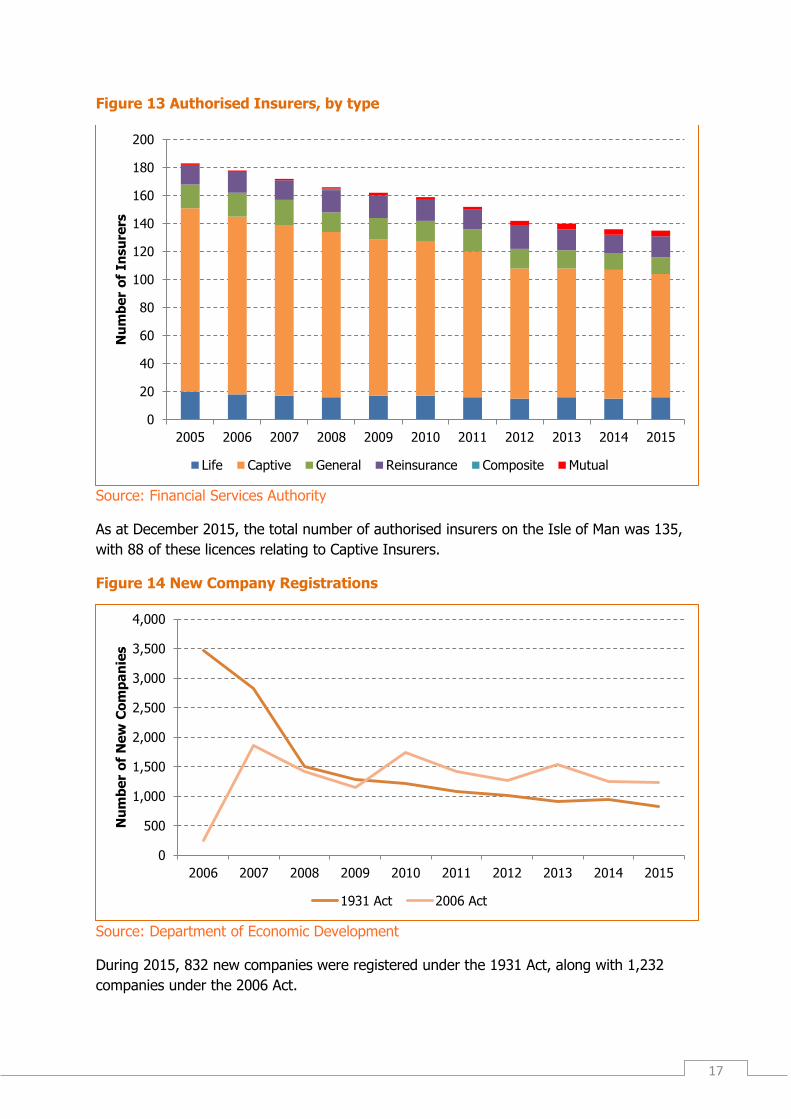
Figure 13 Authorised Insurers, by type
Source: Financial Services Authority
As at December 2015, the total number of authorised insurers on the Isle of Man was 135,
with 88 of these licences relating to Captive Insurers.
Figure 14 New Company Registrations
Source: Department of Economic Development
During 2015, 832 new companies were registered under the 1931 Act, along with 1,232
companies under the 2006 Act.
0
20
40
60
80
100
120
140
160
180
200
2005 2006 2007 2008 2009 2010 2011 2012 2013 2014 2015
Nu
mb
er
of
Insu
rers
Life Captive General Reinsurance Composite Mutual
0
500
1,000
1,500
2,000
2,500
3,000
3,500
4,000
2006 2007 2008 2009 2010 2011 2012 2013 2014 2015
Nu
mb
er
of
Ne
w C
om
pa
nie
s
1931 Act 2006 Act
18
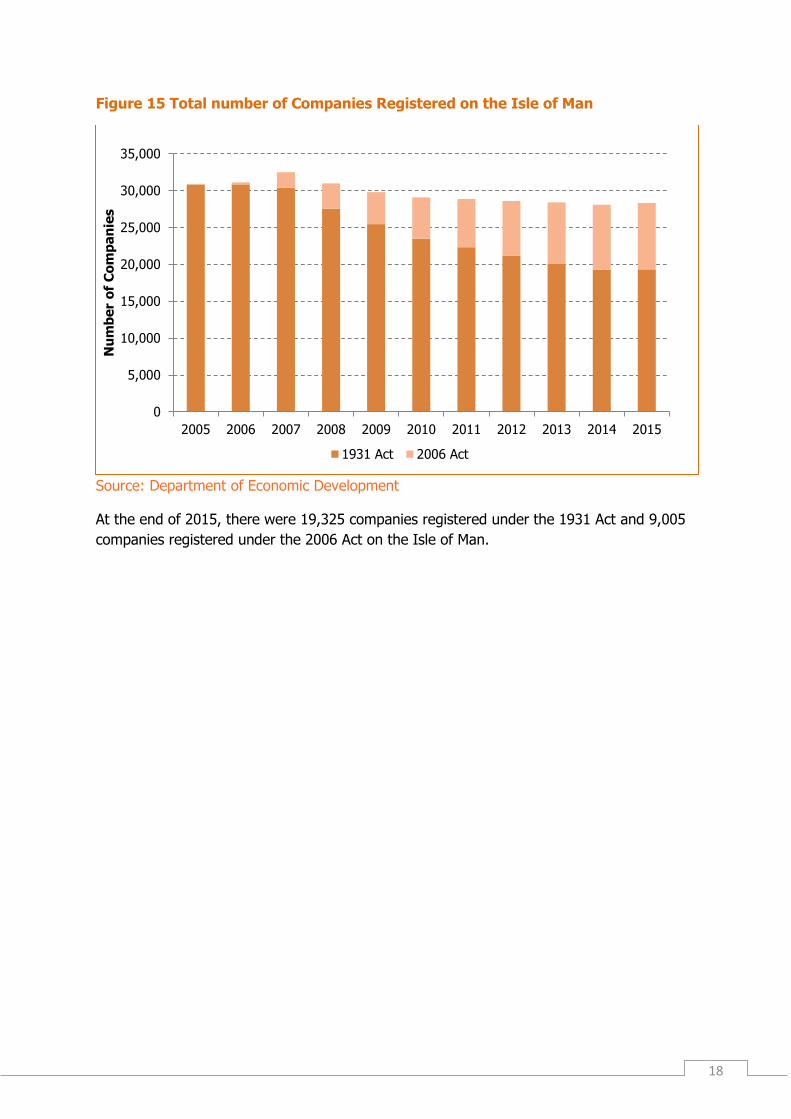
Figure 15 Total number of Companies Registered on the Isle of Man
Source: Department of Economic Development
At the end of 2015, there were 19,325 companies registered under the 1931 Act and 9,005
companies registered under the 2006 Act on the Isle of Man.
0
5,000
10,000
15,000
20,000
25,000
30,000
35,000
2005 2006 2007 2008 2009 2010 2011 2012 2013 2014 2015
Nu
mb
er
of
Co
mp
an
ies
1931 Act 2006 Act
19
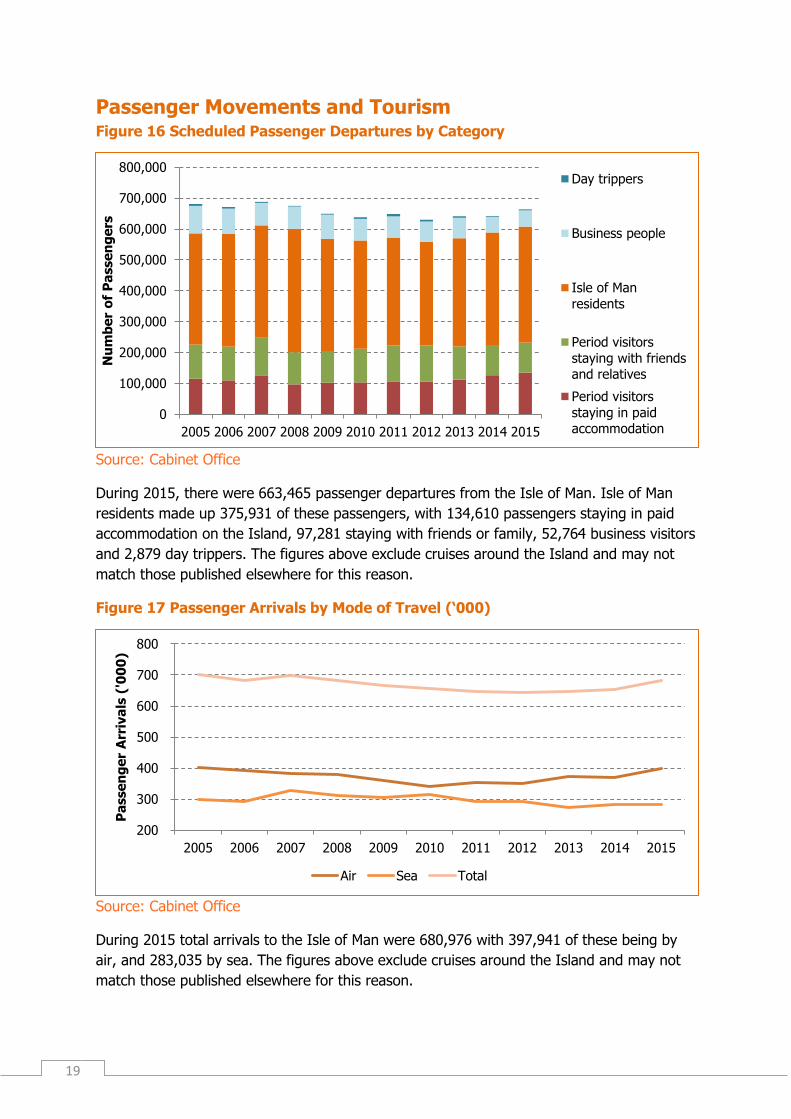
Passenger Movements and Tourism Figure 16 Scheduled Passenger Departures by Category
Source: Cabinet Office
During 2015, there were 663,465 passenger departures from the Isle of Man. Isle of Man
residents made up 375,931 of these passengers, with 134,610 passengers staying in paid
accommodation on the Island, 97,281 staying with friends or family, 52,764 business visitors
and 2,879 day trippers. The figures above exclude cruises around the Island and may not
match those published elsewhere for this reason.
Figure 17 Passenger Arrivals by Mode of Travel (‘000)
Source: Cabinet Office
During 2015 total arrivals to the Isle of Man were 680,976 with 397,941 of these being by
air, and 283,035 by sea. The figures above exclude cruises around the Island and may not
match those published elsewhere for this reason.
0
100,000
200,000
300,000
400,000
500,000
600,000
700,000
800,000
2005 2006 2007 2008 2009 2010 2011 2012 2013 2014 2015
Nu
mb
er
of
Pa
sse
ng
ers
Day trippers
Business people
Isle of Man
residents
Period visitors
staying with friendsand relatives
Period visitors
staying in paidaccommodation
200
300
400
500
600
700
800
2005 2006 2007 2008 2009 2010 2011 2012 2013 2014 2015
Pa
sse
ng
er
Arr
iva
ls (
'00
0)
Air Sea Total
20
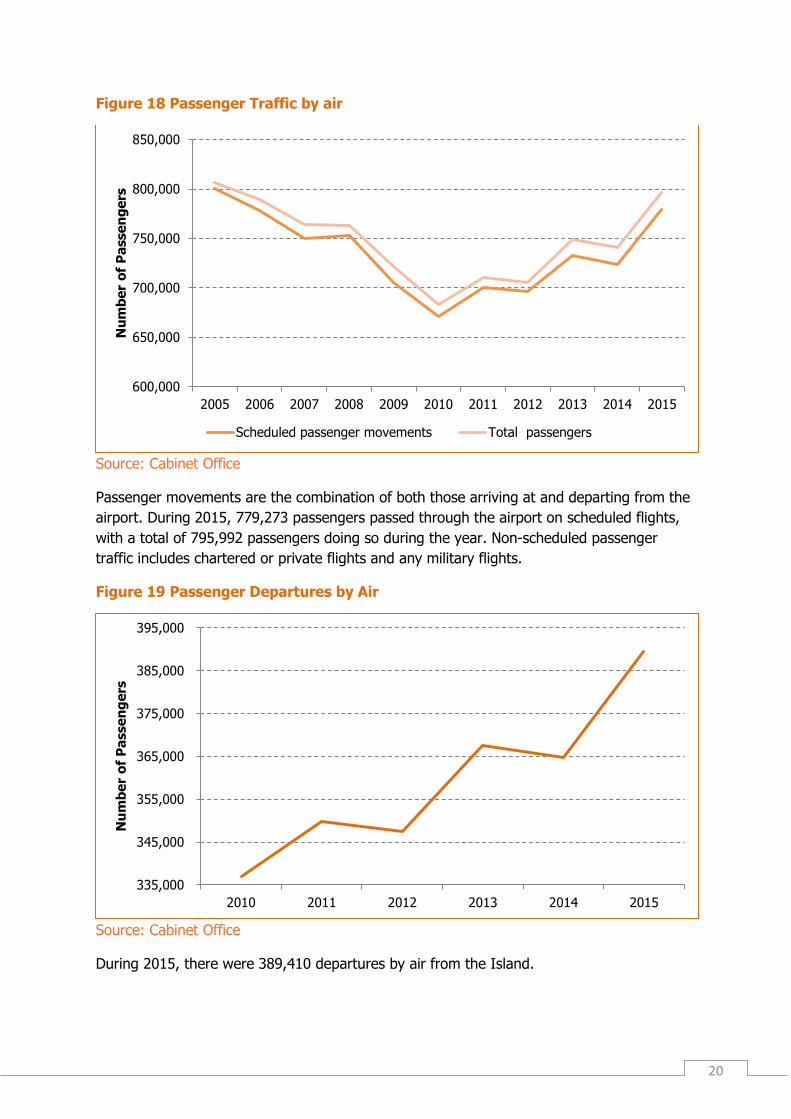
Figure 18 Passenger Traffic by air
Source: Cabinet Office
Passenger movements are the combination of both those arriving at and departing from the
airport. During 2015, 779,273 passengers passed through the airport on scheduled flights,
with a total of 795,992 passengers doing so during the year. Non-scheduled passenger
traffic includes chartered or private flights and any military flights.
Figure 19 Passenger Departures by Air
Source: Cabinet Office
During 2015, there were 389,410 departures by air from the Island.
600,000
650,000
700,000
750,000
800,000
850,000
2005 2006 2007 2008 2009 2010 2011 2012 2013 2014 2015
Nu
mb
er
of
Pa
sse
ng
ers
Scheduled passenger movements Total passengers
335,000
345,000
355,000
365,000
375,000
385,000
395,000
2010 2011 2012 2013 2014 2015
Nu
mb
er
of
Pa
sse
ng
ers
21
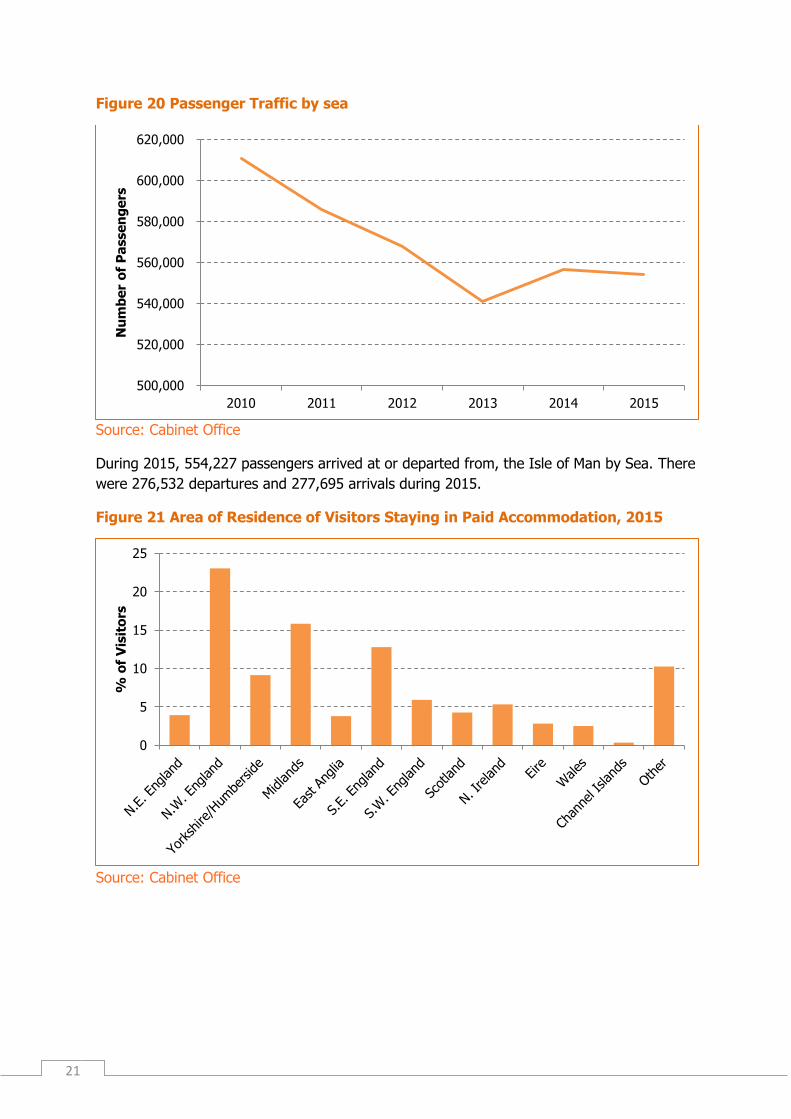
Figure 20 Passenger Traffic by sea
Source: Cabinet Office
During 2015, 554,227 passengers arrived at or departed from, the Isle of Man by Sea. There
were 276,532 departures and 277,695 arrivals during 2015.
Figure 21 Area of Residence of Visitors Staying in Paid Accommodation, 2015
Source: Cabinet Office
500,000
520,000
540,000
560,000
580,000
600,000
620,000
2010 2011 2012 2013 2014 2015
Nu
mb
er
of
Pa
sse
ng
ers
0
5
10
15
20
25
% o
f V
isit
ors
22
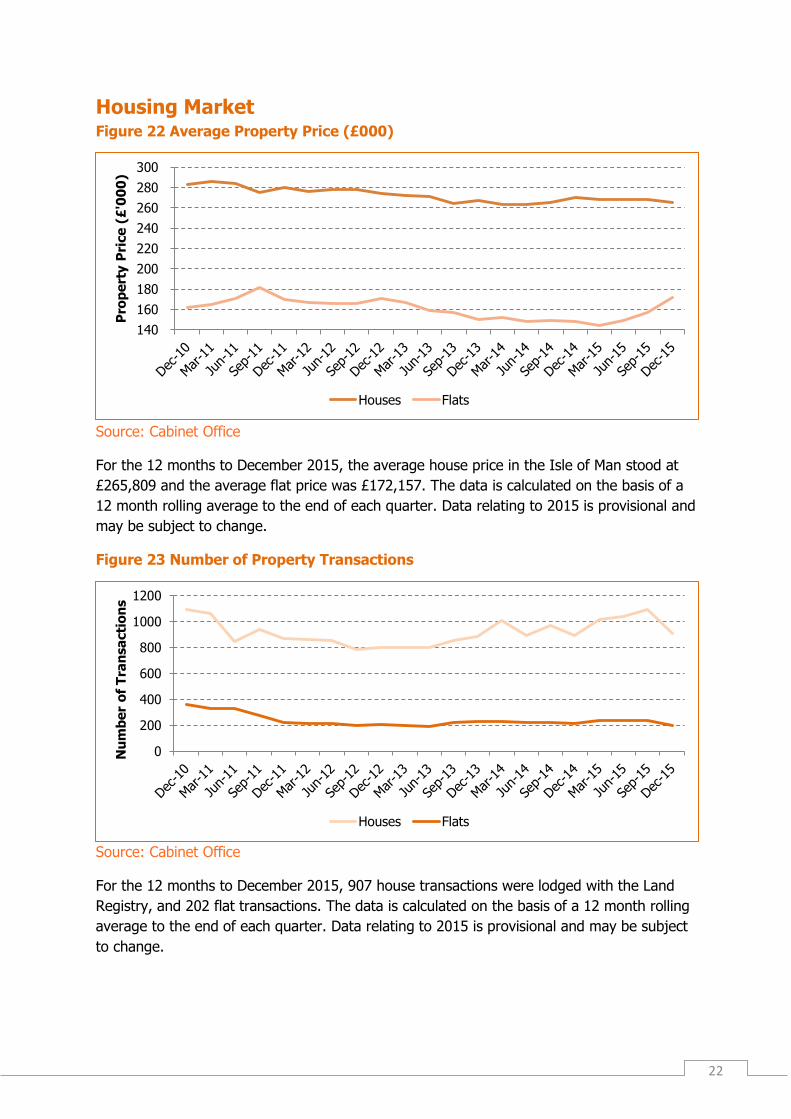
Housing Market Figure 22 Average Property Price (£000)
Source: Cabinet Office
For the 12 months to December 2015, the average house price in the Isle of Man stood at
£265,809 and the average flat price was £172,157. The data is calculated on the basis of a
12 month rolling average to the end of each quarter. Data relating to 2015 is provisional and
may be subject to change.
Figure 23 Number of Property Transactions
Source: Cabinet Office
For the 12 months to December 2015, 907 house transactions were lodged with the Land
Registry, and 202 flat transactions. The data is calculated on the basis of a 12 month rolling
average to the end of each quarter. Data relating to 2015 is provisional and may be subject
to change.
140
160
180
200
220
240
260
280
300
Pro
pe
rty P
rice
(£
'00
0)
Houses Flats
0
200
400
600
800
1000
1200
Nu
mb
er
of
Tra
nsa
cti
on
s
Houses Flats
23
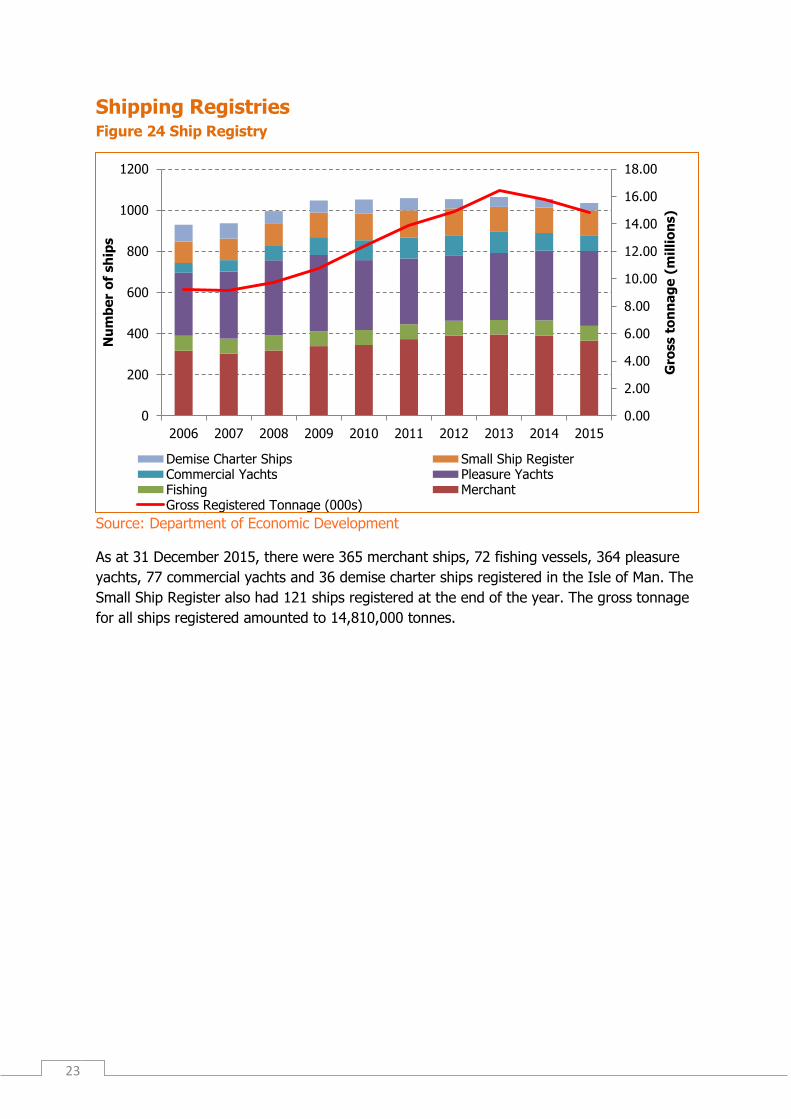
Shipping Registries Figure 24 Ship Registry
Source: Department of Economic Development
As at 31 December 2015, there were 365 merchant ships, 72 fishing vessels, 364 pleasure
yachts, 77 commercial yachts and 36 demise charter ships registered in the Isle of Man. The
Small Ship Register also had 121 ships registered at the end of the year. The gross tonnage
for all ships registered amounted to 14,810,000 tonnes.
0.00
2.00
4.00
6.00
8.00
10.00
12.00
14.00
16.00
18.00
0
200
400
600
800
1000
1200
2006 2007 2008 2009 2010 2011 2012 2013 2014 2015
Gro
ss t
on
na
ge
(m
illi
on
s)
Nu
mb
er
of
sh
ips
Demise Charter Ships Small Ship RegisterCommercial Yachts Pleasure YachtsFishing MerchantGross Registered Tonnage (000s)
24
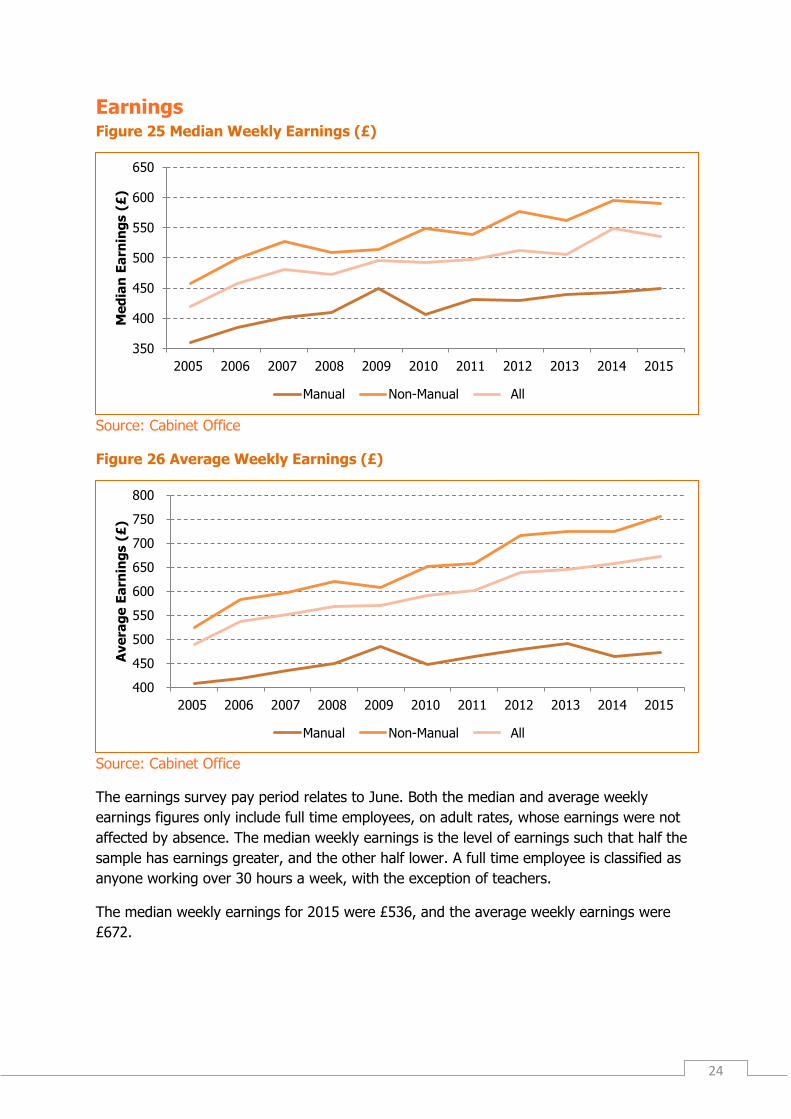
Earnings Figure 25 Median Weekly Earnings (£)
Source: Cabinet Office
Figure 26 Average Weekly Earnings (£)
Source: Cabinet Office
The earnings survey pay period relates to June. Both the median and average weekly
earnings figures only include full time employees, on adult rates, whose earnings were not
affected by absence. The median weekly earnings is the level of earnings such that half the
sample has earnings greater, and the other half lower. A full time employee is classified as
anyone working over 30 hours a week, with the exception of teachers.
The median weekly earnings for 2015 were £536, and the average weekly earnings were
£672.
350
400
450
500
550
600
650
2005 2006 2007 2008 2009 2010 2011 2012 2013 2014 2015
Me
dia
n E
arn
ing
s (
£)
Manual Non-Manual All
400
450
500
550
600
650
700
750
800
2005 2006 2007 2008 2009 2010 2011 2012 2013 2014 2015
Ave
rag
e E
arn
ing
s (
£)
Manual Non-Manual All

25
Figure 27 Distribution of Weekly Earnings 2015
Source: Cabinet Office
Note: The data relates to those classified as full time employees, on adult rates, whose pay during the survey period was not affected by
absence.
0.0%
1.0%
2.0%
3.0%
4.0%
5.0%
6.0%
7.0%
£ per week
26
Income and Expenditure
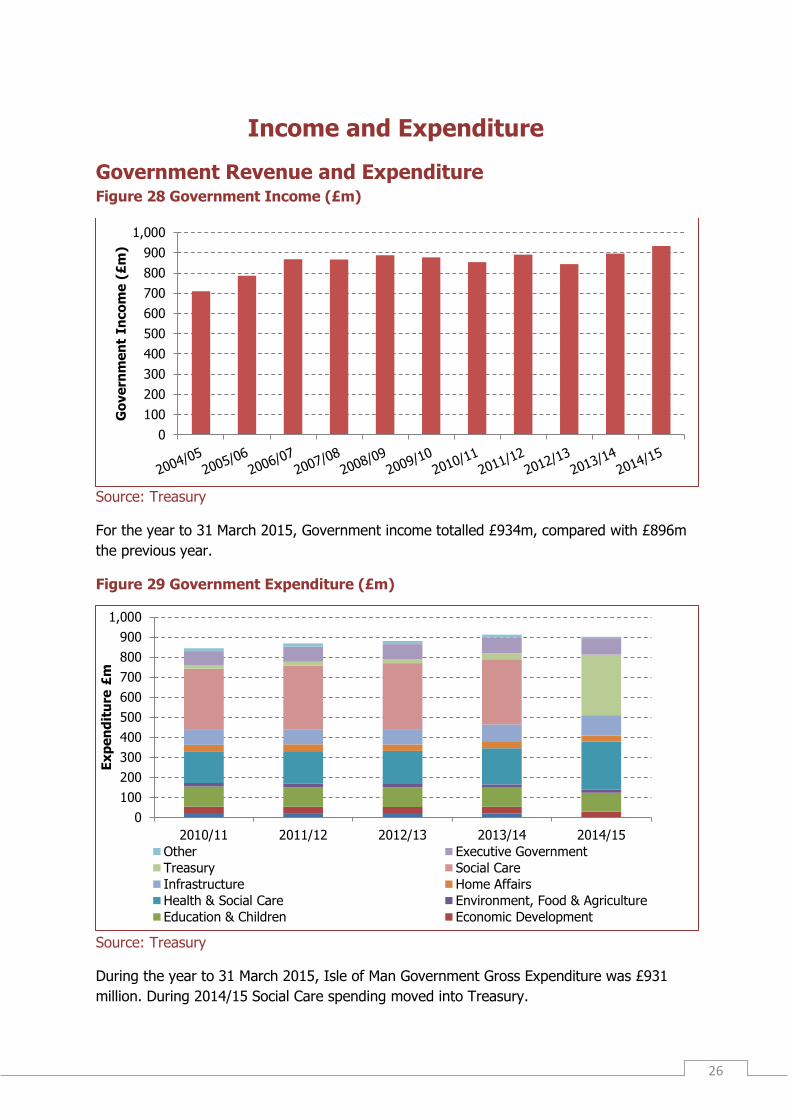
Government Revenue and Expenditure Figure 28 Government Income (£m)
Source: Treasury
For the year to 31 March 2015, Government income totalled £934m, compared with £896m
the previous year.
Figure 29 Government Expenditure (£m)
Source: Treasury
During the year to 31 March 2015, Isle of Man Government Gross Expenditure was £931
million. During 2014/15 Social Care spending moved into Treasury.
0
100
200
300
400
500
600
700
800
900
1,000
Go
ve
rnm
en
t In
co
me
(£
m)
0
100
200
300
400
500
600
700
800
900
1,000
2010/11 2011/12 2012/13 2013/14 2014/15
Ex
pe
nd
itu
re £
m
Other Executive Government
Treasury Social Care
Infrastructure Home Affairs
Health & Social Care Environment, Food & Agriculture
Education & Children Economic Development
27
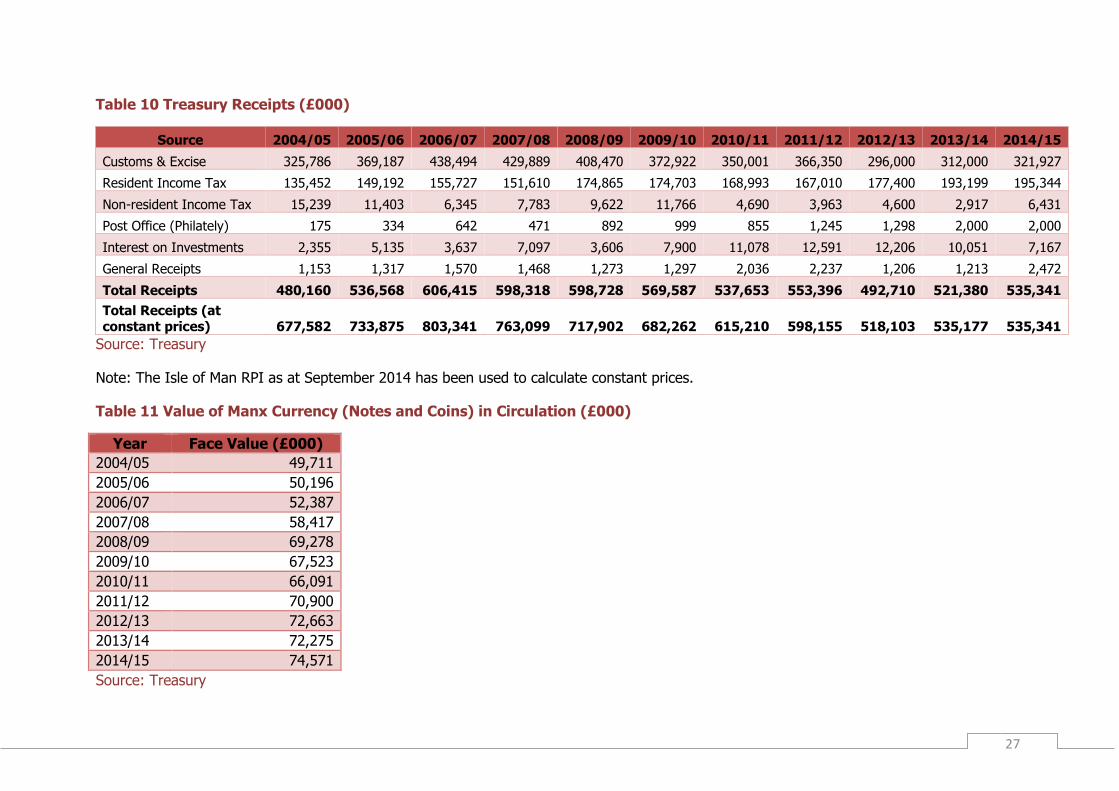
Table 10 Treasury Receipts (£000)
Source 2004/05 2005/06 2006/07 2007/08 2008/09 2009/10 2010/11 2011/12 2012/13 2013/14 2014/15
Customs & Excise 325,786 369,187 438,494 429,889 408,470 372,922 350,001 366,350 296,000 312,000 321,927
Resident Income Tax 135,452 149,192 155,727 151,610 174,865 174,703 168,993 167,010 177,400 193,199 195,344
Non-resident Income Tax 15,239 11,403 6,345 7,783 9,622 11,766 4,690 3,963 4,600 2,917 6,431
Post Office (Philately) 175 334 642 471 892 999 855 1,245 1,298 2,000 2,000
Interest on Investments 2,355 5,135 3,637 7,097 3,606 7,900 11,078 12,591 12,206 10,051 7,167
General Receipts 1,153 1,317 1,570 1,468 1,273 1,297 2,036 2,237 1,206 1,213 2,472
Total Receipts 480,160 536,568 606,415 598,318 598,728 569,587 537,653 553,396 492,710 521,380 535,341
Total Receipts (at constant prices) 677,582 733,875 803,341 763,099 717,902 682,262 615,210 598,155 518,103 535,177 535,341
Source: Treasury
Note: The Isle of Man RPI as at September 2014 has been used to calculate constant prices.
Table 11 Value of Manx Currency (Notes and Coins) in Circulation (£000)
Year Face Value (£000)
2004/05 49,711
2005/06 50,196
2006/07 52,387
2007/08 58,417
2008/09 69,278
2009/10 67,523
2010/11 66,091
2011/12 70,900
2012/13 72,663
2013/14 72,275
2014/15 74,571
Source: Treasury
28
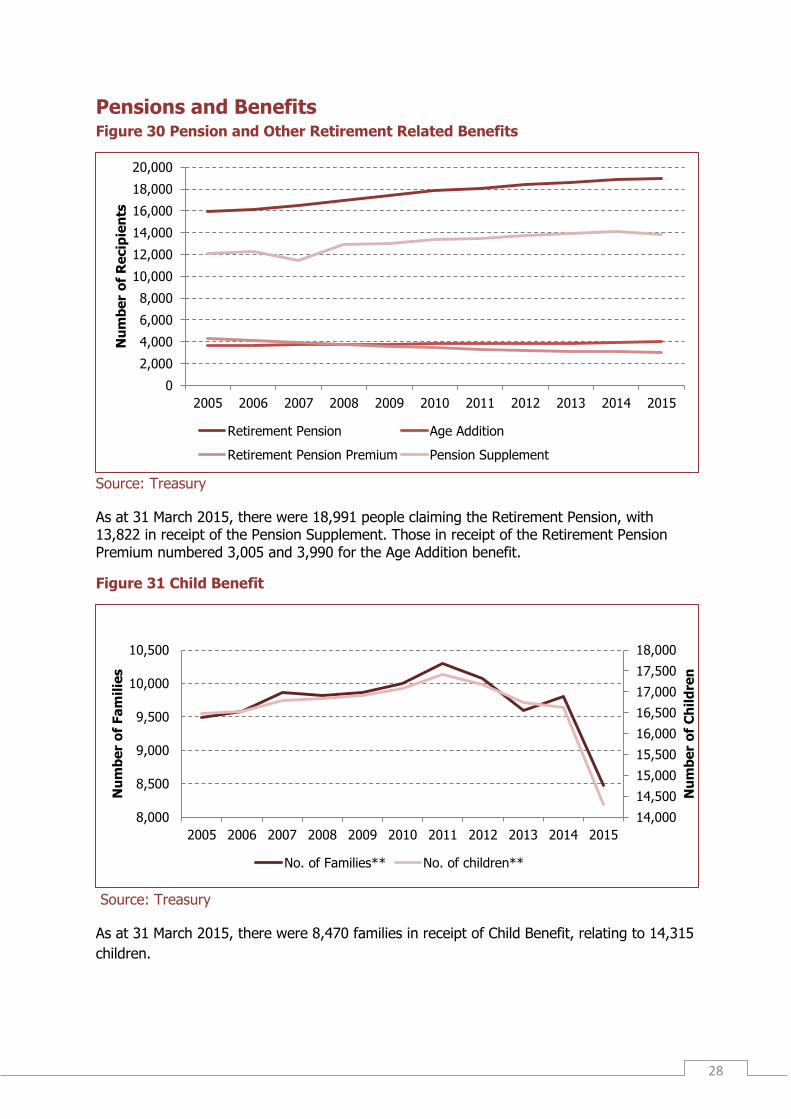
Pensions and Benefits Figure 30 Pension and Other Retirement Related Benefits
Source: Treasury
As at 31 March 2015, there were 18,991 people claiming the Retirement Pension, with 13,822 in receipt of the Pension Supplement. Those in receipt of the Retirement Pension Premium numbered 3,005 and 3,990 for the Age Addition benefit.
Figure 31 Child Benefit
Source: Treasury
As at 31 March 2015, there were 8,470 families in receipt of Child Benefit, relating to 14,315
children.
0
2,000
4,000
6,000
8,000
10,000
12,000
14,000
16,000
18,000
20,000
2005 2006 2007 2008 2009 2010 2011 2012 2013 2014 2015
Nu
mb
er
of
Re
cip
ien
ts
Retirement Pension Age Addition
Retirement Pension Premium Pension Supplement
14,000
14,500
15,000
15,500
16,000
16,500
17,000
17,500
18,000
8,000
8,500
9,000
9,500
10,000
10,500
2005 2006 2007 2008 2009 2010 2011 2012 2013 2014 2015
Nu
mb
er
of
Ch
ild
ren
Nu
mb
er
of
Fa
mil
ies
No. of Families** No. of children**
29
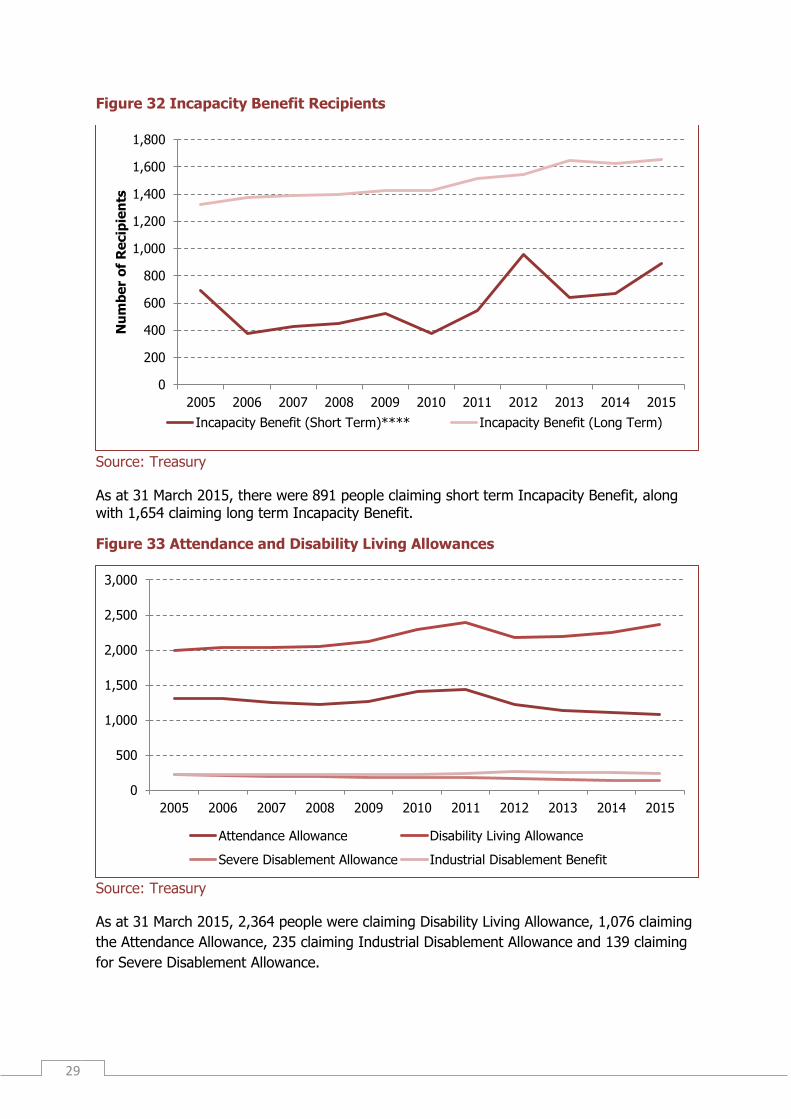
Figure 32 Incapacity Benefit Recipients
Source: Treasury
As at 31 March 2015, there were 891 people claiming short term Incapacity Benefit, along with 1,654 claiming long term Incapacity Benefit.
Figure 33 Attendance and Disability Living Allowances
Source: Treasury
As at 31 March 2015, 2,364 people were claiming Disability Living Allowance, 1,076 claiming
the Attendance Allowance, 235 claiming Industrial Disablement Allowance and 139 claiming
for Severe Disablement Allowance.
0
200
400
600
800
1,000
1,200
1,400
1,600
1,800
2005 2006 2007 2008 2009 2010 2011 2012 2013 2014 2015
Nu
mb
er
of
Re
cip
ien
ts
Incapacity Benefit (Short Term)**** Incapacity Benefit (Long Term)
0
500
1,000
1,500
2,000
2,500
3,000
2005 2006 2007 2008 2009 2010 2011 2012 2013 2014 2015
Attendance Allowance Disability Living Allowance
Severe Disablement Allowance Industrial Disablement Benefit
30
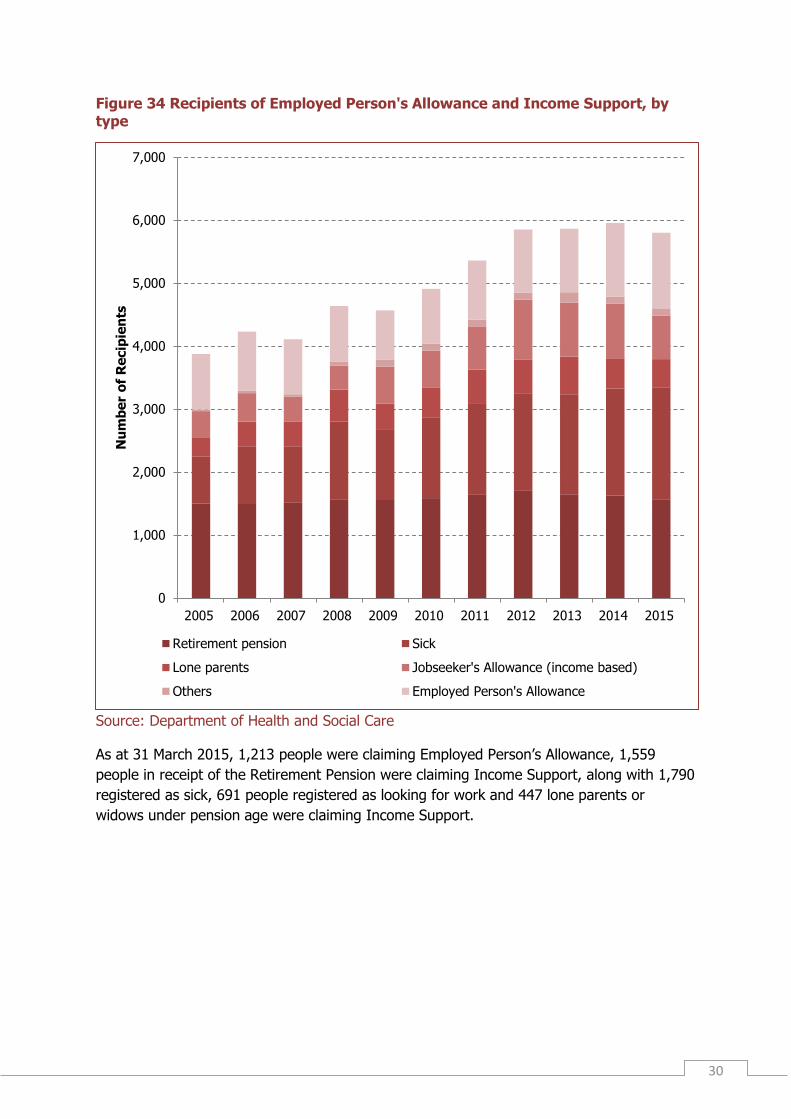
Figure 34 Recipients of Employed Person's Allowance and Income Support, by type
Source: Department of Health and Social Care
As at 31 March 2015, 1,213 people were claiming Employed Person’s Allowance, 1,559
people in receipt of the Retirement Pension were claiming Income Support, along with 1,790
registered as sick, 691 people registered as looking for work and 447 lone parents or
widows under pension age were claiming Income Support.
0
1,000
2,000
3,000
4,000
5,000
6,000
7,000
2005 2006 2007 2008 2009 2010 2011 2012 2013 2014 2015
Nu
mb
er
of
Re
cip
ien
ts
Retirement pension Sick
Lone parents Jobseeker's Allowance (income based)
Others Employed Person's Allowance
31
Our Society
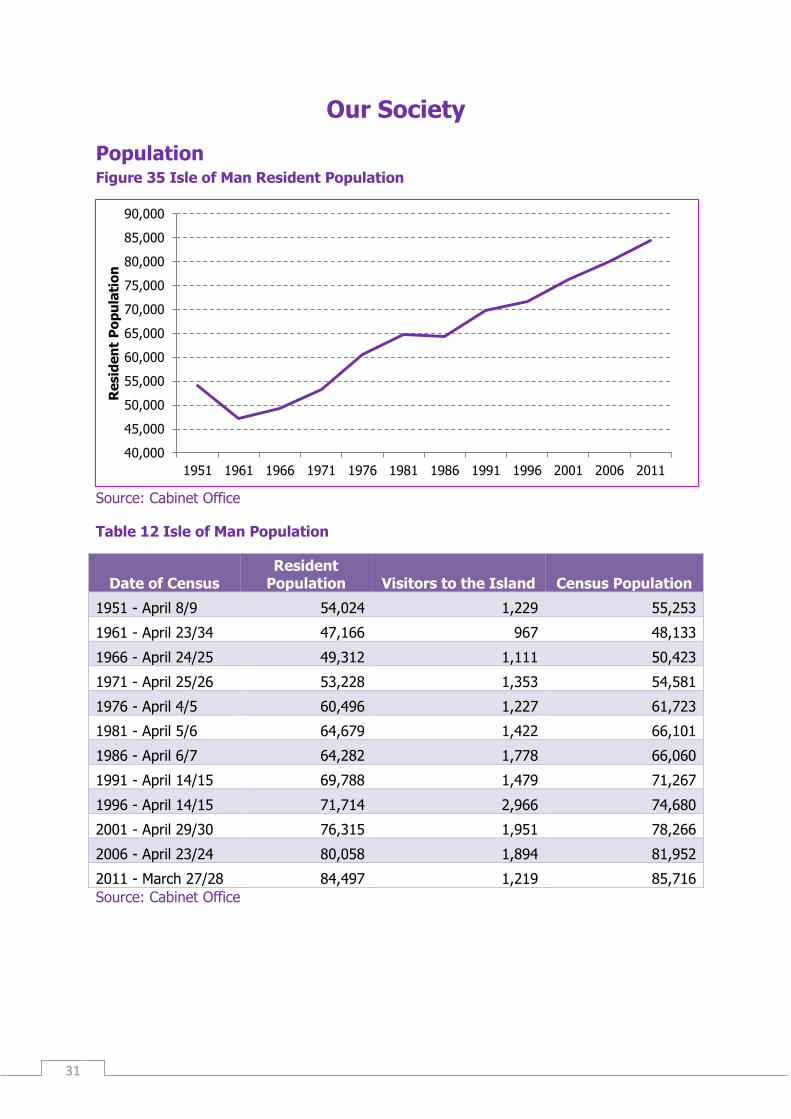
Population Figure 35 Isle of Man Resident Population
Source: Cabinet Office
Table 12 Isle of Man Population
Date of Census Resident
Population Visitors to the Island Census Population
1951 - April 8/9 54,024 1,229 55,253
1961 - April 23/34 47,166 967 48,133
1966 - April 24/25 49,312 1,111 50,423
1971 - April 25/26 53,228 1,353 54,581
1976 - April 4/5 60,496 1,227 61,723
1981 - April 5/6 64,679 1,422 66,101
1986 - April 6/7 64,282 1,778 66,060
1991 - April 14/15 69,788 1,479 71,267
1996 - April 14/15 71,714 2,966 74,680
2001 - April 29/30 76,315 1,951 78,266
2006 - April 23/24 80,058 1,894 81,952
2011 - March 27/28 84,497 1,219 85,716
Source: Cabinet Office
40,000
45,000
50,000
55,000
60,000
65,000
70,000
75,000
80,000
85,000
90,000
1951 1961 1966 1971 1976 1981 1986 1991 1996 2001 2006 2011
Re
sid
en
t P
op
ula
tio
n

32
Table 13 Resident Population by Country of Birth, 2011
Country of Birth Total As a percentage of total
resident population
Isle of Man 40,655 48.1
England 30,329 35.9
Wales 962 1.1
Scotland 2,711 3.2
N.Ireland 1,706 2.0
Channel Islands 202 0.2
Republic of Ireland 1,611 1.9
Other Europe (EU) 2,004 2.4
Other Europe (Non EU) 414 0.5
Middle East 89 0.1
Asia 1,668 2.0
Africa 1,237 1.5
North America 373 0.4
Central America 21 0.0
South America 78 0.1
Caribbean 126 0.1
Australasia 291 0.3
Other/Unidentified 20 0.0
Total Resident Population 84,497 100.0
Source: Cabinet Office
Figure 36 Population in Key Settlements
Source: Cabinet Office
0
5,000
10,000
15,000
20,000
25,000
30,000
1966 1971 1976 1981 1986 1991 1996 2001 2006 2011
Nu
mb
er
of
Pe
rso
ns
Douglas Ramsey Peel Castletown
33
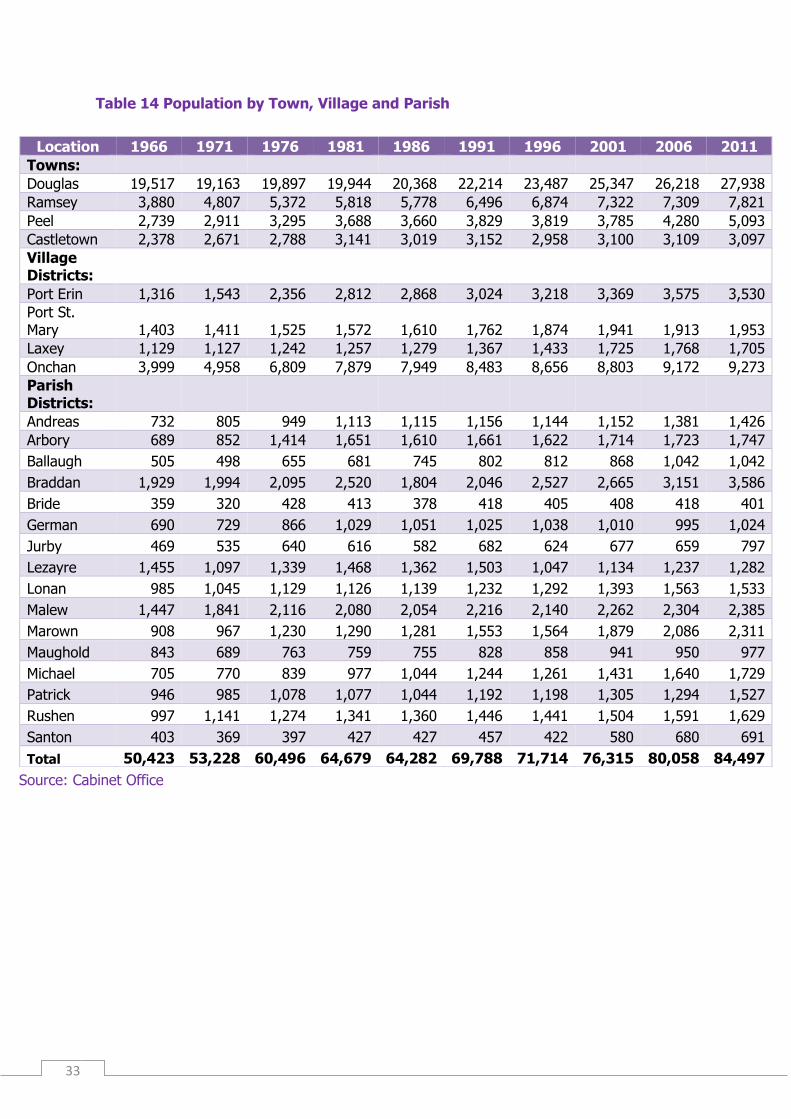
Table 14 Population by Town, Village and Parish
Location 1966 1971 1976 1981 1986 1991 1996 2001 2006 2011
Towns: Douglas 19,517 19,163 19,897 19,944 20,368 22,214 23,487 25,347 26,218 27,938
Ramsey 3,880 4,807 5,372 5,818 5,778 6,496 6,874 7,322 7,309 7,821
Peel 2,739 2,911 3,295 3,688 3,660 3,829 3,819 3,785 4,280 5,093
Castletown 2,378 2,671 2,788 3,141 3,019 3,152 2,958 3,100 3,109 3,097
Village Districts:
Port Erin 1,316 1,543 2,356 2,812 2,868 3,024 3,218 3,369 3,575 3,530
Port St. Mary 1,403 1,411 1,525 1,572 1,610 1,762 1,874 1,941 1,913 1,953
Laxey 1,129 1,127 1,242 1,257 1,279 1,367 1,433 1,725 1,768 1,705
Onchan 3,999 4,958 6,809 7,879 7,949 8,483 8,656 8,803 9,172 9,273
Parish Districts:
Andreas 732 805 949 1,113 1,115 1,156 1,144 1,152 1,381 1,426
Arbory 689 852 1,414 1,651 1,610 1,661 1,622 1,714 1,723 1,747
Ballaugh 505 498 655 681 745 802 812 868 1,042 1,042
Braddan 1,929 1,994 2,095 2,520 1,804 2,046 2,527 2,665 3,151 3,586
Bride 359 320 428 413 378 418 405 408 418 401
German 690 729 866 1,029 1,051 1,025 1,038 1,010 995 1,024
Jurby 469 535 640 616 582 682 624 677 659 797
Lezayre 1,455 1,097 1,339 1,468 1,362 1,503 1,047 1,134 1,237 1,282
Lonan 985 1,045 1,129 1,126 1,139 1,232 1,292 1,393 1,563 1,533
Malew 1,447 1,841 2,116 2,080 2,054 2,216 2,140 2,262 2,304 2,385
Marown 908 967 1,230 1,290 1,281 1,553 1,564 1,879 2,086 2,311
Maughold 843 689 763 759 755 828 858 941 950 977
Michael 705 770 839 977 1,044 1,244 1,261 1,431 1,640 1,729
Patrick 946 985 1,078 1,077 1,044 1,192 1,198 1,305 1,294 1,527
Rushen 997 1,141 1,274 1,341 1,360 1,446 1,441 1,504 1,591 1,629
Santon 403 369 397 427 427 457 422 580 680 691
Total 50,423 53,228 60,496 64,679 64,282 69,788 71,714 76,315 80,058 84,497
Source: Cabinet Office
34
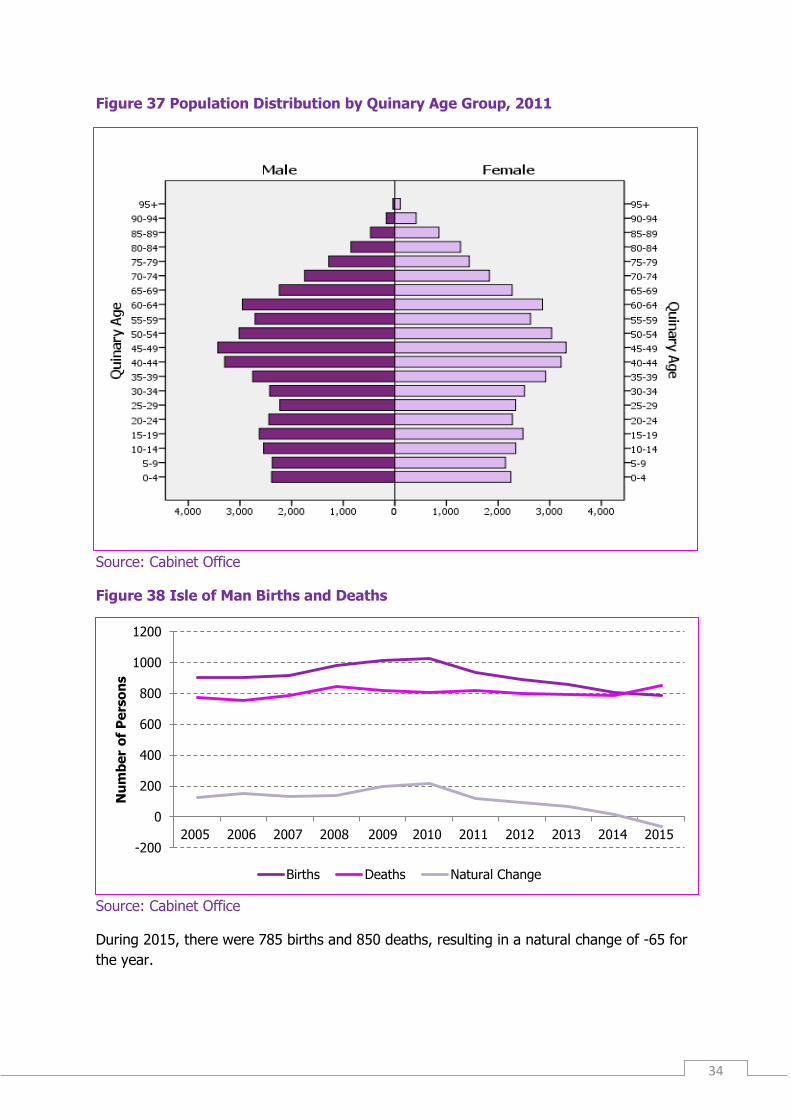
Figure 37 Population Distribution by Quinary Age Group, 2011
Source: Cabinet Office
Figure 38 Isle of Man Births and Deaths
Source: Cabinet Office
During 2015, there were 785 births and 850 deaths, resulting in a natural change of -65 for
the year.
-200
0
200
400
600
800
1000
1200
2005 2006 2007 2008 2009 2010 2011 2012 2013 2014 2015
Nu
mb
er
of
Pe
rso
ns
Births Deaths Natural Change

35
Figure 39 Registered Electors
Source: Cabinet Office
As at 1 January 2016, there were 49,204 registered electors on the Isle of Man.
Table 15 Households by Tenure, 2011
Tenure Number of households Percentage
Buying property (mortgage or loan) 11,446 32
Owning property outright 12,010 34
Renting from government or local authority 5,839 16
Renting from private sector 5,753 16
Renting from employer 221 1
Other 330 1
Total 35,599 100
Source: Cabinet Office
40,000
45,000
50,000
55,000
60,000
65,000
Re
gis
tere
d E
lecto
rs

36
Table 16 Households by Area, 2011
Area 1991 1996 2001 2006 2011
Towns: Douglas 8,447 9,512 10,332 10,835 11,702
Ramsey 2,740 3,054 3,281 3,253 3,530
Peel 1,462 1,529 1,522 1,807 2,168
Castletown 1,237 1,225 1,284 1,291 1,353
Village Districts: Port Erin 1,240 1,369 1,478 1,577 1,631
Port St. Mary 710 788 803 848 860
Laxey 584 614 715 726 716
Onchan 3,349 3,532 3,680 3,882 3,993
Parish Districts Andreas 455 482 481 575 595
Arbory 684 685 730 737 758
Ballaugh 346 362 387 439 438
Braddan 687 896 1,000 1,227 1,350
Bride 170 165 170 176 168
German 398 417 407 406 433
Jurby 234 229 243 241 264
Lezayre 622 439 471 500 510
Lonan 502 532 556 627 621
Malew 852 863 914 936 977
Marown 600 630 744 811 885
Maughold 349 361 383 393 403
Michael 454 470 556 670 682
Patrick 444 458 516 506 604
Rushen 588 599 630 651 675
Santon 162 166 238 276 283
Total 27,316 29,377 31,521 33,390 35,599
Source: Cabinet Office
37
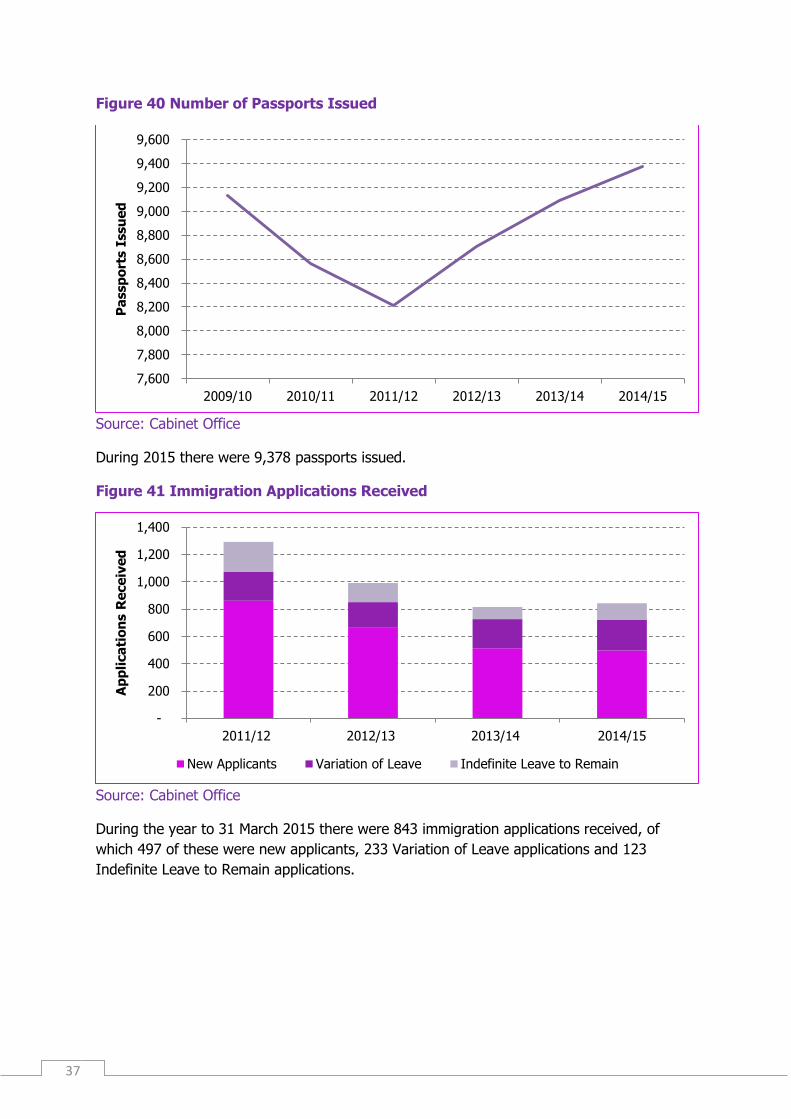
Figure 40 Number of Passports Issued
Source: Cabinet Office
During 2015 there were 9,378 passports issued.
Figure 41 Immigration Applications Received
Source: Cabinet Office
During the year to 31 March 2015 there were 843 immigration applications received, of
which 497 of these were new applicants, 233 Variation of Leave applications and 123
Indefinite Leave to Remain applications.
7,600
7,800
8,000
8,200
8,400
8,600
8,800
9,000
9,200
9,400
9,600
2009/10 2010/11 2011/12 2012/13 2013/14 2014/15
Pa
ssp
ort
s I
ssu
ed
-
200
400
600
800
1,000
1,200
1,400
2011/12 2012/13 2013/14 2014/15
Ap
pli
ca
tio
ns R
ece
ive
d
New Applicants Variation of Leave Indefinite Leave to Remain
38
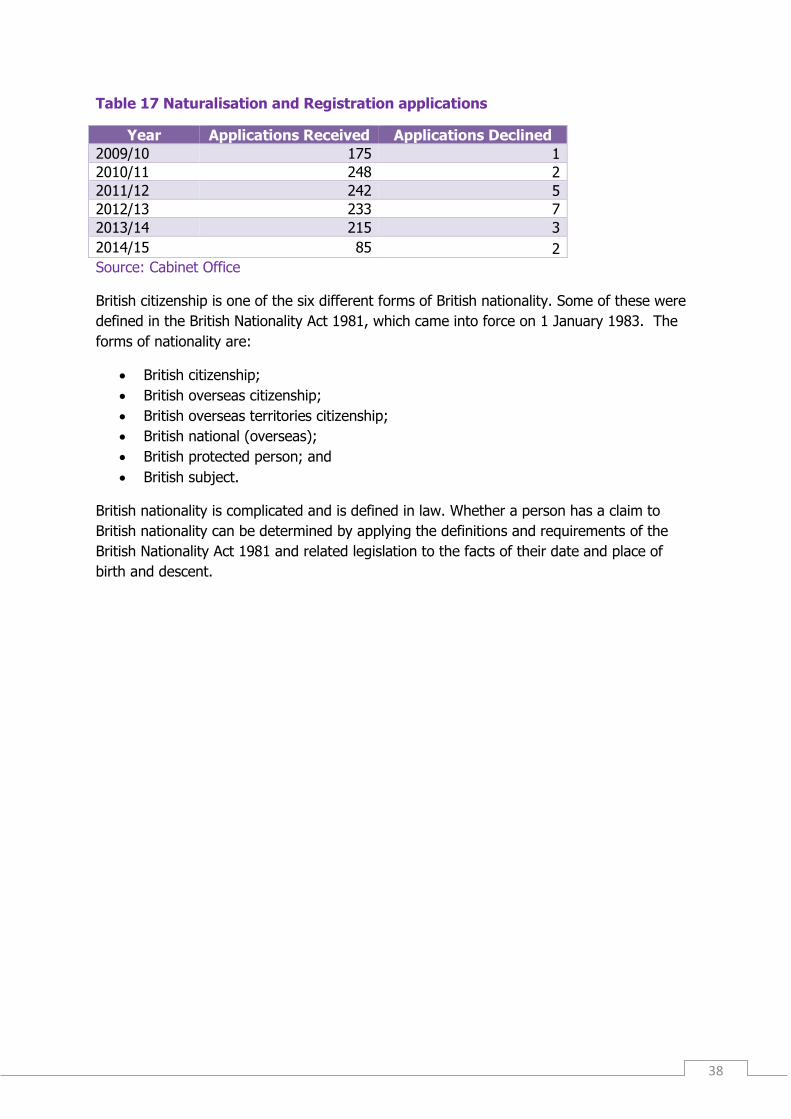
Table 17 Naturalisation and Registration applications
Year Applications Received Applications Declined
2009/10 175 1
2010/11 248 2
2011/12 242 5
2012/13 233 7
2013/14 215 3
2014/15 85 2
Source: Cabinet Office
British citizenship is one of the six different forms of British nationality. Some of these were
defined in the British Nationality Act 1981, which came into force on 1 January 1983. The
forms of nationality are:
British citizenship;
British overseas citizenship;
British overseas territories citizenship;
British national (overseas);
British protected person; and
British subject.
British nationality is complicated and is defined in law. Whether a person has a claim to
British nationality can be determined by applying the definitions and requirements of the
British Nationality Act 1981 and related legislation to the facts of their date and place of
birth and descent.
39
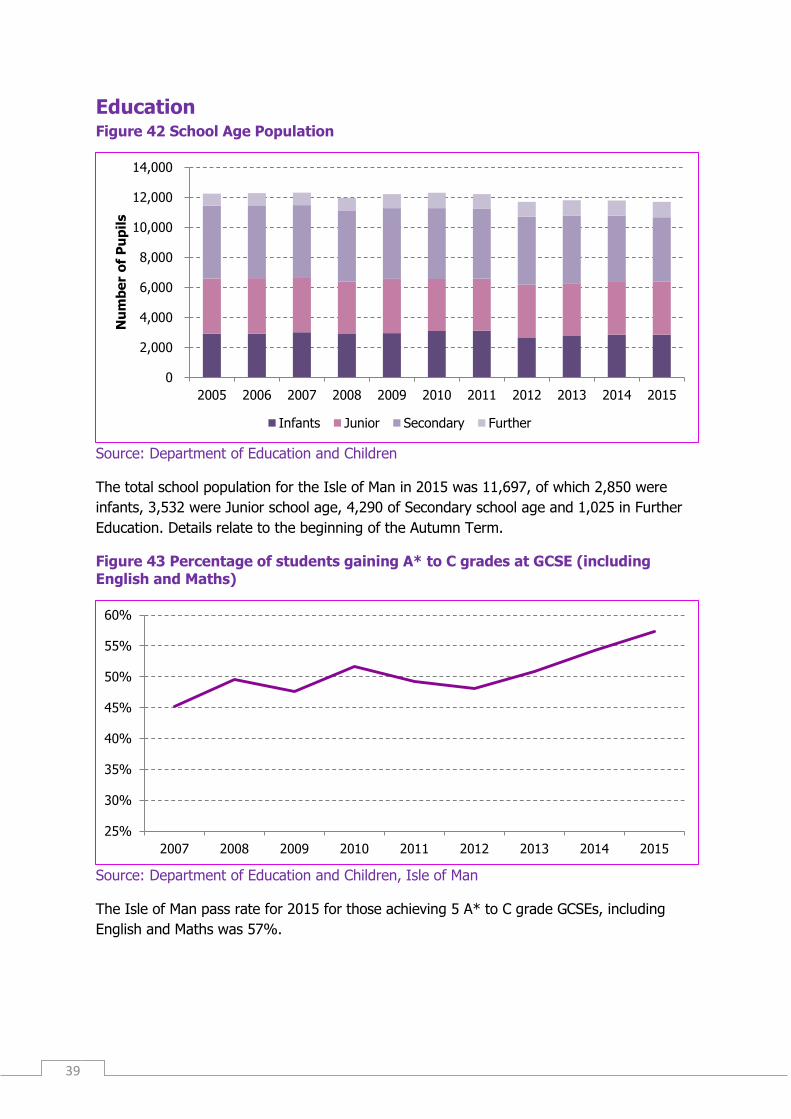
Education Figure 42 School Age Population
Source: Department of Education and Children
The total school population for the Isle of Man in 2015 was 11,697, of which 2,850 were
infants, 3,532 were Junior school age, 4,290 of Secondary school age and 1,025 in Further
Education. Details relate to the beginning of the Autumn Term.
Figure 43 Percentage of students gaining A* to C grades at GCSE (including English and Maths)
Source: Department of Education and Children, Isle of Man
The Isle of Man pass rate for 2015 for those achieving 5 A* to C grade GCSEs, including
English and Maths was 57%.
0
2,000
4,000
6,000
8,000
10,000
12,000
14,000
2005 2006 2007 2008 2009 2010 2011 2012 2013 2014 2015
Nu
mb
er
of
Pu
pil
s
Infants Junior Secondary Further
25%
30%
35%
40%
45%
50%
55%
60%
2007 2008 2009 2010 2011 2012 2013 2014 2015
40
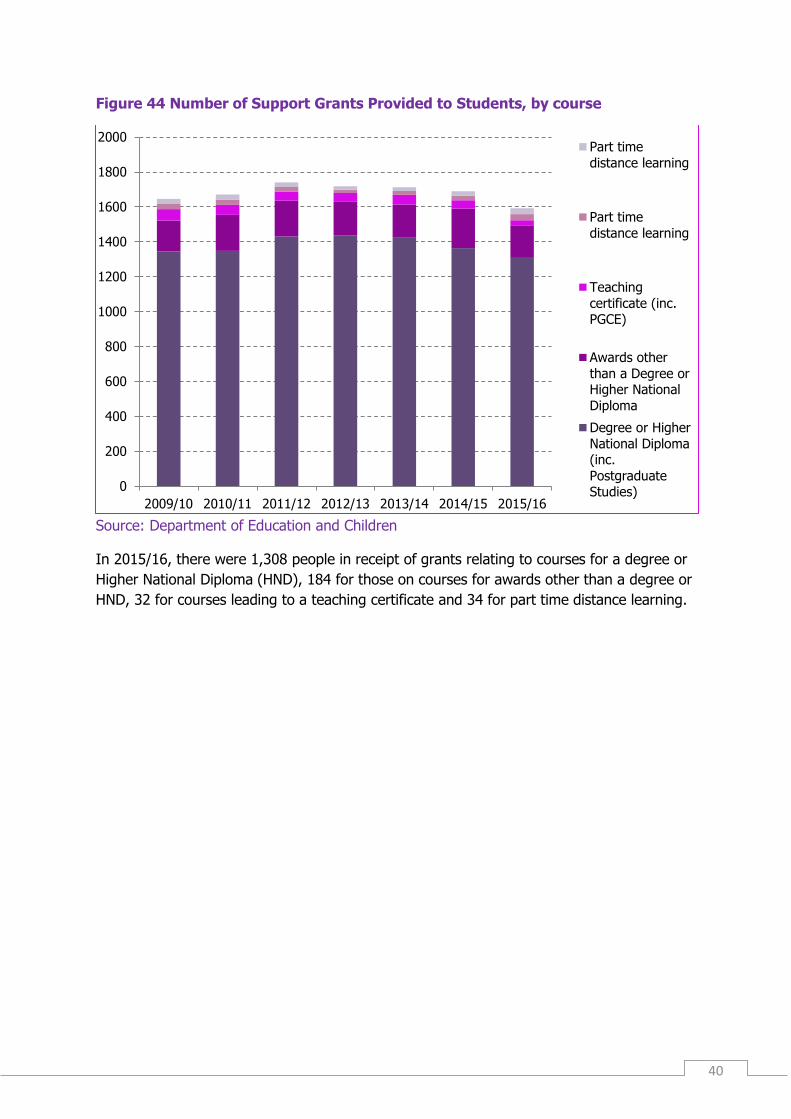
Figure 44 Number of Support Grants Provided to Students, by course
Source: Department of Education and Children
In 2015/16, there were 1,308 people in receipt of grants relating to courses for a degree or
Higher National Diploma (HND), 184 for those on courses for awards other than a degree or
HND, 32 for courses leading to a teaching certificate and 34 for part time distance learning.
0
200
400
600
800
1000
1200
1400
1600
1800
2000
2009/10 2010/11 2011/12 2012/13 2013/14 2014/15 2015/16
Part time
distance learning
Part time
distance learning
Teaching
certificate (inc.PGCE)
Awards other
than a Degree orHigher National
Diploma
Degree or Higher
National Diploma(inc.
PostgraduateStudies)

41
Health and Medicine Table 18 General Practitioners and Patients
Year
Number of General
Practitioners
Number of patients on
lists
Average number of patients per practitioner
Number of patients over 65
2004 43.75 80,272 1,835 13,260
2005 44.75 82,038 1,833 13,486
2006 44.75 82,771 1,850 13,670
2007 45.75 83,987 1,836 13,944
2008 46.25 84,689 1,831 14,251
2009 47.25 85,826 1,962 14,498
2010 46.25 86,476 1,870 14,835
2011 46.95 86,925 1,851 14,946
2012 44.95 87,048 1,936 15,484
2013 45.8 87,195 1,903 16,244
2014 45.35 87,140 1,921 16,692
2015 46.5 87,026 1,871 17,132
Source: Department of Health and Social Care
The number of General Practitioners refers to full time equivalents and all figures are recorded at 31 March.
Figure 45 Noble's and Ramsey Cottage Hospital Activity (excluding Private Patients)
Source: Department of Health and Social Care
During the year to 31 March 2015, there were 74,762 consultant led outpatient attendances,
40,307 accident and emergency attendances and 20,130 hospital admissions.
0
10,000
20,000
30,000
40,000
50,000
60,000
70,000
80,000
2009/10 2010/11 201/12 2012/13 2013/14 2014/15
Att
en
da
nce
s /
Ad
mis
sio
ns
Consultant Led Outpatient Attendances
A&E Attendances (including Ramsey Minor Injuries Unit)
Hospital Admissions (including Day Cases)
42
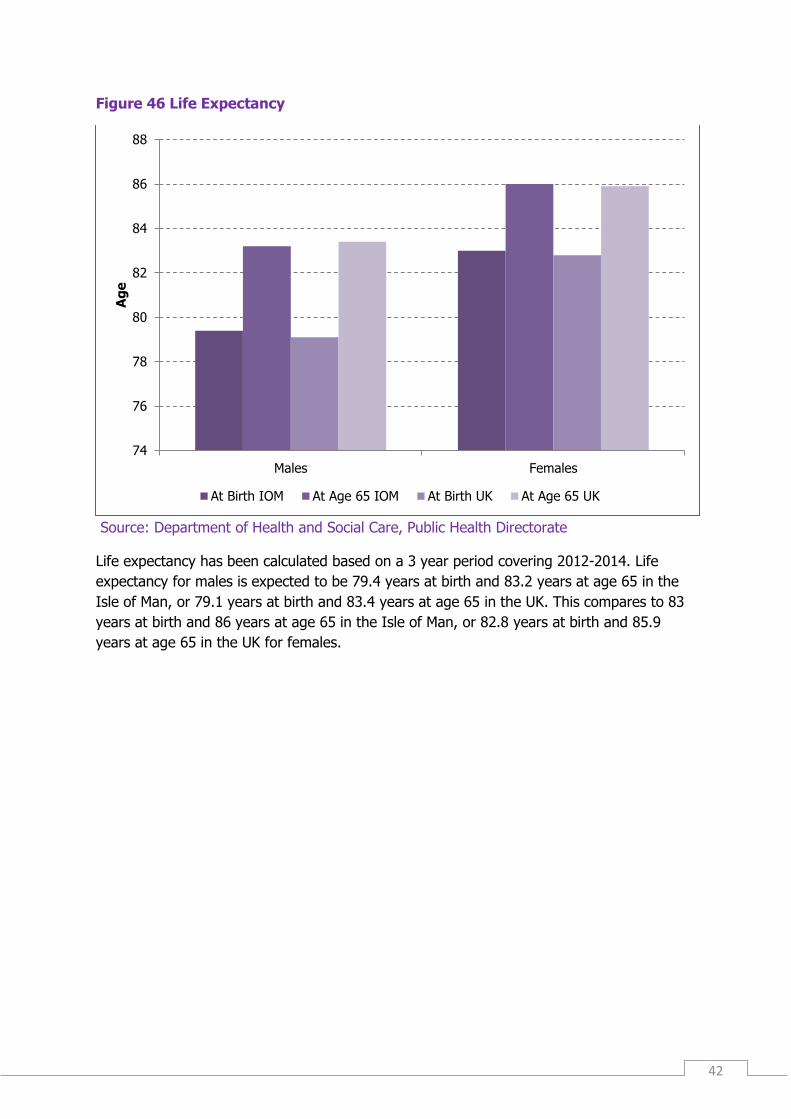
Figure 46 Life Expectancy
Source: Department of Health and Social Care, Public Health Directorate
Life expectancy has been calculated based on a 3 year period covering 2012-2014. Life
expectancy for males is expected to be 79.4 years at birth and 83.2 years at age 65 in the
Isle of Man, or 79.1 years at birth and 83.4 years at age 65 in the UK. This compares to 83
years at birth and 86 years at age 65 in the Isle of Man, or 82.8 years at birth and 85.9
years at age 65 in the UK for females.
74
76
78
80
82
84
86
88
Males Females
Ag
e
At Birth IOM At Age 65 IOM At Birth UK At Age 65 UK
43
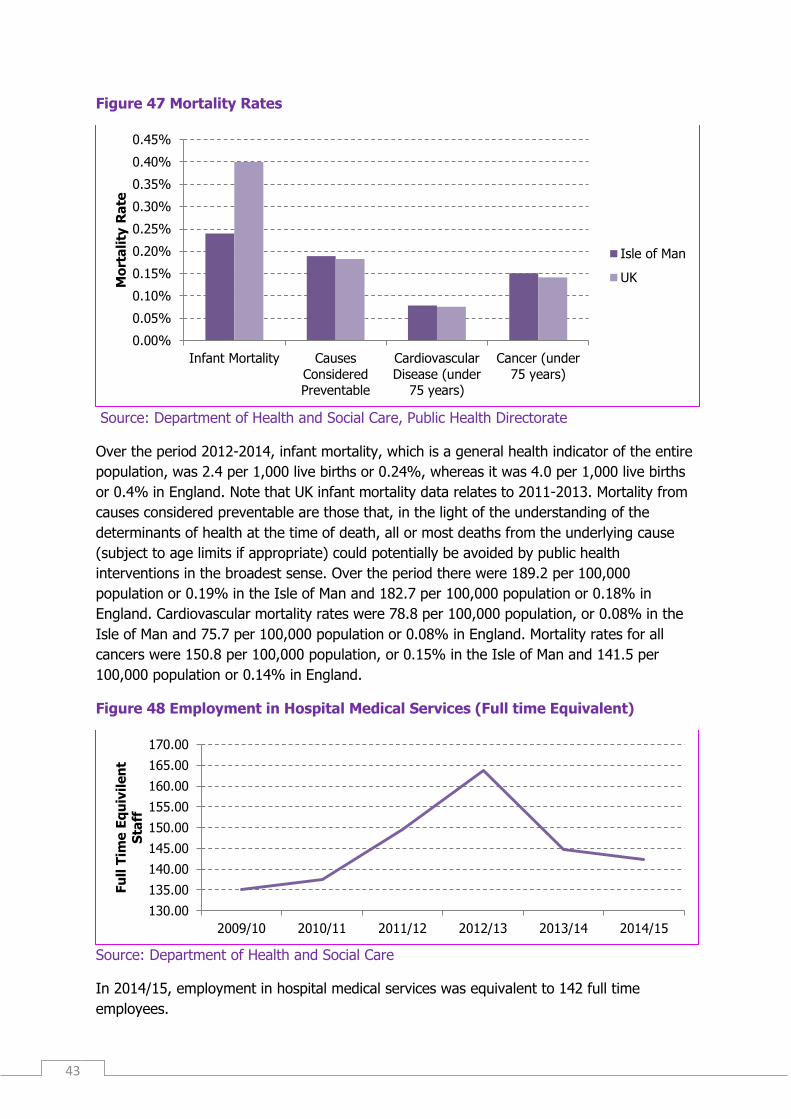
Figure 47 Mortality Rates
Source: Department of Health and Social Care, Public Health Directorate
Over the period 2012-2014, infant mortality, which is a general health indicator of the entire
population, was 2.4 per 1,000 live births or 0.24%, whereas it was 4.0 per 1,000 live births
or 0.4% in England. Note that UK infant mortality data relates to 2011-2013. Mortality from
causes considered preventable are those that, in the light of the understanding of the
determinants of health at the time of death, all or most deaths from the underlying cause
(subject to age limits if appropriate) could potentially be avoided by public health
interventions in the broadest sense. Over the period there were 189.2 per 100,000
population or 0.19% in the Isle of Man and 182.7 per 100,000 population or 0.18% in
England. Cardiovascular mortality rates were 78.8 per 100,000 population, or 0.08% in the
Isle of Man and 75.7 per 100,000 population or 0.08% in England. Mortality rates for all
cancers were 150.8 per 100,000 population, or 0.15% in the Isle of Man and 141.5 per
100,000 population or 0.14% in England.
Figure 48 Employment in Hospital Medical Services (Full time Equivalent)
Source: Department of Health and Social Care
In 2014/15, employment in hospital medical services was equivalent to 142 full time
employees.
0.00%
0.05%
0.10%
0.15%
0.20%
0.25%
0.30%
0.35%
0.40%
0.45%
Infant Mortality Causes
ConsideredPreventable
Cardiovascular
Disease (under75 years)
Cancer (under
75 years)
Mo
rta
lity
Ra
te
Isle of Man
UK
130.00
135.00
140.00
145.00
150.00
155.00
160.00
165.00
170.00
2009/10 2010/11 2011/12 2012/13 2013/14 2014/15
Fu
ll T
ime
Eq
uiv
ile
nt
Sta
ff
44
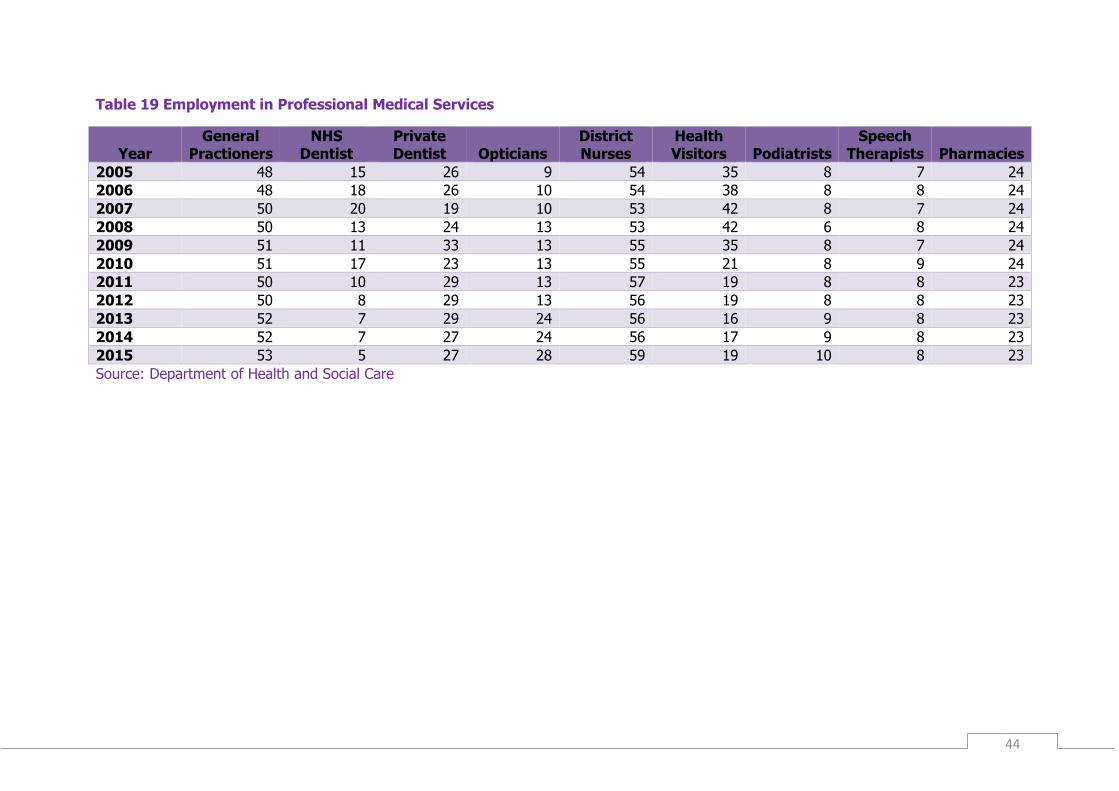
Table 19 Employment in Professional Medical Services
Year General
Practioners NHS
Dentist Private Dentist Opticians
District Nurses
Health Visitors Podiatrists
Speech Therapists Pharmacies
2005 48 15 26 9 54 35 8 7 24
2006 48 18 26 10 54 38 8 8 24
2007 50 20 19 10 53 42 8 7 24
2008 50 13 24 13 53 42 6 8 24
2009 51 11 33 13 55 35 8 7 24
2010 51 17 23 13 55 21 8 9 24
2011 50 10 29 13 57 19 8 8 23
2012 50 8 29 13 56 19 8 8 23
2013 52 7 29 24 56 16 9 8 23
2014 52 7 27 24 56 17 9 8 23
2015 53 5 27 28 59 19 10 8 23
Source: Department of Health and Social Care

45
Keeping People Safe Figure 49 Offences against the Person
Source: Department of Home Affairs
During 2015, there were 351 crimes recorded as Offences against the Person, with 214 of
these being detected. Crimes detected are defined as a recorded crime where one or more
persons have been identified and linked to the crime as subjects. Whilst this often results in
them being charged, it does not necessarily mean they are convicted.
Figure 50 Sexual Offences
Source: Department of Home Affairs
During 2015, there were 72 crimes recorded as Sexual Offences, with 25 of these being
detected.
0
100
200
300
400
500
600
700
800
2005 2006 2007 2008 2009 2010 2011 2012 2013 2014 2015
Nu
mb
er
of
Off
en
ce
s
Crimes recorded Crimes detected
0
10
20
30
40
50
60
70
80
2005 2006 2007 2008 2009 2010 2011 2012 2013 2014 2015
Nu
mb
er
of
Off
en
ce
s
Crimes recorded Crimes detected
46
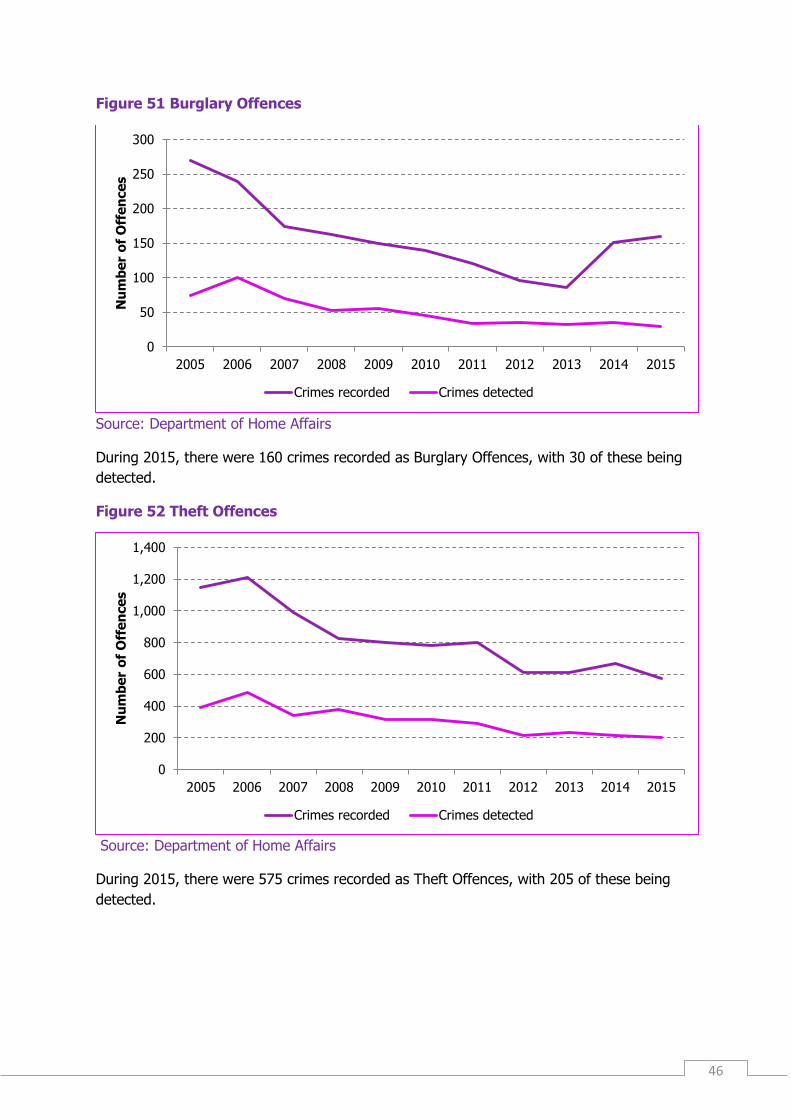
Figure 51 Burglary Offences
Source: Department of Home Affairs
During 2015, there were 160 crimes recorded as Burglary Offences, with 30 of these being
detected.
Figure 52 Theft Offences
Source: Department of Home Affairs
During 2015, there were 575 crimes recorded as Theft Offences, with 205 of these being
detected.
0
50
100
150
200
250
300
2005 2006 2007 2008 2009 2010 2011 2012 2013 2014 2015
Nu
mb
er
of
Off
en
ce
s
Crimes recorded Crimes detected
0
200
400
600
800
1,000
1,200
1,400
2005 2006 2007 2008 2009 2010 2011 2012 2013 2014 2015
Nu
mb
er
of
Off
en
ce
s
Crimes recorded Crimes detected
47
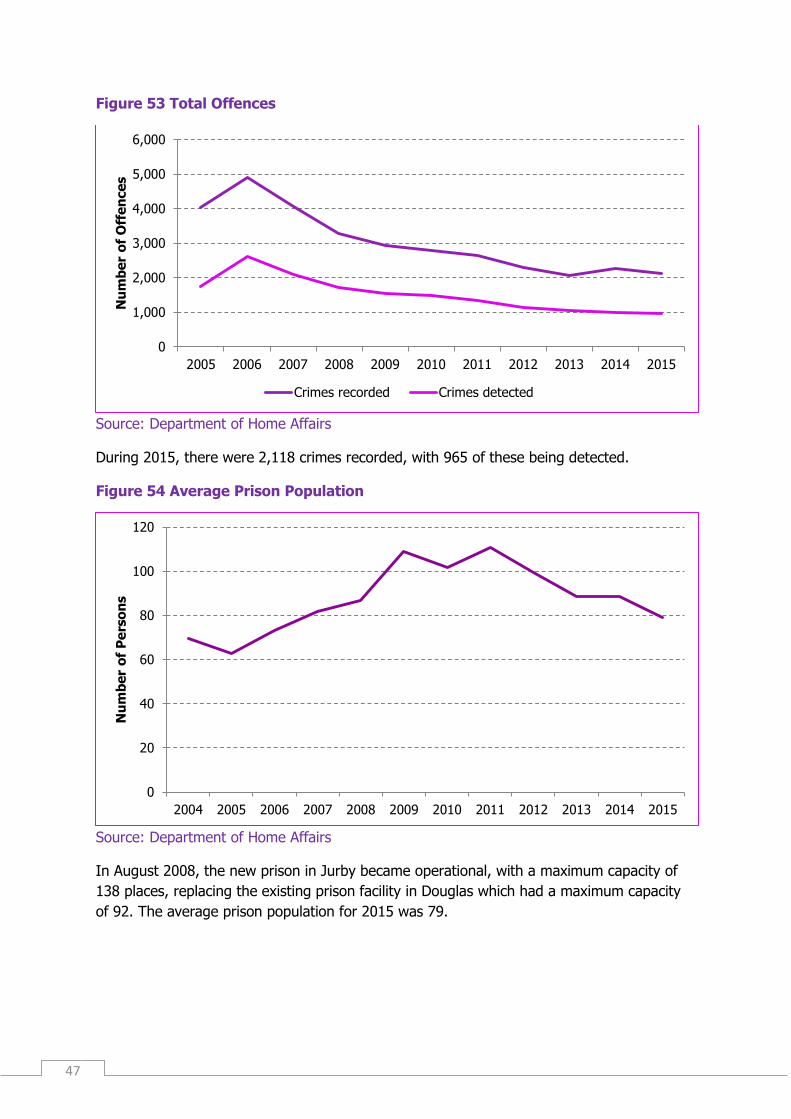
Figure 53 Total Offences
Source: Department of Home Affairs
During 2015, there were 2,118 crimes recorded, with 965 of these being detected.
Figure 54 Average Prison Population
Source: Department of Home Affairs
In August 2008, the new prison in Jurby became operational, with a maximum capacity of
138 places, replacing the existing prison facility in Douglas which had a maximum capacity
of 92. The average prison population for 2015 was 79.
0
1,000
2,000
3,000
4,000
5,000
6,000
2005 2006 2007 2008 2009 2010 2011 2012 2013 2014 2015
Nu
mb
er
of
Off
en
ce
s
Crimes recorded Crimes detected
0
20
40
60
80
100
120
2004 2005 2006 2007 2008 2009 2010 2011 2012 2013 2014 2015
Nu
mb
er
of
Pe
rso
ns
48
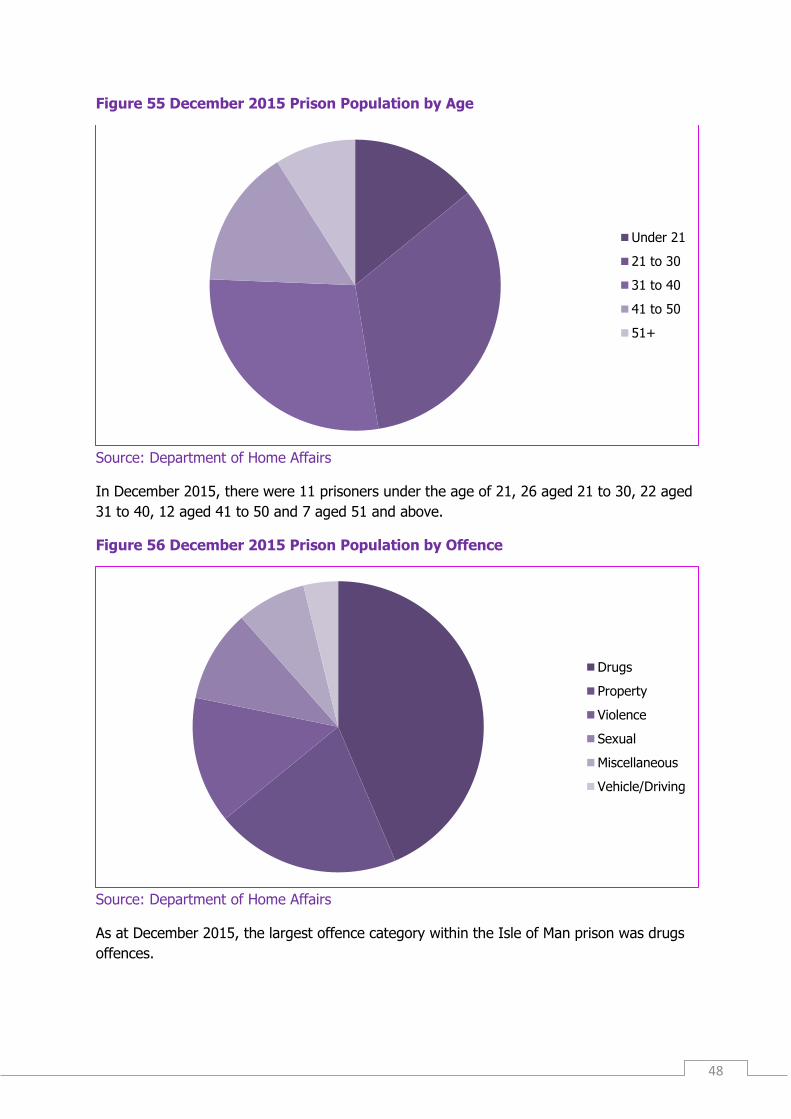
Figure 55 December 2015 Prison Population by Age
Source: Department of Home Affairs
In December 2015, there were 11 prisoners under the age of 21, 26 aged 21 to 30, 22 aged
31 to 40, 12 aged 41 to 50 and 7 aged 51 and above.
Figure 56 December 2015 Prison Population by Offence
Source: Department of Home Affairs
As at December 2015, the largest offence category within the Isle of Man prison was drugs
offences.
Under 21
21 to 30
31 to 40
41 to 50
51+
Drugs
Property
Violence
Sexual
Miscellaneous
Vehicle/Driving

49
Figure 57 December 2015 Prison Population by Length of Sentence
Source: Department of Home Affairs
In December 2015 there were 25 people serving sentences of 4 to 10 years in length.
Un-sentenced
1 to 6 months
6 to 12 months
1 to 4 years
4 to 10 years
10 years +
50
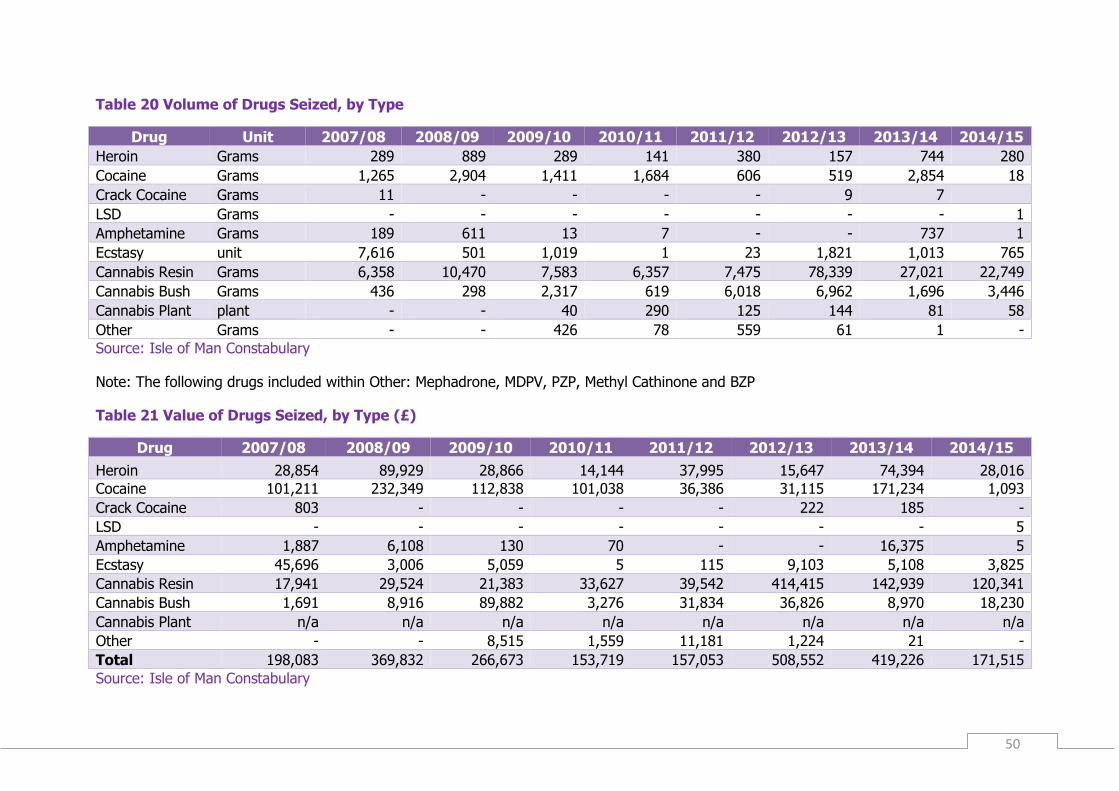
Table 20 Volume of Drugs Seized, by Type
Drug Unit 2007/08 2008/09 2009/10 2010/11 2011/12 2012/13 2013/14 2014/15
Heroin Grams 289 889 289 141 380 157 744 280
Cocaine Grams 1,265 2,904 1,411 1,684 606 519 2,854 18
Crack Cocaine Grams 11 - - - - 9 7 LSD Grams - - - - - - - 1
Amphetamine Grams 189 611 13 7 - - 737 1
Ecstasy unit 7,616 501 1,019 1 23 1,821 1,013 765
Cannabis Resin Grams 6,358 10,470 7,583 6,357 7,475 78,339 27,021 22,749
Cannabis Bush Grams 436 298 2,317 619 6,018 6,962 1,696 3,446
Cannabis Plant plant - - 40 290 125 144 81 58
Other Grams - - 426 78 559 61 1 -
Source: Isle of Man Constabulary
Note: The following drugs included within Other: Mephadrone, MDPV, PZP, Methyl Cathinone and BZP
Table 21 Value of Drugs Seized, by Type (£)
Drug 2007/08 2008/09 2009/10 2010/11 2011/12 2012/13 2013/14 2014/15
Heroin 28,854 89,929 28,866 14,144 37,995 15,647 74,394 28,016
Cocaine 101,211 232,349 112,838 101,038 36,386 31,115 171,234 1,093
Crack Cocaine 803 - - - - 222 185 -
LSD - - - - - - - 5
Amphetamine 1,887 6,108 130 70 - - 16,375 5
Ecstasy 45,696 3,006 5,059 5 115 9,103 5,108 3,825
Cannabis Resin 17,941 29,524 21,383 33,627 39,542 414,415 142,939 120,341
Cannabis Bush 1,691 8,916 89,882 3,276 31,834 36,826 8,970 18,230
Cannabis Plant n/a n/a n/a n/a n/a n/a n/a n/a
Other - - 8,515 1,559 11,181 1,224 21 -
Total 198,083 369,832 266,673 153,719 157,053 508,552 419,226 171,515
Source: Isle of Man Constabulary
51
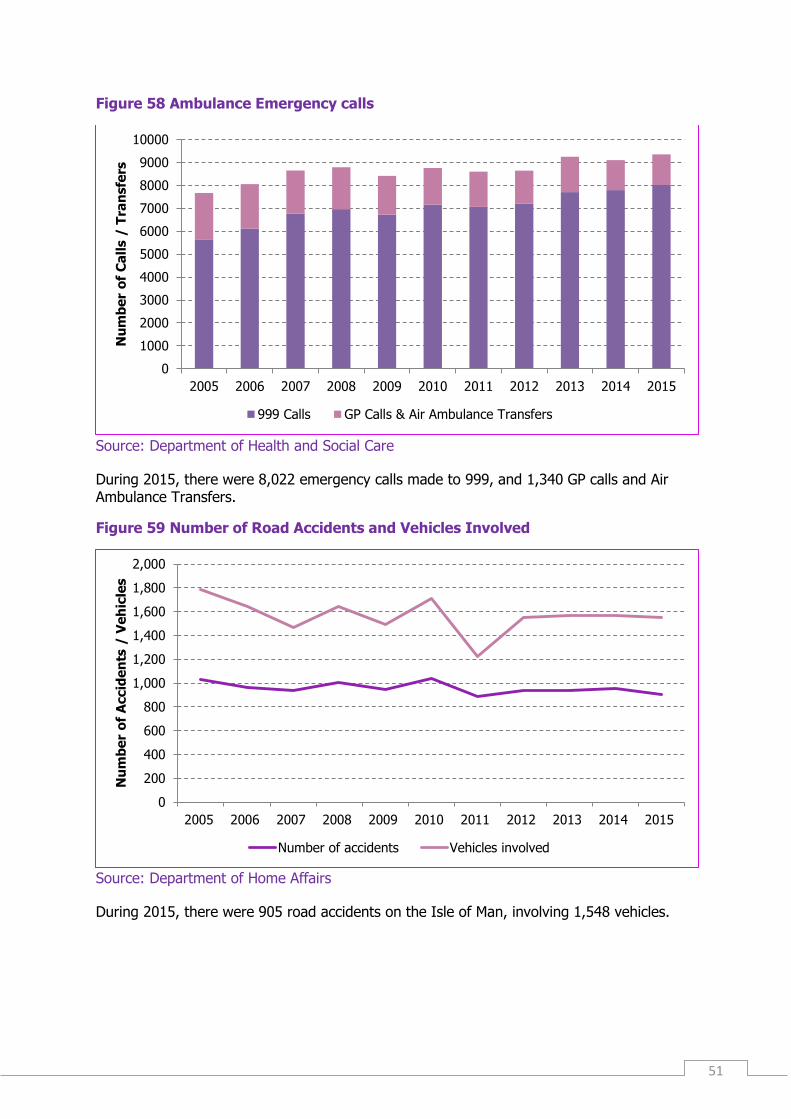
Figure 58 Ambulance Emergency calls
Source: Department of Health and Social Care
During 2015, there were 8,022 emergency calls made to 999, and 1,340 GP calls and Air Ambulance Transfers.
Figure 59 Number of Road Accidents and Vehicles Involved
Source: Department of Home Affairs
During 2015, there were 905 road accidents on the Isle of Man, involving 1,548 vehicles.
0
1000
2000
3000
4000
5000
6000
7000
8000
9000
10000
2005 2006 2007 2008 2009 2010 2011 2012 2013 2014 2015
Nu
mb
er
of
Ca
lls /
Tra
nsfe
rs
999 Calls GP Calls & Air Ambulance Transfers
0
200
400
600
800
1,000
1,200
1,400
1,600
1,800
2,000
2005 2006 2007 2008 2009 2010 2011 2012 2013 2014 2015
Nu
mb
er
of
Accid
en
ts /
Ve
hic
les
Number of accidents Vehicles involved
52
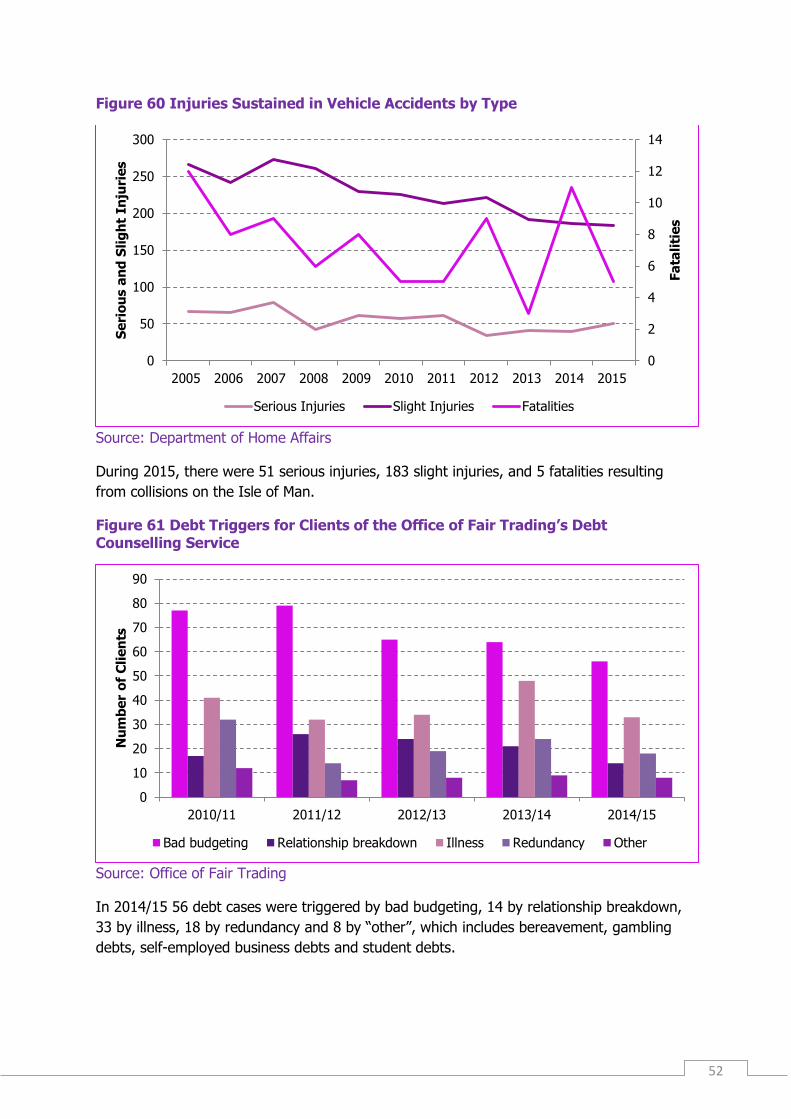
Figure 60 Injuries Sustained in Vehicle Accidents by Type
Source: Department of Home Affairs
During 2015, there were 51 serious injuries, 183 slight injuries, and 5 fatalities resulting
from collisions on the Isle of Man.
Figure 61 Debt Triggers for Clients of the Office of Fair Trading’s Debt Counselling Service
Source: Office of Fair Trading
In 2014/15 56 debt cases were triggered by bad budgeting, 14 by relationship breakdown,
33 by illness, 18 by redundancy and 8 by “other”, which includes bereavement, gambling
debts, self-employed business debts and student debts.
0
2
4
6
8
10
12
14
0
50
100
150
200
250
300
2005 2006 2007 2008 2009 2010 2011 2012 2013 2014 2015
Fa
tali
tie
s
Se
rio
us a
nd
Sli
gh
t In
juri
es
Serious Injuries Slight Injuries Fatalities
0
10
20
30
40
50
60
70
80
90
2010/11 2011/12 2012/13 2013/14 2014/15
Nu
mb
er
of
Cli
en
ts
Bad budgeting Relationship breakdown Illness Redundancy Other
53
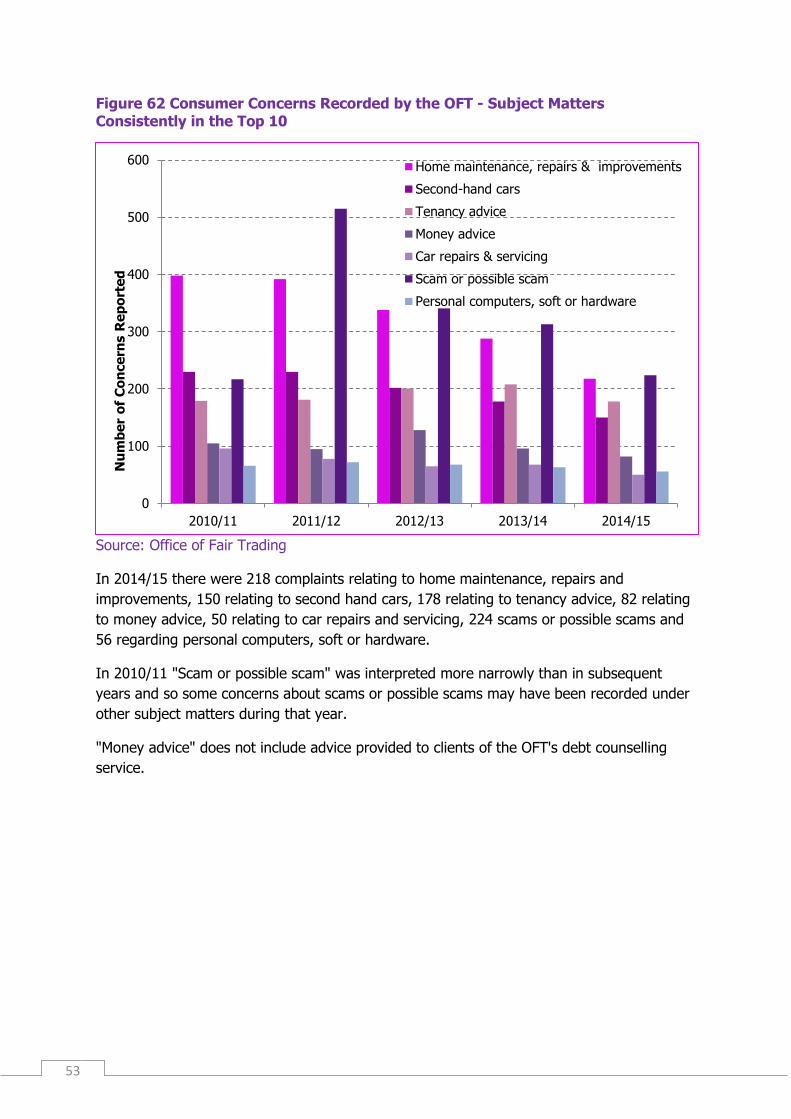
Figure 62 Consumer Concerns Recorded by the OFT - Subject Matters Consistently in the Top 10
Source: Office of Fair Trading
In 2014/15 there were 218 complaints relating to home maintenance, repairs and
improvements, 150 relating to second hand cars, 178 relating to tenancy advice, 82 relating
to money advice, 50 relating to car repairs and servicing, 224 scams or possible scams and
56 regarding personal computers, soft or hardware.
In 2010/11 "Scam or possible scam" was interpreted more narrowly than in subsequent
years and so some concerns about scams or possible scams may have been recorded under
other subject matters during that year.
"Money advice" does not include advice provided to clients of the OFT's debt counselling
service.
0
100
200
300
400
500
600
2010/11 2011/12 2012/13 2013/14 2014/15
Nu
mb
er
of
Co
nce
rns R
ep
ort
ed
Home maintenance, repairs & improvements
Second-hand cars
Tenancy advice
Money advice
Car repairs & servicing
Scam or possible scam
Personal computers, soft or hardware
54
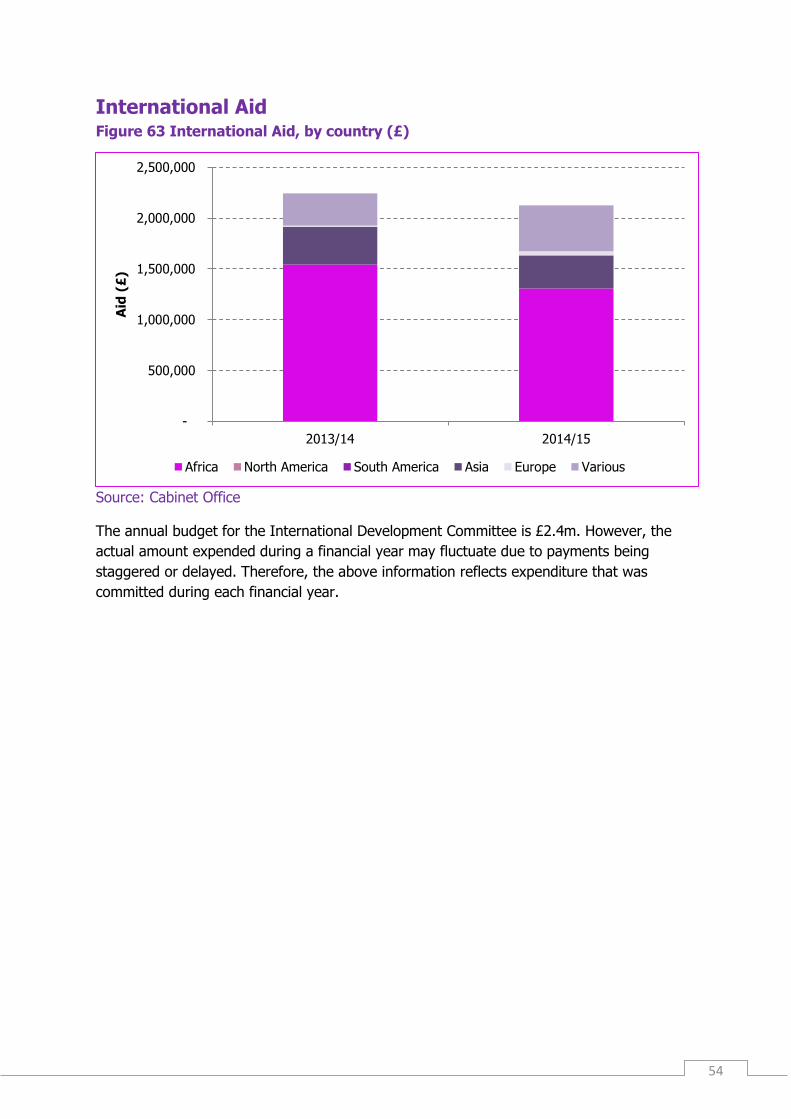
International Aid Figure 63 International Aid, by country (£)
Source: Cabinet Office
The annual budget for the International Development Committee is £2.4m. However, the
actual amount expended during a financial year may fluctuate due to payments being
staggered or delayed. Therefore, the above information reflects expenditure that was
committed during each financial year.
-
500,000
1,000,000
1,500,000
2,000,000
2,500,000
2013/14 2014/15
Aid
(£
)
Africa North America South America Asia Europe Various
55
Environment and Infrastructure
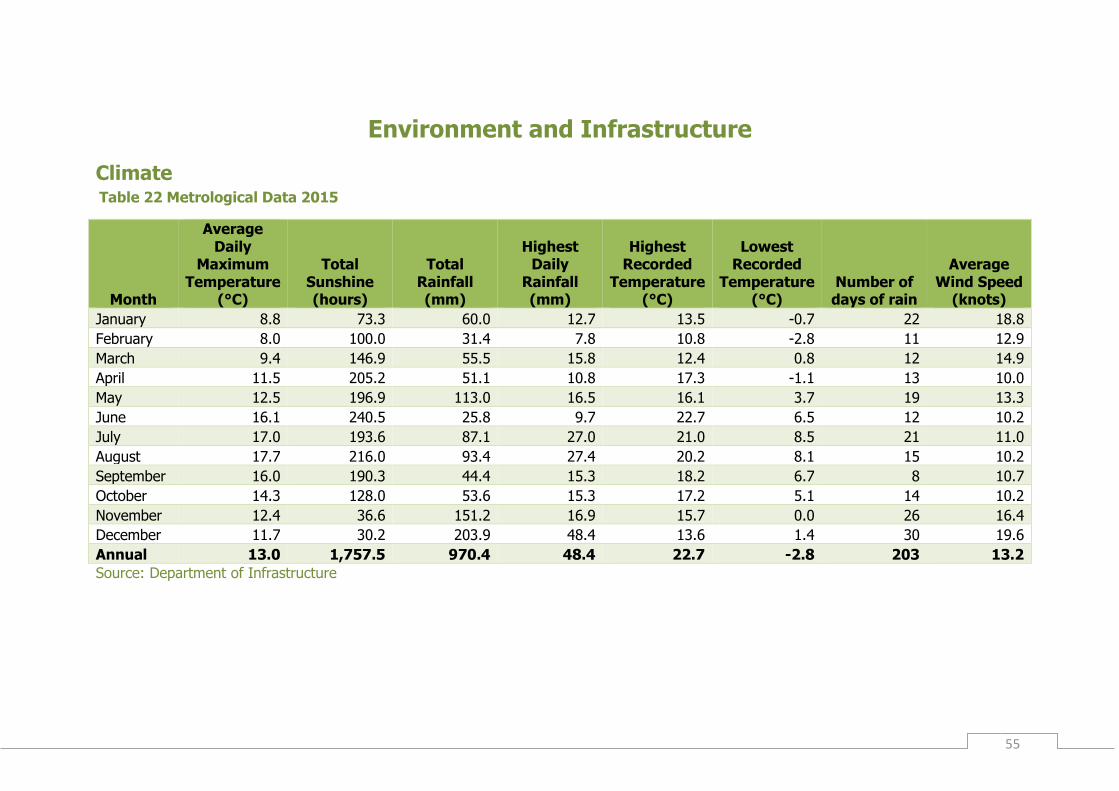
Climate Table 22 Metrological Data 2015
Month
Average Daily
Maximum Temperature
(°C)
Total Sunshine (hours)
Total Rainfall (mm)
Highest Daily
Rainfall (mm)
Highest Recorded
Temperature (°C)
Lowest Recorded
Temperature (°C)
Number of days of rain
Average Wind Speed
(knots)
January 8.8 73.3 60.0 12.7 13.5 -0.7 22 18.8
February 8.0 100.0 31.4 7.8 10.8 -2.8 11 12.9
March 9.4 146.9 55.5 15.8 12.4 0.8 12 14.9
April 11.5 205.2 51.1 10.8 17.3 -1.1 13 10.0
May 12.5 196.9 113.0 16.5 16.1 3.7 19 13.3
June 16.1 240.5 25.8 9.7 22.7 6.5 12 10.2
July 17.0 193.6 87.1 27.0 21.0 8.5 21 11.0
August 17.7 216.0 93.4 27.4 20.2 8.1 15 10.2
September 16.0 190.3 44.4 15.3 18.2 6.7 8 10.7
October 14.3 128.0 53.6 15.3 17.2 5.1 14 10.2
November 12.4 36.6 151.2 16.9 15.7 0.0 26 16.4
December 11.7 30.2 203.9 48.4 13.6 1.4 30 19.6
Annual 13.0 1,757.5 970.4 48.4 22.7 -2.8 203 13.2
Source: Department of Infrastructure
56
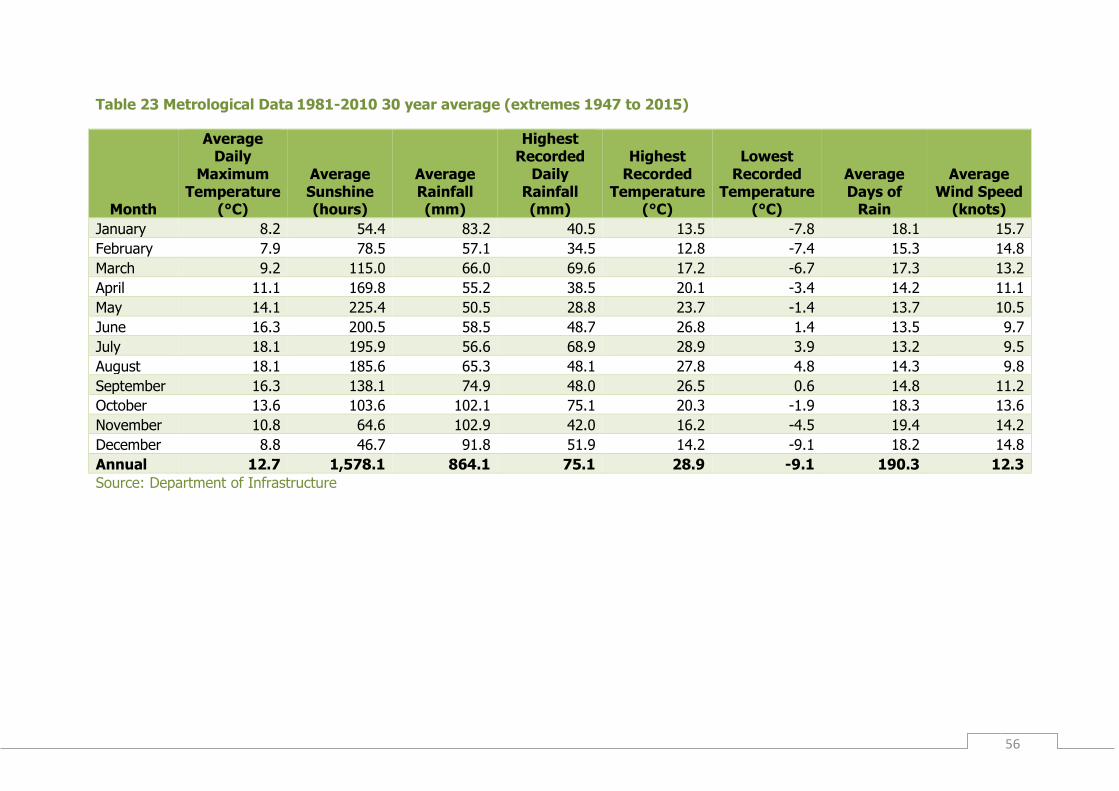
Table 23 Metrological Data 1981-2010 30 year average (extremes 1947 to 2015)
Month
Average Daily
Maximum Temperature
(°C)
Average Sunshine (hours)
Average Rainfall (mm)
Highest Recorded
Daily Rainfall (mm)
Highest Recorded
Temperature (°C)
Lowest Recorded
Temperature (°C)
Average Days of
Rain
Average Wind Speed
(knots)
January 8.2 54.4 83.2 40.5 13.5 -7.8 18.1 15.7
February 7.9 78.5 57.1 34.5 12.8 -7.4 15.3 14.8
March 9.2 115.0 66.0 69.6 17.2 -6.7 17.3 13.2
April 11.1 169.8 55.2 38.5 20.1 -3.4 14.2 11.1
May 14.1 225.4 50.5 28.8 23.7 -1.4 13.7 10.5
June 16.3 200.5 58.5 48.7 26.8 1.4 13.5 9.7
July 18.1 195.9 56.6 68.9 28.9 3.9 13.2 9.5
August 18.1 185.6 65.3 48.1 27.8 4.8 14.3 9.8
September 16.3 138.1 74.9 48.0 26.5 0.6 14.8 11.2
October 13.6 103.6 102.1 75.1 20.3 -1.9 18.3 13.6
November 10.8 64.6 102.9 42.0 16.2 -4.5 19.4 14.2
December 8.8 46.7 91.8 51.9 14.2 -9.1 18.2 14.8
Annual 12.7 1,578.1 864.1 75.1 28.9 -9.1 190.3 12.3
Source: Department of Infrastructure

57
Greenhouse Gas Emissions Figure 64 Greenhouse Gas Emissions, by Type
Source: Data compiled and prepared by Aether Limited, and provided by Department of
Environment, Food and Agriculture.
The most recent data available relating to emissions on the Isle of Man relates to 2013. In
March 2013, the Isle of Man adopted a target to reduce CO2 emissions by 80% by 2050,
which is in line with targets in the United Kingdom. In 2013, the Isle of Man produced 676
kilotonnes of CO2, 74 kilotonnes of methane, 34 kilotonnes of nitrous oxide and 25
kilotonnes of fluorinated gases (hydrofluorocarbons and sulphur hexafluoride).
-
100
200
300
400
500
600
700
800
900
1,000
2004 2005 2006 2007 2008 2009 2010 2011 2012 2013
Th
ou
sa
nd
s o
f to
nn
es o
f C
O2
eq
uiv
ale
nt
Fluorinated gases Nitrous Oxide Methane Carbon Dioxide
58
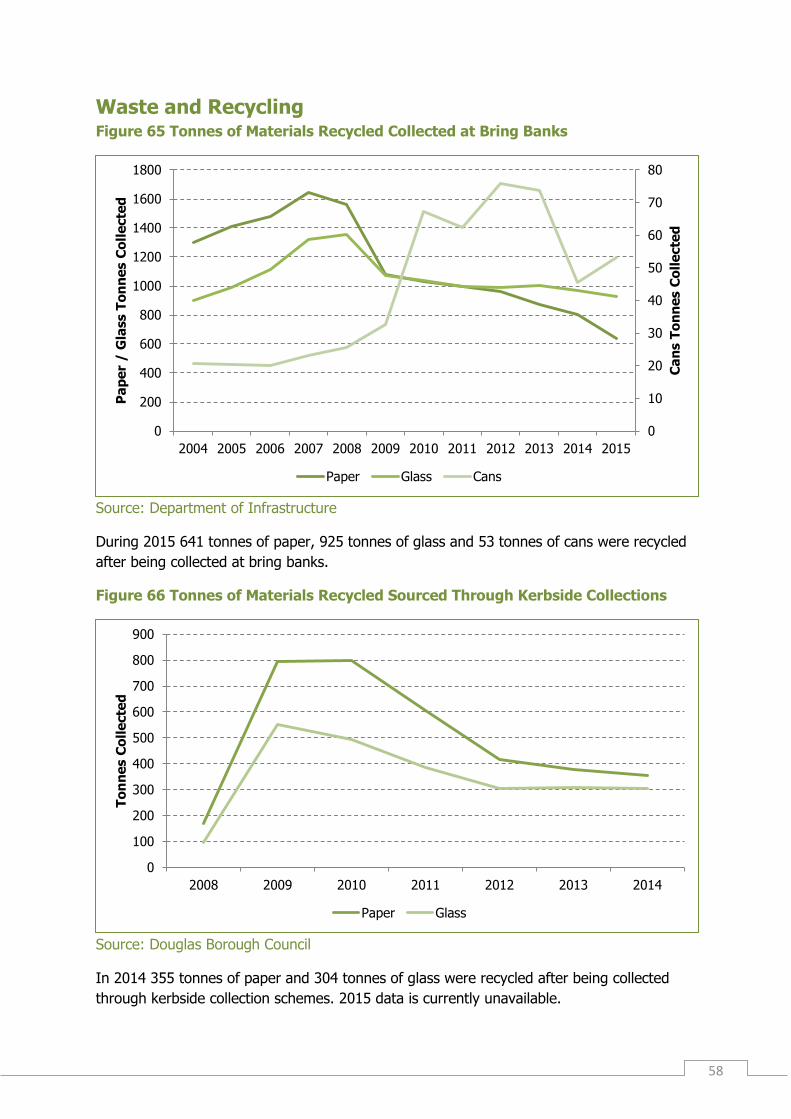
Waste and Recycling Figure 65 Tonnes of Materials Recycled Collected at Bring Banks
Source: Department of Infrastructure
During 2015 641 tonnes of paper, 925 tonnes of glass and 53 tonnes of cans were recycled
after being collected at bring banks.
Figure 66 Tonnes of Materials Recycled Sourced Through Kerbside Collections
Source: Douglas Borough Council
In 2014 355 tonnes of paper and 304 tonnes of glass were recycled after being collected
through kerbside collection schemes. 2015 data is currently unavailable.
0
10
20
30
40
50
60
70
80
0
200
400
600
800
1000
1200
1400
1600
1800
2004 2005 2006 2007 2008 2009 2010 2011 2012 2013 2014 2015
Ca
ns T
on
ne
s C
oll
ecte
d
Pa
pe
r / G
lass T
on
ne
s C
oll
ecte
d
Paper Glass Cans
0
100
200
300
400
500
600
700
800
900
2008 2009 2010 2011 2012 2013 2014
To
nn
es C
oll
ecte
d
Paper Glass
59
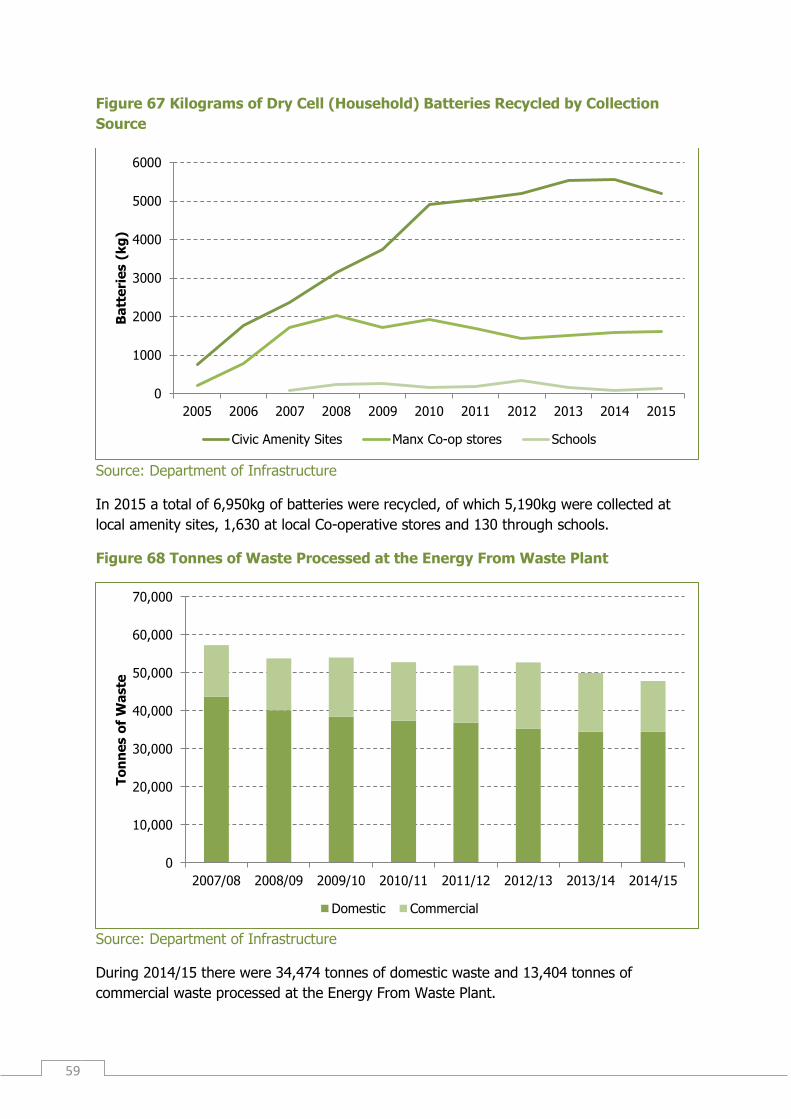
Figure 67 Kilograms of Dry Cell (Household) Batteries Recycled by Collection
Source
Source: Department of Infrastructure
In 2015 a total of 6,950kg of batteries were recycled, of which 5,190kg were collected at
local amenity sites, 1,630 at local Co-operative stores and 130 through schools.
Figure 68 Tonnes of Waste Processed at the Energy From Waste Plant
Source: Department of Infrastructure
During 2014/15 there were 34,474 tonnes of domestic waste and 13,404 tonnes of
commercial waste processed at the Energy From Waste Plant.
0
1000
2000
3000
4000
5000
6000
2005 2006 2007 2008 2009 2010 2011 2012 2013 2014 2015
Ba
tte
ries (
kg
)
Civic Amenity Sites Manx Co-op stores Schools
0
10,000
20,000
30,000
40,000
50,000
60,000
70,000
2007/08 2008/09 2009/10 2010/11 2011/12 2012/13 2013/14 2014/15
To
nn
es o
f W
aste
Domestic Commercial
60
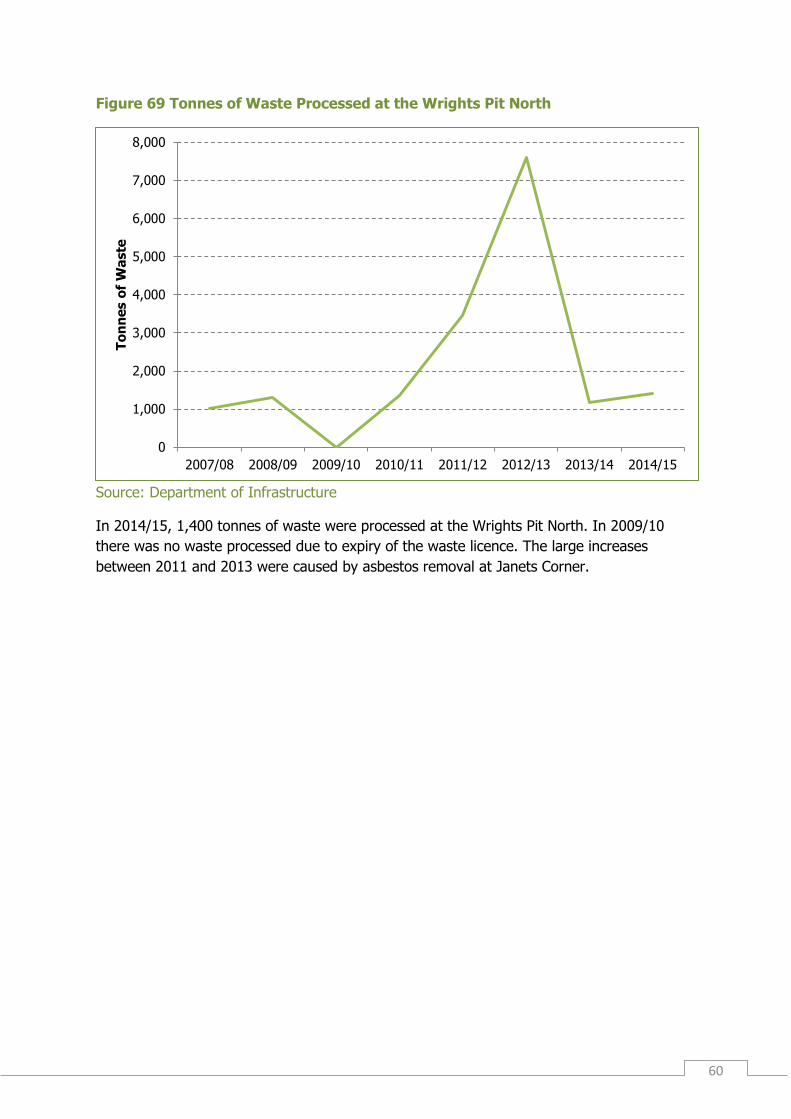
Figure 69 Tonnes of Waste Processed at the Wrights Pit North
Source: Department of Infrastructure
In 2014/15, 1,400 tonnes of waste were processed at the Wrights Pit North. In 2009/10
there was no waste processed due to expiry of the waste licence. The large increases
between 2011 and 2013 were caused by asbestos removal at Janets Corner.
0
1,000
2,000
3,000
4,000
5,000
6,000
7,000
8,000
2007/08 2008/09 2009/10 2010/11 2011/12 2012/13 2013/14 2014/15
To
nn
es o
f W
aste
61
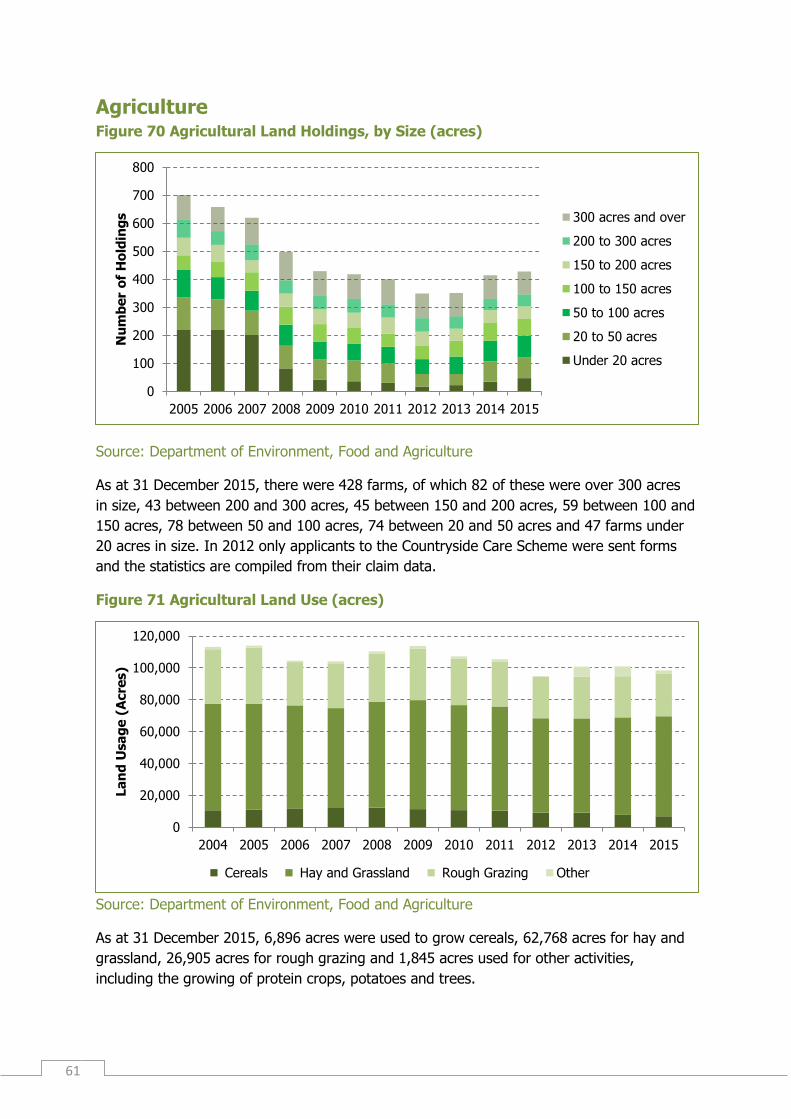
Agriculture Figure 70 Agricultural Land Holdings, by Size (acres)
Source: Department of Environment, Food and Agriculture
As at 31 December 2015, there were 428 farms, of which 82 of these were over 300 acres
in size, 43 between 200 and 300 acres, 45 between 150 and 200 acres, 59 between 100 and
150 acres, 78 between 50 and 100 acres, 74 between 20 and 50 acres and 47 farms under
20 acres in size. In 2012 only applicants to the Countryside Care Scheme were sent forms
and the statistics are compiled from their claim data.
Figure 71 Agricultural Land Use (acres)
Source: Department of Environment, Food and Agriculture
As at 31 December 2015, 6,896 acres were used to grow cereals, 62,768 acres for hay and
grassland, 26,905 acres for rough grazing and 1,845 acres used for other activities,
including the growing of protein crops, potatoes and trees.
0
100
200
300
400
500
600
700
800
2005 2006 2007 2008 2009 2010 2011 2012 2013 2014 2015
Nu
mb
er
of
Ho
ldin
gs
300 acres and over
200 to 300 acres
150 to 200 acres
100 to 150 acres
50 to 100 acres
20 to 50 acres
Under 20 acres
0
20,000
40,000
60,000
80,000
100,000
120,000
2004 2005 2006 2007 2008 2009 2010 2011 2012 2013 2014 2015
La
nd
Usa
ge
(A
cre
s)
Cereals Hay and Grassland Rough Grazing Other
62
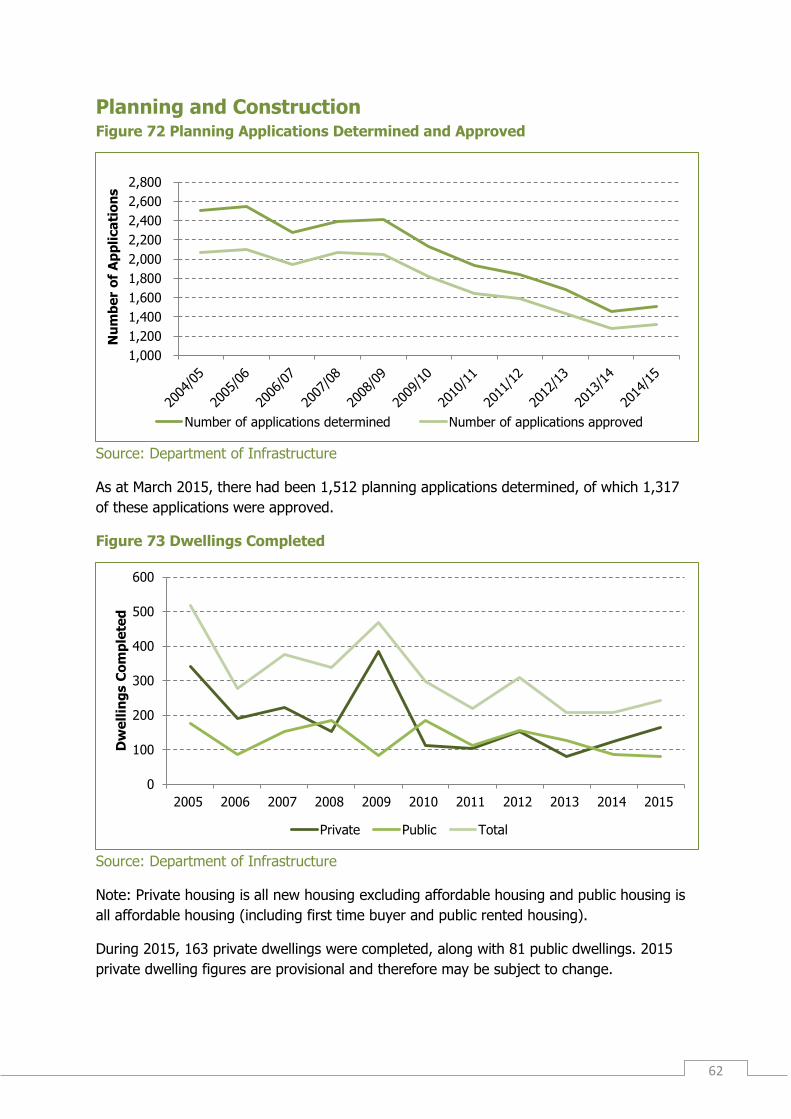
Planning and Construction Figure 72 Planning Applications Determined and Approved
Source: Department of Infrastructure
As at March 2015, there had been 1,512 planning applications determined, of which 1,317
of these applications were approved.
Figure 73 Dwellings Completed
Source: Department of Infrastructure
Note: Private housing is all new housing excluding affordable housing and public housing is
all affordable housing (including first time buyer and public rented housing).
During 2015, 163 private dwellings were completed, along with 81 public dwellings. 2015
private dwelling figures are provisional and therefore may be subject to change.
1,000
1,200
1,400
1,600
1,800
2,000
2,200
2,400
2,600
2,800
Nu
mb
er
of
Ap
pli
ca
tio
ns
Number of applications determined Number of applications approved
0
100
200
300
400
500
600
2005 2006 2007 2008 2009 2010 2011 2012 2013 2014 2015
Dw
ell
ing
s C
om
ple
ted
Private Public Total
63
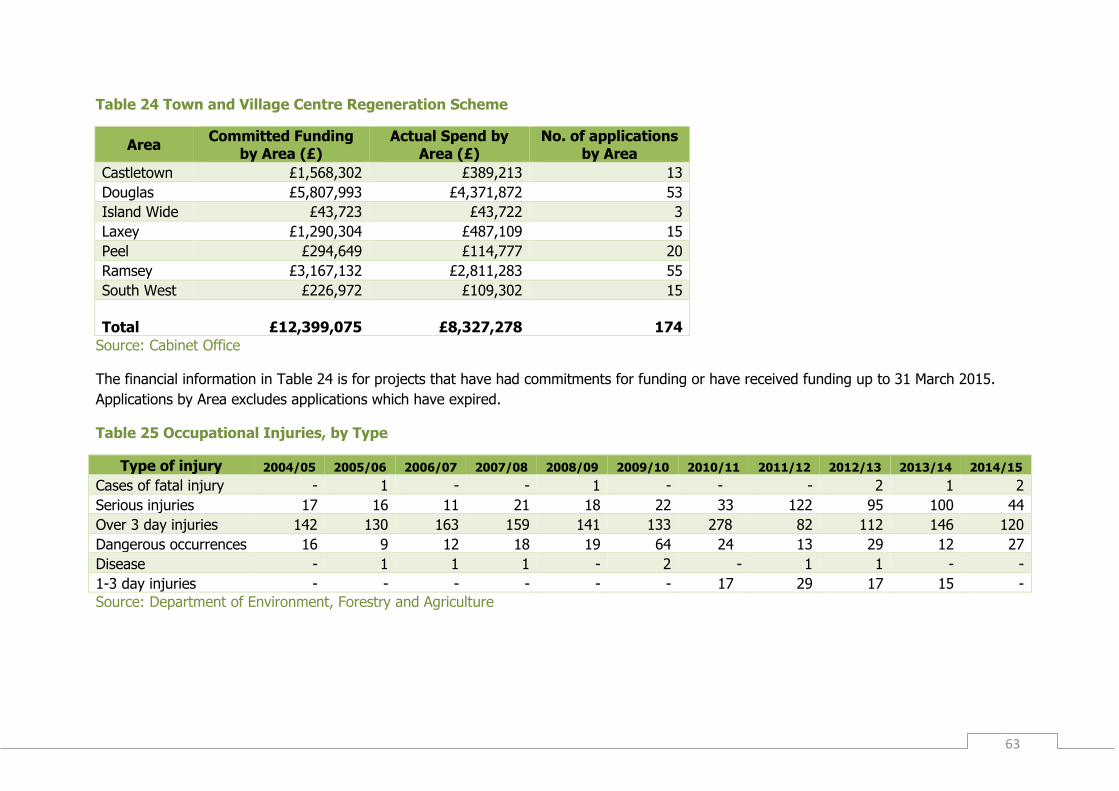
Table 24 Town and Village Centre Regeneration Scheme
Area Committed Funding
by Area (£) Actual Spend by
Area (£) No. of applications
by Area
Castletown £1,568,302 £389,213 13
Douglas £5,807,993 £4,371,872 53
Island Wide £43,723 £43,722 3
Laxey £1,290,304 £487,109 15
Peel £294,649 £114,777 20
Ramsey £3,167,132 £2,811,283 55
South West £226,972 £109,302 15
Total
£12,399,075 £8,327,278 174
Source: Cabinet Office
The financial information in Table 24 is for projects that have had commitments for funding or have received funding up to 31 March 2015.
Applications by Area excludes applications which have expired.
Table 25 Occupational Injuries, by Type
Type of injury 2004/05 2005/06 2006/07 2007/08 2008/09 2009/10 2010/11 2011/12 2012/13 2013/14 2014/15
Cases of fatal injury - 1 - - 1 - - - 2 1 2
Serious injuries 17 16 11 21 18 22 33 122 95 100 44
Over 3 day injuries 142 130 163 159 141 133 278 82 112 146 120
Dangerous occurrences 16 9 12 18 19 64 24 13 29 12 27
Disease - 1 1 1 - 2 - 1 1 - -
1-3 day injuries - - - - - - 17 29 17 15 -
Source: Department of Environment, Forestry and Agriculture
64
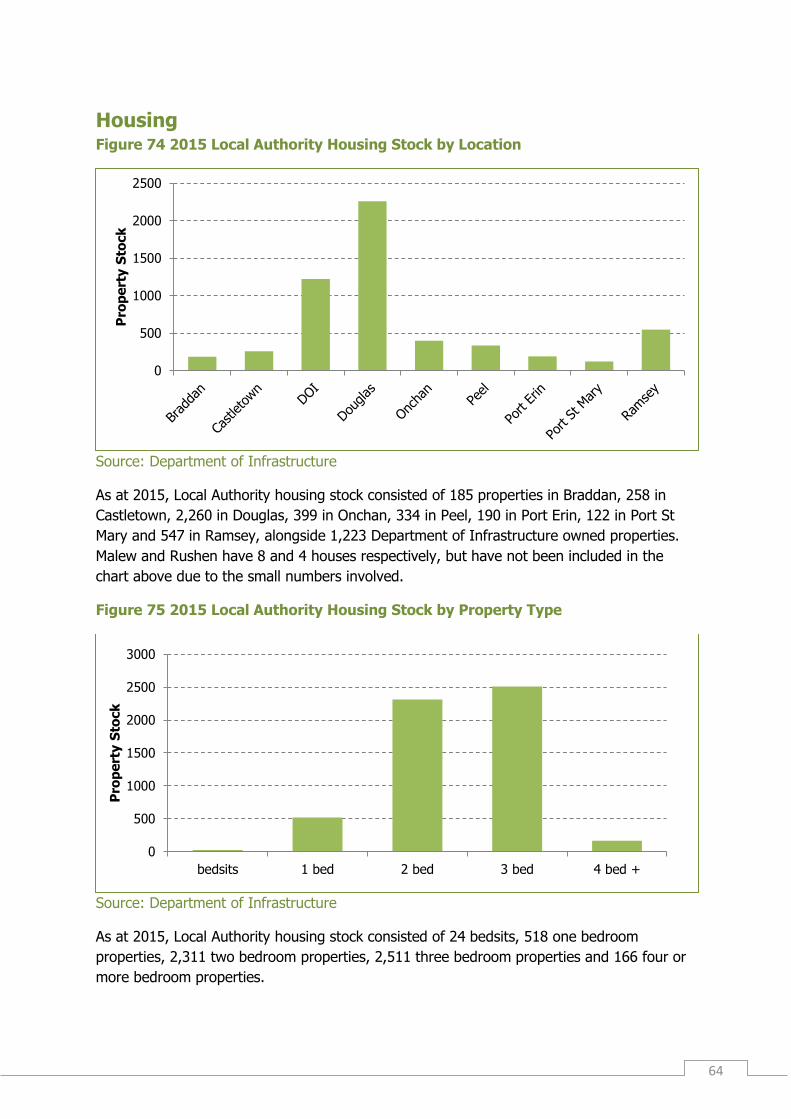
Housing Figure 74 2015 Local Authority Housing Stock by Location
Source: Department of Infrastructure
As at 2015, Local Authority housing stock consisted of 185 properties in Braddan, 258 in
Castletown, 2,260 in Douglas, 399 in Onchan, 334 in Peel, 190 in Port Erin, 122 in Port St
Mary and 547 in Ramsey, alongside 1,223 Department of Infrastructure owned properties.
Malew and Rushen have 8 and 4 houses respectively, but have not been included in the
chart above due to the small numbers involved.
Figure 75 2015 Local Authority Housing Stock by Property Type
Source: Department of Infrastructure
As at 2015, Local Authority housing stock consisted of 24 bedsits, 518 one bedroom
properties, 2,311 two bedroom properties, 2,511 three bedroom properties and 166 four or
more bedroom properties.
0
500
1000
1500
2000
2500
Pro
pe
rty S
tock
0
500
1000
1500
2000
2500
3000
bedsits 1 bed 2 bed 3 bed 4 bed +
Pro
pe
rty S
tock
65
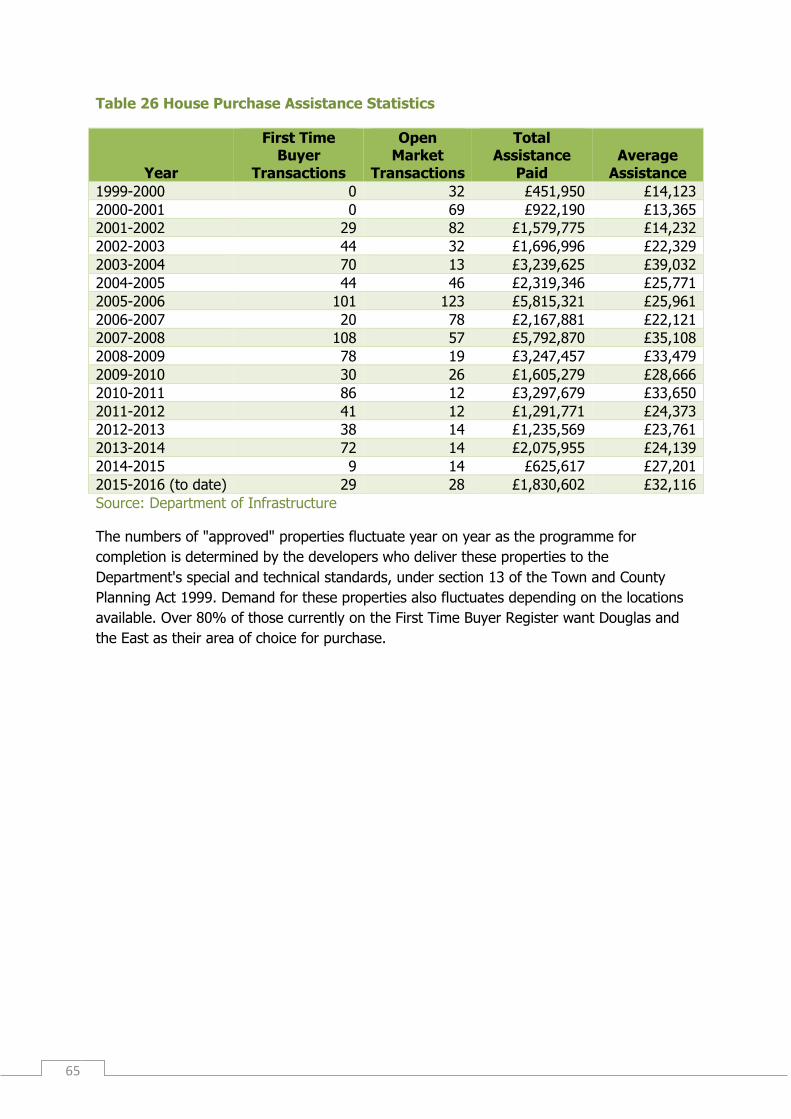
Table 26 House Purchase Assistance Statistics
Year
First Time Buyer
Transactions
Open Market
Transactions
Total Assistance
Paid Average
Assistance
1999-2000 0 32 £451,950 £14,123
2000-2001 0 69 £922,190 £13,365
2001-2002 29 82 £1,579,775 £14,232
2002-2003 44 32 £1,696,996 £22,329
2003-2004 70 13 £3,239,625 £39,032
2004-2005 44 46 £2,319,346 £25,771
2005-2006 101 123 £5,815,321 £25,961
2006-2007 20 78 £2,167,881 £22,121
2007-2008 108 57 £5,792,870 £35,108
2008-2009 78 19 £3,247,457 £33,479
2009-2010 30 26 £1,605,279 £28,666
2010-2011 86 12 £3,297,679 £33,650
2011-2012 41 12 £1,291,771 £24,373
2012-2013 38 14 £1,235,569 £23,761
2013-2014 72 14 £2,075,955 £24,139
2014-2015 9 14 £625,617 £27,201
2015-2016 (to date) 29 28 £1,830,602 £32,116
Source: Department of Infrastructure
The numbers of "approved" properties fluctuate year on year as the programme for
completion is determined by the developers who deliver these properties to the
Department's special and technical standards, under section 13 of the Town and County
Planning Act 1999. Demand for these properties also fluctuates depending on the locations
available. Over 80% of those currently on the First Time Buyer Register want Douglas and
the East as their area of choice for purchase.
66
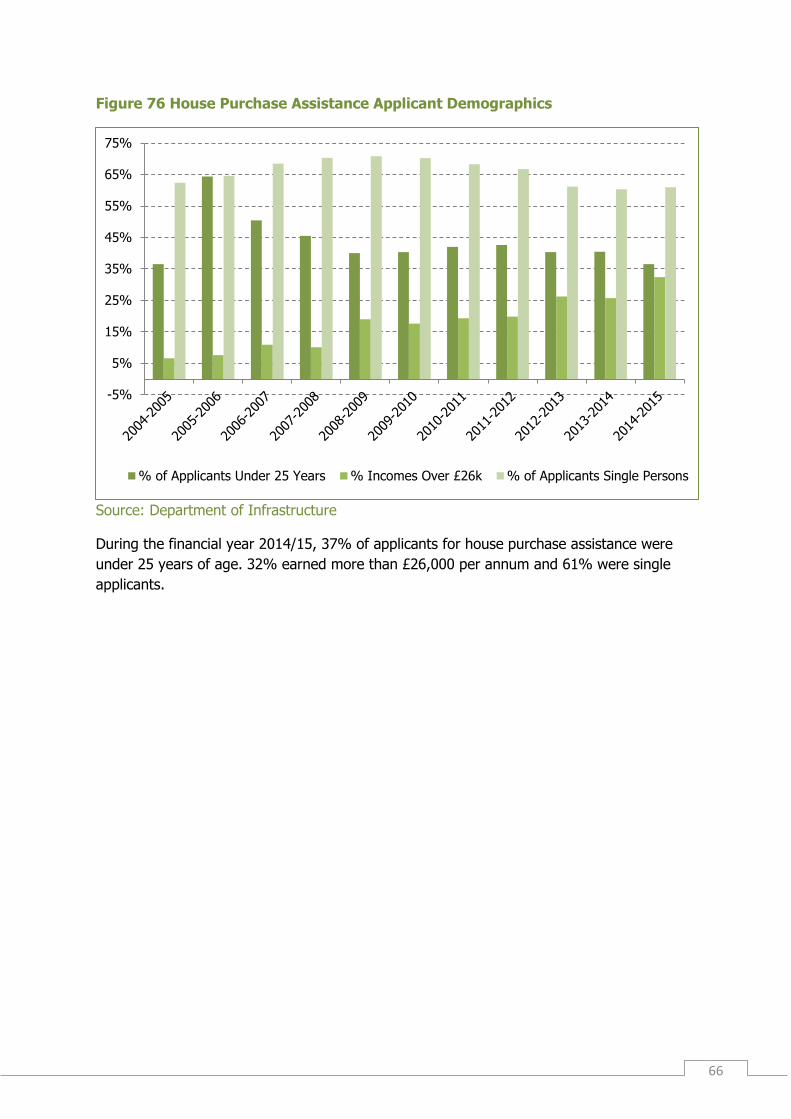
Figure 76 House Purchase Assistance Applicant Demographics
Source: Department of Infrastructure
During the financial year 2014/15, 37% of applicants for house purchase assistance were
under 25 years of age. 32% earned more than £26,000 per annum and 61% were single
applicants.
-5%
5%
15%
25%
35%
45%
55%
65%
75%
% of Applicants Under 25 Years % Incomes Over £26k % of Applicants Single Persons
67
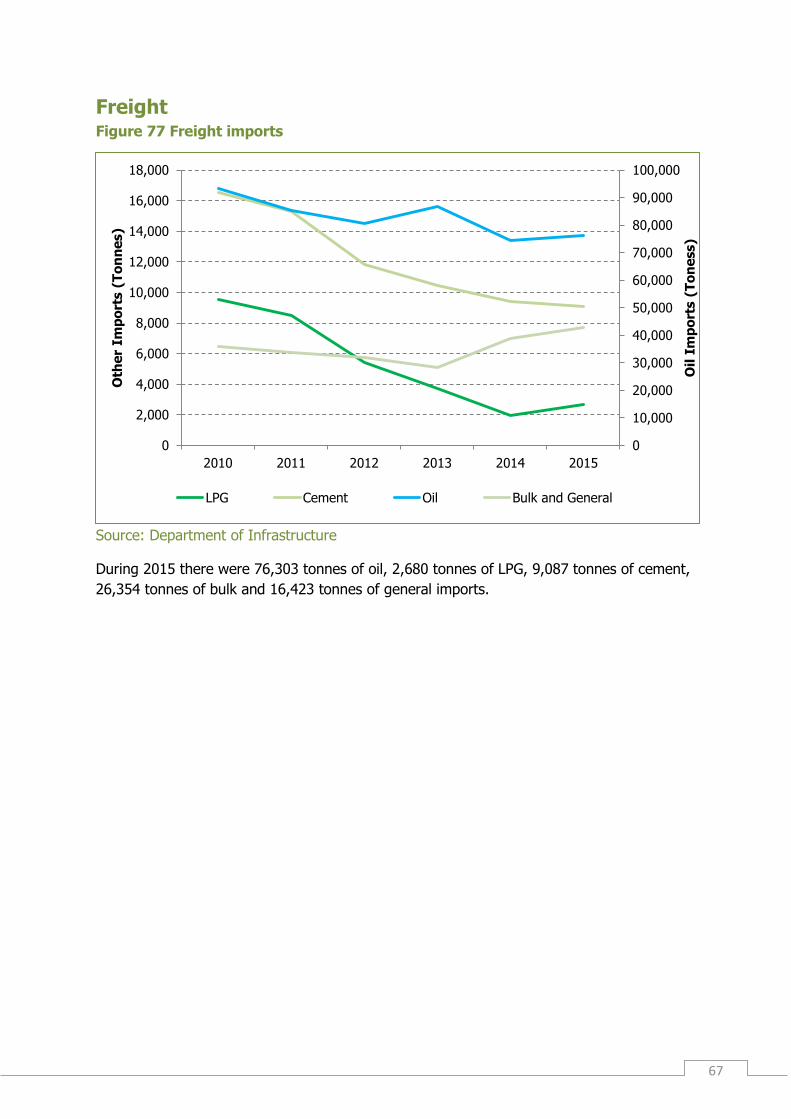
Freight Figure 77 Freight imports
Source: Department of Infrastructure
During 2015 there were 76,303 tonnes of oil, 2,680 tonnes of LPG, 9,087 tonnes of cement,
26,354 tonnes of bulk and 16,423 tonnes of general imports.
0
10,000
20,000
30,000
40,000
50,000
60,000
70,000
80,000
90,000
100,000
0
2,000
4,000
6,000
8,000
10,000
12,000
14,000
16,000
18,000
2010 2011 2012 2013 2014 2015
Oil
Im
po
rts (
To
ne
ss)
Oth
er
Imp
ort
s (
To
nn
es)
LPG Cement Oil Bulk and General
68
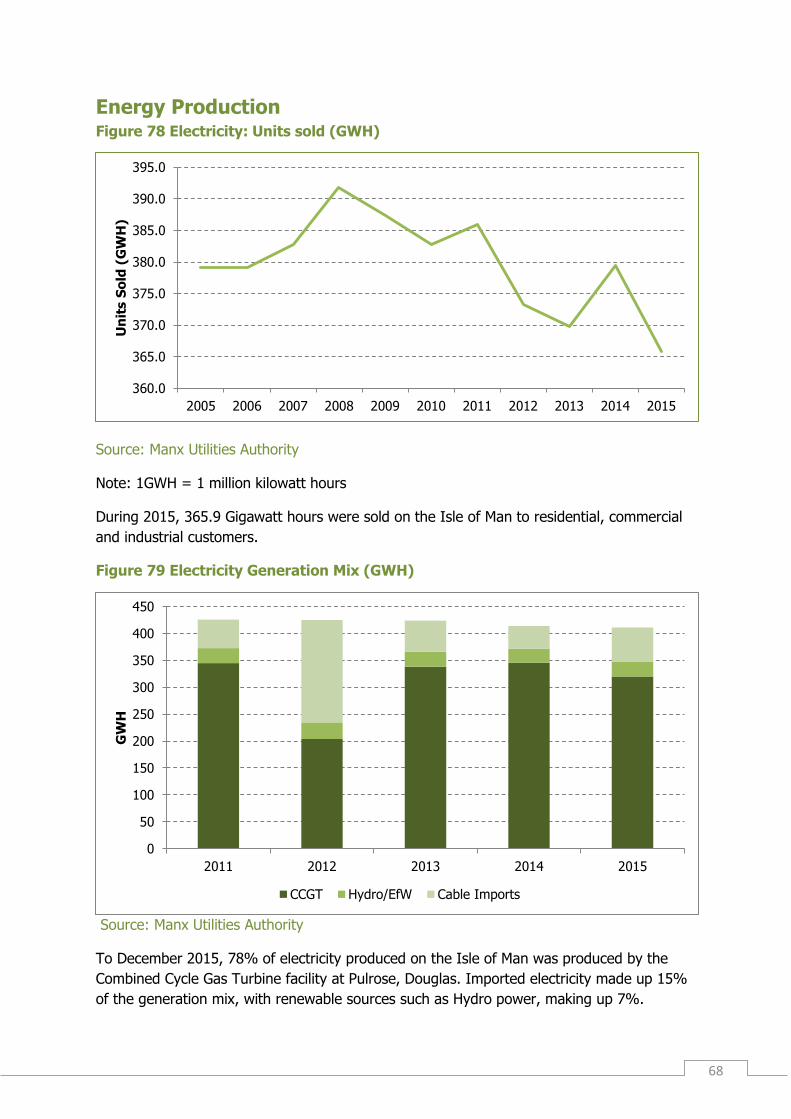
Energy Production Figure 78 Electricity: Units sold (GWH)
Source: Manx Utilities Authority
Note: 1GWH = 1 million kilowatt hours
During 2015, 365.9 Gigawatt hours were sold on the Isle of Man to residential, commercial
and industrial customers.
Figure 79 Electricity Generation Mix (GWH)
Source: Manx Utilities Authority
To December 2015, 78% of electricity produced on the Isle of Man was produced by the
Combined Cycle Gas Turbine facility at Pulrose, Douglas. Imported electricity made up 15%
of the generation mix, with renewable sources such as Hydro power, making up 7%.
360.0
365.0
370.0
375.0
380.0
385.0
390.0
395.0
2005 2006 2007 2008 2009 2010 2011 2012 2013 2014 2015
Un
its S
old
(G
WH
)
0
50
100
150
200
250
300
350
400
450
2011 2012 2013 2014 2015
GW
H
CCGT Hydro/EfW Cable Imports
69
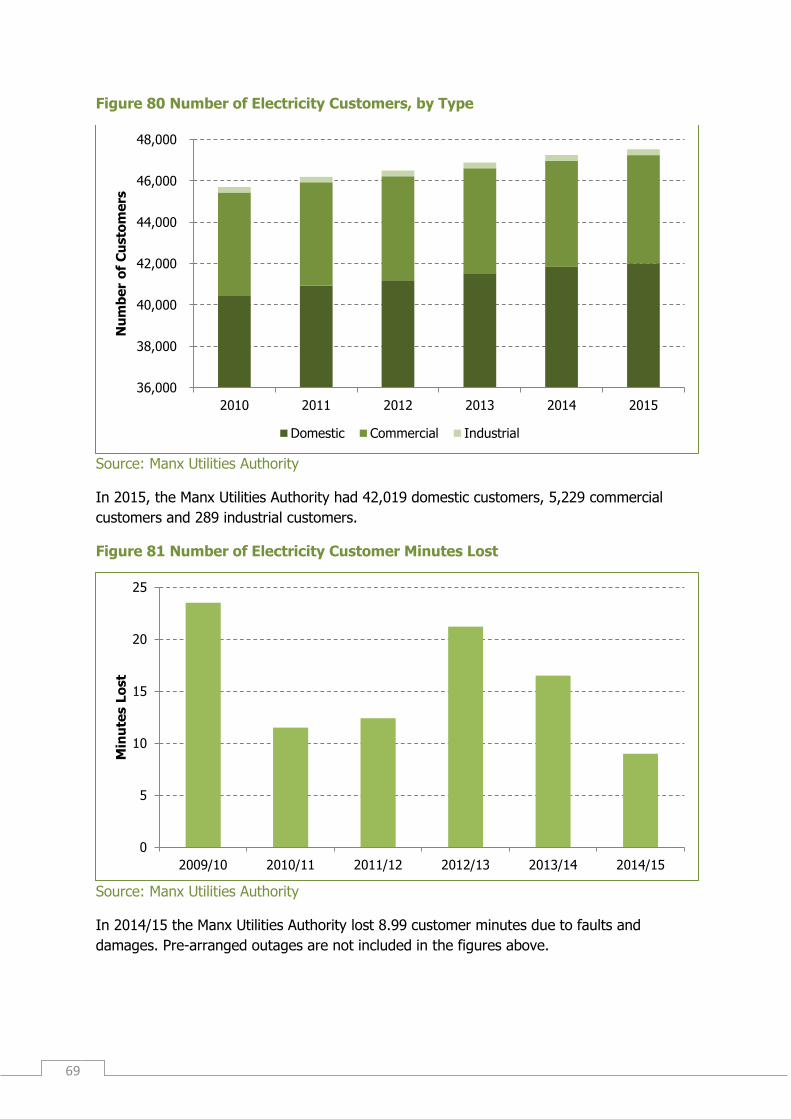
Figure 80 Number of Electricity Customers, by Type
Source: Manx Utilities Authority
In 2015, the Manx Utilities Authority had 42,019 domestic customers, 5,229 commercial
customers and 289 industrial customers.
Figure 81 Number of Electricity Customer Minutes Lost
Source: Manx Utilities Authority
In 2014/15 the Manx Utilities Authority lost 8.99 customer minutes due to faults and
damages. Pre-arranged outages are not included in the figures above.
36,000
38,000
40,000
42,000
44,000
46,000
48,000
2010 2011 2012 2013 2014 2015
Nu
mb
er
of
Cu
sto
me
rs
Domestic Commercial Industrial
0
5
10
15
20
25
2009/10 2010/11 2011/12 2012/13 2013/14 2014/15
Min
ute
s L
ost
70
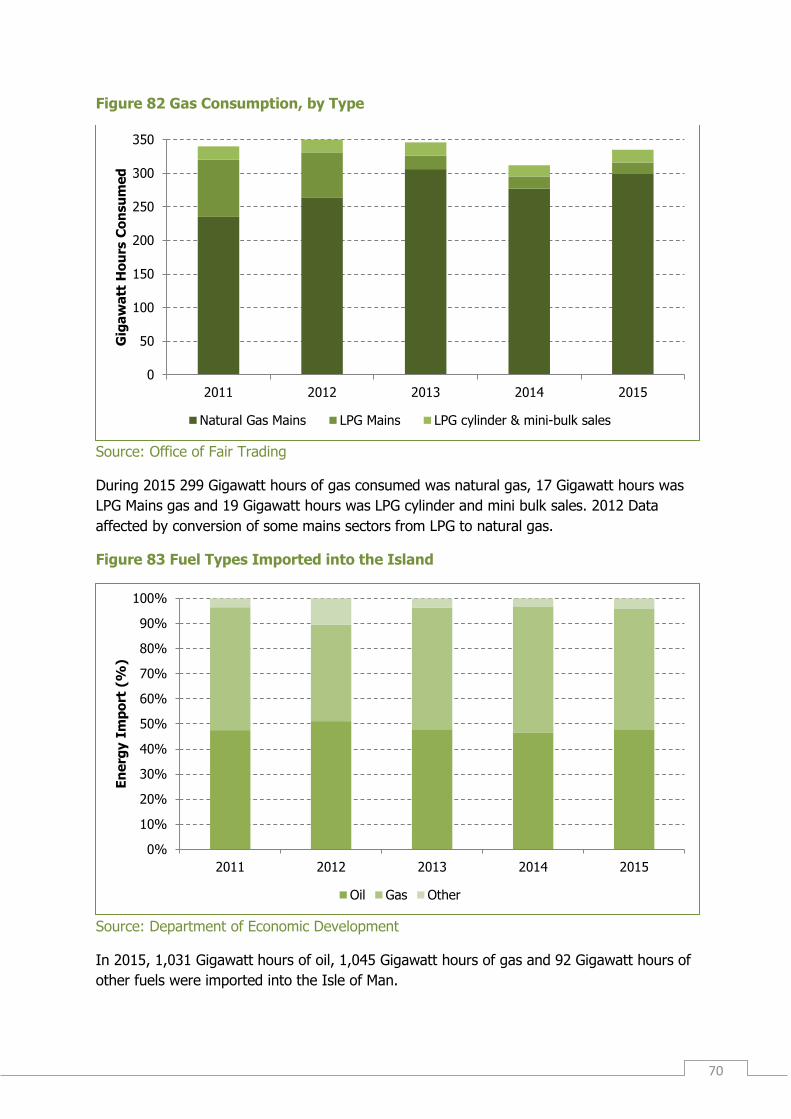
Figure 82 Gas Consumption, by Type
Source: Office of Fair Trading
During 2015 299 Gigawatt hours of gas consumed was natural gas, 17 Gigawatt hours was
LPG Mains gas and 19 Gigawatt hours was LPG cylinder and mini bulk sales. 2012 Data
affected by conversion of some mains sectors from LPG to natural gas.
Figure 83 Fuel Types Imported into the Island
Source: Department of Economic Development
In 2015, 1,031 Gigawatt hours of oil, 1,045 Gigawatt hours of gas and 92 Gigawatt hours of
other fuels were imported into the Isle of Man.
0
50
100
150
200
250
300
350
2011 2012 2013 2014 2015
Gig
aw
att
Ho
urs
Co
nsu
me
d
Natural Gas Mains LPG Mains LPG cylinder & mini-bulk sales
0%
10%
20%
30%
40%
50%
60%
70%
80%
90%
100%
2011 2012 2013 2014 2015
En
erg
y I
mp
ort
(%
)
Oil Gas Other
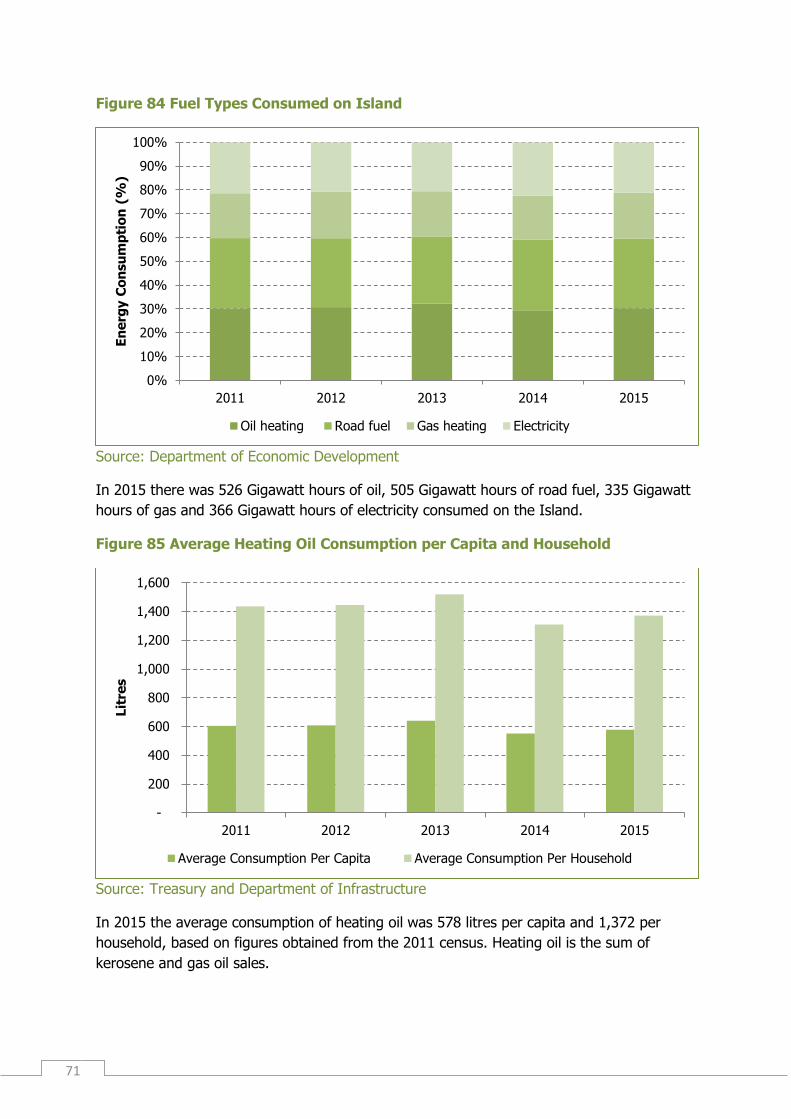
71
Figure 84 Fuel Types Consumed on Island
Source: Department of Economic Development
In 2015 there was 526 Gigawatt hours of oil, 505 Gigawatt hours of road fuel, 335 Gigawatt
hours of gas and 366 Gigawatt hours of electricity consumed on the Island.
Figure 85 Average Heating Oil Consumption per Capita and Household
Source: Treasury and Department of Infrastructure
In 2015 the average consumption of heating oil was 578 litres per capita and 1,372 per
household, based on figures obtained from the 2011 census. Heating oil is the sum of
kerosene and gas oil sales.
0%
10%
20%
30%
40%
50%
60%
70%
80%
90%
100%
2011 2012 2013 2014 2015
En
erg
y C
on
su
mp
tio
n (
%)
Oil heating Road fuel Gas heating Electricity
-
200
400
600
800
1,000
1,200
1,400
1,600
2011 2012 2013 2014 2015
Lit
res
Average Consumption Per Capita Average Consumption Per Household
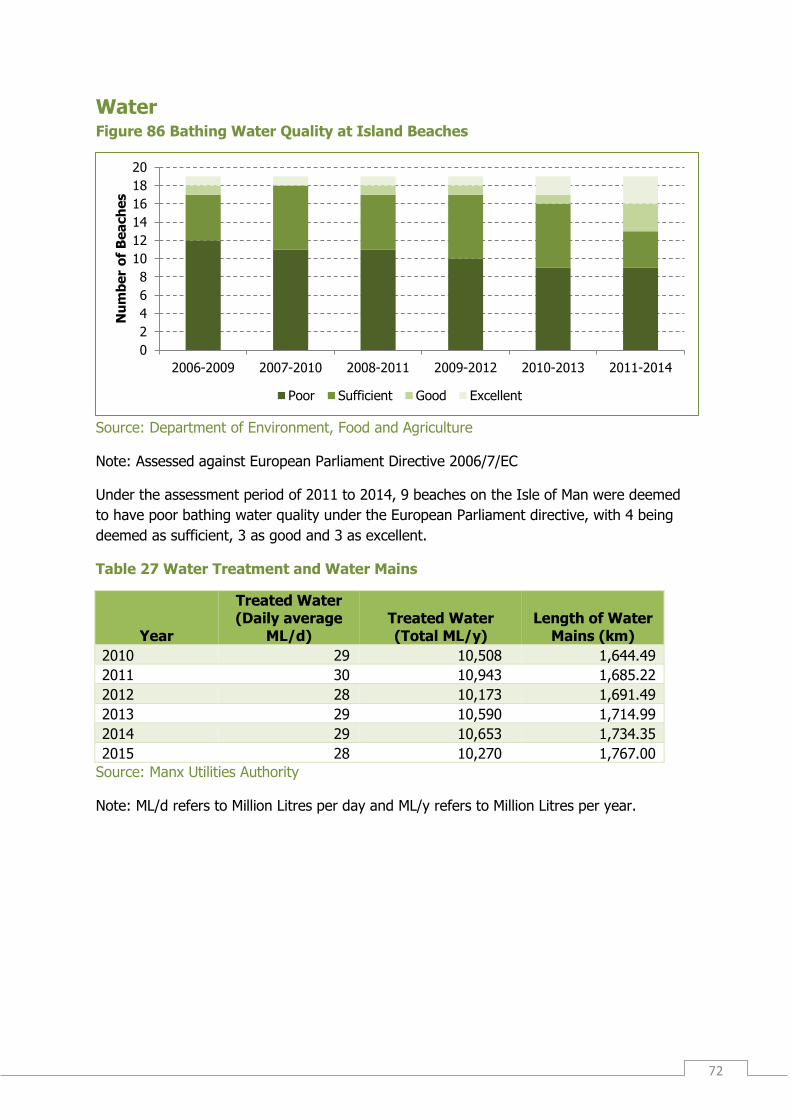
72
Water Figure 86 Bathing Water Quality at Island Beaches
Source: Department of Environment, Food and Agriculture
Note: Assessed against European Parliament Directive 2006/7/EC
Under the assessment period of 2011 to 2014, 9 beaches on the Isle of Man were deemed
to have poor bathing water quality under the European Parliament directive, with 4 being
deemed as sufficient, 3 as good and 3 as excellent.
Table 27 Water Treatment and Water Mains
Year
Treated Water (Daily average
ML/d) Treated Water (Total ML/y)
Length of Water Mains (km)
2010 29 10,508 1,644.49
2011 30 10,943 1,685.22
2012 28 10,173 1,691.49
2013 29 10,590 1,714.99
2014 29 10,653 1,734.35
2015 28 10,270 1,767.00
Source: Manx Utilities Authority
Note: ML/d refers to Million Litres per day and ML/y refers to Million Litres per year.
0
2
4
6
8
10
12
14
16
18
20
2006-2009 2007-2010 2008-2011 2009-2012 2010-2013 2011-2014
Nu
mb
er
of
Bea
ch
es
Poor Sufficient Good Excellent
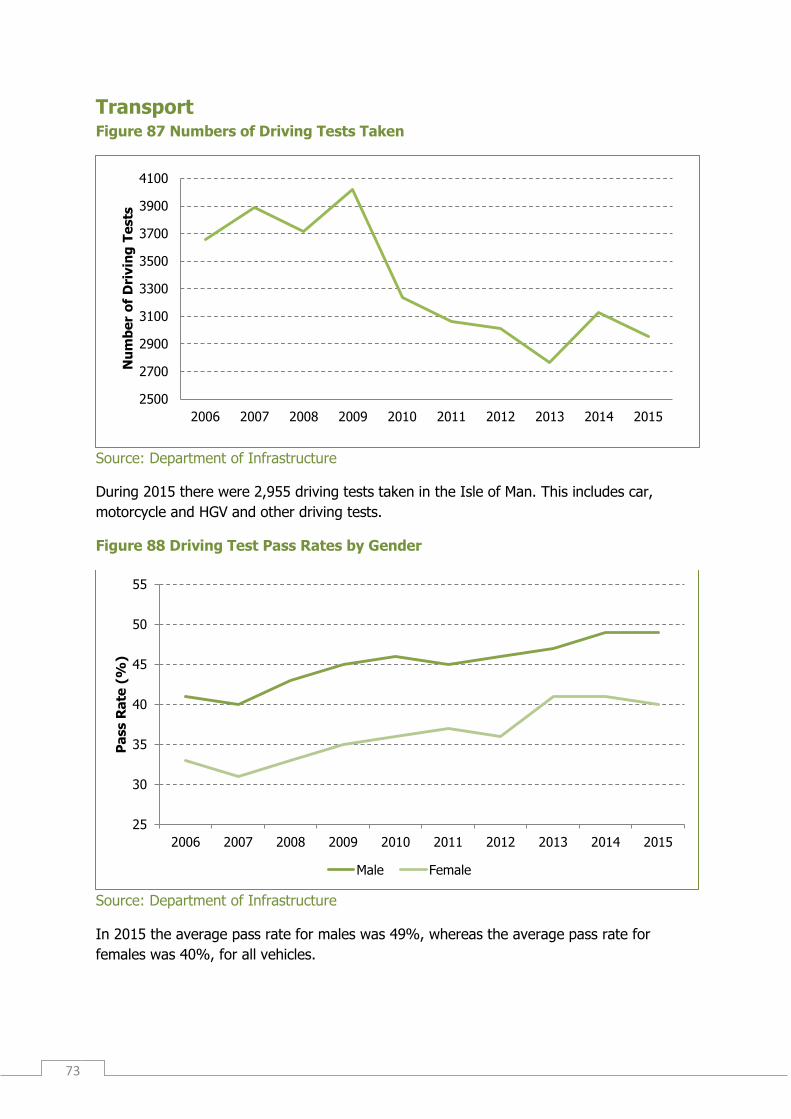
73
Transport Figure 87 Numbers of Driving Tests Taken
Source: Department of Infrastructure
During 2015 there were 2,955 driving tests taken in the Isle of Man. This includes car,
motorcycle and HGV and other driving tests.
Figure 88 Driving Test Pass Rates by Gender
Source: Department of Infrastructure
In 2015 the average pass rate for males was 49%, whereas the average pass rate for
females was 40%, for all vehicles.
2500
2700
2900
3100
3300
3500
3700
3900
4100
2006 2007 2008 2009 2010 2011 2012 2013 2014 2015
Nu
mb
er
of
Dri
vin
g T
ests
25
30
35
40
45
50
55
2006 2007 2008 2009 2010 2011 2012 2013 2014 2015
Pa
ss R
ate
(%
)
Male Female
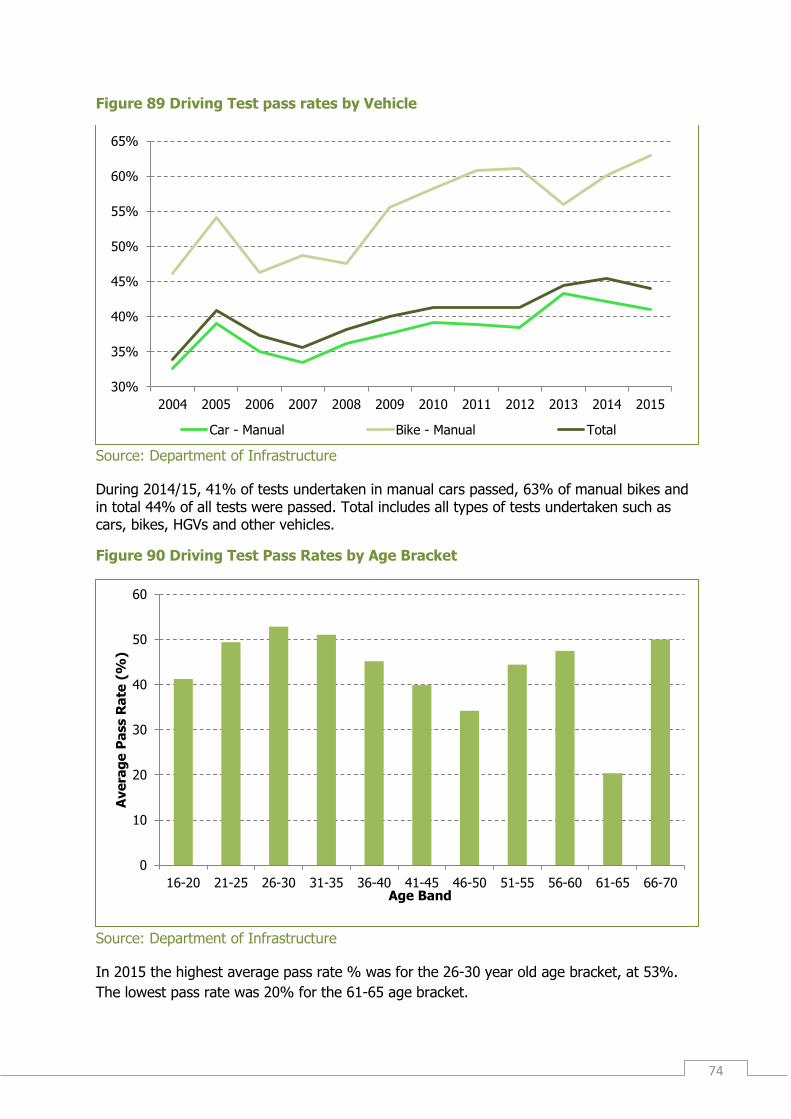
74
Figure 89 Driving Test pass rates by Vehicle
Source: Department of Infrastructure
During 2014/15, 41% of tests undertaken in manual cars passed, 63% of manual bikes and in total 44% of all tests were passed. Total includes all types of tests undertaken such as cars, bikes, HGVs and other vehicles.
Figure 90 Driving Test Pass Rates by Age Bracket
Source: Department of Infrastructure
In 2015 the highest average pass rate % was for the 26-30 year old age bracket, at 53%.
The lowest pass rate was 20% for the 61-65 age bracket.
30%
35%
40%
45%
50%
55%
60%
65%
2004 2005 2006 2007 2008 2009 2010 2011 2012 2013 2014 2015
Car - Manual Bike - Manual Total
0
10
20
30
40
50
60
16-20 21-25 26-30 31-35 36-40 41-45 46-50 51-55 56-60 61-65 66-70
Ave
rag
e P
ass R
ate
(%
)
Age Band

75
Figure 91 Vehicle Registration
Source: Department of Infrastructure
During the 2014/15 financial year, 60,884 cars were registered, 6,004 motorcycles and
2,392 other types of vehicle were registered. The other category includes Goods, Articulated
Goods, Buses/Minibuses and agricultural or plant vehicles.
Figure 92 Average Road Fuel Consumption per Licenced Vehicle
Source: Treasury and Department of Infrastructure
In 2014/15 there was an average of 697 litres of road fuel consumed per licenced vehicle on
the island. Road fuel includes both petrol and diesel sales. Whilst the graph shows that
average consumption per licenced vehicle is increasing, overall fuel sales are fairly static
whereas the number of licenced vehicles has decreased.
-
10,000
20,000
30,000
40,000
50,000
60,000
70,000
80,000
90,000
2008/09 2009/10 2010/11 2011/12 2012/13 2013/14 2014/15
Nu
mb
er
of
Ve
hic
les
Motorcycles Cars Other
0
100
200
300
400
500
600
700
800
2011/12 2012/13 2013/14 2014/15
Lit
res

76
Figure 93 Passenger Numbers for Railway Services
Source: Department of Infrastructure
During 2015 the Steam Railway carried 100,653 passengers, the Manx Electric Railway
carried 72,182 passengers and the Snaefell Mountain Railway carried 52,055 passengers.
The Snaefell services include the evening dining services to the Summit Restaurant, but the
Steam Railway and Manx Electric Railway figures do not include passengers carried on
Dining Car services, special events and private charters. Passengers travelling between
intermediate stops (e.g. Colby to Castletown) have not been included.
0
20,000
40,000
60,000
80,000
100,000
120,000
Steam Railway Manx Electric Railway Snaefell Mountain Railway
Nu
mb
er
of
Pa
sse
ng
ers
2014 2015

77
Copyright
Isle of Man Government
ISBN 978-1-904869-63-4
This document can be provided in large print or audio tape on request