isokinetics and exercise science 29 (2021) 277–289 ios
TRANSCRIPT

Isokinetics and Exercise Science 29 (2021) 277–289 277DOI 10.3233/IES-203241IOS Press
Quadriceps activation during maximalisometric and isokinetic contractions: Theminimal real difference and its implications
Luigi Catinoa, Chiara Malloggib, Stefano Scaranoa,b, Valeria Cerinab, Viviana Rotab andLuigi Tesioa,b,∗aDepartment of Biomedical Sciences for Health, Università degli Studi di Milano, Milan, ItalybIstituto Auxologico Italiano, IRCCS, Department of Neurorehabilitation Sciences, Ospedale San Luca, Milan, Italy
Received 17 October 2020
Accepted 8 November 2020
Abstract.BACKGROUND: A method of measurement of voluntary activation (VA, percent of full muscle recruitment) during isometricand isokinetic concentric contractions of the quadriceps femoris (QF) at 60/s and 120/s was previously validated.OBJECTIVE: This study aimed to quantify the test-retest minimal real difference (MRD) of VA during isometric (ISOM) andisokinetic concentric contractions of QF (100/s, ISOK) in a sample of healthy individuals.METHODS: VA was measured through the interpolated twitch technique. Pairs of electrical stimuli were delivered to the QF at40 of knee flexion during maximal voluntary contractions. Twenty-five healthy participants (20–38 years, 12 women, 13 men)completed two testing sessions with a 14-day interval. VA values were linearized through logit transformation (VAl). The MRDwas estimated from intraclass correlation coefficients (model 2.1).RESULTS: The VA (median, range) was 84.20% (38.2–99.9%) in ISOM and 94.22% (33.8–100%) in ISOK. MRD was 0.78 and1.12 logit for ISOM and ISOK, respectively. As an example, in terms of percent VA these values correspond to a change from 76%to 95% and from 79% to 98% in ISOM and in ISOK, respectively.CONCLUSIONS: The provided MRD values allow to detect significant individual changes in VA, as expected after training andrehabilitation programs.
Keywords: Voluntary activation, isokinetic, quadriceps, minimal real difference, rehabilitation
1. Introduction
Voluntary activation (VA) is defined as the degree ofrecruitment of muscles engaged in a voluntary contrac-tion effort [1]. VA is usually measured as a percentageof the maximum force that could be provided by a mus-cle if all its fibres contract at tetanic frequency. A 100%VA is rarely achieved for the quadriceps femoris (QF),
∗Corresponding author: Luigi Tesio, Istituto Auxologico Italiano,IRCCS, Ospedale San Luca via Giuseppe Mercalli 32, Milan, 20122,Italy. Tel.: +39 2 582 18 150; Fax: +39 2 582 18 155; E-mails: [email protected] and [email protected].
and for most muscles, even among trained healthy par-ticipants [2]. The most commonly used method for VAmeasurement is the interpolated twitch technique (ITT)which consists of stimulating a representative portionof the muscle belly through an electric shock, caus-ing some initial discomfort but no pain. The stimulusis delivered both at rest and during maximal contrac-tion effort. If the shock does not generate extra forceduring contraction, all muscle fibres belonging to thesample reached by the electric shock can be claimed tobe tetanized [1,3]. Otherwise, the contraction/rest ratioof the peak forces during the “twitches” evoked by theshock provides an estimate of the percentage of mus-
ISSN 0959-3020 c© 2021 – The authors. Published by IOS Press. This is an Open Access article distributed under the terms of the CreativeCommons Attribution-NonCommercial License (CC BY-NC 4.0).

278 L. Catino et al. / Minimal real difference of quadriceps activation
cle fibres not (or not fully) engaged by the volitionaldrive: VA is the complement to this ratio. Therefore,the ITT provides an estimation of how voluntary efforttranslates into muscle force production [3].
A less common procedure, known as the central ac-tivation ratio (CAR), implies that the peak moment isevoked with supramaximal stimulation of the femoralnerve, making the resting twitch unnecessary [4–8].The two methods provide quite superimposable results.In previous research on various muscle groups VA hasbeen measured through ITT during isometric contrac-tions (ISOM) [2,9–11] and during both muscle short-ening (“concentric contraction”) [9,12] and lengthen-ing (“eccentric contraction”) [13–16]. Given that mus-cle force depends both on muscle length and velocityof shortening (or lengthening), most studies adoptedisokinetic dynamometers Here, the activation of the QFduring lower limb extension is of concern. The extantliterature agrees (despite initial controversies [16–18])that VA of QF is incomplete during ISOM (around 80–95%) [10,19–21]. In contrast, the debate is ongoingfor isokinetic (ISOK) concentric and eccentric contrac-tions. Some authors concluded that maximal ISOK con-centric VA did not differ significantly from ISOM VAeither at slow (20/s) or fast (150 and 300/s) angularvelocities [9,10]. Other authors observed that VA dur-ing maximal ISOK eccentric and concentric contrac-tions at slow knee angular velocities was significantlylower than VA recorded during maximal ISOM con-tractions [12]. These divergent results, as discussed ina previous paper [1], may be mainly due to technicaldifficulties intrinsic to ITT measurements of VA duringISOK contractions. Variation in the instruments adoptedand characteristics of the sample may have contributedas well.
In a previous paper [1] a method of measurement ofVA during ISOM and ISOK knee extension (velocitiesof 60 and 120/s, twitch peak measured at knee jointangle 50) was validated. In other studies, on isokineticVA measurement, the electrical stimulus was releasedat pre-set joint angles. However, a variable delay occursbetween the stimulus and the force generation, hencethe angle of twitch peak force. In this previous paper [1]the electric shock was delivered at a pre-determinedtime, allowing the twitch to peak always at the desiredknee angle. The applicability of this method to the as-sessment of changes among individual participants ispresented here.
A key property of measurement is its test-retest relia-bility. This parameter for VA has been evaluated in iso-metric conditions at 90 knee flexion (0 = full exten-
sion) among patients with knee osteoarthritis, and theresulting minimal statistically detectable change (seebelow) was 6.60% [22]. To the authors’ knowledge, inisokinetic conditions test-retest reliability was only as-sessed at 25/s at 70 knee angle among healthy partic-ipants. The intraclass correlation coefficient (ICC, un-specified model) of VA was 0.87 (95% confidence inter-val, CI: 0.71–0.95) and 0.86 (CI: 0.63–0.95) in concen-tric and eccentric contractions, respectively [23]. Con-ventional reliability tests currently focus on the stabilityof mean (or median) values across time points or raters(for an overview, see [24]). However, this approachneglects the need for assessing individual changes inclinical and sports training practice. Measures of indi-vidual changes are more subject to error than samplemeans and medians. A valid approach is to estimatethe minimal real difference (MRD) [25] (also referredto as the minimal detectable change) [26]. This is theminimal test-retest difference surpassing the amountof change that can be observed by chance (at a givenlevel of significance). If the MRD is reached or tres-passed, an association between treatment and outcomecan be claimed. The MRD is an intrinsic property ofthe entire measurement process (i.e., instruments andtest procedures). The estimate of MRD requires a dedi-cated study in which appropriate statistical models andalgorithms are applied [1,25]. To the authors’ knowl-edge, only one study tested the MRD of VA of the QFduring ISOM [22] and only one study tested the test-retest reliability of the method (based on the stabilityof mean values) during ISOK concentric and ISOK ec-centric at slow angular velocity (25/s) [23]. No stud-ies of the test-retest MRD, however, have been con-ducted on ISOK concentric contractions among healthyparticipants.
Another neglected issue was the nonlinearity of per-centage measures, flawed by floor and/or ceiling effects.In the present study, measures of VA and their changeswere analysed both as raw percentages (VA) and as val-ues transformed (VAl) after linearization (logit trans-formation).
The primary endpoint of the present study was to de-termine the MRD of VAl of QF during ISOM and ISOKconcentric contractions at 100/s. Secondary endpointswere to elucidate the dependence of VA on lower limbdominance and sex.
2. Methods
The trial was conducted from September 2019 toApril 2020 in a research laboratory on human move-
L. Catino et al. / Minimal real difference of quadriceps activation 279
ment, within a hospital department of neurorehabilita-tion.
2.1. Participants
Twenty-five healthy participants (18–45 years old,12 women) took part in the experiments. The inclusioncriteria were: i) ability to sign the informed consentform; ii) ability to understand the instructions and tocomplete the motor task; and iii) to be recreationallyactive.
Exclusion criteria were: i) pregnancy; ii) a history ofepilepsy (to avoid the risk of seizures triggered by thestimuli); iii) implanted electro-sensitive devices; iv) anyneurologic or orthopaedic condition limiting the artic-ular mobility or muscular strength of the lower limbs;and v) current treatment with oral anticoagulant or an-tiplatelet therapy (to avoid the risk of muscle haemor-rhage). None of the participants were familiar with thetesting method.
2.2. Ethics
All participants gave written informed consent be-fore participating. The study was approved by the ethicscommittee of the institution (project code 24C721_2017date of approval 14th November 2017). The study con-formed to the Code of Ethics of the World MedicalAssociation (Declaration of Helsinki 2013) for medicalresearch involving human participants.
2.3. Procedures
2.3.1. Test sequencingParticipants took part in the experiment during two
sessions, test (T0) and retest (T1), with a 14-day inter-val. The two sessions took place at about the same timeof the day and participants were asked to maintain thesame lifestyle habits between the sessions. The 14-dayinterval was chosen as it is close to the time frame usu-ally adopted for re-testing after rehabilitation or sportstraining. Both lower limbs were tested. The order inwhich the lower limbs were tested was randomised (seebelow).
2.3.2. Trial sequencingIn a separate way for both men and women, for the
first enrolled participant the limb to be tested first (dom-inant vs. non-dominant) was randomly selected. Forsubsequent participants, the sequence in limb testingwas alternated. Then, those participants who had theirdominant limb tested as first at T0 started retest withthe non-dominant limb, and vice-versa.
2.3.3. Anthropometric measurementsAll anthropometric parameters were measured at T0
and at T1 at the beginning of the testing session. Partic-ipants were tested for foot dominance using the Water-loo footedness questionnaire-revised [27]. Height andweight were measured.
2.3.4. InstrumentsAll tests were performed using a Cybex Humac
Norm R© 2014 isokinetic dynamometer (CSMi-Computer Sports Medicine, Inc.; Stoughton, MA-USA). The participants sat in an upright position withthe hip flexed at approximately 90 and grasped ad-hoc seat handles. The lateral epicondyle of the femurwas aligned with the main horizontal axis of rotation ofthe dynamometer, and the lower limb was secured to aJohnson anti-shear device [28].
2.3.5. Range of knee motion and rotation speedsIsometric tests were conducted with the knee held at
40 flexion (0 = full extension). In ISOK, extension-flexion testing was initiated with the knee at approxi-mately 105 flexion and then reaching full anatomic ex-tension. The isokinetic rotation speed was set to 100/s.Knee rotations were performed either actively undervoluntary contractions or passively through the isoki-netic lever (continuous passive motion, CPM).
2.3.6. Electrical stimulation of quadriceps muscleVA levels were determined according to the ITT
method. Electric shocks were delivered through largepercutaneous rubber electrodes (120 × 220 mm). Theanode and the cathode were positioned medially on theanterior aspect of the upper and lower thigh respec-tively. Through a constant current high-voltage stimu-lator (Digitimer R© DS7A, Hertfordshire, UK) a doubletof single square-wave stimuli was delivered (interstim-ulus interval 10 ms) [29–31]. Each stimulus had an am-plitude of approximately 300–600 mA and a durationof 50–100 µs. The exact procedure is described else-where [1]. The amplitude of the electrical stimuli wastailored for each participant. The same amplitude wasused for each limb, during all tests at both T0 and T1.The current amplitude corresponded to the one provid-ing an isometric peak moment at rest of at least 25% ofthe maximal voluntary contraction (MVC) [32–34] onthe first limb tested.
2.3.7. Voluntary efforts and electrical stimulationJoint moments were displayed online on a PC-screen.
The participant was instructed to neglect the screen andto focus on perceiving her/his maximal effort. Verbal

280 L. Catino et al. / Minimal real difference of quadriceps activation
Fig. 1. Schematic representation of the experimental protocol for one limb. The experimental session starts with isometric (ISOM) habituation inwhich 4 submaximal repetitions were requested. Then, one ISOM repetition at 100%MVC was asked for, in order to calculate the parameters ofthe electrical doublets to be delivered in the test (represented by the vertical gray bar). After 3-min rest, the participants performed two ISOMrepetitions separated by a 3-min rest. In each ISOM repetition, three electrical doublets (represented by arrows) were delivered: the first onewas delivered at rest, the second one was delivered 3–4 s after the beginning of the effort initiation, and the third one was delivered at rest 2–3 safter the contraction ended. After the ISOM test, a 5-min rest separated the habituation trials, made by two isokinetic knee extension-flexioncontractions at 100/s (ISOK) at 100% MVC. Then, three repetitions of Continuous Passive Motion (CPM) at 100/s were made, each with asuperimposed doublet. After a 1-min rest, three ISOK at 100% MVC were performed, each with a superimposed doublet.
encouragement was provided to the participants to elicitmaximal effort.
To achieve habituation at the beginning of each ses-sion participants performed 2–4 submaximal isometriccontractions at increasing effort at the pre-determinedjoint angle (40 knee flexion). Then, the participantswere asked to perform a single MVC, which was usedto define the amplitude of the electrical stimuli (seeabove).
After a 3-minute pause, ISOM contractions were re-quested. During ISOM (knee immobilised at 40 flex-ion), three electric paired shocks (doublets, interstim-ulus interval 10 ms) were delivered. The first doubletwas delivered at rest before contraction. The secondone was delivered 3–4 s after the beginning of the effortinitiation when a steady plateau could be appreciated byvisual inspection of the joint moment tracings. The thirddoublet was delivered at rest 2–3 s after the contractionhad ended. Two ISOM contractions were performed foreach limb, with a 3-minute break.
A 5-minute pause separated the end of ISOM test-ing from the beginning of isokinetic habituation: twoextension-flexion repetitions at maximal effort at thechosen angular velocity (100/s). Care was taken toensure that on visual inspection a constant effort wasprovided within and between repetitions, as revealed bybell-shaped and reproducible moment tracings. Contin-uous passive motion (CPM) of knee extension-flexion(range 105-0, angular velocity 100/s) followed. Threeconsecutive CPMs were performed for each limb. Aftera 1-minute pause, ISOK was performed. During bothCPM and ISOK a doublet was delivered during eachrepetition. Through a customised software routine, theinstant of stimulation was computed in order to makeinterpolated twitch (IT) moments to peak at exactly 40
of knee flexion during extension [1]. Three consecu-
tive ISOK procedures were performed for each limb.The same procedure was then administered to the con-tralateral limb. Figure 1 summarizes the experimentalprotocol for one lower limb.
2.3.8. Surface electromyography (sEMG) recordingThe sEMG was recorded at rest to ascertain the fully
relaxed state of the vastus lateralis and the homolat-eral biceps femoris muscle. Two pairs of silver chloridesurface electrodes were applied to each muscle accord-ing to the SENIAM guidelines [35]. Low impedance(< 10 kΩ) of the skin-electrode interface was achievedby gently abrading the skin. The centre-to-centre inter-electrode distance was 2 cm. The reference electrodewas applied over the contralateral patella. EMG sig-nals were recorded simultaneously with the joint mo-ment signal and were used to evaluate the participant’srelaxed state. EMG data were sampled at 1000 Hz.The EMG signal was amplified (× 1000) and filtered(bandpass 50–1000 Hz) using a CED 1902 amplifier(Cambridge Electronic Design, Cambridge, UK).
2.3.9.1. Data acquisition and analysisA signal acquisition system (CED 1401, Cambridge
Electronic Designed Limited-Ced, Cambridge) wasused to simultaneously record knee moment, angle, andangular velocity through the isokinetic dynamometer.These variables were sampled at 500 Hz. A customisedsoftware (Spike 2, version 8, Cambridge Electronic De-sign Limited-CED, Cambridge) connected to the ac-quisition system controlled the electric stimulator ineliciting the stimulus at the desired knee angle. The av-erage moment applied to the transducer when the lowerlimb was fully extended was used to offset the gravi-tational moment at all angles by proper computation.Moment signals were off-line filtered (low-pass FIRfilter, 1.3 Hz).

L. Catino et al. / Minimal real difference of quadriceps activation 281
Fig. 2. Tracings from a representative participant (woman, 35 years,53 kg, 163 m). The gravity-corrected moment (Nm), on the ordinate,is given as a function of time (s), on the abscissa. From top to bottom,in the left column the panels refer to a maximal isometric contractionat 40 knee angle (0 = full extension) (ISOM), a maximal isoki-netic contraction at 100/s (ISOK), and a continuous passive motion(CPM) at 100/s, respectively. In the top panel the first moment peak(resting twitch) anticipates the beginning of the voluntary effort bya variable interval of 2–3 s (see the break on the abscissa). Arrowsmark the delivery of the doublet. The dashed rectangles delimit theevents occurring in a short time frame encasing the superimposedtwitch. The straight gray segments represent the regression line builton the moment values observed just before the doublet: 300 ms inISOM, 50 ms in ISOK, and 100 ms in CPM, respectively. In the rightcolumn, events in the rectangles are zoomed-in. Circles delimit theregression time windows. The upper and lower black triangles givethe peak of the increment following the doublet, and the moment thatwould have occurred, in the same instant of time, without stimula-tion, respectively. The difference between the observed peak and thesynchronously estimated moment gives the IT value [1].
The VA was determined by the following formula:
V A =
[1 − IT
RT
]%
where IT and RT are the peak moments caused bythe electric doublets during the voluntary contractionand at rest, respectively. During ISOM contractions,pre-contraction RT was adopted in the computation ofVA. Indeed, like the twitch during contraction the post-
contraction RT may exhibit some potentiation, but itmay also be diminished by fatigue [36,37]. The pre-contraction twitch is preferred for consistency withISOK computation of VA [1]. During ISOK contrac-tions, the time course of the moments was visually anal-ysed off-line to detect any gross abnormalities. In par-ticular, IT had to occur during the descending part ofthe bell-shaped moment curve (see ref. 1 for details)(Fig. 2).
2.3.9.2. Algebraic considerationsThe goal of this study was the computation of the
minimal real difference (MRD) of VA, at two timepoints. The MRD is the minimal change that cannot beattributed to random error, only (usually, at p < 0.05).Here, MRD is based on the test-retest reliability esti-mated through the ICC. Both the ICC and the MRD for-mulations assume linearity of the measures [25]. Thisis not the case for VA, which is a proportion boundedbetween 0 and 1 (0 to 100 percentage scores) and thusflawed by non-linearity. Therefore, VA raw percentageswere converted into their logit (log-odd ratio) coun-terparts to account, here, for the expected ceiling ef-fect [38]. The logit formulation of VA (VAl) is
V Al = logit = logP
(1 − P )
where P is the observed proportion, i.e., the raw VApercent measure. It is of note that logits are negativefor ratios < 1 (hence, for VA < 50%). However, pro-portions equal to 1 (which are far from exceptional inVA studies) provide infinite logit values, thus prevent-ing a valid estimate of change of VAl both at an aggre-gate and individual level. Neglecting VA values equalto 100%, in this study the observed VAl values rangedbetween VAl = 0.29 (VA = 34%) and VAl = 3.54 (VA= 99.97%). Whether a “real change” is achieved canbe deducted also from percentage measures, if these arelogit-transformed and their difference compared withthe logit-based MRD provided in this study.
2.3.10. Statistical analysesFor each participant, the best repetition out of two
ISOM contractions and out of three ISOK contrac-tions were selected for statistical analysis [39–41]. Thenormality of data distribution was assessed using theShapiro-Wilk’s test. When applicable, means (SD) werecomputed and Student’s t-test and repeated ANOVA(rANOVA) models were applied. For non-normal data,medians (2nd–3rd interquartile range-IQR) were com-puted, and the Wilcoxon signed-rank test was adopted.

282 L. Catino et al. / Minimal real difference of quadriceps activation
Table 1Means, medians, first lower quartiles (Q1) and third upper quartiles(Q3) for age, weight, height, body mass index (BMI) of the dominantand the non-dominant limbs of the twenty-five participants
Mean Median Q1 Q3Age (years) 27.3 26.0 24.0 30.0Weight (kg) 70.4 71.0 59.0 78.0Height (cm) 174.8 176.0 166.0 183.0BMI (kg m−2) 22.9 22.1 21.0 24.0
Fig. 3. The ordinate gives the voluntary activation (VA) values ofthe participants (n = 25). Panel A) refers to isometric contractions(ISOM); panel B) refers to isokinetic knee extension contractions at100/s (ISOK). Values recorded at baseline (T0) and retest (T1) aregiven separately for the dominant and the nondominant lower limbs.Each dot represents the best performance of a single participant.Individual values at T0 and T1 are connected by straight segments(“spaghetti” graph). Filled dots refer to men; empty dots refer towomen.
As an index of test-retest reliability the ICC was com-puted on the VAl transformed values. The ICC2,1 modelwas adopted (all participants with test-retest measures;participants considered as a random sample of a generalpopulation; measures refer to one observation, only).The MRDs at a 95% confidence level were then com-puted (Eq. 10 in ref. 25).
The absolute agreement between VAl values at T0
Fig. 4. The left ordinate gives the voluntary activation levels afterlogit transformation (VAl). The right ordinate gives the correspond-ing measures of VA (% values). Only values of VA < 100% arerepresented. Other indications as in Fig. 3.
and T1 was assessed through the Bland-Altman plot,computing the difference and the mean between theVAl values at T0 and T1, its SD, 95% tolerance lim-its, and 95% confidence limits. At variance with con-fidence limits, applied to estimated means, tolerancelimits can be applied to individual observations [42]and are, therefore, wider [43,44]. The significance levelwas set at 0.05.
2.3.11. SoftwareComputations, statistics, and graphic representa-
tions were performed using MATLABTM (MathWorksInc., version 8, Natick, MA, USA), STATATM (STATACorp., version 14.0, College Station, TX, USA), andSigmaPlotTM (Systat software Inc., version 14.0, SanJosé, CA, USA) software.
3. Results
Twenty-five subjects (12 women), median age 27.3(24.0 ÷ 30.0) years, median weight 71.0 (59.0 ÷ 78.0)
L. Catino et al. / Minimal real difference of quadriceps activation 283
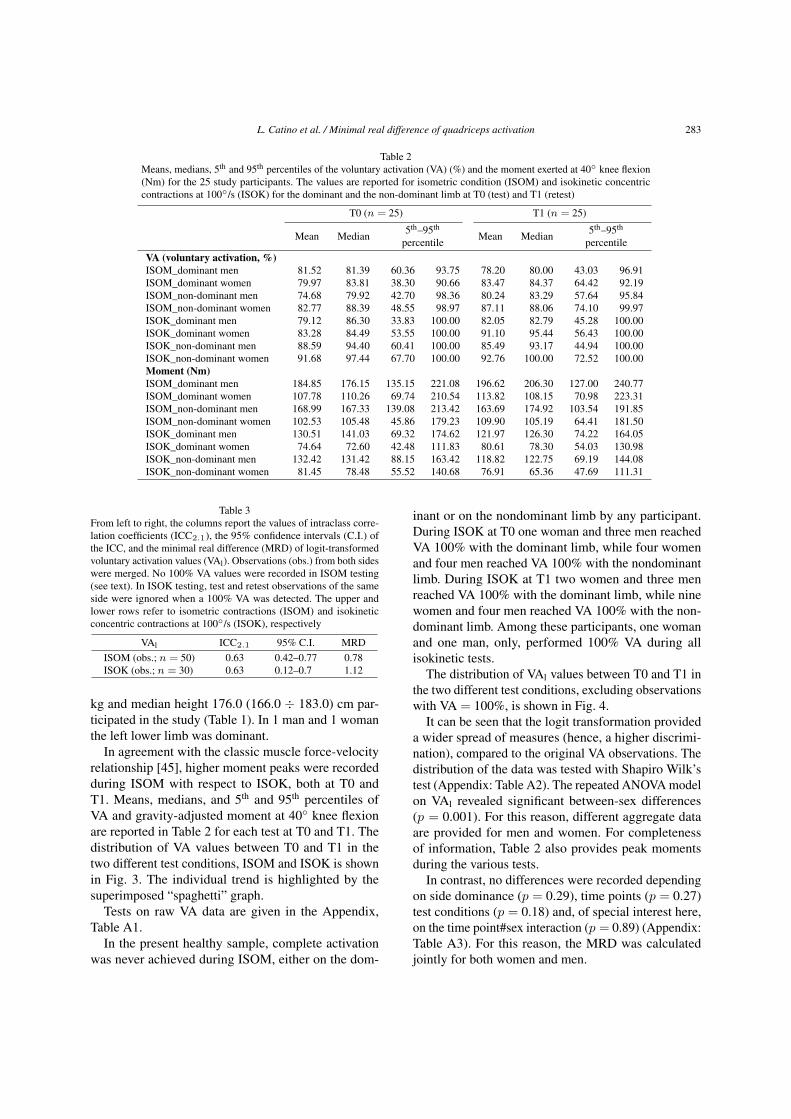
Table 2Means, medians, 5th and 95th percentiles of the voluntary activation (VA) (%) and the moment exerted at 40 knee flexion(Nm) for the 25 study participants. The values are reported for isometric condition (ISOM) and isokinetic concentriccontractions at 100/s (ISOK) for the dominant and the non-dominant limb at T0 (test) and T1 (retest)
T0 (n = 25) T1 (n = 25)
Mean Median 5th–95th
percentile Mean Median 5th–95th
percentileVA (voluntary activation, %)ISOM_dominant men 81.52 81.39 60.36 93.75 78.20 80.00 43.03 96.91ISOM_dominant women 79.97 83.81 38.30 90.66 83.47 84.37 64.42 92.19ISOM_non-dominant men 74.68 79.92 42.70 98.36 80.24 83.29 57.64 95.84ISOM_non-dominant women 82.77 88.39 48.55 98.97 87.11 88.06 74.10 99.97ISOK_dominant men 79.12 86.30 33.83 100.00 82.05 82.79 45.28 100.00ISOK_dominant women 83.28 84.49 53.55 100.00 91.10 95.44 56.43 100.00ISOK_non-dominant men 88.59 94.40 60.41 100.00 85.49 93.17 44.94 100.00ISOK_non-dominant women 91.68 97.44 67.70 100.00 92.76 100.00 72.52 100.00Moment (Nm)ISOM_dominant men 184.85 176.15 135.15 221.08 196.62 206.30 127.00 240.77ISOM_dominant women 107.78 110.26 69.74 210.54 113.82 108.15 70.98 223.31ISOM_non-dominant men 168.99 167.33 139.08 213.42 163.69 174.92 103.54 191.85ISOM_non-dominant women 102.53 105.48 45.86 179.23 109.90 105.19 64.41 181.50ISOK_dominant men 130.51 141.03 69.32 174.62 121.97 126.30 74.22 164.05ISOK_dominant women 74.64 72.60 42.48 111.83 80.61 78.30 54.03 130.98ISOK_non-dominant men 132.42 131.42 88.15 163.42 118.82 122.75 69.19 144.08ISOK_non-dominant women 81.45 78.48 55.52 140.68 76.91 65.36 47.69 111.31
Table 3From left to right, the columns report the values of intraclass corre-lation coefficients (ICC2.1), the 95% confidence intervals (C.I.) ofthe ICC, and the minimal real difference (MRD) of logit-transformedvoluntary activation values (VAl). Observations (obs.) from both sideswere merged. No 100% VA values were recorded in ISOM testing(see text). In ISOK testing, test and retest observations of the sameside were ignored when a 100% VA was detected. The upper andlower rows refer to isometric contractions (ISOM) and isokineticconcentric contractions at 100/s (ISOK), respectively
VAl ICC2.1 95% C.I. MRDISOM (obs.; n = 50) 0.63 0.42–0.77 0.78ISOK (obs.; n = 30) 0.63 0.12–0.7 1.12
kg and median height 176.0 (166.0 ÷ 183.0) cm par-ticipated in the study (Table 1). In 1 man and 1 womanthe left lower limb was dominant.
In agreement with the classic muscle force-velocityrelationship [45], higher moment peaks were recordedduring ISOM with respect to ISOK, both at T0 andT1. Means, medians, and 5th and 95th percentiles ofVA and gravity-adjusted moment at 40 knee flexionare reported in Table 2 for each test at T0 and T1. Thedistribution of VA values between T0 and T1 in thetwo different test conditions, ISOM and ISOK is shownin Fig. 3. The individual trend is highlighted by thesuperimposed “spaghetti” graph.
Tests on raw VA data are given in the Appendix,Table A1.
In the present healthy sample, complete activationwas never achieved during ISOM, either on the dom-
inant or on the nondominant limb by any participant.During ISOK at T0 one woman and three men reachedVA 100% with the dominant limb, while four womenand four men reached VA 100% with the nondominantlimb. During ISOK at T1 two women and three menreached VA 100% with the dominant limb, while ninewomen and four men reached VA 100% with the non-dominant limb. Among these participants, one womanand one man, only, performed 100% VA during allisokinetic tests.
The distribution of VAl values between T0 and T1 inthe two different test conditions, excluding observationswith VA = 100%, is shown in Fig. 4.
It can be seen that the logit transformation provideda wider spread of measures (hence, a higher discrimi-nation), compared to the original VA observations. Thedistribution of the data was tested with Shapiro Wilk’stest (Appendix: Table A2). The repeated ANOVA modelon VAl revealed significant between-sex differences(p = 0.001). For this reason, different aggregate dataare provided for men and women. For completenessof information, Table 2 also provides peak momentsduring the various tests.
In contrast, no differences were recorded dependingon side dominance (p = 0.29), time points (p = 0.27)test conditions (p = 0.18) and, of special interest here,on the time point#sex interaction (p = 0.89) (Appendix:Table A3). For this reason, the MRD was calculatedjointly for both women and men.
284 L. Catino et al. / Minimal real difference of quadriceps activation
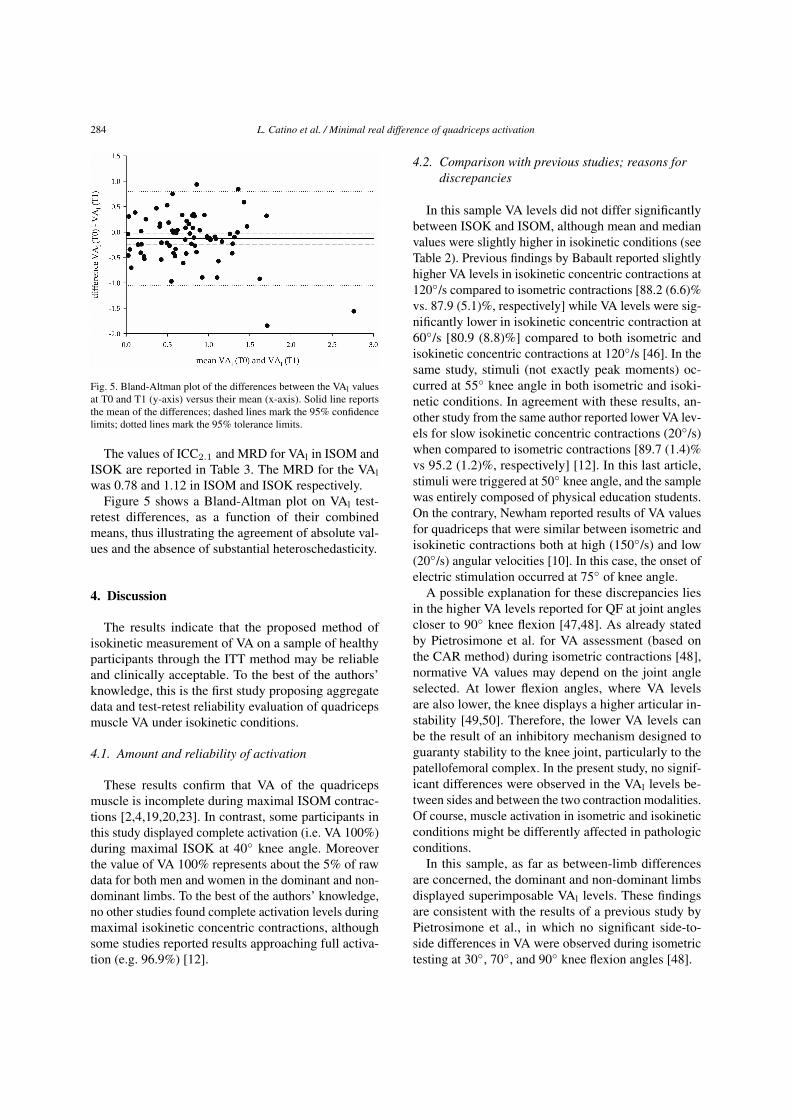
Fig. 5. Bland-Altman plot of the differences between the VAl valuesat T0 and T1 (y-axis) versus their mean (x-axis). Solid line reportsthe mean of the differences; dashed lines mark the 95% confidencelimits; dotted lines mark the 95% tolerance limits.
The values of ICC2.1 and MRD for VAl in ISOM andISOK are reported in Table 3. The MRD for the VAlwas 0.78 and 1.12 in ISOM and ISOK respectively.
Figure 5 shows a Bland-Altman plot on VAl test-retest differences, as a function of their combinedmeans, thus illustrating the agreement of absolute val-ues and the absence of substantial heteroschedasticity.
4. Discussion
The results indicate that the proposed method ofisokinetic measurement of VA on a sample of healthyparticipants through the ITT method may be reliableand clinically acceptable. To the best of the authors’knowledge, this is the first study proposing aggregatedata and test-retest reliability evaluation of quadricepsmuscle VA under isokinetic conditions.
4.1. Amount and reliability of activation
These results confirm that VA of the quadricepsmuscle is incomplete during maximal ISOM contrac-tions [2,4,19,20,23]. In contrast, some participants inthis study displayed complete activation (i.e. VA 100%)during maximal ISOK at 40 knee angle. Moreoverthe value of VA 100% represents about the 5% of rawdata for both men and women in the dominant and non-dominant limbs. To the best of the authors’ knowledge,no other studies found complete activation levels duringmaximal isokinetic concentric contractions, althoughsome studies reported results approaching full activa-tion (e.g. 96.9%) [12].
4.2. Comparison with previous studies; reasons fordiscrepancies
In this sample VA levels did not differ significantlybetween ISOK and ISOM, although mean and medianvalues were slightly higher in isokinetic conditions (seeTable 2). Previous findings by Babault reported slightlyhigher VA levels in isokinetic concentric contractions at120/s compared to isometric contractions [88.2 (6.6)%vs. 87.9 (5.1)%, respectively] while VA levels were sig-nificantly lower in isokinetic concentric contraction at60/s [80.9 (8.8)%] compared to both isometric andisokinetic concentric contractions at 120/s [46]. In thesame study, stimuli (not exactly peak moments) oc-curred at 55 knee angle in both isometric and isoki-netic conditions. In agreement with these results, an-other study from the same author reported lower VA lev-els for slow isokinetic concentric contractions (20/s)when compared to isometric contractions [89.7 (1.4)%vs 95.2 (1.2)%, respectively] [12]. In this last article,stimuli were triggered at 50 knee angle, and the samplewas entirely composed of physical education students.On the contrary, Newham reported results of VA valuesfor quadriceps that were similar between isometric andisokinetic contractions both at high (150/s) and low(20/s) angular velocities [10]. In this case, the onset ofelectric stimulation occurred at 75 of knee angle.
A possible explanation for these discrepancies liesin the higher VA levels reported for QF at joint anglescloser to 90 knee flexion [47,48]. As already statedby Pietrosimone et al. for VA assessment (based onthe CAR method) during isometric contractions [48],normative VA values may depend on the joint angleselected. At lower flexion angles, where VA levelsare also lower, the knee displays a higher articular in-stability [49,50]. Therefore, the lower VA levels canbe the result of an inhibitory mechanism designed toguaranty stability to the knee joint, particularly to thepatellofemoral complex. In the present study, no signif-icant differences were observed in the VAl levels be-tween sides and between the two contraction modalities.Of course, muscle activation in isometric and isokineticconditions might be differently affected in pathologicconditions.
In this sample, as far as between-limb differencesare concerned, the dominant and non-dominant limbsdisplayed superimposable VAl levels. These findingsare consistent with the results of a previous study byPietrosimone et al., in which no significant side-to-side differences in VA were observed during isometrictesting at 30, 70, and 90 knee flexion angles [48].

L. Catino et al. / Minimal real difference of quadriceps activation 285
The present study revealed statistically significantdifferences between women and men, with womendemonstrating higher VAl levels. To the best of the au-thors’ knowledge, no studies have reported significantbetween-sex differences in VA for either ISOM, iso-tonic [51] or ISOK results. Krishnan et al. observedhigher mean VA levels for women compared to men,during ISOM testing at 60 knee flexion with differ-ent quantification methods (ITT and CAR), but thesedifferences between sexes were not statistically signif-icant [8]. However, their statistical analysis was per-formed on raw VA data.
Of relevance here, in the above cited studies andin most currently used isokinetic VA measurementtechniques, the electrical stimulus was triggered whenthe joint reaches a certain angle during its movement.This technique of stimulation introduces an elementof variability in the time of elicitation of the interpo-lated twitch along the curve because its latency de-pends on many factors: type of contraction (isometricvs. isokinetic), joint angular velocity, muscle conduc-tion velocity, electrode positioning, time for excitation-contraction coupling, and tendon stiffness [1]. There-fore, comparisons are difficult when different angularvelocities and knee joint angles are involved. In con-trast, the stimulation technique performed in the presentstudy is characterised by the computation of the instantof stimulation in order to have the peak of the interpo-lated twitch to occur consistently at exactly the desiredknee angle [1].
4.3. Advantages of logit linearisation
In the present study, only the analysis performedon transformed data was able to detect a sex-relateddifference in VAl levels. The analysis of raw data wasflawed by ceiling effects and non-normal distributionsThe observed sex-related difference may reflect:
a) a difference in muscle fibre structure. Althoughthe overall distribution of fast and slow fibre typesin the vastus lateralis muscle is similar betweenwomen and men, a significant difference existswhen the total area occupied by each fibre type isconsidered. In a study by Staron et al. [52], slowfibres were observed to occupy a greater area inthe vastus lateralis muscle of women, whereasfast IIA fibres occupied a greater area in the vas-tus lateralis muscle of men. According to Hen-neman’s size principle of motor unit recruitment,the fast motor units also have the highest recruit-ment thresholds [53]. As already hypothesised by
Behm et al. [2], fast-twitch predominant musclesmay be more difficult to fully activate during vol-untary contractions. Therefore, when comparedto women, the quadriceps femoris muscle of menmight display lower mean and median values involuntary activation levels.
b) The results may reflect a (hardly avoidable) me-chanical artefact. Since VA is calculated as thecomplement to the ratio of IT and RT, the modifi-cation of one of these two parameters would alterthe resulting VA value. In particular, an anteriortilt of the pelvis during knee extension would im-ply a shortening of the rectus femoris muscle and,as a consequence, a loss of knee extensor mo-ment. The subsequent reduction of IT would leadto an increase in VA. Anatomical resting pelvictilt does not display significant betweensex differ-ences [54,55]. Nevertheless, women are known tohave significantly lower abdominal muscle thick-ness than men [56], hence a potentially lower ca-pacity for preventing pelvic tilt during maximalknee-extension effort. In addition, women mightdemonstrate later onsets in anticipatory posturaladjustments of trunk muscles compared to menin single lower limb lift movements [57]. Again,these differences may eventually lead to a pelvictilt causing lower IT peaks and higher VA esti-mates in women.
4.4. The need for a logit transformation
The suggestion of using logit units, unfamiliar tomost clinicians, may appear a major limitation of themethod. However, the simple computation of the MRD(second Equation in the Methods) can be easily per-formed on any spreadsheet or hand calculator. Thisvalue represents a threshold that is easy to interpret fordecisions on individuals. Its critical advantage on per-centage scores is that the measure of change becomesindependent of the baseline values. In other words, a1-logit change means the same amount of change of“activation” at whatever level of the 0–100% scale. Itis not so for raw percent changes, which are “com-pressed” (and therefore, underestimated) when the VAvalues are approaching the extremes of the acceptablerange [46]. The linearization problem, often overlookedin the biomedical literature, arises with VA but not withmoments: these are intrinsically linear (i.e., a 1-momentchange means the same change whatever was the base-line level). Moments, however, were not the topic of thepresent article.

286 L. Catino et al. / Minimal real difference of quadriceps activation
The provided MRD values found here can be usedto exemplify the logit-to-percentages transformationof change values. The MRD was 0.78 and 1.12 logitsfor ISOM and ISOK, respectively. A 0.78 logit changemight reflect a change in VA from 28% to 70% (see thesecond Equation in the Methods) and from 76% to 95%.Likewise, a 1.12 logit change might reflect a change inVA from 79% to 98% and from 30% to 85%. In clin-ical practice, mirror reasoning may apply. The typicalquestion may be checking whether a given observedpercentage change does reveal or not a “real” change. Inthe latter example above, baseline and retest ISOK VAvalues of 30% and 85% correspond to −0.37 and 0.75logits, respectively. The change is [0.75 − (−0.37)] =1.12 logits: it may be concluded that the MRD thresh-old is attained (Table 3) so that the change is “real”.Suppose, however, that the same percent change (55%)occurred between a baseline value of 20% and a retestvalue of 75%. In logit terms, this equals a increase ofchange of [−0.12 − (−0.69)] = 0.57 logit, below thethreshold for a “real” change.
4.5. On the size of the observed MRD
In clinical terms, the MRD values of activation, forboth ISOM and ISOK contexts, seem rather large.Stated otherwise, a large change must be observed be-fore it can be considered as “real”. This may reflecta) limitations of the present study as well as b) difficul-ties intrinsic to the measurement of this variable.
a) In this particular study, some test-retest instabil-ity (thus increasing the MRD) may be due to thesmall sample size and to the presence of out-liers. On the other hand, there were no previ-ously available data allowing for a-priori estima-tion of sample size. In addition, even smaller sam-ple sizes are common in the literature on isoki-netic quadriceps dynamometry [10,12,46]. Someinstability might also stem from the absence ofsubstantial habituation-learning processes, pre-vented by the experimental design. On the otherhand, the design aimed to reproduce clinical con-texts, in which no substantial practice is usuallyallowed.
b) With respect to activation itself, this seems to beintrinsically unstable. In fact, VA is a psychologi-cal (not a biological) variable which may be in-fluenced by numerous extraneous factors (learn-ing, fatigue, fear, motivation, attention, etc.). Inaddition, in human physiology the maximumvoluntary muscle activation is close to its limit
(i.e., 100%). The “crowding” of values hindersthe precision of measurement, hence reliabilitystudies.
Last, a “real” change, i.e., a statistically significantone, is not necessarily a clinically important one. Ingeneral, clinical “significance” requires statistical sig-nificance, but the cut-off is higher and based on ex-ternal criteria (e.g., mortality risk, the incidence of agiven disease, success probability in an examination,or whatever) [58]. In the case of VAl, however, clinicalexperience may suggest a more lenient attitude: consis-tent increments across subsequent retest sessions mayincrease the confidence that some improvement is on-going, although “significance” was not reached withinpairs of subsequent assessments.
4.6. Further limitations and conclusions
The study limits cannot be overemphasised. The re-sults refer to isometric contraction and to one isokineticvelocity (100/s), only, thus limiting the generalizabilityof the estimated MRD to other conditions. More impor-tantly, the MRD values provided here can be validly ap-plied only if the whole measurement procedure is repli-cated, like for any other reliability-based index [25,59].Lastly, in case full activation is recorded, the assessmentof change becomes problematic. Possibly, reaching fullactivation might be considered as a favourable outcomeirrespective of the observed change. All considered, theproposed method and values seem to represent usefultools for the assessment of change after rehabilitationor sports training programs, refining the assessmentsbased on raw VA percentages.
Acknowledgments
The authors have no acknowledgments.
Author contributions
CONCEPTION: Luigi Tesio.PERFORMANCE OF WORK: Luigi Catino, ChiaraMalloggi, Valeria Cerina and Stefano Scarano.INTERPRETATION OR ANALYSIS OF DATA: LuigiCatino, Chiara Malloggi, Stefano Scarano and LuigiTesio.PREPARATION OF MANUSCRIPT: Luigi Catino andStefano Scarano.REVISION FOR IMPORTANT INTELLECTUALCONTENT: Luigi Catino Chiara Malloggi, Valeria Ce-rina, Stefano Scarano, Viviana Rota and Luigi Tesio.SUPERVISION: Luigi Tesio.
L. Catino et al. / Minimal real difference of quadriceps activation 287
Ethical considerations
All participants gave written informed consent beforeparticipating. The study was approved by the ethicscommittee of the institution (project code 24C721_2017, date of approval 14th November 2017). The studyconformed to the Code of Ethics of the World MedicalAssociation (Declaration of Helsinki 2013) for medicalresearch involving human participants.
Conflict of interest
The authors have no conflicts of interest to report.
Funding
The study was supported by Istituto Auxologico Ital-iano, IRCCS [AMULET, “ricerca corrente” projectcode 24C721_2017].
References
[1] Malloggi C, Catino L, Rota V, et al. (2019). Measuring vol-untary activation of the quadriceps femoris during isokineticconcentric contractions. Isokinetic Exerc Sci. 27: 125–134.doi: 10.3233/IES-182224.
[2] Behm DG, Whittle J, Button D, Power K. (2002). Intermuscledifferences in activation. Muscle and Nerve. 25: 236–243. doi:10.1002/mus.10008.
[3] Taylor JL. (2009). Point: the interpolated twitch does providea valid measure of the voluntary activation of muscle. J ApplPhysiol. 107: 354–358. doi: 10.1152/japplphysiol.91220.2008.
[4] Belanger AY, McComas AJ. (1981). Extent of motor unit acti-vation during effort. J Appl Physiol Respir Env Exerc Physiol.51: 1131–1135.
[5] Campbell EL, Seynnes OR, Bottinelli R, et al. (2013). Skele-tal muscle adaptations to physical inactivity and subsequentretraining in young men. Biogerontology. 14: 247–259. doi:10.1007/s10522-013-9427-6.
[6] Matkowski B, Martin A, Lepers R. (2011). Comparison ofmaximal unilateral versus bilateral voluntary contraction force.Eur J Appl Physiol. 111: 1571–1578. doi: 10.1007/s00421-010-1775-1.
[7] De Serres SJ, Enoka RM, Serres D. (1998). Older adults canmaximally activate the biceps brachii muscle by voluntarycommand. J Appl Meas. 84: 284–291.
[8] Krishnan C, Williams GN. (2010). Quantification method af-fects estimates of voluntary quadriceps activation. Muscle andNerve. 41: 868–874. doi: 10.1002/mus.21613.
[9] Gandevia SC, Herbert RD, Leeper JB. (1998). Voluntary ac-tivation of human elbow flexor muscles during maximal con-centric contractions. J Physiol. 512: 595–602. doi: 10.1111/J.1469-7793.1998.595BE.X.
[10] Newham DJ, McCarthy T, Turner J. (1991). Voluntary activa-tion of human quadriceps during and after isokinetic exercise.J Appl Physiol. 71: 2122–2126. doi: 10.1152/jappl.1991.71.6.2122.
[11] Gandevia SC, McNeil CJ, Carroll TJ, Taylor JL. (2013). Twitchinterpolation: superimposed twitches decline progressivelyduring a tetanic contraction of human adductor pollicis. J Phys-iol. 591: 1373–83. doi: 10.1113/jphysiol.2012.248989.
[12] Babault N, Pousson M, Ballay Y, Van Hoecke J. (2001). Acti-vation of human quadriceps femoris during isometric, concen-tric, and eccentric contractions. J Appl Physiol. 91: 2628–2634.doi: 10.1152/jappl.2001.91.6.2628.
[13] Duchateau J, Enoka RM. (2016). Neural control of lengthen-ing contractions. J Exp Biol. 219: 197–204. doi: 10.1242/jeb.123158.
[14] Wilder MR, Cannon J. (2009). Effect of age on muscle activa-tion and twitch properties during static and dynamic actions.Muscle and Nerve. 39: 683–691. doi: 10.1002/mus.21233.
[15] Linnamo V, Strojnik V, Komi PV. (2006). Maximal force dur-ing eccentric and isometric actions at different elbow angles.Eur J Appl Physiol. 96: 672–678. doi: 10.1007/s00421-005-0129-x.
[16] Rice CL, Vollmer TL, Bigland-Ritchie B. (1992). Neuromus-cular responses of patients with multiple sclerosis. MuscleNerve. 15: 1123–1132. doi: 10.1002/mus.880151011.
[17] Phillips SK, Bruce SA, Newton D, Woledge RC. (1992). Theweakness of old age is not due to failure of muscle activation.J Gerontol. 47: M45–49.
[18] Rutherford OM, White PD. (1991). Human quadriceps strengthand fatiguability in patients with post viral fatigue. J NeurolNeurosurg Psychiatry. 54: 961–964.
[19] Kalmar JM, Cafarelli E. (1999). Effects of caffeine on neuro-muscular function. J Appl Physiol. 87: 801–808.
[20] Strojnik V. (1995). Muscle activation level during maximalvoluntary effort. Eur J Appl Physiol Occup Physiol. 72: 144–149.
[21] Morton JP, Atkinson G, MacLaren DP, et al. (2005). Reliabil-ity of maximal muscle force and voluntary activation as mark-ers of exercise-induced muscle damage. Eur J Appl Physiol.94: 541–548. doi: 10.1007/s00421-005-1373-9.
[22] Kean CO, Birmingham TB, Garland SJ, et al. (2010). Minimaldetectable change in quadriceps strength and voluntary muscleactivation in patients with knee osteoarthritis. Arch Phys MedRehabil. 91: 1447–1451. doi: 10.1016/j.apmr.2010.06.002.
[23] Behrens M, Husmann F, Gube M, et al. (2017). Intersessionreliability of the interpolated twitch technique applied duringisometric, concentric, and eccentric actions of the human kneeextensor muscles. Muscle Nerve. 56: 324–327. doi: 10.1002/mus.25498.
[24] Portney L, Watkins M. (2015). Statistical measures of reliabil-ity. In: Foundations of clinical research. Applications to prac-tice, 3rd ed. F.A. Davis Company, Philadelphia, pp. 585–618.
[25] Tesio L. (2012). Outcome measurement in behavioural sci-ences: a view on how to shift attention from means to individ-uals and why. Int J Rehabil Res. 35: 1–12. doi: 10.1097/MRR.0b013e32834fbe89.
[26] Beckerman H, Roebroeck ME, Lankhorst GJ, et al. (2001).Smallest real difference, a link between reproducibility andresponsiveness. Qual Life Res. 10: 571–578. doi: 10.1023/A:1013138911638.
[27] Elias LJ, Bryden MP, Bulman-Fleming MB. (1998). Footed-ness is a better predictor than is handedness of emotional later-alization. Neuropsychologia. 36: 37–43. doi: 10.1016/S0028-3932(97)00107-3.

288 L. Catino et al. / Minimal real difference of quadriceps activation
[28] Li CK, Chan KM, Hsu SY, et al. (1993). The Johnson antisheardevice and standard shin pad in the isokinetic assessment of theknee. Br J Sports Med. 27: 49–52. doi: 10.1136/bjsm.27.1.49.
[29] Suter E, Herzog W. (2001). Effect of number of stimuli andtiming of twitch application on variability in interpolatedtwitch torque. J Appl Physiol. 90: 1036–1040. doi: 10.1152/jappl.2001.90.3.1036.
[30] Bampouras TM, Reeves ND, Baltzopoulos V, Maganaris CN.(2006). Muscle activation assessment: effects of method, stim-ulus number, and joint angle. Muscle Nerve. 34: 740–746. doi:10.1002/mus.20610.
[31] Folland JP, Williams AG. (2007). Methodological issues withthe interpolated twitch technique. J Electromyogr Kinesiol. 17:317–327. doi: 10.1016/j.jelekin.2006.04.008.
[32] Nørregaard J, Lykkegaard JJ, Bülow PM, Danneskiold-SamsøeB. (1997). The twitch interpolation technique for the estimationof true quadriceps muscle strength. Clin Physiol. 17: 523–532.doi: 10.1046/j.1365-2281.1997.05555.x.
[33] Bülow PM, Nørregaard J, Mehlsen J, Danneskiold-SamsøeB. (1995). The twitch interpolation technique for study offatigue of human quadriceps muscle. J Neurosci Methods. 62:103–109. doi: 10.1016/0165-0270(95)00062-3.
[34] Pap G, Machner A, Awiszus F. (2004). Strength and volun-tary activation of the quadriceps femoris muscle at differentseverities of osteoarthritic knee joint damage. J Orthop Res.22: 96–103. doi: 10.1016/S0736-0266(03)00128-1.
[35] Hermens HJ, Freriks B, Merletti R, et al. (1999). EuropeanRecommendations for Surface ElectroMyoGraphy.
[36] Kufel TJ, Pineda LA, Jeffery Mador M. (2002). Comparison ofpotentiated and unpotentiated twitches as an index of musclefatigue. Muscle and Nerve. 25: 438–444. doi: 10.1002/mus.10047.
[37] Place N, Maffiuletti NA, Martin A, Lepers R. (2007). Assess-ment of the reliability of central and peripheral fatigue aftersustained maximal voluntary contraction of the quadricepsmuscle. Muscle Nerve. 35: 486–495. doi: 10.1002/mus.20714.
[38] Warton DI, Hui FKC. (2011). The arcsine is asinine: the anal-ysis of proprtions in ecology. Ecology. 92: 3–10.
[39] Canning CG, Ada L, O’Dwyer N. (1999). Slowness to developforce contributes to weakness after stroke. Arch Phys MedRehabil. 80: 66–70. doi: 10.1016/S0003-9993(99)90309-X.
[40] Marklund I, Klässbo M. (2006). Effects of lower limb inten-sive mass practice in poststroke patients: single-subject exper-imental design with long-term follow-up. Clin Rehabil. 20:568–576. doi: 10.1191/0269215506cr973oa.
[41] Wade D. (1992). Measurement in neurological rehabilitation.Oxford University Press.
[42] Tesio L, Rota V, Chessa C, Perucca L. (2010). The 3D pathof body centre of mass during adult human walking on forcetreadmill. J Biomech. 43: 938–944. doi: 10.1016/j.jbiomech.2009.10.049.
[43] Cavagna GA, Tesio L, Fuchimoto T, Heglund NC. (1983).Ergometric evaluation of pathological gait. J Appl Physiol. 55:607–613. doi: 10.1152/jappl.1983.55.2.606.
[44] Altman DG, Bland JM. (1983). Measurement in medicine: theanalysis of method comparison studies. Stat. 32: 307–311.
[45] Hill AV. (1938). The heat of shortening and the dynamic con-stants of muscle. Proc R Soc B Biol Sci. 126: 136–195. doi:10.1098/rspb.1938.0050.
[46] Babault N, Pousson M, Michaut A, et al. (2002). EMG ac-tivity and voluntary activation during knee-extensor concen-tric torque generation. Eur J Appl Physiol. 86: 541–547. doi:10.1007/s00421-002-0579-3.
[47] Krishnan C, Theuerkauf P. (2015). Effect of knee angle onquadriceps strength and activation after anterior cruciate lig-ament reconstruction. J Appl Physiol. 119: 223–231. doi:10.1152/japplphysiol.01044.2014.
[48] Pietrosimone BG, Park CM, Gribble PA, et al. (2012). Inter-limb differences in quadriceps strength and volitional activa-tion. J Sports Sci. 30: 471–477. doi: 10.1080/02640414.2011.645054.
[49] Philippot R, Boyer B, Testa R, et al. (2012). The role of themedial ligamentous structures on patellar tracking during kneeflexion. Knee Surgery, Sport Traumatol Arthrosc. 20: 331–336.doi: 10.1007/s00167-011-1598-6.
[50] Sanchis-Alfonso V. (2016). How to deal with chronic patellarinstability: what does the literature tell us? Sports Health. 8:86–90. doi: 10.1177/1941738115604156.
[51] Berger MJ, McKenzie CA, Chess DG, et al. (2012). Sex dif-ferences in quadriceps strength in OA. Int J Sports Med. 33:926–933. doi: 10.1055/s-0032-1311587.
[52] Staron RS, Hagerman FC, Hikida RS, et al. (2000). Fiber typecomposition of the vastus lateralis muscle of young men andwomen. J Histochem Cytochem. 48: 623–629. doi: 10.1177/002215540004800506.
[53] Henneman E, Clamann HP, Gillies JD, Skinner RD. (1974).Rank order of motoneurons within a pool: law of combination.J Neurophysiol. 37: 1338–49. doi: 10.1152/jn.1974.37.6.1338.
[54] Imai N, Suzuki H, Nozaki A, et al. (2019). Evaluation ofanatomical pelvic parameters between normal, healthy menand women using three-dimensional computed tomography:a cross-sectional study of sex-specific and age-specific differ-ences. J Orthop Surg Res. 14: 1–7. doi: 10.1186/s13018-019-1165-2.
[55] Herrington L. (2011). Assessment of the degree of pelvic tiltwithin a normal asymptomatic population. Man Ther. 16: 646–648. doi: 10.1016/j.math.2011.04.006.
[56] Rankin G, Stokes M, Newham DJ. (2006). Abdominal musclesize and symmetry in normal subjects. Muscle and Nerve. 34:320–326. doi: 10.1002/mus.20589.
[57] Bussey MD, de Castro MP, Aldabe D, Shemmell J. (2018).Sex differences in anticipatory postural adjustments duringrapid single leg lift. Hum Mov Sci. 57: 417–425. doi: 10.1016/j.humov.2017.10.003.
[58] Page F. (2014). Clinical commentary beyond statistical signif-icance: clinical interpretation of rehabilitation research corre-sponding author. Int J Sports Phys Ther. 9: 726–736.
[59] Shrout PE, Fleiss JL. (1979). Intraclass correlations: uses inassessing rater reliability. Psychol Bull. 86: 420–428.
L. Catino et al. / Minimal real difference of quadriceps activation 289
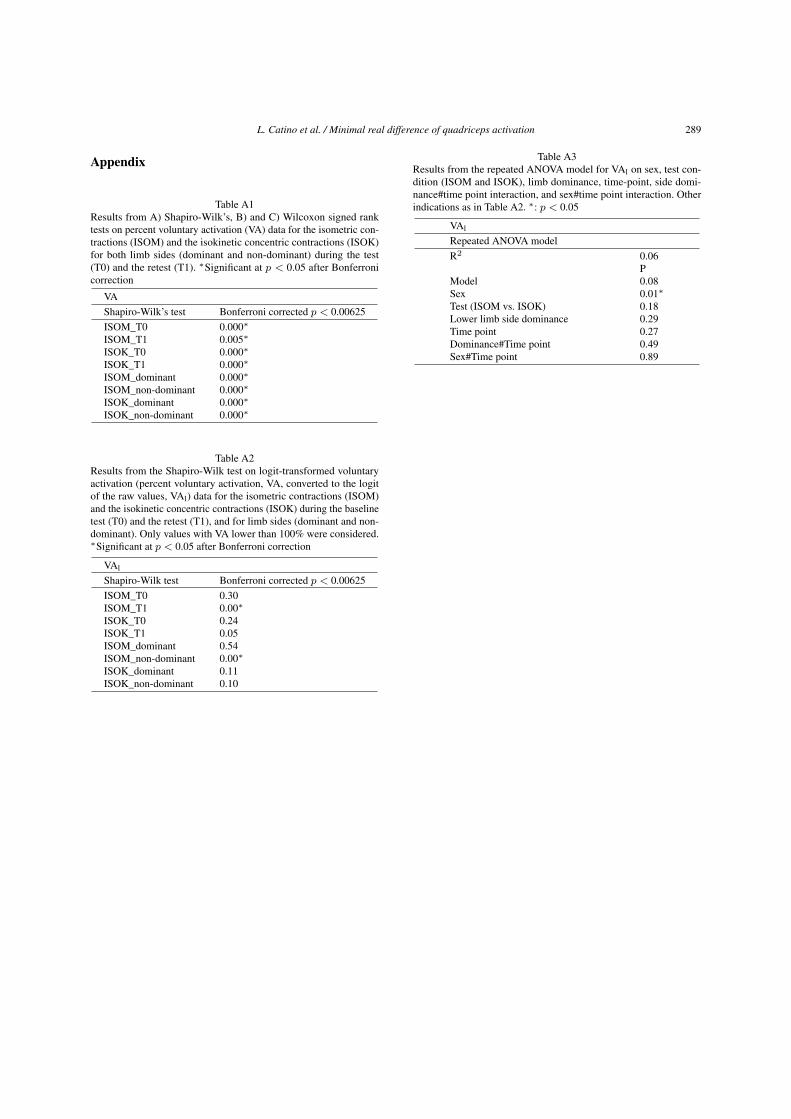
Appendix
Table A1Results from A) Shapiro-Wilk’s, B) and C) Wilcoxon signed ranktests on percent voluntary activation (VA) data for the isometric con-tractions (ISOM) and the isokinetic concentric contractions (ISOK)for both limb sides (dominant and non-dominant) during the test(T0) and the retest (T1). ∗Significant at p < 0.05 after Bonferronicorrection
VAShapiro-Wilk’s test Bonferroni corrected p < 0.00625ISOM_T0 0.000∗
ISOM_T1 0.005∗
ISOK_T0 0.000∗
ISOK_T1 0.000∗
ISOM_dominant 0.000∗
ISOM_non-dominant 0.000∗
ISOK_dominant 0.000∗
ISOK_non-dominant 0.000∗
Table A2Results from the Shapiro-Wilk test on logit-transformed voluntaryactivation (percent voluntary activation, VA, converted to the logitof the raw values, VAl) data for the isometric contractions (ISOM)and the isokinetic concentric contractions (ISOK) during the baselinetest (T0) and the retest (T1), and for limb sides (dominant and non-dominant). Only values with VA lower than 100% were considered.∗Significant at p < 0.05 after Bonferroni correction
VAl
Shapiro-Wilk test Bonferroni corrected p < 0.00625ISOM_T0 0.30ISOM_T1 0.00∗
ISOK_T0 0.24ISOK_T1 0.05ISOM_dominant 0.54ISOM_non-dominant 0.00∗
ISOK_dominant 0.11ISOK_non-dominant 0.10
Table A3Results from the repeated ANOVA model for VAl on sex, test con-dition (ISOM and ISOK), limb dominance, time-point, side domi-nance#time point interaction, and sex#time point interaction. Otherindications as in Table A2. ∗: p < 0.05
VAl
Repeated ANOVA modelR2 0.06
PModel 0.08Sex 0.01∗
Test (ISOM vs. ISOK) 0.18Lower limb side dominance 0.29Time point 0.27Dominance#Time point 0.49Sex#Time point 0.89