“isolation and characterisation of antibiotic isolation and characterisation of antibiotic...
TRANSCRIPT

“Isolation and Characterisation of Antibiotic producing Microbes
present in Rhizospheric soil”
Surabhi Arora
1,Dipika Nandi
2,Namrata Prasad
3, ,Saurabh Rawat
4 ,Amit Pandey
a
Graphic Era university,Dehradun1,2,3,4
and MRD Life Sciencesa
ABSTRACT
Different Soil samples of Calotropis procera and Catharanthus roseus were subjected for
antibacterial activity of microbes, extraction of secondary metabolites i.e both intracellular
and extracellular, and characterisation. Three type of colony were found i.e white, off-white
and yellow. Further using Bergers’ manual Macrococcusluteus ,N.sicca were obtained.
Secondary metabolites i.e intacellular and extracellular were extracted using solvents
chloroform and methanol. Antibiotic sensitivity test was performed against
pathogen(E.coli,P.aeroginosa and S.aureus) and the best Zone of inhibition was of culture of
Catharanthus roseus i.e 28.5 mm. Different test were performed to characterise the microbes.
This was performed in order to isolate microbes that produce antibiotic and then further be
used for medicinal purpose.
Keywords:-Zone of Inhibition, Antibiotic Sensitivity Test, Bergey’s Manual.
1. INTRODUCTION
An antibiotics (against life) is a compound or
substance that kills or slows down the growth
of bacteria. Antibiotics include a
chemically heterogeneous group of small
organic molecules of microbial origin that,
at low concentrations, are deleterious to
the growth or metabolic activities.
1.1Mode of action of antibiotics
1.1.1 Cell Wall Synthesis Inhibitors
1.1.2 Interfering with Protein Synthesis
1.1.3 Cell Membrane Inhibitors
1.1.4 Effect on Nucleic Acids
1.1.5 Competitive Inhibitors
1.2The main classes of antibiotics
1.2.1 Beta-Lactams
a.Penicillin
b.Cephalosporins
1.2.2 Macrolides
1.2.3 Tetracyclines
1.2.4 Aminoglycosides
2. METHODOLOGY
2.1 Collection of soil sample
2.1.1 Serial dilution: Serial dilution
method is perform to get reduce number of
bacterial colonies to pure colonies. It is the
volume of the sample to the total volume
of the sample and dilutants. For this 30ml
of 0.85% NaCl was prepared and 5ml
NaCl was poured in the first test tube and
4.5 ml in rest test tubes and autoclaved.
0.5grm of soil was added in 1st test tube
and serial dilution method was performed
(10-1
to 10-5
).
2.2 Primary screening of bacterial
species for antibacterial compound
production
2.2.1 Sub culturing:- was done in NA
media by spreading 50 µl of culture on NA
plates with spreader and incubating the
plates at 37ºC for overnight.
2.2.2 Pure culturing: Derived from a
mixed culture (containing many species)
by transferring a small sample into new
sterile growth medium in such a manner as
to disperse the individual cells across the
International Journal of Scientific & Engineering Research, Volume 4, Issue 9, September-2013 ISSN 2229-5518
1157
IJSER © 2013 http://www.ijser.org
IJSER
medium. Pure culture contain a single
species of organism.
A pinch of culture on a inoculation loop
was taken from the spreaded plates (10-1
,
10-3
and 10-5
),and streaked over NA plates
and incubated at 37ºC for overnight.
2.3 Secondary Screening of Bacterial
species for antibacterial compound
production
2.3.1 Antibiotic Sensitivity Test
With constant exposure to different
environmental conditions, microbes
develop self resistant and develop drug
resistant against the compound. If
antibiotic will be effective then they will
show zone of inhibition against the
pathogen and if culture will be resistive
then culture will show full growth in the
presence of antibody.
NB broth was prepared, inoculated and
incubated at 37ºC in shaker for overnight.
NA plates were prepared and 50µl of
E.coli, P.aeruginosa, S.aureus each culture
was spreaded on different NA plates. 3
wells were prepared on each plates and
50µl of sample was pipetted in ech well
and plates were incubated.
2.3.2 Growth kinetics: It is applied to determine the time period
at which the culture show its optimum
activity(stationary phase). Growth of any
microbe occurs in different stages: Lag
phase, Log phase, Stationary phase,
Decline phase. In 50 ml NB 50µl of
bacterial culture was inoculated and
incubated at 37°C and O.D was taken at
620 nm day by day until stationary phase
is obtained.
2.3.3 Extraction of secondary
metabolites from isolated culture: solvents chloroform and methnol were
used. Metabolites extracted due to
difference in phase i.e extracellular were
dissolve in chloroform and these
metabolites comes in bottom layer where
as the intracellular were dissolve in
methnol and these metabolites were
observed in top layer. Mixing of
metabolites depend on the polarity of
solvent.
NB was prepared and inoculated. It was
then incubated in shaker incubator at 37ºC
for days in order to obtain stationary
phase. After incubation 5 ml was
transfered in falcon tube and centrifuged at
5000rpm for 5 min.
a) For Intracellular (pellet) - The pellet
was dissolved in 2.5 ml of methanol and
mixed properly for 30 minutes.
Centrifugation was done at 10000 rpm for
10 min. Top layer was collected in a new
tube and air dried, it was then dissolve in
100nM Tris HCl pH8 and again Antibiotic
Sensitivity test was performed.
b) For Extracellular (supernatant) - To
the supernatant equal volume of
chloroform was added and mixed properly
for 30 minute and centrifuged at 10000
rpm for 10 min and bottom layer was
transferred to new tube and air dried. It
was then dissolved in 100nM Tris Hcl pH
8, again AST was performed.
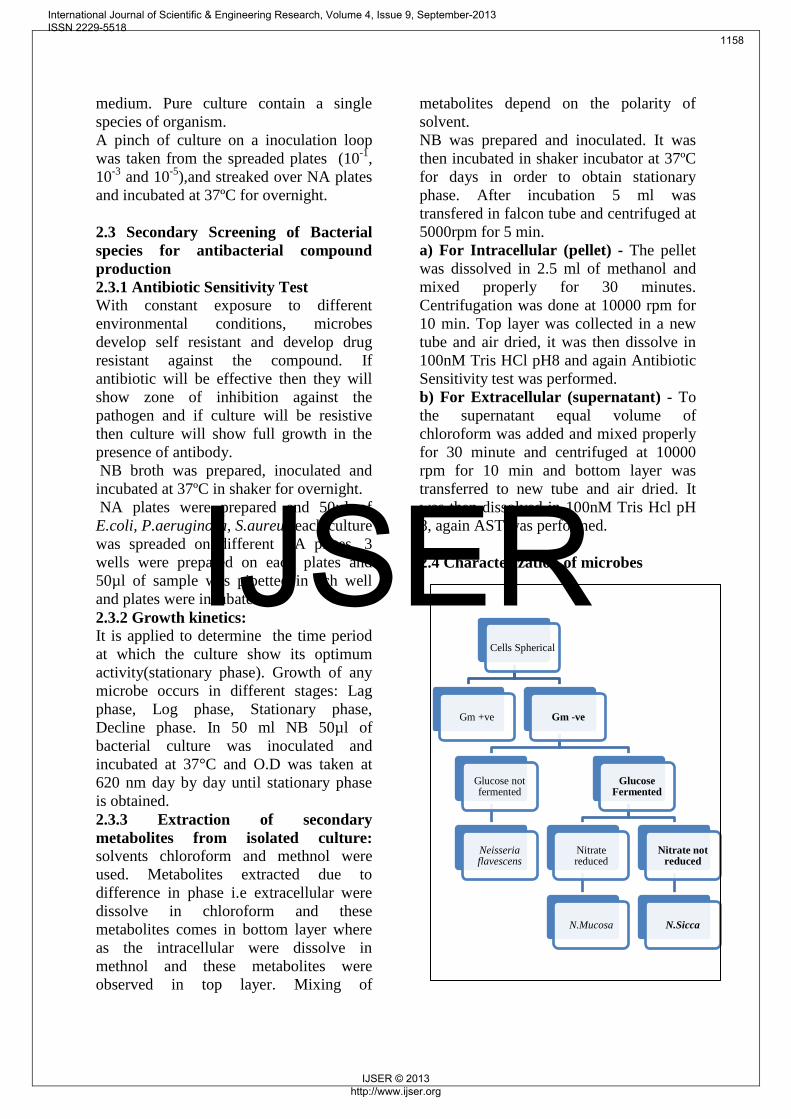
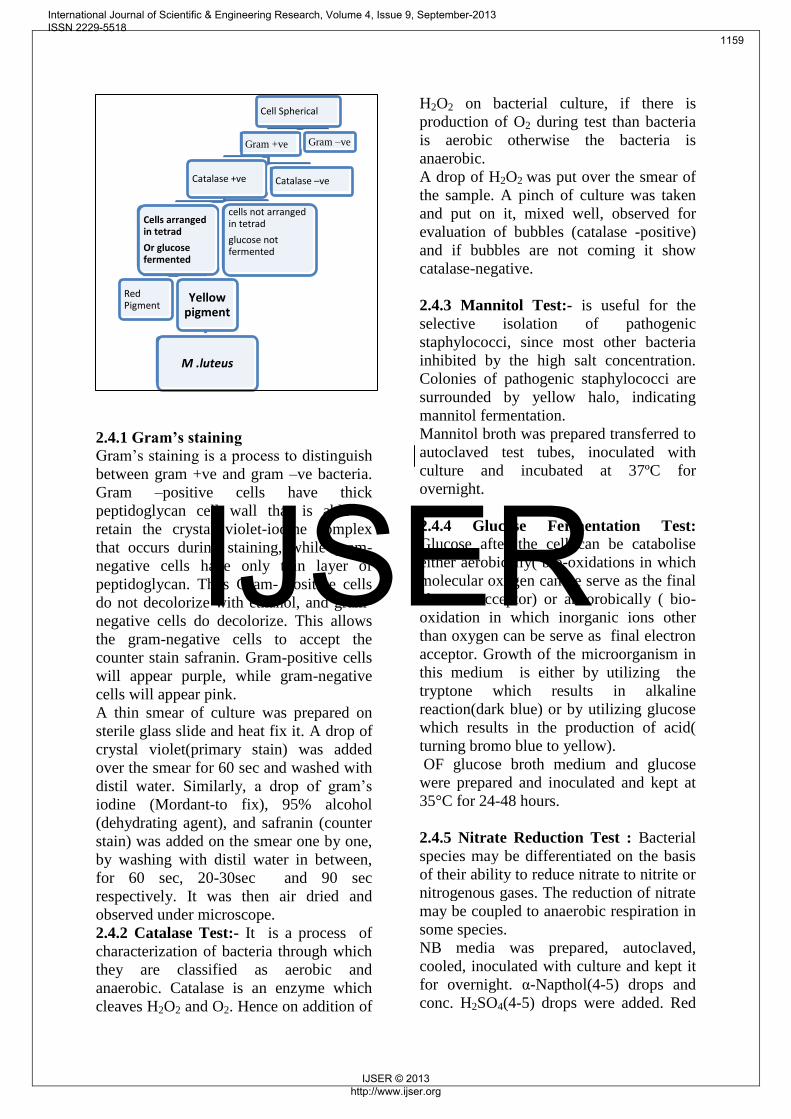
2.4 Characterization of microbes
Cells Spherical
Gm +ve Gm -ve
Glucose not fermented
Neisseria flavescens
Glucose Fermented
Nitrate reduced
N.Mucosa
Nitrate not reduced
N.Sicca
International Journal of Scientific & Engineering Research, Volume 4, Issue 9, September-2013 ISSN 2229-5518
1158
IJSER © 2013 http://www.ijser.org
IJSER
2.4.1 Gram’s staining
Gram’s staining is a process to distinguish
between gram +ve and gram –ve bacteria.
Gram –positive cells have thick
peptidoglycan cell wall that is able to
retain the crystal violet-iodine complex
that occurs during staining, while gram-
negative cells have only thin layer of
peptidoglycan. Thus Gram- positive cells
do not decolorize with ethanol, and gram-
negative cells do decolorize. This allows
the gram-negative cells to accept the
counter stain safranin. Gram-positive cells
will appear purple, while gram-negative
cells will appear pink.
A thin smear of culture was prepared on
sterile glass slide and heat fix it. A drop of
crystal violet(primary stain) was added
over the smear for 60 sec and washed with
distil water. Similarly, a drop of gram’s
iodine (Mordant-to fix), 95% alcohol
(dehydrating agent), and safranin (counter
stain) was added on the smear one by one,
by washing with distil water in between,
for 60 sec, 20-30sec and 90 sec
respectively. It was then air dried and
observed under microscope.
2.4.2 Catalase Test:- It is a process of
characterization of bacteria through which
they are classified as aerobic and
anaerobic. Catalase is an enzyme which
cleaves H2O2 and O2. Hence on addition of
H2O2 on bacterial culture, if there is
production of O2 during test than bacteria
is aerobic otherwise the bacteria is
anaerobic.
A drop of H2O2 was put over the smear of
the sample. A pinch of culture was taken
and put on it, mixed well, observed for
evaluation of bubbles (catalase -positive)
and if bubbles are not coming it show
catalase-negative.
2.4.3 Mannitol Test:- is useful for the
selective isolation of pathogenic
staphylococci, since most other bacteria
inhibited by the high salt concentration.
Colonies of pathogenic staphylococci are
surrounded by yellow halo, indicating
mannitol fermentation.
Mannitol broth was prepared transferred to
autoclaved test tubes, inoculated with
culture and incubated at 37ºC for
overnight.
2.4.4 Glucose Fermentation Test: Glucose after the cell can be catabolise
either aerobically( bio-oxidations in which
molecular oxygen can be serve as the final
electron acceptor) or aneorobically ( bio-
oxidation in which inorganic ions other
than oxygen can be serve as final electron
acceptor. Growth of the microorganism in
this medium is either by utilizing the
tryptone which results in alkaline
reaction(dark blue) or by utilizing glucose
which results in the production of acid(
turning bromo blue to yellow).
OF glucose broth medium and glucose
were prepared and inoculated and kept at
35°C for 24-48 hours.
2.4.5 Nitrate Reduction Test : Bacterial
species may be differentiated on the basis
of their ability to reduce nitrate to nitrite or
nitrogenous gases. The reduction of nitrate
may be coupled to anaerobic respiration in
some species.
NB media was prepared, autoclaved,
cooled, inoculated with culture and kept it
for overnight. α-Napthol(4-5) drops and
conc. H2SO4(4-5) drops were added. Red
Cell Spherical
Gram +ve
Catalase +ve
Cells arranged in tetrad
Or glucose fermented
Red Pigment
Yellow pigment
M .luteus
cells not arranged in tetrad
glucose not fermented
Catalase –ve
Gram –ve
International Journal of Scientific & Engineering Research, Volume 4, Issue 9, September-2013 ISSN 2229-5518
1159
IJSER © 2013 http://www.ijser.org
IJSER

and pink colour indicate positive nitrate
reduction and vice-versa.
2.4.6 Methyl Red and Voges-Proskauer
test: are used to differentiate two major
types of facultatively anerobic enteric
bacteria that produce large amounts of
acid and those that produce the neutral
products acetoin as end product. If the
organism produces large amount of
organic acids end product from glucose the
medium will remain red (positive test)
after the addition of methyl red a pH
indicator. If methyl red turn yellow a
negative test.
MRVP broth(pH 6.9) was prepared and
autoclaved. It was innoculatedand
incubated at 35°C for 48 hours. 5 drops of
methyl red indicator was added and
observed for colour change. 12 drops of V-
P reagent and 2-3 drops of V-P reagent II
was added. It is then shaken gently for 30
sec. The reaction was left to complete for
15-30 min to observe color change.
2.4.7 Endospore test: An aqueous
primary stain (malachite green) is applied
and steamed to enhance penetration of the
impermeable spore coats. Once stained the
endospores do not readily decolorize and
appear green within red cells.
A thin smear of culture was made and
Malachite green was added in the pressure
of water vapours for 5 min. After washing
Safranin was added to it for 40 sec further
it was again washed with distilled water,
air dried and observed under the
microscope.
3.RESULTS
In this paper, a total of 7 cultures of
bacteria were isolated from the collected
sample of soil from lakashmanpuri, Gomti
Nagar, Lucknow,India. 3 were obtained
from the Caranthus roseus and 4 were of
Calathropis procera.
3.1 Serial Dilution :- Through serial
dilution, microbes were isolates from soil
sample of Calathrophis procera and
Catharanthus roseus. Mixed culture were
obtained by spreading different colonies
like white, off-white and yellow.
Spreading results:
Fig1:Colonies of Calatropis procera Fig 2:Colonies of Catharanthus roseus
Table 1:Morphology of Calotropis procera
Colony
Morphology
C1
C2
C3
Shape Regular Irregular Regular
Colour Yellow White White
Texture Smooth Smooth Smooth
Elevation Flat Flat Flat
Margin Entire Lobate Entire
Opacity Transparent Transparent Transparent
Table 2:Morphology of Catharanthus roseus
Colony
Morphology
C1 C2 C3
Shape Regular Regular Fusi form
Colour Yellow White Off White
Texture Smooth Smooth Gummy
Elevation elevated Flat Flat
Margin Entire Entire Undulant
Opacity Opaque Opaque Opaque
Fig 1
Fig 2
International Journal of Scientific & Engineering Research, Volume 4, Issue 9, September-2013 ISSN 2229-5518
1160
IJSER © 2013 http://www.ijser.org
IJSER

3.2 Pure culturing
With the help of streaking pure colonies
were obtained through streaking from
mixed colonies. Fig 3: Streaking result of Catharanthus roseus
Fig 4 : Streaking result of Calotropis procera
3.3 Staining results: Gram positive
bacteria retain violet colour while gram
negative retain pink colour. Both negative
and positive bacteria were obtained.
Fig 5:Microscopic view of Calotropis procera
a) C1 A,Gram Negative cocci(pink colour) b) C2 A, Gram Negative cocci(pink colour)
c) C3 A,Gram Positive rods(purple colour) d) C4 A, Gram Negative cocci(pink colour)
a)
C 1
C 2
C 3
C 4
C 1
C 2
C 3
b)
c)
d)
International Journal of Scientific & Engineering Research, Volume 4, Issue 9, September-2013 ISSN 2229-5518
1161
IJSER © 2013 http://www.ijser.org
IJSER

Fig6: Microscopic view of Catharanthus roseus
a) C1 S,Gram Positive Cocci (purple colour)
b) C2 S,Gram Positive Cocci (purple colour) c) C1 S,Gram Positive Cocci (purple colour)
3.4 Primary Screening:
3.4.1Antibiotic sensitivity test result:- Fig 7 :Results of ASTCalotropis procera
Fig 8:Results of ASTCathranthus roseus
c)
b)
a)
E.coli P.aeroginosa
S.aureus
P.aeroginosa
S.aureus
E.coli
International Journal of Scientific & Engineering Research, Volume 4, Issue 9, September-2013 ISSN 2229-5518
1162
IJSER © 2013 http://www.ijser.org
IJSER

3.4.1 a)Secondary Screening:
Extraction of Secondary Metabolites
Table 3 : Zone of Inhibition obtained during AST
Images of AST Fig9.ASTC2-S
Fig10.ASTC3-S
Culture Pathogen Intracellular Extracellular Intra+Extra
C2-S Pseudomonas 6.5mm -- 14mm
C2-S S.aureus 22.5mm 11mm 11mm
C2-S E.coli 15.5mm 10.5 19mm
C3-S Pseudomonas 28.5mm 29mm 27.5mm
C3-S S.aureus 28.5mm 11.5mm 25mm
C3-S E.coli 28.0mm 29.0mm 27.0mm
C1-A Pseudomonas -- -- --
C1-A S.aureus -- -- --
C1-A E.coli -- -- --
C2-A Pseudomonas 11.5mm 13.0mm 12.0mm
C2-A S.aureus 15.0mm -- 13.0mm
C2-A E.coli 14.5mm 13mm 14.5mm
C3-A Pseudomonas -- -- --
C3-A S.aureus -- -- --
C3-A E.coli -- -- --
C4-A Pseudomonas -- -- --
C4-A S.aureus -- -- --
C4-A E.coli -- -- --
P.aeroginosa
S.aureus
E.coli
P.aeroginosa
S.aureus
E.coli
International Journal of Scientific & Engineering Research, Volume 4, Issue 9, September-2013 ISSN 2229-5518
1163
IJSER © 2013 http://www.ijser.org
IJSER

Fig11.ASTC1-A
Fig12.ASTC2-A
Fig13.ASTC4-A
Pseudomonas E.coli
S.aureus
3.5.Identification & charachterization
through Bergey’s manual Table 4: Illustrates biochemical analysis of isolated
Cultures
Bioche
mical
Tests
C1
-A
C2
-A
C
3-
A
C4
-A
C1
-S
C2
-S
C3
-S
Gram
Staining
-ve
Co
cci
-ve
Co
cci
+v
e
ro
ds
-ve
Co
cci
+v
e
co
cci
+v
e
Co
cci
+v
e
Co
cci
Catalas
e Test
-
-
-
-
+v
e
--
+v
e
+v
e
+v
e
Endosp
ore Test
-
-
-
-
+v
e
--
-
ve
+v
e
-
ve
Glucose
Ferment
ation
+v
e
+v
e
-- +v
e
MRVP
test
-- -- -- -- -- --
Nitrate
Test
-ve -ve -- -ve - -- --
By the help of Bergey’s Manual following
was observed:
P.aeroginosa
S.aureus
E.coli
P.aeroginosa
S.aureus
E.coli
P.aeroginosa
S.aureus
E.coli
International Journal of Scientific & Engineering Research, Volume 4, Issue 9, September-2013 ISSN 2229-5518
1164
IJSER © 2013 http://www.ijser.org
IJSER

Table 5: Illustrates the microbes identified through
various biochemical tests.
Culture Microbe identified:
C1-A N.Sicca
C2-A N.Sicca
C3-A B. sutilis
C4-A N.sicca
C1-S M. lutes
C2-S M. lutes
C2-S M. lutes
4. CONCLUSION
This paper is carried out to study isolation
and characterization of antibiobiotic
producing microbes present in soilTotal 7
cultures were isolated through serial
dilutionmethod and they were
characterised using Bergey’s manual and
the identified cultures were
N.Sicca,M.lutes and B.subtilis these
cultures were subjected to antibiotic
sensitivity test against bacterial
pathogens(E.coli,P.aeruginosa and
S.aureus) and a little Zone of inhibition
was observed. Further Intracellular and
extracellular metabolites were extracted
and then they were subjected to Antibiotic
Sensitivity test, the Zone of Inhibition was
observed with the best
Result in intracellular metabolites of
M.letus about 28.5mm.
These can be used to prepare medicine for
human being. Earlier there was not much
antibiotics for various diseases but now
due to technology antibiotics can be easily
produced.
ACKNOWLEDGMENT
I am very much indebted to Dr. Rajeev Dutta
dean graphic era university for providing such
oppurtunity and for constant encouragement
throughout the project.
I also wish to place on records my indebtness
to Mr.Amit Pandey,Research Scientist,MRD
Life Sciences,Lucknow for their sustained co-
operation,interest and encouraged
throughout this project work.
I am also very thankful to Dr. Saurab Rawat
research Scientist Graphic Era University who
helped me a lot while working in this project.
I am also thankful to my parents and friends
who rendered a helping hand in the hour of
need.
6. REFERENCES
1. Butler.Jessica L, Williams.Mark A,
Bottomley.Peter J ,and Myrold.David D,
2003. Microbial Community Dynamics
Associated with Rhizosphere Carbon
Flow. Applied and environmental
microbiology, 69(11), 6793–6800.
2. Berggren.I, Alström.S and
Mårtensson.A.M.2001,Rhizosphere
bacteria on field pea (Pisum sativum)
under gnotobiotic and non-sterile
conditions. Applied Soil Ecology,16,169–
177. 3. Ramakrishnan Jayapradha,
Shunmugasundaram Murugesh, and
Narayanan Mahesh.2009, Streptomyces
sp. isolated from rhizosphere soil of
medicinal plants. Iranian journal of
biotechnology 7(2),285-289.
4. Kawo et al;(2009), phytochemical
properties and antibacterial activities of the
Leaf and latex extracts of calotropis
procera. Bayero Journal of Pure and
Applied Sciences, 2(1): 34 -40.
5. Khamna S., Yokota A. & Lumyong A.
2009, Actinomycetes isolated from
medicinal plant rhizosphere soils: diversity
and screening of antifungal compounds.
indole-3-acetic acid and siderophore
production. World J MIcrobiol Biotechnol.
25:649–655.
6. Kumar.Aditya ,MAngla.Chavi,
Aggarwal.Ashok and Prakash.Vipin.2010,
Arbuscular mycorrhyzal fungal dynamics
in the rhizospheric soil of 5 medicinal
plant species. Middle-east Journal of
Scientific Research. 6(3),281-288.
International Journal of Scientific & Engineering Research, Volume 4, Issue 9, September-2013 ISSN 2229-5518
1165
IJSER © 2013 http://www.ijser.org
IJSER
7. Kitouni ;2005,Isolation of
actinomycetes producing bioactive
substances from water, soil and tree bark
samples. Journal de Mycologie Médicale
15:45–51.
8. Loper.Joyce E,Haack.T Caryn, and
Schroth.Milton N.1985,Population
Dynamics of Soil Pseudomonas in the
Rhizosphere of Potato (Solanum
tuberosum L.). Applied and environmental
microbiology,49(2),416-422.
9. Makut.M.D and
Owolewa.O.A;2011,antibiotic-producing
fungi present in the soil.Trakia Journal of
Sciences. 9(2), 33-39.
10. Mellado.Jesu’s Caballero,
Lemus.Janette Onofre, Santos.Paulina
Estrada-de los,
and Aguilar.Lourdes Marti nez;2007, The
Tomato Rhizosphere rich in Nitrogen-
Fixing Burkholderia Species with
Capabilities of Interest for Agriculture and
Bioremediation. Applied and
environmental microbiology,73(16),5308–
5319.
Morello.J.E,Pierson.E.A, and Pierson
III.L.S;2004, Negative Cross-
Communication among 11. Wheat
Rhizosphere Bacteria:Effect on Antibiotic
Production by the Biological Control
Bacterium Pseudomonas aureofaciens.
Applied and environmental microbiology,
70(5),3103–3109.
12. Singh.Atul pratap,Singh.R.B and
Mishra.Sanjay;2012, Microbial and
Biochemical Aspects of Antibiotic
Producing Microorganisms from Soil
Samples of Certain Industrial Area of
India. The Open Nutraceuticals Journal,5,
107-112.
13. Neubauer scoot.C, Emerson David and
Megonigal J. Patrick;2002, Kinetics of
Circumneutral Iron Oxidation by
Lithotrophic Iron-Oxidizing Bacteria
Isolated from the Plant Rhizosphere.
Applied and environmental
microbiology,68(8), 3988–3995.
14. Pavithra.N, Sathish.L,Ananda.K;2012,
Antimicrobial and Enzyme Activity of
Endophytic Fungi Isolated from Tulsi.
Journal of pharmaceutical and biomedical
sciences. 16 (12).
15. Peterson.Snow Brook, Dunn. Anne K,
Klimowicz.Amy K, and Handelsman.Jo.
2006,Peptidoglycan from Bacillus cereus
Mediates Commensalism with
Rhizosphere Bacteria from the Cytophaga-
Flavobacterium Group. Applied and
environmental microbiology, 72(8),5421–
5427. 16. Rajkumar H.G, Seema H.S and Sunil
Kumar C. P;2012, Diversity of arbuscular
mycorrhizal fungi associated with some
medicinal plants. World Journal of Science
and Technology , 2(1),13-20.
17. Ramyasmruthi.S*, Pallavi .O,
Pallavi.S, Tilak.K and Srividya.S.2012,
Chitinolytic and secondary metabolite
producing Pseudomonas fluorescens
isolated from Solanaceae rhizosphere
effective against fungal phytopathogens.
Asian Journal of Plant Science and
Research,2 (1),16-24.
18.
Tamilarasi.S,Nanthakumar.K,Karthikeyan.
KandLakshmanaperumalsamy.P;2008,the
antimicrobial property of
Rhizomicroorganisms of the medicinal
plant Coriandrum sativum.Journal of
Environmental Biology.29(1),127-134.
19. Tokala.Ranjeet K, Strap.Janice L,
Jung.Carina M, Crawford.Don L,
Salove.Michelle hamby, Lee A.
Deobald.Lee A, Bailey.J Franklin, and
Morra.J.M;2002, Plant-Microbe
Rhizosphere Interaction Involving
Streptomyces lydicus WYEC108 and the
Pea Plant (Pisum sativum). Applied and
environmental microbiology,
68(5),2161–2171. 20. Battu P. R. & Reddy M.S.2009,
Isolation of secondary metabolites from
Pseudomonas fluorescence & its
characterization. Asian J. Research Chem.
2(1):26-29.
International Journal of Scientific & Engineering Research, Volume 4, Issue 9, September-2013 ISSN 2229-5518
1166
IJSER © 2013 http://www.ijser.org
IJSER