isolation and characterization of human gingival …
TRANSCRIPT

ISOLATION AND CHARACTERIZATION OF HUMAN GINGIVAL FIBROBLASTS
By
Samira Diar-Bakirly
A thesis submitted in partial fulfillment of the requirements for the degree of
Master
of
Science
Faculty of Medicine and Dentistry
University of Alberta
©Samira Diar-Bakirly, 2019

ii
Abstract
Background: Gingival fibroblasts (GFs) that exhibit characteristics similar to adult stem
cells are also known as gingival mesenchymal stem cells (GMSCs). These cells can be
isolated using either tissue explants or enzymatic digestion, however it is unknown
whether the isolation method influences the GMSCs potential for differentiation. In
addition, no specific mesenchymal stem cell (MSC) marker has been reported to identify
and distinguish GMSCs from GFs. Recently, the cell surface molecule known as cluster
of differentiation (CD) 146 has been identified as a potential MSC cell surface marker.
Objective: To investigate the differentiation potential of GMSCs based on CD146
expression.
Hypothesis: CD146 is the MSC surface marker that identifies GMSCs among a
population of GFs regardless of the isolation method employed.
Materials and methods: GFs were isolated by two techniques: tissue explants or
enzymatic digestion. GFs were cultured and expanded in a medium containing fibroblast
growth factor 2 (FGF-2), and magnetically sorted according to CD146 expression. Four
experimental groups were collected: CD146low and CD146high from explant-derived
isolation and CD146low and CD146high from digestion-derived isolation. Each group of
cells was expanded and then tested for stem cell markers using flow cytometry before it
was subjected to osteogenic and chondrogenic differentiation. Multilineage
differentiation outcome was tested after 21 days using histology, immunofluorescence,
real-time quantitative PCR (qPCR), and glycosaminoglycan (GAG) to DNA ratio
(GAG/DNA) assays.
Results: As confirmation of osteogenic differentiation, alizarin red staining was positive
for all groups with no significant difference between osteogenic gene expressions. The

iii
absence of Safranin O staining accompanied by low GAG production negates
chondrogenic differentiation. This lack of chondrogenesis was further confirmed by
immunofluorescence assay, which indicated no deposition of collagen type II in the
extracellular matrix (ECM) of GFs aggregates.
Conclusion: CD146 is not the specific stem cell surface marker to identify and enrich
the GMSC population. Its expression did not enhance the osteogenic potential
differentiation potential of sorted GFs regardless of the implemented isolation method.

iv
Preface
This thesis is an original work by Samira Diar-Bakirly. The research project, of which
this thesis is a part, received research ethics approval from the University of Alberta
Research Ethics Board, Project Name “Effect of Gingival Fibroblasts and Ultrasound
on Tooth Root Resorption in Humans,” No. Pro00056111, October 28, 2014 (Approval
Renewal Date).

v
Acknowledgment:
This study has been funded by the University Hospital Foundation Medical Research
Competition (UHFMRC) grant.

vi
Table of Contents
CHAPTER 1 LITERATURE REVIEW .............................................................................................. 1
1.1 Anatomy and Physiology of the Gingiva .......................................................................................... 1
1.1.1 Tissue Repair of the Gingiva ........................................................................................................................................... 3
1.2 Stem Cell Biology ........................................................................................................................................ 5
1.2.1 Mesenchymal Stem Cell .................................................................................................................................................... 7
1.2.2 Stem Cell Niche ..................................................................................................................................................................... 9
1.3 Dental Stem Cells ........................................................................................................................................ 9
1.3.1 Stem Cells in the Gingiva ............................................................................................................................................... 10
1.4 Role of FGF Signaling in MSCs ........................................................................................................... 12
1.5 Methods to Identify Stem cells ........................................................................................................... 14
1.5.1 Mapping the Stem Cell Hierarchy Using Surface Markers ............................................................................ 15
1.5.2 CD146 ..................................................................................................................................................................................... 17
1.6 Potential Clinical Applications .......................................................................................................... 18
1.6.1 Therapeutic and Tissue Regeneration.................................................................................................................... 19
1.6.2 Immunomodulation ......................................................................................................................................................... 20
1.7 Limitations.................................................................................................................................................. 21
1.8 Current Gaps in Knowledge ................................................................................................................ 22
1.9 Study Aim and Hypothesis ................................................................................................................... 23
CHAPTER 2 MATERIALS AND METHODS ......................................................................... 24
2.1 Isolation and expansion of human gingival fibroblasts ........................................................ 24
Magnetic separation using CD146 magnetic beads ..................................................................................................... 26
2.2 Phenotypic analysis by flow cytometry ......................................................................................... 28
2.3 Osteogenic and chondrogenic differentiation ............................................................................ 28
2.3.1 Osteogenic assays ............................................................................................................................................................. 30
2.3.1.1 Alizarin red staining ................................................................................................................................................ 30
2.3.1.2 Gene analysis after osteogenic differentiation .............................................................................................. 30
2.3.2 Chondrogenic assays ....................................................................................................................................................... 32
2.3.2.1 Safranin O staining .................................................................................................................................................. 32
2.3.2.2 Alcian blue staining ................................................................................................................................................. 32
2.3.2.3 Biochemical analysis for gingival fibroblast chondrogenesis ................................................................. 33
2.4 Immunofluorescent staining for collagen type I and collagen type II ............................ 33
2.5 Statistical analysis ................................................................................................................................................................ 34
CHAPTER 3 RESULTS ................................................................................................................ 36

vii
3.1 Magnetic separation using CD146 magnetic beads ................................................................ 36
3.2 Phenotypic analysis by flow cytometry ......................................................................................... 36
3.3 Osteogenic assays .................................................................................................................................... 39
3.3.1 Alizarin red staining .................................................................................................................................................... 39
3.3.2 Gene analysis following osteogenic differentiation ........................................................................................ 39
3.4 Chondrogenic assays .............................................................................................................................. 42
3.4.1 Safranin O staining ...................................................................................................................................................... 42
3.4.2 Alcian blue staining ..................................................................................................................................................... 42
3.4.3 Biochemical analysis for gingival fibroblast chondrogenesis ..................................................................... 42
3.5 Immunofluorescent staining for collagen type I and collagen type II ............................ 45
CHAPTER 4 DISCUSSION .......................................................................................................... 47
MSC Surface Marker Identification ............................................................................................................................... 47
Osteogenic and Chondrogenic Differentiation ........................................................................................................ 48
Effects of FGF-2 on GFs differentiation potential ................................................................................................... 50
Conclusion .......................................................................................................................................................... 52
Limitations ......................................................................................................................................................... 52
Future Studies ................................................................................................................................................... 53
REFERENCES ....................................................................................................................................... 56

viii
List of abbreviations
GFs: gingival fibroblasts
GMSCs: gingival mesenchymal stem cells
FBS: fetal bovine serum
P1: passage 1
CFU-F: colony forming unit-fibroblast
IL10: interleukin 10
CD: cluster of differentiation or cluster of designation
qPCR: quantitative polymerase chain reaction
DSPP: dentine sialophosphoprotein
SHED: stem cells from human exfoliated deciduous teeth
DPSC: dental pulp stem cells
PDLSC: periodontal ligament stem cell
GAG: glycosaminoglycan
ECM: extracellular matrix
PDGF: platelet-derived growth factor
TGF-ß: transforming growth factor ß
VEGF: vascular endothelial growth factor
RUNX2: runt-related transcription factor2
ALP: alkaline phosphatase
BMP: bone morphogenetic protein
IGF I and II: insulin growth factor I and II
HLA-DR: human leukocyte antigen-DR

ix
mAb-FITC: monoclonal antibodies conjugated to fluorescein isothiocyanate
mAb-PE: monoclonal antibodies conjugated to phycoerythrin
FACS buffer: fluorescence-activated cell sorting buffer
COLI: collagen type 1
COLII: collagen type 2
HPRT1: hypoxanthine phosphoribosyltransferase 1
RPL13: ribosomal protein L13a
YWHAZ: tyrosine 3-monooxygenase/tryptophan 5-monooxygenase activation
protein zeta

x
List of Tables
Table 1. Patient demographics
Table 2. Primers sequences for genes of interest
24
37
Table A1. Summary of published studies using GFs 75

xi
List of Figures
Figure 1. Photomicrograph of gingival and dentogingival tissue 1
Figure 2. Wound healing in the gingiva 5
Figure 3. Identification and progression of stem cells 7
Figure 4. Differentiation potential of MSCs 8
Figure 5. Dental-related stem cells and their sources 11
Figure 6. Expression of FGF family members in the developing tooth 12
Figure 7. Clonal assays to identify stem cells 14
Figure 8. Phenotype of GMSCs 16
Figure 9. Graphic representation of cell expansion 26
Figure 10. CD146 expression immediately following magnetic sorting 36
Figure 11. Flow cytometry analysis of CD surface markers 38
Figure 12. Osteogenic differentiation of GMSCs 40
Figure 13. Relative osteogenic gene expression 41
Figure 14. Chondrogenic differentiation of GMSCs 43
Figure 15. Chondrogenic differentiation of GMSCs 44
Figure 16. GAG, DNA, and GAG/DNA ratios 45
Figure 17. SAFO staining to detect chondrogenesis 46
Figure A1a. Patient JO 89
Figure A1b. Patient LU 90
Figure A1c. Patient SI 91
Figure A1d. Patient KE 92
Figure A1e. Patient RO 93
Figure A1f. Patient SA 94

1
Chapter 1 Literature Review
1.1 Anatomy and Physiology of the Gingiva
The gingiva, both anatomically and functionally, is a unique structure that is firmly
attached to the alveolar bone surrounding the teeth by well-developed collagenous
bundles1. The two main tissue components of the gingiva are the gingival epithelium and
the underlying connective tissue, called the lamina propria.
The gingival epithelium is relatively thick, apart from a small zone of the free
gingiva. The epithelial surface of the gingiva is tough and resistant to abrasion and tightly
bound to the underlying lamina propria (Figure 1). The epithelial cells maintain their
structural integrity through a process of continuous mitotic cell divisions in the basal cell
layer. These cells migrate to the surface and replace those that have been shed. Thus, the
cells of the gingival epithelial cells can be recognized as both, progenitors (providing new
cells) and maturing cells that form the protective surface, the keratinized oral mucosa 1.
Figure 1. Photomicrograph of gingival and dentogingival
tissue. The lamina propria underlies the epithelium and is
continuous with the periodontal ligament, which is adjacent
to the hard tissues of the tooth.

2
The connective tissue of the gingiva consists of collagen fibers embedded in the
extracellular matrix, blood and lymphatic vessels, nerves, and a heterogeneous group of
cells including fibroblasts, immune cells, and endothelial cells1. The predominant cells of
the gingival connective tissue are the gingival fibroblasts (GFs), however, the existence of
various subpopulations of GFs has been reported2-4. Although these subpopulations are
phenotypically different, they share fibroblast-like structures and require identical growth
conditions2. In healthy gingival tissue, GFs exhibit low mitotic activity as well as low
biosynthetic activity of extracellular matrix (ECM) components5, 6. When activated, as in
response to an injury, GFs increase the production of ECM components.
GFs secrete the majority of the components of the ECM including collagen fibers,
proteoglycans, glycoproteins, cytokines, and growth factors7. The collagen matrix of the
gingival connective tissue is well organized into fiber bundles, including type I and type
III collagen as the primary fibers occupying nearly 60% of the extracellular space; and type
IV and type VII occurring as part of the basal lamina8. GFs are able to adhere to these
fibers, forming a 3D network that becomes embedded within the ECM7.
Heterogeneous protein-carbohydrate complexes composed of proteoglycans and
glycoproteins maintain the integrity of the gingival tissue by interacting with the
components of the ECM and contributing to cell adhesion and signaling9. The
proteoglycans consist of a protein (polypeptide) core to which glycosaminoglycans (hexose
sugars) are attached. Dermatan sulphate, chondroitin sulphate (sulphated), and hyaluronan
(non-sulphated) are the primary glycosaminoglycans (GAGs) forming the proteoglycans
decorin, versican, syndecan and biglycan within the gingival ECM 9.

3
Growth factors, including fibroblast growth factor 2 (FGF-2)10. exert their effect on
cells after binding to specific cell receptors during certain conditions; binding of these
growth factors to the proteoglycans within the ECM constitute the reservoir of active
molecules that can be used when needed1. A more detailed discussion of FGF-2 can be
found in Section 1.4.
As a result of the unique properties of GFs, there are several aspects that distinguish
the gingival ECM from the ECM generated by skin fibroblasts. GFs produce larger
dermatan sulphate proteoglycans and higher levels of hyaluronan compared to dermal
fibroblasts11. In addition, the glycoproteins have a polypeptide chain to which only few
simple hexoses are attached and the microfibrillar component of the gingival ECM includes
fibulin 5 and fibrillin-1 and -2. Furthermore, proteins such as periostin, osteopontin and
type V collagen are not highly expressed in the gingiva12. Taken together, these differences
between GFs and dermal fibroblasts in the production of the ECM lends the gingiva its
distinctive characteristics, including as faster healing after injury in the absence of scar
formation12,13.
1.1.1 Tissue Repair of the Gingiva
Given their anatomical location in the oral cavity, gingival cells are in direct and
continuous contact with a complex cellular milieu comprised of bacterial products and
immune cells3. Thus, it is unsurprising that at every instance of damage to oral tissues,
bacteria immediately load the injury site3. The inflammatory reaction induced by injury
and bacterial invasion to the site of injury triggers an inflammatory response with a unique
cytokine response from the GFs. Studies revealed that during gingival healing, GFs exhibit

4
many fetal fibroblast-like properties including their migration properties and production of
migrating stimulating factor 6, 13.
GFs rapidly respond to bacterial products by synthesizing hyaluronic acid, a GAG
found in the ECM that is known to increase cell motility5, 6. Once the ECM is disturbed by
injury, the migration, proliferation, and contraction abilities of GFs will increase as a
response to the large number of chemokine and growth factors secreted into the wounded
area by the degranulated platelets after injury. These growth factors include platelet-
derived growth factor (PDGF), transforming growth factor ß (TGF-ß), insulin-like growth
factors I and II (IGF-I and II), FGF-2, and epidermal growth factor (Figure 2)5. The
activated GFs will then release chemokines such as interleukin 8 (IL-8) that will increase
the number of immune cells in the wounded area and aid in its repair 5.
Over the course of scarless oral wound healing, inflammatory phase is followed by
development of granulation tissue, which contains several types of cells including
fibroblasts, macrophages, and endothelial cells, as well as a dense capillary network. The
epithelial layer is also re-established, and the ECM undergoes restoration. The further
migration and differentiation of fibroblasts and regenerative stem cells allows for the
development and remodeling of the ECM as it progresses towards the center of the wound.
Continual differentiation of the fibroblasts results in contraction and closure of the
wound14.
Taken together, the scarless wound healing and regenerative capacity of the gingiva
elicited researchers to identify the stem cell population residing within the gingiva with the
ability to self-renew.

5
1.2 Stem Cell Biology
Stem cells are defined as cells that have the potential for unlimited or prolonged
self-renewal, as well as the ability to give rise to at least one type of mature, differentiated
cells. Self-renewal is achieved by the ability to divide asymmetrically: one cell remains a
daughter self-renewing stem cell, and the other cell replicates and differentiates into a
mature cell type15. Stem cells can be divided into two types: embryonic stem cells and adult
stem cells.
After fertilization, the cells of the zygote are totipotent, which means they are able
to give rise to all cell types in the body as well as the placenta. Embryonic stem cells are
derived from the blastocyst, which forms 5 days after fertilization. These cells are
Figure 2. Wound healing in the gingiva. Fibroblast activation and regeneration are
promoted by the following: Ang II: angiotensin II; CTGF: connective tissue growth
factor; ET: endothelin; FGF-2: fibroblast growth factor-2; PDGF: platelet-derived
growth factor; TGF: transforming growth factor; ECM: extracellular matrix.

6
pluripotent and have the ability to produce all three germ layers and consequently all cell
types in the body15.
In contrast, adult stem cells are rare cells that do not expand limitlessly and have a
specific differentiation potential. Stem cells in adult tissues are in an inactive quiescent
state and they maintain their long-term homeostasis through the self-renewal process where
they divide into undifferentiated cells10. Adult stem cells, as the name implies, are present
in various adult tissues. It is believed that adult stem cells are responsible for replacing the
cells of certain tissues whenever these cells are destroyed by disease or injury10.
Stem cells can be further categorized based on characteristics acquired upon
activation. Transit-amplifying cells (TACs) are produced from stem cells and have the
capacity to divide quickly several times, before progressing to progenitors that will
terminally differentiate to a specific tissue type16. It is thought that TACs are able to provide
feedback to stem cells in order to generate further progenitor cells for regeneration
processes in response to injury16.
Progenitor cells are derived from stem cells and have the capacity to differentiate
into one specific type of cell after several rounds of cell division (Figure 3)15. A
specialized, and well-known type of adult stem cell progenitor is the mesenchymal stem
cell (MSCs).

7
1.2.1 Mesenchymal Stem Cell
Mesenchymal stem cells are defined as non-hematopoietic stromal cells that were first
identified from mononuclear cells of bone marrow17. Friedenstein et al. noted that these
fibroblast-shaped cells proliferate to form round shaped colonies that could differentiate
into an osteogenic lineage17, 18. They also reported that specific cells formed osteogenic
nodules, and cells with high osteogenic potential also exhibited high mitotic activity 18.
Later, these fibroblast-shaped cells were determined to be mesenchymal stem cells that can
differentiate into multiple mesenchymal lineages including osteogenic, chondrogenic, and
adipogenic lineages (i.e., multipotent cells)19. MSCs have also been called stromal stem
cells in reference to their location in the stroma of the tissue 20.
Figure 3. Identification and progression of stem cells. Stem cells are able to self-
renew and also produce more differentiated progenitors. These progenitors are
highly proliferative and able to differentiate into various cells types.

8
Existing studies reported the presence of MSCs in various tissues such as placental
tissue, umbilical cord blood, perivascular cells, dental pulp tissues, the synovial membrane,
adipose tissue, compact bone, periosteum, and fetal tissues (Figure 4)20, 21. MSCs have
also been extracted from many tissues in the body, including those believed to be post-
mitotic like the heart and kidneys. MSCs derived from different anatomical sites display
differences in their mitotic ability, multipotency, and self-renewal capacities20. These
features are thought to be due to regulatory cues from cells within the local tissue
microenvironment – this is often referred to as the stem cell niche 22.
Figure 4. Differentiation potential of MSCs. Mesenchymal stem cells have been
isolated from a variety of tissues and have the capacity to differentiate into a
variety of cells types, which is especially attractive for regenerative medicine.
Adapted from https://www.sigmaaldrich.com/technical-
documents/articles/biology/cell-culture/mesenchymal-stem-cell-faq.html

9
1.2.2 Stem Cell Niche
The specific microenvironment that supports the development and function of the
stem cells in a tissue is referred to as the niche. The niche embeds the signals generated
from the surrounding blood vessels, supportive cells, and the ECM10. These signals are
essential to regulate stem cell self-renewal, proliferation, survival, and cell death10. In
addition, spatial relationships and adhesion between stem cells and the supporting stromal
cells and/or ECM promotes asymmetric cell divisions, migration, and survival23.
The idea of the stem cell niche is such that the determinate factor of differentiation
and eventual cell fate of the daughter stem cell is the microenvironment in which the cells
reside. Understanding the niche and how it is maintained is important to the replication
ability and the differentiation process of stem cells in vitro. For example, hematopoietic
stem cells receive signals from differentiated macrophages in the bone marrow that prevent
further mobilization to the bloodstream 24, 25. In addition, stem cells located in the crypt of
the intestinal lining receive signals from differentiated Paneth cells to induce self-
renewal26. It has also been shown that stem cells in the hair follicle receive cues from
keratin 6-positive cells to inhibit further activation when the regenerative process is stable
27. Signals from polar cells within the ovary of Drosophila have also been described to
guide the function of follicular stem cells 28. Taken together, there is ample data to support
the existence of a stem cell niche, a microenvironment that can provide instructions to stem
cells to initiate or signal the end of a regenerative process.
1.3 Dental Stem Cells
Craniofacial development is a complex process in which stem cells with varying
developmental origins are involved. The teeth alone have at least two embryonic origins:

10
ectoderm-derived oral epithelium that forms dental enamel and a neural crest that leads to
the development of the remaining dental structures (i.e., pulp, dentine, and cementum)29.
Several types of stems cells have been derived from the various structures within the
teeth (Figure 5). Teeth are composed of enamel, dentine, and soft dental pulp tissue and
are connected to the alveolar bone by the periodontal ligament (PDL)1. Stem cells isolated
from dental pulp are known as dental pulp stem cells (DPSCs) and were the first adult stem
cells identified from dental tissues30. Stem cells from human exfoliated deciduous teeth
(SHED) were isolated from the pulp tissues and are osteoconductive when implanted in
vivo31. Periodontal ligament stem cells (PDLSC) isolated from the periodontal connective
tissue have the potential to regenerate bone, cementum, and PDL-like tissues and could
thus be used for regenerative purposes32 33. Stem cells from the apical papilla (SCAP)
exhibited greater population doubling and superior regeneration and migration capabilities
compared to PDLSCs34. Dental follicle stem cells (DFPCs) have been isolated from the
mesenchymal condensation surrounding the tooth germ during its development35. All of
the above dental-derived MSCs and differentiated into multiple phenotypes (i.e.,
osteogenic, chondrogenic, adipogenic, and neural lineages)36, 37.
1.3.1 Stem Cells in the Gingiva
Stem cells are verifiably present in various dental tissues. However, extracting a
primary tooth to collect the dental follicle and devitalising or extracting an adult tooth to
collect the pulp or periodontal tissue are examples of dental tissue collection procedures
that will compromise the function and vitality of dental structures38. Thus, gingival tissue
represents an ideal source of tissue biopsies and gingival fibroblasts (GFs) due to its
accessibility and significantly reduced donor site morbidity compared to other dental

11
tissues38-40. The literature offers overwhelming evidence to support the hypothesis that a
group of cells within the GF population of cells from the gingival tissue possess
mesenchymal stem cells (MSC) properties – and are thus called gingival mesenchymal
stem cells (GMSCs) (Figure 5)41.
Whether sorted (enriched) or unsorted, several studies have demonstrated that these
GMSCs are able to differentiate into more than one lineage in vitro including osteogenic,
chondrogenic, and adipogenic2, 36, 42-44. The majority of GMSCs are derived from cranial
neural crest cells, however, mesoderm-derived GMSCs also exist within the GMSC
population. When their differentiation potential was compared, the neural crest-derived
GMSCs displayed a higher differentiation potential to neurogenic and chondrogenic
lineages as well as superior immuno-modulatory effects than those derived from a
mesodermal source36, 45.
Figure 5. Dental-related stem cells and their sources.

12
1.4 Role of FGF Signaling in MSCs
Given the ability of GMSCs for osteogenic differentiation, and the fact that FGFs
are expressed during all stages of tooth development in the dental epithelium and
mesenchyme (Figure 6)46, it is an important consideration for the optimization of
experimental conditions in order to fully elucidate the therapeutic effects of GMSCs.
FGFs were discovered in 1974 in the form of a protein that strongly induces
proliferation in fibroblasts isolated from cow pituitary glands47. Initially, two proteins,
basic and acidic, were identified as FGF isoforms. Since then, seven total subfamilies have
been classified with 22 identified genes. Most FGFs bind to a tyrosine kinase-type receptor
that is activated as a result of receptor pairing and autophosphorylation48. Activation of
these receptors will elicit a series of signaling pathways that play an important role in tissue
repair and regeneration49. FGFs have been shown to induce angiogenic activity and
proliferation in undifferentiated mesenchymal cells and lead to new blood vessel
Figure 6. Expression of FGF family members in the developing tooth.

13
formation, induce wound repair, play a role in skeletal muscle development, initiate
hematopoiesis, and heal bone fractures50.
FGF-2 is expressed specifically within the differentiating osteoblasts of the
developing alveolar bone surrounding the developing tooth, where it stimulates
chondrocytes, osteoblast proliferation, and increased production of collagen type I111. In
the context of dental tissue regeneration, in vivo studies have examined the effect of FGF-
2 on periodontal regeneration, and a large multi-center, randomized clinical study was
performed in humans51, 52. In addition, in studies on dogs and primates to assess root
resorption following a fault injury, FGF-2 promoted significant regeneration of the
periodontium through an increase in dentin, cementum, alveolar bone deposition, and
periodontal attachment level53-56. More specifically, FGF-2 significantly improved tooth
root resorption in a model of tooth auto-transplantation compared to controls 56.
FGF-2 expression during the healing process implies several potential benefits of
including FGF-2 treatment with GMSCs therapies to augment regenerative effects. Van
Gastel et al. has demonstrated that exogenous treatment with FGF-2 during expansion of
bone-forming progenitor cells is necessary and required for the cells to maintain their
ability to form bone. This data provides evidence that FGF-2 can prime cells to enhance
their regenerative potential, as well as limits both the need for differentiation of cells in
vitro and the use of exogenous growth factors in vivo57.
The use of FGF-2 in vitro during culture and differentiation of different dental
MSCs has not been widely implemented and requires further study58. Whether its use
during culture is necessary to increase cellular proliferation or to enhance differentiation
also requires further investigation and is of interest for the study of GMSCs in this thesis.

14
1.5 Methods to Identify Stem cells
The heterogeneity of stem cell populations requires analysis of the ability to self-
renew and the differentiation potential of the cells. Selective growth methods have been
used to isolate stem cells, including enrichment of the stem cell populations as opposed to
pure isolation processes, which can be limiting due to available tissue. Physical
separation or in situ analysis of individual cells define the host of single-cell, or clonal,
analyses available. Methods include lineage tracking by recombination, introduction of a
unique clonal marker in the cell, single-cell transplantation, and in vitro or in vivo
imaging of single cells (Figure 7)59. Each method has advantages and disadvantages
including the unknown effects of the methods on cell behavior when they are not in their
natural environment.
Separation and identification of cells can also be performed using centrifugation or
sorting methods. Since centrifugation or density-based separation does not provide
concrete evidence of the cell type, two of the most widely used methods apply affinity-
Figure 7. Clonal assays to identify stem cells. Determining the identity of
heterogenous cell populations can be performed using physical isolation or
genetic labeling in order to track the cells, and then assaying for various
properties using in vitro or in vivo assays.

15
based techniques: fluorescence activated cell sorting (FACS) and magnetic activated cell
sorting (MACS)60. FACS has been shown to provide a more pure population (>95%),
while MACS has a higher throughput with a substantial purity (~75%). Both methods
employ antibodies that are specific to the stem cell markers used to identify these unique
populations.
1.5.1 Mapping the Stem Cell Hierarchy Using Surface Markers
As mentioned above, stem cells can be identified and characterized by the expression
of various cell surface proteins. These surface proteins, which can also act as receptors or
ligands, are formed during cell development and maturation14. For the purpose of
understanding the physiology and phenotype of stem cells, there are numerous clusters of
differentiation (CD) or clusters of designation that have been defined 61. There is no single
CD marker that uniquely distinguishes MSCs from among other fibroblast
populations3,61,62. The majority of the identified stem cell markers are not universal, and
ongoing research seeks to identify the marker or set of markers that can be used to identify
MSCs in different tissues62.
The Mesenchymal and Tissue Stem Cell Committee of the International Society for
Cellular Therapy (ISCT, 2006) defined the MSC population of cells as having at least 95%
of the MSC surface markers CD73, CD90, and CD105, and less than 2% of the
hematopoietic antigens CD34, CD45, CD19, CD14, and HLA-DR15. This percentage of
surface markers meets one of the three criteria needed to identify these cells based on the
in vitro properties of the cultured cells63. The other two criteria include the ability to adhere
to plastic and the capacity for tri-lineage differentiation into osteogenic, chondrogenic, and

16
adipogenic lineages63. While some markers positively identify an MSC population, the
hematopoietic stem cell markers CD45 and CD34 are rarely expressed in human MSCs64.
When compared to bone marrow-derived mesenchymal stem cells (BMSCs),
GMSCs maintain their stem cell surface markers (CD44, CD90, CD105, CD73, and CD29)
(Figure 8)65 after passage 13; and at passage 18, they still exhibit 85% of their marker
expression66. Additionally, GMSCs possess higher proliferation rates and an increased cell
yield within a shorter period of time than BMSCs66. Furthermore, GMSCs are able to
maintain a telomerase activity as well as stable morphology and phenotype with a normal
karyotype in extended-time cultures and at higher passages66. When compared to dermal
stem cells and other types of dental stem cells from periodontal tissues, GMSCs reflected
previously proven results indicating higher proliferative and colony-forming ability but
maintained medial values in terms of osteogenic differentiation potential when compared
to dermal and PDLSCs67.
Other proposed MSC markers include the positive expression of the cell surface
receptor endoglin, CD105, which in addition to its role in enhancing angiogenesis and
neovascularization, has been linked to MSC osteogenic differentiation17. CD90 is also
known as T lymphocyte differentiation antigen (Thy-1), and is a membrane glycoprotein
Figure 8. Phenotype of GMSC. Positively expressed markers
are shown in blue, negative markers are shown in red

17
expressed in more than one type of cell, osteoblast-like cells, and as a late osteoblast
precursor68. STRO-1 is another surface marker protein believed to indicate an enriched
MSC population of cells62, 69. However, STRO-1 is not universally expressed in all reported
MSC types, and its utility as the sole marker for MSC has yet to be verified62. Several
studies have sorted MSCs based on a pre-selected set of applicable surface markers
including CD56, CD271, STRO-1, and CD14670-74. However, CD271 is not universally
expressed in all MSC types and is thus eliminated from consideration as the sole MSC
marker62. Notably, CD146 has been reportedly found in almost every type of MSC and has
since emerged as the marker of choice for identifying MSCs62.
1.5.2 CD146
CD146 has been identified as a melanoma cell adhesion molecule that is primarily
expressed at the intercellular junction and cell-matrix adhesion sites75. It has also been
identified as a ligand, and, more recently, as a surface receptor that plays a role in
transducing signals across the cell membrane, thus affecting cellular motility and
invasion76.
CD146 is believed to play an integral role in multiple functions related to cell
proliferation, development, signal transduction, and angiogenesis75-77. It has also been
linked to cancer metastases, immune response, and cell migration75-77. Additionally,
CD146 has been identified as a pericyte cell marker, MSC marker, an endothelial
progenitor cell marker, and an osteoblastic marker and has been reportedly expressed
during embryonic tissue development75-77. While some groups report that CD146
expression has no effect on the differentiation potential of MSCs78, 79, others have shown
that CD146 exerts a variety of effects on stem cells, including an increase of differentiation

18
potential towards more than one lineage or a decrease in the overall differentiation potential
of the cell77, 80.
These CD146high and CD146low populations have been described for MSC cultures
that have consistent expression of CD90, CD105, and CD73, combined with the lack of
the hematopoietic cell markers CD45 and CD34 (Figure 7)77, 78, 80, 81. However, variability
in the expression of the hematopoietic markers CD34 and CD45 in enriched CD146
cultures has been reported as well70. Moreover, CD146 expression is variable and has been
linked to the location of the tissue: High CD146 expression was reported to be largely
present in sub-endothelial sinusoidal cells, whereas low CD146 expression was reported in
bone lining cells78. Therefore, the ability of CD146 to be a determinant marker
distinguishing GFs from GMSCs remains to be elucidated.
CD146 has also been recently identified as a marker for pericytes which are
perivascular cells located within the basement layer of capillaries and around the vessel
wall82. Generally, pericytes are involved in blood flow regulation, vasoconstriction, and
angiogenesis. More recently, pericytes have been described to contain multipotent
populations of cells with stem cell characteristics83. Notably, pericytes express the MSC
markers CD90, CD73, CD44, and CD105 which are widely employed as MSC markers.
Expression of these MSC markers indicates that their proposed multipotency and stem cell
characteristics do not develop after in vitro culture, rather, it suggests that perivascular sites
may be another niche for MSCs and that MSCs are derived from perivascular cells83, 84.
1.6 Potential Clinical Applications
GMSCs are known to enhance angiogenesis, polarize macrophages toward the
regenerative M2-type, decrease local and systemic inflammation, and increase anti-

19
inflammatory markers3,53. Therefore, the use of MSCs for therapeutic purposes is
extremely attractive in the development of novel and safe treatments for a variety of
diseases and pathological conditions85-88.
1.6.1 Therapeutic and Tissue Regeneration
GMSCs have been used to repair skin wounds and to treat patients with rheumatoid
arthritis and other immune diseases85. In addition, they reduced the severity of colonic
inflammation both clinically and histopathologically, contributed to the regeneration of
tendons and bone, induced tumor cell necrosis and apoptosis, and healed mucositis in the
murine tongue by regenerating the damaged epithelial layer39,86,87.
Dentally, the use of GMSCs has been shown to promote the regeneration of various
dental tissues, including the ability to repair periodontal defects in a porcine model88. In
this study, the cells were loaded into two types of scaffolds before implantation: an
inorganic porous matrix of deproteinised bovine cancellous bone scaffold and an organic
collagen scaffold88. Both scaffolds demonstrated similar regeneration of the periodontium,
and both were favored over the unloaded scaffold controls. In a separate study, GMSCs
were loaded into an IL-1 short-term releasing hyaluronic acid hydrogel synthetic
extracellular matrix89. The results showed that periodontitis could typically damage tissues
within a relatively short time, however groups treated with GMSCs have displayed
increased regeneration of bone, cementum/cementum like material and periodontal
tissue89.
Clinically, the use of GMSCs from gingival biopsies has been shown to increase
the width of the gingiva when used over a non-woven matrix of benzyl ester derived from
hyaluronic acid90. Furthermore, maxillary gingival recessions treated with autologous

20
fibroblast cell cultures isolated from palatal gingival tissues in a collagen matrix placed
under a coronally advanced flap demonstrated beneficial effects91. Researchers are
currently testing various scaffold materials for xenografts with type I and type III collagen
and allografts from the fascia of the thigh with human GMSCs that might aid in periodontal
regeneration for use in future clinical treatments92-94.
1.6.2 Immunomodulation
Generally speaking, MSCs are non-immunogenic and possess immunomodulatory
capabilities95,96. Immunomodulatory actions do not induce a systemic immune response in
the body12. Instead, they control the immune system by inducing, amplifying, or
attenuating the existing immune pathways39,97,98. The inhibition or alteration of the function
of either innate or adaptive immune cells, such as inhibiting the pro-inflammatory action
and recruitment of T-cells, is an example of immunomodulatory actions39,98. The
abundance of recent evidence suggesting that GMSCs possess immunomodulatory
properties is of great therapeutic interest3,6,13,95,99,100. It has been shown that GMSCs
modulate the recruitment of macrophages, mast cells, and neutrophils to injury sites,
resulting in less infiltration compared to skin injuries53. Concurrent with this recruitment,
GMSCs repolarize inflammatory M1-macrophages to anti-inflammatory M2-reparative
cells3.
GFs isolated and cultured from healthy and inflamed gingival tissues exhibit
comparable colony forming unit fibroblasts (CFU-F), universally possess tri-lineage
differentiation, and express MSC-associated markers. One study reported that Population
from both healthy and inflamed gingival tissue display a similar capacity to undergo
osteogenic, adipogenic, and chondrogenic differentiation, both in vitro and in vivo101. In a

21
comparison between hyperplastic gingival tissue, healthy gingival tissue cells, and bone
marrow stem cells (BMSCs), all shared an immunomodulatory feature with their bone
marrow counterpart when placed in a proper immune-activated environment43.
1.7 Limitations
Fibroblasts and MSCs cultures possess a very similar spindle configuration of
cells20. Fibroblasts are the predominant cells in connective tissues, and they maintain the
structural framework of tissues by secreting both the extracellular matrix7. It was
previously thought that fibroblasts possessed a uniform cell type regardless of specific
tissue function. However, this assumption has been challenged, and studies have proven
phenotypic heterogeneity in fibroblastic cultures derived from different tissue sources and
within clonal MSC populations4,7,20. Fibroblast heterogeneity was demonstrated in cell
surface antigen expression, collagen production, morphology, proliferation rate,
differentiated reaction to inflammatory cytokines, and wound healing 4,7.
The epithelial-mesenchymal transition process suggests that fibroblasts originate
from organ epithelia where the epithelial cells break away from the surrounding cells to
develop into mesenchymal fibroblasts102. Other studies reported that hematopoietic stem
cells differentiate and give rise to fibroblasts 102. while yet others describe pericytes and
bone marrow mesenchymal stem cells as sources of fibroblast populations103. Determining
the origin of fibroblasts will help to isolate the fibroblasts that develop MSC properties that
are necessary for obtaining a purified or enriched MSC culture that may be used for future
cell-based therapies20.
GMSCs hold properties such as self-renewal, multipotent differentiation,
expression of MSC associated cell markers, and immuno-modulatory and anti-

22
inflammatory properties95,104. The difficulty in identifying and isolating these GMSCs from
GFs lies in distinguishing between them. This confusion is due to their incredibly similar
morphology, stem cell marker expression, and the ability of both GFs and GMSCs to
adhere to plastic treated plates when cultured in vitro 3,95,105.
With specific regard to GMSCs, seeding them after isolation by any method allows
for the identification of MSCs within gingival fibroblast-derived cultures. The fibroblasts
will then begin to multiply and form discrete colonies (CFU-F) which may grow from a
single cell or an aggregation of multiple cells17. Upon expansion, these colonies
demonstrate self-renewal properties, and are considered to be rich in MSCs3. It is vitally
important to reach a consensus regarding the ideal method of isolating these cells and to
develop a consistent protocol for their in vitro purification and enrichment to ensure their
use in future clinical settings where a specific lineage is required.
Taken together, the combined attributes of GFs, including their accessibility, self-
repair, immunomodulatory effects, and potential for tissue regeneration, may lead to their
use in the development of future tissue engineering and cellular therapeutic modalities. The
vast body of evidence accumulated through in vitro and in vivo studies supports the use of
GFs and GMSCs for the purpose of tissue regeneration106. However, optimization of the
most feasible isolation, expansion, identification, differentiation protocols, and improving
the clinical handling of these cells remain crucial for the success of randomized clinical
trials in proving the regenerative power of GMSCs clinically96.
1.8 Current Gaps in Knowledge
Given the complexity of the various factors that are involved in developing cellular
therapeutic models, in order to ensure consistent results, it is necessary to: 1) develop a

23
consistent protocol for cellular isolation; 2) identify a standard set of stem cell marker(s);
and 3) identify the growth factors that could potentially play a role in MSC function107.
Although these elements are extensively discussed in the literature, they have yet to be
adequately investigated and understood.
The identification of surface markers and their definitive utility in isolating pure
MSC populations are of great value. There is a significant demand for further
experimentation with additional surface markers and different MSC populations to identify
the most reliable MSC marker for use in an in vitro setting that can also be recommended
for future in vivo studies.
1.9 Study Aim and Hypothesis
This study was designed to investigate the role of CD146 in distinguishing GMSCs from
the isolated GFs population based on two different isolation methods. We hypothesize
that CD146 is the surface marker that distinguishes GMSCs from within a GF population
regardless of the isolation method employed.

24
Chapter 2 Materials and Methods
2.1 Isolation and expansion of human gingival fibroblasts
The gingival tissue collection procedure began after receiving approval from the
University of Alberta Health Research Ethics Board (Pro00001454). Gingival tissues were
collected from six adolescent patients undergoing extractions for orthodontic purposes
from healthy interdental papilla at the University of Alberta Dental Clinic (detailed
characteristics are reported in Table 1). All patients read and signed a consent form prior
to the collection of tissues.
Patient Gender
Age
(years-months)
Tissue Weight
(g)
JO 104 Male 17-08 0.21
KE 62 Male 14-0 0.18
RO 76 Male 13-06 0.21
SI 121 Female 16-04 0.19
LU 36 Female 18-0 0.18
SA 178 Female 18-0 0.20
Tissues were weighed and immediately stored in a sterile saline solution for one to
four hours before processing. Cells were extracted from the gingival tissues of each patient
using the two most common established methods of cellular extraction reported in the
Table 1. Participant Demographics (n=6)

25
literature 3. Gingival tissues were washed thoroughly -10 times consecutively- using a
phosphate buffer saline (PBS) solution to dilute the oral bacterial flora of the gingival
tissue. Following the PBS wash, the tissues were weighed and cut into small pieces of
between 1 and 2 mm2 using a No.10 surgical blade (Sigma-Aldrich®, Missouri, US)
Each sample was divided into two equal portions, and one portion was used for
each of the two isolation methods.
Method 1: Enzymatic digestion. This technique entails incubating the tissue in a
collagenase I (2mg/mL; Worthington Biochemical, Lakewood, NJ, USA) solution for one
hour at 37°C in a 5% CO2 incubator. The tissues were then filtered through a 100µm-nylon
mesh filter (Falcon, BD Bioscience, NJ, USA) and centrifuged for 10 minutes at 1500 rpm.
The cells were then re-suspended in a fresh medium and plated at a density of 105 cell/cm2
in 25 cm2 tissue culture flasks (Falcon® Tissue Culture Flasks, Sterile, Corning®, Corning,
New York). After 48 hours, the medium was replaced. The medium used for culture and
expansion consisted of standard alpha minimum essential medium Eagle (αMEM)
supplemented with 10% v/v FBS, 100 mM 4-(2-hydroxyethyl)-1-piperazineethanesulfonic
acid (HEPES), 100 U/mL penicillin, 100 µg/mL streptomycin (all from Sigma-Aldrich®,
Missouri, US) with the addition of 5 ng/mL of FGF-2 (Neuromics, MN, US, Catalog#:
PR80001). The medium was changed every 2 to 3 days. Once the flask was confluent (after
approximately one week of culture), the cells were passaged. At passage 1 (P1), the cells
were trypsinized (0.05% w/v Trypsin/EDTA, Invitrogen), counted, and magnetically
sorted (Figure 9). At the conclusion of the magnetic sorting procedure, four groups of cells
were obtained and then expanded to passage 2 (P2) and passage 3 (P3). The number of
cells at P3 was sufficient to set up the experiment.

26
Method 2: Tissue explants. The gingival tissue was cut into small pieces and plated
over 25 cm2 tissue culture flasks and incubated for 48 hours, undisturbed, at 37°C in a
humidified incubator with 5% CO2. After 48 hours, the medium was exchanged for a fresh
medium. As with the enzymatic group, the cells at P1 were magnetically sorted and
expanded to P2 and P3, where the numbers of cells were sufficient to set up the experiment.
A schematic diagram of the full experimental procedure is illustrated in Figure 9.
Magnetic separation using CD146 magnetic beads
At P1, the cells of both groups (explant and enzymatic digestion) were trypsinized
and counted. A CD146 microbead kit (Mitenyi Biotec Cat. no: 130-093-596) was used to
magnetically sort the GFs based on their CD146 surface marker expression. Following the
manufacturer's instructions, 107 cells were incubated in a fragment crystallisable receptor
(FcR) blocking reagent, followed by CD146 microbeads for 15 minutes in a refrigerator.
Figure 9. Graphic representation of cell expansion. Four groups are obtained at the end of
the magnetic sorting procedure: Explant CD146low, Explant CD146high, Enzymatic CD146low,
and Enzymatic CD146high. Each of the four groups was then expanded to passage 2 and
passage 3 where the number of cells was sufficient to set up the experiment.

27
Incubation with FcR blocking reagent increases the specificity of microbeads to the cells,
thus increasing the purity of the cells after magnetic separation. Following incubation, the
cells were washed, centrifuged, and re-suspended in a prepared buffer solution with pH=7.2
containing PBS 0.5% w/v bovine serum albumin and 2mM Ethylenediaminetetraacetic
acid (EDTA) pursuant to the manufacturer’s protocol.
The suspension of cells with the magnetic beads was passed through a magnetically
activated cell sorting (MACS) LS column (Mitenyi Biotec LS Columns #130-042-401)
that was attached to a highly magnetic board. Each step of the process was performed under
a Class II Type A2 biological safety cabinet. The first elution contained cells that we
characterized as: CD146low expressors. The cells with no CD146 antigen remained
unresponsive to the CD146 microbeads, and, thus, did not adhere to the MACS LS tube
wall. The MACS LS tube was then removed from the magnetic board, the buffer solution
was passed through the MACS LS magnetic tube, and a plunger was used to drive the
solution with the attached cells out from within (Figure 9). The suspension of cells
obtained at this stage was expected to be rich with CD146 surface marker and were
therefore characterized as: CD146high expressors. Flow cytometric analysis was conducted
to determine the percentage of CD146 expression immediately following separation in
order to confirm the expression of CD146 in both groups.
At the conclusion of the magnetic separation phase, four groups of cells were plated
at the same concentration used throughout the entire experiment: 105 cells/cm2 in T-75
tissue culture flasks. The experimental groups were described as follows: enzymatic
CD146high, enzymatic CD146low, explant CD146high, explant CD146low. The growth
medium was exchanged every 2 to 3 days. Once the cells were confluent, they were

28
trypsinized (0.05% w/v Trypsin/EDTA, Invitrogen), counted, and divided into different
groups to set up the experiment.
2.2 Phenotypic analysis by flow cytometry
To characterize the population of cells used to set up the experiment, 25 x 104 cells
were washed with a prepared ice-cold FACS buffer (PBS, 0.5% v/v FBS and 0.1% w/v
sodium azide) then incubated with fluorochrome primary monoclonal antibodies
conjugated to fluorescein isothiocyanate (mAb-FITC) or to phycoerythrin (mAb-PE) for
45 minutes. The antibodies with conjugated fluorescence, in this case, were CD146-PE,
CD90-FITC, CD105-FITC, CD73-FITC, CD34-FITC, and CD45-FITC. The cells were
then washed and fixed with 2% v/v paraformaldehyde for 15 minutes, washed again, and
suspended in 1 ml FACS buffer. Isotype-matched controls were incubated with FITC and
PE-conjugated mIgG1. 104 cells were acquired using a Fortessa SORP flow cytometer. The
results of the flow were analysed using the FlowJo software application (FlowJo, LLC.,
Oregon, US).
2.3 Osteogenic and chondrogenic differentiation
Osteogenic and chondrogenic media were prepared and used to differentiate the
gingival fibroblasts into osteogenic and chondrogenic lineages. For osteogenic induction,
105/mm2 cells were cultured in a monolayer in every well of 6-well plates. Three of the
wells were used for staining, while the other three were used for gene analysis. Osteogenic
medium used was composed of Dulbecco′s Modified Eagle′s Medium (DMEM), 100 U/mL
penicillin, 100 µg/mL streptomycin, 10% v/v FBS, 0.1 mM ascorbic acid, 10mM ß-
glycerophosphate, 10nM Dexamethasone (all medium component products are produced
by Sigma-Aldrich®, Missouri, US). Ascorbic acid stimulated the synthesis of collagen type

29
I, ß-glycerophosphate was added to promote calcium phosphate deposition, and
dexamethasone stimulated osteogenesis by increasing alkaline phosphatase activity. The
medium was changed every 3 to 4 days for a period of 21 days. Following this period,
alizarin red staining was used to determine whether the cells differentiated into osteogenic
lineage and deposited any calcium. Alizarin red stain is a dye used to detect calcium
deposits by binding to calcium through a chelation process to form red alizarin-calcium
complexes. Cells from each of the wells were collected for further gene expression analysis
by quantitative real-time polymerase chain reaction (qPCR).
For chondrogenic induction, 25 x 104 cells were counted and centrifuged in 1.5ml
tubes, the pelleted cells were incubated at 37°C with 5% CO2 in a chondrogenic
differentiation medium composed of DMEM, 365µg/ml ascorbic acid 2-phosphate, 10 nM
dexamethasone, 125µg/ml human serum albumin (all from Sigma-Aldrich®, Missouri,
US), 10ng/ml TGFß3 solution (ProSpec, New Jersey, USA, Catalogue #: cyt-11), 40µg/ml
L-proline, and ITS+ Universal Culture Supplement Premix (Corning Discovery Labware
II, California, US, catalogue #CACB354352). The cells within the pellet aggregated to
form a spherical shape that did not adhere to the walls of the tube. The medium was
changed every 3 to 4 days over a period of 21 days. Following this period, the cellular
aggregates were collected for assays to confirm chondrogenesis qualitatively through
safranin O and alcian blue histologic staining. In addition, the GAG content of every
cellular aggregate was spectrophotometrically measured. The same spherical aggregates
were used to examine the collagen type formed in the ECM, whether type I or type II by
performing an immunofluorescence assay.

30
2.3.1 Osteogenic assays
2.3.1.1 Alizarin red staining
The cells from the four experimental groups were cultured in a monolayer as
described in the osteogenic differentiation assay. After a period of 21 days, the wells were
washed with distilled water twice and fixed with 10% w/v formalin neutral buffer
(Anachemia Canada Inc., Quebec, CAN) for 15 minutes at room temperature. Alizarin red
staining was used to stain the cultured wells for 10 minutes. The wells were washed again
on a shaker for 15 minutes. Finally, microscopy images were captured and used to
qualitatively assess the alizarin stained mineralized nodules using a light microscope.
2.3.1.2 Gene analysis after osteogenic differentiation
Genes that are related to osteogenic differentiation and dentinogenesis were
compared across the four experimental groups and included: 1) runt-related transcription
factor 2 (RUNX2) gene; RUNX2 is essential for osteoblast differentiation; 2) alkaline
phosphatase liver/bone/kidney type (ALPL) gene; ALPL is a metalloenzyme expressed
during osteogenesis8,121,122; 3) osteocalcin (OCN) gene; OCN which constitutes the
majority of noncollagenous bone matrix proteins, is considered a late osteogenic marker,
and has recently been found to play a regulatory role for transcription factors during
mineralization108; 4) collagen type IA1 (COLIA1) gene; collagen type I is the most
abundant organic component of bone ECM, is believed to play an important role in
enhancing osteogenesis through MSC integrin –collagen type I binding109; and 5) dentin
sialophosphoprotein (DSPP) gene, DSPP is abundant in odontoblast cells and plays an
important role in mineralization, DSPP gene was evaluated as the marker gene for
odontogenic differentiation110. The primers sequences are detailed in Table 2.

31
Trizol (Life Technologies) was used to extract the RNA from the monolayer
osteogenic cultures. The RNA concentrations were measured using a NanoDrop-2000C
Spectrophotometer (Thermo Fisher Scientific, Delaware, US). cDNA was then synthesized
following the reverse transcription reaction by using 1µg of Oligo dT (Promega,
Wisconsin, US). Dilutions of 1:10 were prepared from the samples to be used in real-time
PCR (qPCR). A 10µl real-time reaction mixture was prepared by adding 3 µl of cDNA, 1
µl each of forward and reverse primers and 5 µl of Takyon™ No Rox Probe MasterMix
dTTP Blue (Eurogentec North America, Inc., California, US). The dilutions were then
suspended in the 96-well block of the CFX real-time PCR detection system. Hypoxanthine
phosphoribosyltransferase 1(HPRT1), Ribosomal Protein L13a (RPL13), and Tyrosine 3-
Monooxygenase/Tryptophan 5- Monooxygenase Activation Protein Zeta (YWHAZ) were
used as internal controls in each run. These three latter reference genes were used for the
Gene Forward Reverse
Osteocalcin (OCN) AATCCGGACTGTGACGAGTTG CCTAGACCGGGCCGTAGAAG
Alkaline
Phosphatase (ALPL) CCTGGCAGGGCTCACACT AAACAGGAGAGTCGCTTCAGAGA
Runt related
transcription factor
2 (RUNX2/CBFA1)
GGAGTGGACGAGGCAAGAGTTT AGCTTCTGTCTGTGCCTTCTGG
Collagen type I
alpha 1 chain GCCTCGGAGGAAACTTTGC TCCGGTTGATTTCTCATCATAGC
Dentin
sialophosphoprotein
(DSPP)
TGGGCAAAGGCAATGTCAA TGGCCAGGTCCTTCTATGTTG
Table 2. Primers sequences for genes of interest

32
accurate quantification of data. Fluorescence data was obtained and plotted against cycle
number and then analyzed using CFX connect software.
To determine the relative expression of the genes of interest, we used three
reference genes as normalizers. After determining CT values, the difference between the
reference and target gene CT values is calculated. The relative expression of the target gene
is then determined by using the 2-Δ CT
formula to compare and evaluate the osteogenic gene
expression between groups.
2.3.2 Chondrogenic assays
2.3.2.1 Safranin O staining
After 21 days of chondrogenic differentiation, the pellets were fixed in 10% w/v
neutral buffered formalin overnight at 4°C. To preserve the cells and increase
hydrophobicity, the pellets were dehydrated before being embedded in wax blocks by
immersing them in incrementally higher concentrations of ethanol. The pellets were then
embedded in paraffin and cut into sections that were 5µm thick. To detect whether the
sulphated proteoglycans matrix formed within the pellets, the mounted sections of the
pellets were stained with 0.01% w/v safranin-O and counterstained with 0.02% w/v fast
green (Sigma-Aldrich®, Missouri, US). Safranin O staining was used to histologically
assess the chondrogenic differentiation of the gingival fibroblasts. Safranin O, a cationic
stain basic dye, stains the acidic proteoglycans with an orange-red color. Fast green is a
sulphate group containing acidic substrate, which binds strongly to the amino group on
protein and stains the non-collagen sites.
2.3.2.2 Alcian blue staining

33
Alcian blue stain detects all polysaccharides, including any proteoglycan deposits.
Here, the alcian blue stain was prepared in distilled water using alcian blue powder with
pH=1. The pellet sections were then washed in UltraClear™ (Avantor Performance
Materials, Inc., Pennsylvania, US), an isoparaffin-based clearing agent that can be used as
a more environmentally friendly xylene replacement during tissue embedding,
deparaffinization, and staining processes. The pellets sections were then washed in varying
concentrations of ethanol (70-100% v/v) and held under running tap water for 5 minutes,
drained, counterstained for 1 minute with a prepared neutral red stain by dissolving 1 g of
neutral red in 100 ml of distilled water. Afterward, 0.1 ml of glacial acetic acid was added,
mixed, and filtered. The slides were rapidly dehydrated in absolute 100% ethanol. The
microscopic images were then assessed qualitatively.
2.3.2.3 Biochemical analysis for gingival fibroblast chondrogenesis
After 21 days of chondrogenic induction using the chondrogenic medium, the
pellets were washed with PBS. Next, 250µl Protease K (1 mg/mL in 50 mM Tris with
1 mM EDTA, 1 mM iodoacetamide, and 10 mg/mL pepstatin A; all from Sigma-Aldrich®,
Missouri, US) was used overnight at 56°C to digest the pellet. The GAG content was
measured spectrophotometrically after using 1,9-dimethylmethylene blue, and chondroitin
sulphate (Sigma-Aldrich®, Missouri, US) was used as a standard. The DNA content was
determined using the CyQuant cell proliferation assay kit (Invitrogen, Ontario, CAN) with
supplied bacteriophage λ DNA as standard.
2.4 Immunofluorescent staining for collagen type I and collagen type II
5µm sections of pellet slices were deparaffinized after being dipped in UltraClear™
solution followed by ethanol and washed with distilled water. Due to the formation of

34
methylene bridges during fixation of the pellets, the slides were incubated 30 minutes at
room temperature in an antigen retrieval enzyme, protease XXV (AP-9006-005, Thermo
Scientific, Massachusetts, US), in order to unmask the antigen sites and allow the
antibodies to bind. To increase the specificity of the antibodies, the slides were incubated
in hyaluronidase (H6254, Sigma-Aldrich®, Missouri, US) for half an hour at 37oC. The
pellet slices were then incubated in bovine serum albumin (BSA) 5% w/v to reduce non-
specific binding of the antibodies. After BSA incubation, the pellet slices were incubated
in primary antibodies: rabbit anti-collagen I (CL50111AP-1, Cedarlane, Ontario,
CAN), mouse anti-collagen II (II-II6B3, Developmental Studies Hybridoma Bank, Iowa,
US) using a 1:200 dilution at 4°C overnight. For the purpose of fluorescent detection, the
preceding step was followed by incubation with a fluorochrome-conjugated secondary
antibody1:200 dilution for both, goat anti-rabbit IgG (H&L Alexa Fluor 594, Abcam, UK)
for collagen type I and goat anti-mouse IgG (H&L Alexa Fluor 488, Abcam, UK) for
collagen type II.
The sections were then stained with DAPI (4′, 6-diamidino-2-phenylindole,
Cedarlane), to stain the cell nuclei, and mounted with a 1:1 glycerol-PBS solution.
Immunofluorescent images were visualized by an Eclipse Ti-S microscope (Nikon Canada,
Ontario, CAN).
2.5 Statistical analysis
The data presented in the graphs represent the average and standard deviation in
each group for the six donors. Statistical analysis was performed using SPSS (Version 23;
IBM Canada, Ltd., Ontario, CAN) and Excel 2016 (Microsoft, Washington, US). A
normality test to assess the distribution of the data was performed using the Shapiro-Wilk

35
test. A repeated two-way ANOVA was used to determine whether there was any interaction
between the isolation method and sorting groups followed by further assessment of the
primary effect of the isolation method and CD146 expression. Statistical significance was
considered when p <0.05.

36
Chapter 3 Results
3.1 Magnetic separation using CD146 magnetic beads
At the conclusion of P1, magnetic separation was performed on the expanded
gingival fibroblast cellular cultures, which were obtained either by enzymatic digestion or
the tissue explant technique. The objective was to compare the two differentiation
potentials of these populations: one that is enriched, with high expression of CD146 and
one that is low in CD146 expression. After the cellular populations were sorted, flow
cytometry was performed on a sample of the cells to confirm that the sorting process was
successful. Figure 10 confirms that CD146 was highly expressed in the enriched groups,
and there was low expression of CD146 among the low expression groups.
3.2 Phenotypic analysis by flow cytometry
Flow cytometry was performed following the culture and expansion of the four
experimental groups of cells collected from each patient (N=6) at P3 and before
conducting osteogenic and chondrogenic experiments. The expression of CD146 and stem
A. B. C.
Figure 10. CD146 expression immediately following magnetic sorting. (A) Forward
and side scatter of the GF population. (B) CD146 was expressed in 76.8% of the GF
population of CD146high cells. (C) CD146 was expressed in 3.8% of the GF population
of CD146low cells.
37
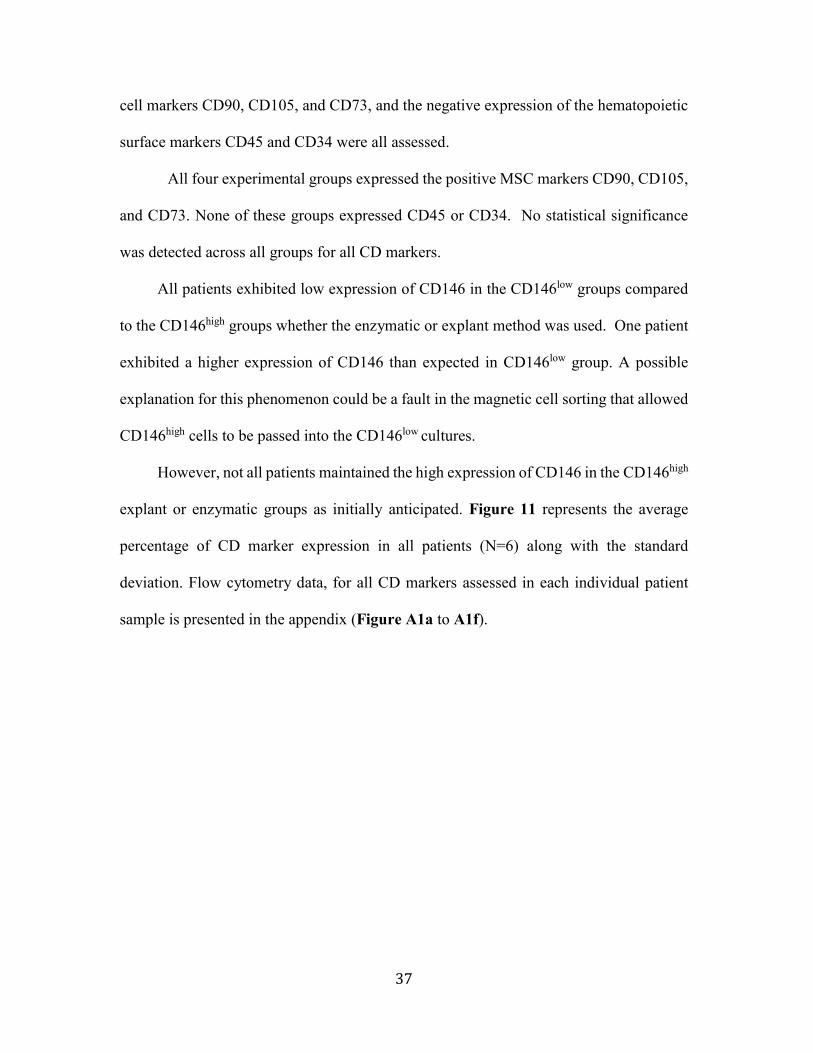
cell markers CD90, CD105, and CD73, and the negative expression of the hematopoietic
surface markers CD45 and CD34 were all assessed.
All four experimental groups expressed the positive MSC markers CD90, CD105,
and CD73. None of these groups expressed CD45 or CD34. No statistical significance
was detected across all groups for all CD markers.
All patients exhibited low expression of CD146 in the CD146low groups compared
to the CD146high groups whether the enzymatic or explant method was used. One patient
exhibited a higher expression of CD146 than expected in CD146low group. A possible
explanation for this phenomenon could be a fault in the magnetic cell sorting that allowed
CD146high cells to be passed into the CD146low cultures.
However, not all patients maintained the high expression of CD146 in the CD146high
explant or enzymatic groups as initially anticipated. Figure 11 represents the average
percentage of CD marker expression in all patients (N=6) along with the standard
deviation. Flow cytometry data, for all CD markers assessed in each individual patient
sample is presented in the appendix (Figure A1a to A1f).

38
0
10
20
30
40
50
60
70
80
90
100
Enzymaticlow
Enzymatichigh
Explant low Explanthigh
CD146
Pe
rce
nta
ge
of
ex
pre
ssio
n
CD146
0
10
20
30
40
50
60
70
80
90
100
Enzymaticlow
Enzymatichigh
Explant low Explant high
Pe
rce
nta
ge
of
ex
pre
ssio
n
CD90
0
20
40
60
80
100
Enzymaticlow
Enzymatichigh
Explant low Explant high
Pe
rce
nta
ge
of
ex
pre
ssio
n
CD73
0102030405060708090
100
Enzymaticlow
Enzymatichigh
Explant low Explant high
Pe
rce
nta
ge
of
ex
pre
ssio
n
CD105
0.00.10.10.20.20.30.30.40.40.50.50.60.60.7
Enzymaticlow
Enzymatichigh
Explant low Explant high
Pe
rce
nta
ge
of
ex
pre
ssio
n
CD45
0
0.1
0.2
0.3
0.4
0.5
0.6
0.7
0.8
Enzymaticlow
Enzymatichigh
Explant low Explant high
Pe
rce
nta
ge
of
ex
pre
ssio
n
CD34
Figure 11. Flow cytometry of CD surface markers. The bars represent the average
expression of surface markers: CD146, CD90, CD70, CD105, CD34, and CD45 in all
four experimental groups. Values are expressed as the average ± standard deviation. No
significant difference was observed (P>0.05).

39
3.3 Osteogenic assays
3.3.1 Alizarin red staining
Osteogenic differentiation was attempted using the differentiation medium
described above to investigate the osteogenic differentiation potential of the gingival
fibroblasts. The alizarin red stain is used to detect any calcium nodules deposited after
osteogenic differentiation. All patient samples exhibited alizarin red staining in all groups
of the 6-well monolayer cultures (Figure 12).
3.3.2 Gene analysis following osteogenic differentiation
The alizarin red stain indicates the osteogenic differentiation of GFs. The fold-
change of relative osteogenic gene expression levels was compared to further investigate
whether there were any differences between the capacities of the four groups of cells to
osteogenically differentiate. The dentin sialophosphoprotein (DSPP) gene was evaluated
to investigate whether the production of the dentin protein regulating gene during
osteogenic differentiation is upregulated110. No significant differences were observed in
any of the experimental groups from all patient samples in terms of the expression of the
RUNX2, OCN, OPN, and DSSP genes (Figure 13).

40
Figure 12. Osteogenic differentiation of GMSCs. All experimental groups from each
patient: JO, LU, SI, KE, RO, and SA. Mineralization nodules were detected with alizarin red
staining after 21 days of osteogenic differentiation. Scale bar (black) 100 µm.

41
0
0.2
0.4
0.6
0.8
1
1.2
1.4
1.6
1.8
2
ENZYMATICLOW
ENZYMATICHIGH
EXPLANTLOW
EXPLANTHIGH
Re
lati
ve
mR
NA
ex
pre
ssio
nAvg ALPL
0
0.001
0.002
0.003
0.004
0.005
0.006
0.007
0.008
0.009
ENZYMATICLOW
ENZYMATICHIGH
EXPLANTLOW
EXPLANTHIGH
Re
lati
ve
mR
NA
ex
pre
ssio
n
Avg OCN
0
0.05
0.1
0.15
0.2
0.25
0.3
0.35
0.4
0.45
ENZYMATICLOW
ENZYMATICHIGH
EXPLANTLOW
EXPLANTHIGH
Re
lati
ve
mR
NA
ex
pre
ssio
n
Avg RUNX2
0
5
10
15
20
25
30
35
40
ENZYMATICLOW
ENZYMATICHIGH
EXPLANTLOW
EXPLANTHIGH
Re
lati
ve
mR
NA
ex
pre
ssio
n
Avg COL1A1
0
0.01
0.02
0.03
0.04
0.05
0.06
0.07
0.08
ENZYMATICLOW
ENZYMATICHIGH
EXPLANTLOW
EXPLANTHIGH
Re
lati
ve
mR
NA
ex
pre
ssio
n
Avg DSPP
Figure 13. Relative osteogenic gene expression. Average value and standard deviation for
all patients (N=6). None of the genes [alkaline phosphastase (ALPL), osteocalcin (OCN),
runt related transcription factor 2 (RUNX2), type I collagen (COL1A1), and dentine
sialophosphoprotein (DSPP)] displayed significant differences in the relative gene
expression across the four groups (P>0.05).

42
3.4 Chondrogenic assays
3.4.1 Safranin O staining
Safranin O was used to stain pellet slices following chondrogenic differentiation
to detect sulphated proteoglycans. The safranin O staining of the pellet slices from all
patients across all four groups showed no significant difference across all experiment
(Figure 14). Patient SA Explant group of cells was contaminated and omitted from the
figure.
3.4.2 Alcian blue staining
Alcian blue was used to stain the pellet slices from all patients across all four
groups to detect all proteoglycans deposited during chondrogenic differentiation. Figure
6 shows the results of the alcian blue staining of the pellets. Patient SA Explant group of
cells was contaminated and omitted from the figure.
3.4.3 Biochemical analysis for gingival fibroblast chondrogenesis
After 21 days in chondrogenic media, the pellets were analyzed to detect their
specific glycosaminoglycan (GAG) content. Figure 7 shows that the GAG content was
very low for all groups. However, there was no significant difference between the four
groups or all patients. Similarly, when the DNA content was normalized against the DNA
content of the cells from every pellet, no significant difference between the groups was
found.

43
Figure 14. Chondrogenic differentiation of GMSCs. All experimental groups from
each patient: JO, LU, SI, KE, RO, and SA. None of the pellet slices exhibit the pink
safranin O stain that should indicate the sulphated proteoglycans in the pellets after
chondrogenesis. Scale bar (black) 100 µm.

44
Figure 15. Chondrogenic differentiation of GMSCs. All experimental groups from
each patient: JO, LU, SI, KE, RO, and SA. All samples from cell pellets stained blue,
indicating proteoglycan formation within the pellets following chondrogenic
differentiation. Scale bar (black) 100 µm.

45
3.5 Immunofluorescent staining for collagen type I and collagen type II
To identify the cells within the pellet, we used blue immunofluorescent stain 4′,6-
diamidino-2-phenylindole (DAPI), which binds strongly to the adenine-thymine rich
region of DNA, the nucleus. The ECM components collagen type I and collagen type II
were stained using a primary antibody to collagen type I and collagen type II. Collagen
type I (red) was detected in each experimental group from all patients (Figure 17).
00.5
11.5
22.5
33.5
44.5
Enzymaticlow
Enzymatichigh
Explantlow
Explanthigh
Co
nce
ntr
ati
on
(µ
g)
Mean GAG (µg)
0
0.2
0.4
0.6
0.8
1
1.2
1.4
Enzymaticlow
Enzymatichigh
Explantlow
Explanthigh
Co
nce
ntr
ati
on
(µ
g)
Mean DNA (µg)
0
0.5
1
1.5
2
2.5
3
3.5
4
4.5
Enzymatic low Enzymatic high Explant low Explant high
GAG/DNA Ratio
Figure 16. GAG, DNA, and GAG/DNA ratios. Pelleted cells from all patients (N=6)
in all experimental groups were analyzed by RT-PCR. Values expressed as mean ±
standard deviation. no significant difference was observed (P>0.05).

46
Qualitatively, the cell nuclei stained by DAPI were uniformly distributed within
the pellet. Collagen type I was produced throughout the entirety of each pellet of each
patient, and no outstanding variations were observed among the four groups. Collagen
type II was not detected in the extracellular matrix of the pellets, a result that aligns with
the low GAG content, negating chondrogenic differentiation potential that was presumed
in the pelleted gingival fibroblasts.
Figure 17. SAFO staining to detect chondrogenesis. Representative images from one
patient. The nuclei of GFs in the pellets were counterstained with DAPI (blue). GF pellets
were fluorescently labelled with antibodies for collagen type I (red) and type II (green).
Dual stain of collagen type I and type II shows only DAPI nuclei stain and red stain of
collagen type I; no collagen type II was detected. Scale bar (white) 100 µm.
COLI/COLII DUAL STAIN

47
Chapter 4 Discussion
The use of MSC surface markers in the studies described in the literature, despite
its long history, is an imprecise process that may lead to the contamination of cultures
with cells other than MSCs, including fibroblasts and other supportive cells 111.
The experiment described in this thesis utilized gingival tissue to isolate and expand
GFs, specifically due to its ease of access and the promising multilineage potential of these
cells 3, 33, 36, 96, 98, 112. More importantly, we attempted to identify GMSCs within GF
cultures. Since MSCs are considered heterogeneous, containing subpopulations within the
same isolated culture, the identification of the specific GMSC marker(s) is essential for
tissue engineering treatments, not only for dental tissue regeneration, but potentially other
organ systems 77.
MSC Surface Marker Identification
CD146 has been identified as a unique MSC marker 70, 77-80, 113. CD146low and
CD146high cultures express similar levels of MSC-positive marker expression, with the
expected negative expression of hematopoietic markers (CD34 and CD45), regardless of
the isolation method. Moreover, the loss of CD146 expression in three of our six samples
of the CD146high expression groups was similar to previously published work, which
showed a loss of CD146 expression from P1 to P6 80. The results of this thesis ran contrary
to other research showing that CD146 maintained high expression after passage 6 77. This
could be attributed to the different tissue sources used: bone marrow Vs. gingival
interdental tissue. It has also been reported that CD146 expression was inconsistent in the
cells that were studied and greatly affected by the anatomical site from which the tissues

48
were derived 78, 79. The range of studies that used different tissue sources to isolate the
MSCs and the variability in the literature regarding CD146 expression and how it is
affected by culture prevents solid conclusions regarding the role and function of CD146.
Osteogenic and Chondrogenic Differentiation
Our results revealed that the osteogenic differentiation potential of both CD146high and
CD146low cultures was similar when assessed phenotypically following alizarin red
staining. Quantitative analysis bore similar results: neither CD146 expression nor the
isolation methods had any effect on ALPL, OCN, COLIA1, or DSPP gene expression.
Studies using MSCs of a dental origin have reported contradictory results with regard to
the differentiation potential between CD146low and CD146high cultures. Several studies
have demonstrated increased differentiation potential of MSCs for CD146high cultures as
opposed to CD146low cultures113-115. In addition, Sorrentino et al. reported an increased
differentiation potential and stem cell marker expression among CD146high cells81.
However, this study used bone marrow-derived cells and made no comparison to
CD146low cells81.
Two additional studies using BMSCs reported a similar differentiation potential
for both CD146low and CD146high cultures. Both studies obtained their cells from fresh
bone marrow aspirate and healthy donors, and both used basic MSC expansion media
without the addition of growth factors78,79. Furthermore, a recent study reported no
difference in osteogenic gene expression between CD146high and CD146low cultures77.
However, it is important to note that publications attempting to replicate this data were
unable to observe similar findings77. Both high and low groups laid bone, but the
CD146low cultures differentiated and laid significantly more bone compared to the
49
CD146high cultures, which formed more bone marrow. The authors linked their finding to
the heterogeneity of the MSC populations - either mature MSCs (laid more bone) or
immature MSCs (laid more marrow)77. In another study, GMSCs were sorted by El-Sayed
et al. according to STRO-1 and CD146 expression and concluded that CD146low cells
possessed superior osteogenic differentiation potential70. Another study supported the
superior osteogenic potential has been reported in CD146low cultures despite a difference
in CD146 expression after passaging80. In summary, it remains unclear whether the
expression level of CD146 has any substantial effect on the ability of MSCs to
differentiate.
We attempted to differentiate the GFs into two lineages: osteogenic and
chondrogenic. Our results indicate a high osteogenic differentiation potential in all four
groups of isolated cells. However, the quantitative assessment of GAG production was
not statistically different among all groups and did not support chondrogenic
differentiation.
In addition, our pellets have shown similar qualitative results following safranin O
staining and none of the pellets displayed positive stains for sulphated
glycosaminoglycans. By contrast, when using alcian blue, which stains polysaccharides
including the GAGs, all pellets stained positive 116. Despite the fact that the safranin O
stain specifically detects sulphated GAGs, the alcian blue could have picked all the
anionic molecules in the tissue formed. That is why alcian blue is not a specific staining
to use. An error in the pH adjustment could have happened which led to the positive
staining of the pellets.

50
For further identification of the ECM collagenous component produced in the
cellular aggregates, an immunofluorescence assay was performed. Immuno-fluorescent
results have shown high and equal production of collagen type I in all pellets; no collagen
type II production was detected. After compiling the results of the chondrogenic ECM
components in our pellet models, following chondrogenic differentiation, we might
assume that the sorted GFs did not undergo chondrogenic differentiation. In the context
of our data, the isolated and sorted GFs may be considered to be osteoprogenitor cells
rather than mesenchymal stem cells that possess multilineage differentiation potential.
Effects of FGF-2 on GFs differentiation potential
In this thesis, we used FGF-2 to culture and expand the GFs that were collected
from human tissue. FGF-2 is known for its mitogenic effects on MSCs, enhancing MSC
proliferation while maintaining MSC multipotency52,53. The increased expression of
VEGF, an angiogenesis marker, has also served as evidence of the ability of FGF-2 to
promote regeneration117. The mitogenic effects of FGF-2, along with its angiogenic
capability, are well established and are frequently examined to gain a better understanding
of the mechanism of action that leads to enhanced tissue regeneration117-119.
The multipotent differentiation of MSCs cultured in FGF-2 supplemented media has
been confirmed58,120, with the demonstration of osteogenic differentiation and increased
expression of OCN in cultures receiving FGF-2 treatment121,122. However, the versatility
of FGF-2 is evidenced by the varying regulatory mechanisms within different cell types.
In periodontal ligament PDL MSCs, FGF-2 inhibits OCN, ALPL, and COLI; whereas
increased expression of these genes is observed in murine bone cellular lines123. With
regard to the gingiva, differential expression of FGF-2 receptors has been reported in the

51
gingival epithelium, GFs, and PDL cell124, Specifically, FGF-2 receptors are abundant in
GFs and PDLs but not in gingival epithelial cells124, These results reveal a selective
mechanism of FGF-2 depending on the cell type – potentially due to the niche in which it
is functioning122.
Few studies have experimented with the effects of FGF-2 on sorted dental MSCs
based on a set of pre-selected MSC surface markers51,58. PDL MSCs have been sorted
using a combination of STRO1/CD146 surface markers58. The addition of FGF-2 to this
sorted population resulted in several observations: FGF-2 stimulated an increase in the
number of cells expressing both STRO1 and CD146; the overall number of cells in FGF-
2 cultures increased 15-fold compared to cells without FGF-2; and the sorted cells
maintained their osteogenic and adipogenic differentiation potential51. To our knowledge,
there has yet to be a study that examines the multipotent differentiation of GFs cultured
in FGF-2 media based on the CD146 selected surface marker. Our study demonstrated
consistent osteogenic differentiation of GFs between all groups when cultured in media
containing FGF-2.
Assessing Methodological Differences in GFs Isolation
As mentioned earlier, extractions of dental MSCs from different anatomical
locations have been performed using either tissue explants or enzymatic digestion. Here,
we tested whether the isolation method had any effect on the expression of MSC markers
or on CD146 expression and compared the osteogenic/chondrogenic differentiation
potential. We report that, regardless of the isolation and culture method, the expression of
MSC markers, including CD146, and the differentiation potential remained unchanged in
our isolated populations. To our knowledge, this is the first study that has considered the

52
effects of isolation methods on MSC marker expression and differentiation potential of
GFs derived from gingival tissue. The importance of this experiment relies in the fact that
a consistent protocol will be required to advance tissue-engineering models for therapeutic
or regenerative purposes.
Conclusion
We attempted to identify and isolate GMSCs from GF populations using the two
most common methods: the explant and enzymatic digestion methods. We then attempted
to enrich the isolated cells by magnetically sorting them based on their CD146 expression.
Neither of the isolation methods we used had any significant effect on the
expression of MSC markers nor the differentiation potential of these cells. Thus, either
isolation method could be used to isolate GF cells. CD146 expression did not affect the
differentiation potential of the enriched group of cells. Based on the results of our study,
we cannot conclude that CD146 is a specific MSC surface marker to isolate or enrich the
MSC population from among GFs. Adding FGF-2 growth factor to the culture media
during cell expansion might have led to greater consistency in the results seen across all
the groups tested. Our results cannot be conclusively adopted due to the lack of a group
of non-FGF-2 media for comparison. However, the addition of FGF-2 growth factor to
the culture medium might represent a viable step during the expansion of the GFs.
Limitations
Our study was not without limitations. It is possible that statistical significance
was not achieved due to the relatively small sample size. Furthermore, the inclusion of
experimental control groups that did not receive FGF-2 treatment was lacking.
Furthermore, we used magnetic sorting by passing the cells with magnetic beads only

53
once in the extraction tube. Passing the cells twice in the tube or using flow assisted cell-
sorting machines, which yield more accurate and purer populations of cells, may have
presented superior methods for sorting cells. It is also possible that the isolation methods
could be optimized, which would be the subject of future studies.
Future Studies
The identification of a specific surface cell marker(s) that identifies GMSCs is
necessary for the development of a consistent stem cell isolation protocol. By extension,
developing a consistent protocol will increase the reliability of tissue engineering models.
The objective of this study was to identify the GMSC population that could be employed
in tissue engineering or cellular therapy protocols for dental tissue regeneration. There is
previous data to support, and great potential for additional data gained by ongoing and
future research to be utilized for dental clinical application in four broad categories: direct
pulp capping, pulp revitalization, pulp tissue engineering, and periodontal ligament
regeneration.
Based on our results, and the limitations discussed, there are several
recommendations for future studies.
1) Increasing the number of samples analyzed. Using a power caclculation and
based on the results of previously published studies regarding the number of
cells recovered and the purity of the population, we estimate that with 10
samples for each experimental condition, we will be sufficiently powered
(>90%) with high confidence levels to detect association of specific cell
surface markers at a significance level of of P < 0.05 in the range found in
other studies.
54
2) Continue to assess the various combinations of MSC markers in GFs
populations in order to reliably identify and isolate the optimal GMSC
population for future translational animal and clinical studies and novel
therapeutic applications.
3) Continue to assess the effects of FGF-2 on the characteristics of GMSCs, and
include untreated control groups for each patient sample.
4) Continue to assess the differential results based on modified isolation methods.
5) Additional studies could also be significantly powered to understand any
potential difference in number of cells recovered, surface marker expression,
or differentiation potential based on:
a. Gender
b. Age – Since age-associated changes have been observed in the
regenerative capacity of stem cells, comparing recovery and potential
of cells from young (adolescent), adult, or aged patients should be
performed.
c. Race
d. Health status of the individual – comparing recovery and potential of
cells from healthy or diseased gingiva
6) Optimize identification of cells by obtaining antibodies for all surface markers
conjugated to different fluorophores that can be analyzed in one sample by
flow cytometry (requires a flow cytometer for analysis or sorting with
sufficient laser compatibility).

55
7) Evaluate the potential for cryopreservation and storage of isolated GMSCs
while maintaining their therapeutic potential.
8) Once the specific GMSC population has been identified and defined, the
therapeutic potential of the cells should be evaluated using in vitro assays and
in vivo models.

56
References
1. Nanci A. Ten Cate's Oral Histology Development, Structure, and Function, 8/E. Elsevier
India; 2014.
2. Fournier BP, Ferre FC, Couty L, et al. Multipotent progenitor cells in gingival connective
tissue. Tissue Engineering Part A. 2010;16:2891-2899.
3. Fournier BP, Larjava H, Hakkinen L. Gingiva as a source of stem cells with therapeutic
potential. Stem Cells Dev. 2013;22:3157-3177.
4. Phipps R, Borrello M, Blieden T. Fibroblast heterogeneity in the periodontium and other
tissues. J Periodont Res. 1997;32:159-165.
5. Chiquet M, Katsaros C, Kletsas D. Multiple functions of gingival and mucoperiosteal
fibroblasts in oral wound healing and repair. Periodontol 2000. 2015;68:21-40.
6. HAeKKINEN L, UITTO V, Larjava H. Cell biology of gingival wound healing. Periodontol
2000. 2000;24:127-152.
7. Chang Y, Li H, Guo Z. Mesenchymal stem cell-like properties in fibroblasts. Cell Physiol
Biochem. 2014;34:703-714.
8. Garant PR, Garant P. Oral cells and tissues. . 2003.
9. Bartold PM, Wiebkin OW, Thonard JC. Proteoglycans of human gingival epithelium and
connective tissue. Biochem J. 1983;211:119-127.
10. Gattazzo F, Urciuolo A, Bonaldo P. Extracellular matrix: a dynamic microenvironment for
stem cell niche. Biochimica et Biophysica Acta (BBA)-General Subjects. 2014;1840:2506-2519.

57
11. Larjava H, Heino J, Krusius T, Vuorio E, Tammi M. The small dermatan sulphate
proteoglycans synthesized by fibroblasts derived from skin, synovium and gingiva show tissue-
related heterogeneity. Biochem J. 1988;256:35-40.
12. HAeKKINEN L, UITTO V, Larjava H. Cell biology of gingival wound healing. Periodontol
2000. 2000;24:127-152.
13. Lo DD, Hu MS, Zimmermann AS, Longaker MT, Lorenz HP. Differences in foetal, adult
skin and mucosal repair. In: Stem Cell Biology and Tissue Engineering in Dental Sciences.
Elsevier; 2015:691-702.
14. Politis C, Schoenaers J, Jacobs R, Agbaje JO. Wound healing problems in the mouth.
Frontiers in physiology. 2016;7:507.
15. Chagastelles PC, Nardi NB. Biology of stem cells: an overview. Kidney international
supplements. 2011;1:63-67.
16. Hsu Y, Li L, Fuchs E. Transit-amplifying cells orchestrate stem cell activity and tissue
regeneration. Cell. 2014;157:935-949.
17. Friedenstein A, Chailakhjan R, Lalykina K. The development of fibroblast colonies in
monolayer cultures of guinea‐pig bone marrow and spleen cells. Cell Prolif. 1970;3:393-403.
18. Friedenstein AJ, Piatetzky-Shapiro II, Petrakova KV. Osteogenesis in transplants of bone
marrow cells. J Embryol Exp Morphol. 1966;16:381-390.
19. Keating A. Mesenchymal stromal cells: new directions. Cell stem cell. 2012;10:709-716.
20. Augello A, Kurth TB, De Bari C. Mesenchymal stem cells: a perspective from in vitro
cultures to in vivo migration and niches. Eur Cell Mater. 2010;20:121-133.
58
21. Jakobsen C, Sørensen J, Kassem M, Thygesen T. Mesenchymal stem cells in oral
reconstructive surgery: a systematic review of the literature. J Oral Rehabil. 2013;40:693-706.
22. Morrison SJ, Spradling AC. Stem cells and niches: mechanisms that promote stem cell
maintenance throughout life. Cell. 2008;132:598-611.
23. Jones DL, Wagers AJ. No place like home: anatomy and function of the stem cell niche.
Nature reviews Molecular cell biology. 2008;9:11.
24. Chow A, Lucas D, Hidalgo A, et al. Bone marrow CD169+ macrophages promote the
retention of hematopoietic stem and progenitor cells in the mesenchymal stem cell niche. J Exp
Med. 2011;208:261-271.
25. Winkler IG, Sims NA, Pettit AR, et al. Bone marrow macrophages maintain hematopoietic
stem cell (HSC) niches and their depletion mobilizes HSCs. Blood. 2010;116:4815-4828.
26. Sato T, Van Es JH, Snippert HJ, et al. Paneth cells constitute the niche for Lgr5 stem cells in
intestinal crypts. Nature. 2011;469:415.
27. Hsu Y, Pasolli HA, Fuchs E. Dynamics between stem cells, niche, and progeny in the hair
follicle. Cell. 2011;144:92-105.
28. Vied C, Reilein A, Field NS, Kalderon D. Regulation of stem cells by intersecting gradients
of long-range niche signals. Developmental cell. 2012;23:836-848.
29. Feng R, Lengner C. Application of stem cell technology in dental regenerative medicine.
Advances in wound care. 2013;2:296-305.
30. Gronthos S, Mankani M, Brahim J, Robey PG, Shi S. Postnatal human dental pulp stem cells
(DPSCs) in vitro and in vivo. Proc Natl Acad Sci U S A. 2000;97:13625-13630.

59
31. Miura M, Gronthos S, Zhao M, et al. SHED: stem cells from human exfoliated deciduous
teeth. Proc Natl Acad Sci U S A. 2003;100:5807-5812.
32. Seo B, Miura M, Gronthos S, et al. Investigation of multipotent postnatal stem cells from
human periodontal ligament. The Lancet. 2004;364:149-155.
33. Hynes K, Menicanin D, Gronthos S, Bartold PM. Clinical utility of stem cells for periodontal
regeneration. Periodontol 2000. 2012;59:203-227.
34. Sonoyama W, Liu Y, Fang D, et al. Mesenchymal stem cell-mediated functional tooth
regeneration in swine. PloS one. 2006;1:e79.
35. Morsczeck C, Götz W, Schierholz J, et al. Isolation of precursor cells (PCs) from human
dental follicle of wisdom teeth. Matrix Biology. 2005;24:155-165.
36. Zhao N, Wu Z, Qin L, Guo Z, Li D. Characteristics and tissue regeneration properties of
gingiva-derived mesenchymal stem cells. Critical Reviews™ in Eukaryotic Gene Expression.
2015;25.
37. Waddington RJ, Sloan AJ. Tissue Engineering and Regeneration in Dentistry: Current
Strategies. John Wiley & Sons; 2016.
38. Jin S, Lee J, Yun J, Kim I, Ko Y, Park J. Isolation and characterization of human
mesenchymal stem cells from gingival connective tissue. J Periodont Res. 2015;50:461-467.
39. Zhang Q, Shi S, Liu Y, et al. Mesenchymal stem cells derived from human gingiva are
capable of immunomodulatory functions and ameliorate inflammation-related tissue destruction
in experimental colitis. J Immunol. 2009;183:7787-7798.

60
40. Mostafa N, Scott P, Dederich DN, Doschak M, El-Bialy T. Low intensity pulsed ultrasound
stimulates osteogenic differentiation of human gingival fibroblasts. Can Acoustics. 2008;36:34-
35.
41. Gardin C, Ricci S, Ferroni L. Dental stem cells (DSCs): Classification and properties. In:
Dental Stem Cells: Regenerative Potential. Springer; 2016:1-25.
42. Mitrano TI, Grob MS, Carrion F, et al. Culture and characterization of mesenchymal stem
cells from human gingival tissue. J Periodontol. 2010;81:917-925.
43. Tang L, Li N, Xie H, Jin Y. Characterization of mesenchymal stem cells from human normal
and hyperplastic gingiva. J Cell Physiol. 2011;226:832-842.
44. Marynka‐Kalmani K, Treves S, Yafee M, et al. The lamina propria of adult human oral
mucosa harbors a novel stem cell population. Stem Cells. 2010;28:984-995.
45. Xu X, Chen C, Akiyama K, et al. Gingivae contain neural-crest-and mesoderm-derived
mesenchymal stem cells. J Dent Res. 2013;92:825-832.
46. Du W, Du W, Yu H. The role of fibroblast growth factors in tooth development and incisor
renewal. Stem cells international. 2018;2018.
47. Gospodarowicz D. Localisation of a fibroblast growth factor and its effect alone and with
hydrocortisone on 3T3 cell growth. Nature. 1974;249:123.
48. Murakami S. Periodontal tissue regeneration by signaling molecule (s): what role does basic
fibroblast growth factor (FGF‐2) have in periodontal therapy? Periodontol 2000. 2011;56:188-
208.

61
49. Powers CJ, McLeskey SW, Wellstein A. Fibroblast growth factors, their receptors and
signaling. Endocr Relat Cancer. 2000;7:165-197.
50. Gupta RR, Gupta M, Garg A. Fibroblast Growth Factor (FGF): A Review. Cell. 2013;1.
51. Kitamura M, Akamatsu M, Machigashira M, et al. FGF-2 stimulates periodontal
regeneration: results of a multi-center randomized clinical trial. J Dent Res. 2011;90:35-40.
52. Nakahara T, Nakamura T, Kobayashi E, et al. Novel approach to regeneration of periodontal
tissues based on in situ tissue engineering: effects of controlled release of basic fibroblast growth
factor from a sandwich membrane. Tissue Eng. 2003;9:153-162.
53. Cha JK, Sun Y, Lee J, Choi S, Jung U. Root coverage using porcine collagen matrix with
fibroblast growth factor‐2: a pilot study in dogs. J Clin Periodontol. 2017;44:96-103.
54. Takayama S, Murakami S, Shimabukuro Y, Kitamura M, Okada H. Periodontal regeneration
by FGF-2 (bFGF) in primate models. J Dent Res. 2001;80:2075-2079.
55. Sae-Lim V, Ong WY, Li Z, Neo J. The effect of basic fibroblast growth factor on delayed-
replanted monkey teeth. J Periodontol. 2004;75:1570-1578.
56. Shiratani S, Ota M, Fujita T, Seshima F, Yamada S, Saito A. Effect of basic fibroblast
growth factor on root resorption after delayed autotransplantation of tooth in dogs. Oral surgery,
oral medicine, oral pathology and oral radiology. 2012;114:e14-e21.
57. van Gastel N, Stegen S, Stockmans I, et al. Expansion of murine periosteal progenitor cells
with fibroblast growth factor 2 reveals an intrinsic endochondral ossification program mediated
by bone morphogenetic protein 2. Stem Cells. 2014;32:2407-2418.

62
58. Hidaka T, Nagasawa T, Shirai K, Kado T, Furuichi Y. FGF-2 induces proliferation of human
periodontal ligament cells and maintains differentiation potentials of STRO-1 /CD146
periodontal ligament cells. Arch Oral Biol. 2012;57:830-840.
59. Hope K, Bhatia M. Clonal interrogation of stem cells. Nature Methods. 2011;8:S36.
60. Zhu B, Murthy SK. Stem cell separation technologies. Current opinion in chemical
engineering. 2013;2:3-7.
61. Murphy NC, Bissada NF, Davidovitch Z, Kucska S, Dashe J, Enlow DH. Tissue engineering
and stem cell therapy for orthodontists. In: Stem Cell Biology and Tissue Engineering in Dental
Sciences. Elsevier; 2015:799-822.
62. Lv F, Tuan RS, Cheung KM, Leung VY. Concise review: the surface markers and identity of
human mesenchymal stem cells. Stem Cells. 2014;32:1408-1419.
63. Dominici M, Le Blanc K, Mueller I, et al. Minimal criteria for defining multipotent
mesenchymal stromal cells. The International Society for Cellular Therapy position statement.
Cytotherapy. 2006;8:315-317.
64. Kolf C, Cho E, Tuan R. Biology of adult mesenchymal stem cells: regulation of niche, self-
renewal and differentiation. 2007. Arthritis Res Therapy. ;9:1-10.
65. Merino-González C, Zuñiga FA, Escudero C, et al. Mesenchymal stem cell-derived
extracellular vesicles promote angiogenesis: potencial clinical application. Frontiers in
physiology. 2016;7:24.

63
66. Tomar GB, Srivastava RK, Gupta N, et al. Human gingiva-derived mesenchymal stem cells
are superior to bone marrow-derived mesenchymal stem cells for cell therapy in regenerative
medicine. Biochem Biophys Res Commun. 2010;393:377-383.
67. Gao Y, Zhao G, Li D, Chen X, Pang J, Ke J. Isolation and multiple differentiation potential
assessment of human gingival mesenchymal stem cells. International journal of molecular
sciences. 2014;15:20982-20996.
68. Chen X, Qian H, Neff L, Satomura K, Horowitz MC. Thy‐1 antigen expression by cells in
the osteoblast lineage. Journal of Bone and Mineral Research. 1999;14:362-375.
69. Simmons PJ, Torok-Storb B. Identification of stromal cell precursors in human bone marrow
by a novel monoclonal antibody, STRO-1. Blood. 1991;78:55-62.
70. El-Sayed KMF, Paris S, Graetz C, et al. Isolation and characterisation of human gingival
margin-derived STRO-1/MACS and MACS− cell populations. International journal of oral
science. 2015;7:80.
71. Gay I, Cavender A, Peto D, et al. Differentiation of human dental stem cells reveals a role
for micro RNA‐218. J Periodont Res. 2014;49:110-120.
72. BÜHRING H, Battula VL, Treml S, Schewe B, Kanz L, Vogel W. Novel markers for the
prospective isolation of human MSC. Ann N Y Acad Sci. 2007;1106:262-271.
73. Battula VL, Treml S, Bareiss PM, et al. Isolation of functionally distinct mesenchymal stem
cell subsets using antibodies against CD56, CD271, and mesenchymal stem cell antigen-1.
Haematologica. 2009;94:173-184.

64
74. Wu C, Liu F, Sytwu H, Tsai C, Chang D. CD146 mesenchymal stem cells display greater
therapeutic potential than CD146–cells for treating collagen-induced arthritis in mice. Stem cell
research & therapy. 2016;7:23.
75. Wang Z, Yan X. CD146, a multi-functional molecule beyond adhesion. Cancer Lett.
2013;330:150-162.
76. Ouhtit A, Gaur RL, Elmageed ZYA, et al. Towards understanding the mode of action of the
multifaceted cell adhesion receptor CD146. Biochimica et Biophysica Acta (BBA)-Reviews on
Cancer. 2009;1795:130-136.
77. Harkness L, Zaher W, Ditzel N, Isa A, Kassem M. CD146/MCAM defines functionality of
human bone marrow stromal stem cell populations. Stem cell research & therapy. 2016;7:4.
78. Tormin A, Li O, Brune JC, et al. CD146 expression on primary nonhematopoietic bone
marrow stem cells is correlated with in situ localization. Blood. 2011;117:5067-5077.
79. Espagnolle N, Guilloton F, Deschaseaux F, Gadelorge M, Sensébé L, Bourin P. CD 146
expression on mesenchymal stem cells is associated with their vascular smooth muscle
commitment. J Cell Mol Med. 2014;18:104-114.
80. Paduano F, Marrelli M, Palmieri F, Tatullo M. CD146 expression influences periapical cyst
mesenchymal stem cell properties. Stem Cell Reviews and Reports. 2016;12:592-603.
81. Sorrentino A, Ferracin M, Castelli G, et al. Isolation and characterization of CD146
multipotent mesenchymal stromal cells. Exp Hematol. 2008;36:1035-1046.
82. Ferland-McCollough D, Slater S, Richard J, Reni C, Mangialardi G. Pericytes, an
overlooked player in vascular pathobiology. Pharmacol Ther. 2017;171:30-42.

65
83. Crisan M, Yap S, Casteilla L, et al. A perivascular origin for mesenchymal stem cells in
multiple human organs. Cell stem cell. 2008;3:301-313.
84. Crisan M, Corselli M, Chen C, Péault B. Multilineage stem cells in the adult: a perivascular
legacy? Organogenesis. 2011;7:101-104.
85. Chen M, Su W, Lin X, et al. Adoptive Transfer of Human Gingiva‐Derived Mesenchymal
Stem Cells Ameliorates Collagen‐Induced Arthritis via Suppression of Th1 and Th17 Cells and
Enhancement of Regulatory T Cell Differentiation. Arthritis & Rheumatology. 2013;65:1181-
1193.
86. Zhang Q, Nguyen AL, Shi S, et al. Three-dimensional spheroid culture of human gingiva-
derived mesenchymal stem cells enhances mitigation of chemotherapy-induced oral mucositis.
Stem cells and development. 2011;21:937-947.
87. Moshaverinia A, Xu X, Chen C, et al. Application of stem cells derived from the periodontal
ligament or gingival tissue sources for tendon tissue regeneration. Biomaterials. 2014;35:2642-
2650.
88. Fawzy El‐Sayed KM, Paris S, Becker ST, et al. Periodontal regeneration employing gingival
margin‐derived stem/progenitor cells: an animal study. J Clin Periodontol. 2012;39:861-870.
89. Fawzy El‐Sayed KM, Mekhemar MK, Beck‐Broichsitter BE, et al. Periodontal regeneration
employing gingival margin‐derived stem/progenitor cells in conjunction with IL‐1ra‐hydrogel
synthetic extracellular matrix. J Clin Periodontol. 2015;42:448-457.
90. Pini Prato GP, Rotundo R, Magnani C, Soranzo C, Muzzi L, Cairo F. An autologous cell
hyaluronic acid graft technique for gingival augmentation: A case series. J Periodontol.
2003;74:262-267.

66
91. Milinkovic I, Aleksic Z, Jankovic S, et al. Clinical application of autologous fibroblast cell
culture in gingival recession treatment. J Periodontal Res. 2015;50:363-370.
92. Zurek J, Dominiak M, Botzenhart U, Bednarz W. The use of a biostatic fascia lata thigh
allograft as a scaffold for autologous human culture of fibroblasts - An in vitro study. Annals of
Anatomy. 2015;199:104-108.
93. Agis H, Collins A, Taut AD, et al. Cell population kinetics of collagen scaffolds in Ex Vivo
oral wound repair. PLoS ONE. 2014;9.
94. Cheung JWC, Rose EE, Paul Santerre J. Perfused culture of gingival fibroblasts in a
degradable/polar/hydrophobic/ ionic polyurethane (D-PHI) scaffold leads to enhanced
proliferation and metabolic activity. Acta Biomater. 2013;9:6867-6875.
95. Zhang Q, Nguyen A, Yu W, Le A. Human oral mucosa and gingiva: a unique reservoir for
mesenchymal stem cells. J Dent Res. 2012;91:1011-1018.
96. Fawzy El-Sayed KM, Dörfer CE. Gingival mesenchymal stem/progenitor cells: a unique
tissue engineering gem. Stem cells international. 2016;2016.
97. Jiang C, Liu J, Zhao J, et al. Effects of hypoxia on the immunomodulatory properties of
human Gingiva–derived mesenchymal stem cells. J Dent Res. 2015;94:69-77.
98. Zhang Q, Su W, Shi S, et al. Human gingiva‐derived mesenchymal stem cells elicit
polarization of m2 macrophages and enhance cutaneous wound healing. Stem Cells.
2010;28:1856-1868.
99. Chiquet M, Katsaros C, Kletsas D. Multiple functions of gingival and mucoperiosteal
fibroblasts in oral wound healing and repair. Periodontol 2000. 2015;68:21-40.

67
100. Zhang Q, Shi S, Liu Y, et al. Mesenchymal stem cells derived from human gingiva are
capable of immunomodulatory functions and ameliorate inflammation-related tissue destruction
in experimental colitis. J Immunol. 2009;183:7787-7798.
101. Ge S, Mrozik KM, Menicanin D, Gronthos S, Bartold PM. Isolation and characterization of
mesenchymal stem cell-like cells from healthy and inflamed gingival tissue: potential use for
clinical therapy. Regen Med. 2012;7:819-832.
102. Ogawa M, LaRue AC, Drake CJ. Hematopoietic origin of fibroblasts/myofibroblasts: Its
pathophysiologic implications. Blood. 2006;108:2893-2896.
103. Feng J, Mantesso A, Sharpe PT. Perivascular cells as mesenchymal stem cells. Expert
opinion on biological therapy. 2010;10:1441-1451.
104. Jin S, Lee J, Yun J, Kim I, Ko Y, Park J. Isolation and characterization of human
mesenchymal stem cells from gingival connective tissue. J Periodont Res. 2015;50:461-467.
105. Brohem CA, de Carvalho CM, Radoski C, et al. Comparison between fibroblasts and
mesenchymal stem cells derived from dermal and adipose tissue. Int J Cosmetic Sci.
2013;35:448-457.
106. Rouabhia M. Advantages and Limitations of Oral Stem Cell use for Oral Tissue
Replacement. J Oral Bio. 2015;2:9-17.
107. Menicanin D, Hynes K, Han J, Gronthos S, Bartold PM. Cementum and Periodontal
Ligament Regeneration. Adv Exp Med Biol. 2015;881:207-236.

68
108. Tsao Y, Huang Y, Wu H, Liu Y, Liu Y, Lee OK. Osteocalcin mediates biomineralization
during osteogenic maturation in human mesenchymal stromal cells. International journal of
molecular sciences. 2017;18:159.
109. Lozito TP, Kolf CM, Tuan RS. Microenvironmental regulation of adult mesenchymal stem
cells. In: Regulatory Networks in Stem Cells. Springer; 2009:185-210.
110. Giacaman R, Perez V, Carrera C. Mineralization processes in hard tissues: Teeth. In:
Biomineralization and Biomaterials. Elsevier; 2016:147-185.
111. Waddington RJ, Sloan AJ. Research advances in tissue regeneration by dental pulp stem
cells. Tissue Engineering and Regeneration in Dentistry: Current Strategies. 2016:50-68.
112. Mostafa NZ, Uludağ H, Varkey M, Dederich DN, Doschak MR, El-Bialy TH. In vitro
osteogenic induction of human gingival fibroblasts for bone regeneration. The open dentistry
journal. 2011;5.
113. Zhu W, Tan Y, Qiu Q, et al. Comparison of the properties of human CD146 and CD146−
periodontal ligament cells in response to stimulation with tumour necrosis factor α. Arch Oral
Biol. 2013;58:1791-1803.
114. Tavangar MS, Hosseini SM, Dehghani-Nazhvani A, Monabati A. Role of CD146
Enrichment in Purification of Stem Cells Derived from Dental Pulp Polyp. Iran Endod J.
2017;12:92-97.
115. Xu J, Wang W, Kapila Y, Lotz J, Kapila S. Multiple differentiation capacity of STRO-1
/CD146 PDL mesenchymal progenitor cells. Stem cells and development. 2008;18:487-496.

69
116. Saraogee A. Engineering a chondrogenic microenvironment to promote MSC
chondrogenesis. . 2017.
117. Bizenjima T, Seshima F, Ishizuka Y, Takeuchi T, Kinumatsu T, Saito A. Fibroblast growth
factor‐2 promotes healing of surgically created periodontal defects in rats with early,
streptozotocin‐induced diabetes via increasing cell proliferation and regulating angiogenesis. J
Clin Periodontol. 2015;42:62-71.
118. Ishii Y, Fujita T, Okubo N, Ota M, Yamada S, Saito A. Effect of basic fibroblast growth
factor (FGF-2) in combination with beta tricalcium phosphate on root coverage in dog. Acta
Odontol Scand. 2013;71:325-332.
119. Murakami S, Takayama S, Kitamura M, et al. Recombinant human basic fibroblast growth
factor (bFGF) stimulates periodontal regeneration in class II furcation defects created in beagle
dogs. J Periodont Res. 2003;38:97-103.
120. Cheung JWC, McCulloch CAG, Santerre JP. Establishing a gingival fibroblast phenotype
in a perfused degradable polyurethane scaffold: mediation by TGF-beta1, FGF-2, beta1-integrin,
and focal adhesion kinase. Biomaterials. 2014;35:10025-10032.
121. Pilipchuk S. CURRENT AND PROSPECTIVE CLINICAL TECHNIQUES FOR TISSUE
ENGINEERING TO PROMOTE BONE AND PERIODONTAL REGENERATION IN THE
ORAL CAVITY. Design of 3D-Printed, Micropatterned Scaffolds for Tissue Engineering of
Bone-Ligament Constructs in the Oral Cavity using Gene Therapy. 2018;195:17.
122. Terashima Y, Shimabukuro Y, Terashima H, et al. Fibroblast growth factor‐2 regulates
expression of osteopontin in periodontal ligament cells. J Cell Physiol. 2008;216:640-650.

70
123. Xiao G, Jiang D, Gopalakrishnan R, Franceschi RT. Fibroblast growth factor 2 induction of
the osteocalcin gene requires MAPK activity and phosphorylation of the osteoblast transcription
factor, Cbfa1/Runx2. J Biol Chem. 2002;277:36181-36187.
124. Takayama S, Yoshida J, Hirano H, Okada H, Murakami S. Effects of basic fibroblast
growth factor on human gingival epithelial cells. J Periodontol. 2002;73:1467-1473.
125. Diomede F, Gugliandolo A, Scionti D, et al. Biotherapeutic effect of gingival stem cells
conditioned medium in bone tissue restoration. International journal of molecular sciences.
2018;19:329.
126. Lee H, Lee JY, Ha D, Jeong J, Park J. Effects of Valproic Acid on Morphology,
Proliferation, and Differentiation of Mesenchymal Stem Cells Derived From Human Gingival
Tissue. Implant Dent. 2018;27:33-42.
127. Gugliandolo A, Diomede F, Cardelli P, et al. Transcriptomic analysis of gingival
mesenchymal stem cells cultured on 3 D bioprinted scaffold: A promising strategy for
neuroregeneration. Journal of Biomedical Materials Research Part A. 2018;106:126-137.
128. Zorin VL, Pulin AA, Eremin II, et al. Myogenic potential of human alveolar mucosa
derived cells. Cell Cycle. 2017;16:545-555.
129. Subbarayan R, Murugan Girija D, Mukherjee J, Mamidanna SRR, Ranga Rao S.
Comparision of gingival and umbilical cord stem cells based on its modulus and neuronal
differentiation. J Cell Biochem. 2017;118:2000-2008.
130. Subbarayan R, Murugan Girija D, Ranga Rao S. Gingival spheroids possess multilineage
differentiation potential. J Cell Physiol. 2018;233:1952-1958.

71
131. Ansari S, Diniz IM, Chen C, et al. Human Periodontal Ligament‐and Gingiva‐derived
Mesenchymal Stem Cells Promote Nerve Regeneration When Encapsulated in
Alginate/Hyaluronic Acid 3D Scaffold. Advanced healthcare materials. 2017;6:1700670.
132. Santamaría S, Sanchez N, Sanz M, Garcia-Sanz JA. Comparison of periodontal ligament
and gingiva-derived mesenchymal stem cells for regenerative therapies. Clin Oral Investig.
2017;21:1095-1102.
133. Rao SR, Subbarayan R, Dinesh MG, Arumugam G, Raja STK. Differentiation of human
gingival mesenchymal stem cells into neuronal lineages in 3D bioconjugated injectable protein
hydrogel construct for the management of neuronal disorder. Exp Mol Med. 2016;48:e209.
134. Ha D, Pathak S, Yong CS, Kim JO, Jeong J, Park J. Potential differentiation ability of
gingiva originated human mesenchymal stem cell in the presence of tacrolimus. Scientific
reports. 2016;6:34910.
135. Van Pham P, Tran NY, Phan NL, Vu NB, Phan NK. Vitamin C stimulates human gingival
stem cell proliferation and expression of pluripotent markers. In Vitro Cellular & Developmental
Biology-Animal. 2016;52:218-227.
136. Ansari S, Chen C, Xu X, et al. Muscle Tissue Engineering Using Gingival Mesenchymal
Stem Cells Encapsulated in Alginate Hydrogels Containing Multiple Growth Factors. Ann
Biomed Eng. 2016;44:1908-1920.
137. Jin S, Lee J, Yun J, Kim I, Ko Y, Park J. Isolation and characterization of human
mesenchymal stem cells from gingival connective tissue. J Periodont Res. 2015;50:461-467.

72
138. Wu S, Chiu H, Chin Y, et al. Effects of enamel matrix derivative on the proliferation and
osteogenic differentiation of human gingival mesenchymal stem cells. Stem cell research &
therapy. 2014;5:52.
139. Xu QC, Wang ZG, Ji QX, et al. Systemically transplanted human gingiva-derived
mesenchymal stem cells contributing to bone tissue regeneration. Int J Clin Exp Pathol.
2014;7:4922-4929.
140. Gao Y, Zhao G, Li D, Chen X, Pang J, Ke J. Isolation and multiple differentiation potential
assessment of human gingival mesenchymal stem cells. International journal of molecular
sciences. 2014;15:20982-20996.
141. El-Bialy T, Alhadlaq A, Wong B, Kucharski C. Ultrasound effect on neural differentiation
of gingival stem/progenitor cells. Ann Biomed Eng. 2014;42:1406-1412.
142. Moshaverinia A, Chen C, Xu X, et al. Bone regeneration potential of stem cells derived
from periodontal ligament or gingival tissue sources encapsulated in RGD-modified alginate
scaffold. Tissue Eng Part A. 2014;20:611-621.
143. Li N, Liu N, Zhou J, et al. Inflammatory environment induces gingival tissue‐specific
mesenchymal stem cells to differentiate towards a pro‐fibrotic phenotype. Biology of the Cell.
2013;105:261-275.
144. Yang H, Gao L, An Y, et al. Comparison of mesenchymal stem cells derived from gingival
tissue and periodontal ligament in different incubation conditions. Biomaterials. 2013;34:7033-
7047.
145. Hsu S, Huang G, Feng F. Isolation of the multipotent MSC subpopulation from human
gingival fibroblasts by culturing on chitosan membranes. Biomaterials. 2012;33:2642-2655.

73
146. Ge S, Mrozik KM, Menicanin D, Gronthos S, Bartold PM. Isolation and characterization of
mesenchymal stem cell-like cells from healthy and inflamed gingival tissue: potential use for
clinical therapy. Regenerative medicine. 2012;7:819-832.
147. Tang L, Li N, Xie H, Jin Y. Characterization of mesenchymal stem cells from human
normal and hyperplastic gingiva. J Cell Physiol. 2011;226:832-842.
148. Wang F, Yu M, Yan X, et al. Gingiva-derived mesenchymal stem cell-mediated therapeutic
approach for bone tissue regeneration. Stem cells and development. 2011;20:2093-2102.
149. Marynka‐Kalmani K, Treves S, Yafee M, et al. The lamina propria of adult human oral
mucosa harbors a novel stem cell population. Stem Cells. 2010;28:984-995.
150. Moshaverinia A, Chen C, Akiyama K, et al. Alginate hydrogel as a promising scaffold for
dental-derived stem cells: an in vitro study. Journal of Materials Science-Materials in Medicine.
2012;23:3041-3051.
151. Tomasello L, Mauceri R, Coppola A, et al. Mesenchymal stem cells derived from inflamed
dental pulpal and gingival tissue: a potential application for bone formation. Stem cell research
& therapy. 2017;8:179.

74
Appendix
Table A1. Summary of published studies using GFs
Author
Cellular
population
Method of isolation
Medium used
for expansion
MSC markers
High
expression
Low
expression
1. Diomede,
et al.
(2018)125
Anatomical site
not reported
Explant:
Tissues ground then washed
several times with PBS,
subsequently cultured using
TheraPEAK™MSCGM-CD™
37°C in 5 % CO2.
Cells were
cultured in
MSCGM-
CD™serum-free
medium then
seeded in a
commercial
polylactide
(PLA) 3D printed
scaffold treated
with conditioned
medium obtained
from GMSCs,
collected at
passage 2.
Oct3/4
Sox-2
SSEA-4
CD29
CD44
CD73
CD90
CD105
CD34
CD14
CD45

75
2. Hyunjin,
et al.
(2018)126
Obtained
during periodontal
treatments.
De-epithelialized, minced into 1 to
2mm fragments and digested in
0.2-mm filtered MEM with 2
mg/mL collagenase IV
incubated in a humidified
incubator at 37°C.
10% FB
4 mM L-
glutamine
100 U/mL
penicillin
100 mg/mL
streptomycin
Osteogenic
medium with
valproic acid
(VPA)
Not reported Not
reported
3.
Gugliandolo,
et al.
(2017)127
Not reported Explant:
Tissues were de-epithelialized and
washed with PBS,
37 °C in 5 % CO2.
DMEM high-
glucose medium
10% FBS
humidified
atmosphere, 5%
CO2.
CD29
CD44
CD73
CD90
CD105
OCT3/4
SSEA4
SOX2
CD14
CD34
CD45
In vitro Polylactic acid polymer filaments,
3D printed.
4. Vadim, et
al. (2017)128
Biopsies of the
alveolar mucosa of
the retromolar area
and attached
gingiva
from the distal
mandibular molar
level
αMEM supplemented with 10%
FBS.
20 mg/mL gentamicin, 0.05%
solution of collagenase type II
Incubated for 12 hours at 37°C.
DMEM/F12
20% FBS
20 m g/mL
gentamicin
CD73
CD90
CD105
CD324,
cytokeratins
(14, 15, 16,
19)
CD31
CD34
CD45

76
5. Subbara-
yan, et al.
(2017)129
Unspecified Enzymatic + overnight plating:
Overnight at 4°C
with dispase 2mg/ml.
Tissues were minced into 1 to
3mm2 fragments
Collagenase IV 4 mg/ml at 37°C
for 2 hours.
[Adopted from Zhang (2009)]
αMEM
10% FBS
100U/mL
penicillin
100 mg/mL
streptomycin
2mM l-glutamine
100mM
nonessential
amino acid
550 mM 2-
mercaptoethanol
37°C in a
humidified tissue
culture incubator
with 5% CO2.
MSCs were
cultured as a
suspension
culture in ultra-
low attachment
dishes to obtain
3D spheroid
formation.
[Adopted from
Zhang (2012)]
CD45
CD34
CD73
CD90
STRO-1
VIMENTIN
OCT-4A
NANOG
SOX-2
SSEA-4
TRA-1-60
TRA-1-81
CD45
CD34
CD11b
CD19
HLA-DR
6. Subbaray
an, et al.
(2017)130
Crown lengthening
procedure or
operculectomy
Explant:
αMEM
10% FBS
CD73
CD90
CD105
CD45
CD34
CD11b

77
Tissue minced and suspended in
the selected medium, left
undisturbed at 37°C in a
humidified
incubator with 5% CO2.
CD44
STRO1
OCT-4,
NANOG,
SOX-2
SSEA-4
TRA1-60
TRA 1–81
CD19
HLA-DR
7. Ansari, et
al. (2017)131
Tissues obtained
from patients
undergoing third
molar extractions
Not reported MSC culture
media
CD73
CD105
CD146
CD34
CD45
In vitro Alginate hydrogel with hyaluronic
acid.
8.
Santamaría,
et al.
(2017)132
After prescribed
periodontal
surgery in the
palatal maxilla.
Enzymatic:
Collagenase I 3mg/ml,
dispase II 4 mg/ml,
1 hour 37°C in 5 % CO2.
DMEM: F12
supplemented
10% FCS
100 U/mL
penicillin
100 μg/mL
streptomycin
50 μg/ml
gentamycin
2 mM L-
glutamine
CD 73
CD 90
CD 105
CD 34
CD 45
HLA-DR
CD11b
CD19
9. Rao, et al.
(2016)133
Crown-lengthening
procedure
or operculectomy.
Enzymatic:
Cut into 1 to 3mm2 pieces and
digested at
αMEM
10%FBS
100 U/mL
penicillin
CD90
CD105
CD73
Oct-4
CD45
CD34
CD11b
CD19

78
37°C for 2 hours in a sterile
medium containing
1mg/ml collagenase type II with
gentle agitation applied.
100 μg/mL
streptomycin
100 μg/mL
amphotericin B
2 mM L-
glutamine
cultured at 37 °C
with 5% CO2.
NANOG
SOX-2
SSEA-4
TRA-1-60
TRA-1-81
HLA-DR
In vitro
Cells incapsulated in 3D hydrogel
(Indian-Del No. 1413del2013).
10. Ha
(2016)134
Gingival derived
stem cells
In vitro
Enzymatic:
De-epithelialized and minced into
1 to 2 mm2 fragments digested in
0.2 ml filtered
αMEM containing dispase (1
mg/mL and collagenase IV) 2
mg/ml at 37°C for 30 minutes.
After discarding the initially
digested cell suspension, the
tissues were digested in the same
solution for 90 minutes at 37°C.
The cell suspension was filtered
with a 70 µm cell strainer.
[Adopted from Jin et al. (2015)]
Cells were incubated with
Tacrolimus-loaded poly (lactic-co-
glycolic acid) microspheres.
αMEM
15% FBS
100 U/mL
penicillin
100 lg/mL
streptomycin
200 mM L-
glutamine
10 mM ascorbic
acid 2 phosphate
[Adopted from
Jin et al. (2015)]
Not reported Not
reported

79
11. Van
Pham, et al.
(2016)135
Explant:
Tissue minced and suspended in
the medium and left undisturbed at
37°C in a humidified
incubator with 5% CO2.
DMEM/F12
10% FBS
1% antibiotic
antimycotic
solution
CD13 CD44
CD73
CD90
CD105
CD14
CD34
CD45
HLA-DR
12. Ansari,
et al.
(2016)136
GMSCs – not
specified
In vitro &
in vivo
Only enzymatic:
2 mg/ml collagenase type I
4 mg/ml dispase II
1 hour at 37°C
αMEM
15% FBS
2 mM L –
glutamine
100 nM Dex
100 mMascorbic
acid
100 mM ascorbic
acid
2 mM sodium
pyruvate
100 µg/ml
streptomycin
CD73,
CD105, and
CD146
≈ 70%
CD34
CD45
13. El-
Sayed, et al.
(2015)70
From the third
molar region with
free
gingival soft tissue
collars
Explant:
Rinsed several
times with Eagle’s minimum
essential medium alpha
modification supplemented with
100 U/ml penicillin
100 mg/ml 21 streptomycin
and 1% amphotericin.
αMEM
15% fetal calf
serum
400 mmol/ml L-
glutamine
100 U/ml 21
penicillin
100 mg/ml 21
streptomycin
1% amphotericin
CD73
CD90
CD105
MUC18
STRO-1
CD146
≈ 8.4–92.7%
CD14
CD34
CD45

80
In vitro
Placed into dry culture flasks for
30 minutes to allow them to
adhere to the bottoms of the
flasks. Cells were then left to grow
in the basic media at 5% carbon
dioxide at 37C.
14. Jin, et
al. (2015)137
Tissues collected
after clinical
crown lengthening
procedures
Enzymatic:
De-epithelialized and minced into
1 to 2 mm2 fragments digested in
0.2 ml filtered
αMEM containing dispase (1
mg/mL and collagenase IV) 2
mg/mL at 37°C for 30 minutes.
After discarding the first digested
cell suspension, the tissues were
digested in the same solution for
90 minutes at 37°C. The cell
suspension was filtered with a 70
µm cell strainer.
αMEM
15% FBS
100 U/ml
penicillin
100 lg/ml
streptomycin
200 mM L-
glutamine
10 mM ascorbic
acid 2 phosphate
CD44
CD73
CD90
CD105
SSEA-4
STRO-1
CD146,
CD166
CD271
CD14
CD19
CD34
CD45
15. Wu, et
al. (2014)138
After crown
lengthening
procedures or distal
wedge periodontal
surgeries
In vitro
At 37°C and 5%
CO2
αMEM
10% FBS
1%penicillin
streptomycin
(P/S)
CD90
CD105
CD73
STRO-1
Not
reported
16. XU, et
al. (2014)139
Anatomical site not
identified
Enzymatic:
αMEM medium
15% FBS
CD73
CD105
CD144
CD31

81
In vitro &
in vivo
Washed several times with PBS.
Incubated in 2mg/ml dispase at
40°C overnight.
Connective tissue is then minced
and digested in 2mg/ml
collagenase (type not reported) for
4 minutes at 37°C.
CD29
CD44
Stro-1
HLA-DR
CD34
CD45
17. Gao, et
al. (2014)140
Gingival tissue
after 3rd molar
extraction
In vitro &
in vivo
Enzymatic + CFU-F
Overnight at 40°C with 2mg/ml
dispase to separate the epithelial
and spinous layers. The tissue was
minced into fragments and
digested with 4 mg/mL
collagenase IV at 37°C for 2 hours
followed by colony forming units.
αMEM
supplemented
with 10% FBS
STRO-1
CD29
CD90
CD105
CD146
8.5%
CD34
CD45
18. El-Bialy,
et al.
(2014)141
Gingival tissue
around the
premolar extraction
site following ortho
treatment
In vitro
Explant:
Cut into small pieces, isolated on
glass slides, placed in a culture
plate at 37°C in a humidified
atmosphere of 5% CO2.
DMEM
10% FBS
100 U/mL
penicillin
100 l g/mL
streptomycin
CD73
CD90
CD105
CD11b
CD34
CD45
CD31
19. Gay, et
al. (2014)71
Human gingival
tissue –
Enzymatic:
3 mg/ml collagenase type I
DMEM with
10% FBS and 1%
Pen-strep at 37°C
CD105,
CD29,
Not
reported

82
unspecified
anatomical site
In vitro
4 mg/ml of dispase SSEA4
OCT4
STRO-1
OCT4
NANOG
20.
Moshaverini
a, et al.
(2014)142
Human gingival
tissue – unspecified
anatomical site
Enzymatic:
Minced and digested in
collagenase IV solution at 37°C
for 2 hours.
Cell suspension filtered through a
70mm cell strainer. Incubated at
37°C in 5% CO2.
αMEM
15% FBS
100 mM ascorbic
acid 2-phosphate
2mM glutamine
100U/ml
penicillin,
100 mg/ml
streptomycin
550 mM 2-
mercaptoethanol
CD166
CD146
≈70%
CD34
In vitro &
In vivo
Cells encapsulated in RGD
alginate capsules.
21.
Moshaverini
a, et al.
(2014)87
Enzymatic:
Minced and digested in
collagenase IV solution at 37°C
for 2 hours.
Cell suspension filtered through a
70mm cell strainer. Incubated at
37°C in 5% CO2.
αMEM
15% FBS
100 mM ascorbic
acid 2-phosphate
2mM glutamine
100U/ml
penicillin,
100 mg/ml
streptomycin
550 mM 2-
mercaptoethanol
CD105
CD146
CD34
In vitro &
In vivo
RGD-coupled alginate

83
22. Li, et al.
(2013)143
Gingival tissue
after gingivectomy
(healthy and
inflamed)
In vitro &
in vivo
Enzymatic and Explant:
0.4% dispase at 37°C for 30 min.
gingival epithelium
stripped off,
type 1 collagenase 0.66mg/ml for
40min
DMEM
10% FBS
0.292 mg/ml of
glutamine
100 U/ml
penicillin
100 mg/ml of
streptomycin at
37°C in a
humidified
atmosphere of
5% CO2 and 95%
air.
CD29
CD90
CD44
CD105
less
expressed
Stro-1
CD146
≈ 8-11%
CD34
CD45
23. Hao
Yang et al.
(2013)144
GMSCs – from the
third molar cervical
ridge
In vitro &
In vivo
Enzymatic followed by Explant:
0.1% dispase
0.2% collagenase IV
30 minutes at 37°C
Tissue incubated until cells grew
out.
α-MEM
10% FBS
0.292 mg/mL
glutamine
100 units/mL
penicillin
streptomycin
STRO-1
CD90
CD105
CD29
CD146
55.2 %
CD31
CD45
24. Hsu, et
al. (2012)145
GMSCs –
unspecified site,
subpopulation
expressing high
(Oct4, Nanog) &
(Slug and Sox10)
In vitro
Explant:
Gingival tissue cut into pieces and
explanted into 60mm tissue
culture polystyrene dishes.
α-MEM
10% FBS
100 mg/ml
streptomycin 100
U/ml penicillin
50 mg/ml
gentamicin
CD29
CD44
CD73
CD90
CD105
CD106
&STRO1
CD146
≈61-91%
CD31
CD34
CD45

84
25. Ge, et al.
(2012)146
Collected
from patients
undergoing crown
lengthening
surgery
Enzymatic + CFUF:
Collagenase type 1 (3 mg/ml;
Dispase II neutral protease) 4
mg/ml for 2 hours at 37°C and
filtered through
70-μm cell strainer + CFUF
selection
α-MEM
20% FBS
2 mM l-
glutamine
100 mM l-
ascorbate-2
phosphate
1 mM sodium
pyruvate
50 U/mL
penicillin G
50 μg/mL
streptomycin
2.5 μg/mL
amphotericin B
37°C with 5%
CO2.
CD44
CD73
CD90
CD105
CD166
CD14
CD34
CD45
26. Tang, et
al. (2011)147
Gingival tissue
following
gingivectomy
(healthy and
inflamed)
In vitro &
In vivo
Enzymatic:
0.4% dispase at 37°C for 30
minutes followed by
physically stripping the gingival
epithelium. The remaining
propria tissues were digested with
type I collagenase (0.66 mg/ml)
for 50 minutes. Single cell
suspensions.
DMEM
10% FBS
0.292 mg/mL
glutamine
100 U/mL
penicillin G
100 mg/mL
streptomycin
CD29
CD44
CD90
CD105
Stro-1
CD146
≈ 85-93%
CD34
CD45

85
27. Wang, et
al. (2011)148
The gingival
tissues were
discarded
tissues following
conventional dental
procedures
In vitro
Enzymatic:
Removal of epithelial layer
Gingiva tissue was minced and
incubated in a mixture of 0.1%
dispase and 0.2% collagenase IV
for 15 minutes at 37°C.
The initially digested cell
suspension was discarded and
incubated in 0.2% trypsin for 5,
10, and 15 minutes at 37°C. All
cell fractions were collected.
αMEM
10% FBS
100U/mL
penicillin
100 mg/mL
streptomycin in
at 37°C in 5%
CO2.
CD29
CD105
STRO-1
CD90
CD34
CD45
In vivo Cellmatrix type I-A kit
(Cellmatrix_ Type 1-A)
28. Keren, et
al. (2010)149
Oral mucosa –
gingival and
periosteal tissue
Explants only:
αMEM
12% FCS
2 mM glutamine
Antibiotics (penicillin [100 U/ml]
Streptomycin [0.1 mg/ml]
Fungisone [0.25 μg/ml]).
low-glucose
Dulbecco’s
modified Eagle’s
medium
(LGDMEM)
10% FBS
CD29
CD73
CD90
CD105, and
CD166
Stro1 and
CD106
human
leukocyte
antigen-DR
(HLA-ABC)
CD146
≈ 16%
SSEA4,
CD34
CD45
human
leukocyte
antigen-DR
(HLA-DR)
SSEA3
SSEA1
Tra1-60,
Tra1-81
CD117

86
In vitro
Oct4, and
Sox2
In vivo
(Formed a
teratoma)
Fibrin membranes
29. Mitrano,
et al.
(2010)42
Gingival tissue was
taken from the
maxillary
tuberosity.
Explanted method only:
Deepithelialized
with a scalpel, #15, leaving only
the connective tissue. The explants
were placed in
tissue culture dishes.
α-MEM,
10% FBS and
1% penicillin,
streptomycin, and
amphotericin.
CD90
CD105
CD73
CD44
CD13
CD34
CD38
CD45
CD54
30. Tomar,
et al.
(2010)66
Gingival tissue –
unspecified
location
Enzymatic method only:
0.1% collagenase
0.2% dispase for 15 minutes at
37°C
The first cell fraction was
discarded. Tissues were further
incubated in enzyme solution for
5, 10, and 15 minutes and all cell
fractions were
α-MEM
10% FBS
CD44
CD29
CD73
CD90
CD105
CD34,
CD14
CD45

87
pooled.
31. Fournier,
et al. (2010)2
All gingival
samples were
obtained from
buccal marginal
tissues
Explant cultures + CFU-F:
Primary explant cultures were
established.
The CFU-F were then
transferred and cultivated.
DMEM
20% fetal calf
serum (FCS),
100 mg penicillin
ml
100 mg/ml
streptomycin
2 ng/ml
amphotericin B
CD29
CD44
CD73
CD90
CD105
STRO-1
CD271
CD146
≈ 3-17%
CD34
CD45
CD117
CD200
HLA-DR
32.
Moshaverini
a, et al.
(2012)150
3rd molar site
following tooth
extraction
Enzymatic:
Minced and digested in
collagenase IV solution at 37°C
for 2 hours.
Cell suspension filtered through a
70-mm cell strainer. Then
incubated at 370C in 5% CO2.
αMEM
15% FCS
100 mM ascorbic
acid 2-phosphate
2mM glutamine
100U/mL
penicillin,
100 mg/mL
streptomycin
550 mM 2-
mercaptoethanol
CD73
CD146
CD34
In vitro
In vivo
Alginate microcapsules
33.
Tomasello,
et al.
(2017)151
Oral surgery
procedures for
tooth extraction.
Enzymatic:
5 mg/ml collagenase G
2 mg/ml collagenase H
in a 4:1 ratio for 4 hours at 37°C
under agitation.
StemLine
Mesenchymal
Stem Cell
Expansion
Medium with
0.5 μg/mL
gentamicin
Stro-1
CD146
CD29
SSEA4
CD146
≈16.5-75.2%
CD 34
CD 45
HLA-DR

88
0.25 μg/mL
levofluoxacin
0.10 μg/mL
vancomicin
0.25 μg/mL
fluconazole
5% FBS and
incubated at 37°C
in 5% CO2.
34. Zhang
Q. et al
(2009)39
The gingival
tissues were
obtained as
remnant or
discarded
tissues following
routine dental
procedures
In vitro
Enzymatic + overnight plating:
overnight at 4°C
with dispase 2 mg/ml
tissues were minced into 1- to 3-
mm2 fragments
collagenase IV 4 mg/ml at 37°C
for 2 h
α-MEM
10% FBS
100 U/mL
penicillin
100 µg/mL
streptomycin
2 mM L-
glutamine
100 mM
nonessential
amino acid
550 µM 2-ME
37°C tissue
culture incubator
with 5% CO2 and
95% O2.
Oct-4
CD29
CD90
CD73
Less
expression
CD105
SSEA-4
Stro-1
CD146
7.1%
CD45
In vivo hydroxyapatite/tricalcium
phosphate ceramic powder

89
Figure A4.a Patient JO: A) Flow cytometry histogram with overlay of CD marker expression in
Enzymatic/Explant, CD146high/CD146low. B) Individual analysis of CD146, CD90, CD105, CD73,
CD45, and CD34.
A.
B.

90
Figure A4.b Patient LU: A) Flow cytometry histogram with overlay of CD marker expression in
Enzymatic/Explant, CD146high/CD146low. B) Individual analysis of CD146, CD90, CD105, CD73,
CD45, and CD34.
A.
B.

91
Figu4.c Patient SI: A) Flow cytometry histogram with overlay of CD marker expression in
Enzymatic/Explant, CD146high/CD146low. B) Individual analysis of CD146, CD90, CD105, CD73,
CD45, and CD34.
A.
B.

92
Figure A4d Patient KE: A) Flow cytometry histogram with overlay of CD marker expression in
Enzymatic/Explant, CD146high/CD146low. B) Individual analysis of CD146, CD90, CD105, CD73,
CD45, and CD34.
A.
B.

93
Figure A4.e Patient RO: A) Flow cytometry histogram with overlay of CD marker expression in
Enzymatic/Explant, CD146high/CD146low. B) Individual analysis of CD146, CD90, CD105, CD73,
CD45, and CD34.
A.
B.

94
Figure A4.f Patient SA. A) Flow cytometry histogram with overlay of CD marker expression in
Enzymatic/Explant, CD146high/CD146low. B) Individual analysis of CD146, CD90, CD105, CD73,
CD45, and CD34.
Generating bibliography... please wait
A.
B.

95