israel citrus annual - usda gain publications/citrus annual... · locally produced varieties are...
TRANSCRIPT

THIS REPORT CONTAINS ASSESSMENTS OF COMMODITY AND TRADE ISSUES MADE BY
USDA STAFF AND NOT NECESSARILY STATEMENTS OF OFFICIAL U.S. GOVERNMENT
POLICY
Date:
Approved By:
Prepared By:
Report Highlights:
Post forecasts Israel’s MY 2015/16 (October-September) citrus production at 600 thousand metric
tons (TMT), up nearly 10 percent from MY2014/15. The increase is attributable to record
production of easy peelers and an increase in orange production due to new plantings in recent
years. Post expects an increase of 16 percent in citrus exports in MY 2015/16, due to the increase
in production. The U.S. and Canada have relatively large shares of Israeli citrus exports and account for about 9
percent of Israeli citrus exports overall. On the other hand, due to the economic situation in Russia
and Ukraine, exports of Israeli citrus to these two markets decreased significantly in MY 2014/15.
Gilad Shachar
Agricultural Marketing Specialist
Orestes Vasquez
Sr. Agricultural Attaché
Citrus Annual
Israel
12/1/2015
Required Report - public distribution
Executive Summary:
The total planted area to citrus was 19,500 hectares (ha) in 2015, 100 HA above 2014. The Or/Orri
mandarin variety accounts for 5,800 ha or 29 percent of the area, and about 55 percent of the new
plantings in 2015 were Or/Orri variety. Taken as a whole, mandarin varieties account for 49
percent of the total citrus planted area.
Post forecasts that MY 2015/16 total citrus production should reach about 600 TMT, a 10 percent
increase compared to MY 2014/2015. The increase is mainly due to increased production of
mandarins and oranges. As a result, orange and easy peeler production is expected to reach 120
TMT and 225 TMT, respectively- a record high for easy peelers. Post forecasts Israel’s exports of
citrus in MY 2015/16 to reach 200 TMT, up by 22 percent compared to MY2014/15. Export growth
is being driven by increased production of easy peelers in MY 2015/16.
MY 2014/15 fresh fruit exports were 163 TMT out of which mandarins accounted for 56 percent
and grapefruit for 37 percent of total exports. The mandarin variety, Or, accounted for 65 TMT, or
40 percent of all Israeli citrus exports. Grapefruit exports have continued their decline and this is
mainly due to the uprooting of red grapefruit over the past 4 years. On the other hand, Or variety
exports increased significantly in MY 2014/15 compared to the previous years as a result of an
increased local production of this variety. About two-thirds of citrus deliveries to processing plants
in the past three years were grapefruits, but as a result of the decreased grapefruit planted area,
in MY 2014/15, only 58 percent of the deliveries were grapefruit.
The Russian market which was a good market for Israeli citrus in recent years experienced a
significant decrease in MY 2014/15, mainly due to the dramatic weakening of the Ruble, and since
January 2015, no Israeli citrus exports were shipped to Russia.
Due to strong hail storms in January 2015, it is estimated that about 50,000 tons of citrus fruit
were destroyed, and a further 50,000 tons of citrus were graded as a B quality product; hence,
production in MY 2014/15 was hit significantly.
Commodities:

Production:
Crop Area
The bulk of the Israeli citrus industry is located in central (48 percent) and southern Israel (31
percent). However, there is also significant citrus production in northern Israel (21 percent). The
total planted area to citrus was 19,500 ha in 2015, an increase of 150 ha from 2014. The Or /Orri
mandarin is the most widespread planted variety, accounting for 5,700 ha or 29 percent of the
total area. Taken as a whole, mandarin varieties account for 49 percent of the total planted area,
while area with red grapefruit has decreased significantly to 1,700 ha compared to 2,800 ha seven
years ago, a 40 percent decrease. Oranges have retained their planted area of 4,000 ha or 20
percent share. In 2014 there are about 3,300 ha of planted grapefruit (white, red and sweetie)
which is a record low. About 55 percent of the new plantings in 2015 were Or /Orri mandarin
variety.
Table 1: Citrus Orchards by Variety, 2015, Hectares and Percentage
Hectares %
Grapefruit 3,300 17
Oranges 4,000 20
Mandarins (easy peelers) 9,500 49
Lemons and Limes 2,000 10
Others 700 4
Total 19,500 100%
Post forecasts that MY 2015/16 total production should reach about 600 TMT, nearly a 12 percent
increase compared to MY 2014/15. The increase is mainly due to increased mandarin and orange
production and better weather condition compared to the previous year. As a result, easy peeler
production in MY 2015/16 is expected to reach 240,000 tons, a record for easy peelers. In
addition, an increasing number of mandarin trees (mainly Or) have entered the fruit-bearing stage
over the last three years. The relatively low citrus production in MY2013/14 and MY2014/15 was
mainly due to hot weather conditions in the spring and hail storms in the winter significantly
affecting easy peeler and orange production. In addition, due to the winter storms in January 2014
and 2015 citrus experienced lower fruit quality and size. Due to strong hail storms in January
2015, it is estimated that about 50,000 MT of citrus fruit were destroyed, and a further 50,000
tons of citrus were graded as a B quality product. In sum, production in MY 2014/15 was hit
significantly as it was estimated last year that MY 2014/15 production would total about 605,000
tons, while in the end it amounted to only 543,000 tons.
Table 2: Citrus Production by Varieties, thousand metric tons, MY
MY Oranges Mandarins Lemons/Limes Grapefruit Other Total
Oranges, Fresh
Orange Juice
Lemons, Fresh
Citrus, Other, Fresh
Tangerines/Mandarins, Fresh
Grapefruit, Fresh

(easy
peelers)
Citrus1 Production
2007/08 125 145 35 242 13 560
2008/09 155 139 29 232 12 567
2009/10 148 150 48 235 14 595
2010/11 100 125 30 190 10 455
2011/12 116 166 53 245 6 586
2012/13 73 178 51 208 7 517
2013/14 69 139 64 236 9 517
2014/15 86 205 58 186 8 543
2015/16 107 240 60 185 8 600 (1) Other Citrus includes red and white pomelos, kumquat, limquat, ethrog (citron).
Table 3: Citrus Type Share of Total Production, Percentage, MY
MY Oranges
Mandarins
(easy
peelers)
Lemons/Limes Grapefruit Other
Citrus
Total
Production
2007/08 22.3 25.9 6.3 43.2 2.3 100
2008/09 27.3 24.5 5.1 40.9 2.2 100
2009/10 24.9 25.2 8.1 39.0 2.8 100
2010/11 22.0 27.5 6.6 41.7 2.2 100
2011/12 19.8 28.3 9.0 41.8 1.0 100
2012/13 14.1 34.5 9.8 40.3 1.3 100
2013/14 13.3 26.9 12.4 45.6 1.8 100
2014/15 15.8 37.8 10.7 34.3 1.4 100
2015/16 17.8 40.0 10.0 30.8 1.4 100
Oranges – Post forecasts that orange production in MY 2015/16 will reach 107,000 TMT, a 24
percent expansion from the previous year. The growth is mainly due to increased orange planting
in recent years. Shamuti and navel oranges remain Israel’s two main orange varieties with a
planted area of 4,000 ha.
Tangerines/ Mandarins (Easy Peelers) – Post forecasts total mandarin production in
MY 2014/15 at 240 TMT, a record high and a 17 percent increase from the previous year. In the
last three marketing seasons, the full production potential of the easy peelers was not achieved
due to unfavorable weather conditions. The Or/Orri variety, the main mandarin variety, captured
about 44 percent or 90 TMT of the total mandarin production in MY 2014/15. Out of the 90 TMT,
72 percent (65 TMT) was exported and the rest (25 TMT) was consumed fresh locally. Other main
locally produced varieties are Suntina, Mineola, Topaz, Orra, Michal, Murcott and Hadas.
Grapefruit – Although there has been a significant decrease in the past three years in the area
planted to red grapefruit varieties, the star ruby “sunrise” variety is the main citrus variety
exported by Israel with a 27 percent market share of total Israeli fresh citrus exports, as well as 59
percent of citrus deliveries to the processing industry. Post forecasts that in MY 2015/2016, Israel
will produce 185 TMT of grapefruit, unchanged from the previous year.
Lemons and Limes – MY 2015/16 lemon and lime production is expected to total 60 TMT, a 3
percent increase from MY 2014/15. Almost all lemons and limes are locally consumed.

Other Citrus – In the last four years, white pomelo planted area has increased by nearly 80
percent. White and red production is mostly consumed domestically. Other citrus are expected to
total 8 TMT in MY 2015/16, unchanged from the previous MY, of which 3,000 tons will be exported,
4,500 tons for local consumption and 500 tons will be processed domestically.
Table 4: Citrus Utilization, Destination, metric tons, MY
Period Total Exports Delivery to Processors Local Fresh Market
MY Quantity % Quantity % Quantity % Total Percent
2007/08 172,059 30.7 212,097 37.9 175,844 31.4 100
2008/09 173,576 30.6 223,310 39.4 170,277 30.0 100
2009/10 179,238 30.0 182,203 30.6 234,531 39.4 100
2010/11 154,996 34.1 139,906 30.7 160,000 35.2 100
2011/12 180,388 30.4 231,454 39.5 176,424 30.1 100
2012/13 166,723 31.2 174,493 39.0 176,000 29.8 100
2013/14 160,691 32.5 177,000 34.2 172,000 33.3 100
2014/15 163,342 30.1 200,000 36.8 180,000 33.1 100
2015/16 190,000 31.7 210,000 35.0 200,000 33.3 100
Consumption:
Post estimates local consumption of fresh citrus fruit in MY 2015/2016 at 200 TMT, an 11 percent
increase from the previous year. The increase is mainly due to the increased supply of oranges and
easy peelers, which will provide attractive pricing in the local fresh market. Most lemon (90
percent) production is consumed fresh by the local market, while just 36 percent of the easy
peelers’ production is consumed domestically, due to higher profitability of the Or/Orri mandarin
variety in the export market.
Table 5: Fresh Citrus Consumption by the Local Market, MY
2013/14 2014/15
Quantity (tons) % Quantity (tons) %
Oranges 46,000 28.6 46,000 25.6
Grapefruit 24,000 8.1 8,000 4.4
Easy Peelers (mandarins) 37,000 23.0 68,000 37.8
Lemons 58,000 36.0 52,000 28.9
Others 7,000 4.3 6,000 3.3
Total 172,000 100 180,000 100
The Processing Industry
Two groups control Israel’s three citrus processing plants. The plants are “Gan Shmuel”, “Pri- Nir”
and “Pri- Mor”. Post estimates deliveries to processing plants in MY 2015/16 will total 210 TMT, up
5 percent from the previous year. The slight increase is driven mainly by oranges and easy peelers’
production. In MY 2014/15 deliveries to the processing industry were up by 13 percent compared
to the previous year and totaled 200 TMT. Pricing was good for most varieties. The increase in
orange deliveries is attributed to a higher demand for oranges for juice in the hotel, coffee shop
and restaurant sector. About 60 percent of citrus deliveries in MY 2014/15 were grapefruit. Easy
peeler deliveries to the processing industry were also up in MY 2014/15, and this is mainly due to
increased local production of easy peelers.

Table 6: Delivery to the Processing Plants, MY
2011/12 2012/13 2013/14 2014/15
Tons % Tons % Tons % Tons %
Oranges 38,092 16 25,550 15 16,000 9 35,500 18
Grapefruit 153,008 66 117,198 67 134,000 76 117,000 59
Mandarins 37,723 16 29,969 17 24,300 14 45,000 22
Lemons 2,631 1 1,776 1 2,700 1 2,500 1
Total 231,454 100 174,493 100 177,000 100 200,000 100
Trade:
Post forecasts Israel’s exports of citrus in MY 2015/16 to reach about 190 TMT, up 16 percent
compared to the previous marketing year. Export growth is being driven mainly by increased
production of both easy peelers (due to Or/Orri mandarin’s very good receptivity in the European
market) and oranges. Total citrus exports in MY 2014/15 were up by nearly 2 percent compared to
the previous marketing year of 163 TMT, of which 56 percent were mandarins and 37 percent
grapefruit. Mandarins and grapefruit account for about 93 percent of the Israeli fresh citrus
exports, a trend that is expected to continue in the coming years. The Or mandarin and Star Ruby
grapefruit varieties alone account for 40 and 27 percent of total citrus exports, respectively.
Oranges on the other hand, continue to see their export market share significantly drop. Oranges
dropped to 3 percent within the citrus export mix in MY 2014/2015; down from 15.5 percent in MY
2008/2010. The significant decrease in orange exports in MY 2012/13, MY 2013/14 and MY
2014/15 compared to the previous years is attributed mainly to the sharp decrease in production
driven by unfavorable weather conditions. Nonetheless, due to favorable weather conditions in MY
2015/16, orange exports are expected to rebound reaching about 10 TMT, or a 100 percent
increase compared to
MY 2014/15. Due to the strengthening of the Israeli shekel compared to the Euro in MY 2014/15
(10% valuation) and the dramatic Russian ruble drop, the revenues of Israeli citrus exporters were
reduced in MY 2014/15 compared to the previous MY.
Table 7: Fresh Citrus Exports by Varieties, metric tons, MY
2011/12
2012/13
2013/14
2014/15
2014/15 % Chg. vs.
2013/2014
Oranges 13,007 7,369 6,880 4,930 -28.3%
Grapefruit 79,905 78,632 76,807 61,078 -20.4%
Mandarins 83,399 78,170 71,021 91,989 29.5%
Lemon and
Limes 1,174
766
3,199 3,416
6.8%
Other Citrus 2,893 1,786 2,784 1,929 -30.7%

Grand Total 813,081 166,723 160,691 163,342 8.1%
Chart 1: Major Citrus Export Varieties, MY 2014/15, Percentage of Total Exports
Red Grapefruit
27%
Sweetie 7%
Shamuti 2%
Suntina 8%Minneola 4%
Or 41%
Lemon 2%
White Grapefruit 3%
Others 6%
Suntina
, Minneola and Or are mandarins varieties
In the last four years “Mehadrin” has been the country’s largest grower and exporter of quality
citrus, as well as a leading exporter of other fruits and vegetables. There are about 50 authorized
private citrus exporters in Israel.
Chart 2: Export Market Destinations, Fresh Citrus, MY 2014/15, Market Share
Europe- European markets import about 75 percent of Israel’s citrus exports. Specifically, Western
Europe absorbs 58 percent of Israeli citrus exports (mainly UK, Scandinavian countries, Holland,
France, Italy and Germany), while Russia and the Ukraine combined take in 17 percent compared
to 23 percent in the previous year.
Russia – The significant weakening of the Russian rubble in conjunction with the economic
situation in Ukraine has dramatically decreased Israeli citrus exports to these two markets.
Japan - Exports to Japan of sweetie (grapefruit variety) in MY 2014/15 decreased by 48 percent
from the previous marketing year. Post finds that red pomelo exports decreased by 41 percent in
MY 2014/15 compared to MY 2013/14, due to shipping earlier than normal and lower quality.

After a hiatus of several years, there have been some exports of white and red grapefruit to
Japan. All in all, it is estimated that total Israeli citrus exports to Japan in MY 2015/16 will not be
much different from MY2014/15.
Table 8: Israeli Fresh Citrus Export to Japan, number of cases, MY
2012/13 2013/14
2014/15
2014/15 % Chg. vs. 2013/2014
White Grapefruit 0 0 10,856 ---
Sweetie 228,816 192,964 100,856 -16%
Red Pomelo 2,520 1,428 840 -43%
Red Grapefruit 2,496 0 1,400 -100%
Other Countries - Increased exports to long distance markets are taking place and mainly go to
United States, Canada, South Korea and Japan. The United States and the Canadian markets
account for 9 percent of the total Israeli citrus exports compared to 2-3 percent in recent years.
Exports by Citrus Varieties:
Oranges – Post estimates exports of oranges to reach 10 TMT in MY 2015/16, an increase of 100
percent compared to the previous marketing year. The expected increase in exports is mainly due
to higher local orange production this season. Due to bad weather conditions in MY 2013/14 and
2014/15, local orange production was significantly lower compared to the previous year leading to
a significant decrease in orange exports in the recent three MY. Israeli Shamuti is, far and away,
the main export variety.
Table 9: Oranges Varieties Exports, metric tons, MY
2012/13
2013/14
2014/15
2014/15 % Chg. vs. 2013/2014

Navel 663 187 684 266%
Shamuti 5,224 6,177 3,911 -37%
Valencia 1,482 516 335 -35%
Total 7,369 6,880 4,930 -28%
Tangerines/ Mandarins (Easy Peelers) – Post forecasts total mandarin exports in MY 2015/16 to
reach about 115 TMT, up 25 percent compared to MY 2014/15. The increase is due to a record
easy peeler production (mainly Or variety), as well as its continued increased demand. In My
2014/15, Or variety exports totaled about 65 TMT, and captured 41 percent of all Israeli citrus
exports. Or mandarins are exported mainly to France.
Table 10: Mandarins (easy-peelers) Varieties Exports, metric tons, MY
2012/13
2013/14
2014/15
2014/15 % Chg. vs. 2013/2014
Or/Orri 48,918 53,274 65,324 23%
Mineolla 5,947 6,818 6,249 -8%
Suntina 13,174 10,500 12,489 19%
Topaz/Tangor 2,856 957 327 -66%
Others 7,275 6,351 7,600 20%
Total 78,170 77,900 91,989 18%
Grapefruit –Due to the significant local uprooting of grapefruit in recent years, grapefruit exports in
MY 2014/15 continued their decline in recent years and totaled 61,078 in MY 2014/15,
representing a 20 percent decrease compared the previous MY. The main Israeli grapefruit export
decrease was recorded in red grapefruit. However, post estimates that Israeli grapefruit exports
will increase by about 10 percent in MY 2015/16 and this is due to expected higher prices for fresh
grapefruit in Europe.
On the other hand, white grapefruit experienced a 42 percent increase to 5.5 TMT. The Star Ruby
(red grapefruit) variety accounts for 27 percent of total citrus exports in MY 2014/15 compared to
36 percent share in recent years.
Table 11: Grapefruit Varieties Exports, metric tons, MY
2012/13 2013/14 2014/15 2014/15 % Chg. vs. 2013/2014
White Grapefruit 5,588 3,850 5,475 42%
Red Grapefruit 59,843 59,031 43,999 -25%
Sweetie 13,192 13,502 11,604 -14%
Total 78,632 76,383 61,078 -20%
Other Citrus –Lemon exports in MY2014/15 totaled 3 TMT and lime exports at 1 TMT. Red and
white pomelo experienced a decrease in exports in MY 2014/15 and this is mainly the result of
lower local production combined with competition by Chinese pomelo producers. It is expected the
lemons and other citrus varieties exports will total about 6,000 tons in MY 2015/16.
Table 12: Lemons and Other Citrus Varieties Exports, metric tons, MY
2012/13 2013/14 2014/15 2014/15 % Chg. vs.

2013/2014
Lemons 583 2,860 2,553 -10%
Red Pomelo 973 1,071 853 -20%
White Pomelo 451 1,166 600 -48%
Limquat and
Kumquat 362
541 557 3%
Lime 183 421 782 86%
Total 2,552 6,059 5,189 -14%
Policy:
Exports of U.S.-origin citrus to Israel are not currently permissible. A Pest Risk Assessment (PRA)
has not been conducted for U.S. citrus. Indications are that even should Israel’s Plant and
Protection Service conduct a PRA for U.S. citrus, high shipping costs would hinder U.S. citrus
exports. In addition, Israel does not import any fresh citrus, and this is not expected to change in
the coming years.
Table 13: Tariff-rate Quotas, U.S. Fresh Citrus, Orange and Grapefruit Juices, U.S.-Israel
Agreement on Trade in Agricultural Products
Description Total Quota (metric tons) Duty
Oranges* 1,689 0%
Lemons* 506 0%
Grapefruit* 1,689 0%
Other citrus
(non-easy peelers)* 1,689 0%
Frozen Orange Juice
(packages over 100 kg) 4,154 0%
Frozen Grapefruit Juice
(packages over 100 kg) 1,016 0%
* Requires a Pest Risk Assessment (PRA). Without a PRA the product cannot enter Israel.
** Within the quota it is duty-free. Kilograms = kg.
No fresh citrus is exported to Israel, as all Israeli citrus consumption is coming from local
production.
Production, Supply and Demand Data Statistics:
Lemons/Limes,
Fresh 2013/2014 2014/2015 2015/2016
Market Begin Year Oct 2013 Oct 2014 Oct 2015
Israel USDA
Official
New
Post
USDA
Official
New
Post
USDA
Official
New
Post
Area Planted 2000 2000 2000 0 0 2000
Area Harvested 1870 1870 1800 0 0 1800
Bearing Trees 0 0 0 0 0 0
Non-Bearing Trees 0 0 0 0 0 0
Total No. Of Trees 0 0 0 0 0 0
Production 64 64 65 0 0 60

Imports 0 0 0 0 0 0
Total Supply 64 64 65 0 0 60
Exports 3 3 3 0 0 3
Fresh Dom.
Consumption
58 58 60 0 0 55
For Processing 3 3 2 0 0 2
Total Distribution 64 64 65 0 0 60
(HECTARES) ,(1000 TREES) ,(1000 MT)
Tangerines/Mandarins,
Fresh 2013/2014 2014/2015 2015/2016
Market Begin Year Oct 2013 Oct 2014 Oct 2015
Israel USDA
Official
New
Post
USDA
Official
New
Post
USDA
Official New Post
Area Planted 9000 0 9400 9400 0 9500
Area Harvested 6900 0 7300 7300 0 7600
Bearing Trees 0 0 0 0 0 0
Non-Bearing Trees 0 0 0 0 0 0
Total No. Of Trees 0 0 0 0 0 0
Production 139 0 200 205 0 240
Imports 0 0 0 0 0 0
Total Supply 139 0 200 205 0 240
Exports 78 0 89 92 0 115
Fresh Dom.
Consumption
37 0 80 68 0 75
For Processing 24 0 31 45 0 50
Total Distribution 139 0 200 205 0 240
(HECTARES) ,(1000 TREES) ,(1000 MT)
Grapefruit, Fresh 2013/2014 2014/2015 2015/2016
Market Begin Year Oct 2013 Oct 2014 Oct 2015
Israel USDA
Official
New
Post
USDA
Official
New
Post
USDA
Official New Post
Area Planted 3800 0 3300 3300 0 3300
Area Harvested 3750 0 3050 3050 0 3070
Bearing Trees 0 0 0 0 0 0
Non-Bearing Trees 0 0 0 0 0 0
Total No. Of Trees 0 0 0 0 0 0
Production 236 0 169 186 0 185
Imports 0 0 0 0 0 0
Total Supply 236 0 169 186 0 185
Exports 78 0 61 61 0 65
Fresh Dom.
Consumption
24 0 10 8 0 10
For Processing 134 0 98 117 0 110
Total Distribution 236 0 169 186 0 185

(HECTARES) ,(1000 TREES) ,(1000 MT)
Oranges, Fresh 2013/2014 2014/2015 2015/2016
Market Begin Year Oct 2013 Oct 2014 Oct 2015
Israel USDA
Official
New
Post
USDA
Official
New
Post
USDA
Official
New
Post
Area Planted 4100 0 4000 4000 0 4000
Area Harvested 3900 0 3750 3750 0 3800
Bearing Trees 0 0 0 0 0 0
Non-Bearing Trees 0 0 0 0 0 0
Total No. Of Trees 0 0 0 0 0 0
Production 69 0 108 86 0 107
Imports 0 0 0 0 0 0
Total Supply 69 0 108 86 0 107
Exports 7 0 6 5 0 10
Fresh Dom.
Consumption
46 0 76 46 0 50
For Processing 16 0 26 35 0 47
Total Distribution 69 0 108 86 0 107
(HECTARES) ,(1000 TREES) ,(1000 MT)
Orange Juice 2013/2014 2014/2015 2015/2016
Market Begin Year Oct 2013 Oct 2014 Oct 2015
Israel USDA
Official
New
Post
USDA
Official
New
Post
USDA
Official
New
Post
Deliv. To
Processors
16000 16000 25500 35500 0 47000
Beginning Stocks 100 100 100 100 0 100
Production 1500 1500 2500 3340 0 4420
Imports 28000 28000 26500 25800 0 26000
Total Supply 29600 29600 29100 29240 0 30520
Exports 13500 13500 13000 12740 0 13400
Domestic
Consumption
16000 16000 16000 16400 0 16900
Ending Stocks 100 100 100 100 0 220
Total Distribution 29600 29600 29100 29240 0 30520
(MT)
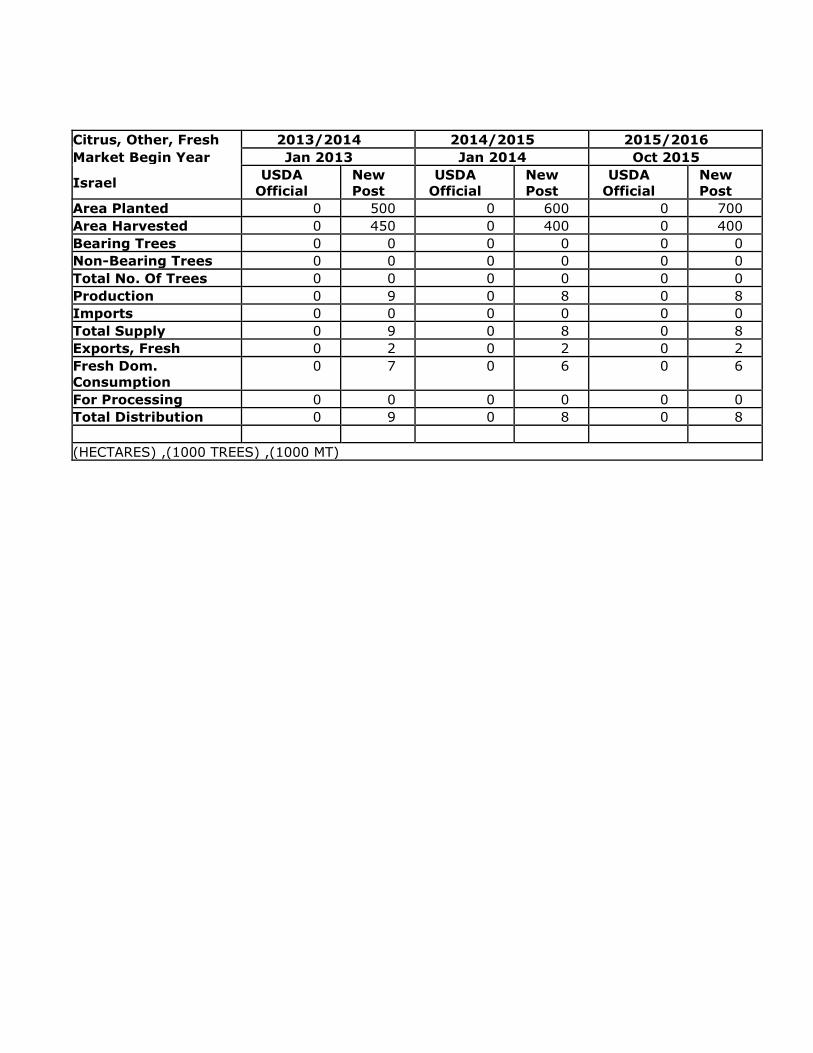
Citrus, Other, Fresh 2013/2014 2014/2015 2015/2016
Market Begin Year Jan 2013 Jan 2014 Oct 2015
Israel USDA
Official
New
Post
USDA
Official
New
Post
USDA
Official
New
Post
Area Planted 0 500 0 600 0 700
Area Harvested 0 450 0 400 0 400
Bearing Trees 0 0 0 0 0 0
Non-Bearing Trees 0 0 0 0 0 0
Total No. Of Trees 0 0 0 0 0 0
Production 0 9 0 8 0 8
Imports 0 0 0 0 0 0
Total Supply 0 9 0 8 0 8
Exports, Fresh 0 2 0 2 0 2
Fresh Dom.
Consumption
0 7 0 6 0 6
For Processing 0 0 0 0 0 0
Total Distribution 0 9 0 8 0 8
(HECTARES) ,(1000 TREES) ,(1000 MT)