iss-1 – hp restricted 1 implementing green technology los angeles technology forum december 3,...
TRANSCRIPT

ISS-1 – HP Restricted1
Implementing Green TechnologyLos Angeles Technology ForumDecember 3, 2007
Brad Dupuy Industry Manager, State and Local Government MarketsHP Technology Solutions Group

ISS-1 – HP Restricted2
The world environmental issue
Global environmental impact
Limited energy resources
Escalating costs
Business disruption from limited power
Social accountability

Environmental Sustainability and Obtainable Goals
• Understanding Government Impact
• Federal Mandates• Goals and Initiatives in
other states• What state CIOs are saying• Collateral benefits of Green
IT• Together Government and
Private Sector can set realistic Green IT Goals
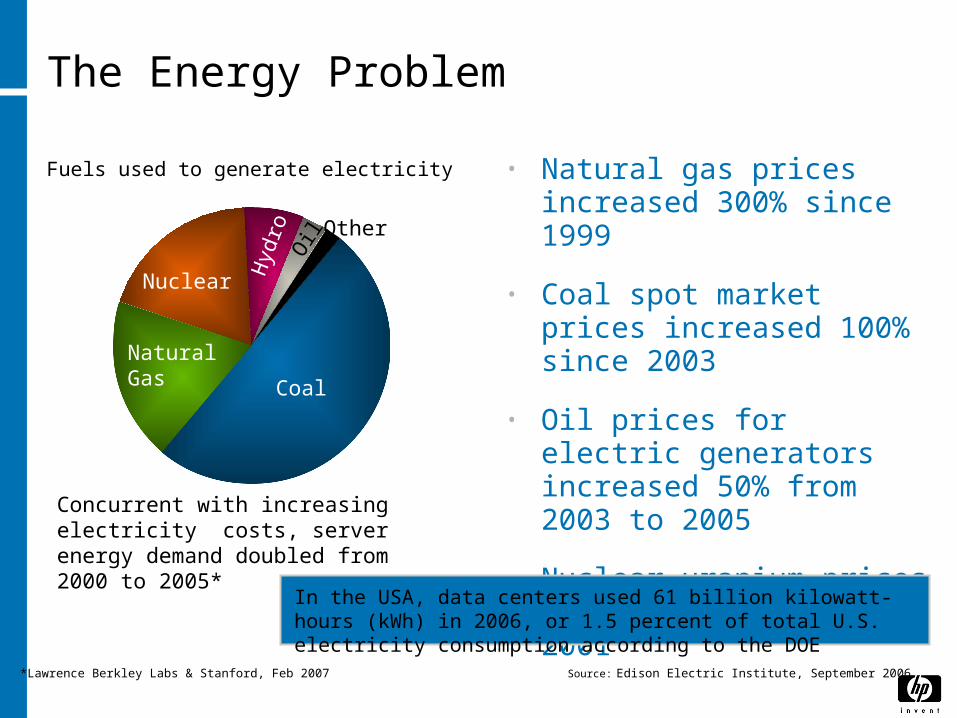
The Energy Problem
• Natural gas pricesincreased 300% since 1999
• Coal spot market prices increased 100% since 2003
• Oil prices for electric generators increased 50% from 2003 to 2005
• Nuclear uranium prices increased 40% since 2001
Fuels used to generate electricity
Source: Edison Electric Institute, September 2006
Concurrent with increasing electricity costs, server energy demand doubled from 2000 to 2005*
In the USA, data centers used 61 billion kilowatt-hours (kWh) in 2006, or 1.5 percent of total U.S. electricity consumption according to the DOE
*Lawrence Berkley Labs & Stanford, Feb 2007
Coal
Natural Gas
Nuclear Hyd
roO
il Other

The eWaste Problem
• While Electronic waste represents 2 percent of America's trash in landfills, it equals 70 percent of overall toxic waste (1)
• In the US – 65 Million computers to be retired this year (2)
• Switzerland was the first electronic waste recycling system 1991 beginning with collection of old refrigerators. Now recycles approx. 20 lbs per capita
• Europe, the Waste Electrical & Electronic Equipment (WEEE) will continue to have strict guidelines for recycling electronics.
• Mandates include Congress law 109-431 ordering EPA to study environmental issues and technology
(1) Slade, Giles. "iWaste", Mother Jones, 2007-04-01. (2) http://ecycleenvironmental.com/(1) Slade, Giles. "iWaste", Mother Jones, 2007-04-01. (2) http://ecycleenvironmental.com/

ENERGY EFFICIENCY
Mega Considerations for Green IT
Energy Efficiency
Material Impact

ENERGY EFFICIENCY
Mega Considerations for Green IT
Energy Efficiency
Material Impact

Energy Efficiency
• Energy Consumption from IT products
• Data Center considerations
• IT Strategies, such as Virtualization
• Current Energy Standards on IT

Energy consumption of the products
Power
Evolution
Cooling
Evolution
• Power/ Watts• Density• Dual/Quad core• Green chips
• Thermal Logic sensors
• Power balancing
• Active cool fans• Local/Central
cooling controls
• 80+ Power Supplies
• Thin Client• Increased
Notebook and Flat Panel use
Individual product advances

What the industry predicted ….
Systems power rising ….

First, let me appeal to your pocketbook
ISS-1 – HP Restricted11
Data centers are at a breaking pointData center power density up >5x in the last 10 years I&E Costs are 2X that of a 1U server today (more tomorrow)Energy costs are rising and make things worse It takes as much power to cool as to compute
Conflict between scaling IT and energy efficiency
Source: Belady, C., “In the Data Center, Power and Cooling Costs More than IT Equipment it Supports”, Electronics Cooling Magazine (Feb 2007)
IT & cooling power & electricity cost of $0.1/kW-hr

Data center energy requirements—an idea of the scale of things
60 W 500 W 12 KW 10 - 15 KW 1 MW
EXAMPLE: 1 rack filled with 24, 4P servers uses 12KW
100 Racks @ power- 12 KW + cooling- 12 KW = 2,400 KW,
Cost: @ 0.15 KWHr. = $3M per year (8,760 Hrs)
Total consumption is 20MWHrs Note: power/cooling energy depends on applications, workloads, environment, climate, energy
costs, etc…. All assumptions are provided as an example only
Calculate your
energy consumptio
n
+
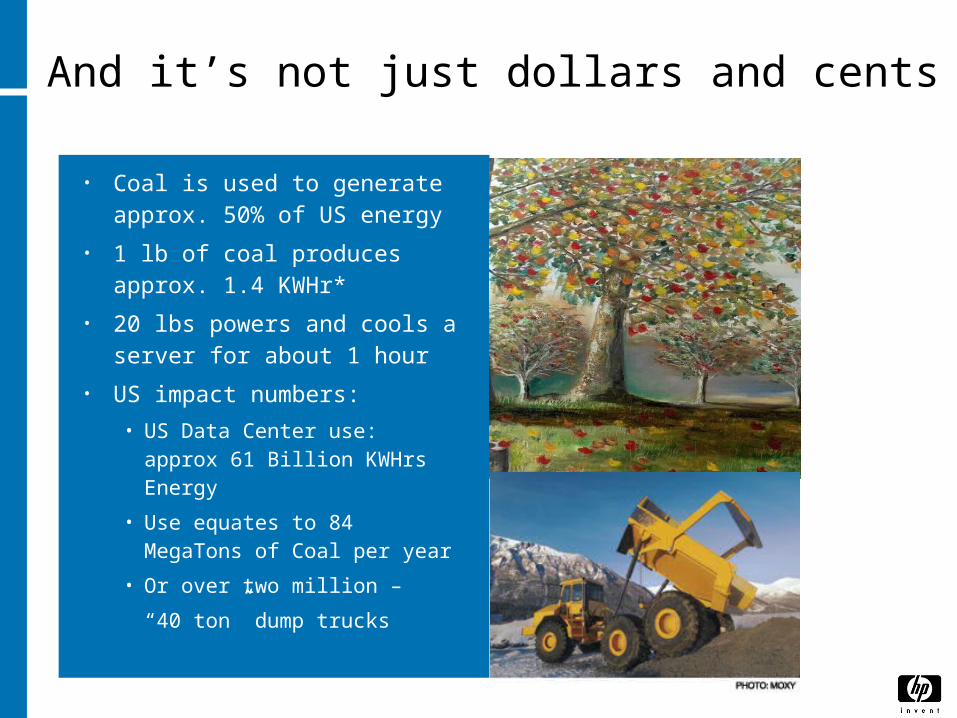
And it’s not just dollars and cents
• Coal is used to generate approx. 50% of US energy
• 1 lb of coal produces approx. 1.4 KWHr*
• 20 lbs powers and cools a server for about 1 hour
• US impact numbers:
• US Data Center use: approx 61 Billion KWHrs Energy
• Use equates to 84 MegaTons of Coal per year
• Or over two million –
“40 ton” dump trucks
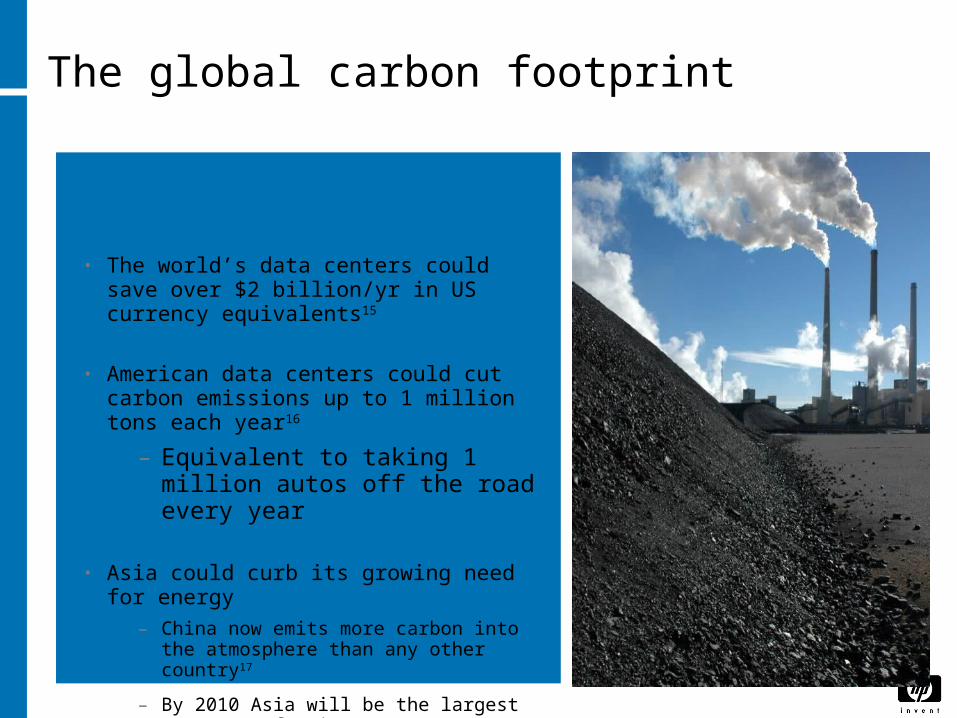
The global carbon footprint
If the world used power saving solutions
• The world’s data centers could save over $2 billion/yr in US currency equivalents15
• American data centers could cut carbon emissions up to 1 million tons each year16
– Equivalent to taking 1 million autos off the road every year
• Asia could curb its growing need for energy
– China now emits more carbon into the atmosphere than any other country17
– By 2010 Asia will be the largest consumer of primary energy18
– By 2020 China & India will produce more carbon emissions than the USA & Europe combined19

Compute Power Cooling
Flexible & Configurable Elements
Sensing Infrastructure
Control Engines, Tools
Designing a Smart Data Center
• Pillars of the Data center: Compute, Power and Cooling
• Goal: Improve data center energy and operational efficiencies
• Holistic design of flexible energy-aware management/provisioning solutions
• End to end focus from chips to room
• Comprehending products & services
Delivering demand-based provisioning of compute & energy resources

ISS-1 – HP Restricted16
Evaluating energy efficient solutions for the IT Power & Cooling Chain
Optimizing from chip to chiller
Overall Strategies•Thermal Zone Mapping, Data Center Assessments, Data Center Site Preparation
Manageability Tools•Insight Power Manager and iLO 2•Dynamic Capacity Management•Thin Provisioning & Data de-duplication•Virtualization
Servers & Storage•Efficient Power Supplies•Energy Optimized Servers•Small Form Factor Drives•Low Power Processors•Low Power Memory
Systems•BladeSystem Enclosures•Thermal Logic•PARSEC enclosure cooling•Active Cool Fans
Data Center & Facilities•Dynamic Smart Cooling•Modular Cooling System•Power Distribution Rack•Three Phase UPS
Up to 33% of Entire Data Center Power
Energy Savings
“Chip to Chiller”

Energy-saving Blade Servers
BladeSystem with Thermal Logic• Revolutionary Active Cool Fans• PARSEC Architecture (parallel redundant enclosure cooling)
• Dynamic Power Saver• Power Regulator
BladeSystem reduces Power, Cooling, costs by 36%.*
Optimizing from chip to chiller
CoolingIT
Powering IT
Savings
Conversion
Savings
Powering IT
CoolingIT
*Sine Nomine Associates Feb 15, 2007
Power Supply

Energy-optimized Servers
– SFF 10k 72GB hard drives– Low Power AMD & Intel Processors– Efficient Power Supply– Power Manager
Energy Optimized servers use 15% less power.11
Optimizing from chip to chiller
CoolingIT
Powering IT
Savings
Conversion

Thin Provisioning (XP24000)• Reduce cost and save
power by up to 40% 1 – customer only buys what it needs today
• Automatically allocates physical capacity
Green Solutions and Data Storage
1 Actual savings will vary depending on starting capacity, HDD type, and several other factors
CoolingIT
Powering IT
Savings
Conversion
EVA Dynamic Capacity Management: •Virtualization for Storage•Improves disk utilization improves power efficiency•Raises capacity utilization efficiency by up to 2X•Saves up to 45% on power

Considering a holistic energy efficient solution
ISS-1 – HP Restricted20
Optimizing from chip to chiller (performance/watt)
Cooling IT
Powering IT
Energy saving solutions from the server chip to the data center air chillers and everything in between
63% of data center energy consumption is for cooling1
Conversion

Best practice: Data Center Airflow
ISS-1 – HP Restricted21
Benefits
Lower server temperatures
Better reliability
Better uptime
Extends life of current data center
Maximize server density
Lower energy usage
Lower TCO
Benefits
Lower server temperatures
Better reliability
Better uptime
Extends life of current data center
Maximize server density
Lower energy usage
Lower TCO
Best practices
Hot aisle/cold aisle
Matching server airflows
Eliminate gaps in rows
Use longer rows
Use cabinet blanking panels
Orient AC units perpendicular to hot aisles
Seal cable cutouts
Use 0.8m to 1.0m high floors
Use high and low density areas
ITSM
Best practices
Hot aisle/cold aisle
Matching server airflows
Eliminate gaps in rows
Use longer rows
Use cabinet blanking panels
Orient AC units perpendicular to hot aisles
Seal cable cutouts
Use 0.8m to 1.0m high floors
Use high and low density areas
ITSM
40-50% of the inefficiency
inside datacenter is
linked to lack of best practices deployment

ISS-1 – HP Restricted22
Solving hot spot issues with water cooled racks
• More effective use of data center space
• Cooling for high density deployments
• 35KW of cooling capacity in a single rack
• CTO capable, up to 2000 lbs of IT equipment
• Uniform air flow across the front of the servers
• Cools 4 Blade chassis with 64 blades or 42 1U servers
• Adjustable temperature set point
For rack cabinets using over 15 KW, consider liquid cooled.5
CoolingIT
Powering IT
15% Savings
Conversion
• Does not add significant heat load to data center
• Server/Blade deployment unaffected by design
• Level 2 Integration with Software tools

ISS-1 – HP Restricted23
Dynamic Smart Cooling
CoolingIT
Powering IT
Conventional ModeOver Provisioned
Savings
15% to 40% Reduction in Cooling Costs.3
Dynamic Smart Cooling ModeRight-Provisioned
Bridging the gap between IT & facility
Conversion

ISS-1 – HP Restricted24
Dynamic Smart CoolingBridging facilities and IT to realize Adaptive Infrastructure
Energy provisioning solution can reduce cooling costs 20-45%
Standard interfaces to air-conditioning and building management systems
Easy to retrofit or spec for new construction applications
Compatible with 3rd party gear

Power and cooling assessments
Thermal Quick Assessment
Thermal Intermediate Assessment
•Data gathering above floor modeling
•Thermal modeling
•Extensive report and recommendations
Thermal Comprehensive Assessment
•3D under- and above- floor modeling
•Thermal prediction
•Comprehensive report and recommendations
•Visual inspection
•Data measurements
•Basic report and recommendations

Squeezing cost out of the energy envelope
Assuming a 60% savings consolidating servers, 45% savings consolidating storage and 45% remaining cooling savings from Thermal Zone Mapping & DSC together.
Optimizing from chip to chiller
Storage & Server Consolidation
10 mWh
3.3 mWh
Dynamic Smart
Cooling&
Services
33%
Savings
35 kWh 60
kWhCoolingIT
Powering IT
Conversion
Savings

0%
20%
40%
60%
80%
100%
PUE=3.0Typical
PUE=2.4Best
Practices
PUE=2.0CFD
PUE=1.6Closely
Coupling
Energy Savings
Cooling
Power
IT
Smart Cooling Results
0%
20%
40%
60%
80%
100%
PUE=3.0Typical
PUE=2.4Best
Practices
PUE=2.0CFD
PUE=1.6 Closely
Coupling
Cooling
Power
Additional IT
IT
50%
30% 45%20%
25% 85%
Potential energy savings
Potential capacity increases
Optimizationcan significantly
impact data center capacity
Optimization can significantly impact energy usage
or DSC
Typical Best Practices
Static Smart Cooling
HP labs prototypes/ future
Typical Best Practices
Static Smart Cooling
HP labs prototypes/ future
Malone, C., C. Belady, "Metrics to characterize Data Center & IT Equipment Energy Use," Digital Power Forum, Richardson, TX (September 2006)

Optimizing Through VirtualizationOptimizing from chip to chiller
*Computerworld “Low-Cost Data Center Locations” by Robert L. Scheier, September 3, 2007 page 2.
Virtualization cuts Data Center power bill by 30% to 40%.*
CoolingIT
Powering IT
Savings
Con
vers
ion
•Consolidate multiple servers at low capacity to fewer servers operating at high capacity
•Leveraging Fans, Hard Drives, Memory, and I/O
•Power Supply higher efficiency at increases utilization
•Even distribution of consolidated resources in data centers
•ProLiant Essentials Virtual Machine Management Pack and VMware
•Virtual Connect for BladeSystem
•Virtual Server Environment (VSE) & Integrity Virtual Machine
•Storage Virtualization with Thin Provisioning
What Drives Savings?
What is Offers

Server consolidation50-100+% increase in utilization
• DNS/DHCP
• Print server
• ERP
• Custom apps
• DNS/DHCP• Print server• ERP• Custom apps
• Web server• NT apps • Database• And more
HP server running virtualization software
(e.g., VMware, Microsoft Virtual Server, Xen, HP Integrity Virtual
Machines)
Unvirtualized servers
Gaining efficiency
Storage consolidation50-100% increase in utilization
Individual servers with DAS
SAN HP StorageWorks EVA in a SAN30% 50% 75%Utilizatio
n
Virtualization –3TB less
DAS to SAN – 6TB less
15 TB
9 TB
6 TB
Raw
C
apaci
ty T
B
Purc
hase
d
4.5 TBUtilize
d
4.5 TBUtilize
d
4.5 TBUtilize
d
Element virtualization solutions to pool and share resources from desktop to datacenter

Approach to energy innovation
Leverage energy-efficient products
Improve energy efficiency of operations
Rethink energy use to transform society
Energy efficient
Energy effective

Halo Collaboration Studio simulates face-to-face meetings, enabling interactive collaboration while avoiding CO2 emissions.
Using technology to minimize travel

• EPEAT Gold Awards, www.epeat.org
• ENERGY STAR® 4.0
• Taiwan Green Mark
• Japan PC Green Label
• China Energy Conservation Program (CECP)
• IT Eco Declaration
• TCO ’03 (Sweden)
• Korea Eco-Label
• Environmental Choice (Canada)
Meeting global eco-label standards

ENERGY EFFICIENCY
Mega Considerations for Green IT
Energy Efficiency
Material Impact

Material Impact
• Growth of IT Waste
• Design for Environment
• Recycling Products
• Refresh and Renew Products
• Packaging

Example of a small counties eWaste program
2002: 16.5 Tons
2003: 29.5 Tons
2004: 169.7 Tons
2005: 187.3 Tons
2006: 290.1 Tons
2007: 346.4 Tons

Design for Recycling
Use modular designs
Eliminate glues and adhesives
Mark plastic parts
Reduce number/ types of materials
used
Use single-plastic polymers
Use molded-in colors and finishes

Illustration of Environmental Impact through a Product Life Cycle
Revise Strategy
Product Design
Use
Reuse and
Recycle
Manu-facture
Evaluation

Easy-to-recycle products
• No-paint, snap-fit design for easy disassembly—Deskjet 6540
• Shares common parts—Deskjet 3740
• Reduced number of parts—monochrome HP LaserJet print cartridges

Product reuse and recycling options
Trade-in
Return for cash
Leasing
Donation
Recycling
Asset recovery
Remarket/refurbish

Smart packaging
• Use molded pulp with recycled material
• Switch from wood to foam plastic pallets
• Simplify documentation and CDs in boxes
• Package PCs together

Case study: inkjet packaging
New packaging equals:
• 2,813 cars off the road
• 1.48 million gallons of gasoline saved
• 1,668 American homes powered
• 107 acres of forest preserved
• 4,375 tons of landfill waste avoided

Redesigned Ink and Toner Cartridge Packaging to Reduce Greenhouse gas
emissions by 37 million pounds in 2007.
New Old
40% less packaging New Old
40% less packaging
45% less packaging
Old
New
HP Press Release February 8, 2007HP Press Release February 8, 2007

This year, we have surpassed our goal of recycling 1 billion pounds of electronic products and supplies

A look at a recycling facility
• HP’s U.S. plants process 1.5 million pounds of electronics a month.
• HP recovers 8 to 10 ounces of precious metals per ton of recycled materials.

HP’s recycling accomplishments
• More than 164 million pounds recycled globally
• 10.4 million pounds of plastics
• 2.4 million units
• 10 percent of relevant sales

Americas20% of total spend
Asia Pacific and Japan75% of total spend
Europe, Middle East and Africa5% of total spend
Extending HP social and environmental responsibility policies to HP suppliers
Major locations of HP product materials, components and services suppliers

We review and audit our suppliers
• In 2006, HP had audited 115 direct material suppliers at 254 sites.
• In 2007, HP audited an additional 45 suppliers and follow up at 100 sites.
• Our suppliers must meet strict requirements regarding human rights, labor, health and safety, environment and ethics.
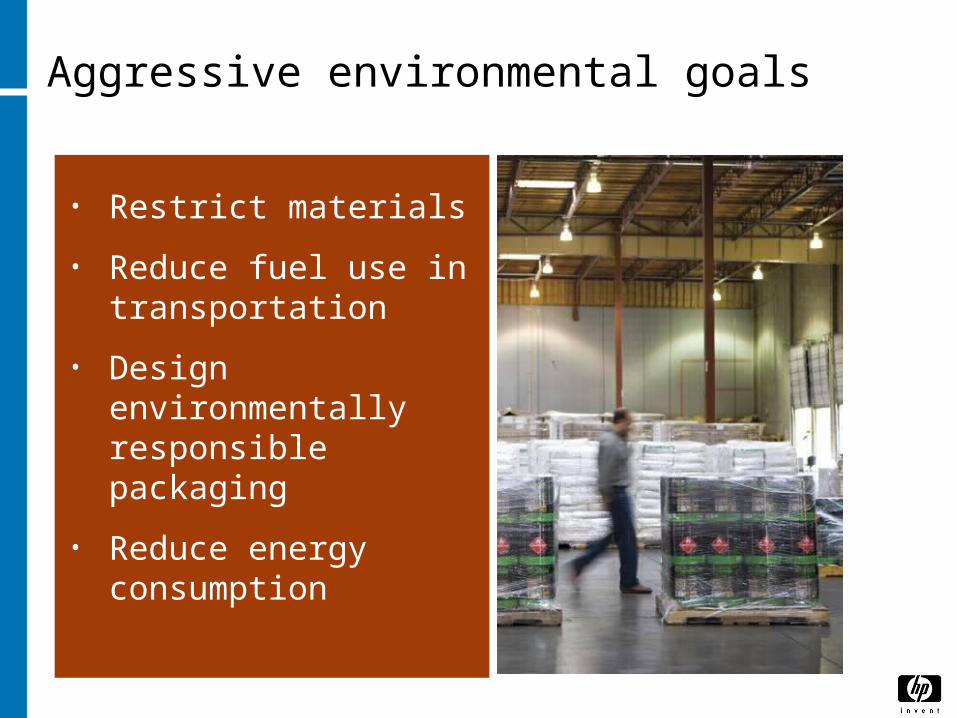
Aggressive environmental goals
• Restrict materials
• Reduce fuel use in transportation
• Design environmentally responsible packaging
• Reduce energy consumption

• Reduce overall energy with IT products, data center best practices
• Leverage conversations between IT and facility management
• Evaluate waste programs both internal to your organization and with the public
• Purchase renewable energy
• Implement Workplace Transformation -Change mentality about energy, environment, and the collateral benefits of Green IT
Next steps to a Green IT Transformation

ISS-1 – HP Restricted50
Brad [email protected] 927 9347
Brad [email protected] 927 9347
Questions Questions

Thank you

HP’s environmental leadership
No. 8 on the list of 100 Greenest Companies, 2007
—Newsweek
Top 10 Fortune Green Giants list, 2007
—Fortune
Top 10 Green Companies of 2006 list
—Portfolio 21

HP Environmental awards and recognitions
Achievement Awards, National
Performance Track and Green Power
Partners
Design for Recycling Award from Institute of Scrap Recycling
Industries
Recycling Council of British Columbia
Private Sector Recognition Award
Honorable Mention in Mexico’s SEMARNAT
Ecological Merit Award
PRMA Award for Environmental Performance at
HP Aguadilla facility
Corporate Leadership Award
from Recycling Council of Alberta
Recycling Council of Ontario Platinum
Waste Minimization Award
Demand Response Award in California Flex
Your Power Program
Association Agency Brazil de Segurança Award of Environment
Winner of Best Sustainability
Report Award for Global Citizenship
Report in 2005 and 2006
Washington State Recycling
Association Recycler of the
Year
Named to Top 10 Green Companies
List2006 and 2007 Environmental Printing Award
from PrintAction
Named to Fortune
magazine’s list of
10 Green Giants
Ranked 8th on list of the 100 Greenest
Companies
2007 AF&PA Business
Leadership Recycling Award from American Forest & Paper
Association
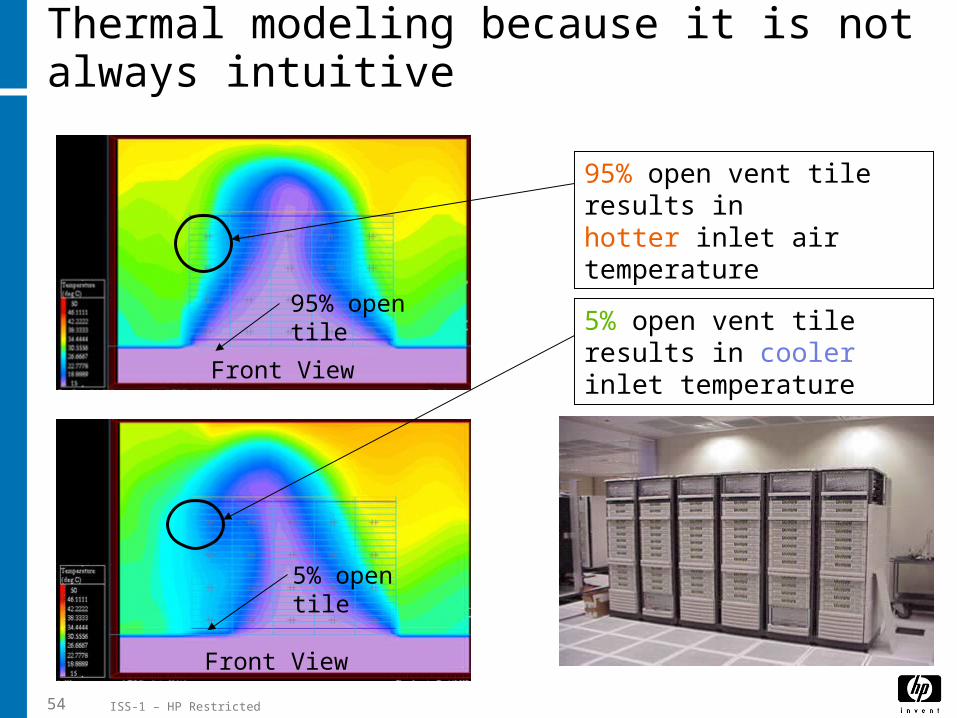
Thermal modeling because it is not always intuitive
ISS-1 – HP Restricted54
5% open tile
95% open tile
Front View
5% open vent tile results in cooler inlet temperature
95% open vent tile results inhotter inlet air temperature
Front View

HP Data Center Cooling Solutions
Dynamic Smart
Cooling
Data Center Design Consulting
Thermal Comprehensive with Thermal Zone Mapping
Thermal Quick
Thermal Intermediate
Best practices consultation
Customized analysis and consultation
Real-time rebalancing
Investment for quick
wins
Investment for bigger savings
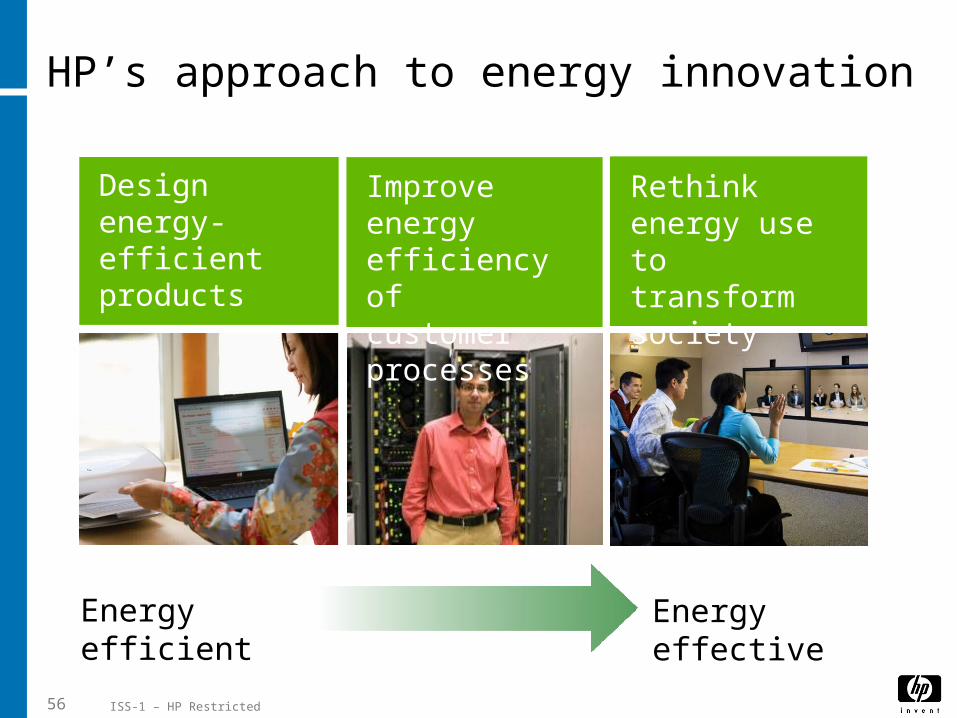
HP’s approach to energy innovation
ISS-1 – HP Restricted56
Design energy-efficient products
Improve energy efficiency of customer processes
Rethink energy use to transform society
Energy efficient
Energy effective

Smart Cooling Solutions
HP Thermal Quick
Assessment
HP Thermal Intermediate Assessment
•Data gathering
•Thermal modeling
•Extensive report and recommendations
HP Thermal Comprehensive
Assessment
HP delivers three Smart Cooling Solutions
•3D under- and above- floor modeling
•Thermal prediction
•Comprehensive report and recommendations
•Visual inspection
•Data measurements
•Basic report and recommendations

HP Thermal Quick Assessment
What it is
• Visual inspection, data analysis and written report of findings
• Based on interviews with staff and HP observations and measurements within the data center

HP Thermal Quick Assessment (cont.)
• Provides basic understanding of power and cooling capability to support high-density data center environments
• Recommendations and best practices to improve cooling efficiency
• Allows smaller scale investment for quick wins and longer-term improvements
What it does
Cold aisle Hot aisleRaised floor
Vented tile
Equipment rack
Non-vented tile
Fron
t
Fron
t
Fron
t

HP Intermediate and Comprehensive Thermal Assessments
What it is
•Visual inspection, extensive data gathering and analysis, recommendations for short and long-term improvements
•HP thermal modeling technique using a scientific approach to airflow and temperature predictions

CRACunit A
CRACunit B
CRAC unit C
CRAC unit D
.38.38
.10.10
.36.36
.13.13
.40.40
.36.36.11.11
.19.19
Supply heat index
Y
Z X
• Sophisticated modeling tools provide data on the unique thermal conditions in a data center
• Shows the impact of different rack configurations, infrastructure management practices, and recommended cooling efficiency measures
What it does
HP Intermediate and Comprehensive Thermal Assessments (cont.)

Assessment, planning and relocation
Data CenterPlanning
Data CenterRelocation
Data Center Assessment
•Comprehensive site-preparation audit to successfully integrate new equipment
• In-depth reporting of any deficiencies, including floor-plan drawings locating equipment, receptacles, airflow panels, cable cut-outs, etc.
•Available for single
or multiple systems, entire data centers, or multiple data center consolidation
•Project management and move coordination
•Analysis of infrastructure with detailed report
•Explanation of risks, deficiencies and recommendations

Standard Optional
• Shutdown controls• Fire protection• Engine generator• EMI• Environmental
monitoring
• Space• Power• Cooling• Raised floor
More on:Data Center Assessment Services
• Provide a thorough review and analysis of the facility’s infrastructure
• Based on industry standards and best practices
• If risks or deficiencies are found, HP provides prioritized recommendations on how to remedy
• Findings are documented in a detailed report
There are standard and optional components to this customizable service:
• Earthquake threat• Power quality• Maintenance• High-frequency
noise• Sound levels

More on: Data Center Planning Services
• Comprehensive site-preparation audit that helps successfully integrate new equipment into a facility
• An in-depth report identifies any deficiencies and provides floor-plan drawings locating equipment, receptacles, airflow panels, cable cut-outs
• Verification of installation and service space • Examination of the capacity and availability of
power distribution system• Analysis of cooling system capacity and airflow
distribution • Review of installation readiness prerequisites
Service deliverables include:

More on:Data Center Relocation Services
• Move heterogeneous systems, data centers or entire facilities • Consolidate data centers; open/close facilities
What is it?
• A comprehensive set of offerings customized to meet your unique requirements for moving technologies in your business with minimum business disruption
• HP servers, workstations, desktop systems, notebook PCs, thin clients, storage devices, networking and software products, as well as HP-supported hardware and software from other vendors
What products are supported?
Smart Cooling – how does it work?

Old thinking…
• The average data centered is designed for 75 – 100 watts per square foot or 800 – 1100 watts per square meter
• A few data centers are designed for 150 watts per square foot or 1615 watts per square meter
• If every rack were equal in a data center operating at 100 W/sq.ft., each rack’s load would be 3.5 kW/rack, maximum
• A full rack of 1U servers or Blades ranges from 9 kW to 22 kW per rack
• Simple math says a data center can’t support rack loads in excess of 3.5 kW/rack

New thinking…
• Data center design metric used to determine overall capacity NOT how much power can be delivered to a single rack
• Loads are never balanced in a data center, some locations are low and others are high…W/sq.ft. merely describes the average
• A 100 W/sq.ft. data center can support a 12 kW rack…just not several of them in a row
• The trick is effective delivery of cooling resources to the required rack location

Static Smart Cooling: Thermal Modeling
Region Size
50% load
100 % load
Modeling can show the impact of:
• High-density racks mixed with low density racks
• High-density racks on cooling resources
• Improvements to infrastructure management practices
• Air conditioner failure or shutdown for scheduled maintenance
• An HP-developed approach to effective thermal management and energy efficiency
• Uses sophisticated modeling tools and techniques to understand the unique thermal conditions in a data center.
• For example, modeling will show if there is any recirculation of the warm exhausted air from the servers back to the intake of the servers.
What is it?

HP Smart Cooling: before and after
AC (5X)
Before• Uniform 150 W/ft2 cooling
Window
50% population 8-10 kW racks
Source: Chandrakant Patel, HP
Hot Aisle
Hot Aisle
Hot Aisle
Hot
Ais
le
Cold Aisle
Cold Aisle
Cold Aisle
Cold
Ais
le
Cold
Ais
le
After • Repositioning inlet air vents• The only degree of freedom
Hot Aisle
Hot Aisle
Hot Aisle
Hot
Ais
le
Cold Aisle
Cold Aisle
Cold Aisle
Cold
Ais
le
Cold
Ais
le

Above floor thermal mapComprehensive Assessment Software Plot
Y-Plot at 78” from the raised floorC
old
Ais
le
Cold
Ais
le
Cold
Ais
le
Cold
Ais
le
Cold
Ais
le
•Max. inlet temperature occurs at R9C1: 84.1oF
R10C1R9C1

Thermal elevation views
Inlet air temperature at Row 9 / Row 10 inlets
Front View
R9C1=84.1oFR
9C
1
R9C
3
R10C1=82oF
R10
C1
R10
C3
R9C1=84.7oFSide View
R9C
1
R10
C1
CRAC

What it is
• Distributed sensor network attached to standard racks for direct measurement of the environment
• Dynamically controls cooling based on real-time monitoring of the sensors
Future service: Dynamic Smart Cooling
Announced Nov 29, 2006; available late 2007

• Thermal sensing at rack level, signals the software to rebalance cooling
• Manages energy consumption by controlling air conditioning units and supplying cooling dynamically
• Up to 50% savings in cooling costs, experimental data from HP Labs
What it does
Future service: Dynamic Smart Cooling
Rack intake air thermal sensors
Blower speed controller
System management controller
• Sensor network/data depository
• System status evaluation• Thermal system control
Sensor and control network
Variable capacity CRAC unit

Dynamic Smart Cooling Elements
Management Software• Calculation/commissioning sensor
placement • System status/monitoring • Auto-balancing cooling resources
Deployment Service • Site readiness and design –
assessment, mapping, sensor placement plan
• Installation – sensors, mgmt console, software, commissioning
Hardware• Rack Sensors • Management console• Variable Speed Fan Kit (not
provided by HP)
Warranty • Hardware• Software
Core elements:
Additional Services (purchased separately, select at least one)
• Maintenance contract (various coverage/ response time levels available)
• Ongoing performance optimization