issn: 0975-833x research article - gmferd.com · introduction according to gillespie et al., (2004)...
TRANSCRIPT
POPULATION FREQUENCY, DENSITY, ABUNDANCE AND DIVERSITY OF TREE SPECIES IN TENCOMMUNAL FORESTS OF NORTHERN CROSS RIVER STATE, NIGERIA
*Akwaji Patrick Ishoro and
Department of Botany, University of Calabar, Calabar, Cross River State, Nigeria
ARTICLE INFO ABSTRACT
Due to the high rate of deforestation and degradation activities carriedecosystem, this study assessed the tree species population frequency, density, abundance and diversity in ten communalforests (two each) of the five Local Government Areas (Ogoja, Yala, Bekwarra, Obudu and Obanliku) of NortheThe study was carried out from (November, 2015 out in a spoke design and tree species present on the plots were recorded. Survey resultstotal of 143 trees belonging to 45 families in the study area. The relative frequency and abundance of the tree species under study varied across the study sites. The highest percentage frequency of the tree species was 24% while the lowest wasspecies was 2 stem/ha while the lowest was 0.1666 stem/ha. Abundance results show that the species were mostly low in their distribution with abundance of (1.00SankwSankwala (8.18) had the highest species richness index while Omulako (4.63) had the lowest. Sankwala forest had the highest diversity index value of 2.12 while OmuThis study shows that majority of the trees were low in their distribution and are declining in the study area. Appropriate decisions and measures in sustainable forest management are strongly recommended so that the forests wouaround the forests.
Copyright©2017, Akwaji Patrick Ishoro and Edu Esther Ajapermits unrestricted use, distribution, and reproduction in any medium, provided the original work is properly cited.
INTRODUCTION According to Gillespie et al., (2004) the tropical rainforest has been identified as the most biologically diverse terrestrial ecosystem on earth while Whitmore (1998), described a typical tropical forest as a complex community whose structure is provided by trees of many sizes and that upon the structure of trees and within the microclimate of the canopy of the trees, grow a range of other kinds of plants such as climbers, epiphytes, strangling plants, parasites and saprophytes.Panayotou and Ashton (1992) and Ikojo et al.,that a tract of rainforest is often viewed as a crop of timber trees suitable for sale rather than an interdependent high diversity ecosystem of potential multiple values. Thus, the tropical rainforests are mostly exploited for their timber resources. Muul (1993) stated that the tropical rainforest ecosystem is a symbol of abundance and nourishment of livelihood of millions of people extending back beyond memory or record and that this is because many of the timber *Corresponding author: Akwaji Patrick Ishoro Department of Botany, University of Calabar, Calabar, Cross River State, Nigeria
ISSN: 0975-833X
Article History:
Received 29th July, 2017 Received in revised form 16th August, 2017 Accepted 09th September, 2017 Published online 31st October, 2017
Citation: Akwaji Patrick Ishoro and Edu Esther Ajaforests of northern Cross River State, Nigeria”, International Journal of Current Research
Key words:
Population frequency, Density, Abundance, Diversity, Forest, Northern Cross River State, Nigeria.
RESEARCH ARTICLE
POPULATION FREQUENCY, DENSITY, ABUNDANCE AND DIVERSITY OF TREE SPECIES IN TENCOMMUNAL FORESTS OF NORTHERN CROSS RIVER STATE, NIGERIA
Akwaji Patrick Ishoro and Edu Esther Aja
Department of Botany, University of Calabar, Calabar, Cross River State, Nigeria
ABSTRACT
Due to the high rate of deforestation and degradation activities carriedecosystem, this study assessed the tree species population frequency, density, abundance and diversity in ten communalforests (two each) of the five Local Government Areas (Ogoja, Yala, Bekwarra, Obudu and Obanliku) of Northern Cross River State, Nigeria using the modified Whittaker method. The study was carried out from (November, 2015 – May, 2016). In each site a 30 × 90 m plot was laid out in a spoke design and tree species present on the plots were recorded. Survey resultstotal of 143 trees belonging to 45 families in the study area. The relative frequency and abundance of the tree species under study varied across the study sites. The highest percentage frequency of the tree species was 24% while the lowest was 6%. The highest population density recorded for the tree species was 2 stem/ha while the lowest was 0.1666 stem/ha. Abundance results show that the species were mostly low in their distribution with abundance of (1.00≤AB≤2.99) except in Bechevie and Sankwala forest where there were occasional (3.00≤AB≤3.33). Results from the study area show that Sankwala (8.18) had the highest species richness index while Omulako (4.63) had the lowest. Sankwala forest had the highest diversity index value of 2.12 while OmuThis study shows that majority of the trees were low in their distribution and are declining in the study area. Appropriate decisions and measures in sustainable forest management are strongly recommended so that the forests would continue to provide goods and services for communities around the forests.
Akwaji Patrick Ishoro and Edu Esther Aja. This is an open access article distributed under the Creative Commons Attreproduction in any medium, provided the original work is properly cited.
(2004) the tropical rainforest has been identified as the most biologically diverse terrestrial ecosystem on earth while Whitmore (1998), described a typical tropical forest as a complex community whose structure is
t upon the structure of trees and within the microclimate of the canopy of the trees, grow a range of other kinds of plants such as climbers, epiphytes, strangling plants, parasites and saprophytes.
et al., (2005) reported that a tract of rainforest is often viewed as a crop of timber trees suitable for sale rather than an interdependent high diversity ecosystem of potential multiple values. Thus, the tropical rainforests are mostly exploited for their timber
Muul (1993) stated that the tropical rainforest ecosystem is a symbol of abundance and nourishment of livelihood of millions of people extending back beyond memory or record and that this is because many of the timber
Department of Botany, University of Calabar, Calabar, Cross River State,
trees in the tropical rainforests produces a variety of highly valuable non-timber products like edible and medicinal fruits, seeds, nuts and oils. Also, a consiproduce industrial materials like latex, tannin, gum exudates, dyes and resin. The timber trees producing economically valuable non-timber products have been christened ‘timber plus trees’. Furthermore, Ford Foundation (1998) statednon-timber forest products are a particularly important part of multiple use strategies because they increase the range of income generating options of forest dependent communities, while avoiding some of the ecological costs of timber cutting.Presently, the need to protect what is left of the tropical rainforest has become imperative considering the high rate of forest destruction, degradation and fragmentation threatening the survival of both plant and animal species in Nigeria. As efforts are geared towards preventing the wanton destruction of the tropical rainforest and ensuring the conservation of its rich biodiversity, it is essential to provide sufficient quantitative and qualitative ecological data on tree species that produce different products. Such data will provide the needed information for fashioning out realistic and effectual conservation strategies. The ecological data that is needed
International Journal of Current Research Vol. 9, Issue, 10, pp.59581-59596, October, 2017
Akwaji Patrick Ishoro and Edu Esther Aja. 2017. “Population frequency, density, abundance and diversity of tree species in tenInternational Journal of Current Research, 9, (10), 59581-59596.
Available online at http://www.journalcra.com z
POPULATION FREQUENCY, DENSITY, ABUNDANCE AND DIVERSITY OF TREE SPECIES IN TEN COMMUNAL FORESTS OF NORTHERN CROSS RIVER STATE, NIGERIA
Department of Botany, University of Calabar, Calabar, Cross River State, Nigeria
Due to the high rate of deforestation and degradation activities carried out by local people on forest ecosystem, this study assessed the tree species population frequency, density, abundance and diversity in ten communalforests (two each) of the five Local Government Areas (Ogoja, Yala, Bekwarra,
rn Cross River State, Nigeria using the modified Whittaker method. May, 2016). In each site a 30 × 90 m plot was laid
out in a spoke design and tree species present on the plots were recorded. Survey results revealed a total of 143 trees belonging to 45 families in the study area. The relative frequency and abundance of the tree species under study varied across the study sites. The highest percentage frequency of the tree
6%. The highest population density recorded for the tree species was 2 stem/ha while the lowest was 0.1666 stem/ha. Abundance results show that the species
≤AB≤2.99) except in Bechevie and ≤AB≤3.33). Results from the study area show that
Sankwala (8.18) had the highest species richness index while Omulako (4.63) had the lowest. Sankwala forest had the highest diversity index value of 2.12 while Omulako (1.21) had the lowest. This study shows that majority of the trees were low in their distribution and are declining in the study area. Appropriate decisions and measures in sustainable forest management are strongly
ld continue to provide goods and services for communities
is an open access article distributed under the Creative Commons Attribution License, which
trees in the tropical rainforests produces a variety of highly timber products like edible and medicinal fruits,
seeds, nuts and oils. Also, a considerable number of trees produce industrial materials like latex, tannin, gum exudates, dyes and resin. The timber trees producing economically
timber products have been christened ‘timber plus trees’. Furthermore, Ford Foundation (1998) stated that
timber forest products are a particularly important part of multiple use strategies because they increase the range of income generating options of forest dependent communities, while avoiding some of the ecological costs of timber cutting.
ntly, the need to protect what is left of the tropical rainforest has become imperative considering the high rate of forest destruction, degradation and fragmentation threatening the survival of both plant and animal species in Nigeria. As
ed towards preventing the wanton destruction of the tropical rainforest and ensuring the conservation of its rich biodiversity, it is essential to provide sufficient quantitative and qualitative ecological data on tree species that produce
ts. Such data will provide the needed information for fashioning out realistic and effectual conservation strategies. The ecological data that is needed
INTERNATIONAL JOURNAL OF CURRENT RESEARCH
Population frequency, density, abundance and diversity of tree species in ten communal
include species composition, abundance of each species, stem diameter distribution and abundance of regeneration of each species. This study therefore assessed the population frequency, density, abundance and diversity of tree species that produce valuable timber and non-timber products in ten communal forests (two each) in the five Local Government areas (Ogoja, Yala, Bekwarra, Obudu and Obanliku) in Northern Cross River State, Nigeria with the aim of providing the required ecological data for effective management of the forests.
MATERIALS AND METHODS
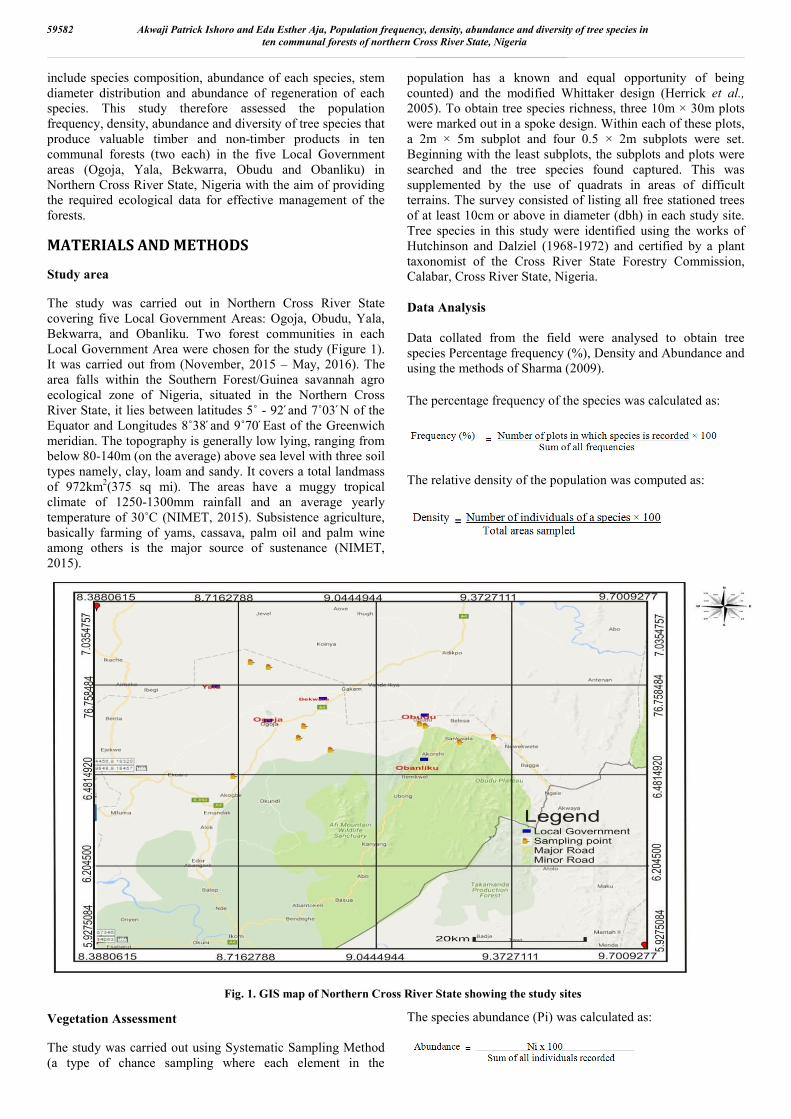
Study area The study was carried out in Northern Cross River State covering five Local Government Areas: Ogoja, Obudu, Yala, Bekwarra, and Obanliku. Two forest communities in each Local Government Area were chosen for the study (Figure 1). It was carried out from (November, 2015 – May, 2016). The area falls within the Southern Forest/Guinea savannah agro ecological zone of Nigeria, situated in the Northern Cross River State, it lies between latitudes 5˚ - 92 and 7˚03 N of the Equator and Longitudes 8˚38 and 9˚70 East of the Greenwich meridian. The topography is generally low lying, ranging from below 80-140m (on the average) above sea level with three soil types namely, clay, loam and sandy. It covers a total landmass of 972km2(375 sq mi). The areas have a muggy tropical climate of 1250-1300mm rainfall and an average yearly temperature of 30˚C (NIMET, 2015). Subsistence agriculture, basically farming of yams, cassava, palm oil and palm wine among others is the major source of sustenance (NIMET, 2015).
Vegetation Assessment The study was carried out using Systematic Sampling Method (a type of chance sampling where each element in the
population has a known and equal opportunity of being counted) and the modified Whittaker design (Herrick et al., 2005). To obtain tree species richness, three 10m × 30m plots were marked out in a spoke design. Within each of these plots, a 2m × 5m subplot and four 0.5 × 2m subplots were set. Beginning with the least subplots, the subplots and plots were searched and the tree species found captured. This was supplemented by the use of quadrats in areas of difficult terrains. The survey consisted of listing all free stationed trees of at least 10cm or above in diameter (dbh) in each study site. Tree species in this study were identified using the works of Hutchinson and Dalziel (1968-1972) and certified by a plant taxonomist of the Cross River State Forestry Commission, Calabar, Cross River State, Nigeria. Data Analysis Data collated from the field were analysed to obtain tree species Percentage frequency (%), Density and Abundance and using the methods of Sharma (2009).
The percentage frequency of the species was calculated as:
The relative density of the population was computed as:
The species abundance (Pi) was calculated as:
Fig. 1. GIS map of Northern Cross River State showing the study sites
59582 Akwaji Patrick Ishoro and Edu Esther Aja, Population frequency, density, abundance and diversity of tree species in ten communal forests of northern Cross River State, Nigeria

Where; Ni is the sum or proportion of each individual species in the sample. The different tree species recorded in this study were scored according to their Abundance (AB): abundant (AB ≥ 5.00); frequent (4.00 ≤ AB ≤ 4.99); occasional (3.00 ≤ AB ≤ 3.99); rare (1.00 ≤ AB ≤ 2.99) and threatened/endangered (0.00 ≤ AB ≤ 1.00) (Sharma, 2009). The measure of number of species occurring in a sample plot is known as species richness. The broader the sample, the more species we would expect to record, tree species richness in this study was recorded using the method of Stolhlgren et al. (1995), Bull et al. (1998) and Herrick et al. (2005) and calculated using Menhinick Index based on the proportion of the number of taxa to the ‘square root of sample size’ as given below: Dmn = s √N(Tuomisto, 2010) Where, Dmn in this case is the Menhinick Index S = number of species N = ‘square root of the number of individuals in the sample plot’ Data obtained from relative abundance were used to compute the Shannon – Weiner’s Diversity index (H) as ascribed by Jayaraman (1999) for forest areas. The Shannon – Weiner’s diversity indices is given by the equation: H = ∑piInpi (Petchay and Gaston, 2002) Where H = Shannon’s index, In = lnPi = Natural logarithm of the corresponding relative abundance (Pi) of the species, Pi = the proportion of individuals found in the ith species.
RESULTS Composition of tree species A total of 143 tree speciesbelonging to 45 families were recorded in the study area (Table 1). The majority of the species (28) were of the family Fabaceae, followed by Euphorbiaceae (12), Anonaceae (10), Moraceae (9 species), Meliaceae (7), Combretaceae, Sapotaceae and Sterculiaceae (6 species each), Anacardiaceae, Apocynaceae, Irvingiaceae and Myristicaceae (4 species each), Bombacaceae, Clusiaceae, Arecaceae and Ebenaceae (3 species each), Burseraceae, Lecythiadaceae, Olacaceae, Caesalpinaceae and Verbanaceae (2 species each), Bignoniaceae, Boriginacea, Ericaceae, Flacourtiaceae, Guttiferae, Juglandaceae, Liliaceae, Melastomataceae, Merantaceae, Meliaceae, Mimosaceae, Moringaceae, Ochnaceae, Palmae (Arecaceae), Papilionaceae, Proteaceae, Rabiaceae, Rhamnaceae, Rubiaceae, Sapindaceae and Ulmaceae had one (1) specie each.
Percentage frequency, density and abundance of tree species
A total of 32 trees were encountered in Gbogbu forest based on the sampled plots (Table 2), 31 in Omulako forest (Table 3), 56 in Aragban forest (Table 4), 57 in Abeya forest (Table 5), 62 in Aguomoh forest (Table 6), 58 in Ukpah forest (Table 7), 62 in Alege forest (Table 8), 61 in Beteh forest (Table 9), 83 in Bechevie forest (Table 10) and 93 species in Sankwala forest (Table 11).
Table 1. Tree species composition of the study area
S/N Family Species
1. Anacardiaceae Anacardium occidentale 2. Anacardiaceae Pseudopondias microcarpa 3. Anarcadiaceae Antrocaryon micrasta 4. Anarcadiaceae Lannea welwitschi 5. Annocaceae Dennittia tripetala 6. Annonaceae Xylopia africana 7. Annonaceae Xylopia spp. 8. Annonaceae Monodora myristica 9. Annonaceae Anonidium mannii 10. Annonaceae Cleistopholis patens 11. Annonaceae Polyceratocarpus parvifllorus 12. Annonaceae Polyalthia suaveolens 13. Annonaceae Uvariopsis dioica 14. Annonaceae Annona senegalensis 15. Apocynaceae Funtumia elastica 16. Apocynaceae Hunteria umbellata 17. Apocynaceae Rauwolfia vomitora 18. Apocynaceae Alstonia boonei 19. Araliaceae Cussonia barteri 20. Arecaceae Cocos nucifera 21. Arecaceae Hyphaena thebaica 22. Bignoniaceae Newbouldia leavis 23. Bombacaceae Ceiba pentandra 24. Bombacaceae Bombax costatum 25. Bombacaceae Bombax brevicuspe 26. Boraginaceae Cordia millenii 27. Buseraceae Canarium schweinfurthii 28. Buseraceae Dacryodes edulis 29. Caesalpinioideae Parinari kerstingii 30. Clusiaceae Symphonia globulifera 31. Clusiaceae Allanblackia floribunda 32. Clusiaceae Pentadesma butyraceae 33. Combietaceae Anogeissus leiocarpus 34. Combietaceae Terminalia macroptera 35. Combretaceae Terminalia superb 36. Combretaceae Terminalia ivorensis 37. Combretaceae Combretum spp. 38. Combretaceae Terminalia aviceniodes 39. Ebenaceae Diospyros spp. 40. Ebenaceae Diospyros dendo 41. Ebenaceae Diospyros mesipiliformes 42. Ericaceae Eriboma oblonga 43. Euphobiaceae Hymenocardia acida 44. Euphorbiaceae Klainedoxa gabonensis 45. Euphorbiaceae Uapaca acuminata 46. Euphorbiaceae Uapaca spp. 47. Euphorbiaceae Anthonotha macrophylla 48. Euphorbiaceae Alchornea cordifolia 49. Euphorbiaceae Hevea brasilliensis 50. Euphorbiaceae Maesobotyra bateri 51. Euphorbiaceae Ricinodendron heudoelotii 52. Euphorbiaceae Tetrorchidium didymostemon 53. Euphorbiaceae Amphimas pterocarpoides 54. Euphorbiaceae Alchornia laxiflora 55. Fabaceae Calpocalyx winkleri 56. Fabaceae Prosopis Africana 57. Fabaceae Gliricidia sepium 58. Fabaceae Berlinia grandiflora 59. Fabaceae Berlinia spp. 60. Fabaceae Cyliodiscus gabunensis 61. Fabaceae Guibourtia spp. 62. Fabaceae Erythrinia senegalensis 63. Fabaceae Isoberlina doka 64. Fabaceae Afzelia bipidensis 65. Fabaceae Afzelia africana 66. Fabaceae Afzelia spp. 67. Fabaceae Pterocarpus erinaceous 68. Fabaceae Parkia biglobosa 69. Fabaceae Pentaclethra macrophylla 70. Fabaceae Albizia ferruginea 71. Fabaceae Daniella ogea 72. Fabaceae Tetrapleura tetraptera 73. Fabaceae Albizia zygia 74. Fabaceae Albizia lebbeck 75. Fabaceae Albizia spp. 76. Fabaceae Angylocalyx zenkeri
59583 International Journal of Current Research, Vol. 9, Issue, 10, pp.59581-59596, October, 2017

77. Fabaceae Dialum guineense 78. Fabaceae Brachystegia nigerica 79. Fabaceae Piptandeniastrum africanum 80. Fabaceae Pterocarpus osun 81. Fabaceae Pterocarpus milbraedii 82. Fabaceae Afzelia africana 83. Flacourtiaceae Oncoba spinosa 84. Guttiferae Garcinia kola 85. Irvingiaceae Irvingia wombulu 86. Irvingiaceae Irvingia gabonensis 87. Irvingiaceae Irvingia grandiflora 88. Irvingiaceae Irvingia spp. 89. Juglandaceae Juglans nigra 90. Lecythidaceae Combretodendron spp. 91. Leccythiadaceae Combretodendron macrocarpum 92. Liliaceae Albuca nigritans 93. Melastomataceae Memocylon blakeoides 94. Meliaceae Khaya ivorensis 95. Meliaceae Guarea cedrata 96. Meliaceae Khaya grandifoliata 97. Meliaceae Khaya senegalensis 98. Meliaceae Trichilia lanata 99. Meliaceae Carapa procera 100. Meliaceae Cedrella spp. 101. Caesalpinaceae Detarium senegalense 102. Miliaceae Milicia excelsa 103. Mimosaceae Acacia gourmaensis 104. Moraceae Treculia obovoidea 105. Moraceae Treculia africana 106. Moraceae Ficus capensis 107. Moraceae Antians welwitschii 108. Moraceae Bosqueia angolensis 109. Moraceae Musanga cecropioides 110. Moraceae Myrianthus arboreus 111. Moraceae Ficus exasperata 112. Moraceae Ficus mucuso 113. Moringaceae Moringa olefeira 114. Myristicaceae Staudtia stipitata 115. Myristicaceae Coelocaryon preusii 116. Myristicaceae Pycanthus angolensis 117. Myristicaceae Pycanthus spp. 118. Ochnaceae Lophira alata 119. Olacaceae Strombosia postulata 120. Olacaceae Ximenia americana 121. Palmae (Arecacea) Elaeis guinensis 122. Papilionaceae Baphia nitida 123. Proteaceae Protea elliotii 124. Rabiaceae Hymenostegia afzelia 125. Rhamnaceae Maesopsis eminii 126. Rubiaceae Nauclea latifolia 127. Rutaceae Fagara macrophylla 128. Sapindaceae Blighia sapida 129. Sapotaceae Chrysophylum albidum 130. Sapotaceae Chrysophyllum spp. 131. Sapotaceae Gambeya albida 132. Sapotaceae Vitellaria paradoxa 133. Sapotaceae Baillenolla toxisperma 134. Sapotaceae Aningeria robusta 135. Sterculiaceae Cola nitida 136. Sterculiaceae Cola millenii 137. Steculiaceae Mansonia altissima 138. Sterculiaceae Sterculia oblonga 139. Sterculiaceae Triplochiton scleroxylon 140. Sterculiaceae Cola acuminata 141. Ulmaceae Celtis zenkeri 142. Verbanaceae Vitex doniana 143. Verbanaceae Vitex spp.
Results show that species proportion varied with sampled plots. Sankwala (93) had the highest proportion of species followed by Bechevie forest (83).Omulako (31) and Gbogbu (32) had the least proportion of tree species. Table 2 shows the population frequency, density and abundance of tree species in Gbogbu forest. Results show that Prosopis africana and Vitellaria paradoxa had the highest population frequency (24%) followed by Afzelia spp. and Ceiba pentandra with 18% each. Some other species, including Pentaclethra macrophylla and Parkia biglobosa had a population frequency of 12% each
while the lowest population frequency of 6% occurred in 19 species. Prosopis africana had the loftiest density of 1.3333 stem/ha of the total population, followed by Vitellaria paradoxa (1 stem/ha), Afzelia spp. and Ceiba pentandra (0.8333 stem/ha). Parkia biglobosa had a population density of 0.6666 stem/ha while Pentaclethra macrophylla and some species such as Uapaca spp and Vitex spp. had a population density of 0.5 stem/ha each while the lowest population density of 0.1666 stem/ha occurred in 13 species. Results of abundance ratio (AR) of each tree species showed that the species were rare (1.00–2.99) except in some few cases where the species were occasional (3.00 and 3.30) in the study area (Table 2 - 11). Results of tree species abundance (Appendix II) show that Acacia gourmaensis, Albizia spp., Anthonotha macrophylla, Coelocaryon preusii, Daniella ogea, Juglans nigra, Parkia biglobosa, Prosopis africana, Symphonia globulifera and Xylopia spp. had the highest abundance ratio of 2.00 followed by Pentaclethra macrophylla, Uapaca spp., Vitex spp. and Vitellaria paradoxa (1.50) while the least abundance ratio was 1.00 in most species. Results of population frequency, density and abundance of tree species in Omulako forest (Table 3) shows that Prosopis africana had the highest frequency (24%) followed by Parkia biglobosa and Acacia gourmaensis with 18% each. Pentaclethra macrophylla and some species had 12% while the lowest was 6% in some species. Prosopis africana had the loftiest density of 1.3333 stem/ha and was preceded by Acacia gourmaensis and Parkia biglobosa with 0.8333 stem/ha each. Juglans nigra had a population density of 0.5 stem/ha while the lowest population density of 0.1666 stem/ha occurred in 8 species. Acacia gourmaensis, Pentaclethra macrophylla and some species had the highest abundance ratio (2.00) while that of Parkia biglobosa was (1.66). The least abundance ratio was (1.00). Results of population frequency, density and abundance of tree species in Aragban forest (Table 4) shows that Juglans nigra and Prosopis africana had the highest frequency of (24%) each followed by Alstonia boonei, Ceiba pentandra, Chrysophyllum albidum, Parkia biglobosa and some species with 18% each while Pentaclethra macrophylla had 12%. The lowest frequency was 6% in some species such as Uapaca spp., Terminalia ivorensis, Maesopsis eminii and Guarea cedrata. Prosopis africana had the loftiest density of 1.3333 stem/ha and was preceded by Ceiba pentandra with 1.1666 stem/ha. Parkia biglobosa, Pentaclethra macrophylla, Xylopia aethiopica, Tetrapleura tetraptera, Pterocarpus milbraedii and Anthonotha macrophylla had population density of 0.8333 stem/ha each. Antrocaryon micrasta, Alstonia boonei, Anacardium occidentale and few other species had 0.5 stem/ha while the lowest population density of 0.1666 stem/ha occurred in 7 species. Anthonotha macrophylla, Pentaclethra macrophylla and Pterocarpus millbraedii had the highest abundance ratio (2.50) followed by Ceiba pentandra (2.40) while Parkia biglobosa had (1.66). Some species had (2.00) while the least abundance ratio was (1.00). Results of population frequency, density and abundance of tree species in Abeya forest (Table 5) shows that Ceiba pentandra, Pentaclethra macrophylla, Prosopis africana and Vitellaria paradoxa had the highest population frequency of (24%) each followed by Parkia biglobosa, Moringa olefeira and Tetrapleura tetraptera with 18% each. The least population frequency was 6% in most species.
59584 Akwaji Patrick Ishoro and Edu Esther Aja, Population frequency, density, abundance and diversity of tree species in ten communal forests of northern Cross River State, Nigeria

Table 2. Population frequency, density and abundance ratio (AR) of tree species identified in GbogbuForest, Gabu, Yala Local Government Area, Cross River State
S/N Species Total no. of
individuals Total no. of segments the species occurred
Total no. of segments
Frequency Density AR
1. Acacia gourmaensis 4 2 6 12 0.6666 2.00 2. Afzelia spp. 5 3 6 18 0.8333 1.66
3. Albizia ferruginea 2 1 6 6 0.3333 2.00 4. Alstonia boonei 1 1 6 6 0.1666 1.00 5. Anthonotha macrophylla 2 1 6 6 0.3333 2.00
6. Berlinia spp. 1 1 6 6 0.1666 1.00 7. Calpocalyx winkleri 1 1 6 6 0.1666 1.00 8. Carapa procera 1 1 6 6 0.1666 1.00
9. Ceiba pentandra 5 3 6 18 0.8333 1.66 10. Coelocaryon preusii 2 1 6 6 0.3333 2.00 11. Cola spp. 1 1 6 6 0.1666 1.00
12. Daniella ogea 2 1 6 6 0.3333 2.00 13. Diospyros spp. 1 1 6 6 0.1666 1.00 14. Eriboma oblonga 1 1 6 6 0.1666 1.00
15. Irvingia spp. 1 1 6 6 0.1666 1.00 16. Juglans nigra 2 1 6 6 0.3333 2.00 17. Khaya spp. 1 1 6 6 0.1666 1.00
18. Klainedoxa gabonensis 1 1 6 6 0.1666 1.00 19. Parinari kerstingii 1 1 6 6 0.1666 1.00 20. Parkia biglobosa 4 2 6 12 0.6666 2.00
21. Prosopis africana 8 4 6 24 1.3333 2.00 22. Pycanthus angolensis 1 1 6 6 0.1666 1.00 23. Staudtia spp. 1 1 6 6 0.1666 1.00
24. Staudtia stipitata 1 1 6 6 0.1666 1.00 25. Strombosia postulata 2 2 6 12 0.3333 1.00 26. Symphonia globulifera 4 2 6 12 0.6666 2.00
27. Treculia obovoidea 2 2 6 12 0.3333 1.00 28. Trichilia lanata 2 2 6 12 0.3333 1.00 29. Uapaca spp. 3 2 6 12 0.5 1.50
30. Vitellaria paradoxa 6 4 6 24 1 1.50 31. Vitex spp. 3 2 6 12 0.5 1.50 32. Xylopia spp. 4 2 6 12 0.6666 2.00
Table 3. Population frequency, density and abundance ratio (AR) of tree species identified in Omulako Forest, Aliforkpa, Yala Local
Government Area, Cross River State
S/N Species Total no. of
individuals Total no. of segments the species occurred
Total no. of segments
Frequency Density AR
1. Acacia gourmaensis 6 3 6 18 1 2.00 2. Afzelia spp. 4 2 6 12 0.6666 2.00 3. Alstonia boonei 2 1 6 6 0.3333 2.00 4. Annona senegalensis 2 2 6 12 0.3333 1.00 5. Anthonotha macrophylla 2 1 6 6 0.3333 2.00 6. Berlinia spp. 1 1 6 6 0.1666 1.00 7. Calpocalyx winkleri 1 1 6 6 0.3333 1.00 8. Carapa procera 3 2 6 12 0.5 1.50 9. Ceiba pentandra 4 2 6 12 0.6666 2.00 10. Coelocaryon preusii 1 1 6 6 0.1666 1.00 11. Cola acuminata 2 2 6 12 0.3333 1.00 12. Combretum spp. 2 1 6 6 0.3333 2.00 13. Diospyros spp. 1 1 6 6 0.1666 1.00 14. Eriboma oblonga 2 2 6 12 0.3333 1.00 15. Gambeya albida 4 2 6 12 0.6666 2.00 16. Irvingia spp. 1 1 6 6 0.1666 1.00 17. Juglans nigra 3 2 6 12 0.5 1.50 18. Khaya spp. 1 1 6 6 0.1666 1.00 19. Klainedoxa gabonensis 1 1 6 6 0.1666 1.00 20. Oncoba spinosa 1 1 6 6 0.1666 1.00 21. Parkia biglobosa 5 3 6 18 0.8333 1.66 22. Pentaclethra macrophylla 4 2 6 12 0.6666 2.00 23. Prosopis africana 8 4 6 24 1.3333 2.00 24. Pterocarpus osun 1 1 6 6 0.1666 1.00 25. Pycanthus angolensis 2 1 6 6 0.3333 2.00 26. Staudtia stipitata 2 1 6 6 0.3333 2.00 27. Terminalia macroptera 4 2 6 12 0.6666 2.00 28. Treculia obovoidea 1 1 6 6 0.1666 1.00 29. Uapaca spp. 2 2 6 12 0.3333 1.00 30. Vitex spp. 2 1 6 6 0.3333 2.00 31. Xylopia africana 4 2 6 12 0.6666 2.00
59585 International Journal of Current Research, Vol. 9, Issue, 10, pp.59581-59596, October, 2017

Prosopis africana and Vitellaria paradoxa had the highest density of 1.3333 stem/ha each and was preceded by Pentaclethra macrophylla and Ceiba pentandra with a population density of 1.1666 stem/ha each. Moringa olefeira, Parkia biglobosa, Tetrapleura tetraptera and Xylopia spp. had 1 stem/ha each while the lowest population density of 0.1666 stem/ha occurred in 10 species. Milicia excelsa had the highest abundance ratio (2.50) followed by Albizia zygia, Parkia biglobosa and some species with (2.00) while Pentaclethra macrophylla had abundance of (1.75). The least abundance ratio was (1.00). Results of population frequency, density and abundance of tree species in Aguomoh forest (Table 6) shows that Anthonotha macrophylla, Ceiba pentandra, Milicia excelsa, Prosopis africana and Xylopia aethiopica had the
highest population frequency of (24%) each preceded by Afzelia africana, Bombax costatum, Chrysophyllum spp., Ficus mucuso, Parkia biglobosa and Pentaclethra macrophylla with 18% each. The least population frequency was 6%. Prosopis africana and Anthonotha macrophylla had the loftiest density of 1.1666 stem/ha each followed by Afzelia africana, Ceiba pentandra, Chrysophyllum spp., Milicia excelsa, Parkia biglobosa, Vitellaria paradoxa and Xylopia aethiopica with 1 stem/ha each. Cedrella sp., Lophira alata, Mansonia altissima and Newbouldia laevis had a population density of 0.5 stem/ha each. Pentaclethra macrophylla and some species had the lowest population density of 0.1666 stem/ha. Parkia biglobosa and some species had the highest abundance ratio of (2.00) followed by Prosopis africana (1.75) while Pentaclethra macrophylla had (1.33). The least abundance ratio was (1.00).
Table. 4. Population frequency, density and abundance ratio (AR) of tree species identified in Aragban Forest, Mbube, Ogoja Local Government Area, Cross River State
S/N Species Total no. of
individuals Total no. of segments the species occurred
Total no. of segments
Frequency Density AR
1. Alchornea laxiflora 2 2 6 12 0.3333 1.00 3. Anacardium occidentale 3 2 6 12 0.5 1.50 4. Anogeissus leiocarpus 1 1 6 6 0.1666 1.00 5. Anthonotha macrophylla 5 2 6 12 0.8333 2.50 6. Antians welwitschii 2 2 6 12 0.3333 1.00 7. Antrocaryon micrasta 3 2 6 12 0.5 1.50 8. Baillenolla toxisperma 3 2 6 12 0.5 1.50 9. Blighia sapida 1 1 6 6 0.1666 1.00 10. Bombax costatum 4 2 6 12 0.6666 2.00 11. Cederella spp. 2 2 6 12 0.3333 1.00 12. Ceiba pentandra 7 3 6 18 1.1666 2.40 13. Chrysophyllum albidum 3 3 6 18 0.5 1.00 14. Cocos nucifera 4 3 6 18 0.6666 1.33 15. Cola nitida 3 3 6 18 0.5 1.00 16. Combretodendron macrocarpum 1 2 6 12 0.1666 0.50 17. Dacryodes edulis 4 3 6 18 0.6666 1.33 18. Dennittia tripetala 2 1 6 6 0.3333 2.00 19. Elaeis guinensis 4 2 6 12 0.6666 2.00 20. Erythrina senegalensis 4 3 6 18 0.6666 1.33 21. Fagara macrophylla 2 1 6 6 0.3333 2.00 22. Ficus capensis 2 2 6 12 0.3333 1.00 23. Ficus mucuso 2 1 6 6 0.3333 2.00 24. Gambeya albida 3 2 6 12 0.5 1.50 25. Garcinia kola 4 2 6 12 0.6666 2.00 26. Guarea cedrata 2 1 6 6 0.3333 2.00 27. Hunteria umbellata 2 1 6 6 0.3333 2.00 28. Irvingia grandifolia 3 2 6 12 0.5 1.50 29. Juglans nigra 6 4 6 24 1 1.50 30. Khaya grandifoliola 4 3 6 18 0.6666 1.33 31. Khaya senegalensis 2 2 6 12 0.3333 1.00 32. Klainedoxa gabonensis 2 1 6 6 0.3333 2.00 33. Maesopsis eminii 1 1 6 6 0.1666 1.00 34. Mansonia altissima 3 2 6 12 0.5 1.50 35. Memocylon blakeoides 2 1 6 6 0.3333 2.00 36. Milicia excelsa 3 2 6 12 0.5 1.50 37. Monodora myristisca 4 2 6 12 0.6666 2.00 38. Moringa olefeira 4 3 6 18 0.6666 1.33 39. Myrianthus arboreus 2 2 6 12 0.3333 1.00 40. Parkia biglobosa 5 3 6 18 0.8333 1.66 41. Pentaclethra macrophylla 5 2 6 12 0.8333 2.50 42. Pentadesma butyracea 3 2 6 12 0.5 1.50 43. Prosopis africana 8 4 6 24 1.3333 2.00 44. Pterocarpus millbraedii 5 2 6 12 0.8333 2.50 45. Pterocarpus spp. 4 2 6 12 0.6666 2.00 46. Pycanthus angolensis 6 3 6 18 1 2.00 47. Staudtia stipitata 3 3 6 18 0.5 1.00 48. Sterculia oblonga 4 2 6 12 0.3333 2.00 49. Terminalia ivorensis 1 1 6 6 0.1666 1.00 50. Terminalia superb 4 2 6 12 0.6666 2.00 51. Tetrapleura tetraptera 5 3 6 18 0.8333 1.66 52. Treculia africana 6 3 6 18 1 2.00 53. Uapaca spp. 1 1 6 6 0.1666 1.00 54. Vitellaria paradoxa 6 3 6 18 1 2.00 55. Vitex spp. 4 3 6 18 0.6666 1.33 56. Xylopia aethiopica 5 3 6 18 0.8333 1.66
59586 Akwaji Patrick Ishoro and Edu Esther Aja, Population frequency, density, abundance and diversity of tree species in ten communal forests of northern Cross River State, Nigeria

Table. 5. Population frequency, density and abundance ratio (AR) of tree species identified in Abeya Forest, Winniba-Ekajuk, Ogoja Local Government Area, Cross River State
S/N Species Total no. of
individuals Total no. of segments the species occurred
Total no. of segments
Frequency Density AR
1. Albizia zygia 2 1 6 12 0.3333 2.00 2. Anacardium occidentale 3 2 6 12 0.5 1.50 3. Anthonotha macrophylla 2 1 6 6 0.3333 1.50 4. Antrocaryon micrasta 1 1 6 6 0.1666 1.00 5. Berlinia spp. 3 2 6 12 0.5 1.50 6. Bombax brevicuspe 2 1 6 6 0.3333 2.00 7. Bombax costatum 3 2 6 12 0.5 1.50 8. Brachystegia nigerica 1 1 6 6 0.1666 1.00 9. Calpocalyx winkleri 3 2 6 12 0.5 1.50 10. Carapa procera 2 1 6 6 0.3333 2.00 11. Ceiba pentandra 7 4 6 24 1.1666 1.75 12. Chrysophylum spp. 4 2 6 12 0.6666 2.00 13. Cleistopholis patens 3 2 6 12 0.5 1.50 14. Cocos nucifera 2 1 6 6 0.3333 2.00 15. Coelocaryon preusii 1 1 6 6 0.1666 1.00 16. Cola nitida 2 2 6 12 0.3333 1.00 17. Cordia millenii 1 1 6 6 0.1666 1.00 18. Cyliocodiscus gabonensis 2 2 6 12 0.3333 1.00 19. Daniella ogea 4 2 6 12 0.6666 2.00 20. Diospyros mesipiliformes 2 1 6 6 0.3333 2.00 21. Diospyros spp. 3 2 6 12 0.5 1.50 22. Elaeis guinensis 4 2 6 12 0.6666 2.00 23. Ficus capensis 2 1 6 6 0.3333 2.00 24. Ficus mucuso 3 2 6 12 0.5 1.50 25. Funtumia elastica 2 1 6 6 0.3333 2.00 26. Garcinia kola 3 2 6 12 0.5 1.50 27. Gliricidia sepium 1 1 6 6 0.1666 1.00 28. Guibourtia spp. 1 1 6 6 0.1666 2.00 29. Hunteria umbellata 2 2 6 12 0.3333 1.00 30. Irvingia gabonensis 2 1 6 6 0.3333 2.00 31. Irvingia grandifolia 3 2 6 12 0.5 1.50 32. Juglans nigra 4 2 6 12 0.6666 2.00 33. Khaya grandifolia 2 1 6 6 0.3333 2.00 34. Khaya ivorensis 4 2 6 12 0.6666 2.00 35. Klainedoxa gabonensis 1 1 6 6 0.1666 1.00 36. Lannea welwitschi 1 1 6 6 0.1666 1.00 37. Lophira alata 1 1 6 6 0.1666 1.00 38. Maesobotyra bateri 4 2 6 12 0.6666 2.00 39. Mansonia altissima 4 2 6 12 0.6666 2.00 40. Milicia excelsa 5 2 6 12 0.8333 2.50 41. Moringa oleifeira 6 3 6 18 1 2.00 42. Parkia biglobosa 6 3 6 18 1 2.00 43. Pentaclethra macrophylla 7 4 6 24 1.1666 1.75 44. Polyalthia suaveolens 2 1 6 6 0.3333 2.00 45. Polyceratocarpus parvifllorus 2 1 6 6 0.3333 2.00 46. Prosopis africana 8 4 6 24 1.3333 2.00 47. Pycanthus angloensis 2 1 6 6 0.3333 2.00 48. Ricinodendron heudoelotii 2 1 6 6 0.3333 2.00 49. Strombosia postulata 2 1 6 6 0.3333 2.00 50. Symphonia globulifera 3 2 6 12 0.5 1.50 51. Tetrapleura tetraptera 6 3 6 18 1 2.00 52. Detarium senegalense 2 1 6 6 0.3333 2.00 53. Treculia africana 4 2 6 12 0.6666 2.00 54. Uvariopsis dioica 3 2 6 12 0.5 1.50 55. Vitellaria paradoxa 8 4 6 24 1.3333 2.00 56. Vitex doniana 2 1 6 6 0.3333 2.00 57. Xylopia spp. 6 3 6 18 1 2.00
Table 6. Population frequency, density and abundance ratio (AR) of tree species identified in Aguomoh forest,
Afrike, Bekwarra Local Government Area, Cross River State
S/N Species Total no. of individuals
Total no. of segments the species occurred
Total no. of segments
Frequency Density AR
1. Afzelia africana 6 3 6 18 1 2.00 2. Afzelia spp. 1 1 6 6 0.1666 1.00 3. Albizia zygia 4 2 6 12 0.6666 2.00 4. Alchornea cordifolia 2 2 6 12 0.3333 1.00 5. Alstonia boonei 2 1 6 6 0.3333 2.00 6. Anogeissus leiocarpus 2 2 6 12 0.3333 1.00 7. Anthonotha macrophylla 7 4 6 24 1.1666 1.75 8. Antrocaryon micrasta 1 1 6 6 0.1666 1.00 9. Baillenolla toxisperma 1 1 6 6 0.1666 1.00 10. Berlinia grandiflora 1 1 6 6 0.1666 1.00
…………………….Continue
59587 International Journal of Current Research, Vol. 9, Issue, 10, pp.59581-59596, October, 2017

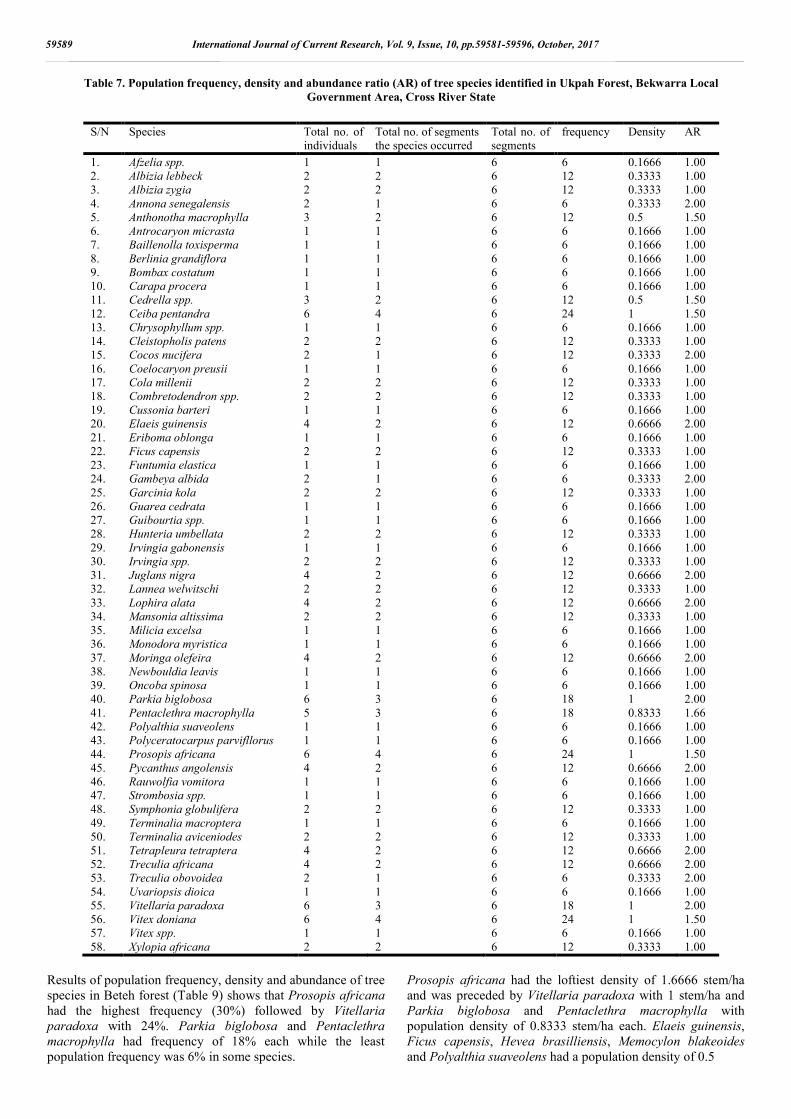
Results of population frequency, density and abundance of tree species in Ukpah forest (Table 7) shows that Ceiba pentandra, Prosopis africana and Vitex spp. had the highest frequency of (24%) each followed by Parkia biglobosa, Pentaclethra macrophylla and Vitellaria paradoxa with 18% each. The least population frequency was observed in species such as Vitex spp., Uvariopsis dioica and Treculia obovoideae which had a population frequency of 6% each. Ceiba pentandra, Parkia biglobosa, Prosopis africana, Vitellaria paradoxa and Vitex doniana had the highest density of 1 stem/ha and was preceded by Pentaclethra macrophylla with 0.8333 stem/ha. Anthonotha macrophylla and Cedrella spp. had a population density of 0.5 stem/ha while the lowest population density of 0.1666 stem/ha occurred in 20 species. Parkia biglobosa, Anona senegalensis, Cocos nucifera, Elaeis guinensis and some species had the highest abundance ratio of (2.00) followed by Pentaclethra macrophylla (1.66). Anthonotha macrophylla, Cedrella spp. and Ceiba pentandra had abundance ratio of (1.50) while the least was (1.00).
Results of population frequency, density and abundance of tree species in Alege forest (Table 8) shows that Prosopis africana had the highest frequency(24%) followed by Albizia lebbeck, Albizia zygia, Angylocalyx zenkeri, Ceiba pentandra, Garcinia kola, Parkia biglobosa and Pentaclethra macrophylla with 18% each. The lowest frequency was 6%. Pentaclethra macrophylla and Prosopis africana had the loftiestdensity of 1 stem/ha and was preceded by Tetrapleura tetraptera with 0.8333 stem/ha and Parkia biglobosa with a population density of 0.6666 stem/ha. Albuca nigritans, Alstonia boonei, Anacardium occidentale, Berlinia grandiflora, Pterocarpus osun and Pycanthus angolensis had a population density of 0.5 stem/ha each while the lowest population density of 0.1666 stem/ha occurred in 18 species. Baphia nitida, Brachystegia nigerica, Carapa procera, Pentaclethra macrophylla and some species had the highest abundance ratio of (2.00) followed by Albizia zygia (1.60) and Parkia biglobosa with (1.30) while the least abundance ratio was (1.00).
11. Bombax costatum 4 3 6 18 0.6666 1.33 12. Carapa procera 2 2 6 12 0.3333 1.00 13. Cedrella spp. 3 2 6 12 0.5 1.50 14. Ceiba pentandra 6 4 6 24 1 1.50 15. Chrysophyllum spp. 6 3 6 18 1 2.00 16. Chrysophylum albidum 4 2 6 12 0.6666 2.00 17. Cleistopholis patens 2 2 6 12 0.3333 1.00 18. Cocos nucifera 2 1 6 6 0.3333 2.00 19. Coelocaryon preusii 1 1 6 6 0.1666 1.00 20. Cola millenii 1 1 6 6 0.1666 1.00 21. Cola nitida 1 1 6 6 0.1666 1.00 22. Dennittia tripetala 1 1 6 6 0.1666 1.00 23. Elaeis guinensis 4 2 6 12 0.6666 2.00 24. Eriboma oblonga 1 1 6 6 0.1666 1.00 25. Ficus capensis 2 2 6 12 0.3333 1.00 26. Ficus exasperata 4 3 6 18 0.6666 1.33 27. Funtumia elastica 2 1 6 6 0. 3333 2.00 28. Gambeya albida 1 1 6 6 0.1666 1.00 29. Garcinia kola 2 1 6 6 0.3333 2.00 30. Gliricidia sepium 1 1 6 6 0.1666 1.00 31. Hunteria umbellata 1 1 6 6 0.1666 1.00 32. Irvingia gabonensis 4 2 6 12 0.6666 2.00 33. Irvingia spp. 2 1 6 6 0.3333 2.00 34. Juglans nigra 2 1 6 6 0.3333 2.00 35. Lannea welwitschi 1 1 6 6 0.1666 1.00 36. Lophira alata 3 2 6 12 0.5 1.50 37. Mansonia altissima 3 2 6 12 0.5 1.50 38. Milicia excelsa 6 4 6 24 1 1.50 40. Moringa olefeira 4 2 6 12 0.6666 2.00 41. Newbouldia laevis 3 2 6 12 0.5 1.50 42. Parkia biglobosa 6 3 6 18 1 2.00 43. Pentaclethra macrophylla 4 3 6 18 0.6666 1.33 44. Polyalthia suaveolens 1 1 6 6 0.1666 1.00 45. Polyceratocarpus parvifllorus 1 1 6 6 0.1666 1.00 46. Prosopis africana 7 4 6 24 1.1666 1.75 47. Pterocarpus erinaceous 1 1 6 6 0.1666 1.00 48. Pycanthus spp. 3 2 6 12 0.5 1.50 49. Rauwolfia vomitora 1 1 6 6 0.1666 1.00 50. Strombosia postulata 1 1 6 6 0.1666 1.00 51. Symphonia globulifera 2 1 6 6 0.3333 2.00 52. Terminalia macroptera 4 2 6 12 0.6666 2.00 53. Terminalia superb 1 1 6 6 0.1666 1.00 54. Tetrapleura tetraptera 2 2 6 12 0.3333 1.00 55. Thaumatococus daniella 1 1 6 6 0.1666 1.00 56. Treculia africana 1 1 6 16 0.1666 1.00 57. Treculia obovoidea 1 1 6 6 0.1666 1.00 58. Uapaca spp. 2 1 6 6 0.3333 2.00 59. Uvariopsis dioica 1 1 6 6 0.1666 1.00 60. Vitellaria paradoxa 6 3 6 18 1 2.00 61. Xylopia aethiopica 6 4 6 24 1 1.50 62. Xylopia africana 1 1 6 6 0.1666 1.00
59588 Akwaji Patrick Ishoro and Edu Esther Aja, Population frequency, density, abundance and diversity of tree species in ten communal forests of northern Cross River State, Nigeria
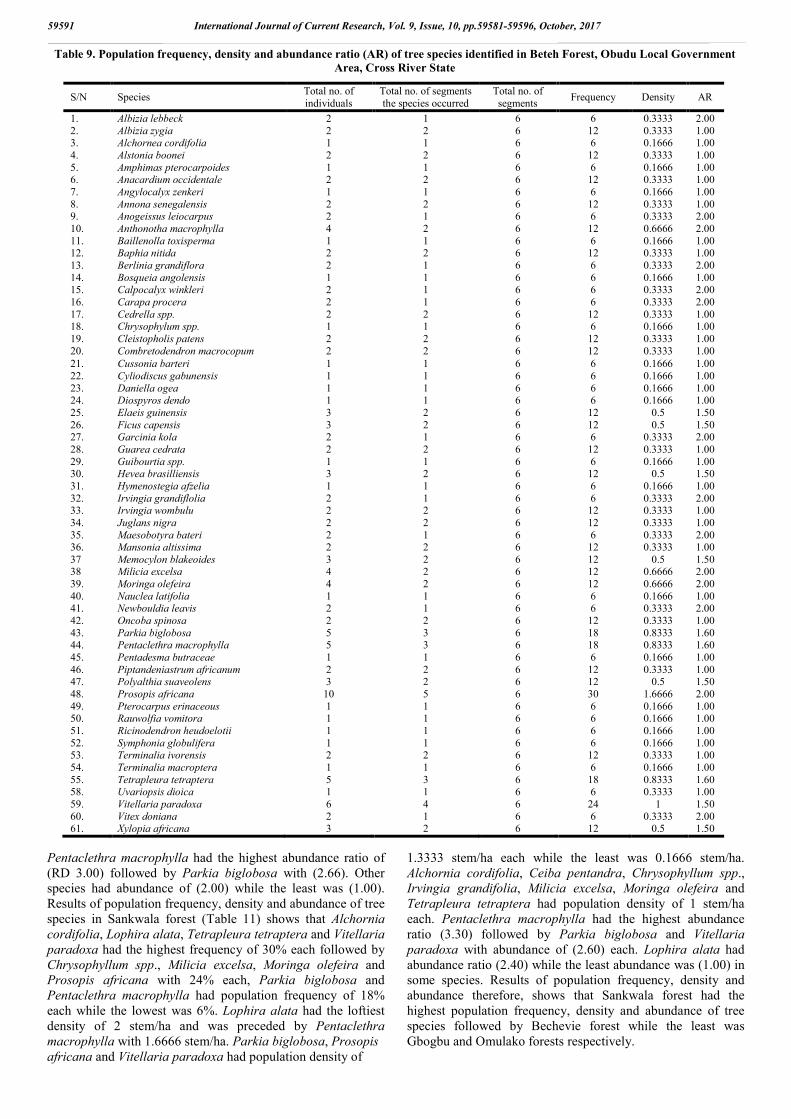
Results of population frequency, density and abundance of tree species in Beteh forest (Table 9) shows that Prosopis africana had the highest frequency (30%) followed by Vitellaria paradoxa with 24%. Parkia biglobosa and Pentaclethra macrophylla had frequency of 18% each while the least population frequency was 6% in some species.
Prosopis africana had the loftiest density of 1.6666 stem/ha and was preceded by Vitellaria paradoxa with 1 stem/ha and Parkia biglobosa and Pentaclethra macrophylla with population density of 0.8333 stem/ha each. Elaeis guinensis, Ficus capensis, Hevea brasilliensis, Memocylon blakeoides and Polyalthia suaveolens had a population density of 0.5
Table 7. Population frequency, density and abundance ratio (AR) of tree species identified in Ukpah Forest, Bekwarra Local Government Area, Cross River State
S/N Species Total no. of
individuals Total no. of segments the species occurred
Total no. of segments
frequency Density AR
1. Afzelia spp. 1 1 6 6 0.1666 1.00 2. Albizia lebbeck 2 2 6 12 0.3333 1.00 3. Albizia zygia 2 2 6 12 0.3333 1.00 4. Annona senegalensis 2 1 6 6 0.3333 2.00 5. Anthonotha macrophylla 3 2 6 12 0.5 1.50 6. Antrocaryon micrasta 1 1 6 6 0.1666 1.00 7. Baillenolla toxisperma 1 1 6 6 0.1666 1.00 8. Berlinia grandiflora 1 1 6 6 0.1666 1.00 9. Bombax costatum 1 1 6 6 0.1666 1.00 10. Carapa procera 1 1 6 6 0.1666 1.00 11. Cedrella spp. 3 2 6 12 0.5 1.50 12. Ceiba pentandra 6 4 6 24 1 1.50 13. Chrysophyllum spp. 1 1 6 6 0.1666 1.00 14. Cleistopholis patens 2 2 6 12 0.3333 1.00 15. Cocos nucifera 2 1 6 12 0.3333 2.00 16. Coelocaryon preusii 1 1 6 6 0.1666 1.00 17. Cola millenii 2 2 6 12 0.3333 1.00 18. Combretodendron spp. 2 2 6 12 0.3333 1.00 19. Cussonia barteri 1 1 6 6 0.1666 1.00 20. Elaeis guinensis 4 2 6 12 0.6666 2.00 21. Eriboma oblonga 1 1 6 6 0.1666 1.00 22. Ficus capensis 2 2 6 12 0.3333 1.00 23. Funtumia elastica 1 1 6 6 0.1666 1.00 24. Gambeya albida 2 1 6 6 0.3333 2.00 25. Garcinia kola 2 2 6 12 0.3333 1.00 26. Guarea cedrata 1 1 6 6 0.1666 1.00 27. Guibourtia spp. 1 1 6 6 0.1666 1.00 28. Hunteria umbellata 2 2 6 12 0.3333 1.00 29. Irvingia gabonensis 1 1 6 6 0.1666 1.00 30. Irvingia spp. 2 2 6 12 0.3333 1.00 31. Juglans nigra 4 2 6 12 0.6666 2.00 32. Lannea welwitschi 2 2 6 12 0.3333 1.00 33. Lophira alata 4 2 6 12 0.6666 2.00 34. Mansonia altissima 2 2 6 12 0.3333 1.00 35. Milicia excelsa 1 1 6 6 0.1666 1.00 36. Monodora myristica 1 1 6 6 0.1666 1.00 37. Moringa olefeira 4 2 6 12 0.6666 2.00 38. Newbouldia leavis 1 1 6 6 0.1666 1.00 39. Oncoba spinosa 1 1 6 6 0.1666 1.00 40. Parkia biglobosa 6 3 6 18 1 2.00 41. Pentaclethra macrophylla 5 3 6 18 0.8333 1.66 42. Polyalthia suaveolens 1 1 6 6 0.1666 1.00 43. Polyceratocarpus parvifllorus 1 1 6 6 0.1666 1.00 44. Prosopis africana 6 4 6 24 1 1.50 45. Pycanthus angolensis 4 2 6 12 0.6666 2.00 46. Rauwolfia vomitora 1 1 6 6 0.1666 1.00 47. Strombosia spp. 1 1 6 6 0.1666 1.00 48. Symphonia globulifera 2 2 6 12 0.3333 1.00 49. Terminalia macroptera 1 1 6 6 0.1666 1.00 50. Terminalia aviceniodes 2 2 6 12 0.3333 1.00 51. Tetrapleura tetraptera 4 2 6 12 0.6666 2.00 52. Treculia africana 4 2 6 12 0.6666 2.00 53. Treculia obovoidea 2 1 6 6 0.3333 2.00 54. Uvariopsis dioica 1 1 6 6 0.1666 1.00 55. Vitellaria paradoxa 6 3 6 18 1 2.00 56. Vitex doniana 6 4 6 24 1 1.50 57. Vitex spp. 1 1 6 6 0.1666 1.00 58. Xylopia africana 2 2 6 12 0.3333 1.00
59589 International Journal of Current Research, Vol. 9, Issue, 10, pp.59581-59596, October, 2017

stem/ha each while the lowest population density of 0.1666 stem/ha occurred in 18 species. Albizia lebbeck, Anogeissus leiocarpus, Anthonotha macrophylla and some species had the highest abundance ratio (2.00) followed by Parkia biglobosa and Pentaclethra macrophylla with (1.60) each while the least was (1.00). Results of population frequency, density and abundance of tree species in Bechevie forest (Table 10) shows that Prosopis africana had the highest frequency (30%) followed by Pentaclethra macrophylla and Vitellaria paradoxa with 24% each.
Parkia biglobosa had a population frequency of 18% while the least was 6%. Pentaclethra macrophylla had the highest density of 2 stem/ha and was preceded by Prosopis africana with 1.6666 stem/ha and Parkia biglobosa with 1.3333 stem/ha. Irvingia gradifolia, Tetrapleura tetraptera and Vitellaria paradoxa had population density of 1 stem/ha each. Carapa procera, Cola nitida, Diospyros mesipiliformes, Gambeya albida, Garcinia kola and some species had a population density of 0.5 stem/ha while the lowest population density of 0.1666 stem/ha occurred in 24 species.
Table 8. Population frequency, density and abundance ratio (AR) of tree species identified in Alege Forest, Obudu Local Government Area, Cross River State
S/N Species Total no. of individual
Total no. of segments the species occurred
Total no. of segments
Frequency Density AR
1. Acacia gourmaensis 2 2 6 12 0.3333 1.00 2. Albizia lebbeck 4 3 6 18 0.6666 1.30 3. Albizia zygia 5 3 6 18 0.8333 1.60 4. Albuca nigritans 3 2 6 12 0.5 1.50 5. Alstonia boonei 3 2 6 12 0.5 1.50 6. Amphimas pterocarpoides 2 2 6 12 0.3333 1.00 7. Anacardium occidentale 3 2 6 12 0.5 1.50 8. Angylocalyx zenkeri 4 3 6 18 0.6666 1.33 9. Anthonotha macrophylla 1 1 6 6 0.1666 1.00 10. Baillenolla toxisperma 1 1 6 6 0.1666 1.00 11. Baphia nitida 4 2 6 12 0.6666 2.00 12. Berlinia grandiflora 3 2 6 12 0.5 1.50 13. Brachystegia nigerica 2 1 6 6 0.3333 2.00 14. Calpocalyx winkleri 1 1 6 6 0.1666 1.00 15. Carapa procera 2 1 6 6 0.3333 2.00 16. Cedrella spp. 2 1 6 6 0.3333 2.00 17. Ceiba pentandra 4 3 6 18 0.6666 1.30 18. Chrysophylum albidum 2 1 6 6 0.3333 2.00 19. Cleistopholis patens 1 1 6 6 0.1666 1.00 20. Cola nitida 1 1 6 6 0.1666 1.00 21. Cyliodiscus gabonensis 1 1 6 6 0.1666 1.00 22. Daniella ogea 1 1 6 6 0.1666 1.00 23. Dennittia tripetala 2 2 6 12 0.3333 1.00 24. Diospyros dendo 1 1 6 6 0.1666 1.00 25. Diospyros mesipiliformes 1 1 6 6 0.1666 1.00 26. Elaeis guinensis 2 2 6 12 0.3333 1.00 27. Ficus exasperata 2 1 6 6 0.3333 2.00 28. Funtumia elastica 2 2 6 12 0.3333 1.00 29. Garcinia kola 4 3 6 18 0.6666 1.30 30. Guarea cedrata 1 1 6 6 0.1666 1.00 31. Guibourtia spp. 1 1 6 6 0.1666 1.00 32. Hevea brasilliensis 1 1 6 6 0.1666 1.00 33. Hymenostegia afzelia 2 2 6 12 0.3333 1.00 34. Irvingia grandifolia 2 2 6 12 0.3333 1.00 35. Juglans nigra 2 1 6 6 0.3333 2.00 36. Khaya ivorensis 2 1 6 6 0.3333 2.00 37. Maesobotyra bateri 2 1 6 6 0.3333 2.00 38. Mansonia altissima 2 1 6 6 0.3333 2.00 39. Memocylon blakeoides 1 1 6 6 0.1666 1.00 40. Milicia excelsa 4 2 6 12 0.6666 2.00 41. Newbouldia leavis 2 1 6 6 0.3333 2.00 42. Parinari kerstingii 2 2 6 12 0.3333 1.00 43. Parkia biglobosa 4 3 6 18 0.6666 1.30 44. Pentaclethra macrophylla 6 3 6 18 1 2.00 45. Pentadesma butyraceae 1 1 6 6 0.1666 1.00 46. Piptadeniastrum africanum 2 1 6 6 0.6666 2.00 47. Polyalthia suaveolens 2 1 6 6 0.3333 2.00 48. Prosopis africana 6 4 6 24 1 1.50 49. Pterocarpus osun 3 2 6 12 0.5 1.50 50. Pycanthus spp. 3 2 6 12 0.5 1.50 51. Rauwolfia vomitora 2 2 6 12 0.3333 1.00 52. Ricinodendron heudoelotii 1 1 6 6 0.1666 1.00 53. Staudtia stipitata 2 2 6 12 0.3333 1.00 54. Symphonia globulifera 1 1 6 6 0.1666 1.00 55. Terminalia ivorensis 2 2 6 12 0.3333 1.00 56. Tetrapleura tetraptera 5 3 6 18 0.8333 1.60 57. Tetrorchidium didymostemon 4 2 6 12 0.6666 2.00 58. Uapaca acuminata 1 1 6 6 0.1666 1.00 59. Uvariopsis dioica 1 1 6 6 0.1666 1.00 60. Vitellaria paradoxa 4 2 6 12 0.6666 2.00 61. Vitex doniana 3 2 6 12 0.5 1.50 62. Xylopia aethiopica 4 2 6 12 0.6666 2.00
59590 Akwaji Patrick Ishoro and Edu Esther Aja, Population frequency, density, abundance and diversity of tree species in ten communal forests of northern Cross River State, Nigeria
Pentaclethra macrophylla had the highest abundance ratio of (RD 3.00) followed by Parkia biglobosa with (2.66). Other species had abundance of (2.00) while the least was (1.00). Results of population frequency, density and abundance of tree species in Sankwala forest (Table 11) shows that Alchornia cordifolia, Lophira alata, Tetrapleura tetraptera and Vitellaria paradoxa had the highest frequency of 30% each followed by Chrysophyllum spp., Milicia excelsa, Moringa olefeira and Prosopis africana with 24% each, Parkia biglobosa and Pentaclethra macrophylla had population frequency of 18% each while the lowest was 6%. Lophira alata had the loftiest density of 2 stem/ha and was preceded by Pentaclethra macrophylla with 1.6666 stem/ha. Parkia biglobosa, Prosopis africana and Vitellaria paradoxa had population density of
1.3333 stem/ha each while the least was 0.1666 stem/ha. Alchornia cordifolia, Ceiba pentandra, Chrysophyllum spp., Irvingia grandifolia, Milicia excelsa, Moringa olefeira and Tetrapleura tetraptera had population density of 1 stem/ha each. Pentaclethra macrophylla had the highest abundance ratio (3.30) followed by Parkia biglobosa and Vitellaria paradoxa with abundance of (2.60) each. Lophira alata had abundance ratio (2.40) while the least abundance was (1.00) in some species. Results of population frequency, density and abundance therefore, shows that Sankwala forest had the highest population frequency, density and abundance of tree species followed by Bechevie forest while the least was Gbogbu and Omulako forests respectively.
Table 9. Population frequency, density and abundance ratio (AR) of tree species identified in Beteh Forest, Obudu Local Government Area, Cross River State
S/N Species Total no. of individuals
Total no. of segments the species occurred
Total no. of segments
Frequency Density AR
1. Albizia lebbeck 2 1 6 6 0.3333 2.00 2. Albizia zygia 2 2 6 12 0.3333 1.00 3. Alchornea cordifolia 1 1 6 6 0.1666 1.00 4. Alstonia boonei 2 2 6 12 0.3333 1.00 5. Amphimas pterocarpoides 1 1 6 6 0.1666 1.00 6. Anacardium occidentale 2 2 6 12 0.3333 1.00 7. Angylocalyx zenkeri 1 1 6 6 0.1666 1.00 8. Annona senegalensis 2 2 6 12 0.3333 1.00 9. Anogeissus leiocarpus 2 1 6 6 0.3333 2.00 10. Anthonotha macrophylla 4 2 6 12 0.6666 2.00 11. Baillenolla toxisperma 1 1 6 6 0.1666 1.00 12. Baphia nitida 2 2 6 12 0.3333 1.00 13. Berlinia grandiflora 2 1 6 6 0.3333 2.00 14. Bosqueia angolensis 1 1 6 6 0.1666 1.00 15. Calpocalyx winkleri 2 1 6 6 0.3333 2.00 16. Carapa procera 2 1 6 6 0.3333 2.00 17. Cedrella spp. 2 2 6 12 0.3333 1.00 18. Chrysophylum spp. 1 1 6 6 0.1666 1.00 19. Cleistopholis patens 2 2 6 12 0.3333 1.00 20. Combretodendron macrocopum 2 2 6 12 0.3333 1.00 21. Cussonia barteri 1 1 6 6 0.1666 1.00 22. Cyliodiscus gabunensis 1 1 6 6 0.1666 1.00 23. Daniella ogea 1 1 6 6 0.1666 1.00 24. Diospyros dendo 1 1 6 6 0.1666 1.00 25. Elaeis guinensis 3 2 6 12 0.5 1.50 26. Ficus capensis 3 2 6 12 0.5 1.50 27. Garcinia kola 2 1 6 6 0.3333 2.00 28. Guarea cedrata 2 2 6 12 0.3333 1.00 29. Guibourtia spp. 1 1 6 6 0.1666 1.00 30. Hevea brasilliensis 3 2 6 12 0.5 1.50 31. Hymenostegia afzelia 1 1 6 6 0.1666 1.00 32. Irvingia grandiflolia 2 1 6 6 0.3333 2.00 33. Irvingia wombulu 2 2 6 12 0.3333 1.00 34. Juglans nigra 2 2 6 12 0.3333 1.00 35. Maesobotyra bateri 2 1 6 6 0.3333 2.00 36. Mansonia altissima 2 2 6 12 0.3333 1.00 37 Memocylon blakeoides 3 2 6 12 0.5 1.50 38 Milicia excelsa 4 2 6 12 0.6666 2.00 39. Moringa olefeira 4 2 6 12 0.6666 2.00 40. Nauclea latifolia 1 1 6 6 0.1666 1.00 41. Newbouldia leavis 2 1 6 6 0.3333 2.00 42. Oncoba spinosa 2 2 6 12 0.3333 1.00 43. Parkia biglobosa 5 3 6 18 0.8333 1.60 44. Pentaclethra macrophylla 5 3 6 18 0.8333 1.60 45. Pentadesma butraceae 1 1 6 6 0.1666 1.00 46. Piptandeniastrum africanum 2 2 6 12 0.3333 1.00 47. Polyalthia suaveolens 3 2 6 12 0.5 1.50 48. Prosopis africana 10 5 6 30 1.6666 2.00 49. Pterocarpus erinaceous 1 1 6 6 0.1666 1.00 50. Rauwolfia vomitora 1 1 6 6 0.1666 1.00 51. Ricinodendron heudoelotii 1 1 6 6 0.1666 1.00 52. Symphonia globulifera 1 1 6 6 0.1666 1.00 53. Terminalia ivorensis 2 2 6 12 0.3333 1.00 54. Terminalia macroptera 1 1 6 6 0.1666 1.00 55. Tetrapleura tetraptera 5 3 6 18 0.8333 1.60 58. Uvariopsis dioica 1 1 6 6 0.3333 1.00 59. Vitellaria paradoxa 6 4 6 24 1 1.50 60. Vitex doniana 2 1 6 6 0.3333 2.00 61. Xylopia africana 3 2 6 12 0.5 1.50
59591 International Journal of Current Research, Vol. 9, Issue, 10, pp.59581-59596, October, 2017

Table 10. Frequency, density and abundance ratio (AR) of tree species identified in Bechevie Forest, Obanliku Local Government Area, Cross River State
S/N Species Total no. of individuals Total no. of segments the species occurred Total no. of segments Frequency Density AR
1. Acacia gourmaensis 1 1 6 6 0.1666 1.00 2. Afzelia spp. 2 2 6 12 0.3333 1.00 3. Albizia lebbeck 2 2 6 12 0.3333 1.00 4. Albizia spp. 1 1 6 6 0.1666 1.00 5. Albizia zygia 1 1 6 6 0.1666 1.00 6. Albuca nigritans 1 1 6 6 0.1666 1.00 7. Allanblackia floribunda 2 2 6 12 0.3333 1.00 8. Alstonia boonei 2 2 6 12 0.3333 1.00 9. Amphimas pterocarpoides 4 2 6 12 0.6666 2.00 10. Anacardium occidentale 4 2 6 12 0.6666 2.00 11. Angylocalyx zenkeri 1 1 6 6 0.1666 1.00 12. Antians welwitschii 1 1 6 6 0.1666 1.00 13. Baphia nitida 1 1 6 6 0.1666 1.00 14. Berlinia grandiflora 1 1 6 6 0.1666 1.00 15. Blighia sapida 1 1 6 6 0.1666 1.00 16. Bombax brevicuspe 2 2 6 12 0.3333 1.00 17. Bombax costatum 2 2 6 12 0.3333 1.00 18. Bosqueia angolensis 1 1 6 6 0.1666 1.00 19. Brachystegia nigerica 1 1 6 6 0.1666 1.00 20. Carapa procera 3 2 6 12 0.5 1.50 21. Cedrella spp. 4 2 6 12 0.6666 2.00 22. Ceiba pentandra 4 2 6 12 0.6666 2.00 23. Chrysophylum albidum 2 2 6 12 0.3333 1.00 24. Cleistopholis patens 1 1 6 6 0.1666 1.00 25. Cola nitida 3 2 6 12 0.5 1.50 26. Combretum spp. 1 1 6 6 0.1666 1.00 27. Cordia millenii 2 2 6 12 0.3333 1.00 28. Cussonia barteri 3 2 6 12 0.5 1.50 29. Cyliodiscus gabunensis 2 2 6 12 0.3333 1.00 30. Daniella ogea 1 1 6 6 0.1666 1.00 31. Diospyros mesipiliformes 3 2 6 12 0.5 1.50 32. Elaeis guinensis 2 1 6 6 0.3333 2.00 33. Fagara macrophylla 2 2 6 12 0.3333 1.00 34. Ficus capensis 1 1 6 6 0.1666 1.00 35. Ficus exasperata 2 2 6 12 0.3333 1.00 36. Funtumia elastica 2 2 6 12 0.3333 1.00 37. Gambeya albida 3 2 6 12 0.5 1.50 38 Garcinia kola 3 2 6 12 0.5 1.5 39. Guarea cedrata 2 2 6 12 0.3333 1.00 40. Guibourtia spp. 2 2 6 12 0.3333 1.00 41. Hevea brasilliensis 3 2 6 12 0.5 1.50 42. Hunteria umbellata 4 2 6 12 0.6666 2.00 43. Hymenostegia afzelia 2 1 6 6 0.3333 2.00 44. Irvingia gabonensis 4 2 6 12 0.6666 2.00 45. Irvingia grandifolia 6 3 6 18 1 2.00 46. Irvingia wombulu 4 2 6 12 0.6666 2.00 47. Khaya grandifoliola 2 2 6 12 0.3333 1.00 48. Khaya spp. 2 2 6 12 0.3333 1.00 49. Klainedoxa gabonensis 1 1 6 6 0.1666 1.00 50. Lannea welwitschi 2 2 6 12 0.3333 1.00 51. Maesobotyra bateri 1 1 6 6 0.1666 1.00 52. Maesopsis eminii 1 1 6 6 0.1666 1.00 53. Memocylon blakeoides 2 2 6 12 0.3333 1.00 54. Milicia excelsa 4 3 6 18 0.3333 1.33 55. Moringa olefeira 4 2 6 12 0.6666 2.00 56. Musanga cecropioides 2 2 6 12 0.3333 1.00 57. Myrianthus arboreus 1 1 6 6 0.1666 1.00 58. Nauclea latifolia 2 2 6 12 0.3333 1.00 59. Oncoba spinosa 2 1 6 12 0.3333 2.00 60. Parkia biglobosa 8 3 6 18 1.3333 2.66 61. Pentaclethra macrophylla 12 4 6 24 2 3.00 62. Pentadesma butyraceae 1 1 6 6 0.1666 1.00 63. Piptadoniastrum africanum 1 1 6 6 0.1666 1.00 64. Polyalthia suaveolens 2 1 6 6 0.3333 2.00 65. Prosopis africana 10 5 6 30 1.6666 2.00 66. Pterocarpus milbraedii 2 1 6 6 0.3333 2.00 67. Pterocarpus osun 1 1 6 6 0.1666 1.00 68. Pycanthus angolensis 3 2 6 12 0.5 1.50 69. Rauwolfia vomitora 2 2 6 12 0.3333 1.00 70. Ricinodendron heudoelotii 2 1 6 6 0.3333 2.00 71. Staudtia stipitata 2 2 6 12 0.3333 1.00 72 Terminalia ivorensis 2 2 6 12 0.3333 1.0 73 Terminalia macroptera 2 2 6 12 0.3333 1.00 74 Tetrapleura tetraptera 6 3 6 1 8 1.50 75. Tetrorchidium didymostemon 2 1 6 6 0.3333 2.00 76. Thaumatococus daniella 2 2 6 12 0.3333 1.00 77. Treculia africana 2 2 6 12 0.3333 1.00 78. Trichilia lanata 1 1 6 6 0.1666 1.00 79. Uapaca acuminata 4 3 6 18 0.6666 1.33 80. Uvariopsis dioica 2 2 6 12 0.3333 1.00 81. Vitellaria paradoxa 6 4 6 24 1 1.50 82. Vitex spp. 1 1 6 6 0.1666 1.00 83. Xylopia aethiopica 2 2 6 12 0.3333 1.00
59592 Akwaji Patrick Ishoro and Edu Esther Aja, Population frequency, density, abundance and diversity of tree species in ten communal forests of northern Cross River State, Nigeria

Table 11. Population frequency, density and abundance ratio (AR) of tree species identified in Sankwala Forest, Obanliku Local Government Area, Cross River State
S/N Species Total no. of individuals
Total no. of segments the species occurred
Total no. of segments
Frequency Density AR
1. Acacia gourmaensis 4 2 6 12 0.6666 2.00 2. Afzelia africana 2 2 6 12 0.3333 1.00 3. Afzelia spp. 2 2 6 12 0.3333 1.00 4. Alchornea cordifolia 6 5 6 30 1 1.20 5. Allanblackia floribunda 4 2 6 12 0.6666 2.00 6. Alstonia boonei 2 2 6 12 0.3333 1.00 7. Amphimas pterocarpoides 2 2 6 12 0.3333 1.00 8. Anacardium occidentale 2 2 6 12 0.3333 1.00 9. Angylocalyx zenkeri 1 1 6 6 0.1666 1.00 10. Aningeria robusta 2 2 6 12 0.3333 1.00 11. Annona senegalensis 2 1 6 6 0.3333 2.00 13. Annonidium manii 4 2 6 12 0.6666 2.00 12. Anogeissus leiocarpus 1 1 6 6 0.1666 1.00 14. Antians welwitschii 2 2 6 12 0.3333 1.00 15. Antrocaryon micrasta 1 1 6 6 0.1666 1.00 16. Baphia nitida 4 2 6 12 0.6666 2.00 17. Berlinia grandiflora 3 2 6 12 0.5 1.50 18. Berlinia spp. 1 1 6 6 0.1666 1.00 19. Blighia sapida 3 2 6 12 0.5 1.50 20. Bombax brevicuspe 2 1 6 6 0.3333 2.00 21. Bombax costatum 2 2 6 12 0.3333 1.00 22. Bosqueia angolensis 2 2 6 12 0.3333 1.00 23. Canarium schweinfurthii 2 1 6 6 0.3333 2.00 24. Carapa procera 2 2 6 12 0.3333 1.00 25. Cedrella spp. 3 2 6 12 0.5 1.50 26. Ceiba pentandra 6 3 6 18 1 2.00 27. Chrysophyllum spp. 6 4 6 24 1 1.50 28. Cleistopholis patens 2 2 6 12 0.3333 1.00 29. Cocos nucifera 4 2 6 12 0.6666 2.00 30. Coelocaryon preusii 1 1 6 6 0.1666 1.00 31. Cola acuminata 3 2 6 12 0.5 1.50 32. Cola millenii 4 2 6 12 0.6666 2.00 33. Cola nitida 1 1 6 6 0.1666 1.00 34. Combretodendron spp. 2 2 6 12 0.3333 1.00 35. Combretum spp. 2 2 6 12 0.3333 1.00 36. Cordia millenii 2 1 6 6 0.3333 2.00 37 Cussonia barteri 1 1 6 6 0.1666 1.00 38. Dacryodes edulis 4 2 6 12 0.6666 2.00 39. Diospyros dendo 2 2 6 12 0.3333 1.00 40. Diospyros mesipiliformes 1 1 6 6 0.1666 1.00 41. Elaeis guinensis 4 2 6 12 0.6666 2.00 42. Eriboma oblonga 1 1 6 6 0.1666 1.00 43. Erythrinia senegalensis 4 2 6 12 0.6666 2.00 44. Fagara macrophylla 2 2 6 12 0.3333 1.00 45. Ficus capensis 4 2 6 12 0.6666 2.00 46. Ficus exasperata 4 3 6 12 0.6666 1.33 47. Ficus mucuso 3 2 6 12 0.5 1.50 48. Funtumia elastica 2 1 6 6 0.3333 2.00 49. Gambeya albida 3 2 6 12 0.5 1.50 50. Garcinia kola 4 2 6 12 0.6666 2.00 51. Gliricidia sepium 1 1 6 6 0.1666 1.00 52. Guarea cedrata 1 1 6 6 0.1666 1.00 53. Hevea brasilliensis 4 2 6 12 0.6666 2.00 54. Hunteria umbellata 2 2 6 12 0.3333 1.00 55. Hymenocardia acida 2 2 6 12 0.3333 1.00 56. Hyphaena thebaica 2 2 6 12 0.3333 1.00 57. Irvingia gabonensis 4 2 6 12 0.6666 2.00 58. Irvingia grandifolia 6 3 6 18 1 2.00 59. Irvingia wombulu 4 2 6 12 0.6666 2.00 60. Isoberlina doka 3 3 6 18 0.5 1.00 61. Juglans nigra 2 2 6 12 0.3333 1.00 62. Lannea welwitschi 2 2 6 12 0.3333 1.00 63. Lophira alata 12 5 6 30 2 2.40 64. Maesopsis eminii 4 2 6 12 0.6666 2.00 65. Memocylon blakeoides 2 2 6 12 0.3333 1.00 66. Milicia excelsa 6 4 6 24 1 1.50 67. Moringa olefeira 6 4 6 24 1 1.50 68. Musanga cecropioides 3 2 6 12 0.5 1.50 69. Myrianthus arboreus 1 1 6 6 0.1666 1.00 70. Nauclea latifolia 1 1 6 6 0.1666 1.00 71. Oncoba spinosa 2 1 6 12 0.3333 2.00 72. Parinari kerstingii 2 2 6 12 0.3333 1.00
Continue…………………………..
59593 International Journal of Current Research, Vol. 9, Issue, 10, pp.59581-59596, October, 2017
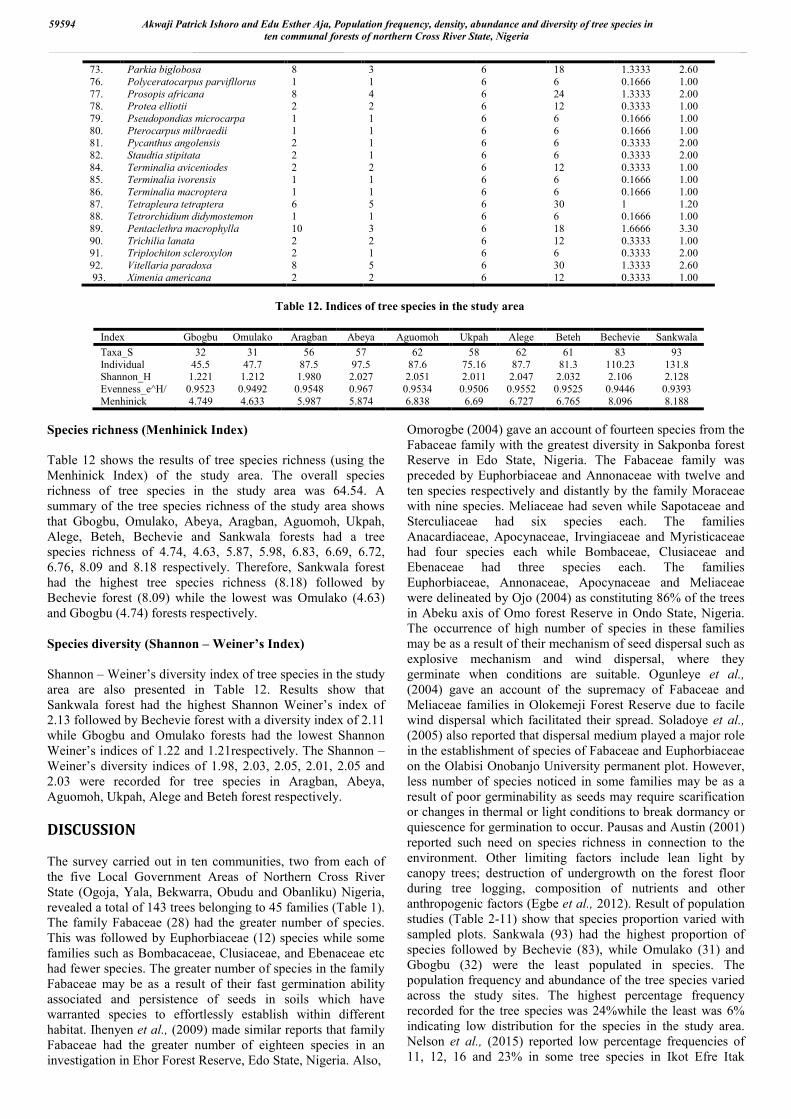
Species richness (Menhinick Index) Table 12 shows the results of tree species richness (using the Menhinick Index) of the study area. The overall species richness of tree species in the study area was 64.54. A summary of the tree species richness of the study area shows that Gbogbu, Omulako, Abeya, Aragban, Aguomoh, Ukpah, Alege, Beteh, Bechevie and Sankwala forests had a tree species richness of 4.74, 4.63, 5.87, 5.98, 6.83, 6.69, 6.72, 6.76, 8.09 and 8.18 respectively. Therefore, Sankwala forest had the highest tree species richness (8.18) followed by Bechevie forest (8.09) while the lowest was Omulako (4.63) and Gbogbu (4.74) forests respectively. Species diversity (Shannon – Weiner’s Index) Shannon – Weiner’s diversity index of tree species in the study area are also presented in Table 12. Results show that Sankwala forest had the highest Shannon Weiner’s index of 2.13 followed by Bechevie forest with a diversity index of 2.11 while Gbogbu and Omulako forests had the lowest Shannon Weiner’s indices of 1.22 and 1.21respectively. The Shannon – Weiner’s diversity indices of 1.98, 2.03, 2.05, 2.01, 2.05 and 2.03 were recorded for tree species in Aragban, Abeya, Aguomoh, Ukpah, Alege and Beteh forest respectively.
DISCUSSION The survey carried out in ten communities, two from each of the five Local Government Areas of Northern Cross River State (Ogoja, Yala, Bekwarra, Obudu and Obanliku) Nigeria, revealed a total of 143 trees belonging to 45 families (Table 1). The family Fabaceae (28) had the greater number of species. This was followed by Euphorbiaceae (12) species while some families such as Bombacaceae, Clusiaceae, and Ebenaceae etc had fewer species. The greater number of species in the family Fabaceae may be as a result of their fast germination ability associated and persistence of seeds in soils which have warranted species to effortlessly establish within different habitat. Ihenyen et al., (2009) made similar reports that family Fabaceae had the greater number of eighteen species in an investigation in Ehor Forest Reserve, Edo State, Nigeria. Also,
Omorogbe (2004) gave an account of fourteen species from the Fabaceae family with the greatest diversity in Sakponba forest Reserve in Edo State, Nigeria. The Fabaceae family was preceded by Euphorbiaceae and Annonaceae with twelve and ten species respectively and distantly by the family Moraceae with nine species. Meliaceae had seven while Sapotaceae and Sterculiaceae had six species each. The families Anacardiaceae, Apocynaceae, Irvingiaceae and Myristicaceae had four species each while Bombaceae, Clusiaceae and Ebenaceae had three species each. The families Euphorbiaceae, Annonaceae, Apocynaceae and Meliaceae were delineated by Ojo (2004) as constituting 86% of the trees in Abeku axis of Omo forest Reserve in Ondo State, Nigeria. The occurrence of high number of species in these families may be as a result of their mechanism of seed dispersal such as explosive mechanism and wind dispersal, where they germinate when conditions are suitable. Ogunleye et al., (2004) gave an account of the supremacy of Fabaceae and Meliaceae families in Olokemeji Forest Reserve due to facile wind dispersal which facilitated their spread. Soladoye et al., (2005) also reported that dispersal medium played a major role in the establishment of species of Fabaceae and Euphorbiaceae on the Olabisi Onobanjo University permanent plot. However, less number of species noticed in some families may be as a result of poor germinability as seeds may require scarification or changes in thermal or light conditions to break dormancy or quiescence for germination to occur. Pausas and Austin (2001) reported such need on species richness in connection to the environment. Other limiting factors include lean light by canopy trees; destruction of undergrowth on the forest floor during tree logging, composition of nutrients and other anthropogenic factors (Egbe et al., 2012). Result of population studies (Table 2-11) show that species proportion varied with sampled plots. Sankwala (93) had the highest proportion of species followed by Bechevie (83), while Omulako (31) and Gbogbu (32) were the least populated in species. The population frequency and abundance of the tree species varied across the study sites. The highest percentage frequency recorded for the tree species was 24%while the least was 6% indicating low distribution for the species in the study area. Nelson et al., (2015) reported low percentage frequencies of 11, 12, 16 and 23% in some tree species in Ikot Efre Itak
73. Parkia biglobosa 8 3 6 18 1.3333 2.60 76. Polyceratocarpus parvifllorus 1 1 6 6 0.1666 1.00 77. Prosopis africana 8 4 6 24 1.3333 2.00 78. Protea elliotii 2 2 6 12 0.3333 1.00 79. Pseudopondias microcarpa 1 1 6 6 0.1666 1.00 80. Pterocarpus milbraedii 1 1 6 6 0.1666 1.00 81. Pycanthus angolensis 2 1 6 6 0.3333 2.00 82. Staudtia stipitata 2 1 6 6 0.3333 2.00 84. Terminalia aviceniodes 2 2 6 12 0.3333 1.00 85. Terminalia ivorensis 1 1 6 6 0.1666 1.00 86. Terminalia macroptera 1 1 6 6 0.1666 1.00 87. Tetrapleura tetraptera 6 5 6 30 1 1.20 88. Tetrorchidium didymostemon 1 1 6 6 0.1666 1.00 89. Pentaclethra macrophylla 10 3 6 18 1.6666 3.30 90. Trichilia lanata 2 2 6 12 0.3333 1.00 91. Triplochiton scleroxylon 2 1 6 6 0.3333 2.00 92. Vitellaria paradoxa 8 5 6 30 1.3333 2.60 93. Ximenia americana 2 2 6 12 0.3333 1.00
Table 12. Indices of tree species in the study area
Index Gbogbu Omulako Aragban Abeya Aguomoh Ukpah Alege Beteh Bechevie Sankwala
Taxa_S 32 31 56 57 62 58 62 61 83 93 Individual 45.5 47.7 87.5 97.5 87.6 75.16 87.7 81.3 110.23 131.8 Shannon_H 1.221 1.212 1.980 2.027 2.051 2.011 2.047 2.032 2.106 2.128 Evenness_e^H/ 0.9523 0.9492 0.9548 0.967 0.9534 0.9506 0.9552 0.9525 0.9446 0.9393 Menhinick 4.749 4.633 5.987 5.874 6.838 6.69 6.727 6.765 8.096 8.188
59594 Akwaji Patrick Ishoro and Edu Esther Aja, Population frequency, density, abundance and diversity of tree species in ten communal forests of northern Cross River State, Nigeria
community forest in Akwa Ibom State, Nigeria. The highest population densities recorded for the tree species in some study sites was 2 stem/ha while the least was 0.1666 stem/ha. Results of abundance of each tree species in the different sites/area studied shows that the species had the highest abundance rates of 2.66-3.33 while the lowest was 1.00. The population density and abundance of a tree species in a patch of rainforest is substantially affected by the atmospheric conditions inside the forest and the number of seeds capable of surviving generated by the tree in question (Aigbe and Omokhua, 2015). For example, a tree species that is not able to endure a shady environment would find it hard to rejuvenate in a rainforest with closed crown. Accordingly, the density and abundance of such a tree species would be lessen in the forest, while the old trees of same species would die. Christie and Armesto (2003) gave an account of very low population densities and abundance of a vast number of economically viable tree species triggered by death of viable seeds and poor micro-sites for rejuvenation. Aigbe and Omokhua (2005) reported low population densities and abundance of tree species in Oban Forest Reserve in Cross River State, Nigeria due to anthropogenic factors. Similarly, the low population density and abundance of the tree species in the study sites may be due to the poor atmospheric conditions within the forests and anthropogenic factors. Furthermore, abundance or rarity of a tree species of economic significance in an area of rainforest is a role of the severity and pattern of overexploitation of the trees for timber and wood fuel (charcoal). This would also lead to overall paucity of seeds for rejuvenation, as large number of mother trees must have been cut down. Olajide (2004) confirmed a positive correlation between poor population density and abundance of some tree species and the death of their old mother trees. The species richness index (Table 12) evaluates the heterogeinity of species. It takes into account the overall number of a certain species in connection to the overall number of individuals inside the forest plot (Gebreselassen, 2011). The species richness index (Menhinick) obtained for the study area was 64.56 which indicates high species richness. Results of species richness show that Sankwala forest had the highest tree species richness of 8.18, this was followed by Bechevie forest with 8.09 while the lowest was recorded in Omulako and Gbogbu forests with 4.63 and 4.74 respectively. The species richness results (Sankwala and Bechevie) obtained in this study is high compared to the values for some tropical forests such as 7.19 for Bwindi forest, 7.54 for Kasyohakitomi forest and 6.38 for Kibale, all of which are located in the Albertine rift, Uganda as reported by Eilu et al.,(2004). The low species richness of some of the study sites (Omulako and Gbogbu) agrees with the findings of Odebiyi et al., (2004) in their study on population structure of economically viable tree species in Kwara State, Nigeria due to anthropogenic factors. Generally, species diversity is one of the most necessary or vital key used to assess an ecosystem. A rich ecosystem with greater species diversity has a lofty Shannon-Weiner (H) value whereas an ecosystem with low (H) will have a less species diversity (Deka et al., 2012; Sobay and Rahman, 2011). Results of Shannon-Weiner’s index (H) of tree species diversity in the study area (Table 12) show that Sankwala forest had the greater species diversity (2.12), this was followed by Bechevie forest with a value of 2.10 while the lowest (H) index values of 1.22 and 1.21 were recorded for Gbogbu and Omulako forests respectively.
The (H) index values of 2.12, 2.10, 1.22 and 1.21 obtained for Sankwala, Bechevie, Gbogbu and Omulako forest respectively is lower than that of 3.1 and 3.3 for different rainforest sites in South-western Nigeria (Adekunle, 2006) and that of 2.20 – 2.65 obtained for tropical forests of Kudarya in Western Ghats, India (Sundaranpandian et al., 2000). Nevertheless, it should be well known that essential quantitative comparisons of species varieties between forest enviroments is dependent on plot size, sample size, environmental factors, as well as other site components. The low (H) index of the tree species in the study area could be as a result of the great economic value of the species to the people of the communities as most species produce consumable fruits and seeds on which the people depend for medicine, food, oil and timber. The products are normally sold in the rural and urban areas by the people who sell them to earn a living (Nath et al., 2009; Udo et al., 2009). The low (H) index value of the tree species also indicates that these tree species are low in their distribution; similar findings were reported by Olajide et al., (2008) and Udo et al., (2009). Conclusion This study revealed that the tree species were mostly low in their distribution and scantily populates the study area; this may be due to unrestrained exploitation and hence are declining. For the reason that these tree species are mostly depended on for timber (wood) and non-timber forest products in this area, it is crucial to make certain their sustainability. To make it possible to prevent the continuos decline of these valuable tree species; there is need for effective management of the forest by the indigenous communities so that the forest can keep on with providing goods and services necessary for these communities. Acknowledgement The authors are very grateful to the Cross River State Forestry Commission for their cooperation and assistance granted them during the field work.
REFERENCES Adekunle, V. A. J.2006. Conservation of tree species diversity
in tropical rainforest ecosystem of South west Nigeria, Journal of Tropical Forest Science, 18(2), pp.91-101.
Aigbe, H. I. and Omokhua, G. E. 2015. Tree species composition and diversity in Oban Forest Reserve, Nigeria, Journal of Agricultural Studies, 3(1), pp.10-24.
Bull, K., Stolte, K. W. and Stohlgren, T. J. 1998. Forest Health Monitoring. Vegetation Pilot, Field Methods Guide U. S. Department of Agriculture, Forest Service Washington, D.C.
Christie, D. A. and Armesto, J. J. 2003. Regeneration at micro site and tree species co-existence in temperate rainforest of Chilue Island, Chile, Journal of Ecology, 91, pp.776-784.
Deka, J., Tripathi, P. O. and Khan, L. M. 2012.High dominance of Shorea robusta gaertn.in Alluvial Plain Kamrup Sal Forest of Assam, N. E. India. International Journal of Ecosystems, 2(4), pp.67-73.
Egbe, E. A., Chuyong, G. B., Fonge, B. A. and Namuene, K. S. 2012. Forest disturbance and natural regeneration in African rainforest at Korup National Park, Cameroon, International Journal of Biodiversity and Conservation, 4(11), pp.377-384.
59595 International Journal of Current Research, Vol. 9, Issue, 10, pp.59581-59596, October, 2017

Eilu, G., Hafashimana, D. L. N. and Kasenene, J. M. 2004. Density and species diversity of trees in four tropical forests of the Albertine rift, western Uganda, Diversity and Distribution, 10, pp.303-312.
Ford Foundation. 1998. Forestry for Sustainable Rural Development. A Review of Ford Foundation Supported Community Forestry Programme in Asia, Ford Foundation, New York.
Gebreselasse, G. V. 2011. Plant communities species diversity seedling bank and re-sprouting in Nandi Forest, Kenya, Ph.D Thesis, Universitat Koblenz-Landau.
Gillespie, T. W., Brock, J. and Wright, C. W. 2004.Prospects for quantifying structure, floristic composition and species richness of tropical forest, International Journal of Remote Sensing, 25, pp.70-77.
Herrick, J. E., Van Zee, J. W., Havstad, K. M., Burkett, L. M. and Whitford, W. G. 2005. Monitoring Manual for Grassland, Shrubland and Savanna Ecosystems, Vol. 2, University of Arizona Press, Tucson.
Hutchinson,J. and Dalziel, J. 1972. Flora of West Tropical AfricaVol.3(1,2) 2nd edition, Crown Agents for Overseas Governments and Administrators, Milbank, London.
Ihenyen, J., Okoegwale, E. E. and Mensah, J. K. 2009. Composition of tree species in Ehor Forest Reserve, Edo State, Natural Science, 7(8), pp.8-18.
Ikojo, H. A., Olajide, O. and Uwadinma, I. J. 2005. Effects of soil media and watering regimes on the growth of Brachyategia eurycoma (Harms) seedlings, Journal of Sustainable Agriculture and Environment, 7, pp.93-98.
Jayaraman, K.1999. A statistical manual for forestry research. Food and Agriculture Organization of the United Nations (FAO) Regional Office for Asia and the Pacific, Bangkok.
Muul, I. 1993. Tropical Forest, Integrated Conservation Strategies and Concept of Critical Mass, Man Biosphere (MAB) Digest No. 15, UNESCO, France.
Nath, O. C., Arunachalam, A., Khan, M. I., Arunachalam, K. and Barhuiya, A. R. 2005.Vegetation analysis and tree population structure of tropical wet evergreen forest in Namdapha National Park, Northeast India, Biodiversity and Conservation, 14, pp.2109-2136.
Nelson, I. U., Udoakpan, U. I. and Jacob, D. E. 2015. Population density and diversity of plants species in Ikot Efre Itak community Forest, Akwa Ibom State, Nigeria, International Journal of Molecular Ecology and Conservation, 5(5), pp.1-6.
NIMET. 2015. Nigerian Meteorological Agency, Agrometeorological Bulletin, 36(3), pp.21-31.
Odebiyi, J. A, Bada, S. O, Awodoyin, R. O, Oni, P. I. and Omoloye, A. A. 2004. Population structure of Vitelaria paradoxa Gaertn. F. and Parkia biglobosa (Jacq) Benth. in the Agroforestry Parklands of Nigeria Humid Savannah, West Africa Journal of Applied Ecology, 5, pp.31-39.
Ogunleye, A. J., Adeola, A. O., Ojo, L. O. and Aduradola, A. M. 2004. Impact of farming activities on vegetation of Olokemeji Forest Reserve, Global Nest: The International Journal, 6 (2), pp.130-139.
Ojo, L. O. 2004. The fate of a tropical rainforest in Nigeria; Abeku sector of Omo Forest Reserve, Global Nest: The International Journal, 6(2), pp.116-130.
Olajide, O., Udo, E. S. and Otu, D. O. 2008. Diversity and population of timber tree species producing valuable non-timber products in two tropical rainforests in Cross River State, Nigeria, Journal of Agriculture and Social Science, 4(2), pp.65-68.
Omorogbe, R. U. 2004. Status of flora biodiversity and exploitation of biological resources in Sakponba Forest Reserve, Edo State, M.Sc Thesis, Ambrose Alli University Ekpoma, Edo State.
Panayoutou, T. and Ashton, P. S. 1992. Not by Timber Alone: Economics and Ecology for Sustainable Tropical Forests, Island Press Washington D. C, Ad Covelin, Carlifornia, U. S. A.
Pausas, J. G. and Austin, M. P. 2001. Patterns of plant species richness in relation to different environments: An appraisal, Journal of Vegetation Science, 12, pp.153-166.
Petchay, O. L. and Gaston, K. J. 2002. Functional diversity (FD), species richness and community composition. Ecology Letters, 5(3), pp.402-411.
Sharma, P. D. 2009. Ecology and Environment 10th edition, Capital Offset Press, New Delhi.
Soladoye, M. O., Sonibare, M. A., Nadi, A. O. and Alabi, D. A. 2005. Indigenous angiosperm biodiversity of Olabisi Onabanjo University Permanent site, African Journal of Biotechnology, 4(5), pp.554-562.
Stohlgren, T. J., Falkner, M. B. and Schell, L. D. 1995. A Modified Whittaker nested vegetation sampling method, Plant Ecology, 117(21), pp.113-121.
Sundarapandian, S. M., Sidiya, S. and Swamy, P. S. 2000. Forest ecosystem structure and composition along an altitudinal gradient in the Western Ghats, South India. Journal of Tropical Forestry Science, 12, pp.104-123.
Tuomisto, H. 2010. A consistent terminology for quatifying species diversity? Yes it does exist, Oecologia, 4, pp.853-860.
Udo, E. S., Olajide, O. and Udoh, E. A. 2009. Life-form classification and density of plants producing economically valuable non-timber products in Ukpon Community Forest, Akwa Ibom State, Nigeria, Nigerian Journal of Botany, 22(1), pp.147-154.
Whitmore, T. C. 1998. An Introduction to Tropical Rainforests. Oxford University Press, Oxford, UK.
*******
59596 Akwaji Patrick Ishoro and Edu Esther Aja, Population frequency, density, abundance and diversity of tree species in ten communal forests of northern Cross River State, Nigeria