issn: 1097-6647 print / 1532-429x online doi: 10.1080...
TRANSCRIPT
Journal of Cardiovascular Magnetic Resonance (2007) 9, 733–740Copyright c© 2007 Informa Healthcare USA, Inc.ISSN: 1097-6647 print / 1532-429X onlineDOI: 10.1080/10976640701544415
Added Value of Rest to Stress Study for Recognitionof Artifacts in Perfusion Cardiovascular Magnetic
ResonanceLouise E. J. Thomson, MBChB, FRACP,1 David S. Fieno, PhD, MD,1 Aiden Abidov, MD, PhD, FACC,1
Piotr J. Slomka, PhD,1,2 Rory Hachamovitch, MD, MSc, FACC,1 Rola Saouaf, MD,1 John D. Friedman, MD, FACC,1,2
and Daniel S. Berman, MD, FACC1,2
Departments of Imaging and Medicine, and Burns & Allen Research Institute, Cedars-Sinai Medical Center, Los Angeles, California, USA1
Department of Medicine, University of California at Los Angeles, David Geffen School of Medicine, Los Angeles, California, USA2
ABSTRACT
Background: The objective was to determine whether rest perfusion (RP) adds to stressperfusion (SP) and late gadolinium enhancement (LGE) cardiac magnetic resonance (CMR) fordetection of impaired coronary flow reserve. Methods: We enrolled patients (n = 45) referredfor myocardial perfusion SPECT (MPS) for adenosine CMR stress. SP, RP and LGE imageswere obtained with 99mTc sestamibi injection during a single adenosine infusion. Segmentalperfusion and confidence scores were recorded for SP-LGE interpreted with and without RP.CMR agreement with MPS was determined. Results: MPS was normal in 653 and abnormal in 67segments. SP-LGE CMR interpreted without RP was normal in 407, abnormal in 313 segments,and showed poor agreement with MPS (58%). Two hundred thirty-seven segments were changedto normal using data from RP, improving agreement (87%, p< 0.0001). Reader confidence waslow in 33 patients with SP-LGE and improved in 26 patients using SP-RP-LGE, where 37/45were read with high confidence. Artifact was present in 68% of SP CMR and accounted for falsepositive studies. Conclusion: Agreement between single stress adenosine CMR and MPS isoptimized by combining RP, LGE and SP CMR. Addition of RP CMR to SP-LGE CMR improvedagreement with MPS and reader confidence. Improved CMR pulse sequences may change therole of rest perfusion data.
INTRODUCTION
Determination of myocardial perfusion is useful for man-agement of patients with known or suspected coronary arterydisease (CAD). Myocardial perfusion SPECT (MPS) is rou-
Received 2 August 2006; accepted 25 April 2007.Keywords: Perfusion, Adenosine, Myocardium, Coronary ArteryDisease.Current institution for Dr. Abidov is Department of Medicine,Division of Cardiology, Beaumont Hospital, Royal Oak, Michigan,USA. Drs. Thomson and Fieno contributed equally to this workand are co-first authors on this manuscript. The authors would liketo acknowledge our technologists, nurse practitioners, and staffmembers for their assistance with these examinations. Studieswere funded, in part, by a grant from Siemens Medical Solutions.Correspondence to:Daniel S. Berman, MD, FACCCedars-Sinai Medical Center8700 Beverly Boulevard, Room A-041Los Angeles, CA 90048tel: 310-423-4223; fax: (310) 423-0811email: [email protected]
tinely used for detection of ischemia and has an establishedrole in risk assessment. Stress first-pass (FP) cardiac magneticresonance (CMR) has been used to detect impaired perfusionin patients referred for diagnostic coronary angiography (1–6). Adenosine FP CMR is accurate for detection of myocar-dial ischemia in animal models (7–9). Studies have comparedFP CMR and MPS and have suggested that reduced CMRsignal intensity correlates to perfusion deficits on stress MPS(5, 10).
There is uncertainty regarding the ideal FP CMR imagingprotocol. While some centers use a rest-stress protocol (1–3),others acquire stress followed by rest (4, 5), and still others em-ploy stress-only CMR (9). Studies have indicated that artifactsexist in FP CMR images that can mimic perfusion defects (11,12). Distinguishing whether reduced signal intensity in FP CMRrepresents true hypoperfusion or artifact is critical to diagnosis.
The objective of the current study was to compare the resultsof CMR and MPS to determine whether agreement and/or readerconfidence in interpretation of SP was improved by RP images.The hypothesis was that, in noninfarcted myocardium, regionsof reduced image intensity present on both SP and RP CMR wereunlikely to represent reversible ischemia on dual-isotope MPS.
733

METHODS
We enrolled 45 patients (15 had known prior CAD) referredfor rest 201Tl - adenosine 99mTc MPS, who agreed to CMR ex-amination. Studies were performed in compliance with the In-stitutional Review Board. Patients who had contraindications toCMR, asthma, 2nd or 3rd degree atrio-ventricular heart block,severe aortic stenosis, or severe emphysema were excluded.
For rest MPS, patients received 2.5 to 4 mCi 201Tl IV andwere imaged in supine position, using a dual-detector gammacamera (Forte, Philips-ADAC Laboratories, Milpitas, CA, USAor Siemens E Cam, Siemens Medical Systems, Hoffman Estates,IL, USA) (13). Rest imaging employed gating and the followingparameters: 10% and 30% energy window centered over the 165and 68–80 KeV peaks of 201Tl, respectively, 64 × 64 matrix, 3◦
angular sampling over 180◦, imaging time 35 seconds for eachprojection and elliptical orbit. No attenuation or scatter correc-tion was used. After filtered back projection, short-, verticallong- and horizontal long-axis tomograms were generated.
Patients were then placed supine on a 1.5-T CMR scanner(Siemens Sonata, Erlangen, Germany) with a 32 × 46 cm flex-ible phased-array surface coil (CP Body Array Flex, SiemensMedical Systems, Erlangen, Germany) on the chest. Blood pres-sure, electrocardiogram, and pulse oxygenation were monitored(In Vivo, Philadelphia, PA, USA); heart rate and systolic bloodpressure were used before, during, and after adenosine infusionto compute rate-pressure products. Following scouts, adenosinewas administered (140 mcg/kg/min IV for 5 minutes). At 2 min-utes into infusion, 25 to 40 mCi 99mTc sestamibi was injectedfollowed by 0.1 mmol/kg gadolinium contrast (Gadodiamide,Omniscan, Amersham, Piscataway, NJ, USA) at 5 mL/sec (bothvia another IV catheter) followed by 30 mL saline at 5 mL/sec.FP CMR was acquired at end-expiration with breath-holdingusing a saturation recovery steady-state free precession (SSFP)pulse sequence that employed partial Fourier filling of k-space(either 6/8 or 7/8 factor) where images were acquired apex tobase. Forty-two of the 45 subjects were able to hold their breathfor the first-pass bolus of contrast through the myocardium; inthe three patients who breathed during the first-pass bolus, imagequality was still deemed acceptable by readers. FP CMR imageswere oriented such that distal, mid-, and basal short-axis viewswere acquired during each heartbeat using the following param-eters: field of view 350 to 380 × 175 to 285 mm depending onpatient size, 192 frequency encoding points, frequency encod-ing resolution 1.8–2.0 mm, 84 to 128 acquired phase encodingsteps, slice thickness 8 mm, TE/TR 1.0/2.9 ms, bandwidth 1240Hz/pixel, flip angle 50◦, time between saturation pulse and centerof k-space 90 ms, non-selective non-adiabatic saturation pulse,asymmetric echoes allowed, all slices acquired during each RRinterval. Parallel imaging was not used.
Ten minutes after SP CMR, the same FP CMR sequencewas used to acquire RP images. Ten minutes later, LGE imagesmatched for field of view and slice position were acquired at midto end diastole using segmented inversion-recovery SSFP withthe following parameters: matrix 192 × 176 to 192, frequencyencoding resolution 1.8–2.0 mm, slice thickness 8 mm, TE/TR
1.1/2.7 ms, bandwidth 1185 Hz/pixel, flip angle 50◦, 5 to 9 phaseencoding lines acquired per segment depending on heart rate,image data acquired every other RR interval, delay time adjustedto acquire image data at mid to end diastasis, and inversiontime set to null normal myocardium, typically between 250 and350 ms.
Following CMR, 99mTc MPS was performed as previouslydescribed (14). Supine post-stress images were acquired with16-frame ECG gating. After filtered back projection, short- andlong- -axis tomograms were generated.
MPS analysis
Semiquantitative interpretation was used to assess MPS im-ages using a 5 point, 20 segment model. Initially, automatic seg-mental scores were obtained by comparison to gender-specificstress and rest normal limits (15). Computer-generated segmentswere adjusted by consensus of 2 nuclear cardiologists blindedto the CMR results using a 5-point scoring system (0 = normal,1 = equivocal, 2 = moderate, 3 = severe reduction, 4 = absenceof radiotracer in a segment versus remote). Scores were thenconverted into a 17 segment model using a previously publishedalgorithm (16). Because a 2-chamber long-axis view could onlybe acquired by CMR in 19/45 patients studied, the apex of theleft ventricle was not included yielding 16 segments per patient.Stress MPS was considered abnormal if ≥2 segments had a score≥2. An increase in stress compared to rest score was consideredindicative of segmental ischemia, provided the stress MPS scorewas ≥2.
CMR analysis
Visual scores for CMR were determined by consensus read of3 observers employing the 16 segment model. CMR readers wereblinded to the results of MPS. Studies were assigned a confidenceusing a 4 point system (high or low confidence normal, high orlow confidence abnormal).
SP-LGE CMR
For each patient, SP was first viewed with correspond-ing LGE. SP images were read using a 5 point system(0 = normal, 1 = equivocal, 2 = moderate, 3 = severe decrease,and 4 = absence of gadolinium uptake in a segment versus re-mote). SP was considered abnormal (ie, indicative of hypoperfu-sion during stress) if a segment had a score ≥2. LGE images werescored using a 5 point system according to segmental transmu-rality of hyperenhancement (0 = no enhancement, 1 = 1−25%,2 = 26–50%, 3 = 51–75%, 4 = 76–100% transmural) (17). Seg-ments were considered abnormal if LGE score was ≥1. Perfu-sion within areas of LGE was not considered. In areas of suben-docardial LGE, scoring took into account the perfusion patternof the viable territory adjacent in the segment of interest. Perfu-sion scored by SP-LGE was considered abnormal (ie, indicativeof hypoperfusion during stress) if a segment had a score ≥2. Asegment with a perfusion defect or an LGE abnormality or bothwas considered abnormal. Ischemia was considered present if
734 L. E. J. Thomson et al.

SP was ≥2 and greater than LGE by ≥1 point. By patient, SP-LGE was considered abnormal if ≥2 segments had evidence ofstress hypoperfusion or infarction.
SP-RP-LGE CMR
After analysis of stress data with LGE as described above,data sets were completely re-scored with stress, rest, and DEdata six weeks later by the same three observers. The paired SP-RP images were viewed with corresponding LGE. The methodfor scoring was the same as that for SP-LGE and rest segmentalperfusion scores were used to determine whether stress perfu-sion abnormalities were artifactual in noninfarcted segments. Ifthe LGE score was ≥1, RP scores were not considered in deter-mining whether ischemia was present or whether the segmentwas abnormal. However, if LGE score was 0 and the SP scorewas ≥2 and greater than RP, then a segment would be consid-ered ischemic and abnormal. If the RP was ≥ SP and LGE was0, the perfusion defect was considered artifactual. By patient,SP-RP-LGE was considered abnormal if ≥2 segments had evi-dence of ischemia or infarction. Regions with stress-rest changeand no scar were considered ischemic, and regions with thesame stress-rest score (both ≥2) with no scar were considerednormal. Specifically, when similar regions of reduced signal in-tensity were observed at stress and rest perfusion CMR, theseareas were considered artifactual rather than true hypoperfusion.
Statistical methods
Rate-pressure products were compared before, during, andafter adenosine using repeated measures analysis of variancewith Bonferronni correction. Kappa statistics were computedto determine whether a relationship existed between severity ofMPS determined ischemia and SP CMR. Values are expressed asmean± standard deviation throughout. Differences between theCMR and MPS examinations were compared using a student’spaired t-test with p < 0.05 considered significant.
RESULTS
Patient characteristics are shown in Table 1. Anginal symp-toms were present in all patients. All patients underwent thestudy without adverse events. The rate-pressure products were:10,200 ± 3,400, 12,260 ± 3,300, and 1,0210 ± 3,700, be-fore, during, and after adenosine administration, respectively(p < 0.001).
Table 1. Characteristics of the study population
Parameter Patients (n = 45 total)
Gender: Male 23 (51%)Mean Age (years) 70 ± 14Diabetes 5 (9%)Hyperlipidemia 23 (51%)Prior Myocardial Infarction 4 (7%)Prior revascularization 15 (35%)
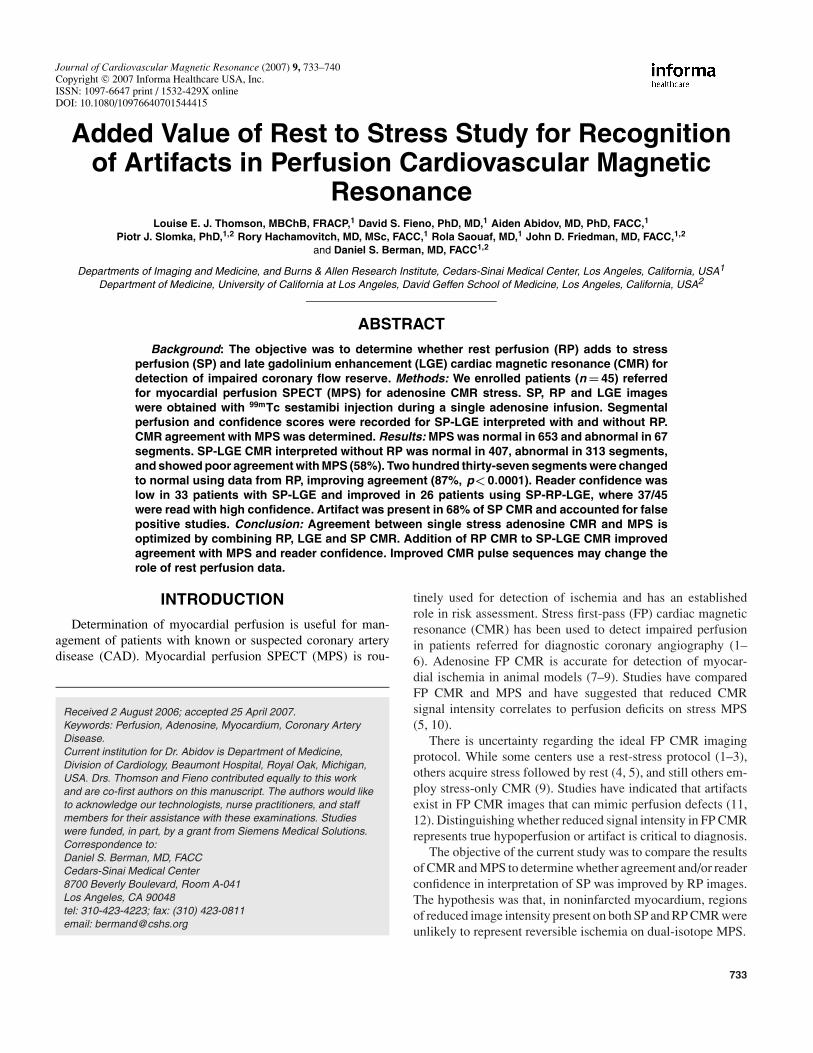
Figure 1 shows CMR versus MPS in three patients. Fig. 1areveals a lateral wall region judged as hypoperfusion usingSP-LGE (score 2, low confidence) but was changed to normal(score 0, high confidence) after SP-RP-LGE. Fig. 1b revealsan inferior region judged as hypoperfusion (score 2, highconfidence) using SP-LGE images and was unchanged afterSP-RP-LGE. Fig.1c reveals stress CMR judged normal (score0, low confidence) with 50–70% infarction by LGE; perfusionremained normal (score 0, high confidence) after SP-RP-LGE.MPS was abnormal with reversible defect in the anterior wall.
MPS
MPS was abnormal in 18/45 (40%) patients, where 16 (36%)had reversible defects, 7 (16%) had fixed defects, and 5 (11%)had both. By segment, MPS was abnormal in 68/720 (9%). Ofthese, 42/720 (6%) had reversible defects, 32 (4%) had fixeddefects, and 6 (1%) segments demonstrated both.
SP-LGE
By patient, SP-LGE CMR was abnormal in 43/45 (96%)subjects. Forty-one (91%) demonstrated perfusion defects onSP-LGE, 13 (29%) had infarction, and 11 (24%) had both.Thirty-four were read with low confidence, while 11 were readwith high confidence. By segment, SP-LGE CMR suggested334/720 (46%) segments were abnormal. SP-LGE demonstratedhypoperfusion in 313/720 (43%), infarction in 54 (8%), and bothin 33 (5%) segments.
SP-RP-LGE
By patient, SP-RP-LGE CMR was abnormal in 21/45 (47%)subjects. Sixteen (36%) demonstrated ischemia, 13 (29%)infarction, and 8 (18%) had both. By SP-RP-LGE CMR,8 patients were read with low confidence, while 37 were judgedwith high confidence. Artifacts were noted in 30/45 (68%)SP CMR scans. By segment, SP-RP-LGE suggested 105/720(15%) segments were abnormal. SP-RP-LGE showed ischemiain 76/720 (11%), infarction in 54 (8%), and both in 25 (3%)segments.
SP-RP-LGE resulted in a different score for SP in a totalof 261 segments versus SP-LGE. Of these, 3/261 scores wereincreased (one from 1 to 2 and two from 2 to 3), and the remaining258 values were decreased (13 from 3 to 0; 222 from 2 to 0; 20from 1 to 0; and 3 from 2 to 1). The majority of score changeswere attributed to identification of artifacts (Fig. 1a.)
Comparison by patient
A summary of CMR and MPS results by patient is shown inTable 2. Of 18 patients in whom MPS was abnormal, SP-LGEwas abnormal in all 18. In the 7 patients with fixed defects byMPS, 5 (71%) had infarction by LGE CMR, while 2 patients hadinfarction by LGE that was not detected by MPS. SP-LGE wasnormal in only 2 of 27 patients (7%) who had a normal MPS. Incontrast, SP-RP-LGE was abnormal in 14/18 (78%), who hadabnormal MPS. Within the group of 16 patients with reversible
Stress-Rest Perfusion CMR vs. MPS 735

Figure 1a. CMR images–perfusion during adenosine (top left), perfusion at rest (top center), and late gadolinium enhancement (top right).A rim of decreased signal intensity was apparent in the subendocardial portion of the lateral wall during both stress and rest (arrowheads).Corresponding stress-rest MPS (bottom left and right) revealed no evidence of ischemia.
Figure 1b. CMR images–perfusion during adenosine (top left), perfusion at rest (top center), and late gadolinium enhancement (top right).Decreased image intensity was apparent in the inferior myocardium at stress (arrowheads) but not at rest with no evidence of late gadoliniumenhancement. Corresponding stress-rest MPS (bottom left and right) revealed a reversible defect in the same myocardial region (arrow) suggestiveof ischemia.
736 L. E. J. Thomson et al.
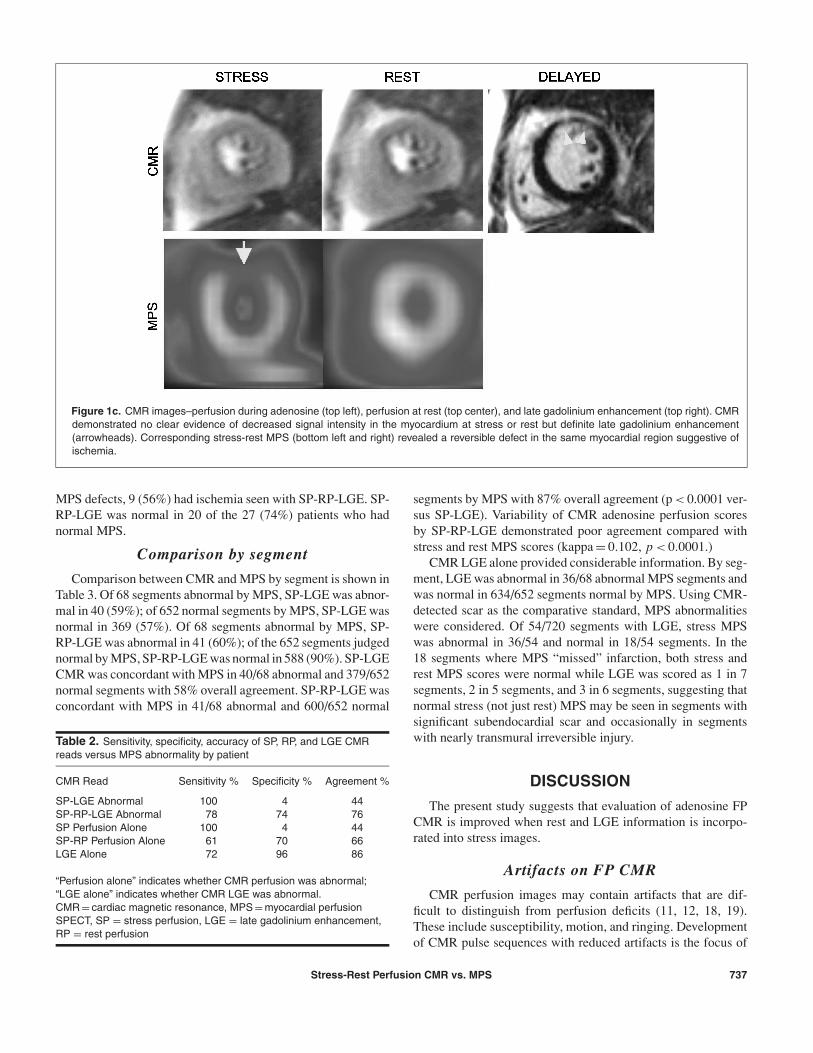
Figure 1c. CMR images–perfusion during adenosine (top left), perfusion at rest (top center), and late gadolinium enhancement (top right). CMRdemonstrated no clear evidence of decreased signal intensity in the myocardium at stress or rest but definite late gadolinium enhancement(arrowheads). Corresponding stress-rest MPS (bottom left and right) revealed a reversible defect in the same myocardial region suggestive ofischemia.
MPS defects, 9 (56%) had ischemia seen with SP-RP-LGE. SP-RP-LGE was normal in 20 of the 27 (74%) patients who hadnormal MPS.
Comparison by segment
Comparison between CMR and MPS by segment is shown inTable 3. Of 68 segments abnormal by MPS, SP-LGE was abnor-mal in 40 (59%); of 652 normal segments by MPS, SP-LGE wasnormal in 369 (57%). Of 68 segments abnormal by MPS, SP-RP-LGE was abnormal in 41 (60%); of the 652 segments judgednormal by MPS, SP-RP-LGE was normal in 588 (90%). SP-LGECMR was concordant with MPS in 40/68 abnormal and 379/652normal segments with 58% overall agreement. SP-RP-LGE wasconcordant with MPS in 41/68 abnormal and 600/652 normal
Table 2. Sensitivity, specificity, accuracy of SP, RP, and LGE CMRreads versus MPS abnormality by patient
CMR Read Sensitivity % Specificity % Agreement %
SP-LGE Abnormal 100 4 44SP-RP-LGE Abnormal 78 74 76SP Perfusion Alone 100 4 44SP-RP Perfusion Alone 61 70 66LGE Alone 72 96 86
“Perfusion alone” indicates whether CMR perfusion was abnormal;“LGE alone” indicates whether CMR LGE was abnormal.CMR = cardiac magnetic resonance, MPS = myocardial perfusionSPECT, SP = stress perfusion, LGE = late gadolinium enhancement,RP = rest perfusion
segments by MPS with 87% overall agreement (p < 0.0001 ver-sus SP-LGE). Variability of CMR adenosine perfusion scoresby SP-RP-LGE demonstrated poor agreement compared withstress and rest MPS scores (kappa = 0.102, p < 0.0001.)
CMR LGE alone provided considerable information. By seg-ment, LGE was abnormal in 36/68 abnormal MPS segments andwas normal in 634/652 segments normal by MPS. Using CMR-detected scar as the comparative standard, MPS abnormalitieswere considered. Of 54/720 segments with LGE, stress MPSwas abnormal in 36/54 and normal in 18/54 segments. In the18 segments where MPS “missed” infarction, both stress andrest MPS scores were normal while LGE was scored as 1 in 7segments, 2 in 5 segments, and 3 in 6 segments, suggesting thatnormal stress (not just rest) MPS may be seen in segments withsignificant subendocardial scar and occasionally in segmentswith nearly transmural irreversible injury.
DISCUSSION
The present study suggests that evaluation of adenosine FPCMR is improved when rest and LGE information is incorpo-rated into stress images.
Artifacts on FP CMR
CMR perfusion images may contain artifacts that are dif-ficult to distinguish from perfusion deficits (11, 12, 18, 19).These include susceptibility, motion, and ringing. Developmentof CMR pulse sequences with reduced artifacts is the focus of
Stress-Rest Perfusion CMR vs. MPS 737

Table 3. Summary of comparisons of SP, RP, and LGE CMR reads versus MPS abnormality by segment
MPS
CMR Abnormal n = 68 Normal n = 652 Sens % Spec % Accuracy %
SP-LGE + 40 273 59 58 58Abnormal − 28 379SP-RP-LGE + 41 64 60 90 87Abnormal − 27 588SP + 40 273 59 58 58Perfusion alone − 28 379SP-RP + 24 52 35 92 86Perfusion alone − 44 600LGE alone + 36 18 53 97 93
− 32 634
“Perfusion alone” indicates whether CMR perfusion was abnormal; “LGE alone” indicates whether CMR LGE wasabnormal. CMR = cardiac magnetic resonance, MPS = myocardial perfusion SPECT, SP = stress perfusion,LGE = late gadolinium enhancement, RP = rest perfusion
ongoing research. In the present study, artifacts were presentin at least one segment in 68% of patients. The results of thisstudy suggest that the combination of rest and stress perfusionis useful in distinguishing artifacts from true perfusion defects.This finding is similar to that observed by Klem et al. (6), whofound that myocardial areas with reduced image intensities dur-ing stress and rest FP CMR, termed “matched” defects, withno evidence of LGE corresponded to nonobstructive coronaryarteries.
Utility of SP-RP-LGE CMR
When CMR was interpreted without RP, sensitivity was high(Table 3), but there was also high false positive rate. By com-bining stress-rest data and examining the qualitative change inmyocardial contrast uptake, specificity and overall agreementimproved compared to stress-only analysis. Quantitative assess-ment of CMR stress perfusion data may also improve imageinterpretation above that which may be possible using qualita-tive analyses (7–9, 12, 20).
Several studies have examined FP CMR at rest and dur-ing stress with comparison to cardiac catheterization (1–5,21). These studies demonstrate that other pulse sequences andmethodologies other than SSFP used in the present study havegood sensitivities and specificities in these patient populations.A few studies have also compared radionuclide stress perfusionto CMR for detection of CAD and have suggested favorableCMR sensitivities and specificities (4, 5).
The findings of the present study with regard to LGE versusresults obtained by MPS are of interest. While 4 (7%) patientshad a history of MI, LGE was positive in 14/45 (31%) of patients.Subendocardial infarction detectable by CMR may be missed byrest myocardial perfusion SPECT (22). Extending this observa-tion, our patient population demonstrated a strong relationshipbetween the presence of subendocardial scar by LGE-CMR andsegmental ischemia by MPS. Although testing algorithms incor-porating CMR in the diagnosis and management of CAD are stillevolving, our observation suggests that presence of subendocar-
dial scar could be a useful predictor of vulnerable myocardiumin patients at intermediate likelihood of disease.
The observed discordance between MPS and CMR perfu-sion on a segmental basis was largely due to disagreement innoninfarcted segments. In our study, 84/105 abnormal segmentsby SP-RP-LGE CMR had subendocardial scarring. In contrast,there were 32 segments judged abnormal by MPS (defined asresting score > 1) that had no evidence of LGE by CMR (de-fined as score = 0). Of these 32 segments without infarction (ie,LGE score = 0), only 4/32 also had first pass hypoperfusion bySP-RP-LGE CMR. Although the relationship between an areaof perfusion (or hypoperfusion) within the myocardium and theabsence (or presence) of infarction might seem straight forward,the present study suggested that LGE can occur in the settingof normal stress and rest MPS and that a majority of ischemicMPS studies have underlying subendocardial LGE.
Rest perfusion
Data from the present study suggest that RP aids in interpre-tation of SP-LGE by identifying artifacts. This finding followsthe historical progression of MPS in that MPS can be performedeither as a stress-only or as a rest-stress protocol (23–26). Inaddition to utility in interpretation of artifacts, rest MPS is use-ful for identification of resting ischemia (27). Similar to MPS,determination of resting myocardial perfusion may be possibleusing methods of quantitative CMR (12, 20).
Study limitations
The large number of artifacts observed in the stress perfu-sion images acquired in the present study employing the SSFPsequence and the 0.1 mmol/kg gadolinium dose with 5 mL/sinjection may have accounted for the conclusion that rest perfu-sion helps to distinguish these areas from true perfusion deficits.An alternative approach would be to develop newer sequenceswith reduced artifacts. Other more recently available CMR SPpulse sequences may have fewer artifacts and may be morereadily interpreted in the absence of rest perfusion imaging (6).
738 L. E. J. Thomson et al.

The conclusions stated in the present study apply to perfusionimaging using SSFP and a gadolinium dose of 0.1 mmol/kg.In addition, it is possible that residual gadolinium in the my-ocardium after the adenosine scan may have influenced theimage intensities observed on RP imaging and, thus, the re-sults of our study. A portion of our study population had noknown coronary artery disease (30/45 patients), was referredfor stress testing due to symptoms, and, thus, had an interme-diate pretest probability of CAD. We elected to compare CMRstress to MPS. While established for risk assessment, the ac-curacy of MPS for CAD detection is imperfect. Ideally, theresults of both CMR and MPS would have been compared tocardiac catheterization, but not all patients in our study under-went this procedure. We acquired only three short-axis slices byCMR so that all slices could be acquired every heartbeat dur-ing adenosine stress. Limited sampling of the left ventricle inthis manner potentially leads to incorrect assessment of the ex-tent of perfusion abnormalities. Also, the technique of scoringSP-LGE then SP-RP-LGE images did not allow for determina-tion of whether rest perfusion, by itself, may have allowed for de-termination of image artifacts. Similarly, the scoring of RP alongwith SP-LGE did not allow for blinded assessment of RP im-ages. In addition, changes in heart location, phase of the cardiaccycle acquired during perfusion versus LGE, and/or breath-holdposition may affect registration of images and, hence, results ofthe present study. Finally, the visual scoring system used waschosen to emulate clinical practice; quantitative methods mayimprove ischemia detection (12, 20).
CONCLUSION
The combination of stress-rest perfusion imaging in the CMRenvironment with infarct imaging by LGE improves identifica-tion and characterization of patients with suspected CAD. In thispatient population, RP aids in interpretation of SP-LGE CMR fordetermination of real versus artifactual perfusion defects duringadenosine stress studies.
ABBREVIATIONS
CAD Coronary artery diseaseCMR Cardiac magnetic resonanceLGE Late gadolinium enhancementFP First-passIV intravenousMPS Myocardial perfusion SPECTRP Rest perfusionSP Stress perfusionSSFP Steady-state free precession99mTc technetium-99-sestamibi201Tl thallium-201
REFERENCES1. Al-Saadi N, Nagel E, Gross M, Bornstedt A, Schnackenburg B,
Klein C, et al. Noninvasive detection of myocardial ischemia from
perfusion reserve based on cardiovascular magnetic resonance.Circulation 2000;101:1379–1383.
2. Paetsch I, Jahnke C, Wahl A, Gebker R, Neuss M, Fleck E, et al.Comparison of dobutamine stress magnetic resonance, adeno-sine stress magnetic resonance, and adenosine stress magneticresonance perfusion. Circulation 2004;110:835–842.
3. Nagel E, Klein C, Paetsch I, Hettwer S, Schnackenburg B,Wegscheider K, et al. Magnetic resonance perfusion measure-ments for the noninvasive detection of coronary artery disease.Circulation 2003;108:432–437.
4. Schwitter J, Nanz D, Kneifel S, Bertschinger K, Buchi M,Knusel PR, et al. Assessment of myocardial perfusion in coro-nary artery disease by magnetic resonance: a comparison withpositron emission tomography and coronary angiography. Circula-tion 2001;103:2230–2235.
5. Ishida N, Sakuma H, Motoyasu M, Okinaka T, Isaka N, Nakano T,et al. Noninfarcted myocardium: correlation between dynamic first-pass contrast-enhanced myocardial MR imaging and quantitativecoronary angiography. Radiology 2003;229:209–216.
6. Klem I, Heitner JF, Shah DJ, Sketch MH, Jr., Behar V, Weinsaft J,et al. Improved detection of coronary artery disease by stress per-fusion cardiovascular magnetic resonance with the use of delayedenhancement infarction imaging. J Am Coll Cardiol 2006;47:1630–1638.
7. Klocke FJ, Simonetti OP, Judd RM, Kim RJ, Harris KR, Hedjbeli S,et al. Limits of detection of regional differences in vasodilated flowin viable myocardium by first-pass magnetic resonance perfusionimaging. Circulation 2001;104:2412–2416.
8. Lee DC, Simonetti OP, Harris KR, Holly TA, Judd RM, Wu E, et al.Magnetic resonance versus radionuclide pharmacological stressperfusion imaging for flow-limiting stenoses of varying severity. Cir-culation 2004;110:58–65.
9. Christian TF, Rettmann DW, Aletras AH, Liao SL, Taylor JL,Balaban RS, et al. Absolute myocardial perfusion in caninesmeasured by using dual-bolus first-pass MR imaging. Radiology2004;232:677–684.
10. Bremerich J, Buser P, Bongartz G, Muller-Brand J, Gradel C,Pfisterer M, et al. Noninvasive stress testing of myocardial is-chemia: comparison of GRE-MRI perfusion and wall motion anal-ysis to 99 mTc-MIBI-SPECT, relation to coronary angiography. EurRadiol 1997;7:990–995.
11. Bertschinger KM, Nanz D, Buechi M, Luescher TF, Marincek B, vonSchulthess GK, et al. Magnetic resonance myocardial first-passperfusion imaging: parameter optimization for signal response andcardiac coverage. J Magn Reson Imaging 2001;14:556–562.
12. Giang TH, Nanz D, Coulden R, Friedrich M, Graves M, Al-Saadi N,et al. Detection of coronary artery disease by magnetic resonancemyocardial perfusion imaging with various contrast medium doses:first European multi-centre experience. Eur Heart J 2004;25:1657–1665.
13. Berman DS, Kiat H, Friedman JD, Wang FP, van Train K, MatzerL, et al. Separate acquisition rest thallium-201/stress technetium-99m sestamibi dual-isotope myocardial perfusion single-photonemission computed tomography: a clinical validation study. J AmColl Cardiol 1993;22:1455–1464.
14. Hachamovitch R, Berman DS, Kiat H, Cohen I, Lewin H, Amanul-lah A, et al. Incremental prognostic value of adenosine stress my-ocardial perfusion single-photon emission computed tomographyand impact on subsequent management in patients with or sus-pected of having myocardial ischemia. Am J Cardiol 1997;80:426–433.
15. Slomka PJ, Nishina H, Berman DS, Akincioglu C, Abidov A,Friedman JD, et al. Automated quantification of myocardial per-fusion SPECT using simplified normal limits. J Nucl Cardiol2005;12:66–77.
16. Berman DS, Abidov A, Kang X, Hayes SW, Friedman JD,Sciammarella MG, et al. Prognostic validation of a 17-segment
Stress-Rest Perfusion CMR vs. MPS 739

score derived from a 20-segment score for myocardial perfusionSPECT interpretation. J Nucl Cardiol 2004;11:414–423.
17. Kim RJ, Wu E, Rafael A, Chen EL, Parker MA, Simonetti O,et al. The use of contrast-enhanced magnetic resonance imag-ing to identify reversible myocardial dysfunction. N Engl J Med2000;343:1445–1453.
18. Jerosch-Herold M, Wilke N, Stillman AE. Magnetic reso-nance quantification of the myocardial perfusion reserve with aFermi function model for constrained deconvolution. Med Phys1998;25:73–84.
19. Wilke N, Jerosch-Herold M, Wang Y, Huang Y, Christensen BV,Stillman AE, et al. Myocardial perfusion reserve: assessmentwith multisection, quantitative, first-pass MR imaging. Radiology1997;204:373–384.
20. Muehling OM, Jerosch-Herold M, Panse P, Zenovich A, Wilson BV,Wilson RF, et al. Regional heterogeneity of myocardial perfusionin healthy human myocardium: assessment with magnetic reso-nance perfusion imaging. J Cardiovasc Magn Reson 2004;6:499–507.
21. Al-Saadi N, Nagel E, Gross M, Schnackenburg B, Paetsch I, KleinC, et al. Improvement of myocardial perfusion reserve early af-ter coronary intervention: assessment with cardiac magnetic res-onance imaging. J Am Coll Cardiol 2000;36:1557–1564.
22. Wagner A, Mahrholdt H, Holly TA, Elliott MD, Regenfus M, ParkerM, et al. Contrast-enhanced MRI and routine single photon emis-
sion computed tomography (SPECT) perfusion imaging for de-tection of subendocardial myocardial infarcts: an imaging study.Lancet 2003;361:374–379.
23. Santana CA, Garcia EV, Vansant JP, Krawczynska EG, Folks RD,Cooke CD, et al. Gated stress-only 99mTc myocardial perfusionSPECT imaging accurately assesses coronary artery disease.Nucl Med Commun 2003;24:241–249.
24. Amanullah AM, Berman DS, Hachamovitch R, Kiat H, KangX, Friedman JD. Identification of severe or extensive coronaryartery disease in women by adenosine technetium-99m sestamibiSPECT. Am J Cardiol 1997;80:132–137.
25. Zellweger MJ, Dubois EA, Lai S, Shaw LJ, Amanullah AM, LewinHC, et al. Risk stratification in patients with remote prior myocar-dial infarction using rest-stress myocardial perfusion SPECT: prog-nostic value and impact on referral to early catheterization. J NuclCardiol 2002;9:23–32.
26. Williams KA, Schuster RA, Williams KA, Jr., Schneider CM,Pokharna HK. Correct spatial normalization of myocardial per-fusion SPECT improves detection of multivessel coronary arterydisease. J Nucl Cardiol 2003;10:353–360.
27. Nagueh SF, Vaduganathan P, Ali N, Blaustein A, Verani MS,Winters WL, Jr., et al. Identification of hibernating myocardium:comparative accuracy of myocardial contrast echocardiogra-phy, rest-redistribution thallium-201 tomography and dobutamineechocardiography. J Am Coll Cardiol 1997;29:985–993.
740 L. E. J. Thomson et al.