issn 1618-2642, volume 397, number 4
TRANSCRIPT

This article was published in the above mentioned Springer issue.The material, including all portions thereof, is protected by copyright;all rights are held exclusively by Springer Science + Business Media.
The material is for personal use only;commercial use is not permitted.
Unauthorized reproduction, transfer and/or usemay be a violation of criminal as well as civil law.
ISSN 1618-2642, Volume 397, Number 4

ORIGINAL PAPER
Detection of chemical agents in the atmosphere by open-pathFT-IR spectroscopy under conditions of backgroundinterference: II. Fog and rain
Limin Shao & Christopher W. Roske & Peter R. Griffiths
Received: 7 October 2009 /Revised: 22 February 2010 /Accepted: 25 March 2010 /Published online: 23 April 2010# Springer-Verlag 2010
Abstract Open-path FT-IR spectra of low-concentrationreleases of diethyl ether were measured both when a glycolfog was passed into the infrared beam and when large waterdroplets from a lawn sprinkler were sprayed into the beam.It was shown that the glycol fog, for which the droplet sizewas much less than the wavelength of the infraredradiation, gave rise to a significant interference such thatpartial least squares (PLS) regression would only yieldreasonable values for the ether concentration if backgroundspectra in which the glycol fog was present were includedin the calibration set. On the other hand, target factoranalysis (TFA) allowed the presence of the ether to berecognized without precalibration. When large water drop-lets were present in the beam, any infrared radiationentering the droplet was completely absorbed, so that bothPLS and TFA would yield accurate results.
Keywords Open-path FT-IR spectrometry . Fog . Rain .
Diethyl ether . Target factor analysis . PLS regression
Introduction
In the first paper in this series [1], we showed how targetfactor analysis could be used to detect the presence of achemical warfare agent simulant, diethyl ether, even when
fireworks were set off in the beam path giving rise to asevere high-frequency interference. In this paper, we reportthe results of analogous experiments that were made when aglycol fog (which has strong absorption bands at approx-imately the same wavelength as the diethyl ether analyte)was allowed to drift into the infrared beam. Previousworkers have demonstrated that fogs of condensed atmo-spheric water vapor both scatter and distort the spectrumand that a different background spectrum should be usedwhen open-path (OP) FT-IR spectra are measured underfoggy conditions and processed using classical least squaresregression [2, 3]. In this paper, we report that similar dataprocessing techniques to those used in our previous paper[1] can be used to detect the analyte when open-path OP/FT-IR spectra are readily measured through a foggyatmosphere. We also report the result when OP/FT-IRspectra are measured under simulated rainy conditions,where the size of the water droplets is much greater than thesize of the aerosol fog.
Experimental
The instrument that was used for these measurements wasthe same as the one used for our previous work, although thelocation was different. A small volume of liquid diethyl etherin a Petri dish was either mounted immediately beneath theIR beam or removed, so that the release of the analyte intothe beam was controlled. A light cross wind was blowingwhen these measurements were being taken so that theconcentration of the analyte varied significantly from 1 minto the next.
Since it was not possible to achieve a uniformdistribution of glycol fog or water droplets from thesprinkler throughout the entire beam, we set up our
L. ShaoDepartment of Chemistry,University of Science and Technology of China,Hefei, Anhui 230026, China
C. W. Roske : P. R. Griffiths (*)Department of Chemistry, University of Idaho,Moscow, ID 83844-2343, USAe-mail: [email protected]
Anal Bioanal Chem (2010) 397:1521–1528DOI 10.1007/s00216-010-3691-y
Author's personal copy

equipment with a fairly short path (about 30 m from thetelescope to the retroreflector for a “round-trip” pathlengthof 60 m) and allowed the fog to drift into the infrared beam,as shown in Fig. 1. The glycol fog was produced byspraying a mixture of triethylene glycol, propylene glycol,1,3-butylene glycol and water (Rosco Clear Fog Fluid,Rosco Laboratories, Inc., Stamford, CT) from a RoscoModel 1700 smoke machine. After measurements involvingthe glycol fog were completed, we set up a lawn sprinklerthat sprayed fairly large water droplets into the beam.
The timing of the releases of diethyl ether, the glycol fogand the spray of water droplets is summarized in the lowerpart of Fig. 2. The first fog release was from measurement#217 to #370; the second release was from measurement#422 to #526. For measurement #597 to #772, a lawnsprinkler was mounted immediately beneath the IR beam sothat water droplets were sprayed into the IR beam, albeitover a shorter pathlength than would be encountered duringa rainstorm. The analyte, diethyl ether, was released twice,first from measurement #104 to #370 and then frommeasurement #673 to #772. A contour plot of theabsorbance spectra that were measured during this exper-iment is shown in the upper part of Fig. 2. Spectra wereonly analyzed in the atmospheric window from 1,250 to888 cm−1.
Seven data sets were constructed to evaluate thedetection of diethyl ether in the presence of a glycol fogor water spray as shown in Table 1.
Results and discussion
Overview of the data
Single-beam spectra were measured over the 60-m path andratioed against a spectrum measured with the retroreflectorlocated very close to the telescope. All interferograms werecorrected to compensate for the non-linear response of theMCT detector [4]. The baseline was found to be very close
to zero absorbance units, demonstrating that, for therelatively short (60 m total) pathlength used in thisexperiment, essentially all the light that leaves the telescopehits the retroreflector and is returned to the telescope.Representative examples of the absorbance spectra mea-sured during this experiment are shown in Figs. 3 and 4.
A Petri dish was placed under the beam and a smallvolume of diethyl ether was poured into it between themeasurement of Spectra 103 and 105. Figure 3a showsSpectra 103 and 104 and Fig. 3b shows the differencebetween these two spectra. Even though the relativehumidity in northern Idaho is very low at the time of yearwhen these measurements were taken, weak lines in thevibration–rotation spectrum of water vapor dominate muchof the spectrum in the region being studied. The path-integrated concentration of ether in the spectrum shown inFig. 3 was calculated to be 4 ppm m, corresponding to anaverage concentration over the entire beam of about 67 ppb.The concentration of ether in the atmosphere during theacquisition of Spectrum 105 was far higher than for anyother spectrum measured in Data Sets #2, #3, or #7,presumably because of ether that evaporated into the airwhile it was being poured into the Petri dish. For all othermeasurements in which the Petri dish of ether was locatedunder the beam, the concentration is known to be less than100 ppb. Thus the signal-to-noise ratio (SNR) at the peak ofthe strongest band in the ether spectra for Spectra 107–200is always low and is often less than one.
The spectra measured by ratioing a long path (60 m“round trip”) spectrum to a short path spectrum in theabsence and presence of the glycol fog are shown in Fig. 4aand b, respectively. For the spectrum shown in Fig. 4a, afew weak lines due to atmospheric water vapor of the sameintensity as those in Fig. 3 are seen. The intense broadbands between 1,200 cm−1 to 1,000 cm−1 in Fig. 4b are dueto absorption by the glycol droplets present in the IR beam.The result of subtracting the spectrum shown in Fig. 4afrom the one shown in Fig. 4b is shown in blue in Fig. 5.The difference spectrum is similar, but not identical, to the
Retroreflector Telescope Interferometer Petri Dish HolderFig. 1 (Left) The instrumentset-up. (Right) Passing the gly-col fog into the beam
1522 L. Shao et al. Author's personal copy

reference spectrum of liquid ethylene glycol, which isshown in red in Fig. 5. This result is not surprising since thefog is composed of a mixture of three glycols (see above) ofdiffering volatility. Because one component may be morevolatile than the others, the relative concentration of eachconstituent may vary on release of the fog. Despite the factthat the glycol fog was opaque to visible light, the spectralbaseline is only shifted to about 0.02 absorbance units(AU), demonstrating that minimal scattering occurred atinfrared wavelengths. The fact that the spectrum is notdistorted by the Christiansen effect shows that the diameterof the glycol droplets is significantly less than thewavelength [5].
Partial least squares regression
The presence of diethyl ether in the beam was detectedthrough the application of partial least squares (PLS)regression, using the same approach that we describedpreviously [1, 6]. Two years before the spectra reported inthis paper were measured, 54 background spectra weremeasured over a nine-month period in pristine air overpathlengths from 50 to 500 m and under conditions suchthat the temperature and relative humidity of the atmo-
sphere varied over as wide a range as possible. Each ofthese background spectra was ratioed against a short-pathlength background in the way described above, andconverted to absorbance. In this way, we obtained a seriesof spectra of the atmosphere in which the absoluteintensities of the lines in the rotation-vibration spectrumof water vapor varied greatly because of the range ofpathlengths covered. In addition, because these backgroundspectra were measured throughout the year so that thetemperature varied by over 30 °C, the relative intensities ofthe lines in the vibration–rotation spectrum of water vaporalso showed small but significant variations. Furthermore,because the spectra were measured over total pathlengths aslong as 500 m, the baseline of these spectra also showedconsiderable variation. To each of these background spectraa reference spectrum of diethyl ether was added, and thepath-integrated concentration of the ether was calculatedfrom the factor by which each spectrum was scaled. Thisset of spectra was used as Calibration Set #1 for the PLSregression.
When the concentration of ether in the atmospherewithin the IR beam was calculated using Calibration Set#1, the results shown in the upper trace of Fig. 6 wereobtained. Neglecting Spectra #104–106 (when the Petridish was being filled), the average concentration of diethylether in Data Set #2 was 54 ppb. The concentrationcalculated for Spectra 107–200 varied considerably becauseof changes in the wind speed while the spectral data werebeing acquired.
For Data Set #3, when the glycol fog was present in thebeam, it can be seen that the concentration of diethyl ethercalculated using Calibration Set #1 increased to 0.15 ppm(see Fig. 6a). Because the Petri dish of ether was not movedbetween the acquisition of Data Sets 2 and 3, the averageconcentration of ether should have remained at approxi-mately the same level before the glycol fog was released,
Glycol Fog Glycol Fog Water Spray
No etherNo ether Ether Ether
Fig. 2 Contour plot of 772 OP/FT-IR absorbance spectra from1,250 to 888 cm−1 arranged inorder of time. The lower axesindicate the controls of the gly-col fog and water spray and therelease of diethyl ether. Notethat the absorbance of the fogwas far greater than that of theanalyte, the strongest band ofwhich was at ∼1,014 cm−1
Table 1 Data sets investigated in this project
Data Set Interference Diethyl ether
#1 (1 to 103) None NO
#2 (104 to 200) None YES
#3 (217 to 370) Glycol fog YES
#4 (422 to 526) Glycol fog NO
#5 (527 to 597) None NO
#6 (598 to 672) Water spray NO
#7 (673 to 772) Water spray YES
Detection of chemical agents in the atmosphere 1523 Author's personal copy

whereas the average calculated concentration increased by afactor of three. Obviously there is significant interference bythe C–O stretching bands of the three glycols, each of whichabsorbs at a similar wavenumber to the corresponding bandof diethyl ether.
When the calibration set was augmented with spectrameasured with Spectra #422–526 that were measured in thepresence of the glycol fog but with no ether in the beam(Calibration Set #2), the results were much closer to whatwas expected, as shown in Fig. 6b. We had no way ofconfirming whether these results were accurate but the factthat maximum concentration and standard deviation of thecalculated concentrations were approximately the same forData Sets #2 and #3 lends credence to the validity of theresults for Data Set #3. The clear lesson to be learned fromthis result is well known to practitioners of PLS, namelythat all sources of variance must be included in thecalibration data. This result also demonstrates the difficultyin developing a good calibration set for atmosphericanalysis under conditions of background clutter. Our work
was funded by the US Army’s Edgewood ChemicalBiological Center with the ultimate goal of developing atechnique for detecting the onset of chemical agents underconditions of “battlefield clutter”. Since the atmosphere inthe battlefield can contain many different unmodeledcomponents, it is clear that PLS regression will not beapplicable under these conditions.
The spectra measured when the sprinkler was turned on(Data Set #7) were calculated using three differentcalibration sets. The first two were the same as the onesused to calculate the results shown in Fig. 6. The variationof the concentration of ether with time that was predictedusing calibration sets #1 and 2 is shown in green and red,respectively. The results were very close, which suggeststhat the effect of the increased humidity in the beam whilethe sprinkler was turned on was negligible, presumablybecause the training set contained many spectra measuredat long (>100 m) pathlength such that the amount of watervapor in the beam was high. When calibration set #2 wasused to predict the ether concentration of Data Sets #6 and
BA
Fig. 3 a Spectra 103 and 104; the region in which ether absorbs is highlighted. b The difference between Spectra 104 and 103 is shown in blue;the reference spectrum of diethyl ether at a path-integrated concentration of 4 ppm m is shown in red
Fig. 4 Absorbance spectra measured by ratioing a long path (60 m) spectrum to a short path spectrum a in the absence and b in the presence ofthe glycol fog
1524 L. Shao et al. Author's personal copy

7, the only effect that was seen was a small shift in thebaseline towards zero. This result suggests that theaugmentation of calibration set #1, which had beenmeasured 2 years before these measurements, by spectrathat had been measured within a few minutes of the timethat the sprinkler was turned on slightly improved theaccuracy. When some of the spectra in Data Set #6 wereadded to the calibration set spectra, no change in the resultwas observed for Data Set #7 (see blue trace in Fig. 7.)
The main cause of the difference between the effect ofthe glycol fog and the water sprinkler is the size of thedroplets. For many compounds, a film that is about 10 μmin diameter will yield a spectrum for which the strongestband has an absorbance of 1 AU. Thus, if the droplets aremuch less than 10 μm in diameter (as they are for theglycol fog), infrared radiation that enters the droplet willnot be completely absorbed even at the wavelengths wherethe absorptivity is high. For the drops produced by the
water sprinkler, which were several millimeters in diameter,infrared radiation that enters the drop will be completelyabsorbed and will not contribute to the signal that ismeasured at the MCT detector. Thus, the only effect thatwould be expected on turning on the sprinkler would be ashift in the spectral baseline, as shown in Fig. 8. OP/FT-IRmeasurements through foggy and smoky atmospheres are,therefore, much more difficult than measurements madeduring a rain storm.
Target factor analysis
An alternative technique for detecting the presence of agiven compound under conditions of background clutter istarget factor analysis (TFA) [7]. A detailed discussion ofTFA and its application to OP/FT-IR spectroscopy may befound in Refs. [6] and [7]. Suffice it to say at this point, thatin TFA, a principal components analysis is carried out on a
Fig. 5 (Blue) Difference be-tween the spectra shown inFig. 4a and b. (Red) Referencespectrum of ethylene glycol(after scaling)
Fig. 6 Concentration of diethylether in the 772 OP/FT-IRmeasurements processed by PLSusing a calibration set #1 and bcalibration set #2. The timeswhen the glycol fog (red) andthe water sprinkler were turnedon (aqua) are shown below asthe upper horizontal bar, alongwith the times that diethyl etherwas absent (green) or present(red) in the beam
Detection of chemical agents in the atmosphere 1525 Author's personal copy

data set and the presence of the target molecule is detectedby rotating the eigenvectors in order to match one to thespectrum of the target molecule in a least squares manner.We have found that the best way of matching the result ofTFA to the spectrum of the target molecule (diethyl ether inthis case) is to calculate the weighted correlation coefficient(wcc) between the eigenvectors and the reference spectrumof the target [8]. The weighted correlation coefficient issimilar to the conventional correlation coefficient exceptthat larger weights are assigned to those wavelengths thathave relatively high absorbance in the reference spectrum.The similarity of the calculated target spectrum and thereference spectrum of diethyl ether is estimated by thecalculated value of wcc: the target molecule is deemed to beabsent if wcc <0.90 and present if wcc >0.90 [9, 10].
The result of target factor analysis of the first four datasets is shown in Fig. 9, along with the wcc value in eachcase. The first two results are not surprising, as ether isclearly shown to be absent for data set #1 and present fordata set #2. It is interesting to look at the result of
performing TFA for the first 103 spectra and then for thefirst 104 spectra, i.e., including just one spectrum in thedata set in which ether is known to be present at a fairlyhigh concentration. This result is shown in Fig. 10. In theabsence of any spectrum measured when diethyl ether ispresent in the beam wcc=0.82. Using the criterion used inour previous report [9], i.e., that the target molecule isabsent if wcc <0.90 and present if wcc >0.90, we canclearly conclude that diethyl ether is present below thedetection limit in all spectra up to #103. As we have notedin a recent paper, TFA is effective when the concentrationof the analyte changes. Thus, when we included spectrum#104 in the data matrix and then performed TFA, diethylether was found unequivocally (wcc=0.99).
The result for data set #3 shown in Fig. 9c demonstratesthe feasibility of applying TFA even when an interferentthat absorbs in a similar wavenumber range is present in theinfrared beam and illustrates the power of this type of dataprocessing. Finally, the result for data set #4 suggests thepresence of trace amounts of ether in the beam in the
Fig. 7 Concentration of diethylether calculated from Data Set#6 (Spectra 592 to 672) and #7(spectra 672 to 772.) using(green) calibration set #1, (red)calibration set #2 (calibration set#1 augmented with some spectrafrom Data Set #4) and (blue)calibration set #3 (calibration set#1 augmented with a few spec-tra from Data Set #6)
Fig. 8 a Spectrum of the atmosphere measured before the sprinkler was turned on; b corresponding spectrum after the sprinkler was turned on.The main difference is a simple shift in the baseline
1526 L. Shao et al. Author's personal copy
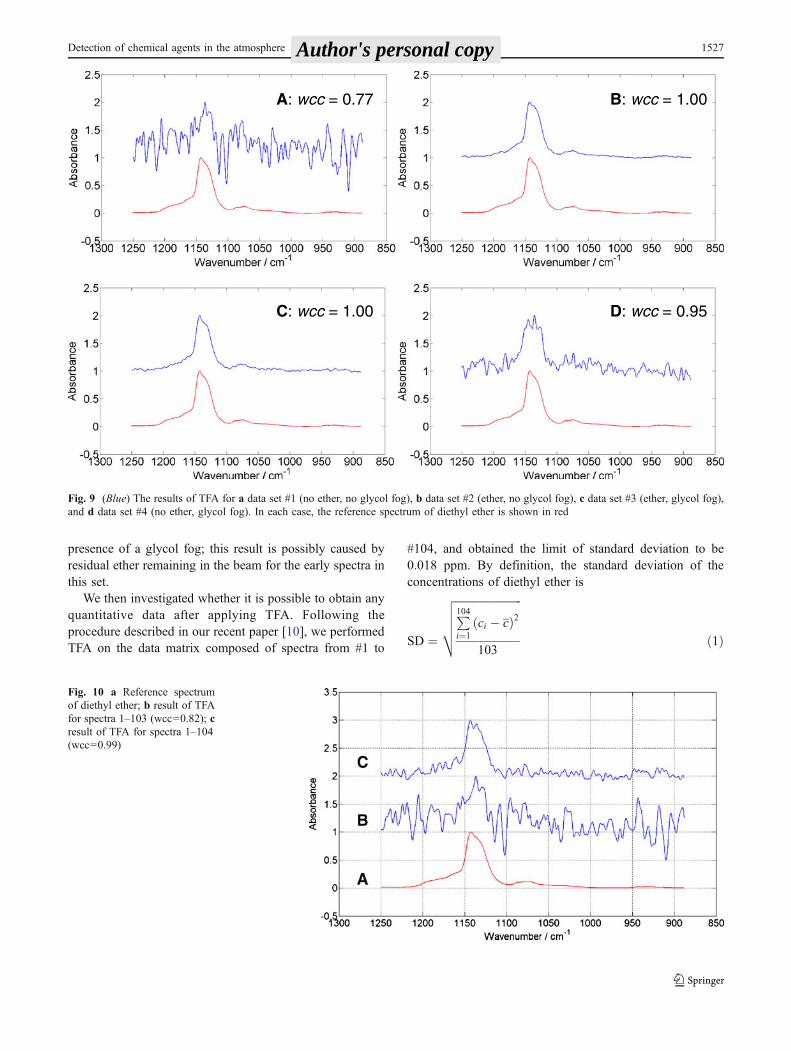
presence of a glycol fog; this result is possibly caused byresidual ether remaining in the beam for the early spectra inthis set.
We then investigated whether it is possible to obtain anyquantitative data after applying TFA. Following theprocedure described in our recent paper [10], we performedTFA on the data matrix composed of spectra from #1 to
#104, and obtained the limit of standard deviation to be0.018 ppm. By definition, the standard deviation of theconcentrations of diethyl ether is
SD ¼
ffiffiffiffiffiffiffiffiffiffiffiffiffiffiffiffiffiffiffiffiffiffiffiffi
P
104
i¼1ci � cð Þ2
103
v
u
u
u
t
ð1Þ
A: wcc = 0.77 B: wcc = 1.00
C: wcc = 1.00 D: wcc = 0.95
Fig. 9 (Blue) The results of TFA for a data set #1 (no ether, no glycol fog), b data set #2 (ether, no glycol fog), c data set #3 (ether, glycol fog),and d data set #4 (no ether, glycol fog). In each case, the reference spectrum of diethyl ether is shown in red
Fig. 10 a Reference spectrumof diethyl ether; b result of TFAfor spectra 1–103 (wcc=0.82); cresult of TFA for spectra 1–104(wcc=0.99)
Detection of chemical agents in the atmosphere 1527 Author's personal copy

Since ci � cð Þ ¼ 0 for all spectra from i=1 to 103, thestandard deviation is SD ¼ c104=
ffiffiffiffiffiffiffiffi
103p
. Since the upperlimit of SD is 0.018 ppm, the upper limit of c104 should be0:018� ffiffiffiffiffiffiffiffi
103p ¼ 0:18 ppm. Earlier, we estimated c104 to be
0.066 ppm. Since the estimated concentration is lower thanthe upper limit, the theory developed in Ref. [10] isvalidated, and we are able to obtain not only the upperlimit of standard deviation of the concentration distribution,but also the upper limit of the concentration.
Conclusions
The results obtained in this study show that even thoughpartial least squares regression is a powerful technique fordetecting the presence of components in OP/FT-IR spectra,it fails when unmodeled constituents are present in theinfrared beam. One of the strengths of PLS is that theconcentration of the analyte can be obtained for eachindividual spectrum within a second of the end of the dataacquisition, even when the SNR of the strongest band in thespectrum is less than unity. When unmodeled interferentsare present in the beam, however, PLS can give grosslyerroneous predictions. In this case, target factor analysis candetect the presence of the analyte from a single scan,although a somewhat higher SNR is required than is needed
for PLS. When the target is present at very low concentra-tion, it may be necessary to include several spectra in thedata matrix used for TFA [9, 10].
Acknowledgment This workwas funded by contractW91ZLK08P0739from the Edgewood Chemical Biological Center (ECBC), EdgewoodArsenal, U.S. Army and by the National Natural Science Foundation inChina (Grant No. 20705032.)
References
1. Shao L, Roske CW, Griffiths PR (2010) Anal Bioanal Chem, inpress
2. Lamp T, Flöth T, Weber K, Weidermann J, van Haren G (1995)Proc. Air and Waste Management Assn. 88th Annual Meeting andExhibition, A&WMA Pittsburgh, PA, Paper No. 95-WP73B.01
3. European Standard EN 15483 (2008) Ambient air quality—atmospheric measurements near ground with FTIR spectroscopy.European Committee for Standardization, Brussels
4. Shao L, Griffiths PR (2008) Anal Chem 80:5219–52245. Pollard MJ, Griffiths PR, Nishikida K (2007) Appl Spectrosc
61:860–8666. Griffiths PR, Shao L, Leytem AB (2009) Anal Bioanal Chem
393:45–517. Malinowski ER (2002) Factor analysis in chemistry, 3rd edn.
Wiley, New York8. Griffiths PR, Shao L (2009) Appl Spectrosc 63:916–9199. Shao L, Griffiths PR (2007) Anal Chem 79:2118–2124
10. Shao L, Griffiths PR (2010) Anal Chem 82:106–114
1528 L. Shao et al. Author's personal copy