issn 1813-1905 (print) issn 2312-1017 (online)ymj.mednauka.com/files/ymj-3-2019-en.pdf · of...
TRANSCRIPT

3(67) `2019ЯКУТСКИЙ МЕДИЦИНСКИЙ ЖУРНАЛ
ISSN 1813-1905 (print)
The founderThe Yakut Science Centre
of Complex Medical Problems
Editor- in- chiefRomanova A.N., MD
Editorial Board:Deputy Chief Editor
and Executive secretaryNikolaev V.P., MD
Scientific editorPlatonov F.A. MD
Editorial Council:Aftanas L.I., MD, Professor,acad. RAMS (Novosibirsk)
Voevoda M.I., MD, Professor,Corresponding Member RAMS (Novosibirsk)
Ivanov P.M., MD, Professor (Yakutsk)Kryubezi Eric, MD, Professor (France)
Maksimova N.R., MD (Yakutsk)Mironova G.E., Doctor of Biology,
Professor (Yakutsk)Mikhailova E.I., Doctor of Pedagogics,
Professor (Yakutsk)Nikitin Yu.P., MD, Professor,
Acad. RAMS (Novosibirsk)Odland John, MD, Professor (Norway)
Puzyrev V.P., MD, Professor,Acad. RAMS (Tomsk)
Reutio Arya, MD, PhD, Professor (Finland)Fedorova S.A., Doctor of Biology (Yakutsk)
Husebek Anne, MD, Professor (Norway)Khusnutdinova E.K., Doctor of Biology,
Professor (Ufa)
Editors:Chuvashova I.I.,
Kononova S.l.Semenova T.F. (English)
Computer designSannikova M.I. (English)
Address:Sergelyakhskoe Highway, 4, Yakutsk Republic
Sakha (Yakutia) Russian Federation 677019Fax: +7 (4112) 32-19-81;
Phone: +7 (4112) [email protected]
e-mail: [email protected]: // www.ymj.mednauka.com
The articles are givenin the authors’ translation
© YSC CMP, 2019
YAKUTMEDICALJOURNALSCIENTIFIC - PRACTICAL JOURNALOF THE YAKUT SCIENCE CENTRE OF COMPLEXMEDICAL PROBLEMS
Quarterly
Registered by the Office of the Federal Service onsupervision in the field of communications, informationtechnologies and mass communications in the RepublicSakha (Yakutia) December 13/2016
Registration number PI No.ТU 14-00475
Subscription index: 78781Free price
«Yakut Medical Journal» is included in the approved bythe Higher Attestation Commission of the RussianFederation List of leading peer-reviewed scientificjournals and publications, in which the main scientificresults of dissertations for the acquisition of scientificdegrees of Doctor and Candidate of science onbiological sciences and medicine should be published.
The journal is included in the international directorysystem under periodic and proceeding editions “Ulrich’sInternational Periodicals Directory”
ISSN 2312-1017 (online)

ЯКУТСКИЙ МЕДИЦИНСКИЙ ЖУРНАЛ2
CONTENTS
Editor-in-Chief column
Editorial
Romanova A.N., Klimova T.M., Egorova A.G., Kuzmina A.A., Malogulova I.S., Arkhipova N.S.Prevalence and treatment of arterial hypertension in the native rural population of Yakutia
Original researches
Ammosova E.P., Klimova T.M., Sivtseva T.M., Fedorov A.I.,Baltakhinova M.E., Zakharova R.N.Lipoprotein lipase gene polymorphism rs320 and metabolic syndrome in native people of YakutiaDyakonova A.T., Kurtanov Kh.A., Pavlova N.I., Solovyova N.A.,Filippova N.P., Aleksandrova T.N.Determination of HLA alleles using single nucleotide polymorphism of rs3104413 HLA-DQA1 gene among patients with type 1 diabetes of the RS (Ya)Sofronova S.I., Romanova A.N., Kirillina M.P.Correlation of the M235T polymorphism of the AGT gene with arterial hypertension and its risk factors in the indigenous people of the arctic territory of YakutiaKit O.I., Bazaev A.L., Zlatnik E.Yu., Novikova I.A., Ulianova E.P.,Shulgina O.G., Sagakyants A.B., Kolesnikov E.N., Trifanov V.S., Mezentsev S.S., Snezhko A.V., Katsieva T.B.Expression of some molecular and biological markers in different periods of progression after radical surgical treatmentof esophageal cancerPopovich A.A., Trifonova E.A., Bocharova A.V., Vagaitseva K.V., Maksimova N.R., Stepanov V.A. Genetic diversity in Yakut population by loci associated with body mass index and obesityKim L.B., Osipova L.P., Rozumenko A.A., Putyatina A.N.,Russkikh G.S., Kozaruk T.V., Voronina N.P. Lipid spectrum features and relationship between specific classes of lipids and sex hormone levelsin Asian North menNelunova T.I., Burtseva T.E., Postoev V.A., Chasnyk V.G.,Slobodchikova M.P.Patent ductus arteriosus association with the congenital heart diseasein the newbornsof the RS (Ya)
Diagnostic and treatment methods
Anikin S.V., Yanovoy V.V., Khodus S.V.The risk stratification of the venous thromboembolic complicationsin oncocoloproctologyAleksandrova T.N., Mulina I.I., Yadrikhinskaya V.N., Solovieva I.E., Terekhova L.D., Pavlova N.I., Kurtanov Kh.A.Clinical and epidemiological aspects of chronic myeloproliferative diseases in the RS (Ya)Kirillina M.P., Kononova I.V., Sofronova S.I.,Ivanova A.K., Lushnikova E.L.The incidence of dysplastic changes in cervix uteri among women of different age groups Semyonova E.I., Olesova L.D., Yefremova A.V., Okhlopkova E.D., Konstantinova L.I., Yakovleva A.I., Romanova A.N.,Sofronova S.I., Egorova A.G.
6
9
13
16
20
23
26
30
32
34
37
40

3’ 2019 3
The structured spot of blood pressure from the perspective of the golden ratio proportionOkhlopkova E.D., Konstantinova L.I., Olesova L.D.,Semenova E.I., Yakovleva A.I., Mironova G.E.Study of the lactate level in the blood serumof athletes training in the conditions of the Far NorthKononova S.K., Barashkov N.A., Pshennikova V.G.,Sidorova O.G., Davydova T.K., Sofronova S.I., Romanova A.N.,Khusnutdinova E.K., Fedorova S.A. DNA diagnostics in clinical practice appliedto translational medicine
Healthy lifestyle. Prevention
Starostina L.D.Comparative analysis of health-saving behaviourof students of comprehensive schoolsand university in YakutskLatyshevskaya N.I., Mikhalchenko V.F., Yatsyshena T.L., Davydenko L.A., Shestopalova E.L.Regional characteristics of permanent teeth eruption in Volgograd schoolchildrenIvanova O.N.Recurrent stomatitis in children
Hygiene, sanitation, epidemiologyand medical ecology
Pavlov N.G., Alekseeva G.I., Vinokurova M.K.Ermolaeva E.I., Chernykh M.V.Comprehensive indicative analysis of the performanceand quality of acid-fast bacteria detectionby primary care facilitiesin the RS (Ya)
Actual topic
Klimova T.M., Egorova A.G., Zakharova R.N., Ammosova E.P., Baltakhinova M.E., Fedorov A.I., Romanova A.N.Metabolic syndromeamong Yakutia’s indigenous female populationNikitina M.A., Zhukova N.G., Bragina E.Yu., Alifirova V.M., Zhukova I.A., Gomboeva D.E., Brazovskaya N.G., Izhboldina O.P.,Zhalsanova I.Zh.The heterogeneity of non-motor symptoms in patients with Parkinson’s disease in Tomsk regionEpanov V.V., Borisova A.P., Epanova A.A., Palshin G.A.Age-related dynamics of bone mineral density in the adult population of YakutskGarmaeva D.K., Alexeev A.A., Zakharova I.S., Popova T.I.,Arsakova V.A.Analysis of gallstone disease risk factors using samples from patients after cholecystectomyat Republic hospital №1 -NCM surgical ward (Yakutsk)Alekseeva Z.N., Arkhipova N.S., Tatarinova O.V.,Sleptsov S.S., Efremova S.D.The gender features of manifestations of frailty,emotional conditionand life quality of long-livers in Yakutsk
45
47
51
54
57
59
62
65
70
73
76

ЯКУТСКИЙ МЕДИЦИНСКИЙ ЖУРНАЛ4
Arctic medicine
Vorontsova E.V., Vorontsov A.L.Environmental state and human health in the Arctic zone: medical and socio-legal aspectNovitskaya V.P., Prakhin E.I.Influence of additional vitaminization of schoolchildren rationsin the Arctic on variability of morphofunctionalparameters of the immune systemKolomeichuk S.N., Morozov A.V., Petrashova D.A.,Pozharskaya V.V., Stafeeva E.B., Vinogradova I.A.,Bochkarev M.V., Tarasov B.A.Daytime sleepiness and sleep parameters in children living in the European North of Russia
Scientific reviews and lectures
Boyko E.R., Kaneva A.M.Indices of lipid metabolism for the early diagnosis of cardiovascular disease in residents of the NorthMoskalenko O.L., Smirnova O.V., Kasparov E.V.Obesity in various ethnic populationsChamsutdinov N.U., Huseynov A.A., Abdulmanapova D.N.Endocrine mechanisms of bronchial control in patients with bronchial asthma
Point of view
Shcheglov B.O., Galkina I.V., Shcheglova S.N., Shchelkanov M.Yu. Effectiveness of 3d-modelling laboratory implementation into therapeutic and diagnostic medical institutionsKudrina P.I., Sofronova S.I., Tatarinova O.V.Ethnic and age-related characteristics of neurological symptoms and functional state of the kidneys in elderlyand senile age people of YakutiaGouriev I.P.Distribution of carriers of “Indo-European” haplotypes of HLA system on the territory of Eurasia
Clinical case
Shevchenko A.A., Kashkarov E.A., Zhila N.G., Koshevoy A.V.Clinical case of successful application of reosteosynthesissternum in chronic postoperativesternomediastinitis
Experience exchange
Ivanov V.A., Bolshev K.N., Alekseev R.Z., Andreev A.S. Determination of the thermal characteristics of the material of the insulating sheathfor the treatmentof cold injuriesSaleev R.A., Abdrashitova A.B.Comparative analysisof maxillofacial area diseases,which led to temporary disability in dentalmedical organizationsSavvina M.S., Evseeva S.A., Nelunova T.I., Burtseva T. Е.,Slobodchikova M.P.Risk factors influencing the persistenceof patent ductus arteriosus in neonateswith CHD in the RS (Ya)
80
85
88
90
9497
102
104
107
111
113
115
118

3’ 2019 5
September has come. Autumn time. The work of the editorial board of the “Yakut Medical Journal” is a continuous cycle. The journal should be published quarterly on an approved schedule re-gardless of vacation period, long holi-days and vacation days. No doubt, the editorial staff rests, goes on vacation, but this does not violate the work of
the established mechanism, the result of which is the next issue. Here comes the third issue of the “Yakut Medical Journal”.
In 2018-2019 the portfolio of materials submitted for publication in the “Yakut Medical Journal” is quite complete. The geography of the authors is wide. The subjects are diverse. Among the authors there are graduate students, applicants for academic degrees, the materials of which are accepted for publication in the first instance.
“Yakut Medical Journal” is a multidis-ciplinary publication. The editorial board adheres to the editorial policy developed in accordance with the Charter of the publication. One of the main principles of the journal’s editorial policy is the princi-ple of strict observance in each issue of its scientific profile. These are molecular genetics and biochemistry, cardiology, pediatrics, oncology, neurology. Materials on these topics are given priority in the publication.
The “Yakut Medical Journal” was es-tablished to more fully cover a wide range of health problems, prevention, revealing and treatment of widespread diseases of the Republic Sakha (Yakutia) population. Besides, its tasks surely include promot-ing the achievements of medical science and medical education not only in the republic, but also in the Russian Feder-ation and the entire world community. Therefore, the "Yakut Medical Journal" is not limited to the publication of materi-als only in its scientific profile. Until now, the journal has had enough space for the publication of a wide range of scientific problems; it exists today, and will contin-ue to be so.
I wish you, our authors, good health, success in research activities, inter-esting publications! And we thank our users for being with us, we are glad that papers of our journal are interest-ing for you!
See you in the next issues of our “Ya-kut Medical Journal”!
КОЛОНКА ГЛАВНОГО РЕДАКТОРА
Dear Colleagues!
Editor-in-chief Anna Romanova

ЯКУТСКИЙ МЕДИЦИНСКИЙ ЖУРНАЛ6
Introduction. Arterial hypertension is a major risk factor for coronary heart disease, chronic renal failure, cerebral stroke and other cardiovascular diseas-es. According to WHO, in 2015, 22% of the world’s population aged 18 years and older had elevated blood pressure [8]. While in high-income countries there is currently a decrease in the prevalence of AH, in low- and middle-income countries the number of AH patients continues to increase. This is caused not only by the aging of the population but also by the presence of such risk factors as over-weight or obesity, decreased physical ac-tivity, stress, environmental degradation, etc.
In the Russian Federation, according to the multicenter study called Epide-miology of Cardiovascular Diseases in Various Regions of Russia (ECCD), the prevalence of hypertension among the population of 25–64 years old was 44%. The study showed variability in the preva-lence rate depending on the region of the participant (from 37.8 to 56.1%) [1].
Sakha (Yakutia) Republic is the larg-est subject of the Russian Federation, characterized by unfavorable climatic conditions for living and working people. For the period from 2004 to 2018, the prevalence of diseases associated with high blood pressure increased among the adult population of the Republic from 65.0 to 108.4 per 1000 population [2, 5]. At the same time, official statistics proba-bly do not fully reflect the entire situation. Additional research may help to make adjustments to ongoing prevention pro-grams in the region.
The aim of the research was to study the prevalence and characteristics of treatment of hypertension in the indige-nous rural population of the Sakha (Ya-kutia) Republic.
Materials and Methods. A screen-ing survey was conducted in 2017-2018, among the population of 3 districts of the Sakha (Yakutia) Republic aged 20 years and older (Oymyakonsky, Gorny and Tat-tinsky), who were representatives of in-digenous ethnic groups (Yakuts, Evens, and Evenki) The study was conducted subject to the voluntary informed consent of the participants. The survey program included: a survey using a special ques-tionnaire, an anthropometric examination using a standardized method, a threefold measurement of blood pressure (BP), and venous blood sampling after fasting. The content of glucose, total cholesterol (cholesterol), triglycerides, high-density lipoprotein cholesterol (HDL cholester-ol) was determined using the express analyzer CardioChek PA, USA. The concentration of low-density lipoprotein cholesterol (LDL cholesterol) was calcu-lated using the Friedewald formula with a blood triglyceride level of less than 4.5 mmol/L. Arterial hypertension (AH) was established by the criteria of ESH/ESC, 2013 [9]. The group with hypertension also included individuals who took an-tihypertensive drugs (AHD) during the survey or stopped taking them less than 2 weeks before the survey, regardless of the measured blood pressure level. Effective treatment of hypertension was considered the achievement of target values of blood pressure on the back-
A.N. Romanova, T.M. Klimova, A.G. Egorova, A.A. Kuzmina, I.S. Malogulova, N.S. ArkhipovaPREVALENCE AND TREATMENTOF ARTERIAL HYPERTENSION IN THE NATIVE RURAL POPULATION OF YAKUTIA
The objective of the research was to study the prevalence and characteristics of treatment of arterial hypertension (AH) in the indigenous rural population of the Sakha (Yakutia) Republic.
Epidemiological research was conducted among the population (20 years and older) of 3 districts of the Sakha (Yakutia) Republic, and repre-sentatives of indigenous ethnic groups (Yakuts, Evens, and Evenks). The prevalence of AH among the surveyed population was 45.9% (95% CI: 42.5-49.3). There were no statistically significant differences in the frequency of hypertension in men and women (45.3 and 46.2%, respectively, p = 0.805). According to the survey, antihypertensive drugs (AHD) were taken by 51.2% of individuals with hypertension according to research criteria. Among women, the proportion of individuals using AHD was statistically significantly higher than among men (57.6 and 39.2%, respectively, p < 0.001). In 75.4% of cases, patients took one antihypertensive drug. In 52.8% of cases, drug therapy included angiotensin-converting enzyme inhibitors, in 42% of cases – calcium channel blockers, in 13.6% – β-blockers, 8.4% – angiotensin II receptor blockers, and in 3.1% – diuretics. The level of blood pressure corresponded to the “target” in 30.9% of those taking AHD.
Along with improving the diagnosis of hypertension and finding and eliminating risk factors, it is necessary to take measures to increase patient adherence to treatment and control blood pressure levels, as well as to conduct pharmacogenetic studies of the effectiveness of antihypertensive drugs.
Keywords: arterial hypertension, arterial hypertension, prevalence, antihypertensive drugs, treatment efficacy, Yakutia.
DOI 10.25789/YMJ.2019.67.01
ROMANOVA Anna Nikolaevna, Doctor of Medical Sciences, Director of Yakut Science Centre of Complex Medical Problems, Yakutsk, Russia, +7-968-151-88-87, e-mail: [email protected], ORCID: 0000-0002-4817-5315, KLIMOVA Tatiana Mikhailovna, Candidate of Medical Sciences, Associate Professor of Department of Pharmacology and Pharmacy, Medical Institute of the M.K. Ammosov North-Eastern Federal University, Senior Researcher, Department of Epidemiology of Chronic Noncommunicable Diseases, Yakut Science Centre of Complex Medical Problems, Yakutsk, Russia, +7-914-233-67-24, e-mail: [email protected], ORCID: 0000-0003-2746-0608, EGOROVA Aitalina Grigorevna, Candidate of Medical Sciences, Head of the Department of Epidemiology of Chronic Non-Communicable Diseases of the Yakut Science Centre of Complex Medical Problems, Yakutsk, Russia, +7-914-234-64-11, e-mail: [email protected]. ORCID: 0000-0002-8526-9644, KUZMINA Ariana Afanasevna, Candidate of Pharmaceutical Sciences, Head of Department of Pharmacology and Pharmacy at Medical Institute of the M.K. Ammosov North-Eastern Federal University, Yakutsk, Russia, [email protected], ORCID: 0000-0001-5220-0766, MALOGULOVA Irina Shamilevna, Candidate of Biological Sciences, Associate Professor of Department of Pharmacology and Pharmacy at Medical Institute of the M.K. Ammosov North-Eastern Federal University, Yakutsk, Russia, [email protected], ORCID: 0000-0003-0687-7949, ARKHIPOVA Natalia Spartakovna, Candidate of Medical Sciences, Head of the Laboratory of Clinical Population and Medical Social Research, Yakut Science Centre of Complex Medical Problems, Yakutsk, Russia, +7-962-739-80-77, e-mail: [email protected].
ПЕРЕДОВАЯ СТАТЬЯ

3’ 2019 7
ground of antihypertensive therapy [9]. Statistical data analysis was car-
ried out in the IBM SPSS STATISTICS 22 package. When comparing groups depending on the type of data, Krus-kal-Wallis criteria were used, as well as Pearson’s chi-squared test (χ2). The crit-ical value of the level of statistical signifi-cance of differences (p) was taken to be 5%. Descriptive statistics of quantitative data are presented as median (Me) and interquartile range (Q1-Q2). AH preva-lence rates are presented with a 95% confidence interval (95% CI).
Results and Discussion. During the epidemiological study in 3 districts of Ya-kutia, 813 men and women aged 20 years and older were examined. Men and women were comparable in age, the average age of the men surveyed was 49.3 (15.9) years, women – 50.9 (15.3) years (p = 0.138).
Analysis of the main anthropometric and metabolic indicators of the sample showed that, in general, the indigenous rural population is characterized by in-creased body weight, waist circumfer-ence, and a fairly favorable lipid profile (Table 1). At the same time, from the age of 44, the upper quartile of the distribution of systolic and diastolic blood pressures is in the range corresponding to the crite-rion of AH. These features were noted by us in previous studies [4, 6, 7].
The prevalence of AH among the sur-veyed population was 45.9% (95% CI: 42.5-49.3). Among the male population, the figures were 45.3% (95% CI: 39.5-51.2), and among women 46.2% (95% CI: 41.9-51.5), respectively. With an in-crease in the age of the examined, the frequency of hypertension increased sig-nificantly (Table 2). There are no statis-tically significant differences in the prev-alence of hypertension among men and women, both in general and in each age group separately. These data are close to the results of the ECCD study in 9 re-gions involving 15,300 people, where the prevalence of AH was on average 44%. The prevalence rates of hypertension in 8 regions were higher for men than for women. In the Tyumen Region, which also belongs to the northern territories,
there are also no significant differences between women and men in the frequen-cy of hypertension [1].
Evaluation of antihypertensive ther-apy was carried out according to the patients’ self-reports, which makes pos-sible the presence of a systematic error associated with a “memory error”. Some patients could not specify all drugs that were taken in connection with high blood pressure. At the same time, it is closer to the actual practice of taking the drugs by the patients themselves. Conducting a future study with simultaneous evaluation of the doctor’s prescriptions and patient self-report could help eliminate these shortcomings and objectively assess the patients’ adherence to treatment, as well as the treatment tactics used by the med-ical staff.
Main Characteristics of the Surveyed Indigenous Population of the Sakha (Yakutia) Republic, 20 Years and Older
Indicator 20-43 yearsn=237
44-59 yearsn=310
60-74 yearsn=177
75 year and oldn=53 р
Мужчины n=287SBP, mm Hg 120.0 (111.8-133.3) 130.0 (116.3-143.0) 141.0 (130.0-160.0) 130.0 (120.0-152.5) <0.001DBP, mm Hg 80.0 (70.3-84.3) 80.0 (73.3-90.0) 90.0 (80.0-100.0) 90.0 (80.0-92.5) <0.001Height, cm 168.0 (164.1-172.0) 167.0 (163.0-172.0) 162.0 (158.0-165.8) 160.0 (157.0-166.8) <0.001
Body mass, kg 69.0 (62.0-79.8) 74.0 (64.0-81.0) 66.0 (62.0-76.0) 64.5 (55.8-73.8) <0.001Body mass index, kg/m2 24.1 (21.9-27.3) 26.8 (23.7-29.3) 25.3 (23.1-29.2) 25.1 (22.1-26.7) 0.007Waist circumference, cm 81.5 (76.3-94.0) 92.0 (84.0-99.8) 92.0 (84.0-97.5) 92.0 (88.0-97.0) <0.001Triglycerides, mmol/L 0.9 (0.6-1.2) 1.1 (0.8-1.8) 0.9 (0.6-1.3) 0.8 (0.6-1.4) 0.048
Total cholesterol, mmol/L 4.8 (4.1-5.8) 5.4 (4.3-6.2) 5.0 (4.2-5.7) 4.7 (3.7-5.6) 0.103HDL cholesterol, mmol/L 1.4 (1.2-1.7) 1.4 (1.2-1.6) 1.5 (1.2-1.6) 1.1 (0.9-1.5) 0.032LDL cholesterol, mmol/L 2.5 (1.9-3.1) 2.9 (2.2-3.4) 2.8 (2.2-3.7) 2.8 (2.2-3.7) 0.038Atherogenic index, c.u. 2.4 (1.8-3.3) 2.8 (2.1-3.5) 2.4 (1.9-3.1) 2.7 (2.1-3.9) 0.106
Glucose, mmol/L 4.8 (4.5-5.3) 5.1 (4.6-5.6) 4.9 (4.3-5.5) 4.7 (3.9-5.0) 0.006Women n=526
SBP, mm Hg 120.0 (110.0-130.0) 134.0 (120.0-150.0) 140.0 (120.0-165.4) 150.0 (138.5-176.7) <0.001DBP, mm Hg 78.5 (70.0-84.2) 85.0 (80.0-94.0) 89.5 (80.0-100.0) 90.0 (80.0-100.0) <0.001Height, cm 158.0 (152.9-162.0) 154.0 (150.0-158.0) 150.0 (147.5-154.0) 146.0 (141.5-150.0) <0.001
Body mass index, kg 61.9 (54.0-72.0) 67.0 (58.2-76.0) 63.0 (55.0-74.0) 58.0 (49.0-69.5) <0.001BMI, kg/m2 24.9 (22.4-28.4) 27.9 (24.9-31.6) 27.9 (24.3-32.3) 27.6 (23.4-32.0) <0.001
Waist circumference, cm 82.0 (74.0-93.8) 91.0 (83.0-100.0) 94.0 (83.5-103.0) 93.0 (84.3-101.0) <0.001Triglycerides, mmol/L 0.8 (0.6-1.1) 1.1 (0.8-1.5) 1.0 (0.7-1.4) 0.9 (0.7-1.1) <0.001
Total cholesterol, mmol/L 4.6 (3.9-5.3) 5.7 (4.9-6.4) 5.4 (4.7-6.2) 5.4 (4.6-5.9) <0.001HDL cholesterol, mmol/L 1.6 (1.3-1.8) 1.5 (1.4-1.7) 1.4 (1.3-1.7) 1.5 (1.2-1.7) 0.253LDL cholesterol, mmol/L 2.2 (1.8-2.8) 3.1 (2.5-3.8) 3.1 (2.6-3.8) 3.3 (2.5-4.0) <0.001
Atherogenic index, c.u 2.2 (1.5-2.7) 2.8 (2.2-3.5) 2.7 (2.0-3.5) 2.6 (2.1-3.1) <0.001Glucose, mmol/L 4.6 (4.3-5.1) 4.9 (4.5-5.6) 4.6 (4.2-5.4) 4.5 (4.1-4.9) <0.001
Note: p is the achieved level of statistical significance of differences when comparing age groups by gender (Kruskal–Wallis test).
Table 1
Table 2
Prevalence of hypertension among the indigenous population of Yakutia, n (%)
Age, years Menn=287
Women n=526 Both genders n=813 р
20-43 29 (26.6) 35 (21.3) 64 (23.4) 0.31544-59 38 (41.80) 115 (52.5) 153 (49.4) 0.08560-74 51 (71.80) 63 (59.4) 114 (64.4) 0.091
75 and older 12 (75.0) 30 (81.1) 42 (79.2) 0.616All 130 (45.3) 243 (46.2) 373 (45.9) 0.805
Note: p is the achieved level of statistical significance of differences when comparing groups by gender (Pearson's test χ2).

ЯКУТСКИЙ МЕДИЦИНСКИЙ ЖУРНАЛ8
According to the survey, 191 people from among 373 persons diagnosed with AH by screening (51.2%) were taking AHD. Among women, the proportion of drug users was statistically significantly higher than among men (57.6 and 39.2%, respectively, p <0.001). According to the results of the ECCD study, on average in Russia 60.9% of women and 39.5% of men with hypertension took AHD [1]. Thus, the attitude of patients to the treat-ment of hypertension in Russia has com-mon features, regardless of the region.
The most commonly used drugs were angiotensin-converting enzyme inhibitors (ACE inhibitors), which were used as monotherapy or were part of combina-tion therapy in 59% of treatment cases. In 42% of cases, calcium channel block-
ers (CCB) were used, in 13.6% – β-blockers (β-АБ), 8.4% – angiotensin II receptor block-ers (ARBs), 3.1% – diuretics (Fig. 1). According to the research of ECCD, ACE inhibitors were also the most fre-quently used drugs in other territories of the Russian Fed-eration [1]. But in Yakutia, in contrast to the regions stud-
ied, the second in use are CCBs. The proportion of people receiving CCB was 18.8% in the Russian study, against 42% in Yakutia. The proportion of β-AB, di-uretics and ARBs was significantly lower. The revealed features require additional studies, since the high frequency of pre-scribing CCBs may be due to their high efficiency in this ethnic group.
144 (75.4%) respondents taking AHD indicated using 1 drug. In 52.8% of cas-es, these were ACE inhibitors, in 31.9% – calcium antagonists, in 9% – β-AB. Of the 47 patients taking 2 or more drugs, 22 (46.8%) indicated that an ACE inhibitor was taken in combination with CCB. The second in frequency (14.9%) was a com-bination of an ACE inhibitor with β-AB. 6
respondents noted the use of 3 drugs, of which in 4 cases it was a combination of an ACE inhibitor + CCB + ARBs.
When measured in 59 out of 191 (30.9%) respondents taking AHD, the level of blood pressure corresponded to the “target”. In women, the proportion of people with a normal level of blood pres-sure on the background of drug intake was slightly higher, but the differences did not reach a statistically significant level (32.1 and 27.5%, respectively, p = 0.535). According to the results of the ECCD study, the treatment efficiency was 53.5% among women and 41.4% among men, which is much higher than our data [1].
Thus, the results of the study showed a high incidence of hypertension among the indigenous population of Yakutia (45.9%). AHD was taken by 57.6% of women and 39.2% of men with hyperten-sion according to the research criteria. At the same time, target blood pressure was achieved only in 30.9% of patients. Along with improving the diagnosis of hyperten-sion, finding and eliminating risk factors, measures are needed to increase patient adherence to treatment and controlling blood pressure levels, as well as phar-macogenetic studies of the effectiveness of antihypertensive drugs in this ethnic group.
The work was carried out as part of the research project “The Contribution of Metabolic Syndrome to the Development of Coronary Artery Atherosclerosis in Ya-kutia’s Residents” (Reg. No. 01-20-128-08-00).
1. Бойцов С.А., Баланова Ю.А., Шальнова С.А. [и др.]. Артериальная гипертония среди лиц 25-64 лет: распространенность, осведомленность, лечение и контроль, По материалам исследования ЭССЕ. Кардиовас-кулярная терапия и профилактика. 2014; 4 (13): 4–14. [Boytsov SA, Balanova YA, Shalnova SA. [et al.]. Arterial Hypertension Among Individ-uals of 25–64 Years Old: Prevalence, Awareness, Treatment, and Control. By the data from CD-VRR. Kardiovaskulyarnaya terapiya i profilaktika. 2014; 4 (13): 4–14. (In Russ.)]
2. Заболеваемость взрослого населения Республики Саха (Якутия): Стат.материалы. ГУ ЯРМИАЦ МЗ РС (Я). Якутск. 2003-2017 гг. [Morbidity of the Adult Population of the Sakha (Yakutia) Republic: statistical materials. Yakutsk. 2003-2017. (In Russ.)]
3. Соболева М.С., Жмеренецкий К.В., Воронина Н.В., Лоскутова Е.Е., Добрых В.А. Использование фиксированных комбинаций при проведении медикаментозной терапии артериальной гипертензии в северных субъектах Дальневосточного федерального округа Якутский медицинский журнал. 2018; 4: 92–96. [Soboleva MS, Zhmerenetsky KV, Vo-ronina NV, Loskutova EE, Dobryh VA. Usage of the fixed-doses combinations for drug therapy of
References
Range of used groups of antihypertensive drugs
Group of drugsDrug intake n=191 (100%)
Monotherapyn=144
(75.4%)
Combined therapy
n=47 (24.6%)
n % n % n %ACE inhibitors 76 39.8 76 52.8
CCB 46 24.1 46 31.9β-АБ 13 6.8 13 9.0ARBs 5 2.6 5 3.5Alpha adrenomimetics 2 1.0 2 1.4Diuretics 2 1.0 2 1.4ACE inhibitors + CCB 22 11.5 22 46.8ACE inhibitors + β-AB 7 3.7 7 14.9CCB + β-AB 4 2.1 4 8.5ACE inhibitors + AV + ARBs 4 2.1 4 8.5CCB + ARBs 3 1.6 3 6.4ACE inhibitors + ARBs 2 1.0 2 4.3CCB + Diuretics 1 0.5 1 2.1ARBs + Diuretics 1 0.5 1 2.1β-AB + ARBs 1 0.5 1 2.1ACE inhibitors + CCB + Diuretics 1 0.5 1 2.1ACE inhibitors + β-AB + Diuretics 1 0.5 1 2.1
Note: ACE inhibitors – inhibitors of the angiotensin-converting enzyme; CCB – calcium channel blockers; β-AB – beta blockers; ARBs – angiotensin II receptor blockers.
Table 3
Fig. 1. Frequency of use of different groups of antihypertensive drugs: ACE inhibitors – inhibitors of the angiotensin-converting enzyme; CCB – calcium channel blockers; β-AB – beta blockers; ARBs – angiotensin II receptor blockers.
3’ 2019 9
arterial hypertension in northern regions of the Far Eastern Federal district. Yakutskij medicinskij zhurnal. 2018; 4: 92–96. (In Russ.)]
4. Климова Т.М., Федорова В.И., Балтахтинова М.Е. Критерии ожирения для идентификации метаболических факторов риска у коренного сельского населения Якутии. Сибирский медицинский журнал. 2012; 8:110–113. [Klimova TM, Fedorova VI, Baltakhi-nova ME. Obesity Criteria for Identifying Metabol-ic Risk Factors Among Indigenous Rural Popula-tion of Yakutia. Sibirskij medicinskij zhurnal. 2012; 8:110–113. (In Russ.)]
5. Общая заболеваемость взрослого на-селения России в 2017 году. Статистические материалы. Часть IV. Москва, 2018. Ссыл-ка активна на 15.05.2019. [Prevalence of the
Adult Population of Russia in 2017. Statistical materials. Part IV. Moscow, 2018. Accessed 15.05.2019. (In Russian)] https://www.ros-minzdrav.ru/ministry/61/22/stranitsa-979/statis-ticheskie-i-informatsionnye-materialy/statistich-eskiy-sbornik-2017-god
6. Климова Т.М., Федорова В. И., Балтахинова М. Е. [и др.]. Содержание холес-терина и риск атеросклероза у сельского корен-ного населения Республики Саха (Якутия). Экология человека. 2014; 4: 22–27. [Klimova TM, Fedorova VI, Baltakhinova ME [et al.]. Cholesterol and Risk of Atherosclerosis in Rural Indigenous Population of the Sakha (Ya-kutia) Republic. Ekologiya cheloveka. 2014; 4: 22–27. (In Russ.)]
7. Софронова С.И. Артериальная гипер-
тония и метаболический синдром у коренных малочисленных народов Севера в Якутии. Якутский медицинский журнал. 2018; 1: 14–16. [Sofronova SI. Arterial hypertension and meta-bolic syndrome in small indigenous people of the North of Yakutia. Yakutskij medicinskij zhurnal. 2018; 1: 14–16. (In Russ.)]
8. WHO.Noncommunicable Diseases Coun-try Profiles. 2018: 223. Accessed 25.05.2019. https://www.who.int/nmh/publications/ncd-pro-files-2018/en/
2013 ESH/ESC Guidelines for the manage-ment of arterial hypertension: the Task Force for the management of arterial hypertension of the European Society of Hypertension (ESH) and of the European Society of Cardiology (ESC). J. Hy-pertens. 2013; 7 (31): 1281–1357.
The aim of the study was investigation the relationship of allelic variants and genotypes of the rs 320 polymorphism of the LPL gene with the metabolic syndrome and its components in adult population of the Yakut ethnic group. In the studied group, it was not possible to establish a direct connection between the allelic variants, the genotypes of the LPL rs320 gene with the metabolic syndrome and its components. However, it is im-portant to note individuals with the TT genotype had somewhat higher level of triglycerides in the blood. It may be associated with a small sample size. We assume that the T allele is associated with low enzyme activity in this population, and plays a key role in the development of diseases associated with metabolic disorders.
Keywords: obesity, metabolic syndrome, multiple metabolic risk factors, population, genetics, rs320 polymorphism of the LPL gene, dyslipid-emia, indigenous population, Yakutia, North.
E.P. Ammosova, T.M. Klimova, T.M. Sivtseva, A.I. Fedorov, M.E. Baltakhinova, R.N. Zakharova
LIPOPROTEIN LIPASE GENE POLYMOR-PHISM rs320 AND METABOLIC SYNDROME IN NATIVE PEOPLE OF YAKUTIA
DOI 10.25789/YMJ.2019.67.02
ORIGINAL RESEARCHES
One of the variants of the LPL gene, which encodes the enzyme lipoprotein lipase, is the replacement of thymine (T) by guanine (G) at position 495 in intron 8. The Hind III (rs320) polymorphism changes the recognition site of the Hind III restriction enzyme and affects the ac-tivity of the enzyme. In recent studies, it was shown that the polymorphism rs320 of the LPL gene has a significant effect on the structure of the precursor RNA [9]. The frequency of minor G allele in different world populations varies from 24 to 38%, the highest frequency is ob-served among the population of Saudi Arabia (37,6%) [3, 5]. The literature pres-ents conflicting data on the role of Hind III (rs320) polymorphism in the develop-ment of diseases associated with lipid metabolism disorders. In some studies, the presence of a minor allele was asso-ciated with a lower risk of diseases asso-ciated with impaired lipid metabolism [4, 10, 12, 16], in other studies the presence of this polymorphism was a risk factor for the development of metabolic disorders and related diseases [7, 13].
In early studies the significant associ-ation between LPL rs320 with type 2 dia-
betes in the Yakut population has shown [1, 2, 3]. However, the mechanism of the influence of polymorphism on the devel-opment of metabolic disorders has not been studied enough. It is known that the inhabitants of the North from time im-memorial adapted to a diet rich in fats. Currently, there is an intensive increase in the incidence of metabolic disorders in the Yakut population. In this regard, the study of the mechanisms of the influence of the LPL gene on the metabolism of in-digenous peoples is a very interesting.
The purpose of this study was to esti-mate of the allele and genotype frequen-cy of LPL gene rs 320 polymorphism and its association with metabolic parameters and components of the metabolic syn-drome in the adult population of Yakut nationality living in Central Yakutia.
Materials and methods: The gen-otype frequency of the LPL gene rs320 was estimated among the unorganized population of the Central region (Gorny ulus, village Berdigestyakh) of the Sakha Republic (Yakutia). The research project was approved by the local bioethics com-mittee of the Yakut Scientific Center for Complex Medical Problems (Protocol No.
39 dated June 26, 2014). Participation in the study was completely voluntary. Ob-tained clinically useful information was available to study participants. The ini-tial participant’s selection was based on household lists. The study included per-sons of the Yakut nationality (by self-de-termination) at the age of 18 and older, regardless of whether they have any so-matic disease (n = 363).
Analyze of rs320 polymorphism was performed in 189 representatives (142 women and 47 men aged 18 years and older) who gave voluntary informational consent to conduct genetic studies. The average age was 52.7 (13.7) years. All participants were examined by a single program, including anthropometric exam-ination by the standard method, analysis of body composition for bio-impedance analysis “Tanita” (Japan) SSC 330, two-fold blood pressure measurement (BP), fasting venous blood sampling. The con-tent of glucose, total cholesterol (choles-terol), triglycerides, high density lipopro-teins (HDL cholesterol) was determined on the express analyzer Cardiochek PA, USA. The concentration of low-density lipoprotein cholesterol (LDL cholesterol)

ЯКУТСКИЙ МЕДИЦИНСКИЙ ЖУРНАЛ10
was calculated using the Friedwald for-mula with a blood triglyceride level of less than 4.5 mmol/l.
Hypertriglyceridemia was established with triglycerides ≥1.7 mmol/l, hypoal-phalesterolemia - at HDL cholesterol concentrations <1.0 mmol/l in men and <1.3 mmol/l in women; elevated blood pressure — with CAD ≥130 mmHg and/or DBP ≥85 mmHg; fasting hyperglyce-mia - with blood plasma glucose ≥5.6 mmol/l. Persons received specific med-ical treatment for these conditions were also referred to patients with metabolic disorders. Multiple metabolic disorders were established with 2 or more of the 4 above-mentioned risk factors. The follow-ing criteria were used to diagnose obesity: body mass index ≥30 kg/m2; the ratio of waist circumference to height ≥0.5; waist circumference by IDF criteria (IDF1) for European populations (more than 80 cm in women and 94 cm in men); IDF (IDF2) for Asian populations (more than 80 cm in women and 90 cm in men) [13].
LPL rs320 SNP was genotyped by the PCR-RFLP method. Amplification was performed with specially selected prim-ers and ready-made commercial reaction mixtures on the T-100 amplifier (Bio-Rad). Next, the PCR products were sub-jected to Hind III restriction enzyme (New England Biolabs) according to the man-ufacturer's protocol. Restriction products were visualized using electrophoresis in a 3% agarose gel on the gel documen-tation system BDA digital system 20 (Biometra). Each reaction was carried out in triplicate.
The verification of the distribution of genotypes to the equilibrium state of Har-dy-Weinberg was carried out using an online calculator at https://wpcalc.com/en/equilibrium-hardy-weinberg / [6]. Sta-tistical data analysis was carried out in the IBM SPSS STATISTICS 22 package. The comparison of groups was performed using Mann-Whitney and Pearson χ2 cri-teria depending on the type of data. The critical value of the level of statistical sig-nificance of differences (p) was 5%.
Results and discussion. The dis-tribution of genotypes, both in general among all examined, and in groups by age and sex, did not correspond to the Hardy-Weinberg equilibrium (Table 1). This is probably due to due to insufficient size of the studied group. However, an at-tempt to assess the relationship between lipid, anthropometric parameters and LPL rs320 was made as the part of explorato-ry research.
In the studied group, the T allele fre-quency was 68%, and the G allele - 32%. The TT genotype (58.7%) was the most
common; GG (12%) was a rare geno-type. The frequency of the heterozygous variant was 29%. Thus, homozygous genotypes were more common than het-erozygous (table 1). These distributions are consistent with data from other Euro-pean and Asian populations [3]. Table 2 presents the quartile distribution of some biochemical and anthropometric data depending on the genotype and allelic variants of the rs320 polymorphism. The triglycerides level in the blood of individ-uals with the TT genotype was slightly higher than that of GG homozygotes. The GT genotype was associated with lower diastolic pressure values compared to homozygotes. There were no statistically significant differences in the levels of oth-er indicators.
Metabolic syndrome was observed in 27 studied patients (14.3%). The most common variant of the metabolic syn-drome was a combination of central type of obesity, high blood pressure and dyslipidemia. The frequency of the met-abolic syndrome and its components did not depend on the genotypes and allel-ic variants of the studied polymorphism (table 3). This result may be due to the limited number of observations with met-abolic syndrome and lipid disorders. To date, the effect of rs320 polymorphism on the enzyme lipoprotein lipase activity and metabolic processes in the human body is not completely clear. Most stud-ies have shown that allele G is associ-ated with a low risk of developing met-abolic syndrome, acute cardiovascular conditions (strokes, heart attacks), and a lower risk of developing hypertension [4, 10, 15]. But at the same time, there are works indicating that carriers of the GG genotype have a high risk of diabet-ic dyslipidemia and type 2 diabetes [11, 13]. There are studies that suggest the association of the genotype and nutri-tion in the form of greater sensitivity to the diet of carriers of the T allele, com-
pared with carriers of G [7, 8, 15, 17]. Early studies in the Yakut population
showed association of T alleles with an increased risk of type 2 diabetes [1, 2, 3]. Our data show that the TT genotype may be associated with low enzyme ac-tivity and an increase in triglyceride levels in the blood. Contradictory results of the different authors may be related to the fact that, the functioning of a gene is sig-nificantly affected by the lifestyle, phys-ical activity of a person and the type of food, because the gene product associ-ated with energy metabolism [1, 2]. The lower prevalence of diabetes and cardio-vascular diseases among the indigenous people of the North in historical past is probably associated with a change in the energy balance of modern man.
Conclusion. In the studied indige-nous population of Yakutia, we did not reveal an association of the rs320 poly-morphism of the LPL gene and meta-bolic parameters, which may be due to limitations in the formation of the group. The allele and genotype frequency were close to those described for rs320 in oth-er groups of the world’s population. The obtained data and the analysis of litera-ture suggest that the T allele carrier, as-sociated with a low activity of the enzyme that hydrolyzes triglycerides in chylomi-crons and LDL, may increase the risk of metabolic disorders under conditions of changes of energy balance.
Considering that this population is evolutionarily adapted to food rich in fats, study of the rate of utilization of dietary fats in individuals with different LPL rs320 genotypes could be of scien-tific interest.
The study was supported by the Min-istry of Education and Science of the Russian Federation (project “Clinical and genetic aspects of diseases character-istic of the indigenous people of Yakutia in modern conditions” (0794-2017-0016, FSRG-2017-0016)).
Frequency distribution of alleles and genotypes of the rs 320 polymorphism of the LPL gene among the population
rs 320 n (%)Alleles
G 78 (32)T 166 (68)
GenotypesGG 23 (12.2)
χ2= 12.47р<0.001GT 55 (29.1)
TT 111 (58.7)
Note: χ2 - Pearson Chi-square test; p - the achieved level of significance when checking compliance with the Hardy-Weinberg equilibrium distribution.
Table 1

3’ 2019 11
1. Метаболический синдром у аборигенно-го населения Якутии / В.Л. Осаковский [и др.] // Якутский медицинский журнал. - 2010.-№ 2. -С. 98-102.
Metabolic syndrome in the aboriginal popula-tion of Yakutia / V L Osakovskij [et al.] // Yakut medical journal -. 2010. - №2 (30). – P. 98-102.
2. Осаковский В.Л. Липопротеин липа-за – важный генетический фактор развития СД2 у аборигенного населения Якутии / В.Л. Осаковский, М.Н. Яковлева // Якутский ме-
дицинский журнал. – 2011. – №3. – С. 29-30.Osakovskij V L Lipoprotein lipase is an import-
ant genetic factor in the development of T2DM in the aboriginal population of Yakutia / V.L. Osa-kovskij, M.N. Yakovleva //Ibid. – 2011. - №3 (35). – P. 29-30.
3. Сравнительная характеристика вариан-та LPL rs320 липопротеинлипазы в различных популяциях /Сивцева Т.М. [и др.] // Там же. – 2014. -№2. - С. 67-69.
Comparative characteristics of lipoprotein lipase gene variant LPL rs320 in different popu-lations / T M Sivceva [et al.] //Ibid. – 2014. -№ 2 (46). – P.67-69.
4. Association of the HindIII and S447X poly-morphisms in LPL gene with hypertension and type 2 diabetes in Mexican families / S. Mu-noz-Barriosa [et al.] // Disease Markers. – 2012. -№ 33. - P. 313–320.
5. DNA Polymorphisms of the Lipoprotein Li-pase Gene and Their Association with Coronary Artery Disease in the Saudi Population / A. Al-Ja-fari [et.al.] // Int. J. Mol. Sci.- 2012. – 13. – P. 7559 – 7574.
6. Equilibrium Hardy-Weinberg [Online]. [cit-ed 2017 June 15]. Available from: https://wpcalc.com/en/equilibrium-hardy-weinberg/.
7. Functional significance of lipoprotein lipase HindIII polymorphism associated with the risk of coronary artery disease / Q. Chen [et al.] // Ath-erosclerosis. -2008. - № 1 (200). - P. 102-108.
8. Hind III polymorphism of the lipoprotein li-pase gene and plasma lipid response to low cal-orie diet. / R. Jemaa [et al.] // Int J Obes Relat Metab Disord. – 1997. - № 4 (21) -P. 280–283.
9. Lipoprotein lipase gene polymorphisms as risk factors for stroke: a computational and me-ta-analysis / M. Nejati [et al.] //Iran J Basic Med Sci. – 2018.- 21(7). – P. 701-708.
10. Lipoprotein lipase gene polymorphism, cholesterol subfractions and myocardial infarc-tion in large samples of the general population / Stephan R. Holmer [et al.] // Cardiovascular Re-search. – 2000. - № 47 –P. 806–812.
11. Polymorphisms of lipid metabolism en-zyme-coding genes / Aslı Tetik Vardarlı [et al.] // Anatol J Cardiol. – 2017. - Vol. 17.-P. 313-321.
12. Seven Lipoprotein Lipase Gene Polymor-phisms, Lipid Fractions, and Coronary / G. S. Sa-goo [et al.] // American Journal of Epidemiology. - № 11 (168). - P. 1233-1246.
13. The Hind III polymorphism in the lipo-protein lipase gene predicts type 2 diabetes risk among Chinese adults / Qi. Yue [et al.] // Clinica Chimica Acta. -2011 - №13-14 (412).-P. 1229-1233.
14. The IDF consensus worldwide definition of the metabolic syndrome [Online]. 2006 [cited 2017 June 15]. Available from: https:// www.idf.org/e-library/consensus-statements/60- idfcon-sensus-worldwide-definitionof-themetabolic- syn-drome.
15. The influence of lipoprotein lipase gene variation on postprandial lipoprotein metabolism / J. Lopez-Miranda [et al.] // J Clin Endocrinol Me-tab. -2004. -№9 (89). -P. 4721-4728.
16. Two DNA polymorphisms in the lipopro-tein lipase gene and their associations with fac-tors related to cardiovascular disease / Y.I. Ahn [et al.] // Journal of Lipid Research. -1993. – Vol. 34. –P.421-427.
17. Effects of lipoprotein lipase gene varia-tions, a high-carbohydrate / Huang Xin [et al.] // BioScience Trends. -2011. -№5 (5). - P. 198-204.
AMMOSOVA Elena Petrovna, candidate of Medical Sciences, leading researcher, Re-search Center of the Medical Institute of the North-Eastern Federal University named after M.K. Ammosova, 677000, Moscow Yakutsk, str. Oiunskogo, 27, Russia. tel. 8-964-424-39-08 Mail: [email protected]. ORCID: 0000-0002-7973-6103, KLIMOVA Tatyana Mikhailovna, candidate of Medical Sciences, assistant professor of Department of Phar-macology and Pharmacy, Medical Institute of the North-Eastern Federal University named after M.K. Ammosova, senior researcher of the Department of Epidemiology of Chronic Non-Communicable Diseases, Yakutsk Sci-entific Center for Complex Medical Problems,
Table 2
Anthropometric and metabolic characteristics of the respondents depending on the allelic variant and the genotypes of the rs 320 polymorphism of the LPL gene
Genotypes АллельTT/GT GT/GG TT/GG G/T
Ме (Q1;Q3) p Ме (Q1;Q3) p Ме (Q1;Q3) p Ме (Q1;Q3) pSystolic blood pressure, mm Hg
120 (110;130)115 (100;129) 0.256 115 (100;129)
120 (107;138) 0.319 120 (110;130)120 (107;138) 0.653 115 (100;130)
116 (110;130) 0.748
Diastolic blood pressure, mm Hg75 (70; 82)70 (60; 80) 0.047 70 (60; 80)
80 (68; 90) 0.014 75 (70; 82)80 (68; 90) 0.211 75 (63; 80)
75 (65; 80) 0.776
TC, mmol / l5.0 (4.2; 5.6)4.7 (3.9; 5.7) 0.199 4.7 (3.9; 5.7)
4.9 (4.2; 5.6) 0.669 5.0 (4.2; 5.6)4.9 (4.2; 5.6) 0.533 4.8 (4.1; 5.6)
4.9 (4.2; 5.7) 0.394
HDL-C, mmol / l1.7 (1.4;2.0)1.8 (1.6;2.1) 0.096 1.8 (1.6; 2.1)
1.7 (1.4; 2.0) 0.308 1.7 (1.4; 2.0)1.7 (1.4; 2.0) 0.959 1.8 (1.5; 2.0)
1.7 (1.5; 2.0) 0.439
TG, mmol / l0.9 (0.8; 1.2) 0.9 (0.6; 1.1) 0.265 0.9 (0.6; 1.1)
0.8(0.6; 1.0) 0.215 0.9 (0.8; 1.2)0.8 (0.6; 1.0) 0.046 0.8 (0.6; 1.0)
0.8 (0.6; 1.2) 0.133
LDL-C, mmol / l2.8 (2.1; 3.4)2.0 (2.5; 3.2) 0.112 2.0 (2.5; 3.2)
2.6 (2.2; 3.5) 0.338 2.8 (2.1; 3.4)2.6 (2.2; 3.5) 0.924 2.5 (2.1; 3.2)
2.7 (2.1; 3.4) 0.450
Glucose, mmol / l4,7 (4,4; 5,1)4,7 (4,4; 5,1) 0.853 4.7 (4.4; 5.1)
4.7 (4.2; 5.0) 0.541 4.7 (4.4; 5.1)4.7 (4.2; 5.0) 0.368 4.7 (4.3; 5.1)
4.7 (4.4; 5.1) 0.260
Fat %
18.4 (13.9; 26.5) 19.1 (12.8; 24.3) 0.903 19.1 (12.8; 24.3)
18.5 (14.5; 26) 0.938 18.4 (13.9; 26.5) 18.5 (14.5; 26) 0.946
19 (14.3;24.7)/19
(13.9;25.3)0.973
BMI, kg / m2
25.3 (22.7; 29.2) 24.7 (22.1; 27.5) 0.291 24.7 (22.1; 27.5)
25.1 (22.1; 28.5) 0.591 25.3 (22.7; 29.2) 25.1 (22.1; 28.5) 0.860
25.1 (22.1; 28.1) 25.1
(22.3; 28.4)0.567
waist, sm
91.9 (85.7; 101.8) 94.3 (83.2; 98.7)
0.80294.3 (83.2; 98.7)
94.8 (83.8; 100.0)
0.96791.9 (85.7; 101.8) 94.8
(83.8; 100.0)0.791
93.3 (83.5; 99.3)
92.7 (85.4; 99.6)
0.824
Waist /growth
0.58 (0.53; 0.65) 0.59 (0.54; 0.64) 0.99 0.59 (0.54; 0.64)
0.58 (0.53; 0.65) 0.697 0.58 (0.53; 0,65) 0.58 (0.53; 0.65) 0.755
0.8 (0.53; 0.64)
0.59 (0.53; 0.64)
0.862
Note: p - the achieved level of statistical significance of differences when comparing groups using the Mann-Whitney test; Me (Q1; Q3) - median (25-75%); BMI - body mass index, OT-waist circumference;
References

ЯКУТСКИЙ МЕДИЦИНСКИЙ ЖУРНАЛ12
Moscow. Yakutsk, Russia, +79142336724, e-mail: [email protected]. ORCID: 0000-0003-2746-0608, SIVTSEVA Tatyana Mikhailovna, cand. biol. sc., senior scien-tist, Research Center of the Medical Institute North-Eastern Federal University named af-ter M.K. Ammosov, 677000, Yakutsk, str. Oi-unskogo, 27, Russia. tel. +7 914 223-74-32, e-mail: [email protected]. ORCID 0000-0002-1501-7433, FEDOROV Afanasy Ivanovich, cand. biol. science, senior researcher, Re-search Center of the Medical Institute of the North-Eastern Federal University named after M.K. Ammosova, 677000, Yakutsk, str. Oiunskogo, 27, Russia. tel. 8-914-2332966, e-mail: [email protected]. ORCID: 0000-0002-7973-6103, BALTAKHINOVA Marina Egorovna, junior researcher, Research Cen-ter of the Medical Institute of the North-East-ern Federal University named after M.K. Am-mosova, 677000, Yakutsk, str. Oiunskogo, 27, Russia. Tel. 89142710634, e-mail: [email protected]. ORCID: 0000-0003-0986-7754, ZAKHAROVA Raisa Nikolaevna, cand. med. science, scientific director, Research Center of the Medical Institute of the North-Eastern Fed-eral University. M.K. Ammosov, 677000, Ya-kutsk, str. Oiunskogo, 27, Russia. tel. 8-914-2223002, e-mail: [email protected]. ORCID: 0000-0002-1395-8256.
The frequency of the metabolic syndrome and its components depending on the allelic variant and the genotypes of the rs 320 polymorphism of the LPL gene
FactorGenotypes n (%)
χ2, pAlleles n (%)
χ2, pGG n=23 GT n=55 TT n=111 G n=78 T n=166
Raised blood pressureYes 13 (10.9) 36 (30.3) 70 (58.8) χ2=0.776
р=0.6749 (31.6) 106 (68.4) χ2=0.003
р=0.955No 9 (14.1) 16 (25) 39 (60.9) 25 (31.3) 55 (68.8)Reduced HDL cholesterol
Yes 4 (28.6) 3 (21.4) 7 (50) χ2=3.845p=0.146
7 (41.2) 10 (58.8) χ2=0.713p=0.425No 19 (10.9) 52 (29.7) 104 (59.4) 71 (31.3) 156 (68.7)
Raised triglyceridesYes 4 (16) 4 (16) 17 (68) χ2=2.468
p=0.2918 (27.6) 21 (72.4) χ2=0.290
p=0.590No 19 (11.6) 51 (31.1) 94 (57.3) 70 (32.6) 145 (72.4)Raised fasting plasma glucose
Yes 4 (16) 4 (16) 17 (68) χ2=2.315p=0.314
8 (27.6) 21 (72.4) χ2=0.287p=0.675No 19 (11.9) 49 (30.6) 92 (57.5) 68 (32.5) 141 (67.5)
ObesityYes 11 (12.4) 25 (28.1) 53 (59.6) χ2=0.087
p=0.95736 (31.6) 78 (68.4) χ2=0.002
p=1.0No 6 (11.3) 16 (30.2) 31 (58. 6) 22 (31.9) 47 (68.1)Abdominal obesity IDF1
Yes 14 (10.9) 37 (28.7) 78 (60.5) χ2=0.23p=0.891
51 (30.7) 115 (69.3) χ2=0.124p=0.732No 5 (12.8) 12 (30.8) 22 (56.4) 17 (33.3) 34 (66.6)
Abdominal obesity IDF2
Yes 14 (11.6) 36 (29.8) 71 (58.7) χ2=0.1290.938
50 (31.8) 107 (68.2) χ2=0.069p=0.871No 5 (10.6 %) 13 (27.7) 29 (61.7) 18 (30) 42 (70)
Multiple metabolic risk factorsYes 7 (18.4) 9 (23.7) 89 (58.9) χ2=2.013
p=0.36616 (34) 31 (66) χ2=0.45
p=0.734No 16 (10.6) 46 (30.5) 89 (58.9) 62 (31.5) 135 (68.5)Metabolic syndrome
Yes 4 (14.8) 6 (22.2) 17 (63) χ2=0.945p=0.623
10 (30.3) 23 (69.7 %) χ2=0.019
p=1.0No 15 (10.6) 43 (31.5) 83 (58.9) 58 (31.5) 126 (68.5)
Note: χ2 * - Pearson Chi-square test, p – significance level
Table 3

3’ 2019 13
In this paper, we analyzed the polymorphism rs3104413 of the HLA-DQA1 gene among patients with type 1 diabetes and a control sample of the population of the Republic of Sakha (Yakutia). Type 1 diabetes (diabetes mellitus type 1) among all forms of diabetes is no more than 10-15%, and type 1 diabetes is related to the most important medical and social problems associated with the often occurring childhood and adolescence, severe course, early disability and mortality. In the study of rs3104413 polymorphism, a significantly lower frequency of the C allele (47.1) was ob-served in the group of healthy individuals compared with the group of people with type 1 diabetes (78.3%). The calculation of the odds ratio showed that the frequency of the C allele in the group of people with type 1 diabetes was significantly higher (OR - 4.036; 95% CI: 2.71-6.02; p <0.001). The study revealed 6 haplotypes and genes. The haplotype DRB1 * 03: 01-DQA1 * 05: 01-DQB1 * 02: 01, DR3 / X, DRX / X was associated with the allele C of the rs3104413 polymorphism. The allele G of rs3104413 polymorphism was associated with the haplotype carrier DRB1 * 04: 01 – DQA1 * 03: 01-DQB1 * 03: 02 (DR4-DQ8) and DRB1 * 04: 01-DQA1 * 03: 01-DQB1 * 03: 01 (DR4-DQ7). Thus, the data obtained can be used as biological predictors of the development of type 1 diabetes in order to carry out timely personalized preventive measures.
Keywords: type 1 diabetes mellitus, HLA typing, HLA-DQA1 gene, polymorphism.
A.T. Dyakonova, Kh.A. Kurtanov, N.I. Pavlova, N.A. Solovyova, N.P. Filippova, T.N. AleksandrovaDETERMINATION OF HLA ALLELES USING SINGLE NUCLEOTIDE POLYMORPHISM OF RS3104413 HLA-DQA1 GENE AMONG PATIENTS WITH TYPE 1 DIABETES OF THE REPUBLIC SAKHA (YAKUTIA)
DOI 10.25789/YMJ.2019.67.03
Type 1 diabetes is a disease in which the body is not able to properly metabo-lize carbohydrates and to a lesser extent other components of food. This disease is caused by a lack of insulin, a hormone that is produced by the pancreas and that is required by the body to convert glucose from other food components into energy. The most severe form of diabe-tes is type 1 diabetes (type 1 diabetes mellitus). Despite the fact that its share among all forms of diabetes is no more than 10-15%, it is type 1 diabetes that is considered to be the most important medico-social problem of health care, since this disease often occurs in child-
hood and adolescence, characterized by severity, early disability and mortality [3].
According to modern data, a large number of genes are involved in the de-velopment of type 1 diabetes [3], more than half of the genetic risks are due to the participation of polymorphic variants of HLA genes located on the short arm of chromosome 6 (6p21). The main genetic contribution to the susceptibility to type 1 diabetes is made by genes of the HLA system encoding class II molecules of the main human histocompatibility com-plex, especially the DR and DQ genes of the HLA class, whose association with the development of type 1 diabetes has been shown in numerous publications for various population groups [1, 4].
In Russia, studies on the definition of HLA alleles using single nucleotide poly-morphisms are not carried out. In this re-gard, today there is a need for research aimed at developing a regionally-adapted method for the HLA-typing of type 1 di-abetes using single nucleotide polymor-phisms (SNP).
Objective: to determine HLA alleles using single nucleotide polymorphism of rs3104413 HLA-DQA1 gene and its as-sociation with type 1 diabetes.
Material and research methods: An experimental part of the work on the ge-notyping of the rs3104413 polymorphism, the HLA-DQA1 gene, was carried out in the laboratory of hereditary pathology of the Department of Molecular Genetics of the Yakutsk Scientific Center for Com-plex Medical Problems (YSC CMP). DNA samples from the collection of the YSC CMP biomaterial are used for the study
- a unique scientific installation “The Ge-nome of Yakutia” (reg. No. US_507512). The sample of patients consisted of 92 patients of the Yakut Scientific Center for Complex Medical Problems, state auton-omous institution of the Republic Sakha (Yakutia) "Republic Hospital №1 National Center of Medicine » and Endocrinology Department of Yakutsk Clinical Hospital, Yakutsk. The sample of patients included 92 patients with a diagnosis of type 1 dia-betes, aged 4 to 56 years, living in the RS (Ya), Yakuts by ethnicity. By gender there were 44 (47.8%) male and 48 (52.2%) fe-male. The average age of patients was 23.04 ± 0.27 years (from 4 to 56 years), the average age of male patients was 20.5 ± 2.3 years (from 5 to 40 years), and female - 25.11 ± 2 , 59 years old (from 4 to 56 years old). The control sample con-sisted of 210 Yakuts who did not suffer from type 1 diabetes. Ethnicity counted to the third generation. Ethnicity counted to third generation.
Amplification of the HLA-DQA1 gene region containing the single nucleotide polymorphism rs3104413 was performed during real-time PCR using primer pairs and allele-specific probes for DNA ampli-fication described in Serr I. et al. [6] Prim-ers and probes were synthesized by the company Biotech-Industry (Lumiprobe) LLC (Moscow, Russia). The sequence of primers: Forward primer 5'-CAGCT-GAGCACTGAGTAG-3 ', reverse prim-er 5'-GCAGTTGAGAAGTGAGAG-3'. Probes structure: FAM - Probe rs3104413 LPC [6FAM] CAGCCT [+ G] CT [+ C] TC [+ C] TA [+ T] TGG [BHQ1], HEX - Probe rs3104413 LPG [HEX] CAGCCT [+ G] CT
YSC CMP, Yakutsk, Republic Sakha (Yakutia), Russia: D'YAKONOVA Aleksandra Timo-feevna – Junior researcher of the laboratory of heritable pathology Tel.: 8 (914) 238 68 93. E-mail: [email protected]; KURTANOV Khariton Alekseevich – Candidate of Scienc-es., Chief Scientific Officer - Head of the De-partment of Molecular Genetics. Tel.: +7 (914) 106 00 30. E-mail: [email protected] Nadezhda Ivanovna – Candidate of Sciences, chief scientific officer - head of the laboratory of heritable pathology. Tel.: +7 (914) 289 39 36. E-mail: [email protected]; SOLOV'EVA Natal'ya Alekseevna – Can-didate of Sciences, - researcher of the Lab-oratory of Population Genetics. Tel.: 8 (924) 171 34 89. E-mail: [email protected]; FILIPPOVA Natal'ya Pavlovna – Candidate of Sciences, associate professor, researcher of the Laboratory of Population Genetics. Tel.: 8 (914) 303 43 95. E-mail: [email protected]; АLEKSANDROVA Tujara Nikonovna - Junior researcher of the laboratory of heritable pa-thology E-mail: [email protected].
ЯКУТСКИЙ МЕДИЦИНСКИЙ ЖУРНАЛ14
[+ G] TC [+ C] TA [+ T] TGG [BHQ1].Amplification was carried out accord-
ing to the temperature program below (Table 1):
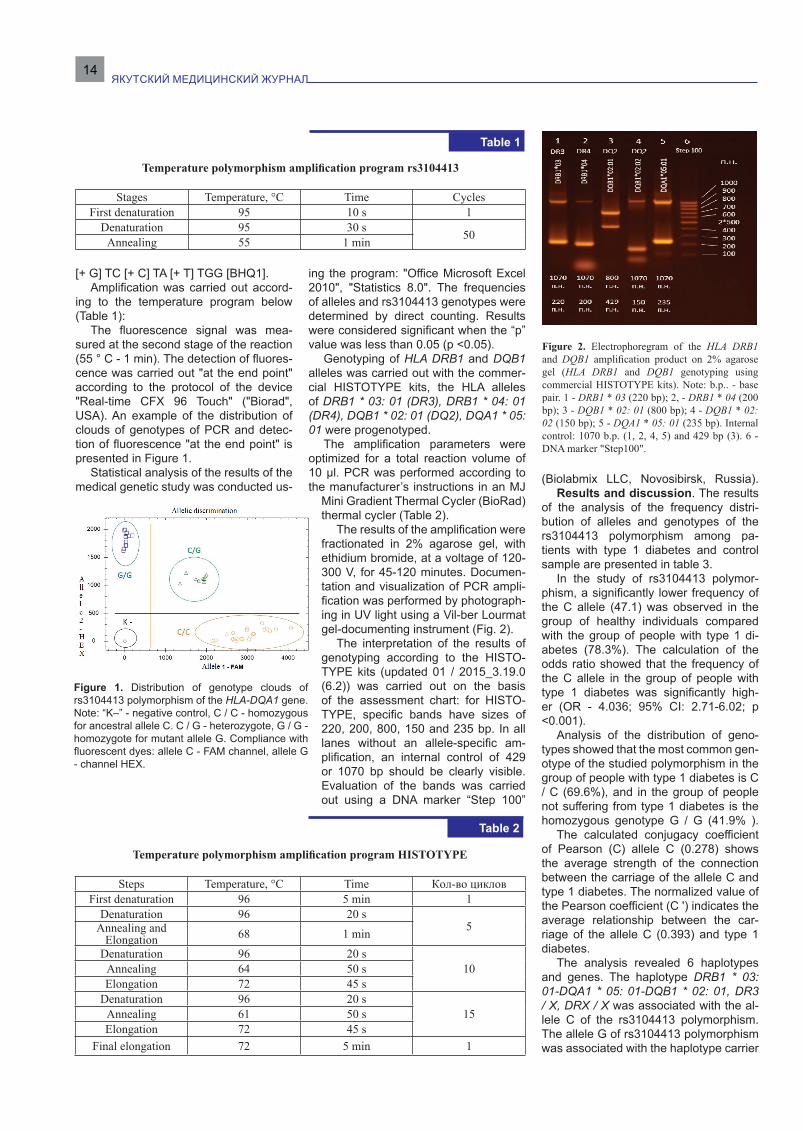
The fluorescence signal was mea-sured at the second stage of the reaction (55 ° C - 1 min). The detection of fluores-cence was carried out "at the end point" according to the protocol of the device "Real-time CFX 96 Touch" ("Biorad", USA). An example of the distribution of clouds of genotypes of PCR and detec-tion of fluorescence "at the end point" is presented in Figure 1.
Statistical analysis of the results of the medical genetic study was conducted us-
ing the program: "Office Microsoft Excel 2010", "Statistics 8.0". The frequencies of alleles and rs3104413 genotypes were determined by direct counting. Results were considered significant when the “p” value was less than 0.05 (p <0.05).
Genotyping of HLA DRB1 and DQB1 alleles was carried out with the commer-cial HISTOTYPE kits, the HLA alleles of DRB1 * 03: 01 (DR3), DRB1 * 04: 01 (DR4), DQB1 * 02: 01 (DQ2), DQA1 * 05: 01 were progenotyped.
The amplification parameters were optimized for a total reaction volume of 10 μl. PCR was performed according to the manufacturer’s instructions in an MJ
Mini Gradient Thermal Cycler (BioRad) thermal cycler (Table 2).
The results of the amplification were fractionated in 2% agarose gel, with ethidium bromide, at a voltage of 120-300 V, for 45-120 minutes. Documen-tation and visualization of PCR ampli-fication was performed by photograph-ing in UV light using a Vil-ber Lourmat gel-documenting instrument (Fig. 2).
The interpretation of the results of genotyping according to the HISTO-TYPE kits (updated 01 / 2015_3.19.0 (6.2)) was carried out on the basis of the assessment chart: for HISTO-TYPE, specific bands have sizes of 220, 200, 800, 150 and 235 bp. In all lanes without an allele-specific am-plification, an internal control of 429 or 1070 bp should be clearly visible. Evaluation of the bands was carried out using a DNA marker “Step 100”
(Biolabmix LLC, Novosibirsk, Russia).Results and discussion. The results
of the analysis of the frequency distri-bution of alleles and genotypes of the rs3104413 polymorphism among pa-tients with type 1 diabetes and control sample are presented in table 3.
In the study of rs3104413 polymor-phism, a significantly lower frequency of the C allele (47.1) was observed in the group of healthy individuals compared with the group of people with type 1 di-abetes (78.3%). The calculation of the odds ratio showed that the frequency of the C allele in the group of people with type 1 diabetes was significantly high-er (OR - 4.036; 95% CI: 2.71-6.02; p <0.001).
Analysis of the distribution of geno-types showed that the most common gen-otype of the studied polymorphism in the group of people with type 1 diabetes is C / C (69.6%), and in the group of people not suffering from type 1 diabetes is the homozygous genotype G / G (41.9% ).
The calculated conjugacy coefficient of Pearson (C) allele C (0.278) shows the average strength of the connection between the carriage of the allele C and type 1 diabetes. The normalized value of the Pearson coefficient (C ') indicates the average relationship between the car-riage of the allele C (0.393) and type 1 diabetes.
The analysis revealed 6 haplotypes and genes. The haplotype DRB1 * 03: 01-DQA1 * 05: 01-DQB1 * 02: 01, DR3 / X, DRX / X was associated with the al-lele C of the rs3104413 polymorphism. The allele G of rs3104413 polymorphism was associated with the haplotype carrier
Figure 2. Electrophoregram of the HLA DRB1 and DQB1 amplification product on 2% agarose gel (HLA DRB1 and DQB1 genotyping using commercial HISTOTYPE kits). Note: b.p.. - base pair. 1 - DRB1 * 03 (220 bp); 2, - DRB1 * 04 (200 bp); 3 - DQB1 * 02: 01 (800 bp); 4 - DQB1 * 02: 02 (150 bp); 5 - DQA1 * 05: 01 (235 bp). Internal control: 1070 b.p. (1, 2, 4, 5) and 429 bp (3). 6 - DNA marker "Step100".
Temperature polymorphism amplification program rs3104413
Stages Temperature, °С Time CyclesFirst denaturation 95 10 s 1
Denaturation 95 30 s 50Annealing 55 1 min
Table 1
Table 2
Temperature polymorphism amplification program HISTOTYPE
Steps Temperature, °С Time Кол-во цикловFirst denaturation 96 5 min 1
Denaturation 96 20 s5Annealing and
Elongation 68 1 minDenaturation 96 20 s
10 Annealing 64 50 sElongation 72 45 s
Denaturation 96 20 s15Annealing 61 50 s
Elongation 72 45 sFinal elongation 72 5 min 1
Figure 1. Distribution of genotype clouds of rs3104413 polymorphism of the HLA-DQA1 gene. Note: “K–” - negative control, C / C - homozygous for ancestral allele C. C / G - heterozygote, G / G - homozygote for mutant allele G. Compliance with fluorescent dyes: allele C - FAM channel, allele G - channel HEX.

3’ 2019 15
DRB1 * 04: 01 – DQA1 * 03: 01-DQB1 * 03: 02 (DR4-DQ8) and DRB1 * 04: 01-DQA1 * 03: 01-DQB1 * 03: 01 ( DR4-DQ7). Table 4.
According to the literature, more than 90 percent of patients with type 1 diabe-tes are carriers of either HLA-DR3, DQB1 * 0201 (DR3-DQ2), or DR4, DQB1 * 0302 (DR4-DQ8). About 30% of patients have the combined genotype DR3 / 4, which is associated with the greatest susceptibility to the disease [2]. Associated previously with a low risk of developing the disease
is the haplotype DRB1 * 04: 01-DQA1 * 03: 01-DQB1 * 03: 01 (DR4-DQ7) [5].
Thus, the study of this rs3104413 poly-morphism in determining the haplotype is insufficient and requires further research in combination with other SNPs.
ConclusionThe study revealed 6 haplotypes and
genes. The haplotype DRB1 * 03: 01-DQA1 * 05: 01-DQB1 * 02: 01, DR3 / X, DRX / X was associated with the allele C of the rs3104413 polymorphism. The allele G of rs3104413 polymorphism was
associated with the haplotype carrier DRB1 * 04: 01 – DQA1 * 03: 01-DQB1 * 03: 02 (DR4-DQ8) and DRB1 * 04: 01-DQA1 * 03: 01-DQB1 * 03: 01 ( DR4-DQ7).
There is a significantly low frequency of allele C (47.1) in the control sample compared with patients with type 1 dia-betes (78.3%) in the rs3104413 polymor-phism. The calculation of the odds ratio showed that the frequency of the C allele in the group of people with type 1 diabe-tes was significantly higher (OR - 4.036; 95% CI: 2.71-6.02; p <0.001).
Thus, the data obtained can be used as biological predictors of the develop-ment of type 1 diabetes in order to carry out timely personalized preventive mea-sures.
The study was conducted in the frame-work of research on the study of the ge-netic structure and burden of hereditary pathology of populations of the Republic of Sakha (Yakutia).
1. Волыкина А.П., Горшков И.П., Прилуцкая О.А. Генетические маркеры сахарного диабе-та (часть 1). Успехи современной медицины. 2017; 2(5):123-126. [Volykina AP, Gorshkov IP, Priluckaya OA. The role of genetic factors in the formation of different levels of type 1 diabetes mellitus in Europe and the Russian Federation. Modern science success. 2017; 2(5):123-126. (In Russ.)]
2. Кураева Т.Л., Ширяева Т.Ю., Прокофьев С.А. Роль генетических факторов в формиро-вании разного уровня заболеваемости сахар-ным диабетом 1-го типа в Европе и Российской Федерации. Проблемы эндокринологии. 2011; 1:19-25. [Kuraeva TL, Shiryaeva TYU, Prokofiev SA. The role of genetic factors in the formation of different levels of type 1 diabetes mellitus in Europe and the Russian Federation. Problems of Endocrinology. 2011; 1:19-25. (In Russ.)]
3. Atkinson M. A. The pathogenesis and natu-ral history of type 1 diabetes. Cold Spring Harbor perspectives in medicine. 2012; 2(11) a007641. doi:10.1101/cshperspect.a007641
4. Redondo MJ, Steck AK, Pugliese A. Genet-ics of type 1 diabetes Pediatric Diabetes. 2017; 19(3):346-353. doi: 10.1111/pedi.12597
5. Nguyen C. Varney MD, Harrison LC, Mora-han G. Definition of high-risk type 1 diabetes HLA-DR and HLA-DQ types using only three sin-gle nucleotide polymorphisms. Diabetes. 2013; DB_121398. doi: 10.2337/db12-1398
Table 3
Table 4
The frequency of occurrence of genotypes and alleles of the rs3104413 polymorphism in the group of patients with type 1 diabetes and control sample
Haplotypes, alleles
Patient with T1D (n =
92),аbs. (%)
control sample (n =
210), аbs.(%)Х2
OR(95% CI)
For allelesSignificance, p
С/С 64 (69.6) 76 (36.2)32.099 4.036
(2.708-6.017)
<0.001*С/G 16 (17.4) 46 (21.9)G/G 12 (13.0) 88 (41.9)
С 144 (0.783) 198 (0.471) 49.184 <0.001**G 40 (0.217) 222 (0.529)
Note. The achieved level of significance when comparing the distribution of genotypes (*) and allele frequencies (**) in comparison groups 1 and 2 is the number of samples, X2 with the Yeats amendment.
Identification of HLA haplotypes and genotypes using single nucleotide polymorphism
rs3104413
Haplotype by genes HLAThe number
of people with this haplotype
Genotype, %Allele
СAllele
GС/С С/G G/G
DRB1*03:01-DQA1*05:01-DQB1*02:01 16 87.5 12.5 0 0.938 0.063
DRB1*04:01–DQA1*03:01-DQB1*03:02
(DR4-DQ8)20 0 40 60 0.200 0.800
DR3/4-DQ8 8 0 100 0 0.500 0.500DR3/X 50 100 0 0 1.000 0.000
DRB1*04:01-DQA1*03:01-DQB1*03:01
(DR4-DQ7)132 0 33.3 66.7 0.167 0.833
DRX/X 76 100 0 0 1.000 0.000
Note: DRX / X - the absence of both DR3 and DR4; DR3 / X - carrier variant 1 of type DR3 and type DR3, not related to DR4
References
ЯКУТСКИЙ МЕДИЦИНСКИЙ ЖУРНАЛ16
A case-control study was conducted for the indigenous population living in the Arctic territory of Yakutia to determine the as-sociation of the M235T polymorphism of the AGT gene with hypertension and its risk factors. A higher average blood pressure, elevated cholesterol and its fractions, a higher incidence of abdominal obesity in carriers of the mutant GG genotype were found both in the general population and separately for people with hypertension. The study shows the contribution of the G allele of the AGT gene to the development of hypertension, lipid disorders and abdominal obesity.
Keywords: AGT gene, polymorphism, arterial hypertension, risk factors, indigenous people, Yakutia.
S.I. Sofronova, A.N. Romanova, M.P. KirillinaCORRELATION OF THE M235T POLYMORPHISM OF THE AGT GENE WITH ARTERIAL HYPERTENSION AND ITS RISK FACTORS IN THE INDIGENOUS PEOPLE OF THE ARCTIC TERRITORY OF YAKUTIAУДК 616-008.9. 1-81(571.56)
DOI 10.25789/YMJ.2019.67.04
Arterial hypertension is the leading risk factor for disability and premature mortal-ity in the global population. As of 2010, 31.1% of the adult population of the world (1.39 billion people) was suffering from hypertension (30.7% of men and 28.8% of women) [10]. In Russia, according to an ESSE-RF epidemiological study, which was conducted in 12 regions, the prev-alence of AH was 50.2% (51.1% in men, 49.7% in women) [2]. It is recognized that hypertension is a polygenic multifactorial disease, the genetic role of which has al-ready been proven. Currently, more than 1.500 genetic polymorphisms associated with blood pressure have been identified, which contribute through various patho-genetic mechanisms [7]. A particularly important role belongs to the genes of the renin-angiotensin system (RAS) respon-sible for vascular tone. The most relevant polymorphisms of the RAS genes for hypertension are angiotensinogen gene polymorphisms (AGT). The results of var-ious researches are ambiguous. Despite numerous studies, the degree and reli-ability of associations vary, for some loci the data are contradictory.
The aim of the study was to research the relationship of angiotensinogen (AGT) gene polymorphism with arterial hyperten-sion and its risk factors in the indigenous people of the Arctic territory of Yakutia.
Materials and research methods.The collection of material for the study was carried out in expeditionary con-ditions in the Arctic territory of Yakutia, including the places of compact resi-dence of the indigenous peoples (Nizh-nekolymsky, Verkhnekolymsky and Tom-ponsky districts). 348 people of the indig-enous nationality were surveyed with the continuous method. The sample consist-ed of an adult population aged 20 to 70 years (225 women and 123 men). The response was 75%. The average age of respondents was 48.16 ± 0.52 years, 49.71 ± 0.63 in women and 44.98 ± 0.91 in men.
Inclusion criteria: representatives of indigenous people (Evens, Chukchi, Yu-kaghirs, Yakuts).
Exclusion criteria: representatives of non-indigenous nationalities.
The research program included the following sections: a survey on the ques-tionnaire to assess the objective state; informed consent of the respondent to conduct research; anthropometric exam-ination with hip and waist measurement; blood sampling for biochemical studies from the cubital vein in the morning on an empty stomach with a 12-hour absti-nence from food. Blood sampling from the cubital vein for molecular genetic studies was carried out in a tube with EDTA. Genomic DNA was isolated from peripheral blood leukocytes by the meth-od of phenol-chloroform extraction. Allel-ic variants of the AGT gene were tested using a polymerase chain reaction with real-time results (real-time PCR). Geno-typing of the polymorphic AGT gene was performed with the usage of kits (Lytech R&D LLC, Moscow) on the «Real-time CFX96» amplifier (BioRad, USA) in ac-cordance with the manufacturer’s instruc-tions. For quality control, 10% of random-
ly selected samples were subjected to repeated genotyping.
Biochemical methods of the research included blood lipid profile: total choles-terol (TC), LDL Cholesterol, HDL Choles-terol, TG, glucose test.
When judging the incidence of disor-ders of the blood lipid profile in a popula-tion, we used the Russian recommenda-tions of the V revision of Society of car-diology of Russian Federation (VNOK), 2012, into account the European recom-mendations, 2011. Hypercholesterolemia (HCE) is the level of total cholesterol (TC) ≥ 5.0 mmol/l, the high LDL Cholesterol level≥3.0 mmol/l, the low HDL Cholester-ol level ≤1.0 mmol/l in men; 1.2 mmol/l in women. Hypertriglyceridemia (HTG) is the TG level ≥1.7 mmol/l; a hyperglyce-mia on an empty stomach (a glucose in a blood plasma on an empty stomach ≥ 6.1 mmol/l) or glucose intolerance (a glucose in a blood plasma in 2 hours after glucose loading within ≥7.8 and ≤11.1 mmol/l).
Blood pressure (BP) was measured twice with an OMRON automatic tonom-eter (Japan) on the right hand in a sitting position with the calculation of the aver-age BP. Hypertension is present at the 140/90 mmHg (2017 ACC/AHA Guide-line).
The abdominal obesity (AO) is ex-posed to the value of the waist measure-ment (WM) ≥ 80 cm on women, ≥94 cm on men.
The study was conducted according to the Local Ethics Committee protocol YSC CMP on the respondent's informed con-sent to the processing of personal data and the study.
Statistical data processing was per-formed using standard methods of math-ematical statistics using the SPSS soft-ware package (version 19.0). To define the characteristics, the arithmetic mean
Yakut science centre of complex medical problems, 677000, Sergelyakhskoe shosse, 4, Yakutsk, The Republic of Sakha (Yakutia), Russia: SOFRONOVA Sargylana Ivanovna – PhD, Head of Scientific-organizational and in-formation publishing Department; [email protected]; ROMANOVA Anna Nikolaevna – MD, Director, ORCID: 0000-0002-4817-5315; KIRILLINA Maria Petrovna – PhD (Biology), leading researcher, head of lab., [email protected].

3’ 2019 17
(M) and the characteristic’s standard error of the mean (m) were calculated. Intergroup differences were evaluated using analysis of variance or non-para-metric criteria. When comparing the fre-quencies of genotypes, the standard χ2 criterion with the Yates correction was used. The relative risk (OR – odds ratio) of disease development at a certain gen-otype was calculated using the standard formula OR=a/b x d/c, where a and b is the number of patients with and without the mutant genotype, respectively, and d, c is the number of people in the control group with and without the mutant gen-otype. OR is indicated with a 95% confi-dence interval. Differences were consid-ered statistically significant at p <0.05.
Results and discussion. In the to-tal population of the indigenous people of the Arctic territory of Yakutia, the fre-quency distribution of the AA, AG and GG M235T genotypes of the AGT gene was 15.5% (n = 54), 45.1% (n = 157), 39.4% (n = 137), respectively, which corre-sponds to the Hardy-Weinberg equilibri-um (χ2 = 0.18, p = 0.66), A alleles - 38.1% (n = 265), G - 61.9% (n = 431).
When comparing the mean values of lipids and glucose depending on a par-ticular AGT gene genotype, we obtained statistically significant differences in all indicators in carriers of heterozygous AG and mutant homozygous GG genotypes. In GG carriers all values were higher: to-tal cholesterol AG 4.93 ± 0. 06 and GG 5.12 ± 0.06, respectively, p = 0.037; HDL 1.32 ± 0.02 and 1.22 ± 0.02 (p = 0.003); LDL 3.12 ± 0.05 and 3.33 ± 0.05, (p = 0.005); TG 1.06 ± 0.02 and 1.21 ± 0.04 (p = 0.005). Our study confirms the con-tribution of the G allele to impaired lipid metabolism. On the contrary, their aver-
age glucose values are significantly low-er compared with AG genotype carriers (4.83 ± 0.11 and 4.35 ± 0.08, respec-tively, p = 0.001). Significant differences were also obtained when comparing the mean values in individuals with homozy-gous AA and GG genotypes, namely, in TG values (1.03 ± 0.05 and 1.21 ± 0.04, p = 0.029), glucose (4.88 ± 0.14 and 4.35 ± 0.08, p = 0.001).
At analyzing the frequencies of lipid and carbohydrate disorders in respon-dents, it was found that all carriers of genotypes showed high numbers of hypercholesterolemia (HCE), especial-ly atherogenic HCE, and GG genotype carriers showed the highest frequency of hypo-alpha-cholesterolemia (Hypo-α-CE). The frequencies of HCE, LDL HCE, Hypo-α-CE in the general population did not have significant differences between genotypes. Thus, in individuals with the AA genotype, the frequency of HCE was 46.3%, АG - 41.4%, GG - 49.6%. More than half of the respondents had the highest frequency of LDL HCE in individ-uals with AA genotype, 64.8% and GG genotype - 59.8%. The frequency of Hy-po-α-CE was 33.3% in the AA genotype individuals, AG - 29.9%, GG - 43.1%. The frequency of HTG in the carriers of ho-mozygous AA and GG genotypes signifi-cantly differed (5.5% and 17.5%, respec-tively, p = 0.033). Also significantly higher was the frequency of HG in heterozygous AG carriers compared with individuals with the mutant GG genotype (8.3% and 2.9%, respectively, p = 0.048).
We also conducted a study of the con-jugation of AGT polymorphism with the presence of abdominal obesity. Carriers of the AG and GG genotypes (59.2% and 60.6%) had the largest statistically insig-nificant frequency of AO versus 46.3% of individuals with the AA genotype, thereby indicating a certain conjugacy of the G al-lele with the presence of AO.
Considering the high frequency of oc-currence of AH in the population (53.3%), for further study, the general population of the indigenous people of the Arctic terri-tory of Yakutia was divided into 2 groups. For the study, 2 groups were formed -
“case” and “control”: “case” - persons suffering from hypertension (175 people), “control” - people without hypertension (173 people). The average age of hyper-tensive patients was 53.07 ± 0.49 years, those without AH - 38.88 ± 0.60 years.
This case-control study was includ-ed to determine the association of AGT gene variants with AH and its risk factors.
The frequency of occurrence of M235T
genotypes of the AGT gene among groups was compared. None of the data sets (Table 1) showed significant devia-tion from Hardy-Weinberg equilibrium (χ2 = 0.32, p = 0.24 for “case” and χ2 = 4.84, p = 0.02 for “control”) and there was no significant difference in the frequencies of genotypes or alleles between hyperten-sive and normotonic patients, with the ex-ception of the homozygous AA genotype (χ2 = 5.21, p = 0.001, OR = 0.39, 95% CI = 0.27-0.89) (Table 2).
We used 2 types of genetic models in order to verify the connection of the M235T polymorphism of the AGT gene with AH (Table 3). Analyzing the models, we found a link between AH and the mu-tant homozygous genotype GG and G al-lele in the recessive model. What is also confirmed by a number of foreign studies, in particular, the effect of the G allele and the GG genotype on the risk of developing essential hypertension [4,6,8,9,15,16]. In the Russian study, which included 514 patients, the association of the G allele with the risk of developing hypertension in men with an odds ratio of 1.95 (p = 0.003) was shown [1]. In contrast, in Co-lombia, Mongolia, the Caucasus, Leb-anon, and India, no reliable association of AG and GG genotypes with AH was found [3,5,11,14,18]. It was assumed that the population is heterogeneous in these countries, polymorphism is associated with differences in populations.
Depending on the genotype, we ana-lyzed the average level of systolic blood pressure (SBP) in hypertensive patients. In individuals with arterial hypertension, the average level of SBP in carriers of AA, AG and GG genotypes was 173.53 ± 3.62, 161.72 ± 1.40 and 159.72 ± 1.92 mmHg, respectively, there were signif-
icant differences in individuals with the AA genotype compared with others (p = 0.001). We did not detect any special differences in the mean values of SBP in normotonics.
Comparison of mean concentrations of blood lipids and glucose in individuals with and without hypertension was car-ried out, depending on whether the AGT gene is a member of a particular M235T
Frequencies of genotypes and alleles of the M235T polymorphism of the AGT gene and correspondence to Hardy-Weinberg equilibrium (HWE)
Genotype Case HWE χ2 p Control HWE χ2 p Allele Frequencies of allelesCase Control
AA 0.097 0.120.32 0.24
0.214 0.174.84 0.02
A 0.347 0.416AC 0.497 0.45 0.405 0.49 C 0.653 0.584CC 0.406 0.43 0.381 0.34
Table 1

ЯКУТСКИЙ МЕДИЦИНСКИЙ ЖУРНАЛ18
genotype (Table 4). For all respondents in the “case” values of lipid metabolism, except for HDL cholesterol, and glucose were higher compared to “control”. Signif-icant differences were found in the aver-age concentrations of TG in all represen-tatives, total cholesterol in the homozy-gous carriers of AA and GG genotypes, LDL cholesterol in carriers of the mutant GG genotype, glucose in individuals with the AA and AG genotype. The average concentrations of total cholesterol, ath-erogenic cholesterol and TG in hyper-tensive patients were higher with the GG genotype.
We determined the frequency of lipid and carbohydrate disorders for persons with and without AH, depending on gen-otype carriership (Fig. 1). In hypertensive patients, all values exceeded those of normotonics. When comparing certain types of lipid disorders and carbohydrate metabolism with respect to one or anoth-er genotype, individuals in the “case” and “control” identified significant differences in the frequency of LDL HCE in hyper-tensive patients of heterozygous and mutant homozygous genotypes, thereby proving the contribution of the G allele
in the development of atherogenesis. In normotonics, significant differences were noted in the frequency of Hypo-α-choles-terol, where the highest frequency was observed in GG carriers. In many studies examining the association of the M235T AGT gene polymorphism with lipid dis-orders, no significant reliable links have been identified. Only a few studies con-firm the fact that the G allele has a signif-icant effect on increasing the concentra-tion of total cholesterol and atherogenic cholesterol [12].
The study of conjugation of AGT poly-morphism in the case and control with the presence of abdominal obesity revealed the highest incidence of AO in individuals with AH - carriers of AG and GG geno-types from 76.1% to 83.9%. In the control, the frequency of AO varied from 28.6% in carriers of the heterozygous genotype to 43.9% in homozygous GG carriers. Both in the group with AH and in the “control”, the highest frequency of AO is associated with the G allele, thereby proving its con-tribution to the development of the meta-bolic syndrome. This was also confirmed by a number of foreign studies [13, 17].
Conclusion. Based on our findings, there is, indeed, a single genetic compo-nent in the implementation of hyperten-sion and its risk factors for development, such as lipid disorders and abdominal obesity. Proof of this are higher average blood pressure, elevated cholesterol and its fractions, a higher incidence of ab-dominal obesity in carriers of the mutant GG genotype both in the general popula-tion of the indigenous people of the Arc-tic territory of Yakutia, and separately for people with arterial hypertension. Thus, the genetic mechanisms of hypertension in the group of patients with arterial hy-pertension are realized through the G al-lele, which programs obesity, increased pressure, and lipid metabolism disor-ders.
The research was conducted within research projects of YSC CMP "A contri-bution of a metabolic syndrome to devel-opment of atherosclerosis of coronary ar-teries in residents of Yakutia", R&D "De-
Table 2
Mean levels of lipid spectrum and blood glucose in hypertensive patients and those without hypertension depending on the M235T genotypes of the AGT gene (M±m)
Blood parameters
AA genotype AG genotype GG genotypecase p control case p control case p control
TC 5.16±0.11 <0.05 4.74±0.16 4.98±0.08 >0.05 4.78±0.10 5.29±0.07 <0.01 4.74±0.09LDL 3.30±0.08 >0.05 3.06±0.12 3.17±0.06 >0.05 2.98±0.08 3.47±0.06 <0.01 3.04±0.08HDL 1.32±0.06 >0.05 1.26±0.05 1.29±0.02 <0.05 1.40±0.04 1.22±0.02 >0.05 1.23±0.03TG 1.17±0.08 <0.02 0.90±0.06 1.14±0.03 <0.01 0.87±0.04 1.29±0.05 <0.05 1.05±0.06
glucose 5.37±0.24 <0.01 4.43±0.14 5.10±0.15 <0.01 4.15±0.10 4.40±0.10 >0.05 4.24±0.10
Frequency distribution of M235T genotypes of the AGT gene among persons with and without AH
Genotype Frequencies of genotypes χ2 p OR 95%CICase ControlAA 0.097 0.214 5.21 0.001 0.39 0.27-0.89AG 0.497 0.405 1.71 нд 1.45 0.83-2.54GG 0.406 0.381 0.13 нд 1.11 0.63-1.96
Frequency distribution of genotypes M235T of AGT gene among persons with and without AH according to the dominant and recessive model
Genotype Frequencies of genotypes χ2 p OR 95%CICase ControlAA+ AG 0.581 0.618 0.28 0.51 0.86 0.56-1.31GG 0.418 0.382
AA 0.095 0.214 9.58 0.001 0.39 0.21-0.72AG+ GG 0.905 0.786
Table 3
а b
1а. The frequency of disorders of lipid and carbohydrate metabolism in individuals with hyperten-sion, depending on the genotypes M235T AGT, 1b. The frequency of disorders of lipid and car-bohydrate metabolism in individuals without hypertension, depending on the genotypes M235T AGT. Note: *- p<0,05
Table 4

3’ 2019 19
velopment of new technologies of treat-ment and risk prediction of hypertension and insult in the Republic of Sakha (Ya-kutia)" (Government contract No. 1133).
1. Максимов В.Н., Орлов П.С., Малютина С.К. [и др.]. Ассоциация генетических марке-ров с артериальной гипертензией в сибирской популяции. Российский кардиологический журнал. 2014; 19(10): 73-76. [ Maximov VN, Orlov PS, Malyutina SK. Association of genetic markers with arterial hypertension in the Siberian population. Rossijskij kardiologicheskij zhurnal. 2014; 19(10): 73-76. (In Russ.)] https://elibrary.ru/item.asp?id=22260826
2. Ерина А.М., Ротарь О.П., Солнцев В.Н. [и др.] Эпидемиология артериальной гипер-тензии в Российской Федерации – важность выбора критериев диагностики. Кардиология. 2019; 59(6): 5-11. [Erina AM, Rotar OP, Solntsev VN et al. Epidemiology of Arterial Hypertension in Russian Federation – Importance of Choice of Diagnosis Criteria. Kardiologiia. 2019; 59(6): 5-11. (In Russ.)] https://doi.org/10.18087/car-dio.2019.6.2595
3. Bautista LE, Vargas CI, Oro´stegui M, Gamarra G. Population based case-control study of renin–angiotensin system genes poly-morphisms and hypertension among Hispanics. Hypertens Res. 2008; 31: 401–8. doi: 10.1291/hypres.31.401
4. Fang YJ, Deng HB, Thomas GN, et al. Linkage of angiotensinogen gene polymorphisms with hypertension in a sibling study of Hong Kong Chinese. J Hypertens. 2010; 28:1203–9. doi: 10.1097/HJH.0b013e3283384b07
5. Glavnik N, Petrovicˇ D. M235T polymor-phism of the angiotensinogen gene and insertion/deletion polymorphism of the angiotensin-1 con-verting enzyme gene in essential arterial hyper-tension in Caucasians. Folia Biol (Praha.) 2007; 53: 69–70. URL: https://www.ncbi.nlm.nih.gov/pubmed/17448297
6. Gopi Chand M, Srinath J, Rao RS, et al. Association between the M268T polymorphism in the angiotensinogen gene and essential hyper-tension in a South Indian population. Biochem Genet. 2011; 49: 474–82. doi: 10.1007/s10528-011-9423-y
7. International Consortium for Blood Pres-sure Genome-Wide Association Studies et al, Ge-netic variants in novel pathways influence blood pressure and cardiovascular disease risk. Nature. 2011; 478: 103-9. doi: 10.1038/nature10405
8. Ji LD, Zhang LN, Shen P, et al. Association of angiotensinogen gene M235T and angioten-sin-converting enzyme gene I/D polymorphisms with essential hypertension in Han Chines pop-ulation: ameta-analysis. J Hypertens. 2010; 28: 419–28. doi: 10.1097/HJH.0b013e32833456b9
9. Kurbanova D, Eliseyeva M. Genetic back-ground of left ventricular hypertrophy in Uzbek hypertensive men. Turk Kardiyol Dern Ars. 2010; 38: 466–72. URL: https://www.ncbi.nlm.nih.gov/pubmed/21206199
10. Mills Katherine T., Bundy Joshua D., Kelly Tanika N. et al. Global Disparities of Hyperten-sion Prevalence and Control // Circulation. 2016; Vol.134 (No. 6):441–450. https://doi.org/10.1161/CIRCULATIONAHA.115.018912
11. Mohana VU, Swapna N, Surender RS et al. Gender-related association of AGT gene variants (M235T and T174M) with essential hypertension-a case-control study. Clin Exp Hypertens. 2012; 34: 38–44. doi: 10.3109/10641963.2011.618207
12. Niemiec P1, Zak I, Wita K. The M235T
polymorphism of the AGT gene modifies the risk of coronary artery disease associated with the presence of hypercholesterolemia. Eur J Epide-miol. 2008; 23(5): 349-54. doi: 10.1007/s10654-008-9241-7.
13. Procopciuc LM, Sitar-Tăut A, Pop D et al. Renin angiotensin system polymorphisms in pa-tients with metabolic syndrome. European Jour-nal of Internal Medicine. 2010; 5 (21): 414-418. https://doi.org/10.1016/j.ejim.2010.06.001
14. Saab YB, Gard PR, Overall ADJ. The association of hypertension with renin–an-giotensin system gene polymorphisms in the Lebanese population. J Renin–Angioten-sin–Aldosterone Syst. 2011; 12: 588–94. doi: 10.1177/1470320311408465
15. Say YH, Ling KH, Duraisamy G, et al. An-giotensinogen M235T gene variants and its as-sociation with essential hypertension and plasma renin activity in Malaysian subjects: a case control study. BMC Cardiovasc Disord. 2005; 5: 7–13. DOI: 10.1186/1471-2261-5-7
16. Shamaa MM, Fouad H, Haroun M. et al. Association between the Angiotensinogen (AGT) gene (M235T) polymorphism and Essential Hy-pertension in Egyptian patients. The Egypt Heart J. 2015; 67(1): 1-5. http://dx.doi.org/10.1016/j.ehj.2013.10.001
17. Takakura Y, Yoshida T, Yoshioka K et al. Angiotensinogen gene polymorphism (Met-235Thr) influences visceral obesity and insulin resistance in obese Japanese women. Metab-olism. 2006; 55: 819–824. DOI: 10.1016/j.me-tabol.2006.02.008
18. Ying CQ, Wang YH, Wu ZL et al. Asso-ciation of the renin gene polymorphism, three angiotensinogen gene polymorphisms and the haplotypes with essential hypertension in the Mongolian population. Clin Exp Hypertens. 2010; 32: 293–300. doi: 10.3109/10641960903443517
References
ЯКУТСКИЙ МЕДИЦИНСКИЙ ЖУРНАЛ20
30 patients with stage II and III of squamous cell carcinoma of the esophagus after surgical treatment were analyzed retrospectively. Prognostic significance of the expression of immuno-histochemical markers p53, bcl-2, ki-67 and E-cadherin and tumor proliferative activity were stud-ied. A significant decrease in the frequency of tumors expressing p53, as well as an increase in the number of tumors expressing bcl-2, was detected in the group of patients with an increase in the event-free period for up to 365-540 days. The mean numbers of bcl-2 positive cells in groups with progression from 181 to 364 days and from 365 to 540 days were 2.3 and 2.8 times higher than in patients with progression in 180 days and earlier. The ki-67 index in the latter was signifi-cantly higher than in groups with progression within 181-364 and 365-540 days.
An increased proliferative activity was registered only in patients with progression in 180 days and earlier. The E-cadherin expression in the group with progression in 365-540 days was significantly higher than in patients with progression in < 180 and 181-364 days.
Keywords: esophageal cancer, immunohistochemical markers, proliferative activity, p53, bcl-2, ki-67, E-cadherin, progression.
O.I. Kit, A.L. Bazaev, E.Yu. Zlatnik, I.A. Novikova,E.P. Ulianova, O.G. Shulgina, A.B. Sagakyants,E.N. Kolesnikov, V.S. Trifanov, S.S. Mezentsev, A.V. Snezhko, T.B. KatsievaEXPRESSION OF SOME MOLECULAR AND BIOLOGICAL MARKERS IN DIFFERENT PE-RIODS OF PROGRESSION AFTER RADICAL SURGICAL TREATMENT OF ESOPHAGEAL CANCERDOI 10.25789/YMJ.2019.67.05
Esophageal cancer is one of the most aggressive malignant diseases of the gastrointestinal tract significantly affect-ing the quality of life of the patient with high rates of poor outcome [3, 10]. Tu-mors of epithelial origin, mainly squa-mous cell carcinoma and adenocarcino-ma, are the most common. According to the International Agency for Research on Cancer (IARC), EC incidence and mor-tality in 2008 were 49.2 and 34.3, respec-tively, per 100 000 per year [12].
High expression of p53 mutant protein is known to predict poor survival in can-cer of the stomach, lung, and other can-cers [4]. However, the predictor role of p53 for EC remains a debatable [14]. In 2015, British journal of cancer published a meta-analysis review of 11 large-scale studies on the role of p53 in EC over the past 20 years, in order to identify potential biomarkers that are sensitive and predic-tive in EC. As a result, only three studies including 268 patients showed a connec-tion between the poor prognosis and high expression of p53. The results of other studies contained conflicting data, most of which showed that the prognostic role of this marker was not obvious [13].
Among other markers considered to be oncogenes, the bcl-2 gene involved in the negative apoptosis regulation can be marked. Some authors regard high ex-pression of bcl-2 as a negative prognos-
tic factor due to the fact that it contributes to the survival of tumor cells [6, 8]. Oth-er researchers showed high expression of bcl-2 to be a prognostically favorable factor [5, 9].
Analysis of proliferative activity (PA) of a tumor is the most important character-istic of cancer, which allows characteriz-ing its biological behavior. It is estimated by the ki-67 index, as only dividing cells detect antibodies to ki-67 [7].
Disorders of intercellular adhesion as-sociated with pathological changes in the membrane protein E-cadherin are one of the factors contributing to the metastasis and progression of malignant tumors [1]. Studies of E-cadherin expression in lung, bladder and gastric cancers showed the significance of its determination. Stud-ies have shown that E-cadherin has the properties of a tumor growth suppressor and its invasion [2]. An imbalance in the cadherin system, in particular inhibition of E-cadherin expression and overexpres-sion of N-cadherin, is considered an im-portant component of the epithelial-mes-enchymal transition process.
Thus, these IHC markers allow char-acterization of the processes of adhe-sion, apoptosis and proliferation of tumor cells, which seems significant for assess-ing the potential of tumor progression. That is why we selected these markers and studied their expression in EC cells
Rostov, Russia: Oleg I. KIT, D.Med.Sc., Pro-fessor, Corresponding Member of RAS, Gen-eral Director of Rostov Research Institute of Oncology, [email protected], Adlan L. BAZAEV, post-graduate student, Rostov Re-search Institute of Oncology, tel. 89286146603, [email protected], Elena Yu. ZLATNIK, D.Med.Sc., Professor, Chief Researcher at Laboratory of Immunophenotyping of Tumors, Rostov Research Institute of Oncology, tel. 89612726968, [email protected], Inna A. NOVIKOVA, Cand.Med.Sc., Deputy Gen-eral Director for Science, Rostov Research Institute of Oncology, tel. 89064162909, [email protected], Elena P. ULIANO-VA, Researcher at Laboratory of Immunophe-notyping of Tumors, Rostov Research Institute of Oncology, tel. 89064248556, [email protected], Oksana G. SHULGINA, Junior Researcher at Laboratory of Immunopheno-typing of Tumors, Rostov Research Institute of Oncology, tel. 89185570986, [email protected], Aleksandr B. SAGAKYANTS, Cand.Biol.Sc., Associate Professor, Head of Lab-oratory of Immunophenotyping of Tumors, Rostov Research Institute of Oncology, tel. 89604458653, [email protected], Evgeniy N. KOLESNIKOV, Cand.Med.Sc., Head of Department of Abdominal Onkology No. 1, Rostov Research Institute of Oncology, tel. 89185538854, [email protected], Vladimir S. TRIFANOV, Cand.Med.Sc., Senior Re-searcher at Department of Abdominal Onkolo-gy No. 1, surgeon oncologist, Rostov Research Institute of Oncology, tel. 89185544312, [email protected], Stanislav S. MEZENT-SEV, Cand.Med.Sc., oncologist at Department of Abdominal Onkology No. 1, surgeon oncol-ogist, Rostov Research Institute of Oncolo-gy, tel. 89185028118, [email protected], Aleksandr V. SNEZHKO, D.Med.Sc., Assis-tant at Department of Oncology, Rostov State Medical University, tel 89185131837, [email protected], Tanzila B. KATSIEVA, Cand.Med.Sc., oncologist at Department of Abdominal Onkology No. 1, surgeon oncolo-gist, Rostov Research Institute of Oncology, tel. 89895113131, [email protected].

3’ 2019 21
in different periods of the disease pro-gression after radical surgical treatment.
The purpose of the study was a com-parative assessment of the expression of p53, bcl-2, ki-67, E-cadherin IHC mark-ers in the tumor tissue of EC patients at different progression periods after surgi-cal treatment.
Material and methods. The study in-cluded 30 patients diagnosed with stage II (n=15) and III (n=15) middle and lower thoracic esophageal squamous cell car-cinoma undergoing treatment in Rostov Research Institute of Oncology. All pa-tients received Lewis surgery with stan-dard bizonal lymph node dissection. No special antitumor therapy was performed until progression was detected. Median age of patients was 57.83 years. All pa-tients developed progression within 1.5 years (up to 540 days). Depending on the time to progression, the patients were di-vided into 3 groups: up to 180 days; from 181 to 364; from 365 to 540 days. In 11 of 30 cases (36.7%), progression occurred within 180 days; in 9 (30%) - from 181 to 364; in 10 (33.3%) - from 365 to 540 days. The median event-free survival was 9 months.
The IHC study was performed on 3-4 µm sections from paraffin blocks pre-pared using the Thermo Scientific Mi-crom HM 325 rotary microtome (Great Britain). Automated immunohistochemi-cal staining was carried out in the Ther-mo Scientific 480S IHC stainer. The following monoclonal antibodies were used for the study: to p53 (clone DO-7, DAKO, 1:100 dilution), bcl-2 (clone Sp 66, DAKO, 1:100 dilution), ki-67 (clone H3060, Spring Biosience, 1:200 dilu-tion), E-cadherin (clone EP700Y, Ther-mo scientific, 1:100 dilution). Dewaxing and dehydration stages were performed according to the standard scheme. The PT-LinkThermo was used for antigen unmasking. The Reveal Polyvalent HRP-DAB Detection System (Spring Biosci-ence) was used for imaging. The cut-off point for positive tumor assessment was 25% for both nuclear staining for p53 and cytoplasm staining for bcl-2. Proliferative activity (PA) was calculated by counting the proportion of positively stained cells to the ki-67 marker per 100 tumor cells. The ki-67 index was determined by the formula: proliferative activity = the num-ber of positively stained cells to the tumor marker ki-67 x 100/total number of cells. Statistical analysis of the results was pro-cessed using the Statistica 8.0 program [9], and the Student’s t-test was calculat-ed.
Results and discussion. The results were expressed in a comparative anal-
ysis of the frequency of expression and average values of indicators depending on the time to EC progression. An in-creased time interval to disease progres-sion was accompanied by an increase in the frequency of expression of bcl-2+ and a decrease in p53+ (table 1). No correla-tion was observed between the disease stage and event-free period.
Table 1 demonstrates that longer re-lapse-free survival was accompanied by decreased rates of tumors expressing p53, with their minimal number (1.5 times lower compared with patients who did not survive six months without progression) in patients with the longest event-free pe-riod (365-540 days).
In these patients, the maximum rate of positive bcl-2 expression was found – 1.4 (p<0.05) and 1.2 (p<0.05) times higher than in groups with progression-free pe-riods of ˂180 and 181-364 days, respec-tively (Table 1, Figure 1).
Table 2 presents the results of a com-parative analysis of average expression of IHC markers. A statistically significant
decrease in the proportion of p53 positive tumor cells was detected as the time to progression increased. With an increase in the time to progression to 540 days, the number of p53 positive cells was 2.2 times lower than in patients with progres-sion within 180 days from the surgery, and 1.5 times lower than in cancer pro-gression from 181 to 364 days. The dif-ferences were statistically significant in all cases (p<0.05).
While expression of p53+ positive cells decreased significantly with longer time to progression, expression of bcl-2 showed the opposite tendency. The av-erage number of bcl-2 positive cells in tu-mors was 2.3 times higher in progression
from 181 to 364 days, compared to pa-tients with progression within 180 days. When progression-free period lasted for up to 540 days, the value increased by up to 2.8 times (differences were statistically significant, p<0.05).
The maximal index of proliferation of tumor cells determined by ki-67+ was de-tected in tumors with the shortest time to progression. It was 3.1 and 2.5 times high-er, compared to the values in groups with progression in 181-364 and 365-540 days.
No statistically significant differenc-es in proliferation indices determined by ki-67+ cell proportion were observed in patients with progression within 181-364 and 365-540 days. Therefore, this indi-cator can be considered as a marker of early (up to six months after surgery) pro-gression of esophageal cancer.
Assessment of the proliferative poten-tial of tumors in the same patients also re-
Frequency of expression of IHC markers (p53 and bcl-2) depending on the timeto progression, absolute count (%)
Time to progression, days
Markers (IHC)p53+ p53- bcl-2+ bcl-2-
< 180 9 (81.8) 2 (18.2) 7 (63.6) 4 (36.4)from 181 to 364 6 (75) 2 (25) 6 (75) 2 (25)from 365 to 540 6 (54.5) 5 (45.5) 10 (90.9) 1 (9.1)
Fig. 1. Squamous cell carcinoma of the esoph-agus: A - 360 days to progression. Low ex-pression of bcl-2; Б - 540 days to progression. High expression of bcl-2. 400x magnification
Table 1
Table 2
Expression of studied markers in patients with different periods to progression, %
Time to progression, days
Expression of IHC markersp53 bcl-2 ki-67 E-cadherin
< 180 60.9±7.4 21.4±3.9 49.7±8.6 65.5±4.6from 181 to 364 41.9±6.6°↓ 48.9±4.6°↑ 15.9±4.8°↓ 66.3±8.8from 365 to 540 28.2±4.2°↓ 59.5±4.8°↑ 19.7±4.9°↓ 89.1±4.9°↑°°↑
Note . ° – differences from values < 180 days; °°– differences from values 181–364 days. Differences were statistically significant in both cases (p<0.05).

ЯКУТСКИЙ МЕДИЦИНСКИЙ ЖУРНАЛ22
vealed a number of differences (Figure 2).Tumors with high PA were found only
in patients with an early period before progression (up to 180 days), while such activity was not detected in tumors of pa-tients with progression from 181–364 and 365–540 days.
Tumors with low PA were most often observed in the group with progression in 181-364 days, and tumors with moderate PA were found in the group of 365–540 days. The number of tumors with mod-erate PA in the 365–540 day group was 1.8 times (p<0.05) higher than in the 181–364 day group. It should be noted that tumors with moderate PA were not detected in the group with progression in <180 days.
Patients in groups with progression within <180 and 181-364 days did not show statistically significant differenc-es in the average values of E-cadherin expression. However, when the time to progression increased to 365–540 days, this indicator became 1.4 and 1.3 times higher, respectively (the differences were statistically significant, p<0.05); table 2, figure 3).
Conclusions. Immunohistochemical analysis allowed identification of some differences in occurrence rates and ex-pression of molecular and biological markers p53, bcl-2, ki-67 and E-cadherin associated with the processes of prolifer-ation, adhesion and apoptosis of tumor cells at different periods to the progres-sion of esophageal cancer (<180 days; from 181 to 364; from 365 to 540 days). The results showed that the most favor-able outcome of surgical treatment for esophageal cancer was characterized by
high expression of bcl-2 and E-cadherin with low proliferative activity of the tumor and low expression of p53, suggesting the potential use of these markers as prognostic ones along with well-known clinical prognosis factors.
1. Бабиченко И.И., Ковязин В.А. Новые методы иммуногистохимической диагности-ки опухолевого роста: учебное пособие. М.: РУДН, 2008. 109 с. [Babichenko II, Kovyazin VA. New methods of immunohistochemical diagnosis of tumor growth: study guide. Moscow: RUDN, 2008. 109 pp. (In Russ.)]
2. Делекторская В.В. Молекулярно-биоло-гические маркеры метастазирования и про-гноза при раке толстой кишки: дис. д-ра мед. наук: 14.00.14. М., 2007. 240 с. [Delektorskaya VV. Molecular and biological markers of metasta-sis and prognosis in colon cancer: dis. d-ra med. nauk: 14.00.14. Moscow, 2007. 240 pp. (In Russ.)]
3. Дулганов В.К., Дулганов П.К. О метаста-зировании рака пищевода. Материалы 5 Все-российского съезда онкологов. Казань, 2000. Т. 2. С.72. [Dulganov VK, Dulganov PK. On esoph-ageal cancer metastasis. Materials of V all-Rus-sian congress of oncologists. Kazan, 2000. Vol. 2. P. 72. (In Russ.)]
4. Кит О.И., Водолажский Д.И., Базаев А.Л. и др. Молекулярные маркеры плоскоклеточ-ного рака пищевода [Эл. ресурс]. Современ-ные проблемы науки и образования. 2017;5:2. URL: https://science-education.ru/ru/article/view?id=26709. [Kit OI, Vodolazhsky DI, Bazaev AL et al. Molecular markers of esophageal squa-mous cell carcinoma. Sovremennye problemy nauki i obrazovaniya. 2017;5:2. (In Russ.)]
5. Новичкова О.Н., Яковлева Л.М., Нович-ков Е.В. Иммуногистохимическое исследо-вание прогностических маркеров опухоли в рецидивирующих муцинозных карциномах
яичников. Иммуноонкология. 2015;1:84-89. [Novichkova ON, Yakovleva LM, Novichkov EV. Immunohistochemical study of prognostic tumor markers in recurrent mucinous carcinoma of the ovaries. Immunoonkologiya. 2015;1:84-89. (In Russ.)]
6. Кит О.И., Ващенко Л.Н., Тодоров С.С., Ибрагимова Е.Л., Аушева Т.В. Способ прогно-зирования рецидивирования сарком мягких тканей. Патент №2532332 Российская Феде-рация, МПК A61B. Опубл. 10.11.2014, Бюл-летень № 31. [Kit OI, Vashchenko LN, Todorov SS, Ibragimova EL, Ausheva TV. Method to predict recurrence of soft tissue sarcoma. Pat-ent №2532332 of the Russian Federation, МПК A61B. Published 10.11.2014, Bulletin № 31. (In Russ.)]
7. Смолякова Р.М., Машевский А.А., Кохнюк В.Т. и др. Прогностическая значимость экс-прессии маркеров опухолевой пролиферации ki-67, p53 и bcl-2 у больных колоректальным раком и полипозом. Онкологический журнал. 2008;2(1):29-39. [Smolyakova RM, Meshevsky AA, Kokhnyuk VT et al. Prognostic significance of ki-67, p53 and bcl-2 expression in colon can-cer and adenomas. Onkologicheskiy zhurnal. 2008;2(1):29-39. (In Russ.)]
8. Сакало А.В., Базалицкая С.В., Бонда-ренко Ю.М. и др. Прогностическое значение р53 и bcl-2 у больных герминогенными опу-холями яичка в динамике прогрессирования заболевания и химиотерапевтического лече-ния. Урологія. 2012;16(1):68-72. [Sakalo AV, Ba-zalitskaya SV, Bondarenko YuM et al. Prognos-tic value of p53 and bcl-2 in patients with germ cell tumors of the testis in the dynamics of dis-ease progression and chemotherapy. Urologiya. 2012;16(1):68-72. (In Russ.)]
9. Петров С.В., Райхлин Н.Т. (ред.). Ру-ководство по иммуногистохимической диа-гностике опухолей человека. 4-е изд. Казань, 2012. 624 с. [Petrov SV, Raikhlin NT, eds. Guid-ance on the immunohistochemical diagnosis of human tumors. 4th ed. Kazan, 2012. 624 pp. (In Russ.)]
10. Черноусов А.Ф., Богопольский П.М., Курбанов Ф.С. Хирургия пищевода. М.: Меди-цина, 2000. 350 с. [Chernousov AF, Bogopolskiy PM, Kurbanov FS. Esophagus surgery. Moscow: Meditsina, 2000. 350 pp. (In Russ.)]
11. Borovikov V.P. STATISTICA: the art of data analysis on the computer. For professionals. SPb.: Piter, 2001.
12. Ferlay J., Shin H.R., Bray F. et al. Estimates of worldwide burden of cancer in 2008: GLOBO-CAN 2008. Int J Cancer. 2010; 127:2893–2917.
13. Murata A., Baba Y., Watanabe M. et al. p53 immunohistochemical expression and patient prognosis in esophageal squamous cell carcino-ma. Med Oncol. 2013;30(4):728.
14. McCormick Matthews L.H., Noble F., Tod J. et al. Systematic review and meta-analysis of immunohistochemical prognostic biomarkers in resected oesophageal adenocarcinoma. Br J of Cancer. 2015; 113(1):107-118. DOI:10.1038/bjc.2015.179.
Figure 2. Proliferative activity of tumors (per-centage) in dependence on time to progression in patients with stage II-III EC. The Y axis - %.
Fig. 3. Squamous cell carcinoma of the esophagus. Days to progression: A – 180, Б - 364 days, В – 540. Expression of E-cadherin. 400x magnification.
References

3’ 2019 23
Obesity is one of the main risk factor for the development of socially important diseases, determining the life quality and human longevity. Ac-cording to the World Health Organization (WHO) overweight and obesity are dramatically increased all over the world. This problem is particularly acute in industrialized countries, where it is becoming a non-infectious pandemic. Thus, it is critically important to focus our research efforts on studying of the genetic basis of the obesity spread in modern human populations. Genetic markers that are related to obesity and quantitative characters as body mass index (BMI), blood lipid levels and others have been identified as a result of number of studies. In the present study the variability of the GWAS-identified SNP allele frequencies associated with BMI and obesity was studied. The results of our study were compared with data on 20 populations from the international project “1000 Genomes”. Genetic markers that make the greatest contribution to the genetic differentiation of populations were identified.
Keywords: human populations, polymorphism, obesity, body mass index.
Obesity is a complex, largely prevent-able disease that, together with over-weightness, affects more than a third of the world's population today. This pheno-type is known to increase the morbidity
of many socially significant diseases. In particular, overweightness and obesity can contribute to the development of type 2 diabetes even in the absence of other metabolic disorders (hypertension, dys-lipidemia, insulin resistance) [29]. Over-weightness is a recognized risk factor for cardiovascular diseases and ischemic stroke that are responsible for the majori-ty of deaths in the modern world. Obesity is also associated with oncological dis-eases. About 6% of cancer diseases (4% in men, 7% in women) have been shown to be associated with obesity [27]. More recently, evidence has been obtained that overweightness and obesity increase the risk of developing cancer of the gallblad-der, prostate, ovarian epithelium, liver, as well as leukemia. [11, 21-23, 26].
Obesity is associated with anatomi-cal as well as functional changes in the human brain. Studies of elderly people have shown that the body mass index (BMI) is negatively correlated with the brain volume and is associated with at-rophy of the frontal lobes, hippocampus and thalamus. [10]. Moreover, obesity in children and adolescents is associated with a smaller amount of gray matter in the orbitofrontal cortex [28]. Overweight-ness in middle-aged patients increases the risk of developing Alzheimer's dis-ease and vascular dementia by 35% and 33%, respectively; an even higher risk of these diseases is observed in obesity [9]. Thus, the influence of overweightness and obesity on human health is signifi-cant, especially in combination with other concomitant diseases.
As is known, this phenotype has a genetic nature. According to studies of twins, the coefficient of obesity heritabili-ty has been found about 40% [12]. Over the past decade, many scientific papers
on the association of candidate genes with obesity have been published, but the results of these studies are largely con-tradictory [19]. This is probably due to the influence of adaptive, ethnic, economic and sociocultural factors. In particular, the indigenous populations of the Siberia and the Far East in the period of adap-tation to low atmospheric temperatures acquired special anatomical features contributing to a decrease in heat trans-fer (constitution with a developed muscu-loskeletal mass, high body density, etc.) [1]. The Republic of Sakha (Yakutia) is one of the arctic and subarctic regions of the Russian Federation. According to the 2017 data of the Ministry of Health of the Russian Federation, the frequency of obesity in the Yakut population is 593.0 per 100 thousand people [5]. It should be noted that the relatively high prevalence of obesity among individuals living in the Republic of Sakha (Yakutia) can be asso-ciated not only with their adaptive prop-erties, but also with changes in the tradi-tional lifestyle and characteristic features of modern nutrition.
The aim of this work is to investigate the genetic markers associated with obe-sity and BMI as part of the genome-wide association study (GWAS), to study the variability of these markers in the pop-ulation sample of Yakuts in comparison with world populations using the methods of the statistical analysis of the data ob-tained.
Materials and methods. The study was conducted on a population sample of Yakuts. The sample included 95 non-ad-mixed and unrelated individuals: 30 men (mean age of 27.56±18.61 years) and 65 women (mean age of 31.02±16.49 years). This sample was collected the Byadi village, the Republic of Sakha (Ya-
A.A. Popovich, E.A. Trifonova, A.V. Bocharova, K.V. Vagaitseva, N.R. Maksimova V.A. StepanovGENETIC DIVERSITY IN YAKUT POPULATION BY LOCI ASSOCIATED WITH BODY MASS INDEX AND OBESITYDOI 10.25789/YMJ.2019.67.06
POPOVICH Anastasia Andreevna, Ph.D. Ju-nior Researcher, Research Institute of Medical Genetics, Federal State Budgetary Scientific Institution «Tomsk National Research Medical Center of the Russian Academy of Sciences», [email protected]; TRIFONOVA Ekaterina Aleksandrov-na, Ph.D. Scientific Researcher, Research Institute of Medical Genetics, Federal State Budgetary Scientific Institution «Tomsk Na-tional Research Medical Center of the Rus-sian Academy of Sciences», [email protected], BOCHAROVA Anna Vladimirovna Junior Researcher, Research Institute of Medical Genetics, Federal State Budgetary Scientific Institution «Tomsk Na-tional Research Medical Center of the Russian Academy of Sciences», [email protected], VAGAITSEVA Ksenia Valer-ievna, Ph.D. Scientific Researcher, Research Institute of Medical Genetics, Federal State Budgetary Scientific Institution «Tomsk Na-tional Research Medical Center of the Russian Academy of Sciences», [email protected], MAXIMOVA Nadezhda Ro-manovna, Dr.Sc. Chief Researcher of the Clinic of the Medical Institute of Federal state Autonomous educational institution of higher professional education «North-Eastern Fed-eral University named after M. K. Ammosov», [email protected], STEPANOV Vadim Ana-tolevich, Dr.Sc., correspondent member RAS Head of the Laboratory of Evolutionary Genet-ics, Research Institute of Medical Genetics, Federal State Budgetary Scientific Institution «Tomsk National Research Medical Center of the Russian Academy of Sciences» Acting Director of Federal State Budgetary Scientific Institution «Tomsk National Research Medical Center of the Russian Academy of Sciences», [email protected].

ЯКУТСКИЙ МЕДИЦИНСКИЙ ЖУРНАЛ24
kutia). Additionally, the study included the results of genotyping of 20 populations from the “1000 Genomes” project (Esan, Gambian, Luhya, Mende, Yoruba, Peru-vian, Bengali, Chinese Dai in Xishuang-banna, Han Chinese in Bejing, Southern Han Chinese, Japanese, Kinh, Finnish, British, Iberian, Toscani, Gujarati In-dian, Indian Telugu, Punjabi, Sri Lankan Tamil).
Genetic markers were selected from the GWAS catalog, where they have shown statistically significant associa-tions with BMI and/or obesity in two or more studies. Thus, 58 single nucleo-tide polymorphisms (SNPs) were stud-ied, genotyping of which was conduct-ed using the MALDI-TOF mass spec-trometry method [3]. 7 out of 58 SNPs (rs10968576, rs13130484, rs11671664, rs12566985, rs17381664, rs2287019 and rs657452) demonstrated a low ge-notyping efficiency (less than 70%) and were excluded from the analysis.
To verify the Hardy-Weinberg equi-librium in the obtained distribution of genotypes and allele frequencies, the c criterion was used. The expected hetero-zygosity reflecting the percentage of het-erozygotes in the population sample was estimated. To study genetic diversity, we calculated the values of expected hetero-zygosity, but not observed one, because in small samples the frequencies of gen-otypes and the observed heterozygosity, for random reasons, can significantly de-viate from the general values [2]. Genetic differentiation of the populations under study was calculated using analysis of molecular variance (AMOVA). To study genetic relationships, we used the prin-cipal components method. Statistical processing of the results was carried out using the software packages «Arlequin 3.5» and «Statistica 7.0».
Results and discussion. In this work, an analysis of the genetic diversity of the Yakut population was conducted. The frequencies of the ancestral alleles of the Yakut population sample, the av-erage values of expected heterozygosity (He) and genetic differentiation (Fst) for the studied polymorphic variants in the 21 populations are presented in Table 1. The deviation of the conformity of the distribution of genotype frequencies with the Hardy-Weinberg equilibrium in Ya-kuts was shown for 2 out of 51 studied SNPs: rs2207139 located in the intergen-ic region and rs7903146 of the TCF7L2 gene. Statistically significant deviations (p<0.05) from the Hardy-Weinberg equi-librium probably reflect specific features of population-genetic processes, among which may be such a factor as the func-
tional significance of SNPs. In general, the population sample of Yakuts is char-acterized by a significant genetic variabil-ity: the frequencies of ancestral alleles range from 0.00 for the rs13021737 lo-cus to 1.00 for the rs11847697 locus located in the intergenic region and the rs13107325 locus of the SLC39A8 gene. The frequency of the ancestral allele of the rs13021737 locus in the populations from the “1000 Genomes” project varies in the range from 0.05 in Luhya to 0.21 in Toscani; rs11847697 – from 0.56 in Yoru-ba to 1.00 in Han Chinese from Bejing, Southern Han Chinese, Kinh, and Japa-nese; rs13107325 – from 0.89 in Toscani to 1.00 in 15 out of 20 population sam-ples from the “1000 Genomes” project. Thus, the indices of the variability of the ancestral allele frequencies of the SNP data in Yakuts correspond to those in the world populations.
The average level of genetic diver-sity in the population sample of Yakuts for 51 SNPs was 0.340, this index cor-responds to the average level of genetic diversity in 21 population samples for all studied SNPs – 0.328. The highest ge-netic diversity were shown for the loci rs2112347 of the gene LOC441087 and rs7141420 of the gene NRXN3, the low-est – for the loci rs6804842 of the gene RARB and rs9540493 located in the in-tergenic region. These genetic markers are characterized by an average level of between-population genetic diversity (from 2% to 6,2%), which corresponds to the level of genetic differences be-tween populations for different genetic markers, according to the results of other studies [8]. The greatest contribution to the genetic differentiation of populations is made by the rs1167827 loci of the HIP1 gene, where the Fst index is equal 45.9%, which significantly exceeds the average Fst in the studied populations (9.8%). This locus is associated with BMI in several studies; the HIP1 gene product is involved in clathrin-mediated endocytosis in cells and is associated with the development of prostate can-cer and Huntington's disease [15, 17, 18]. The rs10182181 and rs11847697 markers located in the intergenic region are also characterized by high values of Fst. According to the GWAS catalog, the 10182181 marker was shown to be asso-ciated with obesity and BMI, rs11847697 – with BMI [7, 13, 14, 16]. According to the HaploReg v4.1 online resource, the rs10182181 marker is closely linked to an rs11676272 allelic variant of the ADCY3 gene (r2=0,97; D'=0,99) [20]. The prod-uct of this gene is known to be widely expressed in various tissues, whereas
the polymorphic variants of the ADCY3 gene are associated with obesity [6, 25]. Epigenetic studies have shown the sig-nificance of the methylation of the CpG sites of the ADCY3 gene in the molec-ular mechanisms of obesity develop-ment. The smallest genetic differences between populations have been found for the rs13021737 and rs1800437 loci, where Fst comprises 1.9%.
Fig. 1 presents an analysis of the ge-netic relationships of world populations according to frequencies of the ances-tral alleles of genetic markers associ-ated with obesity and BMI. The first 2 main components account for 68.4% of the total variability of allele frequencies in the analyzed population samples. The position of the studied populations in the space of the principal components reflects their geographical localization, i.e. geographically close populations get into one cluster (African, East Asian, West European clusters and Hindustan cluster), which corresponds to the re-sults obtained in previous works [4]. The population sample of Yakuts is located in the space of the principal components together with the East Asian populations, which characterizes its genetic proximity to this cluster. Yakuts, as well as popula-tion samples of Chinese, Japanese and Kinh, belong to the Mongoloid race.
The first main component is likely to correspond to the contribution of sever-al climatic and geographical factors: a correlation of the values of this compo-nent with absolute latitude (R=-0.596, p=0.004) and longitude (R=-0.636, p=0.002) and temperature indices (aver-age annual temperature (R = 0.556, p = 0.009), temperature of the coldest (R = 0.642, p = 0.002) and warm (R = 0.438, p = 0.047) months and temperature vari-ation (R = -0.607, p = 0.004)) was found for 51 SNPs. The second main compo-nent reflects a change in the absolute longitude index (R=0.599, p=0.004).
Conclusion. Currently, obesity has become one of the most important med-ical and social problems, due to its pro-gressive spread and severity of compli-cations. Genetic predisposition is one of the important factors in the pathogene-sis of obesity. In this work, we identified high genetic diversity and differentiation in the 21 world populations according to the studied genetic markers associated with obesity and body mass index. The Yakut population is characterized by a significant intrapopulation genetic vari-ability (0.340). We found a correlation between allele frequencies for 51 SNPs and changes in climatic and geographi-cal conditions. The analysis of the main

3’ 2019 25
components showed the genetic affinity of the Yakut popula-tion to the East Asian population samples. Genetic markers that better characterize genetic differences between the studied populations, in par-ticular, rs1167827 of the HIP1 gene and rs10182181 and rs11847697 located in the intergenic re-gion, were identified.
This work was carried out with the support of the Rus-sian Foundation for Basic Research No. 18-04-00758.
1. Alekseeva T. I. Geographical environment and human biology I. Alekseeva // M.: Thought. – 1977. – 302 p.
2. Zhivotovsky LA Population biometrics / L.А. Zhivotovsky // M: Science. – 1991. –271 p.
3. Stepanov V.A. Multiplex SNP genotyping by MALDI-TOF mass spectrometry: Frequencies of 56 immune response gene SNPs in human pop-ulations / V.A. Stepanov, E.A. Trifonova // Molec-ular Biology. – 2013. – 47(6). – P. 852-862. DOI: 10.1134/S0026893313060149.
4. Stepanov V.A. Ethnogenomic population of Siberia and Central Asia / V.A. Stepanov // Tomsk: Printed Manufactory. – 2002. - 242 p.
5. Ministry of Health of the Russian Federa-tion https://www.rosminzdrav.ru/ministry/61/22/stranitsa-979/statisticheskie-i-informatsion-nye-materialy/statisticheskiy-sbornik-2017-god Accessed May 20, 2019.
6. Adenylate cyclase 3: a new target for an-ti-obesity drug development / L. Wu, C. Shen, M. Seed Ahmed [et al.] // Obes Rev. – 2016. – 17(9). – Р. 907-914. DOI: 10.1111/obr.12430.
7. Association analyses of 249,796 individuals reveal 18 new loci associated with body mass in-dex / Speliotes E.K., Willer C.J., Berndt S.I. [et al.] // Nat Genet. – 2010. – 42(11). – P. 937-948. DOI:10.1038/ng.686.
8. Between Lake Baikal and the Baltic Sea: genomic history of the gateway to Europe / P. Triska, N. Chekanov, V. Stepanov [et al.] // BMC Genet. – 2017. – 18(1). DOI: 10.1186/s12863-017-0578-3.
9. Body mass index in midlife and late-life as a risk factor for dementia: a meta-analysis of prospective studies / K.J. Anstey, N. Cherbu-in, M. Budge [et al.] // Obes Rev Off J Int Assoc Study Obes. – 2011. – 5. – P. 426-437. DOI: 10.1111/j.1467-789X.2010.00825.x.
10. Brain structure and obesity / C.A. Raji, A.J. Ho, N.N. Parikshak [et al.] // Hum Brain Mapp. –2010. – 31(3). – P. 353-364. DOI: 10.1002/hbm.20870.
11. Discacciati A. Body mass index and inci-dence of localized and advanced prostate can-cer--a dose-response meta-analysis of prospec-tive studies / A. Discacciati, N. Orsini, A. Wolk // Ann Oncol Off J Eur Soc Med Oncol ESMO. – 2012. – 23(7). – P. 1665-1671. DOI: 10.1093/annonc/mdr603.
12. Evidence for a strong genetic influence on childhood adiposity despite the force of the obe-sogenic environment / J. Wardle, S. Carnell, C.M. Haworth [et al.] // Am J Clin Nutr. – 2008. – 87. – P. 398-404.
13. Genetic studies of body mass index yield new insights for obesity biology / Locke A.E., Kahali B., Berndt S.I. [et al.] // Nature. – 2015. – 518(7538). – P. 197-206. DOI:10.1038/na-ture14177.
14. Genome-wide association analysis iden-tifies three new susceptibility loci for childhood body mass index / Felix J.F., Bradfield J.P., Mon-nereau C. [et al.] // Hum Mol Genet. – 2016. – 25(2). – P. 389-403. DOI:10.1093/hmg/ddv472.
15. Genome-wide association study identifies 112 new loci for body mass index in the Japanese population / M. Akiyama, Y. Okada, M. Kanai [et al.] // Nat Genet. – 2017. – 49(10). – P. 1458-1467. DOI: 10.1038/ng.3951.
16 Genome-wide meta-analysis identifies 11 new loci for anthropometric traits and provides in-sights into genetic architecture / Berndt S.I., Gus-tafsson S., Mägi R. [et al.] // Nat Genet. – 2013. – 45(5) – P. 501-512. DOI:10.1038/ng.2606.
17. Genome-wide meta-analysis of 241,258
Genetic diversity and differentiation of population samples for 51 SNPs studied
SNP
Anc
estra
l alle
le
Freq
uenc
ies o
f an
cest
ral a
llele
s (Y
akut
s)
He
(21
popu
latio
ns)
Fst
SNP
Anc
estra
l alle
leFr
eque
ncie
s of
ance
stra
l alle
les
(Yak
uts)
He
(21
popu
latio
ns)
Fst
rs10182181 G 0.147 0.387 0.222 rs2568958 G 0.053 0.368 0.126rs10938397 A 0.870 0.410 0.037 rs3101336 T 0.053 0.368 0.126rs1121980 A 0.324 0.434 0.052 rs3810291 G 0.598 0.371 0.185rs1167827 G 0.089 0.276 0.459 rs3817334 C 0.665 0.409 0.057rs11847697 C 1.000 0.246 0.219 rs571312 C 0.768 0.372 0.042rs12429545 G 0.711 0.257 0.088 rs633715 T 0.582 0.248 0.049rs12446632 G 0.979 0.135 0.036 rs6567160 T 0.768 0.345 0.023rs12463617 A 0.165 0.259 0.029 rs6804842 A 0.363 0.468 0.062rs12940622 A 0.371 0.443 0.065 rs6864049 G 0.702 0.379 0.072rs13021737 A 0.000 0.205 0.019 rs7138803 G 0.737 0.369 0.048rs13107325 C 1.000 0.116 0.076 rs7141420 T 0.418 0.476 0.036rs13191362 A 0.953 0.115 0.047 rs7164727 C 0.847 0.406 0.167rs1421085 T 0.697 0.305 0.118 rs7195386 C 0.694 0.373 0.165rs1514175 A 0.541 0.436 0.083 rs7498665 G 0.263 0.328 0.099rs1516725 C 0.989 0.193 0.024 rs7531118 T 0.555 0.335 0.160rs1558902 T 0.654 0.306 0.120 rs7647305 T 0.228 0.322 0.105rs16851483 G 0.815 0.228 0.117 rs7903146 T 0.043 0.293 0.097rs17094222 T 0.769 0.274 0.096 rs8050136 A 0.326 0.399 0.061rs17782313 T 0.761 0.356 0.025 rs887912 C 0.984 0.201 0.119rs1800437 G 0.823 0.268 0.019 rs9540493 A 0.750 0.447 0.061rs2030323 A 0.255 0.328 0.145 rs9568867 G 0.707 0.245 0.087rs2033529 A 0.648 0.284 0.046 rs9641123 G 0.744 0.337 0.124rs2112347 G 0.451 0.488 0.020 rs9816226 T 0.989 0.230 0.041rs2206277 C 0.640 0.323 0.040 rs987237 A 0.747 0.280 0.047rs2207139 A 0.686 0.273 0.061 rs9941349 C 0.676 0.364 0.070rs2531995 C 0.633 0.375 0.139 Среднее - - 0.328 0.098
He (21th population) – the values of the average expected heterozygosity in the 51 popu-lations (the Yakut population and 20 populations from the project “1000 Genomes”), Fst – the values of genetic differentiation of populations.
Fig. 1. Positions of the populations in space of the first two prin-cipal components of the allele frequencies for 51 SNPs.: YAB – Ya-kut, ESN – Esan, GWD – Gambian, LWK – Luhya, MSL – Mende, YRI – Yoruba, PEL – Peruvian, BEB – Bengali, CDX – Chinese Dai in Xishuangbanna, CHB – Han Chinese in Bejing, CHS – Southern Han Chinese, JPT – Japanese, KHV – Kinh, FIN – Finnish, GBR – British, IBS – Iberian, TSI – Toscani, GIH – Gujarati Indian, ITU – Indian Telugu, PJL – Punjabi, STU – Sri Lankan Tamil.
References

ЯКУТСКИЙ МЕДИЦИНСКИЙ ЖУРНАЛ26
adults accounting for smoking behaviour identi-fies novel loci for obesity traits / A.E. Justice, T.W. Winkler, M.F. Feitosa [et al.] // Nat Commun. – 2017. – 8. DOI: 10.1038/ncomms14977.
18. Genome-wide physical activity interac-tions in adiposity - A meta-analysis of 200,452 adults / M. Graff, R.A. Scott, A.E. Justice [et al.] // PLoS Genet. – 2017. – 13(4). e1006528. DOI: 10.1371/journal.pgen.1006528.
19. GWAS Catalog [Electronic resource]. URL: https://www.ebi.ac.uk/gwas/ Accessed Sep-tember 30, 2018.
20. HaploReg v4.1 [Electronic resource]. URL: https://pubs.broadinstitute.org/mammals/haploreg/haploreg.php Accessed September 12, 2018.
21. Larsson S.C. Obesity and the risk of gall-bladder cancer: a meta-analysis / S.C. Larsson, A. Wolk // Br J Cancer. – 2007. – 96(9) – P. 1457-1461.
22. Larsson S.C. Overweight and obesity and
incidence of leukemia: a meta-analysis of cohort studies / S.C. Larsson, A. Wolk // Int J Cancer J Int Cancer. – 2008. – 122(6). – P. 1418–1421.
23. Larsson S.C. Overweight, obesity and risk of liver cancer: a meta-analysis of cohort studies / S.C. Larsson, A. Wolk // Br J Cancer. – 2007. – 97(7). – P. 1005-1008.
24. Many obesity-associated SNPs strongly associate with DNA methylation changes at prox-imal promoters and enhancers / S. Voisin, M.S. Almén, G.Y. Zheleznyakova [et al.] // Genome Med. – 2015. – 7. – Р.103. DOI: 10.1186/s13073-015-0225-4.
25. Maternal preconception body mass index and offspring cord blood DNA methylation: ex-ploration of early life origins of disease / X. Liu, Q. Chen, H.J. Tsai [et al.] // Environ Mol Muta-gen. – 2014. – 55(3). – Р. 223-230. DOI: 10.1002/em.21827.
26. Obesity and the risk of epithelial ovarian cancer: a systematic review and meta-analysis /
C.M. Olsen, A.C. Green, D.C. Whiteman [et al.] // Eur J Cancer Oxf Engl 1990. – 2007. – 43(4). – P. 690-709.
27. Polednak A.P. Estimating the number of U.S. incident cancers attributable to obesity and the impact on temporal trends in incidence rates for obesity-related cancers / A.P. Polednak // Cancer Detect Prev. –2008 – 32(3). – P. 190-199. DOI: 10.1016/j.cdp.2008.08.004.
28. Reinert K.R.S. The Relationship be-tween Executive Function and Obesity in Chil-dren and Adolescents: A Systematic Literature Review / K.R.S Reinert, E.K. Po’e, S.L. Bar-kin [et al.] // J Obes. – 2013. – P. 1-10. DOI: 10.1155/2013/820956.
29. The magnitude of association between overweight and obesity and the risk of diabetes: A meta-analysis of prospective cohort studies / A. Abdullah, A. Peeters, M. de Courten [et al.] // Di-abetes Res Clin Pract. – 2010. – 89(3). – P. 309-319. DOI: 10.1016/j.diabres.2010.04.012.
We studied lipid spectrum features in indigenous and non-indigenous residents of Asian North in Russia against the levels of dehydroepiandrosterone sulfate (DHEA-S) and testosterone. Ma-terials and methods: We compared the main parameters of lipid and sex hormone metabolism in indigenous and non-indigenous men inhabitants of Asian North with those of relatively healthy men in Western Siberia (comparison group). Results: lipid profile of indigenous men featured lipoprotein spectrum shifted towards high-density lipoprotein cholesterol compared with lipid pro-file of non-indigenous population and comparison group. Atherogenicity coefficient in indigenous people lied within permissible values. We revealed that low-density lipoprotein cholesterol level and atherogenic coefficient positively correlated with chronological age, and high-density lipo-protein cholesterol level positively correlated with DHEA-S both in native and non-indigenous residents of Asian North. DHEA-S level in non-indigenous population was found to negatively correlate with triglycerides and atherogenic coefficient. This group of men was characterized by high levels of total cholesterol, triglycerides, low-density lipoprotein cholesterol and high athero-genic coefficient.
Keywords: lipid profile, sex hormones, indigenous and non-indigenous residents, Asian North, Arctic zone of the Russian Federation.
L.B. Kim, L.P. Osipova, A.A. Rozumenko, A.N. Putyatina, G.S. Russkikh, T.V. Kozaruk, N.P. VoroninaLIPID SPECTRUM FEATURES AND RELA-TIONSHIP BETWEEN SPECIFIC CLASSES OF LIPIDS AND SEX HORMONE LEVELS IN ASIAN NORTH MENDOI 10.25789/YMJ.2019.67.07
Introduction. For the last decade, economic development of the Arctic zone of the Russian Federation (AZRF) has been considered a priority of state policy as exploration and development of huge reserves of natural gas and oil in the Arc-tic will help to achieve sustainable eco-nomic growth and improve life quality not only of AZRF residents but nationwide.
Some researchers often distinguish between European and Asian North of Russia based on climatic factors and geographical location [4, 7, 8]. It is not unlikely that these factors as well as food patterns, nationality, age, degree of physical fitness and activity, ecologi-cal situation and heredity determine the current demographic situation in these
regions. In particular, it is known that total primary incidence by ICD-10 (A00–T98) per 100.000 population in Yamal-Nenets Autonomous District (Asian North of Rus-sia) in 2007-2016 was higher than in Mur-mansk Region (European North of Rus-sia) [3]. The same ratio was for arterial hypertension incidence.
The prevalence of major circulatory diseases in non-indigenous population of AZRF and a high risk of cardiovascular pathology are caused by the negative impact of extreme climatogeographic factors, such as cold, wind, dry air, con-trasting photoperiodism, intense cosmic radiation, geomagnetic fluctuations and increasing anthropogenic pollution of some areas.
KIM Lena Borisovna – Doctor of Medical Sciences, chief researcher, Head of Group of Connective Tissue Biochemistry, Fed-eral Research Center of Fundamental and Translational Medicine (FRC FTM), contacts: [email protected], +7(383)334-82-11, 2 ul. Timakova, 630117, Novosibirsk, Russia. OSIPOVA Lyudmila Pavlovna – Candidate of Biological Sciences, 1Head of Laboratory of Population Ethnogenetics, Institute of Cy-tology and Genetics SB RAS, 10 pr. akad. Lavrent'eva, Novosibirsk, Russia; 2Novosibirsk State University, 2 ul. Pirogova, Novosibirsk, Akademgorodok, Russia. ROZUMENKO Aleksandr Anatol'evich – Candidate of Bi-ological Sciences, senior researcher of Lab-oratory of Medical Biotechnology, FRC FTM, 2 ul. Timakova, 630117, Novosibirsk, Russia. PUTYATINA Anna Nikolaevna – Candidate of Medical Sciences, researcher in Group of Connective Tissue Biochemistry, FRC FTM, 2 ul. Timakova, 630117, Novosibirsk, Russia. RUSSKIKH Galina Sergeevna – Candidate of Biological Sciences, senior researcher of Laboratory of Medical Biotechnology, FRC FTM, 2 ul. Timakova, 630117, Novosibirsk, Russia. KOZARUK Tat'yana Vladimirovna – specialist in clinical laboratory diagnostics, RI ECM, FRC FTM, 2 ul. Timakova, 630117, Novosibirsk, Russia. VORONINA Natal'ya Petrovna – Doctor of Biological Sciences, se-nior researcher, specialist in clinical laboratory diagnostics, RI ECM, FRC FTM, 2 ul. Timako-va, 630117, Novosibirsk, Russia.

3’ 2019 27
Many authors also attribute the growth of cardiovascular diseases (CVD) inci-dence in extreme AZRF conditions to unfavorable lipid profile [5, 9, 11, 21]. Individual characteristics of lipid metabo-lism are influenced by numerous factors: nutrition, degree of physical fitness and activity, ecological situation, heredity, age, nationality, place of residence. For instance, the residents of the eastern part of the southern Arkhangelsk region (61-62° N) had higher levels of low-density lipoprotein cholesterol (LDL-C) and phos-pholipids compared with those in western part of the region [17]. Studying the rep-resentatives of indigenous and non-indig-enous residents living in the same area can be expected to reveal group-specific features of lipid metabolism that are not associated with the influence of AZRF cli-matic factors.
It is common knowledge that LDL-C plays a leading role in atherogenesis. Un-der oxidative stress, LDL-C modifies and increases its atherogenic properties. The levels of oxidized LDL-C significantly in-crease with age [22]. Sex hormone levels also change with age. Men aged 60-69 residing in European North had 1/3 of de-hydroepiandrosterone sulfate (DHEA-S) levels in young group (up to 29) [25]. There was no positive correlation be-tween DHEA-S and lipid levels. Some epidemiological studies of men, however, found a link between low levels of DHEA and DHEA-S with increased CVD risk [19, 20], while another study shows no correlation [23]. SCORE-based cardio-vascular risk in European North miners was significantly higher than in group of men living in Western Siberia [25]. Car-diovascular risk of northerners increased from low to very high values with chrono-logical age.
The relevance of this study is also re-lated to emerging reports that differences in lipid profile of indigenous and non-in-digenous northerners tend to erase, which may be due to changes in the life-style of the former [2].
Objective: to identify the features of lipid spectrum in indigenous and non-in-digenous Asian North residents living at the same latitude and to assess the rela-tionship between specific indicators of lip-id metabolism and the levels of DHEA-S and testosterone.
Materials and methods. The study was conducted among men of Samburg village (67° N, 78° E), Yamal-Nenets Autonomous District, in spring (March–April). The study involved informed con-sent enrollment of indigenous population (group 1, men (n=18) with the mean age of 38.06±2.92) and non-indigenous pop-
ulation (group 2, men (n=19) with the mean age of 43.79±2.68, polar expe-rience of 23.75±5.22). The indigenous population included forest and tundra Nenets who preserved a traditional food pattern, engaged in reindeer husband-ry, fishing and hunting. Representatives of non-indigenous population were en-gaged in physical labor, preferred Eu-ropean food patterns. Both groups had comparable physical activity (1.4–1.6). The comparison group consisted of ap-parently healthy men of the same age (group 3, men (n=14) with the mean age of 42.86±3.45) living in Novosibirsk (55° N, 82° E, Western Siberia).
This study approved by the Ethics committees of FRC ICG SB RAS and FRC FTM was performed in accordance with the requirements of "Ethical prin-ciples for medical research involving human subjects" and "Rules for clinical practice in the Russian Federation".
Blood was sampled from ulnar vein on an empty stomach after night fasting. The levels of the following components were determined: total cholesterol (TC), very low-density lipoprotein cholesterol (VLDL-C), LDL-C, high-density lipoprotein cholesterol (HDL-C), triglycerides (TGs), DHEA-S, and testosterone. Atherogen-ic coefficient (AC) was also calculated.
Levels of TC and TG, as well as HDL-C and LDL-C were determined using Ther-mo Fisher Scientific (USA) and DiaSyS (Germany) kits, respectively. Measure-ments were carried out using automatic biochemical analyzer AU 480 Beckman Coulter (USA). Levels of DHEA-S and testosterone were measured using "Ste-roid ELISA-DHEA-sulfate" and "Steroid ELISA-testosterone" tests (Russia) for
ELISA. The results were read using a microplate reader Stat Fax-2100 (Aware-ness Technology Inc., USA).
Data were statistically processed us-ing Statistica v. 10 package (Stat Soft Inc., USA). Mann-Whitney U–test was used to compare two independent groups by the same parameter. Nonparametric Spearman’s rank correlation coefficient (r) was used to assess the correlation between individual characteristics. The data are presented as M±m, where “M” is the arithmetic mean and “m” is the mean error. Differences were considered statis-tically significant at p<0.05.
1. Results and discussion. Table 1 shows the levels of lipids, sex hor-mones and AC in study groups. Except for HDL-C, group 1 men had significantly lower lipid levels compared to group 2.
Group 1 had 2.3-, 2.8- and 1.2-times higher levels of TG, LDL-C and TC, re-spectively, compared to group 2. This af-fected AC value that was 2.1-times lower than in group 2. HDL-C levels in group 1 was 1.4-times higher than in group 2. TG levels in group 1 was 1.3-times lower than in group 3. Characteristics of lipid metabolism were identified in the study of first- and second-generation young Caucasians born in the North and indig-enous students of Magadan Region (the Evens, the Koryaks, the Chukchis) [1]. The characteristics reflect ethnic differ-ences in metabolic processes shaped by long-term adaptation to North conditions. In the indigenous group, TC, TG, LDL-C levels were lower and the concentration of HDL-C was higher than in the group of Caucasians born in the North.
Levels of TG, TC, LDL-C and AC value in group 2 study exceeded the permissi-
Lipid and sex hormone levels in serum of male representatives of indigenousand non-indigenous population of AZRF (M±m)
ParameterGroup
pindigenous non-indigenous comparison1 2 3
Age, years 38.06±2.92 43.79±2.68 42.86±3.45 –
TC, mM/l 4.76±0.24 5.70±0.35 4.41±0.26 1-2=0.0342-3=0.006
ТG, mM/l 0.82±0.06 1.86±0.32 1.40±0.22 1-2=0.0021-3=0.010
VLDL-C, mM/l 0.24±0.04 0.66±0.15 – 1-2=0.011
LDL-C, mM/l 3.06±0.23 3.67±0.31 2.49±0.17 1-3=0.0502-3=0.002
HDL-C, mM/l 1.32±0.07 0.97±0.07 0.92±0.07 1-2=0.0011-3=0.001
AC 2.30±0.23 4.91±0.57 4.28±0.59 1-2=0.0011-3=0.002
DHEA-S, μg/ml 2.33±0.19 2.14±0.17 1.84±0.15 1-3=0.050Testosterone, nM/l 23.04±1.74 18.88±1.99 18.43±2.10 1-3=0.034
Table 1

ЯКУТСКИЙ МЕДИЦИНСКИЙ ЖУРНАЛ28
ble values, which indicated lipid metab-olism disorder, hypertriglyceridemia and hypercholesterolemia. Notably, group 2 lipid profile did not differ from that iden-tified by Z.N. Krivoshapkina and col-leagues [14] when studying non-indige-nous residents of Yakutia with more than 20 years of polar experience. TC and LDL-C levels of group 2 exceeded those of group 3 with normal lipid parameters, with the exception of AC (Table 1).
Lipoprotein lipase is known to bind endothelium capillary and hydrolyzes TG in chylomicrons (CM) and VLDL-C with latter transforming into HDL-C. There could be the following reasons of hyper-triglyceridemia: increased formation of VLDL in liver; disorders of TG hydrolysis in CM and VLDL-C and their transforma-tion into remnants; and blockade of re-ceptor absorption by the cells of CM and VLDL-C remnants [16].
Lipoprotein spectrum shift towards HDL-C in group 1 can be considered as a manifestation of reasonable and eco-nomical metabolic background described earlier as a "northern" or "polar" type of metabolism [6, 12, 13]. Normolipidemia in group 1 can be explained by liver ca-pability of active esterification of TC, in-tensive biosynthesis of bile acids and transportation of sterols to bile [10].
It is generally accepted that increased LDL-C level is a key factor of cardiovas-cular pathology. In one of the studies [24], LDL-C level was predictive of cardiovas-cular risk in patients with type 2 diabe-tes. In persons with diabetes and insulin resistance, as well as in elderly patients, the prognostic value of this parameter is higher. The average level of LDL-C may slightly differ in different populations due to both genetic characteristics and envi-ronmental factors.
The content of sex hormones in groups 1 and 2 did not differ (Table 1). However, DHEA-S and testosterone lev-els in group 1 were higher than in group 3. Sex hormone levels in all groups were within reference values.
Thus, significant differences of lipid metabolism were found when compar-ing two groups of men of similar age and the same class of physical activity living in the same geographical area of Asian North located at the same northern lat-itude. Group 1 had more favorable lip-id profile as evidenced by lower levels of TC, TG, LDL-C and higher levels of HDL-C compared to those of group 2. AC, which is considered as a prognos-tic indicator of atherogenesis and pre-disposition to cardiovascular pathology, did not exceed 2.30 in group 1. Group 2 had increased levels of TC, TG, LDL-C,
LDL-C and AC, which suggests lipid me-tabolism disorder and enable us to clas-sify these men to those at risk of cardio-vascular pathology. This is confirmed by more pronounced deviations of lipid pro-file in non-indigenous people suffering from coronary heart disease compared with the indigenous population with the same pathology [15]. The differences between group 1 and 2 appear to be re-lated to lifestyle and diet, which reflect ethnicity.
Correlations between studied parame-ters were investigated to understand the features of hormonal and metabolic rela-tionships (Table 2). The analysis showed a number of correlations between lipid metabolism indicators inherent in all three groups: a) strong positive correlation be-tween TC and LDL-C levels; b) positive correlation between TG and AC levels with average and strong correlation in groups 1, and 2 and 3, respectively; c) negative correlation between HDL-C and AC levels. Group 1 had an average correlation, while groups 2 and 3 had a strong correlation. The identified relation-ships reflect strong positive correlations between proatherogenic lipid fractions and negative correlations between the anti-atherogenic fraction and AC.
Of great interest were significant cor-relations identified in groups of men living in the same geographical area of the Asian North. Positive correlations between DHEA-S and HDL-C levels, the
level of LDL-C and age, AC index and calendar age of men were common for men in groups 1 and 2. Only group 1 had correlations between LDL-C and TG lev-els and between LDL-C and AC.
Group 2 demonstrated a positive correlation between TC level and age, VLDL-C and TG levels, LDL-C and HDL-C levels, VLDL-C level and AC, negative correlation between HDL-C and TG levels, DHEA-S and TG levels, VLDL-C and HDL-C levels, DHEA-S level and AC. This group featured correlations between more atherogenic lipid fraction – LDL-C and AC, TG – compared with group 1 (LDL-C).
Negative correlations between DHEA-S and AC, as well as DHEA-SC and TG, observed in group 2 only, sug-gest the active DHEA-S participation in lipid metabolism regulation among non-indigenous population of the Asian North. It can be assumed that increased DHEA-S will reduce AC and TG levels. There is evidence of DHEA presence in HDL-C and LDL-C particles of healthy young and middle-aged volunteers [18]. Levels of DHEA and DHEA-S in LDL-C particles progressively decreased with age and were almost undetectable in persons over 65. The same in vitro model study demonstrated that DHEA increased LDL-C resistance to oxidation. LDL-C ox-idation inhibition potential of DHEA were higher than that of vitamin E [18]. Our study revealed significant correlations
Table 2
Relationship between lipid profile indicators and sex hormone levels / age in indigenous and non-indigenous population of Asian North (r; p)
Parameter Groupindigenous non-indigenous comparison
TC – Age – 0.54; 0.021 –TC – TG – – 0.71; 0.005TC – LDL-C 0.83; 0.0005 0.81; 0.0005 0.99; 0.0005TC – AC – – 0.73; 0.003TC – Testosterone – – -0.58; 0.031TG – VLDL-C – 0.85; 0.0005 –TG – LDL-C 0.51; 0.031 – 0.73; 0.003TG – HDL-C – -0.75; 0.0003 -0.63; 0.015TG – AC 0.66; 0.004 0.92; 0.0005 0.79; 0.001TG – DHEA-S – -0.47; 0.044 –HDL-C – VLDL-C – -0.74; 0.001 –HDL-C – AC -0.61; 0.015 -0.81; 0.0005 -0.82; 0.0005HDL-C – DHEA-S 0.68; 0.005 0.48; 0.046 –LDL-C – Age 0.52; 0.028 0.81; 0.0005 –LDL-C – HDL-C – 0.52; 0.026 –LDL-C – AC 0.72; 0.001 – 0.80; 0.001LDL-C – Testosterone – – -0.59; 0.026AC – Age 0.55; 0.022 0.47; 0.045 –AC – VLDL-C – 0.81; 0.0005 –AC – DHEA-S – -0.62; 0.005 –

3’ 2019 29
between DHEA-S and lipid metabolism indicators (HDL-C and TG) in groups 1 and 2 only, which indicates characteristic relationships between lipid metabolism indicators and DHEA-S level in men liv-ing in the Asian North.
Group 3 demonstrated positive cor-relations between TC and TG levels, TC level and AC, TG and LDL-C levels, LDL-C level and AC and negative cor-relations between cholesterol and tes-tosterone levels, TG and HDL-C levels, LDL-C and testosterone levels. These correlations indicate unfavorable lipid profile and moderate cardiovascular risk. Group 3 featured important role of testos-terone in lipid metabolism. The identified correlations between TC, LDL-C and TG levels may predetermine increased AC.
Lipid profiles and sex hormone levels in men differentiate them by risk of dis-eases accompanied by lipid metabolism disorder. The first group of men can be considered favorable as lipid metabolism indicators are within normative values. This is possibly due to high sex hormone level and features of traditional food pat-terns. It should not be however forgotten that this group had correlations between LDL-C, TG and AC. Due to hypertri-glyceridemia, hypercholesterolemia and increased AC, group 2 can be classified into a high risk group. Correlation analy-sis demonstrated the role of age, LDL-C and DHEA-S in atherogenic disease risk. Such lipid spectrum changes can be con-sidered as a "fee" for living in extreme climatic conditions. Group 3 can be char-acterized to have moderate risk of ath-erogenic diseases. Complex interactions between pro- and anti-atherogenic lipid fractions and testosterone involvement in regulation of TC and LDL-C levels only increased AC.
Conclusion. Comparative study re-vealed some features of lipid profile and sex hormones in indigenous and non-in-digenous men of the same age who live in the same climatogeographic area of the Asian North, but have different food patterns. Indigenous men had optimal content of TC, TG, and VLDL-C but their lipid spectrum was shifted towards HDL-C compared with lipid profile of non-indigenous men. AC also indicates more favourable lipid profile of indige-nous people. It can be assumed that the favorable lipid profile of the indigenous people induced by traditional way of life and food patterns will preserve their health and prevent diseases of civiliza-tion, including CVD.
Non-indigenous men had increased TC, TG, LDL-C levels and AC (4.91), which suggests unfavorable lipid profile
and classifies these men into a high car-diovascular disease risk group.
Lipid profile correlations were identi-fied that are "united" by living conditions of the same geographical area and are characteristic for Asian North residents. Calendar age was found to correlate with LDL-C, AC (for indigenous and non-indigenous residents), and TC (for non-indigenous residents). Northerners (indigenous and non-indigenous) also featured a positive correlation between DHEA-S with HDL-C with only non-indig-enous men having negative correlations between DHEA-S, AC, and TG. These correlations indicate significant positive contribution of DHEA-S to lipid metabo-lism regulation in indigenous northern-ers, and a possible negative impact of DHEA-S in non-indigenous northerners, taking into account the known age dy-namics of this hormone.
Average positive correlations between TG and TC levels, TG and LDL-C levels, as well as between TC level and AC was a distinctive feature of the comparison group. Testosterone levels negatively correlated with TC and LDL-C levels in this group. The analysis of lipid profile and relationships between its indicators in men from Western Siberia allows us to classify them into a group of moderate atherogenic disease risk.
The study was carried out with the partial support of the Presidium of the Russian Academy of Sciences under the basic research Program «Exploratory Fundamental studies for the development of Arctic region of the Russian Federa-tion» (FRC FTM) and the project budget № 0324-2019-0041 (FRC ICG SB RAS).
We used the equipment of Core Fa-cility “Modern Optical Systems”, Federal Research Center of Fundamental and Translational Medicine (Novosibirsk, Russia).
Conflict of interests. The authors de-clare that they have no conflict of interest.
1. Аверьянова И.В., Максимов А.Л., Борисенко Н.С. Особенности липидного и углеводного обмена у юношей-аборигенов и укорененных европеоидов Магаданской области. Вест. Сев. (Арктич.) федер. ун-та. Сер.: Мед.-биол. науки. 2016;(2):5–15. [Av-eryanova IV, Maksimov AL, Borisenko NS. Lipid and carbohydrate metabolism in indigenous and Caucasian young males living in the Magadan Region. Vest. Sev. (Arktich.) feder. un-ta. Ser.: Med.-biol. nauki. 2016;(2):5–15. (In Russ.).] DOI: 10.17238/issn2308-3174.2016.2.5
2. Агбалян Е.В., Ионова И.Е. Современные тенденции характера питания и липидного спектра крови жителей коренной националь-ности Крайнего Севера. Проф. забол. и укреп. здоровья. 2005;(3):16–19. [Agbalyan EV, Ion-
ova IE. Current trends in the nature of nutrition and blood lipid spectrum in the indigenous peo-ples of Far North. Prof. zabol. i ukrep. zdorov'ya. 2005;(3):16–19 (In Russ.).]
3. Атлас санитарно-эпидемиологической обстановки на территории Арктической зоны Российской Федерации (2017) / Под ред. д.м.н. С.А. Горбанева. СПб., 2017: 52. [Atlas of the sanitary and epidemiological situation in the Arctic zone of the Russian Federation (2017)] / Ed. by PhD SA. Gorbanev. St. Peterburg, 2017: 52. (In Russ.).]
4. Гудков А.Б., Попова О.Н. Внешнее ды-хание человека на Европейском Севере. Ар-хангельск: Изд-во Северного государствен-ного медицинского университета, 2012: 252. [Gudkov AB, Popova ON. External breathing of a person in the European North. Arkhangel'sk: Izd-vo Severnogo Gos. Med. Univ., 2012: 252. (In Russ.).]
5. Даренская М.А. Особенности метаболи-ческих реакций у коренного и пришлого насе-ления Севера и Сибири. Бюл. ВСНЦ СО РАМН. 2014;(2):97–103. [Darenskaya MA. Peculiarities of metabolic reactions in indigenous and migrant populations of the North and Siberia. Byul. VSNTs SO RAMN. 2014;(2):97–103. (In Russ.).]
6. Казначеев В.В. Механизмы адаптации человека в условиях высоких широт. Л.: Медицина, 1980: 200. [Kaznacheev VV. Mech-anisms of human adaptation in high latitudes. Leningrad: Meditsina, 1980: 200. (In Russ.).]
7. Ким Л.Б. Транспорт кислорода при адап-тации человека к условиям Арктики и карди-ореспираторной патологии. Новосибирск: Наука, 2015: 216. [Kim LB. Oxygen transport in human adaptation to Arctic conditions and cardio-respiratory pathology. Novosibirsk: Nauka, 2015: 216. (In Russ.).]
8. Ким Л.Б., Кожин П.М., Путятина А.Н. Ис-следование молекулярного маркера старения у мужчин Европейского Севера России. Журн. мед.-биол. исследований. 2017;5(3):70–78. [Kim LB, Kozhin PM, Putyatina AN. Study of molecular marker of ageing in male residents of the European North of Russia. Zhurn. med.-biol. issledovanij. Zhurn. med.-biol. issledovanij. 2017;5(3):70–78. (In Russ.).] DOI: 10.17238/issn2542-1298.2017.5.3.70
9. Уварова Т.Е., Бурцева Т.Е., Софронова С.И. [и др.]. Липидный профиль крови и осо-бенности нарушений липидного обмена у ко-ренных малочисленных народов севера Яку-тии. Дальневост. мед. журн. 2012;(3):85–88. [Uvarova TE, Burtseva TE, Sofronova SI [et al.]. The bloode lipid profile and the lipid metabolizm disorders to indegenious people of the Yaku-tia. Dal'nevost. med. zhurn. 2012;(3):85–88 (In Russ.).
10. Цуканов В.В., Ноздрачев К.Г., Тонких Ю.Л. [и др.]. Механизм обратного транспорта холестерина и холелитиаз у северных народ-ностей. Клин. медицина. 2007;85(2):33–35. [Tsukanov VV, Nozdrachev KG, Tonkikh YuL [et al.]. The mechanism of reverse transport of cholesterol and cholelithiasis among in northern peoples. Klin. medicina. 2007;85(2):33–35 (In Russ.).]
11. Воевода М.И., Романова А.Н., Рагино Ю.И. [и др.]. Некоторые особенности факто-ров риска коронарного атеросклероза у жите-лей Якутии. Бюллетень СО РАМН. 2010;30(3): 52–58. [Voevoda MI, Romanova AN, Ragino YuI [et al.]. Some features of coronary atherosclero-sis risk factors in the inhabitants of Yakutia. Byul-leten' SO RAMN. 2010;30(3): 52–58. (In Russ.).]
12. Панин Л.Е. Фундаментальные проблемы приполярной и арктической медицины. Бюллетень СО РАМН. 2013;33(6):5–10. [Panin LE. Fundamental problems of the circumpolar and the Arctic medicine. Byulleten' SO RAMN. 2013;33(6):5–10. (In Russ.).]
References
ЯКУТСКИЙ МЕДИЦИНСКИЙ ЖУРНАЛ30
13. Авцын А.П., Жаворонков А.А., Марычев А.Г. [и др.]. Патология человека на Севере. М.: Медицина, 1985: 415. [Avtsyn AP, Zhavoronkov AA, Marytchev AG [et al.]. Human pathology in the North. Moscow: Meditsina, 1985: 415. (In Russ.).]
14. Кривошапкина З.Н., Миронова Г.Е., Се-мёнова Е.И. [и др.]. Показатели липидного об-мена у пришлых жителей Якутии в зависимо-сти от сроков проживания на Севере. Якутский медицинский журнал. 2018;2(62):28–30. [Krivo-shapkina ZN, Mironova GE, Semenova EI [et al.]. Lipid metabolism in the nonindigenous population of Yakutia depending on length of stay in the Nor-th. Yakut medical journal. 2018;2(62):28–30 (In Russ.).] DOI: 10.25789/YMJ.2018.62.09
15. Яковлева А.И., Охлопкова Е.Д., Кривошапкина З.Н. [и др.]. Состояние анти-оксидантной защиты организма у больных ишемической болезнью сердца в условиях Севера в зависимости от этнической при-надлежности. Якутский медицинский журнал. 2018;2(62):38–40. [Yakovleva AI, Okhlopko-va ED, Krivoshapkina ZN [et al.]. The state of antioxidant protection of the body in patients with coronary heart disease in the North de-pending on ethnicity. Yakut medical journal. 2018;2(62):38–40 (In Russ.).] DOI: 10.25789/YMJ.2018.62.12
16. Титов В.Н. Липопротеиды очень низкой
и низкой плотности: функция, транспорт жирных кислот и диагностическое значение. Клин. лаб. диагностика. 2000;(11):25–32. [Ti-tov VN. Very low and low density lipoproteins: function, fatty acid transport and diagnostic val-ue. Klin. lab. diagnostika. 2000;(11):25–32 (In Russ.).]
17. Бичкаева Ф.А., Жилина Л.П., Бойко Е.Р. [и др.]. Физиологические особенности липидного, углеводного и белкового обменов у жителей южных районов Архангельской области. Экология человека. 2006;3:7–11. [Bichkayeva FA, Zhilina LP, Boyko ER [et al.]. Physiological features of metabolic activity of lipids, carbohydrates and proteins in inhabitants of southern districts of Archangelsk Region. Ekologiya cheloveka. 2006;3:7–11 (In Russ.).]
18. Khalil A, Fortin J-P, LeHoux J-G [et al.]. Age-related decrease of dehydroepiandroste-rone concentrations in low density lipoproteins and its role in the susceptibility of low density lipoproteins to lipid peroxidation. J. Lipid Res. 2000;41(10):1552–1561.
19. Thijs L, Fagard R, Forette F [et al.]. Are low dehydroepiandrosterone sulphate levels predictive for cardiovascular diseases? A review of prospective and retrospective studies. Acta Cardiol. 2003;58(5):403–410. DOI: 10.2143/AC.58.5.2005304
20. Barrett-Connor ED, Goodman-Gruen D.
The epidemiology of DHEAS and cardiovascular disease. Ann. NY Acad. Sci. 1995;774(1):259–270. DOI: 10.1111/j.1749-6632.1995.tb17386.x-i1
21. Chateau-Degat M-L, Dewailly E, Louchini R [et al.]. Cardiovascular burden and related risk factors among Nunavik (Quebec) Inuit: Insights from baseline findings in the circumpolar Inuit Health in Transition cohort study. Can. J. Cardi-ol. 2010;26(6):190–196. DOI: 10.1016/s0828-282x(10)70398-6
22. Alique M, Luna C, Carracedo J [et al.]. LDL biochemical modifications: a link between athero-sclerosis and aging. Food Nutr. Res. 2015;59. DOI: 10.3402/fnr.v59.29240
23. Kiechl S, Willeit J, Bonora E [et al.]. No as-sociation between dehydroepiandrosterone sul-phate and development of atherosclerosis in pro-spective population study (Bruneck Study). Arterio-scler. Thromb. Vasc. Biol. 2000;20(4):1094–1100.
24. Turner RC, Millns H, Neil HA [et al.]. Risk factors for coronary artery disease in non-insu-lin dependent diabetes mellitus: United King-dom prospective diabetes study (UKPDS: 23). BMJ. 1998;316(7134):823–828. DOI: 10.1136/bmj.316.7134.823
25. Kim LB, Russkikh GS, Gevorgian MM [et al.]. Sex hormones and cardiovascular risk in male mining workers living in the European North. Human Physiology. 2016;42(2):195–202. DOI: 10.1134/S0362119716020080
Long-term persistence of the ductus arteriosus is considered as a variant of pathology. Therefore, the identification of the most significant factors in the persistence of the ductus arteriosus is the basis for prevention. The aim of the study was to determine the factors associated with the persistence of the ductus arteriosus in newborns with congenital heart defects. This kind of study is performed for the first time in the Republic of Sakha (Yakutia). The article represents retrospective clinical study. The database included 1.824 cases of children with congenital heart defects. The most common association of the patent ductus arteriosus with congenital heart defects was found among the newborns with a gestation period of less than 32 weeks. It was determined that the prevalence of association of congenital heart disease with a patent arterial duct considerably increased depending on the severity of the heart failure.
Keywords: birth defects, heart, patent ductus arteriosus, children, Yakutia.
Introduction. Congenital heart defects (CHDs) represent heterogenic groups of diseases, including comorbities, isolated and combined anomaly of multifactorial etiology. The problem of blood circulation defects is significant as it causes high mortality rate, especially during the first year of life, and disability afterwards. It is determined that CHDs are related to the disturbances of embryogenesis in the 2nd-8th week of gestation as result of ge-netic factors, environment and mother’s physical condition [3,5,7].
Long-term persistence of the ductus arteriosus is considered as a variant of pathology. However, the prevalence of patent (open) ductus arteriosus among the indigenous population of the North is still undetermined as there are no distinct criteria from what period of gestation the ductus arteriosus is considered to be a
defect of development [1,3]. There are single publications of such kind concern-ing Caucasian population. It is hypothet-ically believed, that it should be closed during the first two weeks of life. Under such criteria, the prevalence of the iso-lated anomaly is 0.14-0.3 per 1000 live-born children, 7% among all CHDs and 3% among all the critical defects [6]. Per-sistence of the ductus arteriosus signifi-cantly depends on the term of pregnancy, besides that there are factors caused by mother, as intrauterine hypoxia, nonste-roidal anti-inflammatory drugs use and others [2,4]. The list of some other fac-tors, which can be associated with the long-term persistence of the patent duc-tus arteriosus among the children with CHDs is not enough studied in the Re-public of Sakha (Yakutia).
Objective The objective is to deter-
T.I. Nelunova, T.Ye. Burtseva, V.A. Postoev, V.G. Chasnyk, M.P. SlobodchikovaPATENT DUCTUS ARTERIOSUS ASSOCIATION WITH THE CONGENITAL HEART DISEASE IN THE NEWBORNS OF THE REPUBLIC OF SAKHA (YAKUTIA)DOI 10.25789/YMJ.2019.67.08
NELUNOVA Tuyara Ivanovna – postgrad-uate, St. Petersburg state pediatric medical university, [email protected], CHASNYK Vyacheslav Grigorievich – MD, a head of the department of hospital pediatrics, St. Pe-tersburg state pediatric medical university, [email protected], BURTSEVA Tatiana Egorovna – MD, professor of the department of pediatrics and pediatric surgery, Medical in-stitute of the North-Eastern federal university, a head of the laboratory of the Yakut science Centre of complex medical problems, [email protected], POSTOEV Vitaliy Alexan-drovich – assistant lecturer of the department of public healthcare and social work, a head of Arkhangelsk international school of public healthcare Federal state budget educational institution of higher education “Northern state medical university”, [email protected], SLOBODCHIKOVA Maya Pavlovna – a se-nior lecturer of the department of foreign lan-guages with the course of Russian language, St. Petersburg state pediatric medical univer-sity, [email protected].

3’ 2019 31
mine the association of the patent ductus arteriosus with CHDs in newborns of the Republic of Sakha (Yakutia) by the method of logit and regression analysis. This kind of investigation is performed for the first time in the Republic of Sakha (Yakutia).
Materials and methods: A retrospec-tive clinical research work was performed on the base of the Perinatal centre of the Republican hospital No1, National centre of medicine. A research work is based on 1,824 clinical results of medical tests, taken from the medical records of the pa-tients with a diagnosed “Congenital heart disease” (CHD). The time distance of the medical records is registered two times, thus from 2001 to 2003 and from 2013 to 2015. The CHD is recorded according to Q20-Q28 (ICD-10, chapter XVII: Con-genital malformations, deformations and chromosomal abnormalities). The deliv-ery case reports (#010u) and patient’s discharge statistic card (#066/u-02) were the initial documentations for analysis.
All the newborns had experienced ultrasound examination (Doppler echo-cardiography) of the heart to evaluate the anatomical structure and cardiovas-cular function. The selection is based on the cases with bypass through inter-atrial septum according to the results of ultrasound investigation. The functioning activity of the arterial duct was evaluated by colour Doppler test to define additional flow in the vessel projection, i.e. pulmo-nary trunk. The research was performed from 2001 to 2003 on the base of ATL-HDI-3000 Philips, from 2013 to 2015 on the base of EPIQ-7 Philips.
Logit and regression analysis is per-formed to define the association of patent ductus arteriosus with CHD.
When p<0.05 the intergroup accura-cy was considered significant. The initial data were accumulated in the database by means of Microsoft Excel software, all the statistic operations were conduct-ed by means of SPSS Statistics soft-ware (IBM, USA).
Results. The association of patent ductus arteriosus with CHD was revealed in 386 cases, 21.2%. No significant dif-ferences between gender association of patent ductus arteriosus was revealed, prevalence of patent ductus arteriosus was 21.8% in boys, and 20.4% (p=0.436) in girls.
Most commonly the association of patent ductus arteriosus with CHD was noticed in newborns with the period of gestation less than 32 weeks, rarely in groups of newborns with 32-37 weeks of gestation (p<0.001) (Table 1).
The association of patent ductus ar-teriosus with CHD differed not only by
The distribution of patent ductus arteriosus cases in children with CHD according to the weeks of gestation
Gestation period Absolute number of cases Prevalence, %Less than 32 weeks 78 30.332-37 weeks 119 16.438 weeks and more 189 22.6
Table 1
Table 2
Table 3
The prevalence of patent ductus arteriosus association with other CHDs
CHD case Absolute number of cases PrevalenceCHD without heart failure (HF): isolated interatri-al septum defect, mild or in association with patent ductus arteriosus less than 0.2 cm.
73 7.2
CHD with HF of 1st class, NYHA classification 1: moderate interatrial septum defect or in associa-tion with patent ductus arteriosus less than 0.2 cm.
24 13.0
CHD with HF of 1st and 2nd class and more, NYHA classification of the 1st and 2nd class and more, NYHA classification 2 and more: non-complicated (simple) CHD + complicated (complex) CHD
289 46.0
Association of patent ductus arteriosus with CHDs according to nosologies
CHD group Absolute number of cases Prevalence, %Non-complicated (simple) CHDs 347 19.8Complicated (complex) CHDs, including:atrioventricular canal, completeAnomalous pulmonary veins drainage, totalPulmonary artery atresia Ebstein’s anomaly,tricuspid valve anomalyTricuspid valve atresiaDouble-outlet right ventricleObstructive heart defects, coarctation of the aorta, interrupted aortic archPulmonary artery stenosisTransposition of great vesselsFallot’s tetradAbdominal aortic aneurysmComplex CHD
332253021
231003
51.333.340.071.450.0050.0100.0
33.360.058.9060.0
Factors associated with patent ductus arteriosus in newborns with CHD
Indicator Corrected OS 95% DI for corrected OS
Body weight 1.00 1.00 1.00Sex:malefemale
1.000.85
0.66 1.10
Gestation, weeks 0.89 0.84 0.95CHD groups:group 1group 2group 3
1.001.8312.36
1.119.12
3.0116.76
Complex CHD:noyes
1.001.44 0.89 2.36
Table 4
ЯКУТСКИЙ МЕДИЦИНСКИЙ ЖУРНАЛ32
groups of defects depending on the pres-ence / absence of impaired heart failure, but also nosological groups of defects. It is estimated that the prevalence of CHD association with patent ductus arterio-sus considerably increased depending on the expression of the heart failure (p<0.0001), see tabe2.
Complicated (complex) CHDs more often were associated with patent duc-tus arteriosus (51.3% as against 19.8%, p<0.0001), see table 3.
According to the logit and regression analysis with the correction of the ges-tation, it was determined (see table 4) that CHD with heart failure of 1st degree (NYHA classification 1) moderate intera-trial septum defect or in association with patent ductus arteriosus less than 0.2 cm and CHD with HF of 1st and 2nd class and more (NYHA classification of the 1st and 2nd class and more), NYHA classification 2 and more were significantly associated with patent ductus arteriosus. Moreover, there is no significant association of pat-ent ductus arteriosus with complex con-genital malformation.
Conclusion: According to the logit and regression analysis, the association of the patent ductus arteriosus with other
CHDs is most common for newborns with the gestation period of less than 32 weeks. The association of CHD with the patent ductus arteriosus differed not only groups of defects depending on the prevalence of the heart failure, but also the nosologic groups of defects. The prevalence of CHD association with pat-ent ductus arteriosus depending on the heart failure expression is revealed. The patent ductus arteriosus was also associ-ated with complex heart defects.
1. Бабак O.A. Гемодинамически значимый функционирующий артериальный проток у недоношенных новорожденных факторы риска, клиническая картина, последствия. Вопросы практической педиатрии. 2006;1 (4):38. [Babak O. A. Hemodynamically significant functioning arterial duct in premature newborns risk factors, clinical picture, consequences. Voprosi prakticheskoi pediatrii. 2006; 1(4): 38. (In Russ.).]
2. Бурмистров В.В. Определение пре-дикторов и групп риска по развитию функцио-нальных сердечно-сосудистых заболеваний в разные возрастные периоды у детей, родившихся недоношенными: автореф. … дис. канд. мед. наук. 2000; 25. [Burmistrov V. V. Determination of predictors and risk groups for the development of functional cardiovascular diseases in different age periods in children born prematurely: autoref. … dis. cand. med. scienc-es.2000;25. (In Russ.).]
3. Жученко Л. А. Распространенность и структура врожденных пороков сердечно-сосудистой системы у детей до 1 года. Медицинская генетика. 2006. 1:20-22. [Zhuchenko L. A. Prevalence and structure of congenital defects of cardiovascular system in children under 1 year. Meditsinskaia genetika. 2006. 1:20-22. (In Russ.).]
4. Прийма Н.Ф. Эхокардиография в дифференциальной диагностике арте-риального протока у детей. Педиатрия. Журнал имени Г.Н. Сперанского.2016;7(4):119-127. [Pri-ma N. F. Echocardiography in differential diagno-sis of arterial duct in children. Pediatria. Journal imeni G. N. Speranskogo. 2016;7(4):119-127. (In Russ.).]
5. Черкасов Н.С. Заболевания сердца у новорожденных и детей раннего возраста. Астраханская государственная медицинская академия. 2009;268. [Cherkasov N. S. Heart dis-ease in newborns and young children. Astrakhas-kaia gosudarsvennaia meditsinskaia academia. 2009;268. (In Russ.).]
6. Шарыкин А.С. Врожденные пороки сердца. Руководство для педиатров, кардиологов, неонатологов. Теремок. 2005;384. [Sharykin A. S. Congenital heart de-fects. Guidelines for pediatricians, cardiologists, neonatologists. Teremok, 2005; 384. (In Russ.).]
7. Яковлева Т.В. Региональные особенности и пути снижения смертности детского населения РФ: автореф. дис.… канд. мед. наук. РАМН. 2001;20. [Yakovleva T. V. Re-gional peculiarities and the ways to reduce mor-tality of children population of the Russian Fed-eration.: avtoref. diss. cand.med. nauk. RAMN. 2001; 20. (In Russ.).]
The article is devoted to the problem of the venous thromboembolic complications stratifi-cation in cases of the colorectal cancer. We performed prospective, randomized, blind study in colorectal surgery department. We analyzed the TEC risk factors due to up-to-date recom-mendations of the 100 consecutive patients with operable colorectal cancer. The doctors didn’t know about the study (blind) to decrease the ability for study aggravation. After all, 100 cases were get numbers and randomized by the method of random number for 2 groups: Main group (n50) – the TEC stratification performed by our method; control group (n50) – the TEC level got from history of the patients.
The underestimation of the risk level of these complications was revealed. The reason of this risk underestimation was the absence of some risk factors evaluation connected with the patients’ comorbidity and surgery. The authors of the article described method of the thrombo-embolism risk stratification by new soft for PC with ability to evaluate the risk objectively, unified and with mathematical accuracy with minimal effort.
It was found out the patients suffering from colorectal surgery has extremely high risk of the thromboembolic complications.
Keywords: colorectal cancer, thromboembolic complications, thromboembolism of the pul-monary artery, stratification.
Introduction. The problem of the ve-nous thromboembolic complications (VTEC) of the oncological surgical pa-tients is still urgent. The risk of VTEC at this case is 10 till 40% without prophy-laxis and fatal in about 10% cases [11].
The VTEC is situated on the second place in the structure of mortality and take place approximately in 20% [2]. The recent investigations has shown high risk of VTEC in cases of colorectal cancer [1, 3, 7].
S.V. Anikin, V.V. Yanovoy, S.V. KhodusTHE RISK STRATIFICATION OF THE VENOUS THROMBOEMBOLIC COMPLICATIONS IN ONCOCOLOPROCTOLOGYDOI 10.25789/YMJ.2019.67.09
DIAGNOSTIC AND TREATMENT METHODS
References
ANIKIN Sergey Vladimirovich, PhD (Med-icine), MD, Assistant professor of the hospi-tal surgery department, Amur state medical academy, Russia. 675000, Blagoveshchensk. Gorkogo street, 95. [email protected]. https://orcid.org/0000-0002- 2613-0781, YANOVOY Valeriy Vladimirovich, Professor, Doctor of medical sciences, MD, The head of the hospi-tal surgery department, Amur state medical acad-emy, Russia. 675000, Blagoveshchensk. Gorkogo street, 95. [email protected]. ttps://orcid.org/0000-0002-4481-8520, KHODUS Sergey Vasilievich, PhD (Medicine), MD, The of the anesthesiology and resuscitation department, Amur state medical academy, Russia. 675000, Blagoveshchensk. Gork-ogo street, 95. [email protected].

3’ 2019 33
The multifactorial analysis has shown that the risk of lethal outcome, shock or thromboembolism of the pulmonary artery (TEPA) increased in 3 times dur-ing 30 days in case of cancer [14]. Ob-viously, the best method of TEC care is primary prophylaxis. The primary TEC prophylaxis is based on risk stratification and prophylaxis with accordance to risk level – physical, pharmacological (drug) or surgical methods. Nowadays, the most popular stratification scheme is method of Ch. Samama proposed in 1999 [15]. But, this scheme is based on only one factor evaluation that has most serious impact to thromboembolism. However, the TEPA risk is defined by summation of the risk factors connected with comorbid status and type of surgical intervention. Currently, we have a waste majority of the individual TEC evaluation with the point grading system of every risk factor [4, 9, 12].
But unfortunately these methods are quite complicated and that’s why can’t be useful in real clinical practice.
Objective – to improve the TEC prophylaxis for the patients with colorec-tal cancer.
The design of research. We per-formed prospective, randomized, blind study in colorectal surgery department. We analyzed the TEC risk factors due to up-to-date recommendations of the 100 consecutive patients with operable colo-rectal cancer. The doctors didn’t know about the study (blind) to decrease the ability for study aggravation. After all, 100 cases were get numbers and rand-omized by the method of random number for 2 groups: Main group (n50) – the TEC stratification performed by our method; Control group (n50) – the TEC level got from history of the patients.
Materials and methods. We invented software “The program for automatic eval-uation of the thromboembolic complica-tions and its prophylaxis” (Russian state registration certificate for software for IBM PC №2015619184, from 26.08.2015). This software has interface of dialogue window with ability for a doctor to point the risk factors of TEC: the age (41-60, 61-74, 75 and more), risk factors con-nected with the patient (29 factors) and with the surgery (9 factors). The software automatically calculates the level of TEC risk (low, moderate, high and extremely-high) with the accordance to the quality and quantity risk factors individually to every patient due to up-to-date stratifica-tion models [4, 12]. Besides, our software offers the prophylaxis program individu-ally with the accordance to the TEC risk level [6]. The software also has ability to
calculate the prophylactic and cure dose of the most actual anticoagulants in ap-pliance with the patients’ weight. After all, the doctor has ability to print the protocol of stratification and put it into the history case. This protocol reflects all risk factors and overall risk level for every patient to protect doctor in a case of judicial trial.
Results and discussion. Both groups weren’t statistically differing by the age. The age of patients has a great impact to TEPA stratification: 41-60 years – 1 points, 61-74 years – 2 points, 75 and more – 3 points. First group average age was 63,32±7,58 years (31 - 81 years), the second group - 64,21±5,62 (34 – 80 years). It's necessary to stress that both groups has more than 70% patients with the age more than 61 years and more than 20% among them was in a group of the maximal risk by the age – more than 75 years and only 2 (4%) patients of the first group and 1 patient (2%) of the second group wasn’t in a high TEC risk because of the age less than 40 years.
All patients had colorectal cancer. But the localization of the tumor doesn’t mat-ter due to our program and correspond to 2 points.
All patients were passed through the radical surgery with the duration more than 45 minutes that is also risk factor with 2 points.
Moreover, the patients of the both group had risk factors: varicose of the leg veins – n=8 (16%) of the main group and n=11 (22%) of the second group, the leg puffiness – n=10 (20%) and 12 (24%) accordingly, obesity – n=11 (22%) and 8 (16%) accordingly, chronic obstructive disease n=7 (14%) and n=5 (10%). Fur-thermore, the coexistence of 4 and more factors was in 92% for the 1 group and 86% for the second. Thus, all patients of both groups had extremely high risk of TEC (more than 5 points).
Nonetheless, all patients of both groups got TEC prophylaxis only in a level of compression therapy and early activation of the patients after the surgery (no more than 72 hours). This prophylax-is program corresponds to the moderate level of TEC risk. And only one case of the main group and 2 cases of the con-trol group correspond to the level of the high TEC risk because of the decompen-sated varicose disease of the leg veins that’s why patients were consulted by angiosurgeon, ultrasound investigation performed and after all anticoagulants in prophylactic dosage were used in periop-erative period.
Thus, the main group patients had av-erage risk level 6,69±1,2 points (from 5 till 10 points). If we took as a basis that con-
trol group had prophylaxis of TEC due to recommendations for the moderate risk level with no more than 2 points of TEC risk factors, we found statistically true dif-ference (р=0,023) between the patients of the main and control group because of the underestimation of the TEC risk by doctors without software. Some authors shown us in their investigation that this underestimation of the TEC risk is world-wide tendency [8, 13]
In spite of this, we didn’t get manifest-ed TEC in both groups. Though, some researchers shown [5, 10] that even fatal TEPA can occur in remote period after the surgery and discharge form the hospital.
Our software is very simple in usage – to fill the forms surgeon need no more than 1 min. The possibility to print the protocol of stratification let us to get ob-jective calculation of the TEC risk score and protect the doctor from some juridical problems.
Conclusions. “The program for auto-matic evaluation of the thromboembolic complications and its prophylaxis” gives us opportunity to evaluate objectively the risk of thromboembolical complications;
Patients suffering from colorectal can-cer and passed through the radical sur-gery have extremely high risk of TEC.
The accuracy of the TEC stratification by our method corresponds to modern recommendations and surgeon could be protected from some legal problems;
Our method allows optimizing and uni-fies the prophylactic of the TEC program.
1. Аникин С.В., Яновой В.В. Тромбоэмбо-лические осложнения у больных колорек-тальным раком. Вестник РГМУ. 2006;2:102. [Anikin SV, Yanovoy VV. Thromboembolic compli-cations in the colorectal cancer patients. Bulletin of Russian state medical University. 2006; 2:102. (In Russ).]
2. Воробьева Л.И. Тромбоэмболические осложнения у больных онкологического профиля. Онкология. 2002; 1(4): 70–73. [Voro-biyeva LI. Thromboembolic complications in the oncological patients. Oncology. 2002; 1(4):70–73.(In Russ)]
3. Касюк А.А., Прудывус И.С. Оценка риска развития летальной послеоперационной тромбоэмболии легочной артерии у онко-логических пациентов. Военная медицина. 2014;1(30):48-51. [Kasyuk AA, Prudyvus IS. Risk assesment of lethal postoperative pulmo-nary thromboembolism development in cancer patients. Military medicine. 2014;1(30):48-51(In Russ).]
4. Баринов В.Е., Лобастов К.В., Бояринцев В.В., Счастливцев И.В. Клиническая оценка шкалы «Caprini» для индивидуального прогнозирования риска развития после-операционных венозных тромбоэмболий у хирургических больных. Фундаментальные исследования. 2013; 12-1:11-16. [Barinov VE, Lobastov KV, Boyarintzev VV., Schastlivtzev IV.
References

ЯКУТСКИЙ МЕДИЦИНСКИЙ ЖУРНАЛ34
Clinical evaluation of the “Caprini” scale for an individual risk prognosis of the postoperative ve-nous thromboembolism in the surgical patients. Fundamental research. 2013; 12-1:11-16. (In Russ).]
5. Кательницкий И.И., Сокиренко И.А., Буриков М.А., Сказкин И.В., Шульгин О.В. Обоснования выбора метода профилактики тромбоэмболических осложнений при лапа-роскопических операциях на органах брюшной полости и малого таза. Современные проб-лемы науки и образования. 2016;6. http://www.science-education.ru/ru/article/view?id=25985. [Katelnitsky II, Sokirenko IA, Burikov МА, Ska-zkin IV, Shoulgin ОV. Evidence-based selection of embolism prevention method in laparoscopic abdominal and pelvic surgery. Modern problems of Science and education. 2016.6: URL: http://www.science-education.ru/ru/article/view?id=(In Russ).]
6. Бокерия Л.А., Затевахин И.И., Кириенко А.И. [и др.] Российские клинические реко-мендации по диагностике, лечению и профи-лактике венозных тромбоэмболических ослож-нений. Флебология. 2015; 4(1):52 [Bokeriya LA, Zatevackhin II, Kirienko AI [et al.]. Russian clinical recommendations by diagnostics, treatment and prophylaxis of the venous thromboembolic com-plications. Phlebology. 2015; 4(1):52 (In Russ).]
7. Ачинович С.Л., Пригожая Т.И., Бонда-
ренко В.В., Голубев О.А., Надыров Э.А., Тума-нов Э.В., Нитиш В.Э. Тромбоэмболия легочной артерии при раке прямой кишки по данным аутопсий. Проблемы здоровья и онкологии. 2006; 2(8):38-41. [Achinovich SL., Rrigojaya TI, Bondarenko VV, Golubev OA, Nadyrov EA, Tu-manov EV, Nitish VE. Tromboemboly of lung ar-teries at the cancer of rectum on data autopsy. The problems of the health and oncology. 2006; 2(8):38-41 (In Russ).]
8. Ганцев Ш.Х., Каримов А.И., Огий И.И. Хуснутдинов Ш.М., Ишмуратова Р.Ш., Маматова Г.У., Самышина Е.А., Кзыргалин Ш.Р. Тромбоэмболия легочной артерии: частота, причины и пути профилактики в онкологии. Креативная хирургия и онкология. 2011;4:16-21. [Gantsev ShKh. Karimov AI, Ogiy II, Khusnut-dinov ShM., Ishmuratova RSh, Mamatova GU, Samishina EA, Kzirgalin ShR. Thromboembolia of the pulmonary artery in the cancer detection clinic. Creative surgery and oncology. 2011;4:16-21. (In Russ).]
9. Ташкинов Н.В., Кузьмин И.И., Штай-берг К.А., Бабихин А.В. Факторы риска и профи-лактика тромбоэмболических осложнений при тоталь-ном эндопротезировании тазо-бедренного сустава. Дальневосточный между-народный журнал. 2009;2:33-35 [Taschkinov NV, Kuzmin II, Shtaiberg KA, Babihin AV. Risk of and prophylaxis for venous thromboembolism
in patients undergoing total hip arthroplasty. Far East medical journal. 2009;2:33-35(In Russ).]
10. Хасанов Р.Ш., Камалов И.А. Профилактика тромбоэмболии легочной артерии у онкологических больных в тече-ние первого года диспансерного наблюде-ния. Казанский медицинский журнал. 2015; 1(96):13–16 [Khasanov RSh., Kamalov IA. Pul-monary embolism prevention in out-patients with malignancies during the first year of follow-up. Ka-zan medical journal. 2015;1(96):13–16 (In Russ).]
11. Чарная М.А., Морозов Ю.А. Тромбозы в клинической практике. М.: Гэотар-Медия. 2009:17 [Charnaya MA., Morozov YuA. Thrombo-ses in clinics. M.Geotar-Media.2009:17(In Russ).]
12. Bahl V.A., Hu H.M., Henke P.K. et al. A val-idation study of a retrospective venous thrombo-embolism risk scoring method. Ann Surg. 2010; 251(2): 344–350.
13. Goldhaber S.Z., Tapson V.F. A prospective registry of 5,451 patients with ultrasound-con-firmed deep vein thrombosis. Am J Cardiol. 2004; 93:259-262
14. O., Trinquart L., Caille V. et al. Prognostic factors for pulmonary embolism: the prep study, a prospective multicenter cohort study. Am. J. Respir. Crit. Care Med. 2010; 181(2): 168–173.
15. Samama Ch.M. Samama M.M. Prevention of venous thromboembolism. Congr. Eur. Soc. Anaestesiol. Amsterdam. 1999: 39-43.
Chronic myeloproliferative diseases are characterized by excessive proliferation of myeloid cell lines and a high risk of thrombotic complications. The purpose of the research was to an-alyze the clinical features and epidemiology of chronic myeloproliferative diseases in the Re-public Sakha (Yakutia). We carried out a retrospective analysis of medical records of patients followed-up by hematologists of Yakutsk from 1995 to 2018. The study included 104 patients, 39 of them were diagnosed with ET (27 women and 12 men), 40 had PV (21 women and 19 men), and 25 had PMF (11 women and 14 men). The diagnosis was established based on the current diagnostic criteria of the World Health Society (WHO).
The results of study demonstrated an increase of disease incidence in 2015-2016, preva-lence of thrombotic complications among people younger than 60 years and the prevalence of the latent onset of the disease. The average time from thrombosis onset to disease diagnosis was 1 year. Arterial thrombosis such as acute disorders of cerebral circulation and myocardial infarction occurred more often.
It is necessary to carry out a molecular genetic study to identify driver mutations. During fol-low up 19.4% of patients have developed re-thrombosis.
Keywords: chronic myeloproliferative diseases, thrombosis, cardiovascular risk.
T.N. Aleksandrova, I.I. Mulina, V.N. Yadrikhinskaya, I.E. Solovieva, L.D. Terekhova, N.I. Pavlova, Kh.A. Kurtanov
CLINICAL AND EPIDEMIOLOGICAL ASPECTS OF CHRONIC MYELOPROLIFERATIVE DISEASES IN THE REPUBLIC SAKHA (YAKUTIA)DOI 10.25789/YMJ.2019.67.10
Introductio.Chronic myeloprolifera-tive diseases (CMPD) result from malig-nant transformation of pluripotent stem cell followed by clonal proliferation of one or more myeloid cell lines (erythroid, my-eloid, megakaryocytic) that differentiate into mature forms. Mutations of genes JAK2, MPL and CALR, leading to hy-peractivation of the JAK-STAT signaling pathway, play a key role in developing
CMPD [11, 13]. Polycythemia vera (PV) is characterized by proliferation of three myeloid cell lines, while in essential thrombocythemia (ET) hyperplasia of the megakaryocytic line with thrombocytosis are mainly observed. In case of primary myelofibrosis (PMF) abnormal mega-karyocytes produce cytokines leading to the development of bone marrow fibrosis and extramedullary hematopoiesis [7].
Republican Hospital No. 1 - National Centre of Medicine (Yakutsk, Russia): ALEKSANDRO-VA Tuiara Nikonovna – hematologist, junior researcher of the laboratory of heritable pa-thology [email protected]; MULI-NA Inna Ivanovna – Head of the Department of hematology; SOLOVIEVA Irina Eremeevna – hematologist; TEREKHOVA Lena Dmitriev-na – hematologist; YADRIKHINSKAYA Vera Nikolaevna – candidate of medical sciences, associate professor of department «Hospital therapy, professional diseases, clinical phar-macology» Medical Institute of North-Eastern Federal University; Yakut science Centre of the complex medical problems: PAVLOVA Nadezhda Ivanovna – PhD, temporary acting chief scientific officer - head of the laboratory of heritable pathology E-mail: solnishko_84@ inbox.ru; KURTANOV Khariton Alekseevich – PhD, Chief Scientific Officer - Head of the De-partment of Molecular Genetics. Tel.: +7 (914) 106 00 30. E-mail: [email protected].

3’ 2019 35
The main clinical problem of patients with CMPD, leading to disablement and death, is thrombotic complications [5]. In large international studies, it was shown that thrombosis is observed in 23.4% of patients with PV and 12% of patients with ET [12]. Arterial thrombosis, especially in cerebrovascular system, is more common than venous one. Mortality of patients with CMPD because of cerebrovascular diseases is 1.5 times higher than in gen-eral population [4]. Venous thrombosis is less common, but affects patient survival and development of microcirculatory dis-orders causing decrease in quality of life. Thrombotic complications are less com-mon in patients with PMF, which can be explained by transformation into second-ary acute myeloid leukemia and lower survival rates [7].
Disease manifestation can have a long-term latent course without obvious signs of myeloproliferation, which com-plicates early disease diagnosis and in-creases the risk of complications.
Objective: to analyze the clinical and epidemiological features of CMPD in the Republic Sakha (Yakutia).
Materials and methods. We carried out a retrospective analysis of medi-cal records of patients followed-up by hematologists of Yakutsk from 1995 to 2018. The study included 104 patients, 39 of them were diagnosed with ET (27 women and 12 men), 40 had PV (21 women and 19 men), and 25 had PMF (11 women and 14 men). The diagnosis was established based on the current diagnostic criteria of the World Health Society (WHO) [14]. The epidemiolog-ical, clinical, laboratory, therapy data obtained during outpatient consultation. Primary incidence was calculated as ra-tio of newly diagnosed patients` number to average region population number per 100 thousand populations. Complete blood cells (hemoglobin, platelet, leuko-cyte counts and number of blast cells) and spleen size were recorded at the time of diagnosis. Analysis of correlation of risk factors with incidence of thrombo-sis was performed using a four-field con-tingency table (table 1) and a χ-square test with Yeats correction (pχ2). Results were considered significant at p <0.05.
χ-square test with Yeats correction
calculated by formula:where Oij is the actual number of ob-
servations ij, Eij is the expected number of observations.
Results and discussion. According
to literature review CMPD are mainly found in the elderly. The median age of patients at the moment of disease mani-festation in our study was 50 years in ET (from 38 to 77 years), PV – 56 years (from 21 to 80 years) and PFM – 60 years (from 28 to 80 years). The median time of fol-low-up was 48 months (from 2 months to 23 years). In Republic of Sakha (Yakutia), the primary incidence of ET in different years ranged from 0 to 0,83, PV – from 0 to 0,73, and PMF – from 0 to 0,52 per 100 thousand population per year (fig. 1). The primary incidence of CMPD reached its maximum in 2015-2016 years, which is most likely due improvement of diag-nosis with molecular genetic testing. Ac-cording to foreign researchers’ data, the primary incidence of ET is 0,38-1,7, PV – 0,68-2,6, and PMF – 0,1-1 per 100 thou-sand population per year [8], in Russian Federation there are no large epidemio-logical studies.
At the moment of diagnosis in patients with ET isolated thrombocytosis was the most common sign. Patients with PV demonstrated the signs of three-lineage hyperplasia and in PMF patients – leuko-cytosis with thrombocytosis. Splenomeg-aly was more common in patients with PMF (table 2).
Thrombotic complications were re-corded in 42,5% of patients with PV (17/40), 30,8% of patients with ET (12/39) and 28,0% (7/25) with PMF (ta-ble 3). According to the literature, throm-
bosis is more common among patients with PV [6, 15], which is associated with an extreme increase in the number of blood cells, hematocrit, and increased blood viscosity. In 58,3% (21/36) cases thrombosis was the first clinical symptom of disease. On average, the time from thrombosis to diagnosis of disease was 1 year. CMPD often has a latent manifesta-tion. Polycythemia or thrombocytosis can be masked by increased plasma volume and/or hypersplenism, which causes diffi-culties in interpreting laboratory data, and
Four-field contingency table
Patients with thrombosis
Patients without thrombosis Total
Presence of risk factor A B A + BAbsence of risk factor C D C + DTotal A + C B + D A + B + C + D
Table 1
Clinical characteristics of patients at diagnosis
ET PV PMFMen, % (abs.) 30.8 (12) 47.5 (19) 56 (14)
Women, % (abs.) 69.2 (27) 52.5 (21) 44 (11)Median age
(from min to max)50 лет
(от 38 до 77 лет)56 лет
(от 21 до 80 лет)60 лет
(от 28 до 80 лет)Average erythrocytes
count, М±mм* 4.7±0.9 6.6±1.4 5.1±1.4
Average hemoglobincount, М±mм
135±19.6 171±25.2 127±30.5
Average hematocrit, М±mм
46.5±4.6 51.3±7.7 41.7±42.6
Average leukocytes count, М±mм
9.4±2.7 14.1±13.3 31.4±9.0
Average thrombocytes count, М±mм
1113±442.2 711.8±445.3 881.5±615.2
Splenomegaly,% (абс.) 38.5 (15) 47.5 (19) 60 (15)
*М±mм – mean value ± standard deviation
Table 2
Morbidity of CMPD in Republic of Sakha (Yakutia) 2008-2018 years

ЯКУТСКИЙ МЕДИЦИНСКИЙ ЖУРНАЛ36
the clinical picture is represented only by thrombosis [6].
Arterial thrombosis (30,0 and 25,6%) prevailed among thrombotic complica-tions in patients with PV and ET — acute disorders of cerebral circulation and myocardial infarction, less frequently seen venous thrombosis (12,5 and 6%). In patients with PMF, arterial thrombosis was observed in 16% of cases, and ve-nous in 12%. The median time between the diagnosis of the disease and the de-velopment of thrombosis was 3 years (from 0 to 30 years). Recurrent throm-botic complications were observed in 19,4% (7/36). The predominance of arte-rial thrombosis over venous thrombosis is explained by the direct participation in the pathogenesis of clot formation of the vascular endothelium. Damage to the vascular wall caused by hyperviscosity syndrome and the production of proteo-lytic enzymes by activated neutrophils, morphological and functional changes of blood cells and procoagulant state of plasma represent a multicomponent mechanism of clot formation. A number of publications report a higher thrombo-genic potential of platelets in patients with JAK2V617F mutation [9].
The analysis of risk factors for throm-botic complications included both ma-jor factors (age over 60 years, history of cardiovascular risks) and additional (thrombocytosis more than 1000*109/l
and leukocytosis more than 11*109/l) [3]. The contribution of different factors to pathogenesis of thrombosis is widely discussed in literature, and a number of scales have been proposed for risk strat-ification. Most authors agree that statisti-cally significant risk factors for thrombotic complications are age over 60 years and history of thrombosis [2]. Among ad-ditional risk factors, some authors pay special attention to leukocytosis. It was demonstrated that activated leukocytes synthesize prothrombotic substances that cause functional changes in the en-dothelium, stimulate platelet activity, and they contribute to generation of thrombin and development of thrombosis [15].
Statistically significant differences in the group of patients with thrombosis and without thrombosis were revealed only by the presence of cardiovascular risk factors (p <0.05) (table 4). There were no statistically significant differences in inci-dence of thrombosis in groups of people older than 60 years and younger. Throm-botic complications in people of working age have a high social significance, since they can lead to disability and a decrease in quality of life.
During follow-up molecular genetic testing was performed in 20,2% of pa-tients (21/104), of which in 15,4% of pa-tients (16/104) mutation of JAK2 gene was fond and in 3,8% (4/104) mutation of CALR gene. Among patients with
JAK2V617F mutation, thrombotic compli-cations were observed in 62,5% of cases.
First-line therapy with interferon was prescribed to 42,5% of patients (17/40) with PV, 51,3% (20/39) with ET and 24% (6/25) with PMF. Hydroxyurea was administered to 30% (12/40) of patients with PV, 23,1% (9/39) with ET, and 44% (11/25) with PMV. In other cases, patients receive antiplatelet and vascular therapy. 6 patients are currently receiving target-ed therapy with Ruxolitinib with positive effect. During therapy with Ruxolitinib, thrombotic complications were not ob-served in patients.
Conclusion. In the Republic Sakha (Yakutia) for the research period (1995-2018) the primary incidence of ET per 100 thousand population per year was 0 – 0.83, PV – 0 - 0.73, and PMF – 0 – 0.52, reaching maximum values in 2015-2016. Thrombotic complications, which are a serious clinical problem, are observed in patients with CMPD in 28-42.5% of cas-es. In a half of the cases, thrombosis was a first clinical symptom of myeloprolifera-tive disease. A statistically significant risk factor for thrombosis is the presence of cardiovascular risks, which determines the need for a comprehensive approach to the treatment of this group of patients.
1. Шихбабаева Д.И., Полушкина Л.Б., Шу-ваев В.А., Мартынкевич И.С., Капустин С.И., Замотина Т.Б., Фоминых М.С., Удальева В.Ю., Зотова И.И., Шмелева В.М., Смирнова О.А., Волошин С.В., Бессмельцев С.С., Чечеткин А.В., Абдулкадыров К.М. Генетические марке-ры наследственной тромбофилии и риск тром-ботических осложнений у больных с истинной полицитемией. Клиническая онкогематология. 2017;10(1):85-92. [Genetic markers of hereditary thrombophilia and risk of thrombotic complica-tions in patients with polycythemia vera. Shikh-babaeva DI, Polushkina LB, Shuvaev VA, Martyn-kevich IS, Kapustin SI, Zamotina TB, Fominykh MS, Udal’eva VU, Zotova II, Shmeleva VM, Smirnova OA, Voloshin SV, Bessmel’tsev SS, Chechetkin AV, Abdulkadyrov KM. Klinicheskaja onkogematologija. 2017;10(1):85-92. (In Russ.).] DOI: 10.21320/2500-2139-2017-10-1-85-92
2. Меликян А.Л, Суборцева И.Н. Биоло-гия миелопролиферативных заболеваний. Клиническая онкогематология. 2016;4(3):314-325. [Melikyan AL, Subortseva IN. Biology of myeloid malignancies. Klinicheskaja onkoge-matologija. 2016;4(3):314-325. (In Russ.).] DOI: 10.21320/2500-2139-2016-9-3-314-325
3. Танашян М.М., Кузнецова П.И., Лагода О.В., Шабалина А.А., Суборцева И.Н., Мели-кян А.Л. Миелопролиферативные заболева-ния и ишемические инсульты. Анналы кли-нической и экспериментальной неврологии. 2014;8(2):41-45. [Tanashyan ММ, Kuznetsova PI, Lagoda OV, Shabalina AA, Subortseva IN, Melikyan AL. Myeloproliferative diseases and ischemic stroke. Annaly klinicheskoj i eksperi-mental'noj nevrologii. 2014;8(2):41-45.(In Russ.)]
4. Танашян М.М., Кузнецова П.И., Раскура-
Prevalence of thrombotic complications in patients with CMPD, % (abs.)
Localization ET (n=39)
PV(n=40)
PMF (n=25)
Arterial, total 25.6 (10) 30.0 (12) 16.0 (4)Cerebral blood flow acute disturbances 12.8 (5) 22.5 (9) 12.0 (3)Myocardial infarction 12.8 (5) 7.5 (3) 4.0 (1)Venous, total 6.0 (2) 12.5 (5) 12.0 (3)Deep vein thrombosis 6.0 (2) 10.0 (4) 4.0 (1)Splanchnic vein thrombosis - 2.5 (1) 8 (2)
Table 3
Prevalence of thrombosis risk factors in patients with and without thrombosis, % (n)
Risk factorPatients with chronic myeloproliferative
diseaseswithout thrombosis
(n=68)with thrombosis
(n=36)Age 60 and older 51.5 (35) 47.2 (17)Cardiovascular risk factors 19.1 (13) 38.6 (15)Thrombocytosis>1000*109/l 30.9 (21) 19.4 (7)Leukocytosis >11*109/l 27.9 (19) 33.3 (12)
* pχ2 – χ-square test with Yeats correction
Table 4
References

3’ 2019 37
жев A.A., Лагода О.В. Некоторые аспекты про-филактики нарушений мозгового кровообра-щения у пациентов с миелопролиферативны-ми заболеваниями. Неврология. 2017;4(1):40-43. [Tanashyan ММ, Kuznetsova PI, Raskurajev AA, Lagoda OV. Certain aspects of stroke pre-vention in patients with myeloproliferative diseas-es. Nevrologija. 2017;(4)1:40-43. (In Russ.)]
5. Жернякова А.А., Мартынкевич И.С., Шу-ваев В.А., Полушкина Л.Б., Фоминых М.С., Удальева В.Ю., Зотова И.И., Шихбабаева Д.И., Волошин С.В., Бессмельцев С.С., Чечет-кин А.В., Абдулкадыров К.М. Факторы риска развития тромботических и геморрагических осложнений при эссенциальной тромбоци-темии. Онкогематология. 2017;12(2):30-38. [Zhernyakova AA, Martynkevich IS, Shuvaev VA, Polushkina LB, Fominykh MS, Udal’eva VU, Zotova II, Shiсhbabaeva DI, Voloshin SV, Bess-meltcev SS, Chechetkin AV, Abdulkadyrov KM. Thrombotic and bleeding risk factors in essen-tial thrombocytemia. Klinicheskaja onkogema-tologija. 2017;(10)3:402-408. (In Russ.).] DOI: 10.17650/1818-8346-2017-12-2-30-38
6. Абдулкадыров К.М., Шуваев В.А., Мар-тынкевич И.С. Что нам известно об истинной полицитемии (обзор литературы и собствен-ные данные). Онкогематология. 2015;10(3):28-42. [Abdulkadyrov KM, Shuvaev VA, Martynkev-ich IS. All we know about polycythemia vera: literature review and own experience. Onkoge-matologija. 2015;10(3):28-42. (In Russ.).] DOI: 10.17650/1818-8346-2015-10-3-28-42.
7. Duangnapasatit B, Rattarittamrong E, Rat-tanathammethee T, Hantrakool S, Chai-Adisakso-pha C, Tantiworawit A, Norasetthada L. Clinical Manifestations and Risk Factors for Complica-
tions of Philadelphia Chromosome-Negative My-eloproliferative Neoplasms. Asian Pac J Cancer Prev. 2015;(16)12:5013-5018. DOI: 10.7314/AP-JCP.2015.16.12.5013.
8. Moulard O, Mehta J, Fryzek J, Olivares R, Iqbal U, Mesa RA. Epidemiology of myelofi-brosis, essential thrombocythemia, and polycy-themia vera in the European Union. O Moulard, J Mehta, J Fryzek [et al.]. Eur J Haematol. 2014; 92(4):289-297. DOI: 10.1111/ejh.12256. DOI: 10.1111/ejh.12256.
9. Arellano-Rodrigo E, Alvarez-Larrán A, Re-verter JC, Villamor N, Colomer D, Cervantes F. Increased platelet and leukocyte activation as contributing mechanisms for thrombosis in es-sential thrombocythemia and correlation with the JAK2 mutational status. Haematologica. 2006;91(2):169-175.
10. Sazawal S, Rathi S, Chikkara S, Chaubey R, Seth T, Saraya А, Das J, Mahapatra M, Saxena R. JAK2V617F mutation in patients with splanchnic vein thrombosis. Dig Dis Sci. 2010;55(6):1770-1777.
11. Vainchenker W, Delhommeau F, Constan-tinescu SN, Bernard OA. New mutations and pathogenesis of myeloproliferative neoplasms. Blood. 2011; 118(7):1723–1735.DOI:10.1182/blood-2011-02-292102.
12. Tefferi A, Rumi E, Finazzi G, Gissling-er H, Vannucchi AM, Rodeghiero F, Randi ML, Vaidya R, Cazzola M, Rambaldi A, Gisslinger B, Pieri L, Ruggeri M, Bertozzi I, Sulai NH, Ca-setti I, Carobbio A, Jeryczynski G, Larson DR, Müllauer L, Pardanani A, Thiele J, Pas-samonti F, Barbui T. Survival and prognosis among 1545 patients with contemporary polycy-themia vera: an international study. Leukemia.
2013;27:1874-1881. DOI: 10.1038/leu.2013.16313. Tefferi A, Vannucchi AM. Genetic risk as-
sessment in myeloproliferative neoplasms. Mayo Clinic proceedings. 2017;92(8):1283-1290. DOI: 10.1016/j.mayocp.2017.06.002
14. Barbui T, Thiele J, Gisslinger H, Kvas-nicka HM, Vannucchi AM, Guglielmelli P, Orazi A, Tefferi A. The 2016 WHO classification and diagnostic criteria for myeloproliferative neo-plasms: document summary and in-depth dis-cussion. Blood cancer J. 2018; 8(2):15. DOI: 10.1038%2Fs41408-018-0054-y
15. Casini A, Fontana P, Lecompte TP. Throm-botic complications of myeloproliferative neo-plasms: risk assessment and risk-guided man-agement. J ThrombHaemost. 2013; 11(7):1215-1227. DOI: 10.1111/jth.12265.
16. Survival and prognosis among 1545 pa-tients with contemporary polycythemia vera: an international study / A. Tefferi, E. Rumi, G. Finaz-zi [et al.] // Leukemia, 2013, V.27, P.1874-1881. DOI: 10.1038/leu.2013.163
17. Tefferi A. Genetic risk assessment in myeloproliferative neoplasms. Mayo Clinic pro-ceedings. 2017, V.92, №8, p.1283-1290. DOI: 10.1016/j.mayocp.2017.06.002
18. The 2016 WHO classification and diagnos-tic criteria for myeloproliferative neoplasms: docu-ment summary and in-depth discussion / T.Barbui, J. Thiele, H. Gisslinger [et al.] // Blood cancer J, 2018, Vol.8, №2, P.15. DOI: 10.1038%2Fs41408-018-0054-y
19. Thrombotic complications of myeloprolifer-ative neoplasms: risk assessment and risk-guid-ed management / A Casini, P Fontana, TP Le-compte // J ThrombHaemost. 2013, V.11, №7, P.1215-1227. DOI: 10.1111/jth.12265.
The article presents an analysis of the incidence of dysplasia degrees and cervical cancer (CC) in women of different age groups based on cytological studies from 2016 to 2018 inclusive. The frequency of incidence of CIN 1, CIN 2, CIN 3 and CC was determined, which is inversely dependent on the dysplasia degree in all age groups of women. While the incidence of CIN 2, CIN 3 and CC was decreasing, CIN 1 increased between 2016 and 2018. Women 26-35 years had the highest incidence of CIN 1, CIN 2 and CIN 3; also CIN 2 was detected in women 36-45 years, as in the first group; women of 46-55 years had a sharp rise in CC - it is 2.5 times higher than in previous two groups. The peak incidence of CC was in patients aged 56 years and older.
Keywords: screening, oncocytology, diagnosis, dysplasia, cervical cancer.
Relevance. According to various au-thors, cervical pathology makes up from 10 to 15% of all gynecological diseases [3]. Occurrence and development of the causes and mechanisms of cervix uteri pathological processes are rather com-plex and understudied process [2]. As is known, dysplastic changes in the cervix uteri epithelium are considered as pre-cancerous states [6], there is evidence that one of the main conditions for the development of dysplasia and CC is the persistence of the human papillomavirus
(HPV) [8,9].The state of local immunity, as a regeneration process control agent [1], has great importance in the devel-opment of dysplastic processes in the cervix uteri, as well as a hormonal state, since cell developing and differentiation in the stratified squamous epithelium of the cervix uteri is hormone-depen-dent. Because of the hormonal status in women depends on age, it determines the usefulness of studying the features of dysplastic changes in cervix uteri in different age groups, irrespective of the
M. P. Kirillina, V. I. Kononova, S. I. Sofronova, A. K. Ivanova, E. L. LushnikovaTHE INCIDENCE OF DYSPLASTIC CHANGES IN CERVIX UTERI AMONG WOMENOF DIFFERENT AGE GROUPS
Yakutsk, Republic Sakha (Yakutia), Russia: KIRILLINA Maria Petrovna – Candidate of Biological Sciences, Senior Research Scien-tist, Head of Yakut Science Centre of Complex Medical Problems Laboratory, Head of NEFU Medical Institute Clinic Laboratory,[email protected],89142716881, KONONOVA Irina Vasilievna – Candidate of Medical Science, Research Worker of Yakut Science Centre of Complex Medical Problems Laboratory, [email protected] 89243683673, SOFRONOVA Sargylana Ivanovna – Candidate of Medi-cine, Senior Research Associate, Head of Sci-entific and Organizational Department of Yakut Science Centre of Complex Medical Problems Laboratory, [email protected] 89841094825, IVANOVA Anna Konstantinovna - Clinical Pathologist of NEFU Medical Institute Clin-ic, [email protected], 89248647588, LUSHNIKOVA Elena Leonidovna- Doctor of Biological Science, professor, the head of FSBIS Institute of Molecular Pathology and Pathomorphology “Federal Research Center of Fundamental and Translational Medicine” 630117,Novosibirsk,Timakova st.,2, [email protected](383)334-80-03.
DOI 10.25789/YMJ.2019.67.11

ЯКУТСКИЙ МЕДИЦИНСКИЙ ЖУРНАЛ38
HPV detection in patients. In addition, the frequency of epithelial dysplasia increas-es with age [6]. However, the greatest pathogenic effect of HPV manifests in young women, and it realizes in the de-velopment of cervical intraepithelial neo-plasia (CIN) of severe degree [9], which requires careful study of age-related fea-tures of pathomorphological dysplasia presentation. Dysplasia is a morpholog-ical concept, so diagnosis is made only on the basis of cytological and histolog-ical data [6].Cells with dyskaryosis are cytologically detected in dysplasia of cer-vical smear. Depending on the severity of changes in the nucleo-cytoplasmic ratio and other structural features (shape, nu-clei, content, and distribution of chroma-tin, inclusions in the cytoplasm) there are 3 degrees of CIN: CIN 1 (mild dysplasia), CIN 2 (moderate dysplasia) and CIN 3 (severe dysplasia) [7]. Cytological pic-ture of CIN 1 is represented by relatively mature cells with relatively large nuclei. These cells are located separately or in the two-dimensional assembly of un-changed squamous epithelial cells. Cells retain signs of cytoplasmic differentiation characteristic of the surface and interme-diate layers of the flat epithelium. Nuclei – slightly hyperchromic, with the same type of uniform granular structure of chromatin, nucleoli are absent. Signs of infection with the human papillomavirus (HPV) are often occurred . In CIN 2 the shape and size of cells resemble cells of immature squamous metaplasia, but with larger nuclei. The cytoplasm has a sharp contour (a distinction of squamous cell differentiation). Nuclear-cytoplasmic ratio is increased. There is hyperchromia of the nuclei, the granular structure of chro-matin, and nucleoli are not visible. Some-times signs of HPV infection are found. In cytological preparations with CIN 3 signs of atypia are more intensive. Sharp con-tours of the cytoplasm are visible in cells, making them relate to the squamous epithelium cells. Nuclear-cytoplasmic ra-tio strongly increased. Severe atypia is particularly visible in the nucleus: lumpy chromatin, nuclear membrane are irregu-lar, nucleoli are absent. There are remote signs of HPV infection [5].
Purpose of research. To determine the features of the occurrence of dysplas-tic changes in cervix uteri in women of dif-ferent age groups, we decided to analyze the frequency of incidence of CIN 1, CIN 2, CIN 3 and CC in cytological smears of women of different age groups who were examined from 2016 to 2018 inclusive; to identify the frequency and dynamics of CIN 1, CIN 2, CIN 3 and CC depending on the year of examination and age of women.
Materials and methods of research: The analysis of cytologic material of a cervix of 7600 women aged from 18 up to 88 years with the preventive and di-agnostic purpose, during 2017 – 2018 is carried out to laboratory of a pathomor-phology, histology and cytology of Clinic of Medical institute of NEFU.
The material of the study was smears from the mucosa of the cervix uteri and the cervical canal. Cytological diagnosis was carried out by staining, the method of Romanovskiy - Giemsa. Cytological diagnosis – degree CIN (cervical cancer) is made in accordance with the clinico-pathologic classification of Y. V.Bokhman (1976). The incidence of CIN 1, CIN 2, CIN 3 (CC) in smears was expressed in percentage of the total number of women with dysplasia.
Results and discussion. The total number of patients with dysplastic chang-es in the cervix uteri of different degrees was 931 people. Of them, 128 women (13.7% of the total) went through cyto-logical examination in 2016, 322 women (34.6 %) in 2017, and 481 women (51.6%) in 2018. Cytological material was studied in women according to the age groups, the distribution was as follows: women under 25 years - 144 people (15.5%), 26-35 years – 222 people (23.8%), 36-45 years – 212 women (22.7%), 46 – 55
years – 192 women (20.6%), 56 years and older – 161 women (17.3%).The CIN incidence of varying degrees is analyzed, as well as CC in the cytologi-cal smears of all women who underwent examination from 2016 to 2018 inclusive. It is clear that the highest rate is in CIN 1, which was registered in 578 women and amounted to 62.1% of all women studied, CIN 2 was found in 241 women (25.9%), and CIN3 was diagnosed in 97 women, which amounted to 10.4% of all
cervical dysplasia in the examined group (pic.1,2).Cervical cancer was cytologi-cally detected in 15 cases and amounted to 1.6% of the total number of examined women (pic.5).It should be noted that the high frequency of CIN 1 incidence is de-tected in the inflammation of the cervix when a cytological study reveals repara-tive atypical cells – equivalents of dyspla-sia. These phenomena often disappear after anti-inflammatory treatment, elimi-nation of the viral agent [4].
As Fig.3 shows analysis of the fre-quency of CIN 1, CIN 2, CIN 3 incidence and CC over a three-year period (from 2016 to 2018 inclusive), depending on the year of the examination, CIN 1 is in-creasing from year to year while CIN 2 and CIN 3 are reducing. The frequency of CIN 1 incidence in 2018 increased by 52.6% compared to 2016, while the CIN 2 incidence decreased by 24.3%, and the CIN 3 incidence decreased 3.3 times. The incidence of СС decreased 2.2 times in the studied smears during a three-year period. It indicates a pos-itive dynamics in the development of dysplasia. The growth of CIN1 can be
Fig. 1. The distribution of the incidence rate of the dysplasia of different degree for the period 2016-2018
Fig. 2 А – Cells with signs of mild dysplasia (CIN 1), B – cells with signs of moderate dys-plasia (CIN 2), C, D– severe dysplasia (CIN 3), X200
Fig. 3. Dynamics of incidence of dysplasia of different degrees for the period 2016-2018
Fig. 4. Incidence of cervical dysplasia in differ-ent age groups

3’ 2019 39
explained by reactive epithelial changes in various inflammatory diseases. Re-duction of CIN2 and CIN3, CC can be associated with constant monitoring of patients and the development of dyspla-sia in the dynamics and effectiveness of the treatment.
In studying the incidence of cervical dysplasia depending on age, our analy-sis showed that the most frequently di-agnosed cervical pathology in all age groups was CIN 1(pic.4).The maximum frequency of CIN 1(14.2%) incidence was observed in women of 26-35 age group, the minimum value of this indica-tor (10%) was in the group of 56 years and older. The maximum frequency of CIN 2 (6.4%) incidence was observed in the same population in two groups (26-35 years and 36-45 years). Both groups rep-resent women of childbearing age. The minimum frequency of CIN 2 (3.7%) inci-
dence was in the group of women 46-55 years. The highest incidence of CIN3 was observed in women aged 26-35 years and was 3%. The minimum incidence of CIN3 (0.8%) was in women under 25 years. The obtained data is indicating the maxi-mum number of women who became ill at fertile age, and it is an alarming fact since this group of patients is not only a reproductive considerable part of the fe-male population but also an active social group. Cervical cancer was detected cy-tologically in 15 cases and amounted to 1.6% of the total number of women ex-amined. The maximum incidence of CC was observed in of 56 years and older age group-6 cases (0.6%). It should be noted that the incidence of CC increases depending on the age of patients. The rate is 2.5 and 3 times higher in women of 46-55 years and 56 and older age
groups than in women 26-45 years age group (in women under 25 years, CC was not detected).The study confirms that the progression of the severity of dysplasia is going many decades [10]. Also, when the severity of dysplasia increases -the risk of its progression increases and the chance of regression decreases.
Conclusion. The frequency of CIN 1, CIN 2, CIN 3 and CC incidence in smears of cervix uteri and the cervical canal was inversely dependent on the degree of dysplasia in all age groups of women who were examined from 2016 to 2018.The incidence rate of CIN 1 in-creased from 2016 to 2018, while CIN 2 and CIN 3 and CC have been decreas-ing the rates. Analysis of the nature of CIN 1, CIN 2, CIN 3 and CC incidence, depending on age revealed that women of 26-35 years had the highest incidence of CIN 1, CIN 2 and CIN 3, women of 36-45 years had CIN 2 with the same frequency as in the previous group, and women of 46-55 years had a sharp in-crease in CC by 2.5 times, compared with the previous two groups, but pa-tients of 56 years and older had the peak incidence of CC.
Regular cytological examination of cer-vix uteri leads not only to decrease in the number of newly diagnosed patients from year to year but also to absence or slow-down of negative dynamics and possible regression of existing pathological chang-es in cervix uteri. Prevention, early detec-tion and effective treatment of malignant tumors is one of the most important part of modern medicine. The need of regu-lar preventive examinations of women with the necessary cytological examina-tion, clinical examination, and treatment of patients with background CC diseases is appears based on the data analysis of the incidence of dysplasia and CC. Such an arrangement should be optimized ac-cording to the age of women. Our results require special studies on developing the lines of approach on the main problems associated with the detection, preven-tion, and treatment of early forms of CC. However, at present, we recommend paying more attention to women born in 1980-1990 (age group 26-35 years), who most often had dysplasia of all de-
grees, including severe degree, women of 1960 (age group 46-55 years and older), who had a sharp increase of CC.
The paper was written as part of R&D “The epidemiological aspects of can-cer on the Far North living environment, development of modern early detection methods, and prevention methods with high-informative fundamental research. (М06; 01; 01)" (№ 0556-2014-0006).
1. Бабаева А.Г. Регенерация: факты и перспектива. М., 2009:336. [Babayeva AG. Re-generation: facts and perspective. M., 2009: 336. (In Russ.).]
2. Краснопольский О.Ф., Серова В.А., Туманова и др. Влияние инфекций на репродуктивную систему женщин. Российский вестник акушера- гинеколога. 2004;4(5):26-29. [Krasnopolsky ОF, Serova VA, Tumanova et al. The effect of infections on the reproductive sys-tem of women. Russian vestnik akushera-gine-kologa. 2004; 4(5): 26-29. (In Russ.).]
3. Новик В.И. Факторы эффективности цитологического скрининга рака шейки матки. Практическая онкология. 2010; 11 (2):66-71. [Novik VI. Factors of the effectiveness of cytolog-ical screening for cervical cancer. Prakticheskaya onkologiya. 2010; 11(2):66-71. (In Russ.).]
4. Полякова В.А. Онкогинекология. Медицинская книга.2001:192. [Polyakova VA. Medicinskaya kniga. 2001:192. (In Russ.).]
5. Полонская Н.Ю., Некрасов П.И., Роговская С.И. Повышение эффективности диагностики заболеваний шейки матки: в помощь цитологу и специалисту по кольпоскопии. Доктор.ру. 2015;2(12):6-9. [Polonskaya NYu, Nekrasov PI, Rogovskaya SI. Improving the efficiency of diagnosis of diseases of the cervix uterus: to help the cytologist and specialist in colpos-copy. Doktor.ru. 2015; 2(12):6-9. (In Russ.).]
6. Прилепская В.Н. Заболевания шейки матки, влагалища и вульвы МЕД пре-информ, 2005:432. [Prilepskaya VN. Diseases of the cer-vix, vagina and vulva. MED pre-inform. 2005:432. (In Russ.).]
7. Сидельникова В.М. Первичная потеря беременности. Триада-Х. 2000:304. [Sidelniko-va VM. Primary pregnancy. Triada-X. 2000:304. (In Russ.).]
8. Munoz N, Bosch FX, de Sanjose S, Herrero R, Castellsague X, Shah KV, Snijders PJ, Meijer CJ. Epidemiological classification of human papil-lomavirus types associated with cervical cancer. N. Engl. J. Med. 2003; 348 (6):518-527.
9. Ed. Fattaneh A. Tavassoli, Peter Devilee. Pathology and Genetics of Tumours of the Breast and Female Genital Organs (WHO Classification of Tumours). Lyon.: IARC Press. 2003:266-268.
10. Richart R. M., Barron B. A. A follow-up study of patients with cervical dysplasia. Amer.J. Obstet. Gynecol.1969;105:386-393.
Fig. 5. A - adenocarcinoma of the cervix uteri, B - squamous cell carcinoma of the cervix uteri, X200
References

ЯКУТСКИЙ МЕДИЦИНСКИЙ ЖУРНАЛ40
The analysis of blood pressure indicators for residents of the Republic (Yakutia) from the position of the golden ratio using the structural spot of blood pressure (SSBP) - the ratio of DBP / SBP with a value close to the value of the golden ratio (ZP) - 0.618 (harmonious ratio) was performed. Existing blood pressure standards (120/80 mmHg) are not always acceptable for all categories of the population, especially for older people. Therefore, each person needs an individual approach. It has been established that SSBP opens up new possibilities in terms of the proportion of the golden ratio in predicting the stability of the course of blood pressure during functional studies in patients with arterial hypertension.
Keywords: Yakutia, blood pressure, arterial hypertension, golden ratio.
Introduction. In recent decades, es-sential arterial hypertension (EH) and coronary heart disease (CHD) have firm-ly taken the leading place in the structure of cardiovascular and overall population morbidity. Arterial hypertension (AH) is significant because it is the most import-ant risk factor for cardiovascular diseas-es, mainly affecting the statistics of com-plications, disability and high mortality in the world community. More than half of the deaths in the Russian Federation are due to circulatory system diseases. According to the statistics of the general
morbidity rate of the adult population in 2017, the index of hypertensive heart and kidney disease was 264.3 per 100,000 of the total population [10].
In recent years, the prevalence sta-tistics of AH in the territory of the Sakha (Yakutia) Republic continues to grow. Therefore, in 2016-2017, the prevalence of AH was 43.7 and 44.82%, respective-ly. According to the latest statistics, the number of deaths from circulatory sys-tem diseases from January to December 2018 in Yakutia was 355.0 per 100,000, and 325.6 from January to February 2019 [5, 19].
According to the synergetics theory, the human body is a multi-level hierar-chically organized complex system. Dif-ferent levels interact with each other in different ways and thereby determine the state of dynamic equilibrium [6,15].
The state of dynamic equilibrium sup-ports the functioning of the organism, and a change of this state as a result of external influences or diseases leads to disturbances in hierarchical interactions. These disorders are either quickly com-pensated or lead to the development of the pathological process [3].
Thus, the circulatory system can also be viewed as a multi-level hierarchically complex system and at the level of its constituent subsystems that determine the balance of the body. One of the dis-plays of such structural and functional balance is a correspondence with the “Golden ratio” rule [17,18].
The rule of the golden ratio has been known to mankind for a long time and has found application both in science and art. Pythagoras introduced the concept of the gold division into science. The “golden ra-tio” is known as proportions: the division of the AC interval into two parts, so that the length of the bigger part AB is to the length of the smaller part BC in the same
way as the length of the whole interval to the length of AB (AB: BC = AC: AB ). The golden ratio is made if the whole is to the one part as 1:0.618, and most to the lesser as 0.618:0.382 [17, 18]. Also, the concept of the “golden ratio” is described by the proportions found by using the val-ue that is the universal quotient of divid-ing a larger number by the next smaller number in the gold series of Fibonacci numbers (1, 1, 2, 3, 5, 8, 13, 21, 34, 55, 89 etc.; that is 89:55 = 1.618 ...) [17,18].
In recent years, scientists have active-ly studied the relationship of the golden ratio with the heart function and hemody-namic indices. V.D. Tsvetkov was the first to show the role of the golden ratio and Fibonacci numbers in the organization of the cardiac systems, he found that the golden numbers are the guarantors of the optimal heart activity, the most economi-cal in terms of energy and living matter [7, 18]. Moreover, it was researched that the ratio of heart rate variability to the di-astolic interval was 1.618, which is the golden ratio [8, 21]. Similar studies were conducted to find out whether diastolic and systolic blood pressure is consistent with this ratio [22].
Deviations from ideal indices (1.618 or 0.618) among healthy people are consid-ered to be no more than 5–8%, even with the changes of hemodynamic indices by 1.5–2 times [1].
In 1998 V.V. Shkarin and E.V. Gur-vich studied the clinical value of diastolic (DBP) and systolic (SBP) blood pressure (BP) ratio. This ratio has the term "struc-tured spot of blood pressure" (SSBP). Currently, it is known that SSBP is ap-proaching the value of the “golden ratio” proportion - 0.618. Regardless of BP in-dicators, SSBP aims for a constant value [3, 4].
V.G. Bochkov developed a universal table of the quality zones of the systems
E.I. Semyonova, L.D. Olesova, A.V. Yefremova, E.D. Okhlopkova, L.I. Konstantinova,A.I. Yakovleva, A.N. Romanova, S.I. Sofronova, A. G. EgorovaTHE STRUCTURED SPOT OF BLOOD PRESSURE FROM THE PERSPECTIVE OF THE "GOLDEN RATIO" PROPORTIONDOI 10.25789/YMJ.2019.67.12
Yakutsk, Russia, Yakut Science Centre of Complex Medical Problems: SEMYONOVA Evgenia Ivanovna – Candidate of Biological Sciences, Senior Scientist, E-mail: [email protected], OLESOVA Lyubov Dygynova – Candidate of Biological Sciences, Leading Research Scientist, Head of the Laboratory of biochemical studies at the “Yakut Science Centre of Complex Medical Problems”. EFRE-MOVA Agrafena Vladimirovna – Candidate of Biological Sciences, Senior Scientist of the Laboratory of biochemical studies at the “Ya-kut Science Centre of Complex Medical Prob-lems”. KONSTANTINOVA Lena Ivanovna – Research Scientist of the Laboratory of bio-chemical studies at the “Yakut Science Centre of Complex Medical Problems”. YAKOVLEVA Alexandra Ivanovna – Research Scientist of the Laboratory of biochemical studies, Adap-tation Mechanism Research Division, “Yakut Science Centre of Complex Medical Prob-lems”. OKHLOPKOVA Elena Dmitrievna – Candidate of Biological Sciences, Leading Research Scientist, Head of the Laboratory of immunology, “Yakut Science Centre of Com-plex Medical Problems”. ROMANOVA Anna Nikolaevna – Doctor of Medicine, Director of the “Yakut Science Centre of Complex Med-ical Problems”. SOFRONOVA Sargylana Ivanovna – Candidate of Medical Sciences, Chief Research Scientist, Chief of the “Yakut Science Centre of Complex Medical Prob-lems”. EGOROVA Aytalina Grigorievna – Candidate of Medical Sciences.

3’ 2019 41
functioning, depending on the value of in-dices similar to SSBP for any biological system, applicable for BP, too [4].
The purpose of this study was to as-sess and analyze the structured spot of blood pressure in residents of Yakutia from the perspective of the "golden ratio".
Materials and methods. The study used the existing database of biomed-ical expeditions of the Yakut Science Centre of Complex Medical Problems from 2008-2018, including data on 1959 people. Blood pressure data of 12 re-gions of the Republic of Sakha (Yaku-tia) was analyzed. Districts were divid-ed by socio-economic zones: Northern (Arctic) - Anabarsky, Verkhnekolymsky, Srednekolymsky; Eastern - Ust-Maysky, Oymyakonsky (Tomtor, 2018), Oymya-konsky (Ust-Nera, 2008); Western – Vi-lyuysky; Southern - Lensky, Aldansky; Central - Megino-Kangalasky, Ust-Aldan-sky, Yakutsk.
The body mass index (BMI) was calcu-lated by the formula: BMI = body weight in (kg) / height (m)2 [16]. For overweight took the values were > 25 and < 30 kg / m2. Obesity was recorded with a BMI > 30 kg / m2 (according to European rec-ommendations of the III revision, 2003). During the classification of blood pressure levels of mm Hg. data from VNOK (2009) [2] was used, so the optimal was <120 and <80 mm Hg, normal 120–129 and / or 80–84 mm Hg, high normal 130-1139 / or 85–89 mm Hg; Grade 1 hypertension corresponded to 140–159 and / or 90–99 mm Hg, grade 2 hypertension - 160–179 and / or 100–109 mm Hg, 3rd degree hy-pertension - ≥ 180 and / or ≥110 mm Hg. For the assessment of blood pressure in-dices, the “structured spot of blood pres-sure” (SSBP) and the ratio of DBP/SBP was used. It is now known that SSBP is approaching the value of the golden pro-portion of the RFP - 0.618 (harmonious ratio). The values of blood pressure with SSBP in the range from 0.564 to 0.673 among healthy people were considered stable. In patients with arterial hyper-tension (AH), “disharmony” ranged from 0.549 to 0.687 (the deviation of GP from up to 8% - 11%).The greatest differenc-es from the GR proportion, “imbalance or disbalance” (12% and above), which are characteristic of unstable states: border-line arterial hypertension, severe forms of AH, possibly crisis forms of AH [3].
Statistical processing of the results was performed using the SPSS applica-tion package (version 17) and Microsoft Office Excel 2003.The accuracy of dif-ferences between average indices was assessed using Student’s t-test, Wilcox-on–Mann–Whitney (Ζ) and Kolmogorov–
Smirnov nonparametric test. Differences were considered statistically significant at p <0.05.
Research results. According to the blood pressure data of the studied pop-ulation, the structured spot of blood pres-sure was calculated as the clinical value. At the moment, it has been shown that SSBP is approaching the value of the proportion of the golden ratio = 0.618 [4].
The results of anthropometric indices close to the golden proportion (GP) in terms of blood pressure and SSBP are presented in Table 1. With the indices of SSBP equal to (0.615-0.618), the resi-dents of Tomtor village, Oymyakonsky District had the shortest height (1,547 ± 0,03), and the residents of Yakutsk are the tallest 1,731 ± 0.06 m ( p <0.05).The body weight of the residents of the Srednekolymsky District corresponded to 81.10 + 7.24 kg and was the highest indicator in the compared groups, and the residents of the Megino-Kangalasky district had the smallest weight - 61.42 + 7.36 kg (p <0.05). Body mass index (BMI) showed as overweight almost in all groups. Obesity was observed in residents of the Verkhne- and Sred-nekolymsky districts (30.83 + 3.06, 31.59 + 4.32 respectively), as well as in the
Oymyakonsky District, Ust–Nera village (32.89 + 3.00) (Table 1).
The results of the obtained blood pressure (BP) data and SSBP in the sur-veyed residents by district are presented in Table 2. The average indices of blood pressure and SSBP in the districts were SBP 129.94 + 0.544 mm Hg, DBP 81.10 +, 297 mm Hg. at a harmonious SSBP of 0.629 + 0.00. A SSBP close to the golden proportion (0.618) was found in the res-idents of Anabarsky (0.615 + 0.00) and Ust-Aldansky (0.619 + 0.00) districts, where blood pressure corresponded to SBP 135.45 ± 2.29 mm Hg. and 134.05 + 1.59, DBP 82.13 ± 0.82 and 81.92 + 0.76 mm Hg respectively (Table 2).
With age, there is a tendency of in-creased blood pressure and decreased SSBP, while significant differences in pressure and SSBP have been observed since the age of 30. High pressure, ex-ceeding normal values, begins at the age of 50 and reaches the highest value in the age group of 80-89 years old (Table 3). It should be noted that from the surveyed population, only 1.61-3.23% of the pop-ulation had a harmonious (0.615) SSBP indices, close to the GP (0.618) (Table 3).
The surveyed population was divided into 2 groups: the 1st group included res-
Anthropometric measurements and BMI among the examined residents with the SSBP indices close to the Golden proportion (0,615-0,618)
DISTRICT Height,m
Weightkg
BMI SBP,mm Hg
DBP,mm Hg SSBP
Anabarsky n=16 (13.11%)
1.62±0.05
74.41±8.30
29.35±3.59
130.00±.00
80.00±.00
0.6150±.00
Lenskyn=13 (9.15%)
1.61±.04
68.256±.30
26.25±2.49
128.13±.65
78.842±.19
0.616±0.00
Megino-Kangalaskyn=12 (6.15%)
1.53±0.04 61.42±7.36 26.31±
2.69130.00±5.73
80.00±3.44
0.615±0.00
Oymyakonsky 2018 (Tomtor village)n=3 (1.62%)
1.55±0.03
62.33±11.43
26.145±.14
121.67±10.97
75.00±6.58
0.617±0.00
Srednekolymskyn=4 (8.51%)
1.67±0.02
81.10±7.24
31.59±4.32
130.75±12.43
80.50±7.52
0.616±0.00
Ust-Aldansky n=16 (4.97%)
1.61±0.05
68.68±4.65
26.49±1.61
132.50±8.90
81.56±5.46
0.616±0.00
Ust-Mayskyn=8 (5.63%)
1.59±0.04
73.87±9.23
29.25±4.11
129.12±14.47
79.38±8.77
0.615±0.00
Vilyuysky n=4 (5%)
1.59±0.05
63.25±13.73
25.026±4.84
125.75±15.64
77.50±9.35
0.617±0.00
Verkhnekolymsky n=7 (8.05%)
1.65±0.05
83.57±9.53
30.83±3.06
119.14±6.48
73.57±3.85
0.618±0.00
Yakutsk n=13 (3.54%)
1.73±0.06
83.23±7.45
27.79±2.10
130.00±0.00
80.00±0.00
0.615±0.00
Aldansky n=15 (8.93%)
1.67±0.05
77.13±8.40
27.60±2.53
133.33±6.56
82.00±3.94
0.615±0.00
Oymyakonsky 2008 (Ust-Nera village) n=7 (6.94%)
1.59±0.48
83.80 ±5.19
32.89±3.00
121.57±6.67
75.00±3.97
0.617±0.00
Table 1

ЯКУТСКИЙ МЕДИЦИНСКИЙ ЖУРНАЛ42
idents who did not have high blood pres-sure, the 2 group included people diag-nosed with arterial hypertension. When comparing the average indices of SSBP by districts in the 1st group with harmo-nious SSBP, residents of the Verkhne-kolymsky district amounted to mean 0.609 ± 0.05, and disharmonious SSBP was found among residents of Yakutsk 0.631 ± 0.06. In group 2, harmonious SSBP (0.614 ± 0.07) was observed in the residents of Tomtor village, Oymya-konsky District and Megino-Kangalasky (0.609 ± 0.05) District. Residents of Len-sky District turned out to have a dishar-monious SSBP (0.566 ± 0.07).
When analyzing data by districts, har-monious SSBP was observed among the population of Ust-Aldansky, Anabarsky and Lensky districts, and when compar-ing across SSBP zones, harmonious indices were found among residents of the Arctic (Table 4). Within the zone by districts, a significant difference was found in the Northern (Arctic) zone - be-tween Anabarsky and Verkhnekolymsky districts - p <0.04 (according to Kolmog-orov). The eastern zone - between Ust–
Maysky and Oymyakonsky (Ust-Nera, 2008) districts - p <0.05. Southern zone - a significant difference was observed between Lensky and Aldansky, p <0.001, the Central zone - Magino-Kangalass-ky district and Yakutsk, p <0.001. Also, the difference in SSBP indices between the zones was significant: between the Northern and Eastern, Northern and Western (p <0.02), Western and South-ern, (p <0.001), Southern and Central zones (p <0.02) (Table 4).
Results of the comparative analysis of the groups 1 and 2 are presented in table 5. Indices of blood pressure of the 1st group were within the limits of the permissible rate, harmonious SSBP was detected in 70 people, which amounted to 3.57% (Table 5). In group 2, blood pressure was higher than normal - SBP144.36 ± 0.88 and DBP 89.15 ± 0.51, however, it should be noted that dishar-monic SSBP was 0.619 ± 0.00, which is very close to the golden proportion (0.618). Thus it is possible to confirm the statement of K. Nishi that the main indi-cator of health is the ratio of upper (SBP) and lower (DBP) pressure, which is 7/11
(or quite close to this value within 6/11 - 8/11), as it is approaching the golden ratio (0.618). Meanwhile, in group 2, har-monious SSBP (0.615) was indicated in only 1.84% of people. Harmonious SSBP in group 1 was significantly different from all other indices of SSBP and blood pres-sure of group 2 (χ 2 = 0.000, p = 0.001) (Table 5).
In the study of SSBP, depending on the classifications of blood pressure, the following results were obtained. Out of the total number of people studied, hypo-tonia was detected in 75 people (3.84%) with an average BP of 94.06 / 61.75 mm Hg, SSBP was disharmonious. 578 peo-ple (29.57%) had optimal pressure, BP was 108.65 / 70.4 mm Hg, SSBP was disharmonious. Normal blood pressure was observed in 401 people (20.51%), blood pressure was 123.56 / 81.35 mm Hg, and SSBP was disharmonious. High normal blood pressure was present in 262 people (13.40%), blood pressure was 131.97 / 90.59 mm Hg, SSBP was disbalanced. Moderate hypertension was detected in 378 people (19.34%), blood pressure was 145.61 / 90.47 mm Hg, SSBP was disharmonious. Hyper-tension of moderate severity occurred in 169 people (8.44%), blood pressure ranged 165.70 / 94.87 mm Hg, SSBP was disbalanced. 92 people (4.71%) ap-peared to have severe hypertension, BP 192.33 / 103.04 mm Hg, SSBP was dis-balanced (Table 6). Unbalanced SSBP (0.542) occurred in all classifications of blood pressure, however, the highest incidence was observed in people with moderate (16.57%) and severe hyper-tension (64.13%). Harmonious SSBP (0.615) is observed only in residents with high normal pressure. SSBP was disharmonious in all classifications of blood pressure and the largest numbers had residents with hypotension (50.67%) (Table 6). With an increased blood pres-sure and BMI, a decrease in SSBP and remoteness from the golden proportion (0.618) was observed, and a strong in-verse correlation was noted between them (r = -0.854, p <0.05) (Table 6).
When the heart is working in the ves-sels, hydrodynamic pressure is created, which is caused by the resistance of the vessel walls. For an adult, a convention-ally normal blood pressure is: the max-imum (systolic) -100 - 140 mm Hg. and the minimum (diastolic) - 70 - 90 mm Hg.
Thus, the range of possible BP in hu-mans is 0–100–140 mm Hg. We divide this range in relation of 1.61:1, we get 100 / 1.618 = 61.8 mm Hg. 140 / 1.618 = 86.5 mm Hg., which is very close to the parameters of diastolic pressure. With
The indices of BP and SSBP by districts
Districts n SBP,mm Hg
DBP,mm Hg SSBP
Anabarsky 122 135.45±2.29 82.13±0.82 0.615+0.00Lensky 142 137.64+2.19 81.77+0.86 0.604+0.00Megino-Kangalasky 195 117.79+1.44 73.59+0.81 0.627+0.00Oymyakonsky 2018 (Tomtor Village) 185 144.52+2.02 90.19+1.02 0.632+0.01Srednekolymsky 47 126.32+2.54 78.50+1.62 0.625+0.01Ust-Aldansky 322 134.05+1.59 81.92+0.76 0.619+0.00Ust-Maysky 142 132.26+1.97 85.34+1.25 0.648+0.00Vilyuysky 80 130.76+2.34 82.71+1.57 0.634+0.00Verkhnekolymsky 87 129.57+2.77 77.53+1.26 0.605+0.06Yakutsk 367 123.30+0.96 77.99+0.70 0.632+0.00Aldansky 168 125.80+1.10 82.05+0.71 0.653+0.00Oymyakonsky 2008 (Ust-Nera village) 101 125.13+2.00 80.96+1.17 0.649+0.00Overall 1959 129.94+0.54 81.10+0.29 0.629+0.00
Table 2
Table 3
The indices of BP and SSBP in relation to age
Age N SBP, mm Hg
DBP,mm Hg SSBP
with SSBP (0,615)
in %P<0,05
20-29 247 112.07+3.83 73.29+2.35 0.635+0.00 3.23 -30-39 360 118.32+0.84 76.13+0.57 0.644+0.00 2.5 +40-49 417 125.79+0.95 80.73+0.63 0.643+0.00 2.63 +50+59 574 135.88+0.98 84.83+0.54 0.629+0.00 2.09 +60-69 249 147.32+1.69 87.43+0.87 0.599+0.00 1.61 +70-79 75 153.28+3.03 86.40+1.31 0.572+0.00 2.66 +80-89 19 154.42+6.04 84.742.99 0.555+0.02 - +
90 + y. o. 1 160 80 0.500 - -

3’ 2019 43
hypertensive disease or with increased physical exertion, blood pressure rises. The maximum possible systolic pressure in humans can reach 230 mm Hg. The limiting value of blood pressure differs from normal systolic by 1.618 times: 140 * 1.618 = 226.5 mm Hg. From this we can conclude that the ratio of blood pressure with the golden proportion is obvious.
It is believed that the fluctuations of the upper pressure are harmful to the body. However, as it was written above, Professor Katsuzo Nishi (2006), lived in the early 20th century, the ratio between upper and lower pressure and vice versa considered to be especially dangerous disruptions. He considered the "golden ratio" of blood pressure, which is 7/11 (or rather close to this value within (6/11 - 8/11)), as an indicator of health, which should be aligned with. With this ratio, practically any figures of upper and low-er pressure are absolutely not danger-ous for a person, even 274/174 mm Hg (0.635). But if this "golden ratio" is vio-lated, for example, at the level of BP of 127/95 mm Hg (0.748), there is a signif-icant health hazard. And, of course, the greater the difference between the ratio of upper/lower pressure and the "golden ratio" is, the higher the risk of develop-ing cardiovascular diseases. It should be noted that this formula is applicable only to people over 20 years of age [9].
O.V. Tatarinova (2014) in a result of a 7-year prospective observation of res-idents of Yakutia over 60 years old with a minimal risk of death, revealed that in both sexes, the SBP was 148.3 ± 24.2 and the DBP was 87.4 + 11.7, BMI - 26.7 ± 5.1. Let's make the calculation from the point of view of the Nishi’s golden proportion: 87.4 x11 = 961.4 / 148.3 = 6.48, which is an indicator of health in the “golden ratio”, SSBP turned out to be dis-harmonious - 0.589. Our obtained results upon the age gradient above 60 years old correspond with the data of O.V. Tatarino-va (Table 3) [14].
M.A. Karpenko et al. (2010) re-searched the clinical value of quantita-tive analysis of ECG and BP using the “golden ratio” method and found that if the ECG and blood pressure values devi-ate from the optimal values by more than 15%, the probability of having CHD in the examined patients is 85% [6].
It is interesting how according to a large-scale HOT study (Hypertension Optimal Treatment), which included the study of 18,790 patients with hyperten-sion, the optimal blood pressure in terms of the lowest risk of death due to cardio-vascular causes, is considered to be BP = 138.8 / 86.5 mm Hg. The calculation of
The indices of SSBP by districts, divided by the socio-economic zones
Socio-economic division of districts by zones
Group 1(without AH)
Group 2(with AH) Total amount
Northern (Arctic)Anabarsky 0.654±0.03 n=64 0.573±0.05 n=58 0.615±0.04 n=122Verkhnekolymsky 0.609±0.05 n=60 0.598±0.08 n=27 0.606±0.06 n=87Srednekolymsky 0.625±0.05 n=47TOTAL 0.615±0.05
EasternUst-Maysky 0.655±0.04 n=72 0.641±0.07 n=71 0.648±0.06 n=143Oymyakonsky 2018 0.674±0.05 n=55 0.614±0.07n
=130 0.632±0.07 n=186Oymyakonsky 2008 0.662±0.03 n=55 0.641±0.04 n=56 0.650±0.04 n=101TOTAL 0.643±0.04
WesternVilyuysky 0.642±0.05 n=52 0.621±0.06 n=28 0.635±0.06 n=80TOTAL 0.635±0.06
SouthernLensky 0.642±0.04 n=71 0.566±0.07 n=71 0.604±0.07 n=142
Aldansky 0 . 6 5 7 ± 0 . 0 3 n=117 0.644±0.05 n=48 0.653±0.04 n=165
TOTAL 0.628±0.05Central
Megino-Kangalasky 0.637±0.03 n=30 0.609±0.05 n=65 0.628±0.04 n=195
Ust-Aldansky 0.646±0.03 n=170
0.588±0.06 n=152 0.619±0.06 n=322
Yakutsk 0.631±0.06 n=251
0.633±0.06 n=116 0.632±0.06 n=367
TOTAL 0.626±0.05n=1959
The indices of BP and SSBP among the examined residents without AH and with AH
Indices SBR,mm HG
DBR,mm HG. SSBR %
Gro
up 2
(with
out A
H)
Stable disharmony (0.564-0.673)
n=732116.24±0.53 74.14±0.03 0.638±0.00 37.37
Lower disbalance (from 0.564 and lower)
n=96118.57±1.85 63.45±0.81 0.537±0.00 4.9
Higher disbalance(from 0.673 and higher)
n=232116.81±1.05 82.79±0.35 0.709±0.00 11.84
Harmonious. close to GP(0.618) n=70 126.13±1.27 77.60±0.62 0.619±0.00 3.57
Gro
up 2
(with
AH
)
Stable disharmony (0.549-0.687)
n=535144.36±0.88 89.15±0.51 0.619±0.00 27.31
Lower disbalance (from 0.549 and lower)
n=152170.70±1.56 86.01±0.95 0.505±0.00 7.76
Higher disbalance(from 0.687 and higher)
n=106134.46±1.37 96.24±0.98 0.716±0.00 5.41
Harmonious. close to GP n=36 131.11±1.95 80.69±1.19 0.615±0.00 1.84
Total n=1959 100%
Table 4
Table 5

ЯКУТСКИЙ МЕДИЦИНСКИЙ ЖУРНАЛ44
SSBP from these data gives the number of 0.6231, absolutely identical to the av-erage value of SSBP, which was obtained from the study of a group of healthy in-dividuals, and according to Nishi, the ratio of blood pressure was 6.85. The lowest risk of developing cardiovascular complications was found at BP = 138.5 / 82.6 mm Hg. SSBP in this case is equal to 0.5942, which is also included in the range of SSBP ± 1s [3].
Thus, the existing norms of blood pres-sure (according to WHO: 120/80 mm Hg) do not apply to all people, especially the elderly. Therefore, an individual approach is necessary for each patient, taking into account the proportion of the “golden ra-tio”. Analysis of the values of the struc-tural constant of blood pressure opens up new possibilities in terms of predicting the stability of arterial hypertension, and determination of the structured spot of blood pressure will be appropriate during functional studies in patients with arterial hypertension and coronary heart disease.
1. Александров С. Г. Использование фено-мена «золотого сечения» в оценке показателей гемодинамики. Сб.: Проблемы современной медицины: актуальные воп-росы. Иркутск, 2015: 56-59. [Alexandrov SG. The use of the phe-nomenon of the "golden ratio" in the assessment of hemodynamic indices. Problemy sovremennoj mediciny: aktual'nye voprosy. Irkutsk, 2015: 56-59 (In Russ.).]
2. Всероссийское научное общество кардио-логов (ВНОГ). Национальные рекомен-дации по профилактике, диагностике и лече-нию артериальной гипертонии. Москва: «МЕДИ Экспо»; 2009: 389. [Russian Scientific Society of Cardiologists. National guidelines for the prevention, diagnosis and treatment of hy-pertension. Moscow: “MEDI Expo”; 2009:389. (In Russ.).]
3. Гурвич Е. В. «Золотое сечение» в медицине. Мистика или универсальный критерий? Ниже-городский мед. журнал. 2002; 2:101-106. [Gurvich EV. "Golden ratio" in medi-cine. Mysticism or universal criterion? // Nizh-negorodsky med. zhurnal. 2002; 2:101-106. (In Russ.).]
4. Гурвич Е. В. Клиническое значение структурной точки кардиоцикла и структурной
точки артериального давления с позиции пропорции «золотого сечения»: автореферат дис. ... кандидата медицинских наук. Нижегор. гос. мед. акад. Нижний Новгород, 2003: 27. [Gurvich EV. The clinical value of the structured spot of the cardiac cycle and structured spot of blood pressure from the perspective of the "Golden ratio» proportion: abstract of a Candi-date of Medical Science thesis. Nizhegor. gos. med. academ. Nizhny Novgorod, 2003: 27. (In Russ.).]
5. Ефремова А.И. Уровни артериального давления и распространенность артериальной гипертонии у пожилого населения г. Якут-ска с цереброваскулярными. Якутский медицин-ский журнал. 2010; 2(30): 26-28. [Efremova AI. Blood pressure levels and prevalence of arterial hypertension in the elderly population of Yakutsk with cerebrovascular. Yakutskiy medicinskiy zhur-nal. 2010; 2(30: 26-28 (In Russ.).]
6. Карпенко М. А. Значение анализа электро-кардиограммы с позиций синергетики в оценке степени поражения коронарных артерий у больных ИБС. Бюллетень Федерального Центра сердца, крови и эндокринологии им. В. А. Алмазова. 2010; 5: 39-43. [Karpenko MA. The value of electrocardiogram analysis from the standpoint of synergetics in assessing the degree of coronary artery disease in patients with CHD. V. A. Almazov Bulletin of the Federal Center for heart, blood and endocrinology. 2010; 5: 39-43. (In Russ.).]
7. Кузнецова Т. Г., Иванов В. В. «Золотые» пропорции в динамике сердечного ритма. СПб.: Изд-во Политехн. ун-та, 2016:146 . [Kuznetsova TG, Ivanov VV. "Golden" proportions in the dynamics of the heart rate. SPb.: Publish-ing house of Polytechnical Institute. 2016: 146. (In Russ.).]
8. Марочков А. В., Точило С. А. Оценка артериального давления с использованием правила «золотого сечения». Новости хирур-гии. 2008; 3 (16): 126-131. [Marochkov AV, Tochi-lo SA. Assessment of blood pressure using the rule of "golden ratio" Novosti khirurgii. 2008; 3 (16): 126-131. (In Russ.).]
9. Ниши К. Золотые правила здоровья. Санкт-Петербург, «Невский проспект». 2006: 128. [Nishi K. Golden rules of health. St. Peters-burg, Nevsky prospect. 2006: 128. (In Russ.).]
10. Общая заболеваемость взрослого населе-ния России в 2017 году: статистические мате-риалы. Часть IV. М.; 2017: 69-78. [Gener-al morbidity of the adult population of Russia in 2017: statistical materials. Part IV. М.; 2017: 69-78. (In Russ.).]
11. Корнильева И. В., Иванов К. И., Алексеева Е. Ю., Распространенность арте-риальной гипертонии в РС (Я). Артериальная гипер-тензия. 2003; 5 (9):182-184. [Kornilyeva I. V., Ivanov K. I., Alekseeva E. U. The prevalence of arterial hypertension in the Republic of Sakha (Yakutia). Arterial hypertension. 2003; 5 (9):182-184. (In Russ.).]
12. Рослый И. М., Абрамов С. В., Покровский В. И. Ферментемия – адаптивный механизм или маркер цитолиза? Вестник РАМН. 2002; 8: 3-8. [Roslyi IM, Abramov SV, Pokrovsky VI. Enzymemia – an adaptive mech-anism of a marker of cytolysis? Vestnik Ross. Akad. Med. Nauk. 2002; 8: 3-8. (In Russ.).]
13. Рослый И. М., Водолажская М. Г. Правила чтения биохимического анализа. М., 2010: 93. [Roslyi IM, Vodolazhskaya MG. Rules of reading biochemical analysis. M., 2010: 93. (In Russ.).]
14. Татаринова О. В. Прогностическая значимость основных факторов риска сердечно-сосудистых заболеваний у насе-
The indices of SSBP in relation to the qualification of BP
Classification of BP
SBP, mm Hg
DBP,mm Hg
SSBP SSBP(0,542)
SSBP (0,615)harmonious
SSBP (0,667)
Hypotonia lower than 100/60n=75
94.06±2.30
61.75±1.70
0.657±0.01
(1.33%)n=1 - (50.67%)
n=38
Optimal BP100-119/60-79n=578
108.65±1.37
70.40±1.91
0.649±0.02
(14.19%)n=82 - (5.53%)
n=32
The norm 120-129/80-84n=401
123.562±.39
81.35±2.43
0.659±0.02
(1.74%)n=7 - (53.87%)
n=216
High normal BP130-139/85-89n=262
131.97±1.21
90.59±16.73
0.688±0.13
(262%)n=5
(35.87%)n=94
(8.6%)n=22
Moderate hypertension (1st degree AH)140-159/90-99n=378
145.611±.30
90.47±1.88
0.622±0.01
(2.91%)n=11 - (6.08%)
n=23
Hypertension of intermediate severity (2nd degree AH)160-179/100-109n=169
165.70±1.59
94.87±3.07
0.573±0.02
(16.57%)
n=28- (1.18%)
n=2
Severe hypertension (3rd degree hypertension)Higher than 180/ Higher than 110n=92
192.33±5.07
103.04±4.53
0.5370±.02
(64.13%)n=54
(1.08%)n=1
(3.26%)N=3
TOTAL=1955 193 (9.87%) 95 (4.85%) 336
(17.19)
Table 6
References

3’ 2019 45
ления Республики Саха (Якутия) пожилого, старческого возраста и долгожителей (по данным проспективного исследования): авто-реф. дисс. … док.мед. наук. СПб, 2014: 45. [Ta-tarinova OV. Prognostic significance of the main risk factors for cardiovascular diseases in the elderly, senile and long-living population of the Republic of Sakha (Yakutia) (according to a pro-spective study): abstract of a Candidate of Medi-cal Science thesis. SPb, 2014: 45. (In Russ.).]
15. Хадарцев А. А. Фрактальность природы и гармония в саногенезе. Клиническая медицина и фармакология. 2015; 3 (3): 2-10. [Hadartsev AA. Fractality of nature and harmony in sanogenesis. Clinical medicine and pharmacol-ogy. 2015; 3 (3): 2-10. (In Russ.).]
16. Халтаева Е. Д., Халтаев Н. Г. Ме-тодические вопросы определения избыточной
массы тела в популяционных исследованиях. Вопросы питания. 1983; 1: 22-27. [Khaltaeva E D, Khaltaev NG. Methodological issues of the definition of overweight in population studies. Вопросы питания. 1983; 1: 22-27. (In Russ.).]
17. Цветков В. Д. Ряды Фибоначчи и опти-мальная организация сердечной деятельности млекопитающих. Пущино: НЦБИ АН СССР. 1984: 19. [Tsvetkov VD. Fibonacci Series and optimal organization of cardiac activity of mam-mals. Pushchino: Scientific Centre of Biological Research, Academy of Sciences, USSR. 1984: 19. (In Russ.).]
18. Цветков В. Д. Сердце, "золотое сечение" и симметрия. Пущино: ПНЦ РАН. 1997: 170. [Tsvetkov VD. Heart, “golden ratio” and symme-try. Pushchino: Scientific Centre of the Russian Academy of Sciences. 1997: 170. (In Russ.).]
19. Электронный адрес статистических данных по заболеваемости в Республике РС(Я) https://www.gks.ru [Webpage link of statis-tical data on morbidity in the Republic of Sakha (Yakutia): https://www.gks.ru (In Russ.).]
20. Papaioannou TG., Gialafos E, Vavuranakis M, Vrachatis D, Soulis D, Siasos G., Kyrlagkitsis S, Stefanadis C, Tousoulis D. A novel geometrical analysis of the arterial pulse based on the golden ratio φ (phi): association with heart rate variability. Arch Balk Med Union, 2018: 179-188.
21. Yetkin G, Sivri N, Yalta K, Yetkin E. Golden Ratio is beating in our heart. International Journal of Cardiology. 2013: 4926-4927.
22. Yetkin E, Topbaş U, Yanik A, Yetkin G. Does systolic and diastolic blood pressure follow Golden Ratio? International Journal of Cardiolo-gy. 2014: 1457-1450.
The article presents the results of studies of the lactate level, physical performance and lipid peroxidation in highly skilled athletes in the Far North. We examined 85 men of Yakut nationality, including 60 highly qualified athletes (candidates for masters of sports (kmc) and masters of sports (ms)), aged 17 to 21 years old, the first group consisted of free-style wrestlers -30 people, the second - boxers 30 people.
The control group consisted of young students engaged in physical exercises at least twice a week. It was shown that the level of lactate de-pended on the level of physical performance of athletes and the accumulation of lipid peroxidation products. The highest values of lactic acid were noted at the recovery stage.
Keywords: lactate, lipid peroxidation, physical performance, athletes, Far North.
Introduction. The level of lactate (lactic acid) in the blood serum, and the intensity of free-radical processes in the body are one of the criteria characterizing the fitness of athletes and show their tol-erance to physical exertion [3, 4, 6]. With intense physical exertion, active forms of oxygen are formed leading to a signifi-
cant increase in lipid peroxidation (LPO), which has a negative effect on muscle activity [5]. In conditions of high energy production in anaerobic mode, lactate is a carrier of energy from those places in which it is impossible to transform en-ergy, due to increased acidity, to those places in which it can be transformed into energy (heart, respiratory muscles, slowly contracting muscle fibers, others muscle groups). Lactate plays a special role in maintaining the body's ability to perform strenuous physical work.
It has been established, that with in-tense physical exertion in the muscles a large amount of lactic acid is formed, which inhibits their contractility and caus-es muscle fatigue [3, 5]. The importance of individual metabolites of anaerobic gly-colysis, lactate (lactic acid), is currently being widely studied.
Material and research methods. A survey of 85 men of Yakut nationality was conducted, of which 60 athletes of high qualification (candidates for masters of sports (сms) and masters of sports (ms)), aged 17 to 21 years old. The first group consisted of free-style wrestlers -30 peo-ple, the second – boxers (30 people). The control group consisted of 25 young
students, of the same age, engaged in physical education at least twice a week. All examined according to the results of an in-depth medical examination were practically healthy.
The research material was heparin-ized blood and serum. Blood was taken - in the morning on an empty stomach from the cubital vein. The study was approved by the decision of the local Ethics Com-mittee at the Yakutsk Research Center for Complex Medical Problems.
The intensity of lipid peroxidation was determined by spectrophotometric meth-od [8]. The level of lactate in the blood serum was determined during ongoing examinations in a state of relative rest, on a semi-automatic analyzer "Screen Master" (Italy).
The overall physical performance of the PWC170 was determined using a Neurosoft bicycle ergometer (Ivanovo). The subjects performed two loads of moderate intensity with a pedaling fre-quency of 60 rpm on a bicycle ergometer, separated by a 3-minute rest interval. Each load lasted 5 minutes [2].
Statistical processing of the obtained data was carried out using the package of applied statistical programs STATIS-
E.D. Okhlopkova, L.I. Konstantinova, L.D. Olesova, E.I. Semenova, A.I. Yakovleva, G.E. MironovaSTUDY OF THE LACTATE LEVEL IN THE BLOOD SERUM OF ATHLETES TRAINING IN THE CONDITIONS OF THE FAR NORTHDOI 10.25789/YMJ.2019.67.13
Yakutsk, Republic Sakha (Yakutia), Russia: OKHLOPKOVA Elena Dmitrievna - Candi-date of Biological Sciences, Leading Special-ist, Yakut Science Centre of Complex Medical Problems, [email protected]. KON-STANTINOVA Lena Ivanovna – Researcher, Yakut Science Centre of Complex Medical Problems, [email protected]. OLESOVA Lyubov Dygynovna - Candidate of Biolog-ical Sciences, Leading Researcher, Yakut Science Centre of Complex Medical Prob-lems, [email protected]. SEMENOVA Evgenia Ivanovna - Candidate of Biological Sciences, Senior Researcher, Yakut Science Centre of Complex Medical Problems, [email protected]. YAKOVLEVA Alexandra Ivanovna – Re-searcher, Yakut Science Centre of Complex Medical Problems, e-mail: [email protected]. MIRONOVA Galina Egorovna - Doctor of Bio-logical sciences, Professor, Biological depart-ment of the Institute of Natural Sciences, M.K. Ammosov North eastern Federal University, [email protected].

ЯКУТСКИЙ МЕДИЦИНСКИЙ ЖУРНАЛ46
TICA 6.0. We used standard methods of variation statistics: calculation of average values, standard errors, 95% confidence interval. Statistical data processing was carried out by the non-parametric Kol-mogorov-Smirnov method. The probabil-ity of validity of the null hypothesis was taken at p <0.05.
Results and discussion. According to our data, the lactate content in both groups of martial arts athletes in the blood serum is at the upper limit of the norm and has no significant differences (p> 0.05). The highest values of lactic acid were noted at the recovery stage, in the first group of athletes higher in 1.47 and the second -1.40 times (p <0.01), respectively, compared with the control group (Fig. 1).
The increase in the level of lactate in both groups of athletes in the blood serum is due to the high rate of oxygen utilization and developing hypoxia in the working muscles. Since the high muscle demand for energy substrates in condi-tions of oxygen deficiency is satisfied due to anaerobic oxidation of glucose. The accumulation of lactate stimulates pro-teolysis and supplies glycogenic amino acids for the increasing energy needs of athletes. Fights of fighters, and fights of boxers are characterized by work of sub-maximal power. With submaximal power in the body, although to a lesser extent, anaerobic processes in the release of en-ergy prevail over aerobic ones. As a re-sult of intense glycolysis in the muscles, a large amount of lactic acid accumulates in the blood. According to published data, the level of lactate in the skin extract after exercise in untrained people rises 2 to 3 times compared with the results before exercise. For novice athletes, this indica-tor increased by 1.5-2 times. The quanti-tative content of lactate in the skin extract in professional athletes before and after physical activity remained unchanged [6]. It was also shown, that it saliva the lactate content increases by 2–3 times after prolonged training [6]. The results of the study revealed significant increas-es in the concentration of lactate in the blood of athletes in response to competi-tive loads (at p≤0.01). In this case, the maximum concentration of lactate after competitive fights for mas-wrestling was recorded in the region of 10-12 mmol / l, which corresponds to the level of anaero-bic (An1) physical activity [1].
In the athletes physical performance considered low at PWC170 870 ± 41 kgm, lower than average –1160 ± 31, average - 1305 ± 22 and good - 1614 ± 82 kgm.
Correlation analysis showed that there is a positive relationship between
the PWC170 value and the lactate level (p <0.01). It is known that the concen-tration of lactic acid (lactate) in venous blood is an indicator of anaerobic perfor-mance.
A low level of lactate was observed in martial arts athletes, with low working capacity, with an increase in the level of training and working capacity of athletes, the lactate content increased 1.1, 1.3 and 1.4 times (Fig. 2). In wrestlers with excellent physical performance after the maximum load was fulfill, the lactate con-tent was 1.1 times higher than in in the athletes with average and good physical performance, which is consistent with the literature data [7]. A comparative analysis of the level of lipid peroxidation products at rest, before the test load showed that athletes with low working capacity and with working capacity lower than the av-erage concentration of thiobarbiturate-active products (TBA - AP) (was 1.87 and 1.96 times higher (p < 0.01), compared with athletes with good performance. High aerobic performance among ath-letes with good working capacity is ex-plained by the fact that aerobic perfor-mance is most manifested under those loads where it is possible to fully satisfy the oxygen demand and where a steady level of oxygen consumption is main-tained for a long time.
Anaerobic performance, in which it is not possible to provide the working mus-cles with an adequate amount of oxygen, plays a decisive role in short-term high-intensity exercises.
Conclusion. Thus, a higher concentra-tion of lactate in ath-letes, compared with a group of people en-gaged in physical ed-ucation at least twice a week, indicates that during physical exertion, anaerobic glycolytic processes
are significantly accel-erated. A comparative analysis of the data we cited among athletes of the martial arts group showed that these processes are more intense in wrestlers. Possibilities of anaero-bic oxidation in athletes with medium and good performance are higher than in athletes with low performance and lower than average groups, as evidenced by higher rates of lactate. Despite
the higher level of lactic acid in the blood serum, the body of these athletes is char-acterized by greater resistance to work in conditions of oxygen deficiency, which indicates the fitness of their body.
1. Артахинова С.Р., Захарова Я.Ю., Захаров А.А. Изменения концентрации лактата в крови в результате соревновательных схваток по мас-рестлингу. Ученые записки университета им. П.Ф. Лесгафта. 2014;10 (116):19-21. [Ar-takhinova SR., Zakharova YYu, Zakharov AA. Changes in the blood lactate concentration as a result of mas-wrestling competitive fights. Uchenyye zapiski universiteta im. P.F. Lesgafta. 2014; 10 (116):19-21.(In Russ.)]
2. Белоцерковский З.Б. Эргометрические и кардиологические критерии физической работоспособности у спортсменов. М.: Советский спорт, 2005:312 [Belotserkovsky ZB. Ergometric and cardiological criteria for phys-ical performance in athletes. M.: Soviet Sport, 2005:312. (In Russ.)]
3. Михайлов С.С. Биохимия двигательной деятельности. М.: Спорт, 2016:296. [Mikhailov SS. Biochemistry of motor activity. 6th edition. M.: Sport, 2016:296. (In Russ.)]
4. Голец В.А., Евдокимов Е.И. Оценка информативности биохимических показателей в тренировочном процессе. Педагогика, психо-логия и медико-биологические проблемы фи-зического воспитания и спорта. 2007; 6:74-76. [Golets VA, Evdokimov EI. Assessment of infor-mativeness of biochemical parameters in the training process. Pedagogika, psikhologiya i me-diko-biologicheskiye problemy fizicheskogo vos-pitaniya i sporta. 2007; 6:74-76. (In Russ.)]
5. Корнякова В.В., Конвай В.Д., Муратов В.А. Процессы свободнорадикального окисления при утомлении, развившемся вследствие интенсивных физических наг-
Fig. 1. Note: * p <0.01 compared with the control group
Fig. 2. Serum lactate level (mmol / L) in athletes with different physical performance PWC
References

3’ 2019 47
рузок. Успехи современного естествознания.2015;9(2):308-311.[Kornyakova VV. Konvay VD, Muratov VA. The processes of free radical oxidation during fatigue, developed as a result of intense physical exertion. Uspekhi sovremen-nogo yestestvoznaniya. 2015; 9(2):308-311. (In Russ.)] URL:http://www.natural-sciences.ru/ru/article/view?id=35583
6. Саввин Г.А. Ушакова Е.В., Перфильев О.Н. Уровень лактата в кожном экстракте
как показатель физической тренированности спортсменов. Теория практика физической культуры.2000;1:1-3. [Savvin GA, Ushakova EV, Perfiliev O.N. The lactate level in the skin extract as an indicator of the physical fitness of athletes. Teoriya i praktika fizicheskoy kul'tury. 2000; 1:1-3. (In Russ.)]
7. Сивцева А.А., Филиппова Ю.В. Изменение уровня лактата в крови у спорт-сменов, занимающихся вольной борьбой.
Современные проблемы физической куль-туры, спорта и молодежи: материалы III рег-иональной научной конференции молодых ученых. Чурапча: ЧГИФКиС, 2017:363. [Sivtse-va AA, Filippova YuV. Changes in blood lactate levels in athletes involved in freestyle wrestling. Modern problems of physical education, sports and youth: proceedings of the III regional science conference of young scientists. Churapcha: Ch-GIFKiS, 2017:363. (In Russ.)]
The review presents examples of the translation of genomic studies into practical medicine of two common European hereditary diseases - auto-somal recessive cystic fibrosis and autosomal dominant Huntington’s chorea. With the development of genetic technologies in the Republic Sakha (Yakutia), translational medicine is becoming a reality, and it is necessary to outline the approaches and problems in this field of research using the examples of type 1 spinocerebellar ataxia and type 1A autosomal recessive deafness which are frequent in the republic.
Keywords: translational medicine, hereditary diseases, DNA diagnostics, patient.
S.K. Kononova, N.A. Barashkov, V.G. Pshennikova, O.G. Sidorova, T.K. Davydov, S.I. Sofronova, A.N Romanova., E.K Khusnutdinova., S.A. Fedorova DNA DIAGNOSTICS IN CLINICAL PRACTICE APPLIED TO TRANSLATIONAL MEDICINEDOI 10.25789/YMJ.2019.67.14
Introduction. So-called translational studies are becoming increasingly more developed as of lately. Translational medicine is a modern multidisciplinary science that will have a leading role in the development of genomic medicine. Translational medicine can be consid-ered as a process involving the transfer of discoveries made as a result of funda-mental research in biomedicine into med-ical practice in order to improve diagnosis and treatment [11, 38].
The National Institutes of Health (USA) proposed the following definition of translational medicine: “translational research includes two areas of transla-tion, the first of which is to bring the re-sults of discoveries made in laboratories and preclinical studies to the stage of clinical research and human studies; the second area of translation is associated with research aimed at increasing the efficiency of introducing advanced tech-nologies into wide medical practice”[22]. In accordance with this definition, trans-lational studies are part of a unidirection-al continuum in which research results move from the experimenter's laboratory table to the patient’s bed and to society as a whole [17].
In turn, translational genomic research can be included in translational medi-cine. Translational genomic research is centered around the development of ev-idence-based guidelines [32]. The whole process includes at least three phases. The first phase is fundamental genomic research carried out by qualified special-ists in specialized molecular genetic lab-
oratories at research centers or universi-ties. The second phase is the translation of the discoveries and achievements of genomic research and the development of approaches to the application of the results of genetic research in practical medicine, the assessment of their effec-tiveness and safety, as a rule, is done with the help of clinical trials conducted in specialized medical centers associ-ated with research institutions [36]. The third phase is the conclusive step for the implementation of translational genom-ic research into the healthcare system, and, very importantly, this process also includes the revision and development of legal and bioethical norms, taking the application of genomic technologies in practice into account. The final stage es-tablishes adequate recommendations for the optimal, safe and efficient use of new medical technologies in order to improve public health [12].
In this review, we aim to display ex-amples of the translation of genomic studies into practical medicine of two common European hereditary diseas-es - autosomal recessive cystic fibrosis (CF) and autosomal dominant Hunting-ton’s chorea (HC). With the develop-ment of genetic technologies in the Re-public of Sakha (Yakutia), translational medicine is becoming a reality, and it is necessary to outline the approaches and problems in this field of research using the examples of type 1 spinoc-erebellar ataxia (SCA1) and type 1A autosomal recessive deafness (DFN-B1A) which are frequent in the republic.
KONONOVA Sardana Kononova - senior researcher of the laboratory of molecular genetics, Yakut Science Centre of Complex Medical Problems, Yakutsk, Russian Feder-ation; [email protected]; BARASHKOV Nikolay Alekseevich -head of the laboratory of molecular genetics, Yakut Science Cen-tre of Complex Medical Problems, Yakutsk, Russian Federation; [email protected], PSHENNIKOVA Vera Gennadevna - re-searcher of the laboratory of molecular genet-ics, Yakut Science Centre of Complex Medi-cal Problems, Yakutsk, Russian Federation; [email protected], SIDOROVA Oksa-na Gavril’evna - researcher of the laboratory of hereditary pathology Yakut Science Centre of Complex Medical Problems, Yakutsk, Rus-sian Federation; [email protected], DAVYDO-VA Tatyana Kimovna - PhDs in Medicine, head of the laboratory of neurodegenerative diseases Yakut Science Centre of Complex Medical Problems, Yakutsk, Russian Federa-tion [email protected], SOFRON-OVA Sargylana Ivanovna, PhD, Chief Re-searcher of Yakut Science Centre of Complex Medical Problems, Yakutsk, Russian Federa-tion, [email protected], ROMANOVA Anna Nikolaevna, MD, the director of Yakut Sci-ence Centre of Complex Medical Problems, Yakutsk, Russian Federation, [email protected], KHUSNUTDINOVA Elsa Kamilevna - doctor of biological sciences, professor, academician of the Academy of Sciences of the Republic of Bashkortostan, Director of the Institute of biochemistry and genetics, Ufa Federal Re-search Center, Ufa, Russian Federation; [email protected], FEDOROVA Sardana Ark-adyevna - doctor of biological sciences, head of the laboratory of molecular biology, M.K. Ammosov North-Eastern Federal University, Yakutsk, Russian Federation; [email protected].

ЯКУТСКИЙ МЕДИЦИНСКИЙ ЖУРНАЛ48
Cystic fibrosis (CF). In European populations, cystic fibrosis occurs with a frequency of 1: 2500, while in Asian pop-ulations it is equal to 1: 90,000. If a fre-quent monogenic disease acquires social significance, a need for a number of mea-sures to prevent the hereditary disease from spreading appears. A spectrum of more than 1900 different mutations of the CFTR gene has been described in 25394 patients from 23 European countries [40]. A permanent European Cystic Fibrosis Society Patient Register (ECFSPR) has been created that collects, quantifies and compares data on CF patients living in Europe and neighboring countries who agree to be included in the registry. This is done in order to better understand CF, develop new European standards for care and treatment, conduct research and treatment (https://www.ecfs.eu/proj-ects) [45]. The CF gene is mapped on the long arm of chromosome 7 (7q31.1) in 1985. At the end of 1989, the CF gene itself was identified. The protein product of this gene was characterized, which was called the “Cystic Fibrosis Trans-membrane conductance Regulator” (CFTR) and the most frequent mutation was revealed — a deletion of phenylal-anine at the 508 position of the amino acid sequence of the protein (delF508), leading to the disease [28,29]. In addition to deletions, many other mutations have been detected in the CFTR gene. Unlike delF508, the vast majority of them are represented by sporadic cases, that is, they are quite rare. By the end of 2006, more than 1,500 point mutations, several deletions and duplications were identified in the CFTR gene.
The neonatal screening protocol for CF in the Russian Federation includes 4 stages: determination of immunore-active trypsin (IRT1), re-determination of immunoreactive trypsin (IRT), sweat test and DNA diagnostics, and only the first three stages are mandatory in the national protocol and are provided by the state. Therefore, DNA diagnostics in many cases are limited. The availability of DNA diagnostics is limited by the high cost and the small number of laborato-ries capable of conducting this analysis [9,14]. DNA testing of CF is carried out using diagnostic panels, for example, in the “RCMG” a panel is used that in-cludes the most frequent mutations in the world: F508del, CFTRdele2.3 (21kb), 3849 + 10kbC> T, W1282X, 2143delT, 2184insA, 1677delTA , N1303K, G542X, R334W, E92K, L138ins, 394delTT, 3821delT, S1196X, 2789 + 5G> A, G85E, 2183AA> G, 604insA, 621 + 1G> T, R117H, R347P, R553X, 3667in-
sTCA17, 557171TCA17, 55717TCA17, 55717TCA17, 55717TCA17, 55717 -1G> A, 2184delA. Thus, using a specially de-signed panel that includes 28 mutations, it is possible to detect only about 82.5% of the mutant alleles in the total sample of examined CF patients. Almost 20% of patients with CF need an additional ex-amination to detect rarer mutations or polymorphisms, including the ones which require the usage of the sequencing method, which is not yet routinely used in the Russian Federation [14].
Huntington’s chorea (HC) is a pro-gressive autosomal dominant neuro-muscular disease characterized by the development of choreic hyperkinesis and dementia. Symptoms of the disease are caused by atrophy of the putamen and the caudate nucleus in the brain of pa-tients, associated with premature selec-tive death of neurons. In most Russian populations, the prevalence of HC is 1 in 10,000. Significant differences are noted in relation to the age of onset and sever-ity of the disease. Moreover, even within individual families, pronounced clinical heterogeneity is observed. When HC is inherited on the paternal side, the effect of anticipation is sometimes manifested — an increase in the severity and a de-crease in the age of onset of the disease in a number of generations [6].
The IT15 gene, in which dynamic mu-tations lead to the development of HC, is expressed in many types of cells and encodes a protein with a molecular mass of 348 kDa, called huntingtin. In the IT15 coding region, at a distance of 18 codons downstream from the start of the trans-lation, a polymorphic trinucleotide repeat (CAG)n is localized. The number of CAG repeats in the IT15 gene normally varies from 9 to 37, while the mutant alleles of patients with HC carry 36 to 121 triplets. An inverse correlation was found be-tween the length of the CAG repeat and the age of onset of the disease and a di-rect correlation with the rate of progres-sion of clinical symptoms. The change in the length of the repeat during transmis-sion to the offspring explains the majority of cases of anticipation [25].
Mutant alleles in the range of 36–40 triplets are characterized by incomplete penetrance. A significant number of pa-tients with HC with a similar number of repetitions on the mutant allele have been described, and at the same time, clinical-ly healthy individuals older than 70 can be found in the same pedigrees. Alleles with a number of CAG repeats ≥ 40 are always associated with the development of the disease. The study of the state of CAG repeats by PCR in high-risk fami-
lies allows direct molecular diagnostics of the disease at any stage of ontogenesis, including the pre-symptomatic period [7]. At the same time, it is important to note that genetic counseling in families with HC (as in the case of other diseases with late manifestation) is fraught with ethical difficulties. Given the dominant type of in-heritance, the risk of obtaining a mutant gene for children and siblings of a patient with HC is 50%. Naturally, the exclusion of carriage, of course, should have a pos-itive impact on the mental state of people at risk. On the other hand, given the lack of effective methods of treatment for HC, the identification of an allele in a patient with expansion is almost the same as a death sentence. At present, it is cus-tomary to conduct a pre-symptomatic examination exclusively of adults from the risk group when they directly seek advice. A serious argument in favor of a pre-symptomatic examination of relatives of patients is the possibility of preventing the disease in high-risk families by con-ducting prenatal diagnosis. But if we are talking about prenatal DNA testing as a method of preventing hereditary diseas-es with late onset, which include HC, we cannot ignore the complex moral and eth-ical aspects that inevitably arise during prenatal medical and genetic counseling [18, 43].
Therefore, as shown by the practice of DNA diagnosis of HC in different coun-tries, a very small number of burdened families agree to prenatal diagnosis. For example, in Portugal, over 5 years of re-search, 158 families burdened with HC conducted 338 genetic tests, of which 234 were for diagnosis, 96 for pre-symp-tomatic and only 4 for prenatal DNA test-ing [34]. In Canada, 1061 pre-symptom-atic DNA tests of HC and 636 diagnostic tests were performed over 14 years, of which 15 burdened families agreed to prenatal testing [37]. In Greece, DNA testing of HC was performed in 461 peo-ple with clinical symptoms and 256 peo-ple for pre-symptomatic diagnosis. Muta-tion (allele extension) was confirmed in 278 individuals. Prenatal diagnosis was carried out in 6 cases [27]. The authors note that the main reasons for rejecting prenatal diagnosis are the hope of de-veloping treatment for HC and the re-luctance to terminate the pregnancy for psychological reasons [24].
Spinocerebellar ataxia of the 1st type belongs to the group of neurodegen-erative diseases with late manifestation. Inheritance is characterized by a high degree of penetrance, the phenomenon of anticipation. The mutation of the SCA1 gene located on the short arm of the 6th

3’ 2019 49
chromosome consists in an uncontrolled increase in the number of trinucleotide CAG repeats in the coding region of the gene. The clinical manifestations of the disease are very diverse, the main ones are: a slow progressive loss of coordina-tion of movements and speech, the pres-ence of the cerebellar-pyramidal syn-drome, various degrees of damage to the cerebellum and its pathways [8].
In the 1970s Pierre-Marie cerebellar ataxia was first differentiated from the clinical forms of Vilyui encephalomyeli-tis (VE), previously this disease was at-tributed to one of the forms of chronic VE [3]. A comprehensive study of hereditary cerebellar ataxia (HCA) in Yakutia was launched in 1992 during the implemen-tation of the scientific program “Biology of Vilyuisky Encephalomyelitis”. Molecular genetic studies of HCA were carried out as part of the scientific project “Identifi-cation of genes and genetic mechanisms that cause hereditary neurological dis-eases”, developed by the Department of Neurogenetics of the National Institute of Neurological Disorders and Stroke (NINDS / NIH) in the USA. In 1993, the research work of Dr. H. Orr et al. for the isolation of the Spinocerebellar ataxia type 1 (SCA1) gene was accomplished [23]. In 1994, the first work on the mo-lecular genetic study of HCA in the Yakut population was published. A. Lunkes et al. (1994) revealed an allelic association of highly informative markers D6S274 and D6S89 flanking the SCA1 locus on chromosome 6 with HCA disease. The association was absolute in the case of D6S274 microsatellite, while for D6S89 allelic substitution was recorded only in two families, which gave rise to the as-sumption of historical recombination and date of the spread of the disease in the Yakut population [19]. In 1996, the results of a joint project by Yakut and American researchers were published, in which hereditary cerebellar ataxia, common in Yakutia, was identified as Spinocerebel-lar ataxia type 1 (SCA1). In these studies, the Siberian site of disease accumulation is defined as the largest known in the world, prone to further increase [41].
The molecular genetic methods of DNA testing of SCA1 were introduced in 1999 in the medical practice of the medical and genetic consultation of the Republican Hospital No. 1 - the Nation-al Center of Medicine of the Ministry of Health of the Republic of Sakha (Yaku-tia) and acquired the status of routine clinical analyzes, despite the absence of relevant instructions and orders for DNA diagnostics of hereditary diseases in clin-ical diagnostic laboratories. For the first
time, DNA testing and prenatal DNA di-agnostics work algorithms and bioethical rules for medical and genetic counseling for patients from burdened families were developed [2,4].
Hereditary deafness. Studies have shown that about 50-60% of congenital hearing loss are hereditary. The most common of the hereditary forms is sen-sorineural hearing loss, which is caused by mutations in the GJB2 gene encoding the connexin 26 protein, currently there are more than 150 of them [21]. This form of hereditary hearing loss is detected in 1 out of 2,000 newborns, which is twice as often as cystic fibrosis and five times as often as phenylketonuria. Usually the parents of a deaf child have normal hear-ing, because they are heterozygous car-riers of the mutation [5].
Around the world, the spectrum of the main pathological mutations that cause hearing impairment is wide and diverse. So, in various ethnic groups: Europe-ans, Indians, Jews, Arabs, Bedouins, Pakistanis, etc., the mutation c.35delG was found, among Ashkenazi Jews, the mutation c.167delT is the most com-mon, in Asian populations - the mutation c.235delC [26,35]. Among Yakuts, the population frequency of c35delG is ex-tremely low (0.2%), which may indicate the non-specificity of this deletion for the Yakut population or be single cases of crossbreeding [1]. In the Yakut popula-tion, the main cause of congenital hear-ing loss is a mutation in the donor site of splicing of c.-23+1G>A gene GJB2 (Cx26) and, according to the international OMIM catalog (Online Mendelian Inher-itance in Men), is classified as an allelic variant of autosomal recessive deafness type 1A (ARD1A) [44].
According to N.A. Barashkov (2011), the prevalence of ARD1A is 16.2 per 100,000 of the Yakut population, and the frequency of heterozygous carriage of the mutation c.-23+1G>A varies from 3.8 to 11.7% among the indigenous popula-tion of Yakutia (Evens, Evenks, Dolgans, Yakuts). The results of the study of the GJB2 (Cx26) mutation gene splicing site indicate the existence of the world's larg-est “endemic focus” of c.-23+1G>A accu-mulation in Eastern Siberia [20].
The high frequency of deafness mu-tations c.35delG (22.3%) in patients of Caucasian origin in the Republic of Sakha (Yakutia) suggests the possibility of direct DNA diagnostics, differential and prenatal diagnosis, as well as screening of hereditary forms of deafness among wide groups of people, because approx-imately 50% of the inhabitants of Yakutia are Caucasians [31].
According to V.G. Pshennikova (2017), the proportion of pathogenic variants of the GJB2 gene was 51.10% of the num-ber of chromosomes studied in 393 un-related patients. Among them, the three most common (allelic frequency >1%) pathogenic variants were identified: c.-23+1G>A (42.3%), c.35delG (5.9%) and c.109G>A (1,9%). When distributing un-related patients by ethnicity: among the Yakut patients, the most frequent patho-genic variant is c.-23+1G>A (51.8%), the second most frequent is c.109G>A (2.4%), and the third is c.35delG (1.6%). Among Russian patients, c.35delG (22.3%) and c.-23+1G>A (5.3%) were most frequently encountered [13]. Giv-en the identified spectrum and frequen-cy features of pathogenic variants in the GJB2 gene in patients with hereditary hearing impairment in Yakutia, a rou-tine DNA diagnostic algorithm for auto-somal recessive deafness type 1A was developed. The algorithm is based on a sequential search for the most common variants of the GJB2 gene (c.-23+1G>A, c.35delG and c.109G>A), followed by resequencing of the protein-non-cod-ing (exon1) and protein-coding regions (exon 2) of the GJB2 gene, as well as the search for an extended deletion of c.del (GJB6-D13S1830), which allows to detect up to 99% of pathogenic variants responsible for ARD1A in Yakutia [15].
DNA testing of hearing impaired/deaf people involves many organizational and ethical issues. When communicating with deaf people, it must be borne in mind that they are members of a socially isolated community of the “world of the deaf” with their own language, culture and habits [39]. The number of assorted marriages among the deaf is growing, sometimes spouses may express a desire to have a deaf child, despite the unfairness of such a decision in relation to the child.
In any case, comparing themselves to hearing people, most deaf people consid-er themselves to be flawed and socially deprived [42]. The use of DNA testing to detect mutations responsible for the de-velopment of deafness can pose a risk of psychological stress and exacerbate the sense of inferiority in the individual. Therefore, it is necessary to create spe-cial conditions for genetic counseling and obtaining informed consent among the deaf [10].
Conclusion. It is impossible to over-estimate the importance of translational medicine for solving practical problems of healthcare, because such an approach has already led to the transfer of the role and place of a practical doctor to a differ-ent plane, where they operate with fun-
ЯКУТСКИЙ МЕДИЦИНСКИЙ ЖУРНАЛ50
damentally new technologies. Moreover, the ever-increasing distance between practical health care and the accumulat-ing information in the field of fundamental biomedicine dictates the need for direct professional contact between clinicians and research scientists. Moreover, this kind of contact is required to cover not only biological and medical sciences, but also a number of related disciplines that generate facts of strategic importance, which, in turn, need active transfer (trans-lation) to the field of medical practice, and, accordingly, to the real and effective care for a particular patient [16].
According to P. Lunt (2010), the com-mon features of the organization of clini-cal molecular genetic laboratories are:
• limited contingent for which the diagnosis is intended, these are mainly families burdened by a hereditary dis-ease and their relatives;
• mandatory patient follow-up with counseling and psychological assis-tance by a trained clinical geneticist;
• a small amount of conductible research; higher price of both the means invested in the laboratory and the cost of analyzes;
• the difficulty of interpreting the results of the study, the long duration of waiting for the results of the analysis;
• the existence of moral and ethi-cal aspects of genomic analyzes [33].
Molecular genetic studies of heredi-tary diseases in Yakutia open up great opportunities in the field of translational medicine, namely the introduction of the results of scientific research into medi-cal practice in the form of routine DNA diagnostics. On the other hand, modern personalized medicine using genomic technology requires the mandatory con-sideration of the bioethical, psychologi-cal and social aspects of translational medicine.
The study was supported by Ministry of Education and Science of Russian Federation #6.1766.2017 project M. K. Ammosov NEFU: "Genetic features of the population of Yakutia: the structure of the gene pool, adaptation to cold, psy-chogenetic characteristics, the preva-lence of some hereditary and infectious diseases» , FASO (BRK:0556-2017-0003) and RFBR (18-013-00738_A , 18-015-00212_A).
1. Барашков Н.А., Кононова С.К., Макси-мова Н.Р. и др. Анализ распространенности мутации 35delG гена GJB2 у пациентов с ней-росенсорной тугоухостью в Якутии. Наука и образование. 2006; 42: 129-33. [Barashkov N A, Kononova SK, Maksimova NR et al. Analysis of
the prevalence of 35delG mutation of the GJB2 gene in patients with sensorineural hearing loss in Yakutia. Nauka i obrazovanie. 2006; 42: 129-33 (in Russ.).]
2. Кононова C. К., Сидорова О.Г., Сухо-мясова А.Л. и др. Биоэтические проблемы пресимптоматической ДНК-диагностики спи-ноцеребеллярной атаксии 1-го типа в прак-тике медико-генетической консультации Яку-тии. Медицинская генетика. 2005;12:583-88. [Kononova CK, Sidorova OG, Sukhomjasova AL et al. Bioethical problems of presymptomatic DNA diagnosis of spinocerebellar ataxia of the 1st type in the practice of medical genetic consultation of Yakutia. Medicinskaja genetika. 2005; 12:583-88. (in Russ.)]
3. Зубри Г.Л., Гольдфарб Л.Г., Савинов А.П. и др. Дифференциальная диагностика вилюйского энцефаломиелита: Изучение на-следственной мозжечковой атаксии в Якутии. Актуальные Проблемы Вирусологии и Про-филактики Вирусных Заболеваний. М: АМН СССР.1972:201-210. [Zubri GL, Goldfarb LG, Savinov AP et al. Differential diagnosis of Vilyui encephalomyelitis: Study of hereditary cerebellar ataxia in Yakutia Aktualnyie Problemyi Viruso-logii i Profilaktiki Virusnyih Zabolevaniy. M: AMN SSSR. 1972:201-210 (in Russ.)]
4. Кононова C. К., Федорова С.А., Макси-мова Н.Р. Диагностика спиноцеребеллярной атаксии 1 типа в медико-генетической кон-сультации Национального Центра Медици-ны Республики Саха (Якутия) Тез.докл. 2-ой международной науч.-практ. конф. " Пробле-мы Вилюйского энцефаломиелита, нейроде-генеративных и наследственных заболеваний нервной системы; 2000:84-85. [Kononovа SK, Fedorova SA, Maksimova NR. Diagnosis of spi-nocerebellar ataxia type 1 in the medical genetic consultation of the National Center of Medicine of the Republic of Sakha (Yakutia) Tez.dokl. 2-oj mezhdunarodnoj nauch.-prakt. konf. " Proble-my` Vilyujskogo e`ncefalomielita, nejrodegener-ativny`x i nasledstvenny`x zabolevanij nervnoj sistemy`; 2000:84-85 (in Russ.)]
5. Маркова Т.Г. и др. Диагностика наслед-ственных нарушений слуха в сурдологии. Не-синдромальная тугоухость: учебное пособие, М: ФГБОУ ДПО РМАНПО,2018. [Markova T. G. et al. Diagnosis of hereditary hearing impair-ment in audiology. Nesindromal`naya tugouxost`: uchebnoe posobie, M: FGBOU DPO RMANPO, 2018 (in Russ.)]
6. Иллариошкин С.Н. Болезнь Гентингтона как модель для изучения нейродегенератив-ных заболеваний. Бюллетень национального общества по изучению болезни Паркинсона и расстройств движений. 2016;1:3-11. [Illariosh-kin SN. Huntington's disease as a model for the study of neurodegenerative diseases. Byulleten` nacional`nogo obshhestva po izucheniyu bolezni Parkinsona i rasstrojstv dvizhenij. 2016; 1:3-11. (In Russ.)]
7. Иллариошкин С.Н., Иванова-Смоленская И.А., Маркова Е.Д. Новый механизм мутации у человека: экспансия тринуклеотидных повто-ров. Генетика. 1995; 31: 1478–89. [Illarioshkin SN, Ivanova-Smolenskaya IA, Markova ED. New mechanism of human mutation: expansion of tri-nucleotide repeats. Genetika. 1995; 31: 1478–89. (in Russ.)].
8. Иванова-Смоленская И.А. Клинические и молекулярно-генетические аспекты из-учения наследственных заболеваний нерв-ной системы. Общие вопросы неврологии и психиатрии.1996;1:29-33. [Ivanova-Smo-lenskaya IA. Clinical and molecular genetic aspects of the study of hereditary diseases of the nervous system. Obschie voprosyi nev-
rologii i psihiatrii. 1996; 1:29-33 (In Russ.)].9. Кусова З. А., Каширская Н. Ю., Капра-
нов Н. И. Особенности массового скрининга новорожденных на муковисцидоз. Русский медицинский журнал (Человек и лекарство. Часть 1). 2010;18(5): 265–270. [Kusova ZA, Kashirskaya NYu, Kapranov NI. Features of mass screening of newborns for cystic fibrosis. Russkij medicinskij zhurnal (Chelovek i lekarstvo. Chast` 1). 2010;18(5): 265–270. (In Russ.)].
10. Кононова C. К., Барашков Н.А., Пшен-никова В.Г. и др. Некоторые биоэтические вопросы молекулярно - генетической диагно-стики аутосомно - рецессивной глухоты 1 а типа, распространенной в якутской популяции. Якутский медицинский журнал. 2018;2:79-82.[Kononova CK, Barashkov NA, Pshennikova VG et al. Some bioethical issues of molecular genetic diagnosis of autosomal recessive deafness type 1 a, common in the Yakut population. Yakutskij medicinskij zhurnal. 2018; 2:79-82. (In Russ.)].
11. Пальцев М.А. Молекулярная медици-на: достижения и перспективы. Молекулярная медицина. 2004;4:3-8. [Paltsev MA. Molecular medicine: achievements and prospects. Molekul-yarnaja medicina. 2004; 4:3-8. (In Russ.)].
12. Пальцев М.А., Белушкина Н.Н. Транс-ляционная медицина – новый этап развития молекулярной медицины. Молекулярная ме-дицина. 2012;4:3-6. [Paltsev M A, Belushkin NN. Translational medicine is a new stage in the development of molecular medicine. Molekulyar-naya medicina. 2012; 4:3-6. (In Russ.)].
13. Пшенникова В.Г. Мутации генов GJB2 (Cx26), GJB6 (Cx30) и GJB3 (Cx31) у паци-ентов с врожденными нарушениями слуха в Якутии. Автореф. дисс…канд.биол.наук.-Уфа: 2017 [Pshennikova VG. Gene Mutations of GJB2 (Cx26), GJB6 (Cx30) and GJB3 (Cx31) in pa-tients with congenital hearing impairment in Ya-kutia. Avtoref. diss..kand.biol.sciences. Ufa: 2017 (In Russ.)].
14. Баранов А.А., Капранов Н.И., Кашир-ская Н.Ю. и др. Проблемы диагностики муко-висцидоза и пути их решения в России. Педи-атрическая фармакология. 2014;11(6):16-23.[Baranov A A, Kapranov NI, Kashirskaya NU et al. Problems of diagnosis of cystic fibrosis and their solutions in Russia. Pediatricheskaya farma-kologiya.2014;.11(6):16-23. (In Russ.)].
15. Пшенникова В.Г. Разработка алгорит-ма молекулярно-генетической диагностики аутосомно-рецессивной глухоты 1А типа в Республике Саха (Якутия). VIII Всероссийская научно-практическая конференция с междуна-родным участием «Молекулярная диагностика 2014» Раздел 18. Медицинская генетика. 2014; 2:212-213. [Pshennikova VG. Development of the algorithm of molecular genetic diagnosis of auto-somal recessive deafness type 1A in the Republic of Sakha (Yakutia) VIII Vserossijskaya nauch-no-prakticheskaya konferenciya s mezhdunarod-ny`m uchastiem «Molekulyarnaya diagnostika 2014» Razdel 18. Medicinskaya genetika. 2014; 2: 212-213. (In Russ.)].
16. Сучков С. и др. Трансляционная меди-цина – миф или реальность? Ремедиум.2013; 5: 8-17. [Suchkov S et al. Translational medicine – myth or reality? Remedium.2013; 5: 8-17. (In Russ.)].
17. Шляхто Е.В. Трансляционные иссле-дования как модель развития современной медицинской науки. Трансляционная меди-цина. 2014;1:5-18. [Shlyakhto EV. Translational research as a model of development of modern medical science. Translyacionnaya medicina. 2014; 1:5-18. (In Russ.)].
18. Клюшников С.А., Иванова-Смоленская И.А. и др. Этические проблемы медико-гене-
References

3’ 2019 51
тического консультирования на примере хореи Гентингтона. Российский медицинский журнал. 2000; 2: 32–36. [Klyushnikov SA, Ivanova-Smo-lenskaya IA et al. Ethical problems of medical ge-netic counseling on the example of Huntington's chorea. Rossijskij medicinskij zhurnal. 2000; 2: 32–36. (In Russ.)].
19. Lunkes A, Goldfarb LG, Platonov FA et al. Autosomal dominant spinocerebellar ataxia (SCA) in a Siberian Founder Population: assign-ment to the SCA1 locus. Experimental neurolo-gy.1994; 126:310-312.
20. Barashkov NA, Djemileva LKh, Fedor-ova SA et al. Autosomal recessive deafness 1A (DFNB1A) in Yakut population isolate in Eastern Siberia: extensive accumulation of the splice site mutation IVS1+1G>A in GJB2 gene as a result of founder effect. Journal of Human Genetics. 2011;56(8):631-639. Doi:10.1038/jhg.2011.72
21. Ballana E et al Connexins and deafness Homepage. World wide web.-URL: http://www.crg.es/deafness.
22. Rubio DM, McGartland D, Schoenbaum E et al. Defining translational research: Implications for training. Academic Med. 2010; 85:470–475.
23. Orr HT, Chang M-Y, Banfi S et al. Expan-sion of an unstable trinukleotide CAG repeat in spinoserebellar ataxia type 1. Nature Gen-et.1993;4:.221-226.
24. Adam S, Wiggins S, Whyte P et al. Five year study of prenatal testing for Huntington dis-ease: demand, attitudes and psychological as-sessment. J Med Genet.1993; 30: 549–556.
25. Gusella JF, McDonald ME, Lee J-M. Ge-netic modifiers of Huntington’s disease. Mov. Dis-ord. 2014; 29: 1359–65.
26. Snoeckx RL, Huygen PL, Feldmann D et al. GJB2 mutation and degree of hearing loss: a mul-ticenter study Am.J.Hum.Genet.2005;77:945-57
27. Panas M et al. Huntington’s disease in Greece: the experience of 14 years. Clin Genet. - 2011; 80: 586–590.
28. Rommens JM, Karadima G, Vassos E et al. Identification of Cystic Fibrosis gene: Chromo-some walking and jumping. Science. 1989; 245: 1059-65.
29. Riordan J M, Rommens JM, Kerem B et al. Identification of the cystic fibrosis gene: Clon-ing and characterization of complementary DNA. Science. 1989; 245: 1066-73.
30. Kerem BS. Identification of the cystic fibro-sis gene: genetic analysis. Science. 1989; 245: 1073-80.
31. Barashkov N A et al. Introduction of muta-tion identification 35delG gene GJB2 in hereditary forms of hearing loss/deafness in the practice of medical-genetic counseling of the Republic of Sakha (Yakutia). Yakut medical journal. 2005; 3: 90-93.
32. Kumar D. Genes and genomes in health and disease: an introduction. Genomics and health in the developing world: Oxford mono-graphs on medical genetics, 2012.
33. Lunt P Diagnostic genetic laboratory ser-vices: models for the developing world. Genomics and health in the developing world: Oxford mono-graphs on medical genetics, 2012.
34. do Carmo Costa M, Magalhães P, Ferrei-rinha F et al. Molecular diagnosis of Huntington disease in Portugal: implications for genetic coun-selling and clinical practice. European Journal of Human Genetics. 2003; 11: 872–8.
35. Anichkina A, Kulenich T, Zinchenko S et al. On the origin and frequency of the 35delG allele in GJB2-linked deafness in Europe. Eur J.Hum.Genet.2001; 9:151
36. Petticrew M, Roberts H Evidence, hierar-chies, and typologies: horses for courses. J.Epi-demiol.Commun.Health.2003; 57:527-9.
37. Creighton S, Almqvist EW, MacGregor D et al. Predictive, prenatal and diagnostic genetic testing for Huntington’s disease: the experience in Canada from 1987 to 2000.Clin Genet. 2003; 63: 462–475.
38. Strasser B Perspectives: Molecular Medi-cine. Science.1999; 286(5444):1488-90.
39. Stebnicki JA, Coeling HV The culture of the deaf. J Transcult Nurs. 1999; 10(4):350-7.
40. De Boeck K The relative frequency of CFTR mutation classes in European patients with cystic fibrosis J.of Cystic Fibrosis.2010; 13(4):403-9.
41. Goldfarb LG, Vasconcelos O, Platonov FA et al. Unstable Triplet Repeat and Phenotypic Variability of Spinocerebellar Ataxia Type 1. Ann. Neurol. 1996; 39(4):500-6.
42. van Eldik T Mental health problems of Dutch youth with hearing loss as shown on the Youth Self Report. Am Ann Deaf.2005; 150(1):11–16.
43. Craufurd D, MacLeod R, Frontali M et al. Working Group on Genetic Counselling and Test-ing of the European Huntington’s Disease Net-work (EHDN). Diagnostic genetic testing for Hun-tington’s disease. Pract. Neurol. 2015; 15: 80–84.
44. Web site NCBI (OMIM, MedLine, PubMed): http://www.ncbi:nlm.nlh.gov
45. Web site https://www.ecfs.eu/projects
This research compares the behaviour components defining the attitude of the person to his health at comprehensive schools and university in Yakutsk. So, distinctions in value-required, cognitive, emotional and behavioural components have been found. Individual peculiarities, con-sciousness and attitude to health-saving behaviour have been revealed. Health-saving set and readiness for actions in this area are insufficiently generated in both groups. We should rely on youth high aspirations to self-assertion and self-development when we work with them in the field of health-saving consciousness and behavior.
Keywords: healthy lifestyle, health-saving behavior, teenage age, student's age, attitude to health, consciousness.
L.D. Starostina
COMPARATIVE ANALYSIS OF HEALTH-SAVING BEHAVIOUR OF STUDENTS OF COMPREHENSIVE SCHOOLS AND UNIVERSITY IN YAKUTSKDOI 10.25789/YMJ.2019.67.15
HEALTHY LIFESTYLE. PREVENTION
Introduction. Formation of health- saving behaviour is an important part of education. The researchers mark close interrelation between health, health-sav-ing behaviour and potential development
of the person. Many scientists have been studying the attitude to health, forma-tion factors of health-saving behaviour at the teenager age. For instance, R.A.Berezovskaya's researched the problem of the attitude to health and developed the questionnaire for assessment of health-saving behaviour [2]. Ya.V.Ush-akova devoted her works to self-saving behaviour, health control of the youth and its formation factors [8, 12, 13]. N.N.Avdeeva, I.I.Ashmarina, G.B.Ste-panova researched the human potential
of students and factors, promoting its realisation [1]. Youth health as object of social policy was considered by I.V.Zhu-ravleva, N.V.Lakomova [3]. G.Y. Коzina studied the youth attitude to healthy lifestyle factors [4, 6]. L.G.Rozenfild has described major risk factors of health disorders of students and Y.G.Mironova – self-saving behaviour of student's youth [7, 9]. Researches on the yielded subjects were made also among teenagers [5, 11].
Formation of health-saving behaviour and responsibility for your health should
STAROSTINA Lyubov Dmitrievna, candidate of psychological sciences, associate professor of psychology and social sciences department, Institute of psychology, North-Eastern federal university named after M.K.Ammosov, Ya-kutsk, Russia, +79241661252, e-mail:. [email protected] ORCID: 0000-0002-9609-9900

ЯКУТСКИЙ МЕДИЦИНСКИЙ ЖУРНАЛ52
be an integral part of educational process at schools and universities [14]. In modern life this period is frequently interfaced to untimely food intake, non-regular sleep, insufficient stay in the open air, low motor activity, absence of harden procedures, smoking, etc. Successful strategy reali-sation of youth healthy lifestyle values at the university is frequently circumscribed by insufficient material base, absence of health-saving technologies adapted for the region, methods of diagnostics, medi-cal-rehabilitation actions, and also the irre-sponsible attitude of the majority of youth to the health [10]. The objective situation assessment and search of key parts of the impact, considering different stag-es of formation of health-saving sets is necessary to overcome these obstacles.
Considering all this, the aim of our research is a comparative analysis of health-saving behaviour of students at comprehensive schools and university in Yakutsk, to define all possible ways of formation of healthy lifestyle sets.
Material and methods. Re-search was made among students of North-Eastern federal university named after M.K.Ammosov and pupils of com-prehensive schools of Yakutsk. The following methods were used to get psychological information: «Personal differential» (adapted version of scien-tific research institute by V.I.Bekhterev); R.L.Berezovskoy's questionnaire «Atti-tude to health [2]. 124 respondents have taken part in our research, 64 students at the age from 18 to 21 years old and 60 schoolchildren at the age of 14-15 years old. Both groups were compara-ble by girls and boys share (р=0,687).
The statistical analysis of the data has been executed in package IBM SPSS STATISTICS 22. Mann-Whitney U-test and Pearson’s test χ2 were used for groups comparison. Critical value of lev-el of the statistical importance of distinc-tions (p) was taken equal to 5 %.
Results and discussion. Let's con-sider the list of predominant require-ments for values system among school-children and students by scales “Attitude to health” R.A.Berezovskaya (Table). In the list of leading values, "Health" takes the first position among girls that can be explained by future motherhood sets whereas among boys "Health" is on the fourth position after social values (p <0,001). Comparing predominant re-quirements for values system of it is pos-sible to notice that at school age girls do not reflect yet about health (but among females -students the yielded value is on the first place that can be caused by their reproductive behaviour). Prevalence of
value «Family well-being» among girls-students (in comparison with school-girls), also confirms the assumption of their sets for the future home life. Aver-age values of "Career" among students and schoolgirls are identical, however at females-students, "Career" is only on the fifth position, unlike schoolgirls where this value occupies one of leading places. Ac-tualisation of the yielded value at school-girls can be probably explained by school exams period, and with the plans to con-tinue education.
Value "Health" among schoolboys is on the first place while at students it concedes values "Friends". It is possible to assume that in student's years, young men are more adhered to friends (fellow-students), they like to spend their free time together.
Thus, predominant requirements in the system of values are: at schoolboys – health, independence, career; at stu-dents – friends, health, happy family. Thus value «Recognition of people» at students takes higher places in hierarchy of values, than at schoolboys (p <0,001) that speaks about the importance of a so-cial recognition at student's age.
Both schoolboys and students bind success in life first of all to diligence, abili-ties, necessary communications, thus the important factor defining working capac-ity and persistence – "Health", does not undertake them in attention. At females (students and schoolchildren) the interre-lation of the personal qualities promoting vital successes, has similar allocation, ex-cept for scales "Health" and "Prosperity". Here as well as in the previous compari-son, value "Health" at schoolgirls takes lower places, than at students (p <0,001).
The analysis of the role of various in-formation resources in the field of health has shown that the most important ca-
nal of reception of the information about health for students are: doctors, further on decreasing: television and the Inter-net, friends and people, special literature, periodic printed editions. Thus, if girls-students prefer opinion of real doctors, schoolgirls prefer Internet resources. Schoolboys besides doctors trust the lit-erature, and students trust their friends’ advices.
According to students, the factors neg-atively influencing on health are: wrong lifestyle and nutrition, insufficient health care, bad ecology and medicine. Thus the most significant factor is "lifestyle", "food", “lack of health care”, “quality of health services” and "ecology". School-boys showed the following - "lifestyle", "ecology", “quality of medical services”, "food". Thus schoolgirls equally evolve the importance for health of "lifestyle" and "food", and schoolboys mark "ecol-ogy" and " lifestyle".
Refusal of bad habits, overweight control, sleep regime, physical exercises were considered to be significant ways of health maintenance among girls-stu-dents. The rating differed a little at stu-dents-boys, and has been presented in the following sequence: physical exercis-es, avoiding bad habits, sports, sleep re-gime. According to schoolgirls, the most important ways of health preservation are bad habits refusal, physical exercises, diet and healthy nutrition. Among boys — bad habits avoiding, regular physical ex-ercises, sleep and wakefulness regime, various sports sections. The analysis of the actions made by youth for health preservation has shown that students visit baths and saunas much more often, than schoolboys (p <0,001), and school-boys have preventive procedures more often and keep to a diet (p <0,001) (table).
Students have specified the causes
Predominant values and attitude to health
Schoolchildren Students Predominant requirements for system of values
1) health2) independence3) career
1) Friends2) health3) happy family
Block «What I do for health preservation»
Preventive procedures and diet Baths and saunas
Block «What prevents me from healthy lifestyle»
Other causes (are not specified) Financial possibilities, absence of conditions, shortage of time
Actions at deterioration of health state I go to polyclinicI do not pay attention I consult to my friends, relatives

3’ 2019 53
of insufficient healthcare: time lack, ab-sence of necessity, unprofitable, ab-sence of conditions, employment. Thus females-students, first of all, mark a lack of time and cost-based, then absence of will power, absence of necessity and conditions. Accordingly, male-students: absence of necessity and shortage of time, unprofitable, not to stint themselves in everything. The causes of insufficient health care s also are “absence of neces-sity” as they consider themselves healthy and do not wish to apply any efforts on health conservation, referring to employ-ment and “absence of time”.
At deterioration of physical state of health students consult to their friends and relatives more often, self-medicate, try not to pay attention to illness, and only in severe case they visit medical institu-tion. Schoolboys more often, than stu-dents go to doctors, or also do not pay attention to the state.
The information concerning features of individual peculiarities, conscious-ness and attitudes has been received by method “Personal differential” (scien-tific research institute by V.I. Bekhterev). Results of diagnostics have shown that 68% of students have high values by self-esteem scale to themselves as a person-ality, average values at 28%, that is, stu-dents take over themselves as positive, socially-desirable characters. 71% of students and 60% of schoolboys showed mean level of strong-willed ability. Thus 21% of schoolboys have low indexes on will power. Low values speak about insufficient self-control, inability to keep to the taken over line of behaviour, de-pendence on choronomic circumstances and assessments. Students have realis-tic enough representations about a role of strong-willed regulation in healthy life-style, than schoolboys.
We may assume that student's life period has more social activity than at school which is expressed in change of a social situation of development, social status and environment. Thus, extrovert indexes (activity, sociability, impulsive-ness) were higher at student's age, than in school. Level of aspiration by self-es-teem scale was higher at student's age. Discrepancy between indexes was more expressed by activity scale that testified that, both groups would like to be more awake and sociable «in ideal». This fact can specify in occurrence of problems in interaction with a social environment.
Conclusion. Thus, the analysis of health-saving behaviour of schoolchil-dren and students has shown the pres-ence of peculiarities determined by re-spondents’ age, gender, social situation
of development, self-assessment level. However it is possible to assert that for school and student's youth health is-sues are more "abstraction" rather than a necessary reality. Even if health is proclaimed as a part of students’ value (especially among girls), nevertheless, is poorly presented in individual conscious-ness. That is the concept "health" is not included into sphere of personal senses of the individual at this age. The com-parative analysis has allowed revealing existence of distinctions concerning stu-dents and schoolchildren to health on the following points: dominant requirements; actions for health preservation; causes preventing healthy lifestyle; actions at health deterioration.
Students and schoolchildren can’t ad-here to the taken over line of behaviour with healthy lifestyle, owing to insufficient development of self-control and depen-dence on circumstances and assess-ments. However students understand a role of strong-willed regulation for healthy lifestyle more. The student's period is marked by bigger social activity than at school which is expressed in change of a social situation of development, social status and environment. Level of aspi-ration by self-esteem scale also raises at student's age that speaks well for that the youth would like to be more awake and sociable «in ideal». All features set forth above specify in the big readiness of students to acceptance of values and observance of norms of healthy lifestyle, in comparison with schoolchildren, but health-saving and readiness for actions in this area are insufficiently generated in both groups. At work with youth in the field of formation consciousness and behaviour it is necessary to lean against high claims of youth to self-affirmation and require-ment for self-development. We should rely on youth high aspirations to self-as-sertion and self-development when we work with them in the field of health-sav-ing consciousness and behavior.
1. Ашмарин И.И. Человеческий потенциал студенчества в инновационном развитии России. М.: Московский гуманитарный университет. 2015. [Ashmarin II. Human po-tential of students in innovative development of Russia. Moscow: Moscow Humanities University. 2015 (In Russ.).]
2. Березовская Р.А. Отношение к здоровью. Здоровая личность. 2013;214–244. [Berezovskaya RA. Attitude to Health. Healthy personality. 2013; 214-244. (In Russ.).]
3. Журавлева И.В. Здоровье молодежи как объект социальной политики. Социальные аспекты здоровья населения. 2018;4. URL: http://www.vestnik.mednet.ru/content/view/999/30/lang.ru. DOI: 10.21045/2071-5021-
2018-62-4-8. [Zhuravleva IV. Youth Health as an object of social policy. Social aspects of public health. 2018; 4. URL: http://www.vestnik.mednet.ru/content/view/999/30/lang.ru. DOI: 10.21045/2071-5021-2018-62-4-8 (In Russ.).]
4. Козина Г.Ю. Отношение студенческой молодежи к факторам здорового образа жизни. Вестник международной академии наук. 2011;2:141-142. [Kozina GYu. Attitude of students to the factors of a healthy lifestyle. Bul-letin of the international Academy of Sciences. 2011; 2:141-142. (In Russ.).]
5. Журавлева И.В. Здоровье студентов: социологический анализ. Москва. 2014. [Jurav-leva IV. Health of students: a sociological analy-sis. Moscow. 2014. (In Russ.).]
6. Козина Г.Ю. Здоровье нации как основополагающий фактор экономического благополучия общества. Общество и здоровье: современное состояние и тенденции развития. Москва. 2013;620–631. [Kozina GYu. Health of the nation as a basic factor of economic well-be-ing of society. Society and health: current state and development trends. Moscow. 2013; 620-631. (In Russ.).]
7. Миронова Ю.Г. Особенности самосох-ранительного поведения современной сту-денческой молодежи. Теория и практика общественного развития. 2016;6. URL: http://teoria-practica.ru/vipusk-6-2016/. [Mironova YuG. Features of self-preservation behavior of modern students. Theory and practice of social develop-ment. 2016; 6. (In Russ.).]
8. Ушакова Я.В. Практика самосох-ранительного поведения студенческой моло-дежи: социологический анализ. Нижний Нов-город. 2010. [Ushakov YaV. The practice of self-preservation behavior of students: sociolog-ical analysis. Nizhny Novgorod. 2010. (In Russ.).]
9. Розенфельд Л.Г. Здоровье студентов по данным субъективной оценки и факторы риска, влияющие на него. Здравоохранение Российской Федерации. – 2008;4:38-39. [Ros-enfeld LG. Health of Students according to sub-jective assessment and risk factors affecting it. Health Care Of The Russian Federation. – 2008; 4:38-39. (In Russ.).]
10. Страхова И.Б. Здоровый образ жизни как способ интеграции в социум (на примере студентов с ослабленным здоровьем). Новосибирск, 2005. [Strakhova IB. Healthy life-style as a way of integration into society (on the example of students with poor health). Novosi-birsk. 2005. (In Russ.).]
11. Сурмач М.Ю. Качество жизни подростков Республики Беларусь: связь со здоровьем. Гродно. 2013. [Surmach MYu. Quality of the life of teenagers of the Republic of Belarus: con-nection with health. Grodno. 2013. (In Russ.).]
12. Ушакова Я.В. Человеческий капитал и самосохранительное поведение молодежи. Социальные преобразования и социальные проблемы. 2008;7:101-106. [Ushakova YaV. Human capital and self-preservation behavior of young people. Social transformation and social problems. 2008; 7:101-106. (In Russ.).]
13. Ушакова Я.В. Здоровье студентов и факторы его формирования. Вестник Нижегородского университета. 2007;4:197-202. [Ushakova YV. Health of students and fac-tors of its formation. Bulletin of Nizhny Novgorod University. 2007; 4:197-202. (In Russ.).]
14. Шувалова И.Н. Здоровьесохраняющее образование как система организационных и психолого-педагогических установок. Гума-нитарные науки. 2018;1(41):46-51. [Shuvalova IN. Health-Saving education as a system of or-ganizational, psychological and pedagogical atti-tudes. Humanities. 2018; 1(41): 46-51. (In Russ.).]
References

ЯКУТСКИЙ МЕДИЦИНСКИЙ ЖУРНАЛ54
The physical development assessing, reflecting the formation of morphological and functional properties of the organism is the most important part of the children health studying. One of the criteria for a child’s biological development is tooth maturity. Dental maturity as a criterion of bio-logical age is determined by the timing of the milk and permanent teeth eruption. At the same time, the overwhelming majority of hygienic work on the assessment of regional characteristics of children's physical development contains information on morphofunctional indicators: length and body weight, chest circumference, muscular strength of the hand, lung capacity, but very rarely provide information about "dental age". Analysis of the results of assessing the morphofunctional state of schoolchildren using the local standard is preferable for preventive medicine, including for developing priority health measures for this category of the population.
The objective of the investigation was to identify the characteristics of the permanent teeth eruption in the Volgograd schoolchildren, to com-pare the obtained data with the dynamics of anthropometric indicators (height, body weight), taking into account gender differences; to analyze the differences in the indicator “permanent teeth eruption” in different regions of the country (according to literary sources). The number and timing of the permanent teeth eruption in Volgograd schoolchildren from 7 to 17 years old were estimated. The differences in number and timing of the permanent teeth eruption in comparison with similar indicators in regions with other climate, socio-economic, ethnic and ecological peculiarities were identified. The relationship between the timing of the permanent teeth eruption and dynamics of somatometric parameters was established. The necessity of the permanent teeth eruption standards development and the usage of this indicator in assessing the physical development of schoolchildren are justified.
Conclusions: it is necessary to include standards for the permanent teeth eruption in regional standards for the physical development of chil-dren and adolescents. During preventive medical examinations of minors, it is necessary to indicate not only the sexual development formula of the child, but also the terms of the permanent teeth eruption. According to the teething indicators in different regions of the country, differing in climat-ic-geographical, socio-economic, ethnic and ecological characteristics, it is necessary to develop standards and further studying the characteristics of the eruption process for each region in Russia.
Keywords: physical development, dental maturity, permanent teeth eruption, somatometric indicators, morphofunctional status.
Introduction. The physical develop-ment assessing, reflecting the formation of morphological and functional proper-ties of the organism is the most import-ant part of the children health studying.
There are various methods and scientific approaches in assessing the physical development of children and adoles-cents [12].
The main method of studying the physical development of children and adolescents is a comprehensive as-sessment in hygienic practice, firstly approved by the Civil Code of the RF SEC in 1996. Modern techniques, rules for examining and assessing the phys-ical development of a child, as well as organized groups of children and ad-olescents of school age, is described in the manual for medical workers "As-sessment of the physical development of children and adolescents in educational organizations" ed. by V.R.Kuchma [8]. Comprehensive assessment supposes assessing the morphofunctional status of the child (the balance development) and the level of biological development. One of the criteria for a child’s biologi-cal development is tooth maturity. Dental maturity as a criterion of biological age is determined by the timing of the milk and permanent teeth eruption; biological age for school children can be determined by dental maturity before the age of 14 [1, 10]. During assessing the studied indica-tors from the point of their informational significance as criteria of biological age, a statistically strong direct connection of the level of biological development with
signs of puberty and the connection of the average degree - with the number of permanent teeth erupted, which charac-terizes them as leading informational cri-teria in school-age children [3, 9]. At the same time, the overwhelming majority of hygienic work on the assessment of re-gional characteristics of children's physi-cal development contains information on morphofunctional indicators: length and body weight, chest circumference, mus-cular strength of the hand, lung capacity, but very rarely provide information about "dental age" [1]. Generally, in assessing the indicators of a child’s biological de-velopment (development of secondary sexual characteristics, number of perma-nent teeth), the authors, as a rule, use all-Russian data.
The main question is to develop and use of regional standards for assessing the physical development of children and adolescents. According to many authors, the objective assessment of physical de-velopment is possible in the presence of "standards" in a particular region, charac-terized by a certain ethnic composition, climate, geographical and socio-eco-nomic conditions [4, 5, 12]. The use of other regions standards is undesirable due to differences in these indicators. Standards of physical development of children and adolescents require regular (at least 1 in 10-15 years) updates [4, 5].
N.I. Latyshevskaya, V.F. Mikhalchenko, T.L. Yatsyshena, L.A. Davydenko, E.L. ShestopalovaREGIONAL CHARACTERISTICS OF PERMANENT TEETH ERUPTIONIN VOLGOGRAD SCHOOLCHILDREN
LATYSHEVSKAYA Natalya Ivanovna - Doc-tor of Medicine, full Professor, the Head of the department for Hygiene and Ecology FGBOU "Volgograd State Medical University", Volgo-grad, 400131,Glazkova Avenue 1-16, Latysh-nata@ mail.ru 89377023030, MIKHALCHEN-KO Valery Fedorovich - Doctor of Medicine, full Professor, Professor of the Department for Therapeutic Dentistry FGBOU VO "Volgograd State Medical University", Volgograd, 400048, Zhukova Avenue 127-42, [email protected], 89023810014, YATSYSHENA Tatyana Leonidovna - candidate of medical scienc-es, associate professor of the department for Hygiene and Ecology FGBOU VO "Volgograd State Medical University", Volgograd,400107, Сhorosheva Avenue 48-1, [email protected], 89178338541, DAVYDENKO Lyudmi-la Aleksandrovna – Doctor of Medicine, full professor, Professor of the department for Hygiene and Ecology FGBOU VO "Volgo-grad State Medical University", Volgograd, 400131, Avenue of Heroes 5-6, [email protected] 89047704714, SHESTOPALOVA Ele-na Livovna - candidate of medical sciences, associate professor of the department for Hy-giene and Ecology FGBOU VO "Volgograd State Medical University", Volgograd, 400131, Avenue of Heroes 4- 54, [email protected], 89377353535
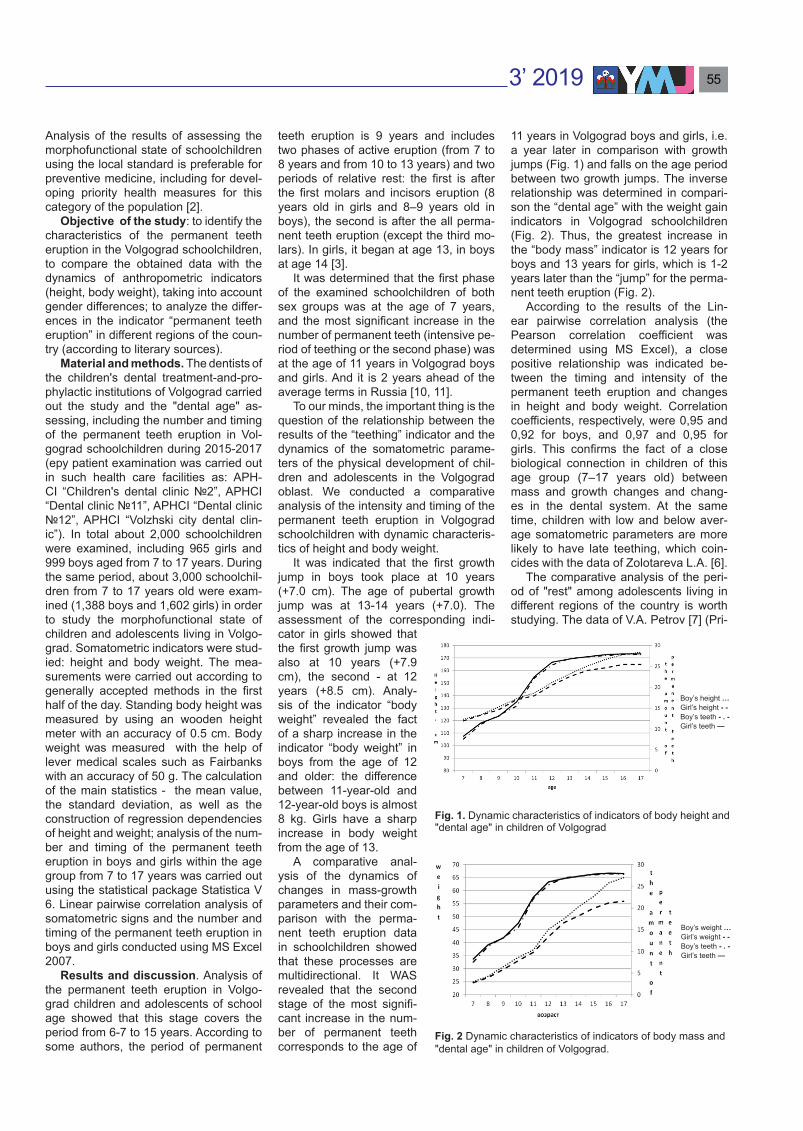
3’ 2019 55
Analysis of the results of assessing the morphofunctional state of schoolchildren using the local standard is preferable for preventive medicine, including for devel-oping priority health measures for this category of the population [2].
Objective of the study: to identify the characteristics of the permanent teeth eruption in the Volgograd schoolchildren, to compare the obtained data with the dynamics of anthropometric indicators (height, body weight), taking into account gender differences; to analyze the differ-ences in the indicator “permanent teeth eruption” in different regions of the coun-try (according to literary sources).
Material and methods. The dentists of the children's dental treatment-and-pro-phylactic institutions of Volgograd carried out the study and the "dental age" as-sessing, including the number and timing of the permanent teeth eruption in Vol-gograd schoolchildren during 2015-2017 (еру patient examination was carried out in such health care facilities as: APH-CI “Children's dental clinic №2”, APHCI “Dental clinic №11”, APHCI “Dental clinic №12”, APHCI “Volzhski city dental clin-ic”). In total about 2,000 schoolchildren were examined, including 965 girls and 999 boys aged from 7 to 17 years. During the same period, about 3,000 schoolchil-dren from 7 to 17 years old were exam-ined (1,388 boys and 1,602 girls) in order to study the morphofunctional state of children and adolescents living in Volgo-grad. Somatometric indicators were stud-ied: height and body weight. The mea-surements were carried out according to generally accepted methods in the first half of the day. Standing body height was measured by using an wooden height meter with an accuracy of 0.5 cm. Body weight was measured with the help of lever medical scales such as Fairbanks with an accuracy of 50 g. The calculation of the main statistics - the mean value, the standard deviation, as well as the construction of regression dependencies of height and weight; analysis of the num-ber and timing of the permanent teeth eruption in boys and girls within the age group from 7 to 17 years was carried out using the statistical package Statistica V 6. Linear pairwise correlation analysis of somatometric signs and the number and timing of the permanent teeth eruption in boys and girls conducted using MS Excel 2007.
Results and discussion. Analysis of the permanent teeth eruption in Volgo-grad children and adolescents of school age showed that this stage covers the period from 6-7 to 15 years. According to some authors, the period of permanent
teeth eruption is 9 years and includes two phases of active eruption (from 7 to 8 years and from 10 to 13 years) and two periods of relative rest: the first is after the first molars and incisors eruption (8 years old in girls and 8–9 years old in boys), the second is after the all perma-nent teeth eruption (except the third mo-lars). In girls, it began at age 13, in boys at age 14 [3].
It was determined that the first phase of the examined schoolchildren of both sex groups was at the age of 7 years, and the most significant increase in the number of permanent teeth (intensive pe-riod of teething or the second phase) was at the age of 11 years in Volgograd boys and girls. And it is 2 years ahead of the average terms in Russia [10, 11].
To our minds, the important thing is the question of the relationship between the results of the “teething” indicator and the dynamics of the somatometric parame-ters of the physical development of chil-dren and adolescents in the Volgograd oblast. We conducted a comparative analysis of the intensity and timing of the permanent teeth eruption in Volgograd schoolchildren with dynamic characteris-tics of height and body weight.
It was indicated that the first growth jump in boys took place at 10 years (+7.0 cm). The age of pubertal growth jump was at 13-14 years (+7.0). The assessment of the corresponding indi-cator in girls showed that the first growth jump was also at 10 years (+7.9 cm), the second - at 12 years (+8.5 cm). Analy-sis of the indicator “body weight” revealed the fact of a sharp increase in the indicator “body weight” in boys from the age of 12 and older: the difference between 11-year-old and 12-year-old boys is almost 8 kg. Girls have a sharp increase in body weight from the age of 13.
A comparative anal-ysis of the dynamics of changes in mass-growth parameters and their com-parison with the perma-nent teeth eruption data in schoolchildren showed that these processes are multidirectional. It WAS revealed that the second stage of the most signifi-cant increase in the num-ber of permanent teeth corresponds to the age of
11 years in Volgograd boys and girls, i.e. a year later in comparison with growth jumps (Fig. 1) and falls on the age period between two growth jumps. The inverse relationship was determined in compari-son the “dental age” with the weight gain indicators in Volgograd schoolchildren (Fig. 2). Thus, the greatest increase in the “body mass” indicator is 12 years for boys and 13 years for girls, which is 1-2 years later than the “jump” for the perma-nent teeth eruption (Fig. 2).
According to the results of the Lin-ear pairwise correlation analysis (the Pearson correlation coefficient was determined using MS Excel), a close positive relationship was indicated be-tween the timing and intensity of the permanent teeth eruption and changes in height and body weight. Correlation coefficients, respectively, were 0,95 and 0,92 for boys, and 0,97 and 0,95 for girls. This confirms the fact of a close biological connection in children of this age group (7–17 years old) between mass and growth changes and chang-es in the dental system. At the same time, children with low and below aver-age somatometric parameters are more likely to have late teething, which coin-cides with the data of Zolotareva L.А. [6].
The comparative analysis of the peri-od of "rest" among adolescents living in different regions of the country is worth studying. The data of V.A. Petrov [7] (Pri-
Fig. 1. Dynamic characteristics of indicators of body height and "dental age" in children of Volgograd
Fig. 2 Dynamic characteristics of indicators of body mass and "dental age" in children of Volgograd.
Boy’s weight …Girl’s weight - -Boy’s teeth - . -Girl’s teeth —
Boy’s height …Girl’s height - -Boy’s teeth - . -Girl’s teeth —

ЯКУТСКИЙ МЕДИЦИНСКИЙ ЖУРНАЛ56
morsky Krai) and S.Yu. Kasyugi et al. [7] (Nizhny Novgorod ) indicate the onset of the second period of “rest” in girls from the age of 13, in boys - from the age of 14. According to our data, the second “rest period” in Volgograd boys and girls be-gins at the age of 12 (the least statistical-ly significant increase). It was also found that in the Volgograd oblast, the period of the most intense dentition occurs in boys and girls at 11 years old (in Primorsky Krai, it begins at 10 years in both boys and girls, in the Nizhny Novgorod oblast: in boys at 11 12 years old, in girls 10-11 years old). It is possible that the revealed differences are due to climate, nutritional, ethnic, and ecological peculiarities of liv-ing, which requires further scientific study and confirmation [6].
Conclusions:1. It is necessary to include standards
for the permanent teeth eruption in re-gional standards for the physical devel-opment of children and adolescents. During preventive medical examinations of minors, it is necessary to indicate not only the sexual development formula of the child, but also the terms of the perma-nent teeth eruption.
2. According to the teething indicators in different regions of the country, differ-ing in climatic-geographical, socio-eco-nomic, ethnic and ecological characteris-tics, it is necessary to develop standards and further studying the characteristics
of the eruption process for each region in Russia.
1. Харитонов В.М., Ожигова А.П., Година Е.З. Антропология: учеб. для студ. высш. учеб. заведений / М.: Гуманит. изд. центр ВЛАДОС. 2004; 272. [Haritonov VM, Ozhigova AP, Godina EZ. Anthropology: textbook for higher institutions stud. M.: Gumanit. izd. centr VLADOS. 2004; 272. ( In Russ.).]
2. Богомолова Е.С. Гигиеническое обосно-вание мониторинга роста и развития школь-ников в системе «здоровье-среда обитания »: автореф. дис. … докт.мед.наук, Нижний Новго-род.2010; 23. [Bogomolova ES. Hygienic justifi-cation for monitoring the growth and development of schoolchildren in the "health-environment": avtoref. dis. … dokt.med.nauk. Nizhnij Novgorod. 2010; 23. ( In Russ.).]
3. Волкова С.И., Гретченко Я.В. Особенно-
сти формирования зубной системы у детей и подростков г. Сергача Нижегородской области как один из показателей их биологического со-зревания. Молодой ученый. 2016; 3: 359-361. [Volkova SI. Gretchenko YaV. Features of the for-mation of the dental system in children and ado-lescents of the city of Sergach, Nizhny Novgorod region as one of the indicators of their biological maturation. Molodoj uchenyj. 2016; 3: 359-361( In Russ.).]
4. Гаврюшин М.Ю., Березин И.И., Сазоно-ва О.В. Антропометрические особенности фи-зического развития школьников современного мегаполиса. Казанский медицинский журнал. 2016; 4: 629-633. DOI 10.17750/ КMol 2015-629. [Gavryushin MYu, Berezin II, Sazonova OV. Anthropometric features of the physical develop-ment of schoolchildren in a modern metropolis. Kazanskij medicinskij zhurnal. 2016; 4: 629-633. ( In Russ.). ]
5. Година Е.З. Секулярный тренд и регио-нальные особенности его протекания: зачем нужны локальные стандарты. Актуальные проблемы здоровья детей и подростков и пути их решения: материалы 3-го Всероссийского конгресса с межд. участием по школьной и университетской медицине. М. 2012; 42. [Go-dina E.Z. Secular trend and regional features of its course: why do we need local standards. Ac-tual problems of the health of children and ado-lescents and ways to solve them: materials of the 3rd All-Russian Congress with int. participation in school and university medicine. M., 2012: 42. ( In Russ.).]
6. Золотарева Л.А. Влияние регионально-этнических факторов на сроки прорезывания постоянных зубов у детей Удмуртии: дис. … канд.мед.наук. Москва. 2004; 126. [Zolotare-va LA. The influence of regional and ethnic fac-tors on the timing of teething of permanent teeth in children of Udmurtia: dis. … kand.med.nauk. Moskva, 2004; 126. ( In Russ.). ]
7. Косюга С.Ю., Богомолова Е.С., Киселе-ва О.С. и др. Стоматологические критерии оценки биологического возраста детей и под-ростков. Стоматология. 2013; 92(6): 56-58. [Kosyuga SYu, Bogomolova ES, Kiseleva OS. Dental criteria for assessing the biological age of children and adolescents. Stomatologiya. 2013; 92(6): 56-58. ( In Russ.).]
8. Кучма В.Р., Скоблина Н.А., Бокарева и др. Оценка физического развития детей и подростков в образовательных организаци-ях. М. Научный центр здоровья детей РАМН, 2014; 38. [Kuchma VR, Skoblina NA, Bokareva NA i dr. Assessment of the physical development of children and adolescents in educational institu-tions. V.R. Kuchma, - M.: Izd-vo. Nauchnyj centr zdorov'ya detej RAMN. 2014; 38. ( In Russ.).]
9. Петров В.А. Методы определения и оценки состояния здоровья и физического развития детей и подростков: учебное посо-бие. Владивосток. Медицина ДВ. 2014; 168.[Petrov VA. Methods for determining and assess-ing the state of health and physical development of children and adolescents: a training manual. Vladivostok. Medicina DV. 2014; 168. ( In Russ.).]
10. Пивоваров Ю.П., Королик В.В. Руковод-ство к лабораторным занятиям по гигиене и ос-новам экологии человека. М. Академия. 2006; 512. [Pivovarov YuP, Korolik VV. Guide to labora-tory classes on hygiene and the basics of human ecology. M. Akademiya. 2006; 512. ( In Russ.).]
11. Полосухина Е.И. Индивидуально-типо-логическая изменчивость прорезывания по-стоянных зубов в связи с цефало и соматоти-пами: клинико-анатомическое исследование: автореф. дис. … канд.мед.наук. Волгоград. 2007; 22. [Polosuhina EI. Individual-typological variability of teething of permanent teeth in con-nection with cephalo and somatotypes: clinical anatomical study: author. dis. ... Candidate of Medical Science. Volgograd. 2007; 22 .]
12. Баранов А.А., Кучма В.Р., Скоблина Н.А. Физическое развитие детей и подростков на рубеже тысячелетий. М. Научный центр здо-ровья детей РАМН. 2008; 216. [Baranov AA, Kuchma VR, Skoblina NA. The physical devel-opment of children and adolescents at the turn of the millennium. M. Nauchnyj centr zdorov'ya detej RAMN. 2008; 216. (In Russ.).]
Comparative data on the number of permanent teeth in different regions (M±δ)
AgeNizhny Novgorod Primorsky Krai Volgograd oblastboys girls boys girls boys girls
6 - - - - 2.62±2.19 3.06±2.297 7.7±2.6 8.5±2.6 7±3 9±3 7.53±2.94 8.21±3.228 10.6±1.8 11.4±2.4 12±2 12±3 11.12±2.09 11.48±1.989 12.9±2.6 13.8±3.1 14±2 15±3 13.24±2.54 13.07±2.22
10 14.6±3.9 16.8±4.4 18±3 19±3 15.49±3.19 16.47±4.3911 18.8±5.2 20.0±4.7 20±4 21±3 22.15±4.29 22.48±4.0812 23.5±4.1 24.5±3.8 24±3 25±2 25.29±3.11 25.97±2.3613 25.6±3.2 26.7±2.0 27±1 28 26.90±1.65 26.78±1.6414 27.3±1.4 27.5±1.2 28 28 27.29±1.69 27.35±1.2515 27.6±0.8 27.7±0.9 28 28 27.62±1.15 27.83±0.6316 - ± 28 28 27.84±0.72 28±0.0017 - ± 28 28 27.82±1.16 27.97±0.30
References

3’ 2019 57
This article is devoted to the actual problem of recurrent aphthous stomatitis in children. The authors studied the features of the course of recur-rent aphthous stomatitis in children and the effectiveness of the use of Imudon in the treatment of this disease.
We surveyed 100 children with recurrent aphthous stomatitis, within a year at the age of 7 to 12 years on the basis of the Consultative Clinic RH №1- National center of medicine (Yakutsk). All children were examined by a pediatrician and profile specialists: an endocrinologist, a hematologist, an otolaryngologist, and a dentist. General blood and urine tests, biochemical studies (CRP, ASLO), blood sugar levels, a study of the level of im-munocompetent cells in peripheral blood and the level of immunoglobulins A, M, G were examined in all children. Then a group of 50 children with recurrent stomatitis was identified, all of them except of local therapy (cauterization of ulcers by the stomatofit) received treatment with Imudon (the group under study). A group of children (50 people) received only local treatment (the control group). All children showed a decrease in immunity, changes in the general blood test. In the treatment of recurrent stomatitis, in addition to local treatment, treatment with Imudon is recommended, which leads to a reduction in clinical symptoms, normalization of immune status indicators and a general blood test.
Keywords: stomatitis, aphthae, children, immunity, ulcers, therapy, Imudon.Stomatitis is a disease of the oral mucosa. Pathogens are more often streptococci. Stomatitis is most often caused by a failure of the immune
system or a number of diseases of various organs (diabetes mellitus, kidney disease, blood deficiency disease, vitamin deficiency).
In children, aphthous form of stomati-tis is more common. Aphthae appear as small white or yellowish plaques of var-ious sizes, surrounded by a red rim, on the mucous membrane of the cheeks, gums, lips or tongue. Characterize by a sharp pain when eating and symptoms of intoxication. Their outcome is often favorable, after 6-8 days the process subsides, aphthae heal, erosion epithe-lialized. Sometimes stomatitis becomes chronic and tends to recur.
As a result of treatment with antiseptic agents of the oral cavity, aphthae heal, but new ones appear. The process can last for years, affecting the patient's qual-ity of life; children try to eat liquid food in order not to injure the oral mucosa. In the process of the disease, children lose weight, are stunted in growth and psy-chomotor development [1,2].
Objective: To study the peculiarities of the course of recurrent aphthous stomatitis in children and the effectiveness of the use of Imudon in the treatment of this disease.
Materials and methods. We sur-veyed 100 children with recurrent aph-thous stomatitis for a year, aged from 7 to 12 years based on the Consultative Clinic RH №1- National center of medicine. All children were examined by a pediatrician and profile specialists: an endocrinolo-gist, a hematologist, an otolaryngologist, and a dentist. General blood and urine tests, biochemical studies (CRP, ASLO), blood sugar levels, a study of the level
of immunocompetent cells in peripheral blood and the level of immunoglobulins A, M, G were examined in all children. Then a group of 50 children with recurrent sto-matitis was identified, all of them except of local therapy (cauterization of ulcers by the stomatofit) received treatment with Imudon (the group under study). A group of children (50 people) received only lo-cal treatment (the control group).
All the data obtained were subjected to thorough statistical processing: the numerical data were calculated as the arithmetic mean and standard error of the mean M ± m; differences were con-sidered significant at p <0.05. Compari-sons of mean values were performed by single-factor analysis of variance using Student's t-test to assess the equality of the averages of the Fisher's F-test to assess the equality of the variance. The relationship between the parameters was estimated using linear and rank correla-tion coefficients.
Results. A survey of 100 children with recurrent stomatitis by specialists revealed
that 15 (15%) people had iron deficiency anemia, 70 (70%) children had chronic tonsillitis, 50 (50%) children had caries.
Then we decided to study the main symptoms in children with recurrent sto-matitis: 90 children (90%) had a burning sensation and soreness of the oral muco-sa when eating, 65 children (65%) had a weight loss of 1 to 3 kg during the year, 30 % growth retardation, 60 (60%) decrease in appetite, 90% weakness, fatigue.
All patients with recurrent stomatitis had a general blood count.
According to the results of a general blood test in patients with stomatitis, the level of erythrocytes, platelets, hemoglo-bin and erythrocytes is reduced (Figure 1).
All patients with recurrent stomatitis were examined for their immune status. The following results were obtained: a decrease in the content of CD4 + lym-phocytes, that is, activated T-cells, a decrease in the number of natural killer cells (CD16 +), T-helper cells (CD4 +), cytotoxic T-lymphocytes (CD8 +), and an increase in IgM (Table 1).
O.N. IVANOVARECURRENT STOMATITIS IN CHILDRENDOI 10.25789/YMJ.2019.67.17
IVANOVA Olga Nikolaevna, MD, Professor, Department of Pediatrics and Pediatric Surgery, Medical Institute of the Federal State Autonomous Educational Institution of Higher Educational Institution "Northeast Federal University named after MK Ammosov". Mailing address: 677018, Yakutsk, ul. Krupskaya 37, apt. 107; to / tel. 8 (4112) 39-56-09; e-mail: [email protected].
Indicators of the immune status in children of RS (Ya) in children with recurrent stomatitis and healthy children, M±m
Indicator Children with recurrent stomatitis (n = 100) Health children(n = 2000)
СD3+ 18.1 ± 1.03* 27.2±1.04СD4+ 16.2 ± 0.5* 28.3±0.6СD8+ 15.9 ± 0.8* 24.1±2.5СD16+ 10.1 ± 1.2* 22.0±1.01IRI 0.7 ± 0.6 1.08±0.02IgA 1.1 ± 0.1* 2.9±0.6IgG 18.2 ± 0.7 17.1±0.09IgM 1.0 ± 0.08* 2.2±0.09СD25+ 13.9 ± 1.2* 24.6±0.7CIK 186.2 ± 1.5<0.05* 70±0.07
Note. In the Tables 1-2 *p < 0.05 between standards and indicators in each group
Table 1

ЯКУТСКИЙ МЕДИЦИНСКИЙ ЖУРНАЛ58
Standards of immune status indica-tors were developed by the team of the Immunology Laboratory of the Medical Institute in 2018 based on a survey of 2,000 healthy children aged 5 to 10 years (Table 1).
Treatment of recurrent stomatitis was carried out jointly with the dentist. With-in 1 month, 50 children of the examined group with recurrent stomatitis received the drug Imudon 1 tablet 3 times a day. Patients from the control group of 50 chil-dren received only antiseptic treatment with stomatofit, cauterization of aphthae.
During the therapy and after the treat-ment, the aphthasis did not appear in the
examined group in chil-dren during the month, the symptoms of the children in the control group remained the same.
Thus, as a result of the treatment carried out in the examined group of children (lo-cal antiseptic treatment and imudon), there was a positive dynamics of clinical manifestations in comparison with children of the
control group who received only local an-tiseptic treatment.
In the examined group of children, there was a positive trend in the indica-tors of the general blood test (Figure 2).
All children were examined for im-mune status in the control and survey groups. It was revealed that the immune indices improved in the group of children with recurrent stomatitis after therapy (lo-cal treatment and imudon): an increase in cellular and humoral immunity: the level of normal killer CD16 + and the level of IgA, IgM (Table 2). These changes are significantly higher than the immune sta-
tus in children of the control group who received only topical antiseptic treatment of stomatitis.
Thus, there is a positive dynamics of indicators of immune status, clinical man-ifestations of recurrent stomatitis of chil-dren of the examined group as a result of the treatment.
Conclusion. In the treatment of recur-rent stomatitis, in addition to local anti-septic treatment, treatment with Imudon is recommended, which leads to a reduc-tion in clinical symptoms, normalization of immune status indicators and a gen-eral blood test.
1. Крючко Т.О., Бабанина С.М., Карпенко О.О. и [и др]. Пути оптимизации эффектив-ности лечения пациентов с рецидивирующим герпетическим стоматитом. Современная пе-диатрия. 2012; 1 (41):150-154. [Kryuchko TO, Babanina SM, Karpenko OO, Babanina MY, Pili-penko OA. Ways to optimize the effectiveness of treatment of patients with recurrent herpetic stomatitis. Sovremennaya pediatriya. 2012; 1 (41):150-154. (In Rus.)]
2. Спиридонова С.А., Толмачева С.М., Лу-киных Л.М. Комплексная терапия хроническо-го рецидивирующего стоматита. Современные технологии в медицине. 2013; 1 (5): 118-121. [Spiridonova SA, Tolmacheva SM, Lukinykh LM. Combined therapy of chronic recurrent stomatitis. Sovremennye tekhnologii v medicine. 2013; 1 (5): 118-121.
Fig. 1. General blood count in patients with recurrent stomatitis compared with normal values
Fig. 2. Dynamics of changes in the general blood count in children with recurrent stomatitis of the examined and control groups after the treatment
Indicators of the immune status in children with recurrent stomatitis of the examined and control groups after therapy, M±m
Indicator Children of the examined group after therapy (n = 50)
Children of the control group (n = 50)
СD3+ 27.1 ± 1.1 22.1 ± 1.03СD4+ 21.6 ± 0.9 18.9 ± 0.5СD8+ 18.2 ± 0.2 16.9 ± 0.8СD16+ 20.3 ± 1.0 13.1 ± 1.2*IRI 1.9 ± 0.1 0.7 ± 0.6IgA 2.6 ± 0.1 1.8 ± 0.1*IgG 18.9 ± 0.2 18.2 ± 0.7IgM 2.4 ± 0.2 1.2 ± 0.08*СD25+ 20.1 ± 1.2 13.9 ± 1.2CIK 172.1 ± 1.0 186.2 ± 1.5<0.05
Table 2
References
3’ 2019 59
The study takes a look at the work of clinical laboratory service performing microscopic diagnosis of tuberculosis in the Sakha Republic (Yaku-tia). We analyzed results of Ziehl-Neelsen microscopic detection of tuberculosis (TB) in clinical diagnostic laboratories of primary care facilities in 2005, and over the period from 2012 to 2016.
Analysis was based on national-level and industry sectoral reports, and annual reports of laboratories performing microscopic diagnosis of TB. Data from the following statistical forms were studied: Form 30, Form 33, Form ‘7-ТБ’, Register ‘03-ТБ/у’, Register ‘4-ТБ/у’ for the years 2005, and 2012-2016.
Keywords: Mycobacterium tuberculosis, clinical diagnostic laboratory, acid-fast bacilli, Ziehl-Neelsen microscopy, primary care.
N.G. Pavlov, G.I. Alekseeva, M.K. Vinokurova, E.I. Ermolaeva, M.V. Chernykh
COMPREHENSIVE INDICATIVE ANALYSIS OF THE PERFORMANCE AND QUALITY OF ACID-FAST BACTERIA DETECTION BY PRIMARY CARE FACILITIES IN THE SAKHA REPUBLIC (YAKUTIA)DOI 10.25789/YMJ.2019.67.18
HYGIENE, SANITATION, EPIDEMIOLOGY AND MEDICAL ECOLOGY
Introduction. Today’s epidemiological situation with tuberculosis (TB) in Rus-sia, and in the world, is demanding fast and effective detection and control of the causative agent, to prevent its spread. Microscopic method based on acid-fast biological properties of Mycobacterium tuberculosis is one of the detection meth-ods that are both fast and inexpensive [9].
Detection of acid-fast bacilli (AFB) in diagnostic specimens is significant in terms of identifying infectious TB cases, which present the biggest epidemiologi-cal risk. As is recognized, these patients can infect 20-30 or even more persons a year, on average [1, 5, 9].
In this view, intensifying the detection of cases by microscopic methods is con-sidered more and more as an urgent task for laboratory services within all medical
and preventive healthcare facilities, irre-spective of their departmental affiliation or forms of ownership [9].
One of the viable focus areas in rais-ing the effectiveness of anti-TB measures is the application of indicative approach to state monitoring and management system. Monitoring trends in indicators can be useful in terms of more effective management of prevention and treatment practices, and to assess the performance of anti-TB measures. Based on indica-tive approach, improved epidemiological monitoring and quality assessment sys-tems in TB care system have been de-veloped and implemented at a regional level [7].
Aim. Analyze performance and qual-ity of AFB detection by means of Zie-hl-Neelsen staining-based microscopic examination performed in laboratories of primary care facilities in the Sakha Re-public (Yakutia).
Material and methods. We analyzed the work of laboratory service performing microscopic diagnosis of TB in Yakutia. Analysis was based on national-level and industry sectoral reports, and annual reports of laboratories performing microscopic diagnosis of TB.
Data from the following statistical forms were analyzed: Form 30, Form 33, Form ‘7-ТБ’, Register ‘03-ТБ/у’, Register ‘4-ТБ/у’ for the years 2005, and 2012-2016.
Statistical data processing was per-formed using commonly available software (Microsoft Excel), and StatSoft Statistica 6, and was based on mean values (M±m), and statistical significance measure for observed statistical differences (P).
Results and discussion. As of Jan-uary 1, 2017, 209 clinical laboratories of
all levels were functioning in the Sakha Republic (Yakutia).
Of 209 laboratories, Ziehl-Neelsen mi-croscopic tests for AFB were performed by 144 (68.9%) labs. Due to substandard resources, 60 (28.7%) labs were not li-censed to work with RG3 and RG4 bio-logical agents, and were not performing tests for AFB.
Based on WHO recommendations for primary care facilities, the key per-formance quality indicators for Zie-hl-Neelsen (ZN) microscopy are AFB detection rate in diagnostic specimens, multiplicity of tests performed, population coverage (%) with tests, and proportion of new TB cases with positive ZN sputum microscopy detected in primary care lab-oratories. Based on these criteria, we as-sessed performance for ZN microscopic tests conducted in clinical diagnostic lab-oratories of primary care facilities over the period from 2012 to 2016.
As is seen in Table 1, over the spec-ified period, number of tests performed and number of individuals tested for AFB in primary care laboratories had re-mained practically at the same level, with minor variations ranging from 79 258 (2012) to 79 544 (2016) tests/year, and from 30 760 (2012) to 30 174 (2016) pa-tients/year. Proportion of AFB-positive patients had been declining each year (WHO reference level: 1%), with 0.3% in 2016, compared to 0.5% in 2012. Multi-plicity of tests (WHO reference value: 3.0) remained stably at 2.6. Population coverage (WHO reference level: 5%) ranged from 3.4% to 3.1%.
It can be said, that AFB detection rate, multiplicity of ZN tests, and population coverage with ZN testing in primary care
PAVLOV Nikolai Gerasimovich, Cand.Sci. (Veterinary Medicine), senior researcher, Bacteriological laboratory, Phthisiatry Re-search-Practice Center, Yakutsk, Russia; Mobile: 79644240417 E-mail: [email protected], ALEKSEEVA Galina Ivanovna, Dr.Sci. (Medicine), Head of Bacteriological labo-ratory, Phthisiatry Research-Practice Cen-ter, Yakutsk, Russia; Mobile: 79644260609 E-mail: [email protected], VINOKUROVA Maria Konstantinovna, Dr.Sci. (Medicine), Deputy Director for Science, Phthisiatry Re-search-Practice Center, Yakutsk, Russia; Mo-bile: 79644239494 E-mail: [email protected], ERMOLAEVA Elena Innokentievna, Head of Clinical diagnostic laboratory, Phthisiatry Research-Practice Center, Yakutsk, Russia; Mobile: 79142378470 E-mail: [email protected], CHERNYKH Marina Valerievna, bac-teriologist, Bacteriological laboratory, Phthisiat-ry Research-Practice Center, Yakutsk, Russia; Mobile: 79142221306 E-mail: [email protected].

ЯКУТСКИЙ МЕДИЦИНСКИЙ ЖУРНАЛ60
laboratories had been below the reference WHO levels over the period from 2012 to 2016, and showed a trend to decline.
Therefore, with the aim to comprehen-sively assess performance of microsco-pies for AFB, we analyzed some aspects in generating the values for indicative statistics.
The first indicator, AFB detection rate, is used to describe the percent of smear-positive TB patients among pa-tients suspected for TB and tested in pri-mary care laboratories. Indicative value is calculated based on ratio of smear-posi-tive patient number to total number of persons tested for TB (% of infectious TB patients identified by microscopy). Calcu-lation is made using the formula:
Number of smear-positive patients
x 100
Number of patients with suspicion tested for TB
This indicator is used to assess perfor-mance of primary level laboratories in de-tecting TB cases. It is in correlation with TB prevalence level in a region. Reference value for AFB detection rate should be 1%.
Data in Table 1 show that in the Sakha Republic, the reference value for AFB detection rate is achieved only in spe-cialized TB service facilities. Considering the existing estimated TB incidence in Russia, primary level laboratories could be able to detect, respectively, 1-2% and 2-3% of TB cases in cities and in rural ar-eas, per every 100 individuals tested [6].
Reaching these proportions will de-mand rigorous adherence to require-ments: appropriate patient referral for AFB-test; adequate multiplicity of tests performed; adequate quality of diagnos-tic specimens.
The second indicator, multiplicity of tests, is calculated using the formula:
Number of samples testedx 100
Number of patients with suspicion tested for TB
WHO recommends collecting three samples from each patient suspected for TB to perform sputum microscopy. Ideal-ly, an average number of slides (samples) observed to diagnose 1 patient should be 3 or close to 3. Too many (>3) or too few (<2) samples would be considered as noncompliance to sputum collection procedure [6]. But taking into consider-ation the new recommendations, cancel of further diagnostic tests of specimens
is allowed, if AFB are detected in the first sputum sample. Optimal multiplicity for sputum tests per 1 patient, performed with diagnostic purpose, could be 2.7.
The third indicator describing the performance of primary-level facilities is population coverage with microscopy, calculated using the formula:
Number of patients with suspicion tested for TB
x 100
Total population of an area
Reference level for this indicator is 5%. This level is achievable with ade-quate patient classification to social and medical risk groups for TB.
The forth indicator, a significant one, is the proportion of smear-positive patients with TB detected in primary-level labora-tories among all notified new smear-pos-itive TB cases.
With well-organized workflow, the ma-jority of infectious TB cases identified by sputum microscopy should be detected by primary-level facilities. Recommend-ed detection level is estimated as no less than 50-70%. This indicator is calculated using the formula:
Number of smear-positive TB patients detected by primary-level
facilitiesx 100
Number of all notified new smear-positive TB cases
To analyze this indicator, results of mi-crobiological examinations were studied in newly identified patients within annual co-horts of pulmonary TB cases in Sakha Re-public for the years 2005, and 2012-2016.
Over the study period, there was a de-
cline trend in number of new cases of pul-monary TB, with a decrease by 15.3%, on average (from 577 in 2005 to 489 in 2016). Among new pulmonary TB cases, diagnosis of infectious TB (i.e. case iden-tification and notification) by means of mi-croscopy (ZN, fluorescence) decreased by 5% (from 34.0% in 2005 to 32.3% in 2016) (Table 2).
There was a noticeable increase in AFB detection rate by microscopies per-formed in primary-level facilities. In 2005, proportion of AFB+ results in primary-lev-el facilities was 18.4%, but during the pe-riod from 2012 to 2016, there was a sta-tistically reliable increase by a factor of 2.4 (p<0.05), and in 2016, the proportion was 44.3%.
In the Far-East Federal District, the proportions of new infectious (smear-pos-itive) TB cases detected by microscopy were lower, compared to Sakha Republic (Table 3): 32.2 (2012); 30.2 (2013); 31.5 (2014); 32.8 (2015); 30.2% (2016). In Russian Federation, the proportions were almost the same as in Sakha Republic: 33.8 (2012); 34.2 (2013); 34.0 (2014); 34.1 (2015); 33.8% (2016) [2,3,4,8].
For the last 5 years, the proportion of AFB-positive cases detected by prima-ry-level facilities, among all notified AFB+ cases, was stably above 40% (except 39.8% in 2015), which was meaningful-ly higher, compared to Far-East Federal District and Russian Federation (2.3 and 2.4 times (p<0.05), respectively).
Hence, taking into consideration the increase in microscopic detections by primary-level facilities in Sakha Republic, observed over the study period, an ap-propriate reference level for this indicator would be no less than 60%.
Conclusion. All reference indicators discussed are suitable for estimation of the performance, quality of work, and work-
Number and quality of ZN microscopies for AFB in clinical diagnostic laboratoriesof primary care facilities in 2012-2016
Indicators Years2012 2013 2014 2015 2016
Number of tests, total 79258 83501 79305 80034 79544Of them, AFB+ 322 228 226 187 162
Detection %(WHO reference: 1%) 0.4 0.3 0.3 0.2 0.2
Patients tested 30760 32584 30797 29920 30174Of them, AFB+ 149 126 110 101 87
Detection %(WHO reference: 1%) 0.5 0.4 0.4 0.3 0.3
Test multiplicity(WHO reference: 3.0) 2.6 2.6 2.6 2.7 2.6
Population coverage %(WHO reference: 5%) 3.2 3.4 3.2 2.8 3.1
Table 1

3’ 2019 61
flow management of primary-level labora-tories performing ZN microscopy for AFB.
The indicators are easy to calculate, and are currently included in official sta-tistical recording and reporting forms.
In conclusion, present-day reality is demanding further dedicated manage-rial efforts to continue actively using mi-croscopic method in case detection, in particular, pulmonary TB cases, and es-pecially, among social and medical risk groups. In view of this, more emphasis is put on comprehensive indicative ap-proach to estimation and continuous monitoring of workflow organization and quality of microscopic tests performed, for the purposes of TB detection.
1. Выявление туберкулеза методом микро-скопии: учебное пособие для проведения ба-зового курса обучения. Москва, Тверь: Триада; 2008. [Detection of tuberculosis using microsco-py method: study guide for basic studies courses. Moscow, Tver: Triada Publ.; 2008. (In Russ.)].
2. Ревякина О.В. и др. Основные показа-тели противотуберкулезной деятельности в Сибирском и Дальневосточном федеральных округах. Новосибирск; 2013. [Revyakina OV et al. Key indicators for anti-tuberculosis measures in Siberian and Far-East Federal Districts. Novo-sibirsk; 2013 (In Russ.)].
3. Габбасова Л.А. и др. Отраслевые и эко-номические показатели противотуберкулезной работы в 2009-2014 гг. Методика расчета по-казателей и статистические материалы по ре-зультатам пятилетнего наблюдения. Москва: ЦНИИОИЗ; 2015. [Gabbasova LA et al. Industry sectoral and economic indicators for measures against tuberculosis in 2009-2014. Indicator cal-culation methodology and statistical materials, based on the results of 5-year observation. Mos-cow: TSNIIOIZ Publ.; 2015 (In Russ.)].
4. Стерликов С.А. и др. Отраслевые и эко-номические показатели противотуберкулезной работы в 2015-2016 гг.: статистические мате-риалы. Москва: ЦНИИОИЗ; 2017. [Sterlikov SA et al. Industry sectoral and economic indicators for measures against tuberculosis in 2015-2016: statistical materials. Moscow: TSNIIOIZ; 2017 (In Russ.)].
5. Павлунин А.В. и др. Проблемы органи-зации выявления и диагностики туберкулеза в общей лечебной сети. Проблемы туберкуле-за. 2014;11:18-22. [Pavlunin AV et al. Problems in organizing the detection and diagnosis of tu-berculosis in primary care network. Problemy tu-
berkuleza. 2014; 11:18-22 (In Russ.).] https://doi.org/10.21292/2075-1230-2014-0-11-18-22
6. Севастьянова Э.В. и др. Разработка критериев оценки качества и эффективности микробиологических исследований в учрежде-ниях противотуберкулезной службы и общей лечебной сети. Проблемы туберкулеза и бо-лезней легких. 2009; 3:55-60. [Sevast’yanova EV et al. Development of criteria for assessing the quality and performance of microbiological testing in TB facilities and in primary care network. Prob-lemy tuberkuleza i bolezney legkikh. 2009;3:55-60 (In Russ.)].
7. Скачкова Е.И. Научное обоснование и разработка региональной модели организации борьбы с туберкулезом в современных соци-ально-экономических и эпидемиологических условиях [диссертация]. Москва; 2008. [Skac-hkova E.I. Scientific substantiation and develop-ment of the regional model for organization of the
fight against tuberculosis in the current socioeco-nomic and epidemiological settings [dissertation]. Moscow; 2008 (In Russ.)].
8. Туберкулез в Российской Федерации 2011 г.: аналитический обзор статистических показателей, используемых в Российской Фе-дерации и в мире. Москва; 2013. [Tuberculosis in Russian Federation 2011: analytical review of indicators used in Russian Federation and in the world. Moscow; 2013 (In Russ.)].
9. Ерохин В.В. и др. Унифицированный метод микроскопического выявления кисло-тоустойчивых микобактерий: руководство для клинико-диагностических лабораторий лечеб-но-профилактических учреждений. Москва, Тверь: Триада; 2008. [Erokhin VV et al. Unified method of microscopic detection of acid-fast my-cobacteria: manual for clinical diagnostic labora-tories of healthcare facilities. Moscow, Tver: Tria-da Publ.; 2008 (In Russ.)].
AFB detection among new cases of pulmonary TB, Sakha Republic, 2005, 2012-2016
Year Total number
Of them AFB+ (microscopy)
Of them, AFB+ (microscopy in primary care)
n % n %2005 577 196 34,0 36 18,42012 576 215 37,3 88 40,92013 591 199 33,7 81 40,72014 558 212 38,1 94 44,32015 517 171 33,1 68 39,82016 489 158 32,3 70 44,3
Trend over 2005-2016 - 15,3% - 19,4% - 5% +1.9 times +2.4 times
Table 2
Proportion of new cases of pulmonary TB with positive microscopy, Sakha Republic, Far-East Federal District, Russian Federation, 2012-2016
Indicator Years2012 2013 2014 2015 2016
Notifiedwith AFB+ microscopy:
Yakutia: (М±m) = 34.9±1.2Far-East: (М±m) = 31.4±0.5
Russia: (М±m)=34.0±0.1
37.332.233.8
33.730.234.2
38.131.534.0
33.132.834.1
32.430.233.8
Of them. proportion of AFB+ detected in primary care facilities:
Yakutia: (М±m) = 42.0±0.9Far-East: (М±m) =17.9±0.5Russia: (М±m) =17.5±0.3
40.919.218.3
40.718.717.9
44.316.116.8
39.817.217.5
44.318.116.8
Increase in Yakutia, compared to Far-East Federal District and Russia: by a factor of 2.3 and 2.4.
Table 3
References

ЯКУТСКИЙ МЕДИЦИНСКИЙ ЖУРНАЛ62
ABSTRACT The aim of the study was to assess the prevalence and structure of metabolic syndrome among the indigenous female population (n=628)
of the Republic of Sakha (Yakutia). The screening survey was conducted among the female population of 2 districts of the Republic of Sakha (Yakutia) at the age of 20 and older (Oimyakonsky, Gorny, Tattinsky). IDF metabolic syndrome was established in 142 women, thus prevalence was at 22.6%. The most common variant of the clinical manifestations of metabolic syndrome was a combination of abdominal obesity with high blood pressure and dyslipidemia (in 62.7% of cases). The dynamics of the frequency of metabolic disorders in different age groups suggests that abdominal obesity is the main pathogenetic factor contributing to the development of a chain of metabolic disorders in a given population.
Keywords: metabolic syndrome, Yakutia, abdominal obesity, diabetes mellitus, fasting hyperglycemia.
T.M. Klimova, A.G. Egorova, R.N. Zakharova, E.P. Ammosova,M.E. Baltakhinova, A.I. Fedorov, A.N. RomanovaMETABOLIC SYNDROME AMONG YAKUTIA’S INDIGENOUS FEMALE POPULATIONDOI 10.25789/YMJ.2019.67.19
ACTUAL TOPIC
Introduction. Metabolic syndrome is a complex of pathological conditions characterized by abdominal obesity, in-sulin resistance, hypertension, and hy-perlipidemia. The syndrome contributes to the development of diseases such as diabetes mellitus type 2, coronary heart disease, stroke, and other disorders. The prevalence of metabolic syndrome has increased markedly over the past de-cades worldwide [5]. The main reasons for this are the changes in nutrition and a decrease in physical activity [6].
In the Sakha (Yakutia) Republic, changes in the socio-economic struc-ture of the population in the 20th century changed the structure of diseases and their prevalence. Epidemiological transi-tion is accompanied by an increase in the number of non-communicable diseases, including cardiovascular and type 2 di-abetes. According to the state statistics bodies, the incidence of type 2 diabetes among the adult population of the repub-lic increased from 2004 to 2017. from 14 to 40.3 per 1000 population, diseases of the circulatory system from 164.8 to 236.2 per 1000 population. Undoubtedly, this also entails an increase in longevity, but on the whole, indicates a significant burden on society. Effective control of risk factors for these diseases is possible with an objective assessment of the epi-demiological situation.
In this regard, the purpose of the study was to assess the prevalence and struc-ture of the metabolic syndrome among the indigenous female population of the Sakha (Yakutia) Republic.
Materials and Methods. A screening survey was conducted in 2017 among the female population of 2 districts of the Republic of Sakha (Yakutia) aged 20 and over (Oymyakonsky, Gorny, Tat-tinsky), representatives of indigenous ethnic groups (Yakuts, Evens, Evenks).
The study was conducted subject to the voluntary informed consent of the participants. The examination program included: anthropometric examination by the standard method, triple measure-ment of blood pressure (BP), fasting venous blood sampling. The content of glucose, total cholesterol (cholesterol), triglycerides, high-density lipoproteins (HDL cholesterol) was determined on the express analyzer Cardiochek PA, USA. The concentration of low-density lipo-protein cholesterol (LDL cholesterol) was calculated using the Friedwald formula with a blood triglyceride level of less than 4.5 mmol/L. Hypertriglyceridemia was established with a triglyceride content of ≥ 1.7 mmol/L, hypercholesterolemia – at a concentration of HDL cholesterol < 1.0 mmol/L in men and < 1.3 mmol/L in wom-en; elevated blood pressure – with sys-tolic blood pressure (SBP) ≥ 130 mmHg and/or diastolic blood pressure (DBP) ≥ 85 mm Hg; fasting hyperglycemia (FHG) – when the plasma glucose level is ≥ 5.6 mmol/L, or when an established diagno-sis of diabetes mellitus (DM). Persons receiving specific medical treatment for these conditions were also referred to as persons with these disorders. As cri-teria for metabolic syndrome, IDF 2006 criteria were used, according to which MS was established in the presence of abdominal obesity (waist circumference more than 80 cm) and 2 or more of the 4 above-mentioned risk factors [6].
Statistical data analysis was per-formed in the IBM SPSS STATISTICS 22 package. When comparing groups depending on the type of data, Krus-kal-Wallis and Pearson χ2 criteria were used. The critical value of the level of statistical significance of differences (p) was taken to be 5%. Descriptive statis-tics of quantitative data are presented as median (Me) and interquartile range
KLIMOVA Tatyana Mikhailovna, Candidate of Medical Sciences, Associate Professor, Depart-ment of Pharmacology and Pharmacy, Medical Institute of the M.K. Ammosov North-Eastern Federal University, Senior Researcher, Depart-ment of Epidemiology of Chronic Non-Commu-nicable Diseases, Yakutsk Scientific Center for Complex Medical Problems, Yakutsk, Russia, +79142336724, e-mail: [email protected]. ORCID: 0000-0003-2746-0608. EGOROVA Aitalina Grigorevna, Candidate of Medical Sciences, Head of the Department of Epi-demiology of Chronic Non-Communicable Diseases of the Yakutsk Scientific Center for Complex Medical Problems, Yakutsk, Russia, +79142346411, e-mail: [email protected]. OR-CID: 0000-0002-8526-9644. ZAKHAROVA Raisa Nikolaevna, Cand. Candidate of Med-ical Sciences, Senior Researcher, Research Center of the Medical Institute of the M.K. Ammosov North-Eastern Federal University, 677000, Yakutsk, 27 Ulitsa Oiunskogo, Russia. tel. +79142223002, e-mail: [email protected], ORCID: 0000-0002-1395-8256. AMMOSOVA Elena Petrovna, Candidate of Medical Sci-ences, Senior Researcher, Research Center of the Medical Institute of the M.K. Ammosov North-Eastern Federal University, 677000, Yakutsk, 27 Ulitsa Oiunskogo, Russia. tel. +79644243908, e-mail: [email protected], ORCID: 0000-0002-7973-6103. FEDOR-OV Afanasy Ivanovich, Candidate of Biolog-ical Sciences, Senior Researcher, Research Center of the Medical Institute of the M.K. Ammosov North-Eastern Federal University, 677000, Yakutsk, 27 Ulitsa Oiunskogo, Russia. tel. +79142332966, e-mail: [email protected], ORCID: 0000-0002-7973-6103. BALTAKH-INOVA Marina Egorovna, Research Asso-ciate, Medical Institute of the M.K. Ammosov North-Eastern Federal University’s Scientific Research Center, 677000, Yakutsk, 27 Ulit-sa Ojunskogo, tel. +79142710634, e-mail: [email protected]. ORCID: 0000-0003-0986-7754. ROMANOVA Anna Nikolaevna, Doctor of Medical Sciences, Director of the Yakutsk Scientific Center for Complex Medical Prob-lems, Yakutsk, Russia, +79681518887, e-mail: [email protected]. ORCID: 0000-0002-4817-5315.
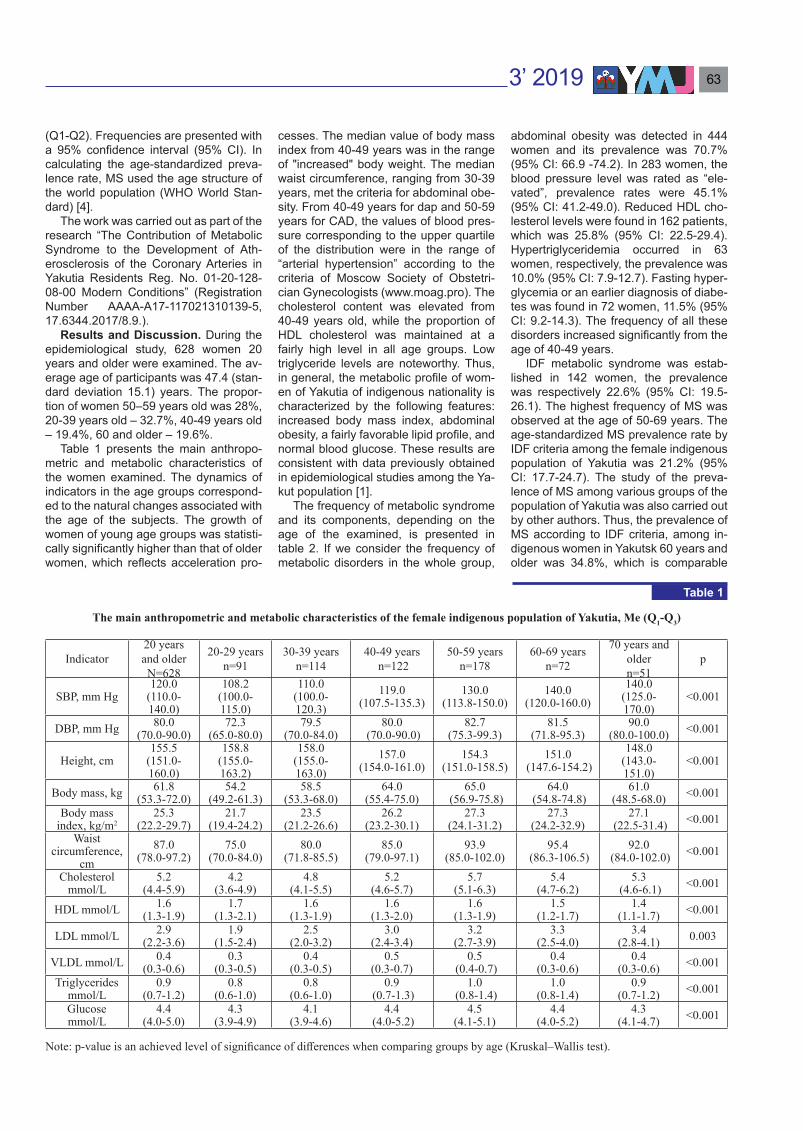
3’ 2019 63
(Q1-Q2). Frequencies are presented with a 95% confidence interval (95% CI). In calculating the age-standardized preva-lence rate, MS used the age structure of the world population (WHO World Stan-dard) [4].
The work was carried out as part of the research “The Contribution of Metabolic Syndrome to the Development of Ath-erosclerosis of the Coronary Arteries in Yakutia Residents Reg. No. 01-20-128-08-00 Modern Conditions” (Registration Number АААА-А17-117021310139-5, 17.6344.2017/8.9.).
Results and Discussion. During the epidemiological study, 628 women 20 years and older were examined. The av-erage age of participants was 47.4 (stan-dard deviation 15.1) years. The propor-tion of women 50–59 years old was 28%, 20-39 years old – 32.7%, 40-49 years old – 19.4%, 60 and older – 19.6%.
Table 1 presents the main anthropo-metric and metabolic characteristics of the women examined. The dynamics of indicators in the age groups correspond-ed to the natural changes associated with the age of the subjects. The growth of women of young age groups was statisti-cally significantly higher than that of older women, which reflects acceleration pro-
cesses. The median value of body mass index from 40-49 years was in the range of "increased" body weight. The median waist circumference, ranging from 30-39 years, met the criteria for abdominal obe-sity. From 40-49 years for dap and 50-59 years for CAD, the values of blood pres-sure corresponding to the upper quartile of the distribution were in the range of “arterial hypertension” according to the criteria of Moscow Society of Obstetri-cian Gynecologists (www.moag.pro). The cholesterol content was elevated from 40-49 years old, while the proportion of HDL cholesterol was maintained at a fairly high level in all age groups. Low triglyceride levels are noteworthy. Thus, in general, the metabolic profile of wom-en of Yakutia of indigenous nationality is characterized by the following features: increased body mass index, abdominal obesity, a fairly favorable lipid profile, and normal blood glucose. These results are consistent with data previously obtained in epidemiological studies among the Ya-kut population [1].
The frequency of metabolic syndrome and its components, depending on the age of the examined, is presented in table 2. If we consider the frequency of metabolic disorders in the whole group,
abdominal obesity was detected in 444 women and its prevalence was 70.7% (95% CI: 66.9 -74.2). In 283 women, the blood pressure level was rated as “ele-vated”, prevalence rates were 45.1% (95% CI: 41.2-49.0). Reduced HDL cho-lesterol levels were found in 162 patients, which was 25.8% (95% CI: 22.5-29.4). Hypertriglyceridemia occurred in 63 women, respectively, the prevalence was 10.0% (95% CI: 7.9-12.7). Fasting hyper-glycemia or an earlier diagnosis of diabe-tes was found in 72 women, 11.5% (95% CI: 9.2-14.3). The frequency of all these disorders increased significantly from the age of 40-49 years.
IDF metabolic syndrome was estab-lished in 142 women, the prevalence was respectively 22.6% (95% CI: 19.5-26.1). The highest frequency of MS was observed at the age of 50-69 years. The age-standardized MS prevalence rate by IDF criteria among the female indigenous population of Yakutia was 21.2% (95% CI: 17.7-24.7). The study of the preva-lence of MS among various groups of the population of Yakutia was also carried out by other authors. Thus, the prevalence of MS according to IDF criteria, among in-digenous women in Yakutsk 60 years and older was 34.8%, which is comparable
The main anthropometric and metabolic characteristics of the female indigenous population of Yakutia, Me (Q1-Q3)
Indicator20 years and olderN=628
20-29 yearsn=91
30-39 yearsn=114
40-49 years n=122
50-59 yearsn=178
60-69 yearsn=72
70 years and oldern=51
р
SBP, mm Hg120.0
(110.0-140.0)
108.2(100.0-115.0)
110.0(100.0-120.3)
119.0(107.5-135.3)
130.0(113.8-150.0)
140.0(120.0-160.0)
140.0(125.0-170.0)
<0.001
DBP, mm Hg 80.0(70.0-90.0)
72.3(65.0-80.0)
79.5(70.0-84.0)
80.0 (70.0-90.0)
82.7 (75.3-99.3)
81.5 (71.8-95.3)
90.0 (80.0-100.0) <0.001
Height, cm155.5
(151.0-160.0)
158.8(155.0-163.2)
158.0(155.0-163.0)
157.0 (154.0-161.0)
154.3 (151.0-158.5)
151.0 (147.6-154.2)
148.0 (143.0-151.0)
<0.001
Body mass, kg 61.8(53.3-72.0)
54.2(49.2-61.3)
58.5(53.3-68.0)
64.0 (55.4-75.0)
65.0 (56.9-75.8)
64.0 (54.8-74.8)
61.0 (48.5-68.0) <0.001
Body mass index, kg/m2
25.3(22.2-29.7)
21.7(19.4-24.2)
23.5(21.2-26.6)
26.2 (23.2-30.1)
27.3 (24.1-31.2)
27.3 (24.2-32.9)
27.1 (22.5-31.4) <0.001
Waist circumference,
cm87.0
(78.0-97.2)75.0
(70.0-84.0)80.0
(71.8-85.5)85.0
(79.0-97.1)93.9
(85.0-102.0)95.4
(86.3-106.5)92.0
(84.0-102.0) <0.001
Cholesterol mmol/L
5.2(4.4-5.9)
4.2(3.6-4.9)
4.8(4.1-5.5)
5.2 (4.6-5.7)
5.7 (5.1-6.3)
5.4 (4.7-6.2)
5.3 (4.6-6.1) <0.001
HDL mmol/L 1.6(1.3-1.9)
1.7(1.3-2.1)
1.6(1.3-1.9)
1.6 (1.3-2.0)
1.6 (1.3-1.9)
1.5 (1.2-1.7)
1.4 (1.1-1.7) <0.001
LDL mmol/L 2.9(2.2-3.6)
1.9(1.5-2.4)
2.5(2.0-3.2)
3.0 (2.4-3.4)
3.2 (2.7-3.9)
3.3 (2.5-4.0)
3.4 (2.8-4.1) 0.003
VLDL mmol/L 0.4(0.3-0.6)
0.3(0.3-0.5)
0.4(0.3-0.5)
0.5 (0.3-0.7)
0.5 (0.4-0.7)
0.4 (0.3-0.6)
0.4 (0.3-0.6) <0.001
Triglycerides mmol/L
0.9(0.7-1.2)
0.8(0.6-1.0)
0.8(0.6-1.0)
0.9 (0.7-1.3)
1.0 (0.8-1.4)
1.0 (0.8-1.4)
0.9 (0.7-1.2) <0.001
Glucose mmol/L
4.4(4.0-5.0)
4.3(3.9-4.9)
4.1(3.9-4.6)
4.4 (4.0-5.2)
4.5 (4.1-5.1)
4.4 (4.0-5.2)
4.3(4.1-4.7) <0.001
Note: p-value is an achieved level of significance of differences when comparing groups by age (Kruskal–Wallis test).
Table 1

ЯКУТСКИЙ МЕДИЦИНСКИЙ ЖУРНАЛ64
with our data in the corresponding age group (33.5%) [2]. In a study conducted among small indigenous peoples of the North, the prevalence of MS according to the criteria of GNOK ranged from 25 to 61% [3].
Elevated blood pressure was one of the components of MS in 90.1% of cases of MS, hypercholesterolemia in 71.1%, Fasting Hyperglycemia/Diabetes Mellitus in 35.9%, and GGT in 34.5%. The most common variant of the clinical manifes-tations of MS was the combination of ab-dominal obesity with high blood pressure and dyslipidemia (Table 3). This com-bination of risk factors was observed in 89 of 142 women with MS. A combina-tion of 4 risk factors (abdominal obesity, elevated blood pressure, dyslipidemia, fasting hyperglycemia (DM)) was detect-ed in 21 cases of MS. In 18 women, MS was a combination of abdominal obesi-ty, elevated blood pressure and fasting hyperglycemia (or DM). A rare variant of MS without elevated blood pressure was found in 10 women aged 30-69 years. Four cases of isolated lipid spectrum disorders in the form of a combination of hypertriglyceridemia and a reduced level of HDL cholesterol on the background of abdominal obesity were recorded in dif-ferent age groups, and possibly reflect
cases of primary dyslipidemia. In general, options with the inclusion of disorders of carbohydrate metabolism in the form of fasting hyperglycemia or diabetes were recorded from the age of 40-49 years. This suggests that in this population ab-
dominal obesity is the main pathogenetic factor contributing to the development of a chain of metabolic disorders.
Conclusion. Thus, according to the results of a screening survey, the prev-alence of metabolic syndrome accord-
Prevalence of metabolic syndrome and its components among the female indigenous population of Yakutia
AgeВозраст
Totaln=628
20-29 years n=91
30-39 years n=114
40-49 years n=122
50-59 years n=178
60-69 years n=72
70-79 years n=51
Triglycerides ≥ 1.7 mmol/Ln 4 6 14 28 8 3 63%
(95%ДИ)4.4
(0.6-11.9)5.3
(1.6-11.8)11.5
(6.4-18.9)15.7
(10.8-22.1)11.1
(4.6-21.6)5.9
(0-18.1)10.0
(7.9-12.7)HDL < 1.29 mmol/L
n 17 31 30 42 24 18 162%
(95%ДИ)18.7
(11.3-28.6)27.2
(19.4-36.5)24.6
(17.4-33.4)23.6
(17.7-30.6)33.3
(22.7-45.6)35.3
(22.3-50.3)25.8
(22.5-29.4)Fasting blood glucose ≥ 5.6 mmol/L or Type 2 Diabetes
n 6 3 17 31 12 3 72%
(95%ДИ)6.6
(2.1-14.7)2.6
(0-8.5)13.9
(8.4-21.7)17.4
(12.3-23.9)16.7
(8.8-27.9)5.9
(0-18)11.5
(9.2-14.3)SBP ≥ 130 mm Hg and/or DBP ≥ 85 mm Hg
n 12 31 52 101 49 38 283%
(95%ДИ)13.2
(6.9-22.4)27.2
(19.4-36.5)42.6
(33.8-51.9)56.7
(49.2-64.0)68.1
(55.8-78.5)74.5
(59.7-85.9)45.1
(41.2-49.0)Waist circumference more than 80 cm
n 34 61 89 150 64 46 444%
(95%ДИ)37.4
(27.5-48.2)53.5
(44.0-62.8)73.0
(64.0-80.5)84.3
(77.9-89.2)88.9
(78.4-95.4)90.2
(77.2-97.6)70.7
(66.9-74.2)Metabolic syndrome by IDF criteria
n 3 13 30 54 27 15 142%
(95%ДИ)3.3
(0-10.5)11.4
(6.2-19.2)24.6
(17.4-33.4)30.3
(23.8-37.7)37.5
(26.4-49.9)29.4
(17.4-44.4)22.6
(19.5-26.1)
Table 2
Variants of clinical manifestations of metabolic syndrome depending on the ageof the examined, %
AgeAO+EBP+
DLP
AO+EBP+ FHG/
DM+DLP
AO+EBP+FHG/DM
AO+FHG/DM+DLP
DLP (GGT, CS HDL ↓)
n % n % n % n % n %20-29 years
n=3 2 66.6 0 0 0 0 0 0 1 33.3
30-39 yearsn=13 12 92.3 0 0 0 0 1 7.7 0 0.0
40-49 yearsn=30 17 56.6 5 16.6 3 10.0 5 16.7 0 0.0
50-59 yearsn=54 29 53.7 9 16.7 11 20.4 3 5.6 2 3.7
60-69 years n=27 17 63.0 6 22.2 3 11.1 1 3.7 0 0.0
70-79 yearsn=15 12 80.0 1 6.7 1 6.7 0 0.0 1 6.7
Totaln=142 89 62.7 21 14.8 18 12.7 10 7.0 4 2.8
Note. AO – abdominal obesity; EBP – elevated blood pressure; DLP – dyslipoproteinemia; FHG/DM – fasting hyperglycemia and/or proven case of DM.
Table 3

3’ 2019 65
ing to IDF criteria among the indigenous female population was 22.6% (95% CI: 19.5-26.1). With standardization on the age structure of the world’s population, the prevalence of MS was 21.2% (95% CI: 17.7-24.7). The most common variant of the clinical manifestations of MS was a combination of abdominal obesity with high blood pressure and dyslipidemia (in 62.7% of cases). A combination of 4 risk factors (abdominal obesity, elevat-ed blood pressure, dyslipidemia, fasting hyperglycemia/diabetes) was detected in 14.8% of cases of MS. Variants with the inclusion of disorders of carbohydrate metabolism in the form of FHG/DM were recorded from the age of 40-49 years. The dynamics of the frequency of met-abolic disorders in different age groups suggests that abdominal obesity is the main pathogenetic factor contributing to the development of a chain of metabol-ic disorders in a given population. The
statement of this fact contains the poten-tial for correction by informing the public about the risks, creating conditions for an active lifestyle, improving the eating hab-its of the population, restricting advertis-ing of unhealthy foods in the media, etc.
1. Климова Т.М., Федорова В.И., Балтахи-нова М.Е. Метаболические факторы риска хронических неинфекционных заболеваний у коренного сельского населения Якутии. Экология человека. 2013; 2: 3–7. [Klimova TM, Fedorova VI, Baltakhinova ME. Metabolic risk factors for chronic non-communicable dis-eases among the indigenous rural population of Yakutia. Ekologiya cheloveka. 2013; 2: 3-7. (in Russ.)]
2. Симонова Г.И., Созонова К.К., Тата-ринова О.В., Мустафина С.В., Неустроева В.Н., Щербакова Л.В. Распространенность метаболического синдрома у пожилого насе-ления в Якутии. Якутский медицинский журнал. 2013; 44 (4): 19–22. [Simonova GI, Sozonova KK, Tatarinova OV, Mustafina SV, Neustroeva VN, Shcherbakova LV. Prevalence of
metabolic syndrome in the elderly population of Yakutia. Yаkutskij medicinskij zhurnal. 2013; 44 ( 4): 19-22. (in Russ.)]
3. Софронова С.И. Артериальная гипер-тония и метаболический синдром у коренных малочисленных народов Севера в Якутии. Якутский медицинский журнал. 2018; 61 (1): 14–17. [Sofronova SI. Arterial hypertension and metabolic syndrome in the indigenous peoples of the north in Yakutia. Yakutskij medicinskij zhurnal. 2018; 61 (1):14-17. (in Russ.)]
4. Borch-Johnsen K. The metabolic syn-drome in a global perspective. The public health impact--secondary publication. Dan. Med. Bull. 2007; 54 (2): 157–159.
5. Elabbassi W.N., Haddad H.A. The epidemic of the metabolic syndrome.Saudi Med. J. Current Hypertension Reports. 2005; 26 (3):373–375.
6. IDF. The IDF consensus worldwide defini-tion of the metabolic syndrome. 2006. 24 p. URL: http://www.idf.org/webdata/docs/ IDF_Meta_def_final.pdf (accessed 11 May 2019)
7. Ahmad O.B., Boschi-Pinto C., Lopez A.D., Murray Ch. JL., Lozano R., Inoue M. Age standardization of rates: a new WHO standard. EIP/GPE/EBD, World Health Organization. 2001; 31. https://www.who.int/healthinfo/paper31.pdf (accessed 11 May 2019)
References
This study was designed to survey the prevalence and distribution of non-motor symptoms (NMS) in Parkinson's disease (PD) patients in Siberian region, Russia, and to investigate the association between NMS and health-related quality of life.
Materials and methods. Two hundred six PD patients were evaluated using a battery of vali-dated scales recommended by leading PD research Societies (Movement Disorders Society and the European Academy of Neurology). Clinical assessments were conducted using Uniform Par-kinson's Disease Rating Scale (UPDRS), Hospital Anxiety and Depression Scale, Beck depres-sion inventory II, Apathy Scale, Montreal Cognitive Assessment (MoCAtest), Epworth Sleepiness Scale, Sleep Assessment Questionnaire, Columbia-Suicide Severity Rating Scale, Parkinson's Disease Questionnaire-39 – PDQ-39. Results. Each PD patient had eight different individual NMS on average. The constipation (87%), depression (67%), insomnia (66%), anxiety (52%), apathy (35%), and impulsive behavior disorders (27%) were the most frequent complaints. NMS prevalence in PD patients in Tomsk region was consistent with that in the international study, although the composition proportions were different. There was a significant association of PDQ-39 score with anxiety (r = 0,474, p = 0,000), depression (r = 0,471, p = 0,000), apathy (r = 0,322, p = 0,000), UPDRS III score (r = 0,316, p = 0,000), Hoehn and Yahr stage (r = 0,267, p = 0,000), disease duration (r = 0,220, р = 0,005), and levodopa equivalent dosage (r = 0,213, р = 0,001).
Conclusion. This study confirmed that NMS are common in PD, occurring across all disease stages and have a great impact on quality of life. NMS progression contributes significantly to health-related quality of life decline, and should be well recognized and treated.
Keywords: Parkinson's disease, apathy, anxiety, depression, impulsive behavioral disorders, insomnia, constipation.
M.A. Nikitina, N.G. Zhukova, E.Yu. Bragina, V.M. Alifirova , I.A. Zhukova, D.E. Gomboeva, N.G. Brazovskaya,O.P. Izhboldina , I.Zh. Zhalsanova
THE HETEROGENEITY OF NON-MOTOR SYMPTOMS IN PATIENTS WITH PARKINSON'S DISEASE IN TOMSK REGION
DOI 10.25789/YMJ.2019.67.20
NIKITINA Maria A. – MD, PhD, Associate Professor, Department of Neurology and Neu-rosurgery, Siberian State Medical University, Tomsk, Russian Federation, 8-913-865-4918, e-mail: [email protected], ORCID 0000-0002-2614-207X, ZHUKOVA Natalya G. –MD, PhD, Professor, Department of Neurology and Neurosurgery, Siberian State Medical Uni-versity, Tomsk, Russian Federation, [email protected], 8-913-824-6202, BRAGINA Ele-na Yu. - PhD, Senior Researcher, Laboratory of Population Genetics, Research Institute of Medical Genetics, Tomsk NRMC, Tomsk, Rus-sian Federation, [email protected], 8-913-823-4122, ALIFIROVA Valentina M., MD, PhD, Professor, Head of the Department of Neurology and Neurosurgery, Siberian State Medical University, Tomsk, Russian Federation, [email protected], 8-913-850-0240, ZHUKO-VA Irina A. – MD, PhD, Associate Professor, Department of Neurology and Neurosurgery, Siberian State Medical University, Tomsk, Russian Federation, [email protected], 8-913-800-6296, GOMBOEVA Densema E. – PhD student of the Laboratory of Popu-lation Genetics, Research Institute of Medical Genetics, Tomsk National Research Medical Center, Tomsk NRMC, Tomsk, Russian Fed-eration, [email protected], 8-923-409-6698, BRAZOVSKAYA Natalia G. – PhD, Associate Professor, Department of Medical and Biolog-ical Cybernetics, Siberian State Medical Uni-versity, Tomsk, Russian Federation, [email protected], 8-913-884-7333, IZHBOLDINA Olga P. - MD, PhD, Neurologist, Siberian State Med-ical University, Tomsk, Russian Federation, [email protected], 8-913-853-6047, ZHALSANOVA Irina Zh. – PhD student of the Laboratory of Population Genetics, Re-search Institute of Medical Genetics, Tomsk National Research Medical Center, Tomsk NRMC, Tomsk, Russian Federation, [email protected], 8-923-409-6698
Introduction. Parkinson’s Disease (PD) is one of the most common neu-rological disease reaching 1% among population with age more than 60. PD’s morbidity is up to 40 cases per 100 000 of population per year. According to the results of different epidemiological re-searches conducted in the USA and
some European countries the prevalence of this neurodegenerative disease rang-es in wide limits from 18 to 328 cases per 100 000 of population, but on the aver-age it is about 120 cases per 100 000 of population [9]. In the Russian Federation the prevalence of PD is at worldwide lev-el and according to the epidemiological

ЯКУТСКИЙ МЕДИЦИНСКИЙ ЖУРНАЛ66
researches conducted in different regions it is in the limit from 40 to 140 cases per 100 000 of population. The amount of pa-tients with Parkinson’s disease (PwPD) is suggested to increase in 1,5-2 times to 2030 year [4].
Non-motor symptoms of PD are com-mon but might stay unrecognized in clini-cal practice due to the insufficient target-ed detection by physicians and absence of active complaints from patients and their relatives [1]. While dominating in clinical case and being main factors that influence life quality and length of PwPD, such non-motor symptoms like emotion-al-affective, behavioral and psychotic symptoms accelerate progressing of in-validization and cause patients’ accom-modation in nursing home [13].
For the first time non-motor symptoms of PD were systematically described in 2006 by K. Ray Chaudhuri and all [9] and nowadays non-motor symptoms are paid great attention [7, 23]. Wide range of non-motor symptoms includes vegeta-tive, neuropsychic, sensor disorders, fa-tigue, sleep and wakefulness disturbanc-es. Some PD’s non-motor symptoms are registered in almost all patients regard-less of the age of onset and Hoehn and Yahr stage of disease and become more expressed with the course of the disease [2]. Some of non-motor symptoms (anxi-ety, fatigue and vegetative disorders) are registered at the early stage of disease before the beginning of treatment [12]; the others according to literature data and own clinical observations precede PD’s motor symptoms for a few years (olfactory dysfunction, disturbed eye movement in the sleep phase with fast eye movement – REM sleep phase, con-stipation, pain and depression) [1]. At late stages of disease non-motor symptoms are observed in almost all patients with motor fluctuations [10]. A lot of research-es have established that at the time of PD diagnose verification its prevalence is 21%, but in only 7 years after the disease onset it is 88% [12].
The aim of this study is to analyze het-erogeneity of non-motor manifestation of PD in Tomsk region.
Materials and methods. This study was performed on the base of Depart-ment of Neurology and Neurosurgery, Siberian State Medical University. We examined 206 PwPD, 57 % (118 people) out of them were women. The examina-tion of all patients was held according to our own designed individual registration card including information about social status, history of previous diseases, passport details, neurological status and results of neuropsychological testing with
scales and questionnaries. Diagnose of PD was established according to UK Par-kinson’s Disease Society Brain Bank Di-agnostic Criteria. While establishing the diagnosis clinical form, Hoehn and Yahr stage of disease (according to «Modified Hoehn and Yahr Scale», 1967), rate of progression, presence of postural un-steadiness, impaired walking, sidedness with a predominance of motor symptoms in the limbs, severity of different non-mo-tor manifestations (depression, anxiety, apathy, cognitive and vegetative disor-ders) were considered.
Average age of examined patients
was about 65,9±9,8 years (66 (60;74) years), varying from 40 to 85 years. Peo-ple with secondary professional educa-tion (39,3%) and with higher education (46,6%) prevailed.
The study involved patients matching certain criteria: men and women from 50 to 86 years; presence of PD’s diagnosis with I-IV stage by Hoehn and Yahr scale; patients who signed and dated voluntary informed agreement for taking part in the research.
Severity of motor manifestations of PD such as resting tremor, hypokine-sia, rigidity and postural unsteadiness was determined according to III part of the Unified Parkinson's Disease Rating Scale (UPDRS) [11].
Validated neuropsychological tests provided in the study were focused on de-tection of such non-motor manifestations of PD as impulsive behavioral disorders, cognitive and emotional-affective disor-ders, psychotic manifestation and sleep disorders. Impulsive-compulsive disor-ders were evaluated by questionnaire for Questionnaire for Impulsive-Compulsive Disorders in PD Rating Scale (QUIO-RS). Anxiety-depressive disorders were evaluated according to Hospital Anxiety and Depression Scale (HADS), Beck’s Depression Inventory – II (BDI-II), Apa-thy Scale and Columbia Suicide Severity Rating Scale (C-SSRS). Cognitive sta-tus was analyzed according to Montreal Cognitive Assessment (MoCA). Sleep disorders were studied according to Ep-
worth Sleepiness Scale (ESS) and Sleep Attack Questionnaire (SAQ). Quality of life was studied by using specialized self-questionnaire for life quality assess-ment in PwPD, PDQ-39.
Statistical result processing was per-formed by using application package SPSS 11.5 for Windows.
Results and discussion. During re-sults analysis it was revealed that among the examined 206 PwPD 27% (56 pa-tients) had subclinical anxiety accord-ing to HADS and 25% (51 patients) had clinically manifested anxiety (table 1).
The average was 66 (61; 73) years
in the group without anxiety, 64 (60; 74) years in the group with subclinical anxiety and 64 (57; 75) years in the group with clinically manifested anxiety (χ²=0,162, p=0,922). During intergroup comparison it was revealed that younger patients (aged 50-59 years, 31,4%) prevailed in the group with clinically manifested anxi-ety as opposed to groups without anxiety and with subclinical anxiety which con-sisted of more older patients.
In the result of our research it was re-vealed that patients with clinically man-ifested anxiety had the longest duration of PD – about 8 (4; 10) years, patients with subclinical anxiety had the shortest – 4 (3; 9) years and without anxiety – 6 (3; 10) years. The received data correspond to the literary described as “parkinsonian personality” according to which anxiety preceding to first motor manifestations of PD is characteristic. On advanced stages of the disease PwPD with motor fluctuations have anxiety level depending on levodopa action phase. Thus, anxiety symptoms are increased by relative over-dose of dopaminergic drugs [11, 16].
Analisys of motor disorders by III part of UPDRS depending on severity of anxi-ety revealed that patients with anxiety had more expressed motor manifestations of PD: in the group of patients without anxi-ety, with subclinical expressed and mani-fested anxiety average mean by UPDRS was 32 (25; 43), 33 (27; 46) и 35 (28; 44) points respectively. This fact can be ex-plained on the one side by progressive
Characteristics of patients with Parkinson's disease, depending on the presenceand severity of anxiety according to the HADS scale
Indicatorabs.%
Выраженность тревоги по шкале HADS, баллы
Norm0—7
subclinical8—10
Clinical≥11
n=206100 %
9948.06
5627.18
5124.76
Table 1

3’ 2019 67
neurodegenerative process, from the other side by not always correct usage of antiparkinsonian drugs treatment in pa-tients with emotional-affective disorders. While analyzing clinical form of PD debut we revealed that anxiety prevailed in pa-tients with acinetic-rigidity form.
Statistically significant positive mean force correlation between anxiety and depression was revealed both by HADS (r=0,446; p<0,0001) and BDI-II (r=0,436; p<0,0001) questionnaires. Statistically significant difference in severity of apa-thy in patients with clinically manifested anxiety 14 (7; 19), with subclinical anxiety – 12 (7; 15) and without anxiety – 8 (5; 14), p=0,001 (table 2) was also detected. The obtained results indicate that anxi-ety in PD more often is not a separate neuropsychological disorder but a part of depression structure.
That means PwPD and more ex-pressed anxiety usually have other emo-tional-affective disorders.
It was revealed that among our 206 researched patients with clinically signif-icant diagnosis of PD there were only 4 patients with identified suicidal intent in history according to Columbia suicide severity rating scale C-SSRS and sub-sequent interviewed physicians. Here-with no active suicidal attempts were observed in anamnesis of these patients. Our results prove the literary data that “suicidal thoughts are rarity for PwPD” [7].
Analysis of drug-induced dyskinesia prevalence in PwPD with anxiety demon-strated statistically more significant prev-alence (39,2%) in comparison with pa-tients without anxiety (17,2%), z=2,77; p=0,006.
Significant influence of anxiety on qual-ity of life in PwPD was revealed. Com-mon health status index by self-question-naire quality of life PDQ-39 in patients without anxiety was significantly lower in comparison with patients with subclin-ical and clinically manifested anxiety and means 28 (20; 44), 37 (26; 46) и 48 (39; 57) points, p<0,001 respectively. The more the total overall health status index is, the worse the quality of life of the sub-ject is (table 2).
Among studied PwPD with anxiety there are statistically more occurring im-pulsive behavior disorders such as gam-bling (p=0,004), hobbysm (p=0,042) and compulsive obsessive taking of dopami-nergic drugs within dofamin dysregula-tion syndrome (p=0,010) that correlates with literary data according to which anx-iety disorders can be manifested both by common anxiety and panic attacks, social phobia and obsessive-compulsive disorders. Although impulsive compul-
sive disorders are different from obses-sive-compulsive, there is phenomeno-logical duplication indicating community of certain neurobiologocal mechanisms. Both disorders have common diagnos-tic criteria such as “excessive behavior” leading to “significant deterioration” in the main areas of life [13].
Analysis of impulsive behavior disor-ders rate indicates that it occurs in 27% of cases (in 56 patients) with the majority prevailing in men: gambling was regis-tered in 6,7 %, among women – 2,7 %, p>0,05, hypersexuality – in 6,7 %, among women – 0,0 %, p>0,05, punding – in 20,0 %, among women – 8,1 %, p>0,05, hobbysm – in 20,0 %, among women – 5,4 %, p>0,05, dofamin dysregulation syndrome – in 20,0 %, among women – 13,5 %, p>0,05. Whereas among wom-en such disorders as shopping mania prevailed in women and occurs in 8,1 %; among men such impulsive behav-ior disorder was not registered in men p>0,05 and compulsive overeating was registered in women – 10,8 % was not registered in men – 0,0 %, p>0,05. It should be noted that there are no statis-tically significant differences between the groups of both men and women in terms of the prevalence of any behavioral dis-turbance.
According to literary data prevalence of depression is 3-10% among popula-tion [10]. On the early stages of PD de-pression occurs in 27,6% patients [15], on later stages in 40-50% of patients [5, 8]. The last one is characteristic for all stages of PD. At the same time, it was established that in 30% of cases the di-agnosis of depression preceded the first motor symptoms of PD. Emotional affec-tive disorders can manifest themselves in some cases 20 years before the motor manifestation, but on average this period
is 3–6 years [10]. According to the results of a study conducted at the Mayo Clin-ic, the risk of developing PD is 1.9 times higher in patients with depressive disor-ders, with anxious disorders - 2.2, and with both - 2.4 [9, 12].
Depression can be manifested by dys-thymia (the frequency of which is about 13% in PwPD), major (17%) and minor (22%) depressive disorders. About 35% of PwPD have clinically expressed de-pressive symptoms [12, 16], however, according to various literary, the propor-tion of patients with severe depression is 3-8%, reaching a psychotic level, and it does not end with suicide attempts. In patients with motor fluctuations, transient depression (“off-period”) occurs that is changes in depression and maniacal state, marked against the background of motor fluctuations [15].
One of the main problems that impede the diagnosis of depression in PD is sim-ilarity, common features inherent in de-pressive syndrome and PD: hypomimia, hypophony, decreased psychomotor activity, attention disorders, increased fatigue, decreased appetite, decreased libido and sleep disorder [3, 4, 13].
There is a point of view that depres-sion in PwPD does not depend on the age, duration of PD and severity of dis-ease [10]. However, some researchers claim that the most prevalence of this emotional and affective disorder occurs in patients with the initial stage of PD (first stage by Hoehn and Yahr scale). Such dependence can be explained by the importance of psychological factors in the development of depressive disor-ders in the early stages of PD associat-ed with the onset of the disease and the establishment of a diagnosis. Then it decreases slightly to stage II (due to the patient's internal adaptation to a chronic
Table 2
Severe apathy and characteristic of quality of life in people with Parkinson's disease, depending on the severity of anxiety, in points; - Me (Q1; Q3)
Normn=99
Subclinicalanxiety n=56
Clinicalanxietyn=51
Kruskal-Wallis Criteria Mann-Whitney
CriteriaМe (Q1;
Q3) Мe (Q1; Q3) Мe (Q1; Q3) χ² p
Apathy,points 8 (5;14) 12 (7;15) 14 (7;19) 13.193 0.001*
р1—2=0.093р1—3=0.002*р2—3=0.170
PDQ-39, points 28 (20;44) 37 (26;46) 48 (39;57) 32.704 <0.001*
р1—2=0.090р1—3<0.001*р2—3<0.001*
Note. In the Tables 2, 3 * - statistically significant differences at p <0.005. Quantitative attri-butes are presented in the form of a median and interquartile interval - Me (Q1; Q3).
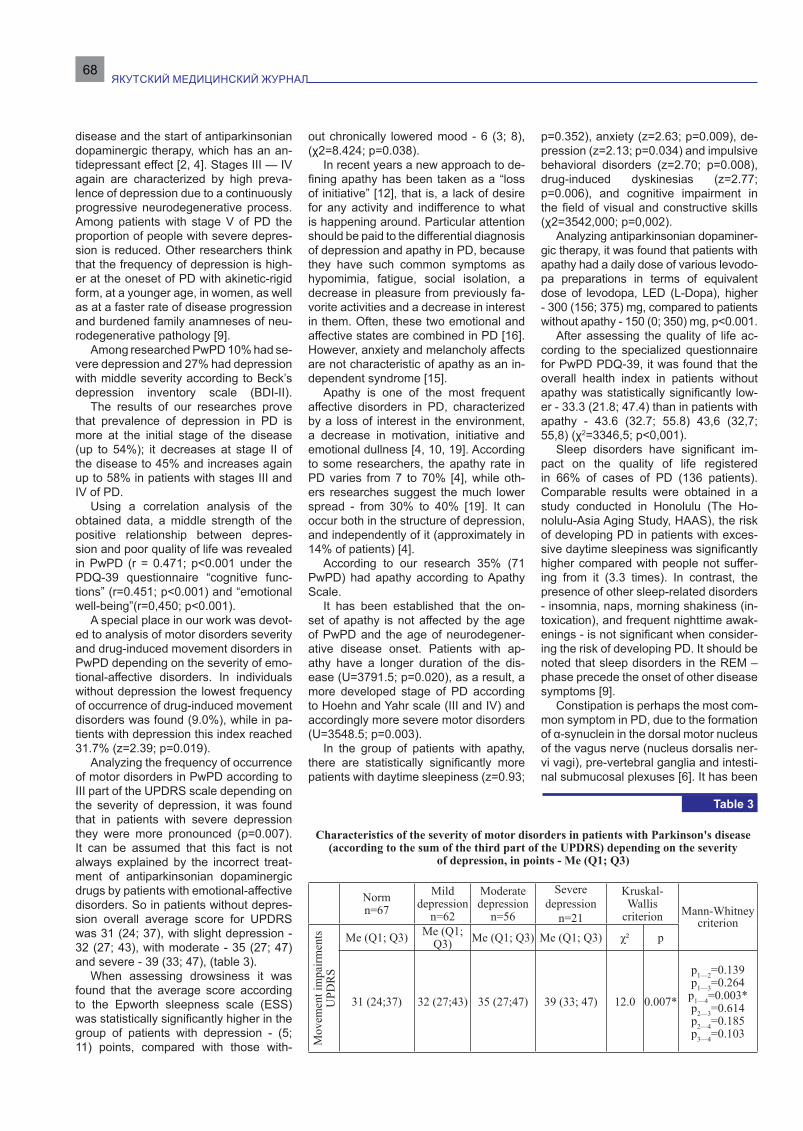
ЯКУТСКИЙ МЕДИЦИНСКИЙ ЖУРНАЛ68
disease and the start of antiparkinsonian dopaminergic therapy, which has an an-tidepressant effect [2, 4]. Stages III — IV again are characterized by high preva-lence of depression due to a continuously progressive neurodegenerative process. Among patients with stage V of PD the proportion of people with severe depres-sion is reduced. Other researchers think that the frequency of depression is high-er at the oneset of PD with akinetic-rigid form, at a younger age, in women, as well as at a faster rate of disease progression and burdened family anamneses of neu-rodegenerative pathology [9].
Among researched PwPD 10% had se-vere depression and 27% had depression with middle severity according to Beck’s depression inventory scale (BDI-II).
The results of our researches prove that prevalence of depression in PD is more at the initial stage of the disease (up to 54%); it decreases at stage II of the disease to 45% and increases again up to 58% in patients with stages III and IV of PD.
Using a correlation analysis of the obtained data, a middle strength of the positive relationship between depres-sion and poor quality of life was revealed in PwPD (r = 0.471; p<0.001 under the PDQ-39 questionnaire “cognitive func-tions” (r=0.451; p<0.001) and “emotional well-being”(r=0,450; p<0.001).
A special place in our work was devot-ed to analysis of motor disorders severity and drug-induced movement disorders in PwPD depending on the severity of emo-tional-affective disorders. In individuals without depression the lowest frequency of occurrence of drug-induced movement disorders was found (9.0%), while in pa-tients with depression this index reached 31.7% (z=2.39; p=0.019).
Analyzing the frequency of occurrence of motor disorders in PwPD according to III part of the UPDRS scale depending on the severity of depression, it was found that in patients with severe depression they were more pronounced (p=0.007). It can be assumed that this fact is not always explained by the incorrect treat-ment of antiparkinsonian dopaminergic drugs by patients with emotional-affective disorders. So in patients without depres-sion overall average score for UPDRS was 31 (24; 37), with slight depression - 32 (27; 43), with moderate - 35 (27; 47) and severe - 39 (33; 47), (table 3).
When assessing drowsiness it was found that the average score according to the Epworth sleepness scale (ESS) was statistically significantly higher in the group of patients with depression - (5; 11) points, compared with those with-
out chronically lowered mood - 6 (3; 8), (χ2=8.424; p=0.038).
In recent years a new approach to de-fining apathy has been taken as a “loss of initiative” [12], that is, a lack of desire for any activity and indifference to what is happening around. Particular attention should be paid to the differential diagnosis of depression and apathy in PD, because they have such common symptoms as hypomimia, fatigue, social isolation, a decrease in pleasure from previously fa-vorite activities and a decrease in interest in them. Often, these two emotional and affective states are combined in PD [16]. However, anxiety and melancholy affects are not characteristic of apathy as an in-dependent syndrome [15].
Apathy is one of the most frequent affective disorders in PD, characterized by a loss of interest in the environment, a decrease in motivation, initiative and emotional dullness [4, 10, 19]. According to some researchers, the apathy rate in PD varies from 7 to 70% [4], while oth-ers researches suggest the much lower spread - from 30% to 40% [19]. It can occur both in the structure of depression, and independently of it (approximately in 14% of patients) [4].
According to our research 35% (71 PwPD) had apathy according to Apathy Scale.
It has been established that the on-set of apathy is not affected by the age of PwPD and the age of neurodegener-ative disease onset. Patients with ap-athy have a longer duration of the dis-ease (U=3791.5; p=0.020), as a result, a more developed stage of PD according to Hoehn and Yahr scale (III and IV) and accordingly more severe motor disorders (U=3548.5; p=0.003).
In the group of patients with apathy, there are statistically significantly more patients with daytime sleepiness (z=0.93;
p=0.352), anxiety (z=2.63; p=0.009), de-pression (z=2.13; p=0.034) and impulsive behavioral disorders (z=2.70; p=0.008), drug-induced dyskinesias (z=2.77; p=0.006), and cognitive impairment in the field of visual and constructive skills (χ2=3542,000; p=0,002).
Analyzing antiparkinsonian dopaminer-gic therapy, it was found that patients with apathy had a daily dose of various levodo-pa preparations in terms of equivalent dose of levodopa, LED (L-Dopa), higher - 300 (156; 375) mg, compared to patients without apathy - 150 (0; 350) mg, p<0.001.
After assessing the quality of life ac-cording to the specialized questionnaire for PwPD PDQ-39, it was found that the overall health index in patients without apathy was statistically significantly low-er - 33.3 (21.8; 47.4) than in patients with apathy - 43.6 (32.7; 55.8) 43,6 (32,7; 55,8) (χ2=3346,5; p<0,001).
Sleep disorders have significant im-pact on the quality of life registered in 66% of cases of PD (136 patients). Comparable results were obtained in a study conducted in Honolulu (The Ho-nolulu-Asia Aging Study, HAAS), the risk of developing PD in patients with exces-sive daytime sleepiness was significantly higher compared with people not suffer-ing from it (3.3 times). In contrast, the presence of other sleep-related disorders - insomnia, naps, morning shakiness (in-toxication), and frequent nighttime awak-enings - is not significant when consider-ing the risk of developing PD. It should be noted that sleep disorders in the REM – phase precede the onset of other disease symptoms [9].
Constipation is perhaps the most com-mon symptom in PD, due to the formation of α-synuclein in the dorsal motor nucleus of the vagus nerve (nucleus dorsalis ner-vi vagi), pre-vertebral ganglia and intesti-nal submucosal plexuses [6]. It has been
Characteristics of the severity of motor disorders in patients with Parkinson's disease (according to the sum of the third part of the UPDRS) depending on the severity
of depression, in points - Me (Q1; Q3)
Normn=67
Mild depression
n=62
Moderatedepression
n=56
Severe depression
n=21
Kruskal-Wallis
criterion Mann-Whitney criterion
Mov
emen
t im
pairm
ents
U
PDR
S
Мe (Q1; Q3) Мe (Q1; Q3) Мe (Q1; Q3) Мe (Q1; Q3) χ² p
31 (24;37) 32 (27;43) 35 (27;47) 39 (33; 47) 12.0 0.007*
р1—2=0.139р1—3=0.264р1—4=0.003*р2—3=0.614р2—4=0.185р3—4=0.103
Table 3

3’ 2019 69
recently established that the pathology of α-synuclein can be detected by biopsy of the colon submucosa in patients with PD [9]. Studies have shown that constipation usually precedes the development of PD for more than 10–18 years [1, 2]. Ac-cording to the results of our study, it was found that 87% of patients with PD had these gastroenterological disorders (con-stipation was regarded as reduction of the bowel movements frequency to once or less a week). This is one of problems of current interest for patients with PD and their physicians, as problems with the evacuation function of the intestine lead to a decrease in the bioavailability of dopaminergic antiparkinsonian ther-apy, and, as a result, to a deterioration in the physical activity of PwPD. In ad-dition, interest to the studying of gastro-enterological disorders in PwPD remains on high level due to the fact that consti-pation, along with depression and olfac-tory disorders, is the “Non-motor stage” of PD, which already is the beginning of a systemic degenerative process pre-ceding the onset of motor disorders [1, 14]. Thus, according to the history of our patients, gastroenterological symptoms such as constipation, nausea, and flat-ulence were present 5–12 years before the clinical diagnosis of PD.
Conclusion. Questions about phe-nomenological independence of non-mo-tor disorders in PwPD, their pathophys-iological commonality with the motor manifestations of the disease due to the multifactorial nature of PD and insuffi-ciently developed approaches to therapy are very relevant today. Well-timed and adequate identification of risk factors for the progression of non-motor manifesta-tions of PD will allow correct therapy to be given to patients with high risk of their development. Thus in recent years the understanding of the essence of PD as a pathological, pathophysiological and de-veloping clinical process has significant-ly changed, covering not only the motor sphere, but also causing a violation of the vegetative regulation, obvious changes in the psychoemotional state of patients
and their behavior.Disclosure: The study was performed
with the support of Council on grants of the President of the Russian Federation (Grant № МК-813.2019.7, "Clinical and epidemiological features of neurodegen-erative diseases of the Tomsk region")
1. Анализ методов оценки обоняния у па-циентов с болезнью Паркинсона / И.А. Жукова, Н.Г. Жукова, О.П. Ижболдина [и др.]. Журнал неврологии и психиатрии имени С.С. Корса-кова. Выпуск 2. Неврология и психиатрия по-жилого возраста. 2015; 115(2): 47-52. [Methods for evaluating of olfactory function in patients with Parkinson’s disease / I.A. Zhukova, N.G. Zhukova, O.P. Izhboldina, [et al.]. S.S. Korsa-kov Journal of Neurology and Psychiatry. 2015; 115(2): 47-52; (In Russ.).] DOI: 10.17116/jnev-ro20151156244-49
2. Взаимосвязь эмоционально-аффектив-ных нарушений и микробиоты у пациентов с болезнью Паркинсона. Алифирова В.М., Жуко-ва Н.Г., Жукова И.А., Миронова Ю.С., Петров В.А. [и др.]. Вестник Российской академии медицинских наук. 2016; 71(6). [Correlation Be-tween Emotional-Affective Disorders and Gut Mi-crobiota Composition in Patients with Parkinson’s Disease / Alifirova V.M., Zhukova N.G., Zhukova I.A., Mironova Y.S. [et al.]. Annals of the Russian academy of medical sciences. 2016; 71(6). (In Russ.).] DOI: 10.15690/vramn734
3. Дифференциальная диагностика муль-тисистемной атрофии и эссенциального тре-мора с болезнью Паркинсона. Таппахов А.А., Николаева Т.Я., Алексеева А.Д., Оконешни-кова Л.Т. [и др.]. Якутский медицинский жур-нал. 2016; 2(54): 90-93. [Differential diagnosis of Multiple system atrophy and essential tremor with Parkinson’s disease (clinical cases). A.A. Tappakhov, T.Ya. Nikolaeva, A.D. Alexeeva, L.T. Okoneshnikova [et al.]. Yakut medical journal. 2016; 2(54): 90-93. (In Russ.).]
4. Лебедева Е.В., Счастный Е.Д., Симут-кин Г.Г., Репин А.Н., Нонка Т.Г. Клиническая характеристика аффективных расстройств и эффективность антидепрессивной терапии у больных хронической ишемической болез-нью сердца. Бюллетень сибирской медицины. 2018;17(4):85-93. [Lebedeva E.V., Schastnyy E.D., Simutkin G.G., Repin A.N., Nonka T.G. Clinical description of affective disorders and effi-ciency of antidepressant therapy. Bulletin of Sibe-rian Medicine. 2018;17(4):85-93. (In Russ.)] DOI: 10.20538/1682-0363-2018-4-85-93
5. Левин О.С. Болезнь Паркинсона: совре-менные подходы к диагностике и лечению / Левин О.С., Артемьев Д.В., Бриль Е.В., Кулуа Т.К. // Практическая медицина. 2017; 1 (102):
45-51. [Levin O.S. Parkinson's disease: modern approaches to diagnosis and treatment / O.S. Levin, D.V. Artemyev, E.V. Bril, T.K. Kulua. PM. 2017; 1 (102): 45-51. (In Russ.).]
6. Эпидемиология болезни Паркинсона в Республике Саха (Якутия) / Попова Т.Е., Тап-пахов А.А., Николаева Т.Я., Оконешникова Л.Т. [и др.] // Якутский медицинский журнал. 2017; 3(59): 98-101. [Epidemiology of Parkinson’s dis-ease in the RS(Ya) / Popova T.E., Tappakhov A.A., Nikolaeva T.Ya., Okoneshnikova L.T. [et al.] // Yakut medical journal. – 2017; 3(59): 98-101. (In Russ.)]
7. Fenelon, G. Epidemiology of psychosis in Parkinson's diseas. Fenelon, G., Alves, G. Jour-nal of the Neurological Sciences. 2010; 289(1-2): 12-17 DOI: 10.1016/j.jns.2009.08.014
8. Hauser, R. Determination of minimal clin-ically important change in early and advanced Parkinson's disease. Hauser, R. and Auinger, P. Mov. Disord. 2011; 26 (5): 813-818 DOI: 10.1002/mds.23638
9. Lang, A. A critical appraisal of the premotor symptoms of Parkinson's disease: Potential use-fulness in early diagnosis and design of neuropro-tective trials. Mov. Disord. 2011; 26(5): 775-783 DOI: 10.1002/mds.23609
10. Martínez-Martín, P. Parkinson disease: Depression and anxiety in Parkinson disease. Martínez-Martín, P. and Damián, J. Nature Re-views Neurology. 2010; 6(5): 243-245 DOI: 10.1038/nrneurol.2010.49
11. Merello M. Correlation between the Movement Disorders Society Unified Parkin-son’s Disease rating scale (MDS-UPDRS) and the Unified Parkinson’s Disease rating scale (UPDRS) during l-dopa acute challenge. Merello, M., Gerschcovich, E., Ballesteros, D. and Cerquetti, D. Parkinsonism & Related Dis-orders. 2011; 17(9): 705-707 DOI: 10.1016/j.parkreldis.2011.07.002
12. Nonmotor Symptoms in Parkinson’s Dis-ease in 2012: Relevant Clinical Aspects. Bonnet, A., Jutras, M., Czernecki, V., Corvol, J. and Vid-ailhet, M. Parkinson's Disease. 2012; 1(1):1-15 DOI: 10.1155/2012/198316
13. Parkinson disease: Neuropsychiatric and cognitive profiling of patients with early, untreat-ed Parkinson disease. Nature Reviews Neurol-ogy. 2015; 11(4): 186-186 DOI:10.1038/nrneu-rol.2015.47
14. Prevalence of smell loss in Parkinson's disease – A multicenter study. Haehner, A., Boesveldt, S., Berendse, H., Mackay-Sim, A., Fleischmann, J. [et al.]. Parkinsonism & Related Disorders. 2009; 15(7): 490-494 DOI: 10.1016/j.parkreldis.2008.12.005
15. Schapira, A. The measurement and im-portance of non-motor symptoms in Parkinson disease. Eur J Neurol. 2014: 22(1): 2-3. DOI: 10.1111/ene.12523
16. Tan L.C.S. Mood disorders in Parkinson's disease. Parkinsonism Relat Disord. 2012; 18: 1: 74–76 DOI: http: 10.1016/S1353-8020(11)70024-4
References

ЯКУТСКИЙ МЕДИЦИНСКИЙ ЖУРНАЛ70
ABSTRACT. There has been conducted a study of the age dynamics and characteristics of the of the bone mineral density (BMD) in the adult population of the Yakutsk city. There have been revealed the BMD maximum age rates in both women (aged between 40 and 49 years old) and men (aged between 60 and 69 years old). The first 10 years after menopause onset in women, BMD decreases by 18%. The correlation of body mass index and BMD depending on gender and ethnicity was revealed.
Keywords: bone mineral density, osteoporosis, body mass index, menopause.
Relevance. Yakutsk is acknowledged to be the largest city of central Yakutia. The climatic and geographical features of the location are known to be accompa-nied by a low level of insolation and a long winter period of 6-9 months per year [3, 4].
A low level of insolation is stated to lead to a deficiency in the synthesis of vitamin D, which in turn appears to be a trigger in the development of osteoporo-sis [7].
Osteoporosis is accepted to be one of the most common diseases which have been given a leading position in the structure of morbidity and mortality in the world [1, 6].
According to the International Os-teoporosis Foundation, more than 200 million people worldwide have been suf-fering from osteoporosis. In Russia, the number of patients with osteoporosis is estimated to be about 14 million. The ten-dency to increase the life expectancy of the population is admitted to result in an increase in the incidence of osteoporosis in postmenopausal women, as well as in men, in the older age group [12, 17].
Women are known to have a higher
risk of developing osteoporosis. This is supposed to be due to the peculiarities of the hormonal status; during the onset of menopause, the process of bone resorp-tion is acknowledged to be accelerated, the volume of bone mass is stated to de-crease, whereas the risk of fractures is accepted to increase [11].
The severity of osteoporosis is known to be caused by the presence of low-en-ergy fractures one of which appears to be a fracture of the proximal femur including the femoral neck fracture. Some epide-miological studies which have been con-ducted in a number of Russian cities have revealed significant differences in the prevalence of proximal femur fractures in a population over 50 years of age. On average, the incidence of proximal femur fractures among residents in the Russian Federation has been accessed to be 174.7 for men and 267.5 for women for 100 thousand people [18].
According to the undertaken multi-site epidemiological study, the incidence of fractures of the proximal femur in Yakutsk has been estimated to be 216.64 per 100 thousand people [8].
Considering that Yakutia has its cli-matic and geographical features (which are low insolation, type of nutrition, long winter period, remoteness of settlements, their inaccessibility), the need to study the problem of osteoporosis and its com-plications is supposed to be viewed as relevant both for the Republic of Sakha (Yakutia) and for Russia in general.
Objective: to identify the age and gender features of the dynamics of bone mineral density in the adult population of the city of Yakutsk.
Materials and methods: During the period of 2016-2017, in the Clinic of the Medical Institute of North-Eastern Feder-al University named after M.K. Ammosov Yakutsk, X-ray densitometry was per-formed in 868 patients. The analysis in-cluded data on 776 people aged 20 years and older, of which 22.7% were men and 79.3% were women. The distribution by
nationality is as follows: in most cases, there were investigated Yakuts (76%) and Russians (20%), whereas there were also examined 4% of patients of other nationalities. The survey was conducted on an X-ray axial densitometer Lunar GE iDXA (USA) with the study of the BMD in the lumbar spine L1-L4 (g/cm2) [13]. BMD was evaluated according to the WHO cri-teria (1970): in postmenopausal women and in men over 50 years old, the norm is T-test + 2.5-0.9 of standard deviations; osteopenia is -1.0 – -2.4 of standard de-viations: osteoporosis is T-criterion -2.5 and below. In women before menopause and in men younger than 50 years, the Z-test was evaluated [14].
In addition, there was calculated the body mass index, BMI according to WHO, 2004 (18.50-24.99 is a normal weight, 25.00-29.99 is overweight, ≥30.00 is obe-sity, 30.00-34.99 is the 1st degree, 35.00-39.99 – the 2nd degree, ≥40.00 – the 3rd degree) [15].
Apart from that, there was indicated the hormonal status of women and the presence of menopause (absence of the menstrual cycle after 12 months), distin-guishing between an early menopause up to 40–45 years old and a timely meno-pause at 46–54 years old [10].
In the course of collecting the histo-ry, there was revealed the presence of low-energy fractures (falling from the own height) as a risk factor for osteoporosis [11].
Checking the normality of the distri-bution of quantitative variables was im-plemented using Kolmogorov-Smirnov, Shapiro-Wilk with the amendment of Lil-io-Fords. The descriptive statistics were presented in the form of Median (Me) and interval distribution (Q1; Q3). In the course of comparing independent groups, the Kruskal-Wallis test was used. To as-sess the strength of the direction of the relationship between the variables, the Spearman rank analysis was used. The level of the statistical significance of dif-ferences was compared to p = 0.05.
V.V. Epanov, A.P. Borisova, A.A. Epanova, G.A. Palshin
AGE-RELATED DYNAMICS OF BONE MINERAL DENSITY IN THE ADULT POPULATION OF YAKUTSKDOI 10.25789/YMJ.2019.67.21
EPANOV Viktor Vladimirovich, Candidate of Medical Sciences, Head of Scientific Lab-oratory of osteoporosis of the Clinic of the Medical Institute of North-Eastern Federal University, Associate Professor of the Depart-ment of Public Health and Health Care, Gen-eral Hygiene and Bioethics; 36 Kulakovskogo str., Yakutsk, Russia; +7 (4112) 49-66-55, +79141770273, e-mail: [email protected]; BORISOVA Afrafena Pavlovna, master student of North-Eastern Federal University named after M.K. Ammosov, Medical Institute, Yakutsk, Russia +79644236965; EPANOVA Anastasia Aleksandrovna, Candidate of Medical Sciences, Associate Professor of the Department of Organic Chemistry and Radia-tion Diagnostics; 27 Oiunskogo str., Yakutsk, Russia ; +7 (4112) 49-66-55, +79141770273. PALSHIN Gennady Anatolyevich, MD, Pro-fessor, Head of the Department of TO and DM MI NEFU named after M.K. Ammosov. Yakutsk, st. Oyunskogo, 27.8 (4112) 49-67-65.
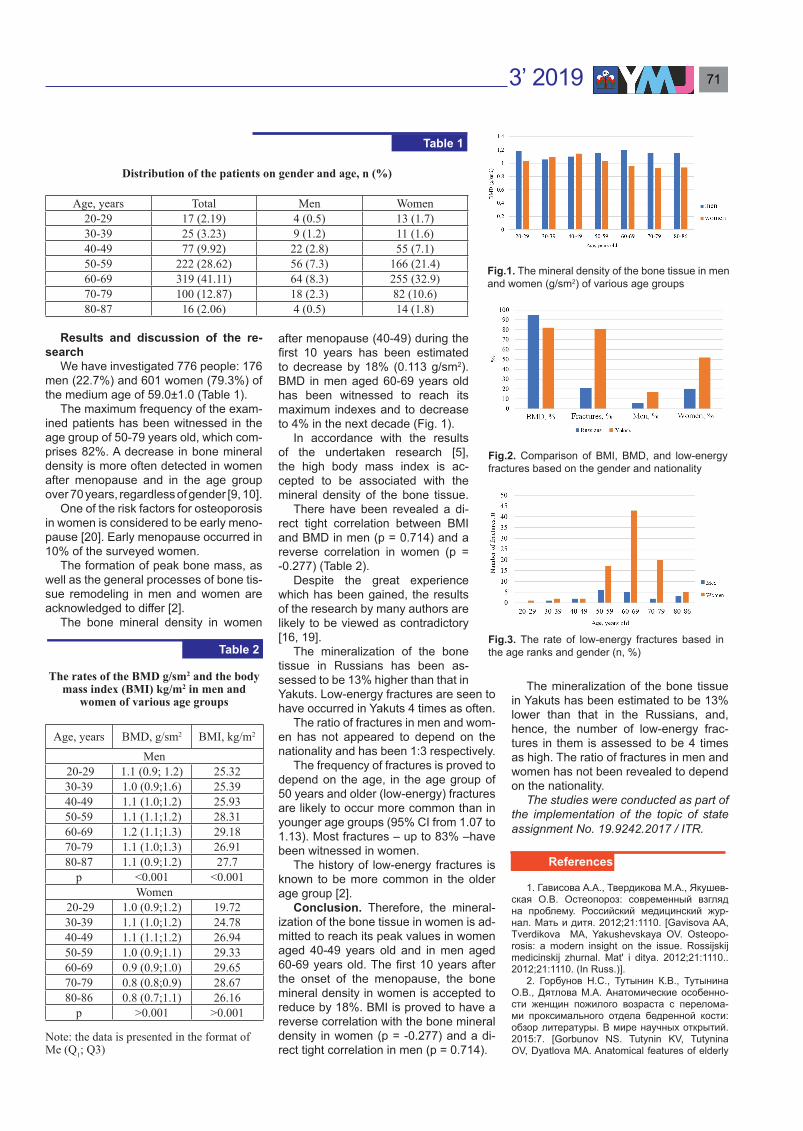
3’ 2019 71
Results and discussion of the re-search
We have investigated 776 people: 176 men (22.7%) and 601 women (79.3%) of the medium age of 59.0±1.0 (Table 1).
The maximum frequency of the exam-ined patients has been witnessed in the age group of 50-79 years old, which com-prises 82%. A decrease in bone mineral density is more often detected in women after menopause and in the age group over 70 years, regardless of gender [9, 10].
One of the risk factors for osteoporosis in women is considered to be early meno-pause [20]. Early menopause occurred in 10% of the surveyed women.
The formation of peak bone mass, as well as the general processes of bone tis-sue remodeling in men and women are acknowledged to differ [2].
The bone mineral density in women
after menopause (40-49) during the first 10 years has been estimated to decrease by 18% (0.113 g/sm2). BMD in men aged 60-69 years old has been witnessed to reach its maximum indexes and to decrease to 4% in the next decade (Fig. 1).
In accordance with the results of the undertaken research [5], the high body mass index is ac-cepted to be associated with the mineral density of the bone tissue.
There have been revealed a di-rect tight correlation between BMI and BMD in men (р = 0.714) and a reverse correlation in women (р = -0.277) (Table 2).
Despite the great experience which has been gained, the results of the research by many authors are likely to be viewed as contradictory [16, 19].
The mineralization of the bone tissue in Russians has been as-sessed to be 13% higher than that in Yakuts. Low-energy fractures are seen to have occurred in Yakuts 4 times as often.
The ratio of fractures in men and wom-en has not appeared to depend on the nationality and has been 1:3 respectively.
The frequency of fractures is proved to depend on the age, in the a ge group of 50 years and older (low-energy) fractures are likely to occur more common than in younger age groups (95% CI from 1.07 to 1.13). Most fractures – up to 83% –have been witnessed in women.
The history of low-energy fractures is known to be more common in the older age group [2].
Conclusion. Therefore, the mineral-ization of the bone tissue in women is ad-mitted to reach its peak values in women aged 40-49 years old and in men aged 60-69 years old. The first 10 years after the onset of the menopause, the bone mineral density in women is accepted to reduce by 18%. BMI is proved to have a reverse correlation with the bone mineral density in women (p = -0.277) and a di-rect tight correlation in men (р = 0.714).
The mineralization of the bone tissue in Yakuts has been estimated to be 13% lower than that in the Russians, and, hence, the number of low-energy frac-tures in them is assessed to be 4 times as high. The ratio of fractures in men and women has not been revealed to depend on the nationality.
The studies were conducted as part of the implementation of the topic of state assignment No. 19.9242.2017 / ITR.
1. Гависова А.А., Твердикова М.А., Якушев-ская О.В. Остеопороз: современный взгляд на проблему. Российский медицинский жур-нал. Мать и дитя. 2012;21:1110. [Gavisova AA, Tverdikova MA, Yakushevskaya OV. Osteopo-rosis: a modern insight on the issue. Rossijskij medicinskij zhurnal. Mat' i ditya. 2012;21:1110.. 2012;21:1110. (In Russ.)].
2. Горбунов Н.С., Тутынин К.В., Тутынина О.В., Дятлова М.А. Анатомические особенно-сти женщин пожилого возраста с перелома-ми проксимального отдела бедренной кости: обзор литературы. В мире научных открытий. 2015:7. [Gorbunov NS. Tutynin KV, Tutynina OV, Dyatlova MA. Anatomical features of elderly
Distribution of the patients on gender and age, n (%)
Age, years Total Men Women20-29 17 (2.19) 4 (0.5) 13 (1.7)30-39 25 (3.23) 9 (1.2) 11 (1.6)40-49 77 (9.92) 22 (2.8) 55 (7.1)50-59 222 (28.62) 56 (7.3) 166 (21.4)60-69 319 (41.11) 64 (8.3) 255 (32.9)70-79 100 (12.87) 18 (2.3) 82 (10.6)80-87 16 (2.06) 4 (0.5) 14 (1.8)
Table 1
Fig.1. The mineral density of the bone tissue in men and women (g/sm2) of various age groups
The rates of the BMD g/sm2 and the body mass index (BMI) kg/m2 in men and
women of various age groups
Age, years BMD, g/sm2 BMI, kg/m2
Men 20-29 1.1 (0.9; 1.2) 25.3230-39 1.0 (0.9;1.6) 25.3940-49 1.1 (1.0;1.2) 25.9350-59 1.1 (1.1;1.2) 28.3160-69 1.2 (1.1;1.3) 29.1870-79 1.1 (1.0;1.3) 26.9180-87 1.1 (0.9;1.2) 27.7
р <0.001 <0.001Women
20-29 1.0 (0.9;1.2) 19.7230-39 1.1 (1.0;1.2) 24.7840-49 1.1 (1.1;1.2) 26.9450-59 1.0 (0.9;1.1) 29.3360-69 0.9 (0.9;1.0) 29.6570-79 0.8 (0.8;0.9) 28.6780-86 0.8 (0.7;1.1) 26.16
p >0.001 >0.001
Note: the data is presented in the format of Me (Q1; Q3)
Fig.2. Comparison of BMI, BMD, and low-energy fractures based on the gender and nationality
Fig.3. The rate of low-energy fractures based in the age ranks and gender (n, %)Table 2
References

ЯКУТСКИЙ МЕДИЦИНСКИЙ ЖУРНАЛ72
women with fractures of the proximal femur (Lit-erature review). V mire nauchnyh otkrytij. 2015:7. (In Russ.)].
3. Егоров Е.Г., Пономарева Г.А., Федорова Е.Н. Географическое положение Республики Саха (Якутия) и его уникальность. Региональ-ная экономика. 2009;14(107):16-19. [Egorov EG, Ponomareva GA, Fedorova EN. The geo-graphical position of the Republic Sakha (Yaku-tia) and its uniqueness. Regional'naya ekonomi-ka.2009;14(107):16-19. (In Russ.)].
4. Иванов В.Н. Историко-культурный атлас Якутии. М: Из-во Феория. 2007:112. [Ivanov VN. Historical and cultural atlas of Yakutia. M: Iz-vo Feoriya, 2007:112.(In Russ.)].
5. Климонтов В.В., Фазуллина О.Н. Взаи-мосвязь композитного состава тела с мине-ральной плотностью костной ткани у женщин с сахарным диабетом 2-го типа в постменопа-узе. Сахарный диабет. 2015;1:65-69. [Klimontov VV, Fazullina ON. Correlation of composite body composition with bone mineral density in post-menopausal women with type 2 diabetes mellitus. Saharnyj diabet. 2015;1:65-69. (In Russ.)].
6. Лесняк О.М. Остеопороз: руководство для врачей. М.: ГОЭТАР-Медиа, 2016:464. [Lesnyak OM. Osteoporosis: the guidelines for doctors. M.: GOETAR-Media, 2016:464. (In Russ.)].
7. Лесняк О.М. Профилактика, диагностика и лечение дефицита витамина Д и кальция у пациентов с остеопорозом. Рекомендации Российской ассоциации по остеопорозу. М.: ГЭОТАР-Медиа, 2016:94. [Lesnyak O.M. Pre-vention, diagnostics, and treatment of vitamin D and calcium deficiency in patients with osteo-porosis . Recommendations on osteoporosis by the Russian association. M.: GOETAR-Media, 2016:94.(In Russ.)].
8. Лесняк О.М., Лебедев А.К., Галстян Р. Эпидемиология переломов проксимального отдела бедренной кости в странах региона по результатам многоцентрового эпидемиоло-гического исследования ЭВА. Остеопороз и остеопатии. 2016;2:16. [Lesnyak OM, Lebedev AK, Galstyan R. Epidemiology of proximal femur
fractures in countries of the region according to the results of a multicenter epidemiological study in Eurasia. Osteoporoz i osteopatii. 2016; 2:16. (In Russ.)].
9. Лесняк О.М., Торопцова Н. В. Диагно-стика, лечение и профилактика остеопороза в общей врачебной практике: клинич. реко-менд. 2014:4-17. [Lesnyak OM, Toroptsova NV. Diagnostics, treatment, and prevention of oste-oporosis in the general medical practice: klinich. rekomend. 2014:4-17. (In Russ.)].
10. Мирзаева Ю. К. Особенности развития остеопороза у женщин в климактерическом периоде. Молодой ученый. 2017;18:123-125. — URL https://moluch.ru/archive/152/43071/ (дата обращения: 18.04.2019). [Mirzaeva YuK. Features of the osteoporosis development in menopausal women. Molodoj uchenyj. 2017; 18:123-125. (In Russ.)]. - URL https://moluch.ru/archive/152/43071/ (accessed on 18.04.2019).
11. Беневоленская ЛИ, Лесняк О.М. Осте-опороз. Диагностика, профилактика и лече-ние: клинич. рекоменд. М.: ГОЭТАР-Медиа. 2009:272. [Benevolenskaya LI, Lesnyak OM. Osteoporosis. Diagnostics, prevention, and treat-ment: klinich. rekomend. M.: GOETAR-Media. 2009:272. (In Russ.)].
12. Лесняк О.М., Беневоленская Л.И. Осте-опороз в Российской Федерации: проблемы и перспективы. Науч.-практич. ревматоло-гия.2010; 5: 14. DOI: 10.14412/1995-4484-2010-725. [Lesnyak OM, Benevolenskaya L.I. Osteo-porosis in the Russian Federation: problems and perspectives. Nauch.-praktich. revmatologiya. 2010; 5: 14. (In Russ.)].
13. Петак С. М. Денситометрия: интерпре-тация результатов исследования. Остеопороз и остеопатии. 2004;2:11-13. [Petak S.M. Densi-tometry: interpretation of the research results. Os-teoporoz i osteopatii. 2004; 2:11-13. (In Russ.)].
14. Сухих Г.Т., Сметник В.П., Андреева Е.Н. Менопаузальная гормонотерапия и со-хранение здоровья женщин в зрелом возрас-те: клинич. рекоменд. М. 2015:49. [Sukhikh GT, Smetnik VP, Andreeva EN. Menopausal hormone therapy and the preservation of the health of
women in adulthood» clinical recommendations. M. 2015:49. (In Russ.)].
15 Самородская И.В., Болотова Е.В., Бой-цов С.А. Актуальные вопросы классификации ожирения. Кардиоваскулярная терапия. 2015; 14(4):103-110. [Samorodskaya IV, Bolotova EV, Bojtsov S.A. Topical issues of obesity clas-sification. Kardiovaskulyarnaya terapiya. 2015; 14(4):103-110. (In Russ.)].
16. Скрипникова И.А., Птичкина П.А., Ми-трохина Т.В., Колтунов И.Е. Метаболические эффекты менопаузы: роль маркеров жирового обмена в развитии остеопороза. Профилакти-ческая медицина. 2011;14(2):11-16. [Skripniko-va IA, Ptichkina PA, Mitrokhina TV, Koltunov IE. The metabolic effects of menopause: the role of fat metabolism markers in the development of osteoporosis. Profilakticheskaya medicina. 2011; 14(2):11-16. (In Russ.)].
17. Гребенникова Т.А., Белая Ж.Е., Ро-жинская Л.Я. [и др.] Эпигенетические аспек-ты остеопороза. Вестник РАМН. 2015;70 (5): 541–548. Doi: 10.15690/vramn.v 70.i5.1440 [Grebennikova TA, Belaya ZE, Rozhinskaya LY. [et al.] Epigenetic aspects of osteoporosis Vestnik RAMN. 2015; 70 (5): 541–548. (In Russ.)].
18. Лесняк О.М., Ершова О. Б., Белова К. Ю. [и др.] Эпидемиология остеопоротических переломов в Российской Федерации и россий-ская модель FRAX. Остеопороз и остеопатии. 2014;3:3-8. [Lesnyak OM, Ershova OB, Belova KY. [et al.] Epidemiology of osteoporotic fractures in the Russian Federation and the Russian model of FRAX. Osteoporoz i osteopatii. 2014; 3:3-8. (In Russ.)].
19. Tomlinson DJ, Erskine RM, Morse CI, Onambélé GL. Body Fat Percentage, Body Mass Index, Fat Mass Index and the Ageing Bone: Their Singular and Combined Roles Linked to Physical Activity and Diet. Nutrients. 2019; 11:195.
20. Svejme O. Ahlborg HG, Nillson JA, Karls-son MK. Early menopause and risk of osteoporo-sis, fracture and mortality: a 34-year prospective observational study in 390 women. An Interna-tional Journal of Obstetrics and Gynaecology. 2012; 119(7):810-6.

3’ 2019 73
The article analyzes the risk factors for the development of gallstone disease on the example of patients of the surgical ward the Republican hospital No.1 – NCM (Yakutsk, Russia) after cholecystectomy. It presents data on the analysis of the organic composition of gallstones using infra-red spectrometry. It was revealed that gallstone disease is most common in hypersthenic women of the second adult stage, every third patient has a burdened familial history. Most of the examined stones were cholesterol ones. Analysis, synthesis, and accumulation of analytical material will bring to an understanding of the pathogenetic mechanisms of gallstones in the indigenous population, the role of endogenous and environmental factors, timely prevention and effective treatment of gallstone disease.
Keywords: gallstone disease, sludge, lithogenic bile, risk factors, chemical composition of gallstones, IR spectroscopy.
Introduction. In modern conditions, there is an increase in the incidence of gallstone disease in the Sakha (Yakutia) Republic, which can be attributed to the urbanization of the population and chang-es in the diet of the indigenous population of the Republic. Historically, the indige-nous peoples of the North have devel-oped a protein-lipid type of exchange according to the nature of their diet, due to the consumption of venison, fish prod-ucts that are hypoallergenic and easi-ly digestible products containing large amounts of polyunsaturated fatty acids. The separation of the inhabitants of the indigenous nationality from the natural habitat, traditional way of life and food ration cause their growth of the digestive system diseases [3, 9]. Currently, gall-stone disease has become a social prob-
lem among the indigenous people of the Sakha (Yakutia) Republic. In the Russian Federation, the frequency of chronic cal-culous cholecystitis is about 12–20% [2]. As a rule, in the initial stages of gallstone disease, it is asymptomatic and is detect-ed by chance with an ultrasound exam-ination of the abdominal cavity organs. The generally accepted risk factors for gallstones are female gender, age over 50, obesity, multiple pregnancies, liver diseases (cirrhosis, hepatitis), and infec-tions (giardiasis, amebiasis, opisthorchi-asis, ascariasis, echinococcosis) [9, 10, 11, 14]. However, further research of the etiological and environmental factors of gallstone disease, chemical composition of gallstones, elucidation of the mecha-nisms of education, detection of gallstone disease at at an early stage, before the formation of stones, when it is possible to successfully use organ preservation, and conservative treatment methods remains relevant and needs to be clarified.
Research Objective: identify risk factors for gallstone disease and estab-lish their priority importance, identify the features of the elemental composition of stones using IR spectrometry on the ex-ample of patients after cholecystectomy of the surgical ward of the FRH (NHC).
Study Materials: Using the surgical ward of FRH (NHC), we conducted a sur-vey of 77 patients with gallstone disease in the period from February 4 to April 15, 2019. The majority of the studied were representatives of the indigenous na-tionality – 64 (83.1%). The respondents were asked to answer questions from a test questionnaire adapted to identify risk factors for gallstone disease. The calcu-lation of body mass index (I) was deter-mined using the formula I = m/h², where
m is the body weight in kilograms and the height in meters. The study examined 11 samples of stones obtained after chole-cystectomy of the patients surveyed. The organic status of the samples was deter-mined by the method of IR spectrosco-py using a Spotlight 200i IR microscope with an MCT-detector based on the FTIR SPECTRUM Two spectrometer in the Training Laboratory of Biophysics of NE-FU’S Physics-Technical Institute.
Results and Discussion. The results of the data obtained revealed that fe-males are more susceptible to gallstone disease than men. Thus, during the study period, 66 (85.7%) turned out to be in the female department; 11 (14.3%) were males. When analyzing the data obtained, the relationship between the frequency of occurrence of gallstones and female reproductive activity was re-vealed. So, out of 66 women surveyed, 40.9% had births up to 3 times, 48.5% from three or more times, whereas only 10.6% did not give birth. Perhaps this is due to both the increased lithogenicity of bile and dyskinesia of the biliary tract against the background of changing hor-monal levels. The lithogenicity of bile in-creases during pregnancy by increasing the level of estrogen, which increases cholesterol transition through the sinu-soidal membrane of hepatocytes, which leads to its saturation in bile, reducing the synthesis of fatty acids, changing the biochemical composition of bile and the formation of stones from cholesterol crys-tals [6, 8]. Hypokinesia of the gallblad-der and biliary tract during pregnancy also contribute to the formation of biliary sludge, and subsequently the formation of gallstones [5].
According to our data gallstone dis-
D.K. Garmaeva, A.A. Alexeev, I.S. Zakharova, T.I., Popova, V.A. ArsakovaANALYSIS OF GALLSTONE DISEASE RISK FACTORS USING SAMPLES FROM PATIENTS AFTER CHOLECYSTECTOMY AT REPUBLIC HOSPITAL №1- NCM SURGICAL WARD (YAKUTSK)DOI 10.25789/YMJ.2019.67.22
GARMAEVA Darima Kyshektovna, Doc-tor of Medical Sciences, Professor at Medi-cal Institute of M.K. Ammosov North-Eastern Federal University, [email protected], +7-914-234-96-80; ALEKSEEV Aleksandr Alek-seevich, Candidate of Biological Sciences, Docent at Physical-Technical Institute of M.K. Ammosov North-Eastern Federal University, [email protected], +7-914-275-71-18; ZAKHAROVA Irina Sergeevna, Medical In-stitute of M.K. Ammosov North-Eastern Fed-eral University, an undergraduate student of General Medicine-16-03-1, [email protected], +7-964-417-77-04; POPOVA Ta-tiana Igorevna, Medical Institute of M.K. Am-mosov North-Eastern Federal University, an undergraduate student of General Medicine: 16-03-1, [email protected], +7-996-316-72-39; ARSAKOVA Viktoriia Anatolevna, Med-ical Institute of M.K. Ammosov North-Eastern Federal University, an undergraduate student of General Medicine: 16-03-1, [email protected], +7-964-424-80-45

ЯКУТСКИЙ МЕДИЦИНСКИЙ ЖУРНАЛ74
ease among the interviewed patients mainly occurs in the age period from 36 to 74 years. This is due to an increased level of bile acid formation, that is, an increase in the lithogenic bile mainly in the elderly. According to the literature, the metabolism slows down and disrupts over the years, the activity of enzyme systems is significantly reduced, in par-ticular, the main enzyme for the synthesis of bile acids, which in turn keep choles-terol in bile in a dissolved state [1]. In ad-dition, the incidence of gallstone disease with increasing age is due to the evolu-tionary processes of the gallbladder, re-ducing the body’s need for cholesterol, as in building material, which increases its concentration in bile [2, 5].
According to the survey, we can talk about the hereditary factor. It turned out that 36 (46.8%) patients have close rel-atives with gallstones in history. From lit-erary sources, it is known that there is a gene for the lithogenic bile. Disruption of cholesterol metabolism is associated with the polymorphism of apolipoprotein E (Apo-E), which is genetically determined and determines the nature of changes in cholesterol metabolism. It has been prov-en that differences in cholesterol metabo-lism in different Apo-E phenotypes affect bile cholesterol secretion and its stability in bile [4, 10].
According to our data, among the examined patients who indicated their height and weight, 77.3% turned out to be individuals with hypersthenic type, 18.7% with normosthenic type, 4% with asthenic type. Thus, gallstone disease occurs mainly in individuals with a BMI > 24.9. It is known that obesity is most of-ten associated with increased synthesis and excretion of cholesterol. Its excess is transferred in phospholipid vesicles, which are unstable, easily aggregated. At the same time, large multi-layered bub-bles are formed, from which cholesterol monohydrate crystals precipitate, creat-ing the basis for the biliary sludge. While maintaining the conditions supporting the processes of lithogenesis, gallstones form over time [5].
Of the patients we surveyed, 63.6% lead an inactive lifestyle, 10.4% have high physical activity, and 26% have av-erage physical activity. Thus, a sedentary lifestyle leads to the formation of gall-stones. This explains the opinion that as a result of physical inactivity, the rate of bile evacuation from the gallbladder de-creases and, as a result, the concentra-tion of bile increases.
As a result of our study, it was found that the patients examined mainly con-sumed flour (59.7%) dairy (59.7%),
strong tea (51.7%), meat (48.1%), fried foods (40.3 %). There was little plant food in their diet. It is known that the formation of gallstones is associated with a low con-tent of fiber in food and a longer passage of food through the gastrointestinal tract, which contributes to increased absorp-tion of secondary bile acids (deoxycho-lic) and makes bile more lithogenic. Fatty foods increase the level of lipids in the blood, respectively, increases the content of cholesterol in bile, which changes its normal ratio to cholates, increasing the lithogenicity of bile. Analysis of the multi-plicity of nutrition of patients showed that more than half of patients eat 4-5 times a day. As is known, the number of evacua-tions of bile per day is multiple to meals, therefore, with rare consumption of food, bile becomes concentrated.
Analysis of bad habits showed that about half of patients have addictive ad-dictions, such as drinking alcohol (26%), smoking (18%), and both of them (11%). Alcohol and smoking lead to a decrease in high-density lipoproteins, narrowing of blood vessels and, as a result, to their obliteration. When vascular inflammation occurs, lipoprotein receptors are acti-vated for low-density lipoproteins (LDL), very low-density lipoproteins (VLDL). Next, cholesterol is separated from them, and settles in the inner lining of the ves-sels and contributes to the development of atherosclerosis. Due to this process, the level of LDL and VLDL in the blood-stream increases, which leads to hyper-cholesterolemia, which is one of the main factors for the formation of cholesterol stones [12, 13, 14].
Considering that the quantity and qual-ity of water consumed can to some extent influence the formation of gallstones, we have analyzed the drinking regime of the interviewed patients. It was revealed that more than 51.9% of patients consume less than 1200 ml per day. At the same time, mainly the examined patients use river water (28.6%), bottled (36.4%), fil-tered (28.6%), lake water (28.6%), which contain a small number of mineral sub-stances (including sulfate, sulfate-chlo-ride compounds) (Fig.4). These com-pounds enhance bile formation and bile secretion, reduce the level of total cho-lesterol in the blood. Moreover, perhaps, the use of insufficient amounts of water leads to a thickening of bile and conse-quently the formation of stones.
Analysis of comorbidities showed that 20.7% of the interviewed patients suffer from hypertension. The results obtained are consistent with the opinion that the predisposing factor for the development of gallstones is the presence of hyperten-
sion, which develops, as a rule, in obe-sity and overweight, as a result of which an elevated level of cholesterol and a change in the lipid profile are observed in the blood. The overwhelming majority of respondents (64.9%) have impaired stool, manifested mainly by constipation (76%), which is a manifestation of de-creased contractility of the gallbladder and lack of bile in the intestine. Accord-ing to our data, cholecystitis (42.5%) and pancreatitis (38.9%) were the most com-mon background diseases in patients with gallstones, due to the characteristics of the anatomy and topography of the gallbladder and pancreas ducts. This is followed by gastritis (32.5%), which is ex-plained not only by the dysfunction of the sphincter of Oddi in gallstone disease but also by impaired duodenal motor activi-ty, which leads to duodenogastric reflux. The above diseases are a consequence of gallstone disease [7].
IR absorption spectra of three stones of different chemical composition are pre-sented in Figures 1-3. respectively. The peak of the cholesterol, bilirubin, mixed wavelengths corresponds to the values indicated in the literature [14]. Based on these data, we identified the type of stones. The results of IR spectrometry showed that 9 (81.8%) of 11 stones are cholesterol, 1 (9.1%) concrement was bil-irubin and 1 (9.1%) was mixed [12].
Fig. 1 shows the IR spectrum of sam-ple gall_1. The IR spectrum of the exam-ined gallstone sample contains absorp-tion bands in the 3401, 2933, and 2902, 2867, 2849 cm-1 oscillations, which cor-respond to asymmetric and symmetric C–H bonds in the CH2 and CH3 groups of cholesterol. Intensive absorption bands at 1466 cm-1 and the absorption band at 1377 cm-1 are related to ring deformation of cholesterol and deformation vibrations of C–H bonds in the CH2 group of choles-terol, respectively. The intense absorp-tion band at 1057 cm-1 is characteristic of the C–C vibrations of the ring bonds in the cholesterol molecule.
The intense absorption bands at 3302 and 2931 cm-1 observed in the IR spec-trum of the gall-3 sample (Fig. 2) corre-spond to the stretching vibrations of the pyrrole NH group in bilirubin. Oscillations in the region of 1662 cm-1 and 1628 cm-1 are characteristic of vibrations of the O–C=O bonds in the bilirubin molecule and the absorption band at 1571 cm-1 corre-sponds to the stretching vibrations of the C=C bonds in the calcium bilirubinate molecule. The absorption band in the oscillation region of 1250...1235 cm-1 is characteristic of asymmetric stretching vibrations of the COOH group in the bil-

3’ 2019 75
Fig. 3. IR spectrum of mixed stone (gall_8)
irubin molecule, as well as for vibrations of the ν(C–O), ν(C–H), δ(N–H) bonds in the molecule calcium bilirubinate.
The infrared spectrum of the gallstone of sample gall_8 (Fig. 3) shows the char-acteristic infrared absorption spectrum of mixed gallstones. The absorption bands
at 3395 cm-1 and 2932 cm-1 are due to the asymmetric stretching of CH2 and the asymmetric stretching of CH3. and the absorption band at 2867 cm-1 aris-es due to the symmetric stretching of CH2. Calci-um bilirubinate has char-acteristic bands at 1250 cm-1 (amide III), which is associated with stretching (C–O) or stretching C–N in combination with the defor-mation of N–H (C – N) [M. A. Subhan 1,2 *, P. Sarker, and T. Ahmed]. The ab-sorption band at 1378 cm-1 is explained by the bending (CH3) vibration of choles-terol in a mixed gallstone.
Conclusion. Our anal-ysis showed that gallstone disease is a polietiologic disease. According to our data, the leading factors re-flecting the risk of calculus are age, gender, lifestyle, and hereditary predisposi-tion. So, gallstone disease is most common in hyper-sthenic women of the sec-ond mature age (50%) and identified the relationship of the frequency of occur-rence of gallstones with the reproductive activity of women.
In addition, important risk factors for the occur-rence of gallstones are lifestyle hypodynamia (in 63.6% of respondents), which undoubtedly affect the reduction of bile evac-uation. Also, the consump-tion of foods rich in animal fats is observed in almost all the examined patients. This diet leads to a vio-lation of fat metabolism, which is the main cause of increasing cholesterol lev-els in body fluids, including bile, whose lithogenicity increases. Low fluid intake (in 52% of the examined) leads to the loss of its body and, as a result, the con-
densation of all body fluids, including bile. It was revealed that gallstone disease
is closely associated with such patholo-gies of the digestive system, such as cho-lecystitis (41.5%), pancreatitis (38.9%), gastritis (32.5%), hepatitis (13%), con-
stipation (76%), which may complicate the course of the disease being studied. In addition, many of the interviewed pa-tients suffer from hypertension (20.7%), which may contribute to stone formation.
We have begun studies on the ele-mental composition of gallstones. The results of IR spectroscopy showed that most of the stones studied are cholester-ol (81.8%).
Thus, identifying the features of litho-genesis will bring us closer to under-standing the pathogenetic mechanisms of gallstone disease, the role of endog-enous, environmental and technological factors in the formation of micro-elemen-tal imbalances, as well as the correct choice of treatment tactics for patients with gallstone disease.
1. Вахрушев Я.М., Хохлачева Н.А. Желчно-каменная болезнь: эпидемиология, факторы риска, особенности клинического течения, профилактика. Архив внутренней медицины. 2016; 3(29):30-35. [Vakhrushev YM, Khokhlache-va NA. Gallstone Disease: Epidemiology, Risk Factors, Clinical Features, Prevention. Arhiv vnu-trennej mediciny. 2016; 3(29):30-35. (In Russ.).] DOI: 10.20514/2226-6704-2016-6-3-30-35
2. Гребенев А.Л. Пропедевтика внутрен-них болезней: Учебник. М.: Медицина.2001. [Grebenev AL. Propedeutics of Internal Diseases: Textbook. M.: Medicine.2001. (In Russ.).]
3. Мараховский Ю.Х. Желчнокаменная болезнь: современное состояние проблемы. Российский Журнал гастроэнтерологии, гепа-тологии, колопроктологии. 2003; 13(1):81–92. [Marakhovsky YH. Gallstone Disease: Current State of the Problem. Rossijskij ZHurnal gastro-jenterologii, gepatologii, koloproktologii. 2003; 13(1):81–92] (In Russ.).]
4. Селезнева Э. Я., Ильченко А. А. Желчно-каменная болезнь, сочетающаяся с язвенной болезнью двенадцатиперстной кишки (обзор литературы). Экспериментальная и клиниче-ская гастроэнтерология. 2008; 5:48-55. [Selez-neva EY, Ilchenko AA. Gallstone Disease Com-bined with Duodenal Ulcer (Literature Review). Eksperimental'naya i klinicheskaya gastroenter-ologiya. 2008; 5:48-55. (In Russ.).]
5. Семенов Д. Ю., Смолина Е. Н., Айлама-зян А. Н. Факторы риска развития желчнока-менной болезни у женщин репродуктивного возраста. Ученые записки СПБГМу им. акад. И.П. Павлова.- Том XX. 2013; 3:41- 44. [Se-menov D Y, Smolina EN, Aylamazyan AN. Risk Factors for the Development of Cholelithiasis in Women of Reproductive Age. Uchenye zapiski SPBGMu im. akad. I.P. Pavlova. Vol. XX. 2013; 3:41-44. (In Russ.).]
6. Парфенов И.П., Зорбасов М.А., Ярош М.А., Карапчев А.А., Солошенко А.В. Совре-менные представления об этиопатогенезе желчнокаменной болезни. Научные ведомости Белогородского государственного университе-та. 2011; 16(111):27-31. [Parfenov IP, Zorbasov MA, Yarosh AL. [et al.] Modern view on etiopatho-genesis of cholelithiasis. Nauchnye vedomosti Belogorodskogo gosudarstvennogo universiteta. 2011; 16 (111):27-31. (In Russ.).]
7. Трухан Д.И., Викторова И.А. Гастроэнте-рология: учебное пособие для студентов ме-
Fig. 1. IR spectrum of cholesterol stone (gall_1)
Fig. 2. IR spectrum of bilirubin stone (gall_3)
References

ЯКУТСКИЙ МЕДИЦИНСКИЙ ЖУРНАЛ76
дицинских вузов. Санкт-Петербург: СпецЛит. 2013. [Trukhan DI, Viktorova IA. Gastroenterolo-gy: textbook for medical students. St. Petersburg: SpecLit. 2013. (In Russ.).]
8. Тяптиргянова Т. М., Тобохов А.В., За-харов А.Д., Яковлева З.А. Желчнокаменная болезнь как причина острого билиарного панкреатита. Якутский медицинский журнал. 2018; 2(62):82-84. [Tyaptirgyanova TM, Tobok-hov AV, Zakharov AD, Yakovleva ZA. Gallstone Disease as a Cause of Acute Biliary Pancreatitis. Yаkutskij medicinskij zhurnal. 2018; 2(62):82-84. (In Russ.).] DOI 10.25789/YMJ.2018.62.24
9. Кривошапкин В.Г., Сивцева А.И., Сивце-ва Е.Н., Максимова С.С., Саввин Р.Г., Криво-шапкина М.В. Фактическое питание коренных малочисленных народов Севера (на примере эвенков Оленекского района Республики Саха
(Якутия)). Якутский медицинский журнал. 2015; 3(51):58-61. [Krivoshapkin VG, Sivtseva AI, Sivtseva EN, Krivoshapkin MV. Factual Nutri-tion of the Indigenous Peoples of the North (on the example of the Evenks of the Olenek region of the Sakha Republic). Yаkutskij medicinskij zhur-nal. 2015; 3 (51):58-61. (In Russ.).]
10. Циммерман Я. С. Клиническая гас-троэнтерология: избранные разделы. М.: ГЭОТАР-Медиа. 2009. [Zimmerman YC. Clinical Gastroenterology: selected sections. M.: GEO-TAR-Media. 2009. (In Russ.).]
11. Якубчик Т.Н. Клиническая гастроэнте-рология: пособие для студентов лечебного, педиатрического, медико-психологического факультетов, врачей-интернов, клинических ординаторов, врачей гастроэнтерологов и терапевтов. Учебное пособие. Гродно. 2014.
[Yakubchik TN. Clinical Gastroenterology: Text-book for Medical Students, Interns, Clinical Resi-dents, Gastroenterologists, and Physicians. Man-ual. Grodno. 2014. (In Russ.).]
12. Kleiner OI., Ramesh J, Huleihel M, Cohen B. [et al.]. A Comparative Study of Gallstones from Children and Adults using FTIR spectroscopy and Fluorescence Microscopy. BMC Gastroenterol. 2002; 2: 1-14. DOI: 10.1186/1471-230X-2-3
13. Sherlock’s Diseases of the Liver and Bil-iary System. Edited by James S. Dooley, Anna S.F. Lok, Guadalupe Garcia-Tsao, Massimo Pinzani. Wiley-Blackwell. 2018; 260-264.
14. Sleisenger and Fordtran’s Gastrointestinal and Liver Disease: Pathophysiology, Diagnosis, Management [Edited by] Mark Feldman, Law-rence S. Friedman, Lawrence J. Brandt. 2 Volume Set - 10th edition. 2015; 1100-1104.
The article analyzes the severity of frailty, anxiety and depression, parameters of quality of life depending on gender, and evaluates the effect of asthenia and anxiety-depressive states on the quality of life of long-livers in Yakutsk. The data of 70 long-livers are analyzed, whose average age was 92 ± 2.21 years. By gender distribution, the number of people was the same, with 35 respondents in each group. According to the ethnic composition of the sample was represented mainly by indigenous people. The study used the methods “Age is not a hindrance” (national vali-dated questionnaire), the hospital scale of anxiety and depression (HADS) and the questionnaire for assessing the quality of life (SF-36). According to the results of the study, frailty was diag-nosed in 64.3%, prevalence in 35.7% of the examined, no significant differences were found by gender. Indicators of frailty correlated with the level of anxiety, depression, and low rates across all scales of quality of life. Clinically significant anxiety was diagnosed in 5.8%, and depression in 2.9% of subjects. Subclinical anxiety and depression were noted in 42.8% and 35.7% of subjects, respectively. Anxiety and depression rates were significantly higher among females. The positive correlation of anxiety and depression was also noted. The results of assessing the quality of life of long-livers were within the age norm, except for indicators of role physical, role emotional and social functioning, which were higher among our respondents. Depending on the gender, values on the scales “bodily pain, “social functioning”, “role emotional” and on the general indicator of physical health were obtained significantly lower among women. The assessment of the quality of life, depending on the degree of asthenia, showed significant differences in all scales of quality of life, except for role physical condition. And the presence of anxiety and depression was asso-ciated with pain and a decrease in general health.
Keywords: frailty, anxiety, depression, quality of life, long-livers, gender.
Z.N. Alekseeva, N.S. Arkhipova, O.V. Tatarinova, S.S. Sleptsov, S.D. Efremova
THE GENDER FEATURES OF MANIFESTATIONS OF FRAILTY, EMOTIONAL CONDITION AND LIFE QUALITY OF LONG-LIVERS IN YAKUTSKDOI 10.25789/YMJ.2019.67.23
ALEKSEEVA Zinaida Nikolaevna – clini-cal psychologist, junior research Laboratory of clinical-populational, and medico-social researches, Yakut Science Centre of Com-plex Medical Problems, 677010, Yakutsk, Sergelyakhskoye Shosse, 4 km. [email protected]; ARKHIPOVA Natal’ya Spartakovna - Candidate of Medical Sciences, cardiolo-gist, Republican Hospital #1 – National Medic Centre, Yakutsk, Sergelyakhskoye Shosse, 4 km. [email protected]; TATARINOVA Ol’ga Viktorovna – MD, Ph.D., Head, Republican Hospital #3, Leading Researcher - Labora-tory of clinical-population and medico-social researches, Yakut Science Centre of Com-plex Medical Problems, 677010, Yakutsk, Sergelyakhskoye Shosse, 4 km. [email protected]; SLEPTSOV Spiridon Spiridonovich - Candidate of Biological Sciences, Leading Researcher - Laboratory of clinical-popula-tion and medico-social researches, Yakut Sci-ence Centre of Complex Medical Problems, 677010, Yakutsk, Sergelyakhskoye Shosse, 4 km. [email protected]. EFREMOVA Svet-lana Dmitrievna - junior researcher, Labora-tory of Immunology, Yakut Science Centre of Complex Medical Problems, 677010, Yakutsk, Sergelyakhskoye Shosse, 4 km.
Introduction. WHO experts noted the problem of population “aging”. This prob-lem includes not only the increase in el-derly population but also the population of people living 90 years and more. This category of people is the most vulnerable and their share is growing faster than the share of people 60 years and older. Thus, over the past 25 years, the longevity in-dex in Russia has increased by 1.7 times (from 9.0 to 15.4%) [8].
It is also well known that the incidence of senile asthenia syndrome (SAS) in-creases with age. Clinical manifestations of SAS include reduced strength, en-
durance, and physiological functioning, which increases the risk of dependence and death. According to some research-ers, the prevalence of SAS among peo-ple aged 80 to 84 years old reaches 16% and at among the people elder than 85 years - 26% [4, 12].
Some authors note that the main fac-tors determining the quality of life in later ages are somatic vulnerabilities, affective disorders and personal traits [17].
Therefore, it is obvious that issues re-lated to the preservation of the life qual-ity of long-livers in the future will be even more relevant.

3’ 2019 77
Research objective: study gender differences in indicators of frailty, emo-tional state and life quality of long livers in Yakutsk.
Materials and Methods: In the period from February to March 2019 in the Re-publican Hospital No. 3 and with home visits, we conducted a socio-psychologi-cal and medical examination of 82 people at the age of 89 to 100 years. 70 people (92 ± 2.21) were able to undergo the psy-chodiagnostic examination. The criteria for exclusion from the study are severe dementia, complete deafness, and blind-ness. Gender distribution is equal: 35 women (92 ± 2.48) and men (92 ± 1.92). The ethnic composition of the sample was represented mainly by indigenous people - Yakuts (75.7%), small peoples of the North (2.8%) and Russians (21.5%).
A screening questionnaire “Age is not a hindrance,” which includes 7 questions with two answers (yes or no) [2] had been used to identify the SAS. If there are 3 or more affirmative answers we diagnose SAS, at 1-2 points - preasthenia. The Hospital Anxiety and Depression Scale (HADS) and the Quality of Life Evaluation Questionnaire (SF-36) were also used.
Statistical processing of the research results was carried out using the IBM SPSS Statistics 23 software package with the calculation of the Spearman cor-relation coefficient and the significance of differences for independent samples — the Mann-Whitney test. The significance of the statistical significance of differenc-es was taken at a value of p <0.05.
Results and Discussion: According to the results of the “Age is not a hin-drance” questionnaire, senile asthenia was diagnosed in 64.3%, preasthenia in 35.7% of the patients. The absence of as-thenia had been not detected. The maxi-mum number of affirmative answers was 6 and was noted in 4.3% of the subjects.
The average rate for the SAS index for the group was 2.96 ± 1.12 (M ± m), which corresponds to the index between the preasthenia and asthenia. The SAS index correlated with the level of anxiety (p = 0.000), depression (p = 0.000) and with a low index of life quality (p≤0.01).
In terms of gender distribution, the SAS index was slightly higher among women (3.09 ± 1.01) but has not reached the level of statistical significance (Fig. 1). In other studies, it is also noted that the prevalence of SAS among women is higher than among men, which is also seen in our study [16].
This is known that depending on the method of determining the prevalence of senile asthenia among persons over 65 ranges from 4.0% to 59.1% [7]. It reach-
es 32-45% among persons older than 90 [16]. The data we obtained are higher than the presented and close to the re-sults of a study conducted by Soselia N.N. among seniors and long-livers with acute coronary syndrome: there is the prevalence of SAS equal to 66.1% [1]. It should be noted that the screening ques-tionnaire “Age is not a hindrance” was also used in this study. Also, cardiovas-cular disease in a patient is accompanied by a threefold increase in the frequency of senile asthenia [10]. Thus, it is possible that the results we obtained may be relat-ed to the greater sensitivity of the ques-tionnaire we used, or with the severity of chronic diseases and their comorbidity.
Analysis of the items on the ques-tionnaire showed that the overwhelming majority, regardless of gender, noted a decrease in hearing and vision (85.7% of men and 82.8% of women) (Table 1). Women more often complained of emo-tional depression, anxiety, falls and trau-matization, and difficulties in moving around the house and on the street. Men more often answered affirmatively to the question of a decrease in memory and orientation in the locality. Both groups rarely complained about weight loss and urinary incontinence.
The last two points with the lowest rates - weight loss and incontinence should be discussed. The prevalence of
primary sarcopenia (a syndrome char-acterized by progressive and general-ized loss of muscle mass and strength) among people over 80 years of age reaches 50% [4]. Our results are much lower than indicated. However, it should be noted that the body mass index among all the respondents in the normal range, but they did not have objective data about their weight and indicated that they do not monitor their weight. In earlier studies, it was stated that the incidence of symptoms of urinary incontinence in Russian women over 65 reaches 41.4%, and among men from 15 to 50% de-pending on living conditions [13], but in S.Maggi studies among people over 80 years, urinary incontinence was detected in 22.9% of men and 29.3% of women [15], which is consistent with our results. Also, literature data often indicates that symptoms associated with dysfunction of the urinary tract, and especially urinary incontinence, are not always easy to ex-press patients' complaints due to patient embarrassment [14], which can also af-fect the accuracy.
According to the results of the Hospi-tal anxiety and depression rating scale (HADS), the results of more than half of the subjects were within the normal range in terms of anxiety and depression (Fig. 2). Clinically significant anxiety was diag-nosed in 5.8%, and depression in 2.9% of subjects. Subclinical anxiety and depres-sion were noted in 42.8% and 35.7% of subjects, respectively.
Indicators of anxiety and depression depending on sex are presented in Table 2. It was noted that indicators of either anxiety and depression are significantly higher among females. A positive correla-tion between anxiety and depression was also noted (p = 0.000).
According to the literature, the symp-
Fig.1. “Age is not a hindrance” questionnaire results.
Distribution of the affirmative answers in the “Age is not a hindrance” questionnaire, (%)
Question Men Women
Have you lost 5 kg or more in the last 6 months? 5.7 8.6Do you experience any restrictions in everyday life due to decreased vision or hearing? 85.7 82.8
During the past year, have you got a fall injury? 25.7 37.1
Do you feel depressed, sad, or anxious in recent weeks? 34.3 51.4
Do you have problems with memory, understanding, orientation, or the ability to planning? 62.8 54.3
Do you have urinary incontinence? 22.8 22.8
Do you have difficulties in moving around the house or outdoor? 48.6 68.6
Table 1

ЯКУТСКИЙ МЕДИЦИНСКИЙ ЖУРНАЛ78
toms of anxiety and depression are ob-served in 25-30% of people over 65 and with concomitant somatic diseases, this reaches 50% [5]. 10-14% of inpatients and residents of nursing homes have major depression, even more, have com-ponents of depressive disorders [3]. Ac-cording to the results of our study, the rate of clinically expressed depression was lower which could be explained by the fact that almost all our subjects lived with their relatives, which is an alleviat-ing factor to depression. It should also be noted the prevalence of depression was significantly lower among people over 90 years [9]. Regarding the gender distribu-tion of depression, it was found that in old age (75–90 years), the difference in the frequency of depression in men and women decreases, and at an over-elderly age (after 90 years) it almost disappears. In our study, these data were not con-firmed: we had obtained significant differ-ences between men and women in terms of anxiety and depression.
We also analyzed the severity of anxi-ety and depression depending on the presence of preasthenia and SAS and obtained a significant difference in anxi-ety and depression between preasthenia and SAS (indicators prevail in the group with SAS) (p = 0.001 for these indicators)
According to the results of assessing life quality, the average values ranged from 33.50 to 80.47. The lowest values were noted for the general indicator of physical health and “physical func-tioning” (Table 3). The values of these scales correlate with age (p = 0.001), which indicates that the age of each age negatively affects physical well-being. The following scales are "intensity of pain" and "general health". The highest rates (role functioning based on physi-cal and emotional condition) indicates that the daily activities of long-livers are not limited to a physical or emotional state. At the same time, the indicators of the mental component of health are re-duced less than the physical component.
Depending on the sex, reliable low val-ues were obtained on the scale “pain in-tensity” (p = 0.002), “social functioning” (p = 0.015), “role functioning based on the emotional state” (p = 0.037) and on over-all indication of physical health (p = 0.015).
Deterioration of physical functioning is considered one of the key character-istics of the deterioration in the quality of life, and even minor negative changes in functional status are associated with an increase in mortality, an increase in the need for additional care and health-related expenses. Nevertheless, the low data we obtained are normal for this age group, as in the study conducted in Be-larus, the average value of the physical functioning scale among the long-livers was 32.1, and the physical component of health was 33.1, which corresponds to our results. Focusing on the data of a multicenter MIRAGE study of the quality of life [11] among persons over 75 years old, it can be noted that the indicators on the scales are mostly within the average values of the population, except for role functioning based on physical and emo-tional state. In another study conducted in Yakutsk among the elder, high values on the scales of emotional and social functioning were found [6]. Regarding gender differences, many authors noted that the parameters of quality of life are higher among men of longevity than women [18]. In general, the obtained data are consistent with data from com-parative studies of the quality of life in men and women.
The assessment of the life quality depending on the degree of asthenia, showed significant differences in all scales of quality of life, except for role functioning based on physical condition. It is logical to expect a decrease in daily ac-tivity due to SAS, which was not reflected
in our study and requires further consid-eration. Considering the severity of cog-nitive deficit overestimated rates of activ-ity may be noted, although this should have affected other indicators. In general, during the survey, there was satisfactory independence of respondents in daily life - the majority served themselves inde-pendently and showed sufficient physical activity. Many were engaged in everyday exercise, Nordic walking. For example, one respondent noted that she was do-ing a set of exercises every day, con-sisting of one hundred different options.
We also evaluated the effect of anxiety and depression on quality of life: subjects were divided into 2 groups, where the first group is individuals without detected anxiety and depression, the second is re-spondents with subclinical and clinically significant anxiety and depression. The results of statistical processing showed significant differences in the group of indi-viduals with anxiety and depressive states for all scales of psychological health and some scales of physical health. The rela-tionship of these indicators with the psy-chological components of health is clear, so we are focusing on physical indicators. Thus, the presence of anxiety was asso-ciated with pain syndrome (p = 0.038) and with a decrease in general health (p = 0.024). The presence of depres-sion was also associated with a worse general health assessment (p = 0.002).
Conclusion:1. Manifestations of senile asthenia
syndrome were diagnosed in 64.3% of subjects. The SAS indicators correlated with the level of anxiety, depression, and low rates across all scales of quality of life.
2. Anxiety and depression rates were significantly higher among females. Val-ues were positively correlated with each other and reflect comorbidity. High rates of anxiety and depression were associ-ated with low rates of quality of life.
3. In general, indicators of the quality
Anxiety and depression assessment results (HADS) (М±m)
Total Men Women p-valueAnxiety 6.91 ± 2.23 5.74 ± 1.75 8.09 ± 2.04 р=0.000Depression 6.54 ± 2.47 5.83 ± 2.14 7.26 ± 2.60 р=0.020
Table 2
Fig. 2. Anxiety and depression distribution among respondents (%, n=70)

3’ 2019 79
of life among long-livers corresponded to average values, except for the scales on “role functioning associated with the physical and emotional state” and “social functioning”, which indicates sufficient in-dependence in daily life and intact daily activity of long-livers.
4. Quality of life scales such as the physical component, pain intensity, so-cial functioning, and role functioning due to the emotional state was significantly lower among women.
1. Соселия Н.Н., Багманова Н.Х., Виллевальде С.В., Кобалава Ж.Д. Ассоциации синдрома старческой астении с маркерами повреждения почек и миокарда у пациентов с острым коронарным синдромом. Трудный пациент. 2018; 3(16):53-55. [Soseliya N.N., Bag-manova N. Kh., Villevalde S.V., Kobalava Z.D. Association of the senile asthenia syndrome with markers of kidney and myocardium damage in patients with acute coronary syndrome. Trudnyj pacient. 2018; 3(16):53-55. (In Russ.).]
2. Ткачева О.Н., Рунихина Н.К., Остапенко В.С., Шарашкина Н.В., Мхитарян Э.А., Онучина Ю.С., Лысенков С.Н. Валидация опросника для скрининга синдрома старческой астении в амбулаторной практике. Успехи геронтологии. 2017; 30(2):236-242. [Tkacheva O.N., Runikhina N.K., Ostapenko V.S., Sharashkina N.V., Mkhitary-an E.A., Onuchina U.S., Lysenkov S.N. Validation of the questionnaire for screening frailty. Uspekhi
gerontologii. 2017; 30(2):236-242. (In Russ.).]3. Воробьев П.А., Власова А.В. Депрессия в
пожилом возрасте. Клиническая геронтология. 2007; 3:22-28. [Vorobiev P.A., Vlasova A.V. De-pression in old age. Klinicheskaya gerontologiya. 2007; 3:22-28. (In Russ.).]
4. Кононова Л.И., Миронова А.С. Выявление и особенности введения пациен-тов с синдромом старческой астении: мето-дическое пособие для врачей первичного звена здравоохранения. Красноярск: 2017. 50 с. [Kononova L.I., Mironova A.S. Identification and features of the introduction of patients with se-nile asthenia syndrome: metodicheskoe posobie dlya vrachej pervichnogo zvena zdravoohraneni-ya. Krasnoyarsk: 2017. 50 p. (In Russ.).]
5. Захарченко Д.В. Клинико-динамическая характеристика реккурентного депрессивного расстройства в позднем возрасте: автореф. дисс…. канд. мед. наук. СПб., 2015. [Zakharch-enko D.V. Clinical and dynamic characteristics of recurrent depressive disorder in late age: abstract dis. ... Phd. Saint-Petersburg., 2015. (In Russ.).]
6. Ефремова А.И., Никитин Ю.П., Симонова Г.И., Щербакова Л.В. Качество жизни жителей г. Якутска в возрасте 60 лет и старше. Вестник СВФУ. 2011;8 (3):32-35. [Efremova A.I., Nikitin Yu. P., Simonova G. I., Sherbakova L.V. Quality of life of Yakutsk citizens at the age of 60 and older. Vestnik SVFU. 2011;8 (3):32-35. (In Russ.).]
7. Киселева Г.В., Рафальская К.А. Распространенность гериатрических синдро-мов у пациентов врача общей практики. Российский семейный врач. 2017;21(4):21-28. [Kiseleva G.V., Rafalskaya К.A. The preva-lence of geriatric syndromes in general practice. Rossijskij semejnyj vrach. 2017;21(4):21-28. (In Russ.).] DOI: 10.17816/RFD2017421-28
8. Короленко А.В. Региональные осо-
бенности и предпосылки долголетия в России. Социальное пространство. 2016; 4(06): 1-18. [Korolenko A.V. Regional features and precondi-tions of longevity in Russia. Social'noe prostrans-tvo. 2016; 4(06): 1-18. (In Russ.).]
9. Краснов В.Н. Психиатрически расс-тройства в общей медицинской практике. Русский медицинский журнал. 2001; 9(25):1187–1191. [Krasnov. V.N. Psychiatric dis-orders in medical practice. Russkij medicinskij zhurnal. 2001; 9(25):1187–1191. (In Russ.).]
10. Ткачева О. Н., Рунихина Н. К., Котовская Ю. В., Шарашкина Н. В., Остапенко В. С. Лечение артериальной гипертонии у пациентов 80 лет и старше и пациентов со старческой астенией. Кардиоваскулярная терапия и профилактика. 2017;16(1): 8-21. [Tkacheva O. N., Runikhina N. K., Kotovskaya Yu. V., Sharashkina N.V., Ostapenko V.S. Arte-rial hypertension management in patients aged older than 80 years and patients with the senile asthenia. Kardiovaskulyarnaya terapiya i profilak-tika. 2017;16(1): 8-21. (In Russ.).] http://dx.doi.org/10.15829/1728-8800-2017-1-8-21
11. Амирджанова В.Н., Горячев Д.В., Коршунов Н.И., Ребров А.П., Сороцкая В.Н. Популяционные показатели качества жизни по опроснику SF-36 (результаты многоцентрового исследования качества жизни «Мираж»). Научно-практическая ревматология. 2008; 1: 36-48. [Amirdjanova V.N., Goryachev D.V., Kor-shunov N. I., Rebrov A.P., Sorotskaya V.N. SF-36 questionnaire population quality of life indices. Nauchno-prakticheskaya revmatologiya. 2008; 1: 36-48. (In Russ.).]
12. Турушева А.В., Фролова Е.В., Дегриз Ж.М. Эволюция теории старческой астении. Вестник Северо-Западного государственного медицинского университета им. И.И. Мечникова. 2017;9(1):117-124. [Turusheva А.V., Frolova E.V., Degryse J.M. Evolution of the frailty concept. Vestnik Severo-Zapadnogo gosudarst-vennogo medicinskogo universiteta im. I.I. Mech-nikova. 2017;9(1):117-124. (In Russ.).]
13. Чукаева И.И., Ларина В.Н. Возраст-ассоциированные состояния (гериатрические синдромы) в практике врача-терапевта поликлиники. Лечебное дело. 2017;1:6-15. [Chukaeva I.I., Larina V.N. Geriatric syndrome in a primary care setting. Lechebnoe delo. 2017;1:6-15. (In Russ.).]
14. Initial Manifestations of Frailty Criteria and the Development of Frailty Phenotype in the Women's Health and Aging Study / K. Ban-deen-Roche, R. Varadhan, J. Zhou [et al.] // The Journals of Gerontology: Series A. – 2008. - 63(9). – Р. 984–990
15. Maggi S. Prevalence rate of urinary incon-tinence in community-dwelling elderly individuals: the Veneto study./ S. Maggi, N. Minicuci, J. Lan-glois, M. Pavan, G. Enzi, G. Crepaldi // J Gerontol A Biol Sci Med Sci. – 2001. - 56(1). – P. 14-18.
16. Prevalence of frailty in community-dwell-ing older persons: a systematic review / R.M. Collard, H. Boter, R.A. Schoevers [et al.] // J Am Geriatr Soc. - 2012. - 60(8). – Р.1487-92.
17. Quality of life in old age International and Multi-Disciplinary Perspectives / Ed. H. Mollen-kopf, A. Walker //Dordrecht: Springer. 2007. 259 р.
18. Shaw C. Functional abilities and conti-nence: the use of proxy respondents in research involving older people. / C. Shaw, E. McColl, S. Bond // Qual Life Res. — 2000. - 9(10). — P. 1117-1126.
Table 3
Life quality assessment results (SF-36) (М±m)
Total Men Women p-value
Physical componentof health 33.57 ± 6.87 35.57 ± 7.36 31.56 ± 5.77 р= 0.015
Physical functioning 33.50 ± 17.96 37 ± 17.49 30 ± 17.98 р= 0.163
РRole-Physical Functioning 78.57 ± 24.55 84.29 ± 21.07 72.86 ± 26.68 р= 0.064
Bodily pain 45.89 ± 17.14 52.14 ± 19.82 39.63 ± 11.07 р= 0.002
General Health 46.84 ± 12.79 49.17 ± 13.22 44.51 ± 12.09 р= 0.20
Рsychological component of health 52.51 ± 6.91 53.47 ± 6.60 51.54 ± 7.16 р= 0.30
Vitality 50 ± 11.97 51.43 ± 12.40 48.57 ± 11.54 р= 0.28
Social Functioning 69.28 ± 21.14 76.07 ± 22.14 62.50 ± 17.93 р= 0.015
Role-Emotional 80.47 ± 23.74 85.71 ± 21.82 75.23 ± 24.72 р= 0.037
Mental Health 70.91 ± 12.10 71.43 ± 10.93 70.40 ± 13.30 р= 0.57
References

ЯКУТСКИЙ МЕДИЦИНСКИЙ ЖУРНАЛ80
In international law, the Arctic is usu-ally understood as a part of the Earth's spheroid, whose center is the North Pole and the marginal boundary is the Arctic Circle (parallel 66 ° 33ʹ north latitude)[13]. The Arctic region connects together two continents - Eurasia and North America, within its borders there are five states - Russia, Norway, Denmark, the USA and Canada, each of which has an exclusive economic zone and a continental shelf in the Arctic Ocean [3]. According to the Fundamentals of the State Policy of the Russian Federation in the Arctic for the period up to 2020 and beyond, the Arctic zone of the Russian Federation is under-stood as part of the Arctic which includes all or part of the territory of the Sakha Re-public (Yakutia), Murmansk and Arkhan-gelsk Regions, Krasnoyarsk Territory, Nenets, Yamalo-Nenets and the Chukot-
ka Autonomous Districts, as well as the lands and islands adjacent to these ter-ritories, internal sea waters, the territorial sea, the exclusive economic zone and the continental lf the Russian Federation, within which Russia has sovereign rights and jurisdiction in accordance with inter-national law. This territory is the largest source and strategic reserve of mineral and energy resources of Russia. It pro-duces 100% of domestic diamonds, 98% of platinum, 97.5% of gas, 75% of oil, 95% of nickel and cobalt [22, p.50-51]. The Arctic zone can rightly be called the source of raw materials for the develop-ment of the domestic economy. In addi-tion, the Russian Arctic zone has a pow-erful logistical potential - in conditions of climatic warming, the Northern Sea Route we are reviving is able to reverse the existing global logistics schemes. Thus, the importance of the Arctic for our country cannot be overestimated.
Realization of the Arctic potential re-quires the involvement of human resourc-es. This is also required by defense proj-ects, since our competitors in the Arctic region are increasing their military pres-ence and are seeking to question the sov-ereign rights of the Russian Federation to the natural resources belonging to it.
The circumstances noted above in-crease the importance of human capi-
tal. In turn, the quality of human capital is largely (and in the first place in the extreme conditions of the North) de-termined by the state of health. Hence, when planning and implementing plans for the development of the Arctic, it is extremely important to take into account a wide range of adverse factors affect-ing the human body. This actualizes the study of biomedical problems of the de-velopment of the Arctic zone in a wide range of scientific fields, including in the aspect of environmental protection and its legal support as directly related to hu-man health.
The purpose of this work was to ana-lyze environmental problems in the Arctic zone of the Russian Federation and their impact on the health of the population liv-ing in this region.
Based on the results of the analysis, the authors will propose legal measures to reduce risks to human health in the Arc-tic region (in the regions of the Far North).
Materials and methods of the re-search. The research process was based on the principles of scientific knowledge and objectivity of the knowledge gained. The material for the analysis undertaken was the results of previously conducted research in the field of human physiology and hygiene in the Far North, identifying the main risk factors for health problems
The authors investigate the environmental impact of the Arctic zone of the Russian Federation on human health. Noting the importance of the Arctic region for our country, the authors draw attention to the huge role of human capital in the processes of its further development. In their opinion, it is the “human factor” that is the main factor determining the possibility of implementing projects for the development of the Arctic zone. In turn, the quality of human capital in the extreme conditions of the North determined primarily by the state of health. This actualizes the need to study the adverse factors affecting the human body in the Arctic. The aim of the work was to analyze environmental problems in the Arctic zone of the Russian Federation and their impact on the health of the population living in this region. The analysis of these problems carried out by the authors not only from biomedical positions, but also from the positions of legal support of environmental protection as a condition for reducing risks to human health. The main research methods were the methods of statistical and logical analysis, the system-functional method, the com-parative method, the generalization method. Results. In the course of the study, the authors identified the main factors of the negative impact of the environment of the Arctic zone on human health, having a natural and anthropogenic character. According to the authors, the main natural factorsare cold, increased electromagnetic activity and radiation, low absolute humidity of the air, frequent fluctuations in atmospheric pressure, unusual photoperiodism. The authors attributed the anthropogenic factors to pollution of surface and groundwater, as well as the soil cover with oil products; air pollution by emissions of mining, mining and metallurgical and metallurgical enterprises; radionuclides of technogenic origin. The paper describes the consequences of the impact of these environmental factors in the Arctic zone on human health. According to the results of the study, conclusions was drawn about the immanent nature of environmental risks, and, accordingly, risks to public health during intensive industrial development of the Arctic zone. The natural and climatic conditions of the Polar region objectively increase the harmful effects on human health of the effects of anthropogenic pressure on the environment. In order to prevent and minimize the risks of human health violations in the Arctic zone and environmental protection, it is necessary to amend a number of legislative acts of the Russian Federation, as well as to adopt a comprehensive Federal law "On the Arctic zone of the Russian Federation", which should be based on a unified concept of legal regulation, taking into account the climatic, environmental, medical and biological specifics of the Arctic.
Keywords: the Arctic, the Arctic zone of the Russian Federation, the Arctic region, natural factors of negative impact on health, negative en-vironmental factors of anthropogenic origin, risks of impairment of health, environment, legislation, “Arctic synergy”, diseases, health protection.
E.V.Vorontsova, A.L.VorontsovENVIRONMENTAL STATE AND HUMAN HEALTH IN THE ARCTIC ZONE: MEDICAL AND SOCIO-LEGAL ASPECTDOI 10.25789/YMJ.2019.67.24
ARCTIC MEDICINE
VORONTSOVA Elena Vladimirovna, PhD, associate Professor of Department of finan-cial law, constitutional, civil and administrative proceedings, South-West state University, 305040, Kursk, street 50 let Oktyabrya, 94, e-mail: [email protected]; VORONTSOV Andrey Leonidovich, PhD, associate Pro-fessor, associate Professor of Department of administrative and labor law South-West state University, 305040, Kursk, street 50 let Okty-abrya, 94, e-mail: [email protected].

3’ 2019 81
in these areas, as well as materials from other biomedical research. In addition, data obtained from environmental mon-itoring in specific regions of the Arctic zone, as well as data from integrated geo-environmental studies were used. In addition, the content of the program strategic documents of the Russian state in the field of development and devel-opment of the Arctic zone, as well as the content of environmental legislation were analyzed. A specific methodology comprised a complex of general scientif-ic and private scientific methods, among which the main ones were the method of statistical and logical analysis, the sys-tem-functional method, the comparative method, the generalization method.
Results and discussion.1. The impact of environmental fac-
tors on the human body in the Arctic. The natural and climatic environment of the Arctic zone is characterized by an abundance of factors that have a nega-tive impact on the health of the popula-tion living here. First of all, such factors should include cold, by which many re-searchers tend to understand the entire set of cooling meteorological conditions — low air temperatures, a long period of standing snow, strong winds, lack of solar insolation [18, p.5].
Cold affects the heat transfer and hu-man performance. Labor load in cold con-ditions requires large physiological costs. Coefficient of performance (COP) of phys-ical work in the open air in the conditions of the Extreme North is approximately 15–25% lower than in middle latitudes [12]. At the same time, there is an increased risk of chronic exposure to the cold fac-tor in the Arctic zone for many workers.
The respiratory system, which is most vulnerable, as it cannot be completely protected from external conditions, is ex-posed to cold most often.The cold factor also contributes to the fact that the respi-ratory tract and respiratory membranes have the largest environmental contact surface among all tissues of the body, the area of which is approximately 50 times the surface of the body [20]. According to medical research, the local exposure to cold air on the mucous membrane of the upper respiratory tract, trachea and bron-chial tree causes a significant loss of heat and moisture, which are used to warm and moisten the inhaled air. Negative temperature values of inhaled air require significant functional stress from the re-spiratory system and, in general, create an extremely aggressive environment for the respiratory system. In addition, the increase in pulmonary ventilation caused by cold exacerbates the harmful effects
on the body of chemicals. It should be added that the super cooled organism more sensitive to industrial poisons.
In addition to the respiratory system, the primary objects of cold exposure in the Arctic zone are open areas of the face and head (most often the nose and ears), as well as the hands and feet. Blood sup-ply in these parts of the body is peripheral and therefore and they are more prone to frostbite. In addition, the narrowing of pe-ripheral blood vessels under the influence of cold strengthens the central circulation and provokes an increase in blood pres-sure.Even cooling the forehead and head can increase blood pressure and heart rate. Joints also suffer in this situation: under the influence of cold, they lose mo-bility due to an increase in the viscosity of synovial fluid [12]. It should be added that the effect of the cold factor in the Arc-tic is enhanced by the high speed of air movement (i.e. strong wind).
Another natural factor in the Arctic zone of the Russian Federation, which has a negative impact on human health, is increased electromagnetic activity and radiation. The first adverse phenome-non is due to the strong variability of the natural physical environment and is as-sociated with the structural features of the Earth's magnetosphere in the Polar Regions. In these areas, the fluctuations of the variable geomagnetic field and the intensity of cosmic solar rays at the sur-face of the planet are most pronounced. This leads to the so-called geomagnetic storms, which affect the functional state of the human body [6, p. 44-52]. During this period, the number of hypertensive crises, strokes, myocardial infarction in-creases, the course of some mental dis-eases worsens, etc. Causing geomag-netic storms, solar activity also affects the radon content in the atmospheric air of the Arctic zone, thereby increasing the dose of ionizing radiation. For example, a study conducted in the Murmansk region (Apatity) showed that the average dose from natural sources of ionizing radia-tion due to atmospheric air is 12.5 times higher than the average in Russia [7, p. 93-111].
A characteristic natural factor of the Arctic that has a negative impact on hu-man health is low humidity (especially on frosty days). This reduces the oxygen uti-lization factor in the lungs [8, p. 213-217]. In dry air the lungs hard to lose moisture. This leads to disruption of gas exchange in the alveoli and the formation of hy-poxemia in the northerners (low oxygen content in the blood). In addition, the dry air of the Arctic region contributes to the loss of moisture in the skin and mucous
membranes, which leads to a decrease in their protective functions. It should be noted that low air humidity is a constant environmental factor for residents of the Arctic and is typical not only for open ar-eas of the territory, but also for residen-tial and industrial premises, which in turn requires the moistening of air in these premises during the winter period and the development of individual means protec-tion of the respiratory system to work in the cold 11 [8, p.213-217].
The Arctic zone is also characterized by frequent daily fluctuations in atmo-spheric pressure, and very significant ones. This fact also leads to serious risks of health disorders of the population.
A feature of the Arctic region is an un-usual photoperiodism: polar night and polar day. Both natural phenomena affect the state of the human body, in particular, the development of aging, age-related pathology and neoplasm[9].
In general, it should be concluded that the human in the Arctic zone is a re-structuring of all types of metabolism and hormonal regulation. The body of the in-habitants of the Arctic is functioning more intensively, in connection with which the physiological reserves are gradually de-pleted. In the Far North, morbidity and mortality rates of the population are in-creasedcompared with central Russia [17]. More often, there are diseases of the cardiovascular system and respirato-ry organs, musculoskeletal and nervous systems, digestive organs, damage to teeth and bone tissue. There is a reduc-tion in the reproductive period and the ac-celeration of age-related changes in oth-er physiological functions. In our opinion, this is due to negative natural-climatic and anthropogenic factors that give rise to the effect of "Arctic synergy"in their combined effect on the human body. This effect increases the harmful effects of each adverse environmental factor in the Arctic zone. All this leads to significant labor losses, early disability and reduced life expectancy [16, p. 33-40].
Unfortunately, it is impossible to elim-inate the adverse effects of natural and climatic factors of the Arctic. At the same time, the interests of public health require the adoption of state measures aimed at reducing the harmful effects of such ex-posure. It seems to us that in this case it is necessary to focus on preventive measures and the development of new personal protective equipment. Note that this, among other things, is prompted by Russian legislation [2; 1], as well as documents adopted by the World Health Organization (WHO) [24] and the Arctic Council.
ЯКУТСКИЙ МЕДИЦИНСКИЙ ЖУРНАЛ82
2. Human health and human impact on the environment. In addition to nat-ural factors, technogenic pollution has a significant impact on human health in the Arctic zone of the Russian Federation (as well as in the entire Arctic).
The intensity and scale of the current anthropogenic impact on the environment is already incommensurable with the ability of the Arctic ecosystem to natural self-purification.The assimilation poten-tial of the ecosystem has been exhausted at the present stage and the situation is close to critical. The Arctic ecosystem is under stress[4, p.85]. In this regard, the environmental problems of the Arctic at-tract the attention of both the Arctic states and the states located outside its territory [10, p.133].
Wherein the possibility of eliminating the consequences of emergency situ-ations in Arctic is complicated by the conditions of the polar night, numer-ous storms with high waves, thick fog, multi-meter ice and the possibility of colli-sion with icebergs [14, p.159].
Our country, as a state with a third part of its territory in the Far North, is aware of its responsibility for the preservation of the environment of the Arctic region and notes this in the fundamental stra-tegic documents.The key document in this sense is the “Fundamentals of the state policy of the Russian Federation in the Arctic for the period up to 2020 and further perspective”. One of Russia's main national interestsin this document is saving unique ecological systems of the Arctic. The next most important docu-ment regarding the Arctic is the “Strategy for the Development of the Arctic Zone of the Russian Federation and Ensuring National Security until 2020”, which spec-ified the planned results of environmental protection in stages: the first stage of the implementation of the Strategy should en-sure the development of a unified nation-al monitoring system the state and pollu-tion of the environment of the Arctic zone, synchronized with similar international systems; at the second stage - the reduc-tion and prevention of the negative impact on the environment of the Arctic zone.
Note that other Arctic states - the Unit-ed States, Canada, Norway, Denmark also pay serious attention to environmen-tal protection and environmental safety in the Arctic, but at the level of strategic planning, our country regulates these is-sues in more detail.
The above cannot be attributed to the current Russian legislation in the field of environmental protection. Neither the Federal Law “On Environmental Protec-tion”, nor the Federal Law “On Specially
Protected Natural Territories”, nor other federal laws and other regulatory legal acts in this area take into account the natural and climatic specifics of the Arctic zone. After all, it causes need of estab-lishment of special (issued author) envi-ronmental protection requirements when carrying out economic and other activities in a given region. However, the Russian legislator in these matters is limited to existing legal approaches, i.e. legal tools used in the Arctic are almost the same as those used in mid-latitudes. For example, despite the fact that the Strategy for the Development of the Arctic Zone provides for the need to increase the responsibility of nature utilization enterprises operating in the Arctic, neither the Criminal Code of the Russian Federation nor the Russian Federation Code on Administrative Of-fenses still does not contain special rules governing liability for environmental pol-lution in the Arctic zone.
The special vulnerability of the Arctic ecosystem urgently requires the man-datory state environmental review when planning all types of economic activities without exception (issued by the author.). However, the current Federal Law "On Ecological Expertise" allows not to do this, allowing the possibility of carrying out certain types of economic activity without an expert examination. Of course, this lack of regulation creates the risk of irreversible environmental damage to the environment of the Arctic region, as well as harm to the health of the population living there.
In addition to the federal laws men-tioned by us, adjustments require other regulations that play a huge role in the industrial development of the Arctic: the law of Russian Federation "On Subsoil", the Federal Law "On the Continental Shelf of the RF" and a number of others. A more radical and more acceptable op-tion would be the adoption of a compre-hensive Federal Law “On the Arctic zone of the Russian Federation”, which would be based on a single concept of legal regulation, taking into account the spe-cific climatic, ethnic, cultural and medical biological features of the Arctic region and providing special approach to the use and protection of the environment as an environment that forms human health.
A powerful factor in the pollution of the Arctic is oil pollution in the basin of the Arctic Ocean. Most of the rivers of the Urals and Siberia flow into the Arc-tic seas, carrying oil emissions into them that have fallen into the rivers thousands of kilometers from the ocean coast. The scale of such pollution is several hun-dred thousand tons of petroleum prod-
ucts per year [19, p.118]. As a result, the concentration of pollutants in the Rus-sian part of the Arctic Ocean is several times higher than normal. As a result - accumulation in the Arctic food chains - fish, terrestrial and especially marine mammals - persistent toxic substances (PTS). Many representatives of the Arc-tic fauna are traditional food sources for the indigenous peoples of the North, and this pathway for PTS in the human body remains one of the main risks to human health in the Arctic zone.
The main way of getting oil and oil products into the environment of the Arc-tic region of the Russian Federation is oil spills. However, relatively small accidents on oil pipelines occur with enviable reg-ularity in Russia. At the same time, the cumulative amount of spilled oil is simply shocking - more than 5 million tons of oil annually (this figure was cited by an employee of the Department of American Studies at St. Petersburg State Univer-sity - N. A. Chenskikh, after comparing the published data on the volumes of oil produced and mining and transportation in Russia). For comparison, this is more than the volume of oil spilled as a result of the disaster in the Gulf of Mexico in 2010, which led to environmental con-sequences of a global scale. According to experts, hundreds of drilling sites and pipelines cross the migration routes of wild animals and the routes of domestic deer migrations, having had a negative impact to date on more than 40% of the areas of reindeer pastures and hunting grounds [15, p.48]. In addition to damage to the environment, this circumstance creates real risks to human health, taking into account the food chain of indigenous peoples of the North that we noted earlier.
Oil pollution of water and soil cover are not the only negative environmental fac-tors in the Arctic, which are of an anthro-pogenic character. In addition, the enor-mous risks of disruption to public health are created by the activities of mining enterprises, as well as enterprises of fer-rous and non-ferrous metallurgy. In areas with developed industry concentrations of heavy metals, fluorides, sulfates, nitro-gen compounds in surface and ground-water are often at the level of high and extremely high pollution. Serious anthro-pogenic impact on the atmosphere. If the total world industrial emissions of SO2 (sulfur dioxide, sulfur dioxide) is about 100 million tons per year, in Russia this figure is 9.2 million tons [23, pp.370-373]. At the same time, mining industry enter-prises emit more than 3 million tons into the atmosphere annually [11, p.73-75]. The emissions of solid compounds, espe-

3’ 2019 83
cially insoluble nickel, copper and cobalt compounds, carried out by enterprises in the north of the Krasnoyarsk Territory and the Kola Peninsula, are of great negative importance for human health in the Arctic zone. Emissions from ore-dressing en-terprises largely determine the chemical composition of dust in the Arctic region. Thus, in the Western and Central Arctic, dust contains up to 25% Cu, 15% Ni, 11% S and 4% Co [5; 21, p. 369-374].
The impact of air pollution is most pro-nounced in the large industrial centers of the Arctic zone, especially in Norilsk, the coal-mining cities of the Komi Repub-lic, and the industrial centers of the Kola Peninsula. This leads to pronounced changes in the immune, hormonal, car-diorespiratory, hematopoietic and other vital human systems (especially in chil-dren). In addition, the atmospheric air of a number of settlements, for example, the city of Monchegorsk (Murmansk region) and the city of Norilsk (Krasnoyarsk Terri-tory), has an increased carcinogenic risk.
For the health of the Arctic population, a noticeable negative environmental fac-tor of anthropogenic origin is exposure to radionuclides. It should be noted that for a long time, residents of the Arctic zone of the Russian Federation were subject-ed to chronic radiation by radionuclides formed in the atmosphere as a result of nuclear tests at arctic test sites. Falling out with precipitation, these radionuclides affected a huge area, causing significant harm to human health. The termination of nuclear tests reduced the value of ra-diation exposure as a risk of impairment of health in the Arctic region, but didn’t completely eliminate it. Even now, resi-dents of certain Arctic areas, especially the Murmansk region, are exposed to the potential danger of radiation contamina-tion. This is facilitated by the presence of a large number of radiation sources of anthropogenic origin: nuclear reactors of operating and decommissioned subma-rines (NPS), radioactive waste storage facilities, infrastructure facilities of the ice-breaking fleet of the Russian Federation.
Thus, negative environmental factors of anthropogenic origin continue to con-stitute a significant proportion of the risks to human health in the Arctic zone.
Conclusion. The study allowed the authors to draw the following conclusions:
- The Arctic zone of the Russian Fed-eration is a unique natural resource, environmental and logistical resource not only of our country, but of the whole world. Industrial development of the Arc-tic zone acts as an objective need of the Russian Federation, as a condition for its successful economic development. At
the same time, harsh climatic conditions create significant problems in the process of industrial and infrastructural develop-ment of the Arctic region, having a neg-ative impact on human health. The con-sequences of anthropogenic pressure on the environment that have accumulated over many years have a huge negative impact on the health of the population of the Arctic;
- the main natural factors of negative impact on human health in the Arctic are the cold factor, increased electromagnet-ic activity, increased ionizing radiation, low absolute air humidity, frequent and abrupt changes in atmospheric pressure, and specific photoperiodism. These nat-ural factors are immanent characteristics of the environment of the Arctic region and have a constant negative impact on human health;
- negative environmental factors of the Arctic zone, which are of anthropo-genic origin, are pollution of surface and groundwater, as well as soil cover with oil products and waste from other industrial production; increased concentration of persistent toxic substances (PTS) in the atmospheric air of the industrial centers of the Arctic region, triggered by emis-sions of mining and ore-dressing com-plexes, as well as enterprises of ferrous and non-ferrous metallurgy; radionu-clides accumulated in the environment of the Arctic zone as a result of past nuclear tests, as well as the potential danger from existing man-made sources of radiation. It should be noted that the negative im-pact of many of these factors on human health is increasing (the effect of “Arctic synergy”) due to the influence of the nat-ural climatic conditions of the North. In addition, environmental risks (due to the vulnerability of Arctic ecosystems) and, accordingly, risks to human health as a result of anthropogenic environmental impact, are also likely to be immanent;
- a significant contribution to reduc-ing the harmful effects of anthropogenic pressures on the environment can be made by an effective mechanism of le-gal regulation of the relationship between man and nature, taking into account the specifics of the ecology of the Arctic re-gion, in particular, its endemicity and vulnerability. According to the authors, it is necessary to adopt a comprehensive federal law “On the Arctic zone of the Russian Federation”, providing a special legal regime for the use and protection of the environment of the Russian Arctic. In addition, it is necessary to include in the sectoral legislation the rules governing the legal status of natural and nature-re-source objects in the Arctic.
1. Об основах охраны здоровья граждан в Российской Федерации: федер. закон от 21.11.2011 № 323-ФЗ [ред. от 06.03.2019]. Со-брание законодательства РФ. 2011; 48: 6724. [On the basis of the protection of public health in the Russian Federation: Feder. Law of 21.11.2011 No. 323-FZ [ed. from 06.03.2019]. Sobranie za-konodatel'stva RF.2011; 48: 6724. (In Russ.).]
2. Об утверждении Концепции демографи-ческой политики Российской Федерации на период до 2025 года: указ Президента РФ от 09.10.2007 № 1351 [ред. от 01.07.2014]. Со-брание законодательства РФ. 2007; 42: 5009. [On approval of the Concept of the demographic policy of the Russian Federation for the period until 2025: Presidential Decree of 09.10.2007 No. 1351 [ed. from 01.07.2014]. Sobranie zakonoda-tel'stva RF. 2007; 42: 5009. (In Russ.).]
3. Основы государственной политики Рос-сийской Федерации в Арктике на период до 2020 года и дальнейшую перспективу: утв. Президентом РФ от 18.09.2008 № Пр-1969. Российская газета. 2009; 53п. (разделы I-IV). [The fundamentals of the state policy of the Rus-sian Federation in the Arctic for the period up to 2020 and further perspective: app. by the Presi-dent of the Russian Federation of 18.09.2008 No. Pr-1969. Rossiyskaya gazeta. 2009; 53p. (Sec-tions I-IV). (In Russ.).]
4. Агбалян Е.В. Предикторы экологическо-го стресса Центральной Арктики. Научный вестник Ямало-Ненецкого автономного окру-га. 2014; 2 (83): 81-86. [Agbalyan EV. Predic-tors of environmental stress in the Central Arctic. Nauchnyj vestnik YAmalo-Neneckogo avtonom-nogo okruga. 2014; 2 (83):81-86. (In Russ.).]
5. Грамберг И. С., Додин Д. А., Лаверов Н. П. и др. /Отв. ред. д. г. -м. н. Додин Д. А. Ар-ктика на пороге третьего тысячелетия (ресурс-ный потенциал и проблемы экологии). Санкт-Петербург: Наука. 2000; 247. [Gramberg IS, Do-din DA, Laverov NP. The Arctic on the threshold of the third millennium (resource potential and en-vironmental problems). Sankt-Peterburg: Nauka. 2000; 247 (In Russ.).]
6. Белишева Н.К. Значение вариаций гео-магнитного поля для функционального состо-яния организма человека в высоких широтах. Геофизические процессы и биосфера. 2005; Т.4.(1/2): 44-52. [Belisheva NK. The value of geo-magnetic field variations for the functional state of the human body in high latitudes. Geofizicheskie processy i biosfera. 2005; T.4. (1/2): 44-52. (In Russ.).]
7. Белишева Н.К. Медико-биологический мониторинг - как средство оценки качества окружающей среды для здоровья населения на Севере. Материалы VII Северного социаль-но-экологического конгресса. М. ООО «Первая Оперативная Типография». 2012;93-111. [Beli-sheva NK. Medical and biological monitoring - as a means of assessing the quality of the environ-ment for the health of the population in the North. Proceedings of the VII Northern Socio-Ecologi-cal Congress. M. OOO «Pervaya Operativnaya Tipografiya».2012; 93-111 (In Russ.).]
8. Величковский Б.Т. Причины и механиз-мы снижения коэффициента использования кислорода в легких человека на Крайнем Севере. Биосфера. 2010; Т1.1.(2):213-217. [Velichkovsky BT. The causes and mechanisms of reducing the utilization of oxygen in the hu-man lungs in the Far North. Biosfera. 2010; Vol. 1.(2):213-217. (In Russ.).]
9. Виноградова И.А. Световой режим Се-вера и возрастная патология. Петрозаводск.
References

ЯКУТСКИЙ МЕДИЦИНСКИЙ ЖУРНАЛ84
Петро-Пресс. 2012; 128. [Vinogradov IA. Light regime of the North and age pathology. Petroza-vodsk. Petro-Press. 2012; 128. (In Russ.).]
10. Гладун Е.Ф. Охрана окружающей среды в Арктике в период промышленного освоения: анализ законодательства Арктических госу-дарств. Вестник Тюменского государственно-го университета. Социально-экономические и правовые исследования. 2015; Т.1. (3 (3)): 132-142. [Gladun EF. Environmental protection in the Arctic in the period of industrial development: an analysis of the legislation of the Arctic states. Vestnik Tyumenskogo gosudarstvennogo univer-siteta. Social'no-ekonomicheskie i pravovye issle-dovaniya. 2015; Т.1. (3 (3)): 132-142. (In Russ.).]
11. Додин Д.А. Геоэкологические аспекты мониторинга окружающей среды Российской Арктики. Современная геодинамика, глубин-ное строение и сейсмичность платформенных территорий и сопредельных регионов: матери-алы международной конференции. 2001; 73-75. [Dodin DA. Geoecological aspects of environ-mental monitoring in the Russian Arctic. Sovre-mennaya geodinamika, glubinnoe stroenie i se-jsmichnost' platformennyh territorij i sopredel'nyh regionov: materialy mezhdunarodnoj konferencii. 2001; 73-75. (In Russ.).]
12. Кандрор И.С. Очерки по физиологии и гигиене человека на Крайнем Севере. М.: Медицина. 1968; 279. [Kandror IS. Essays on human physiology and hygiene in the Far North. M.:Medicina. 1968; 279. (In Russ.).]
13. Колосов Ю.М., Кривчикова Э.С. Между-народное право: учебник. М.:Высшее образо-вание, Юрайт-Издат. 2009; 1012. [Kolosov YuM, Krivchikova ES. International Law: textbook.
M.:Vysshee obrazovanie, YUrajt-Izdat.. 2009; 1012. (In Russ.).]
14. Кондратьева В.И. Арктика: перспекти-вы устойчивого развития. Арктика и Север. 2015;18:148-169. [Kondratyeva VI. Arctic: pros-pects for sustainable development. Arctica I Sev-er. 2015;18:148-169. (In Russ.).
15. Лиманзо А.Г. Роль общин коренных малочисленных народов Севера в устойчивом развитии региона. В мире коренных народов: альманах. 2014; 48-52. [Limanzo AG. The role of the indigenous communities of the North in the sustainable development of the region. V mire korennyh narodov: al'manah. 2014; 48-52. (In Russ.).]
16. Солонин Ю.Г. Медико-физиологические проблемы в Арктике. Известия Коми научно-го центра УрО РАН. 2017;4(32):33-40. [Solon-inYuG. Medical and physiological problems in the. Izvestiya Komi nauchnogo centra UrO RAN. 2017;4(32):33-40. (In Russ.).]
17. Хаснулин В.И. Введение в полярную медицину. Новосибирск. СО РАМН. 1998; 337. [Hasnulin VI. Introduction to polar medicine. No-vosibirsk. SO RAMN. 1998; 337. (In Russ.).]
18. Чащин В.П. Характеристика основных факторов риска нарушений здоровья населе-ния, проживающего на территориях активно-го природопользования в Арктике. Экология человека. 2014; 1:3-12. [Chashchin VP. Char-acteristics of the main risk factors for health dis-orders of the population living in areas of active nature management in the. Ekologiya cheloveka. 2014;1:3-12. (In Russ.).]
19. Ченских Н.А. Фактор экологической безопасности в хозяйственной деятельности
США и России в Арктике. Азимут научных ис-следований: экономика и управление. 2015; 4 (13):116-120. [Chenskikh NA. The environmen-tal safety factor in the economic activities of the United States and Russia in the Arctic. Azimut nauchnyh issledovanij: ekonomika i upravlenie. 2015; 4(13):116-120. (In Russ.).]
20. Чучалин А. Г. Хронические обструктив-ные болезни легких. ЗАО «Издательство БИ-НОМ». 1999; 512. [Chuchalin AG. Chronic ob-structive pulmonary diseases. ZAO «Izdatel'stvo BINOM». 1999; 512. (In Russ.).]
21. Юдахин Ф.Н. Аэротехногенное загряз-нение окружающей среды Архангельской агло-мерации и прилегающих к ней территорий. Геоэкология. Инженерная геология, гидрогео-логия, геокриология. 2001; 4:369-374. [Yudahin FN. Aerotechnogenic pollution of the Arkhangelsk agglomeration and adjacent territories. Geoe-kologiya. Inzhenernaya geologiya, gidrogeologi-ya, geokriologiya. 2001; 4: 369-374. (In Russ.).]
22. Юшкин Н. П. Минеральные ресурсы Российской Арктики. Север как объект ком-плексных региональных исследований. Сык-тывкар. 2005; 512. [Yushkin NP. Mineral resourc-es of the Russian Arctic. Sever kak ob"ekt kom-pleksnyh regional'nyh issledovanij. 2005; 512. (In Russ.).]
23. Gudkov AB, Tedder JuR. Metabolic Changes in workers under conditions of Expedi-tion shift work Schedule beyond the Polar Circle // Human Physiology. 1999;25(3):370-373.
24. The State-Federal Joint Pipeline Office. URL: http: // dnr.alaska.gov/commis/pco/jpo.htm
25. The World Health Report 2002/ Reducing Risks, Promoting Healthy Life. Geneva, 2002; 248.

3’ 2019 85
Introduction. The demand for scien-tific studies detailing the results of addi-tional vitaminization of schoolchildren is related to the fact that the actual nutrition of children aged 7-14 years in the Arctic is characterized by significant shortcom-ings in the form of a deficiency of micro and macro nutrients, which increases the risk of developing many diseases [1, 5, 7, 12]. Especially important is the optimal supply of vitamins of children of primary school age, when intensive growth and formation of the organism.
The national program for the optimi-zation of the provision of vitamins and minerals of children in Russia empha-
sized that one of the methods of choice that favorably differ from others is the vitaminization of children's food rations using multivitamin preparations [5]. This has been justified earlier in Russia [1, 5, 7] and abroad [9, 11, 12].
For reliable evidence of the effect of the use of vitamin complexes for prophy-lactic purpose the object of study should include the characteristics of homeostatic systems of indicators of the adaptive ca-pabilities of the organism. These require-ments are met by blood cells as com-ponents of the immune system involved in adaptive responses to preserve the changed homeostasis [3, 10].
It is well known the participation of blood cells in the mechanisms of the adaptation syndrome, including the con-ditions of the Far North [2, 4]. Monoami-nergic systems exert their influence on immune responses through the hypothal-amus-pituitary-adrenal system. The reali-zation of these processes occurs through the action of mediators and hormones on the corresponding receptor structures of the cells of the immune system [3, 10].
It is known that hormones and neu-rotransmitters can affect the functional activity of these cells, causing either stim-ulation of the immune response with an increase in the proliferative abilities of the cells, or activate suppressor activity, re-
ducing the level of the immune response [2, 3, 10]. In the literature there is infor-mation that the complexes of vitamins and minerals exhibit immunomodulatory and antioxidant activity have an adapto-genic effect on the organism [1, 3, 7.
There are no studies on the variabil-ity of the immune system parameters in children of primary school age after pro-longed vitaminization in the conditions of the Far North, which determines the rele-vance and scientific novelty of this work.
Aim of the study: to identify the fea-tures of the variability of morphofunction-al indicators of the immune system of schoolchildren after prolonged vitamini-zation in the Arctic.
Material and methods of research. Schoolchildren - representatives of the alien population of the North aged 10–11 years living in the city of Norilsk (60 peo-ple) were under observation. The children of the same school, who regularly took a domestic multivitamin complex, 1 tablet once a day, during the school year from September to March, made up the main observation group (n = 30, 15 girls and 15 boys). Children from another school who did not take multivitamins constitut-ed the comparison group (n = 30, 15 girls and 15 boys).
Both schools were located in areas with the same environmental situation.
The paper reports a representative study of the effect of vitaminization of children of the North on one of the most important indicators of health - immunity. Objective of the study: to identify the features of the variability of morphofunctional indicators of the immune system of schoolchildren after prolonged vitaminization in the Arctic.
Materials and methods. Practically healthy schoolchildren aged 10-11 years (60 people) living in the city of Norilsk was examined. Children from the same school, who regularly took a domestic multivitamin complex of 1 tablet once a day from September to March, made up the main group (n = 30). Children from another school who did not take multivitamins formed a comparison group (n = 30). The luminescent-histochemical method of H. Yokoo et al. (1982) modified by V.P. Novitskaya (2000), the content of catecholamines (CA) and serotonin (Ser.) in lymphocytes and the ratio of catecholamines: serotonin (CA / Ser.) were determined; hematological method was used to determine the blood composition indicators in percent: basophils, %, eosinophils, %, band neutrophils,%, neutrophils,%, lymphocytes,%, monocytes, %, and the Garkavi index : lymphocytes / neutrophils.
Results and discussion. It was established that after the inclusion of multivitamins in the diet of children, a decrease in the level of CA and an increase in the serotonin content in blood lymphocytes was observed. It was revealed that in boys of the main group the level of CA decreased by 2.6 times (p <0.001), whereas in girls it was only 1.5 times (p <0.01) relative to the children of the comparison group. Along with a change in the balance of neurotransmitters after taking multivitamins in girls and boys in the main group, an increase of 1.5-1.6 times (p<0.05) was observed in the percentage of band neutrophils relative to children in the comparison group.
Conclusion. The results of the study showed the multivariate functioning of the immune system of schoolchildren in the conditions of the Far North after the inclusion of multivitamins in the diets. A change in the balance of regulatory indicators in schoolchildren's lymphocytes, which can change the functional activity of these cells, has been established. Carried out vitaminization, among schoolchildren of the Polar region significantly changes the balance of the cellular elements of peripheral blood in children in this region.
Keywords: North, schoolchildren, vitaminization, variability of blood parameters.
V.P. Novitskaya, E.I PrakhinINFLUENCE OF ADDITIONAL VITAMINIZATION OF SCHOOLCHILDREN RATIONS IN THE ARCTIC ON VARIABILITY OF MORPHOFUNCTIONAL PARAMETERS OF THE IMMUNE SYSTEMDOI 10.25789/YMJ.2019.67.25
FRC КSC SB RAS Research Institute of Med-ical Problems of the North, Krasnoyarsk, Rus-sia: NOVITSKAYA Valentina Petrovna – Doc-tor of Biological Sciences, Senior Researcher Clinical Pathophysiology Laboratories FRC KSC SB RAS Research Institute MPN, ad-dress: 660022, Krasnoyarsk, st. Partizana Zheleznyaka d.3 "g", tel.: 8 (391) 228 - 06 – 83, Е-mail: [email protected], ORCID 0000-0002-7556-7699; PRAКHIN Efim Isaakovich – Doctor of Medical Sciences, Professor, Chief Researcher, Laboratory of Clinical Pathophys-iology, FRC KSC SB RAS Research Institute MPS, address: 660022, Krasnoyarsk, st. Par-tizana Zheleznyaka d. 3 "g", tel.: 8 (391) 228 - 06 - 83, Е-mail:[email protected], ORCID 0000-0003-1583-9928

ЯКУТСКИЙ МЕДИЦИНСКИЙ ЖУРНАЛ86
The criterion for inclusion in the study was that the children were somatically healthy, did not take other medications and vitamin complexes, did not under-go vaccination during this period. The examination of children was carried out in consultation with the school adminis-tration, when parents signed an informed consent to conduct this observation and study.
The exclusion criterion from the study was deviations in the condition of the children and the disagreement of the chil-dren and the parents.
As a means for prophylactic vitamini-zation, a multivitamin complex containing basic vitamins was used, whose compo-sition is close to the physiological daily needs of school-age children [4]. The composition of one multivitamin bean contains the following components: vi-tamins − A − 3300 IU (200% of daily need); B1 − 0.002 g (133%); B2 − 0.002 g (153%); B6 − 0.003 g (143%); B12 − 0.000002 g (6.7%); PP − 0.02 g (100%); P − 0.01g (6.7%); E − 0.01 g (56%); C − 0.075 g (107%); folic acid − 0.00007 g (17.5%) and calcium pantothenate 0.03 g (60%).
After vitaminization, the children took blood from a finger. On blood smears us-ing the fluorescent-histochemical meth-od of H. Yokoo et al. (1982) modified by V.P. Novitskaya (2000), the content of monoamines, catecholamines (CA) and serotonin (Ser.) [6] was determined in lymphocytes. The level of catechol-amines and serotonin was expressed in conventional units (cu) and the ratio of catecholamines: serotonin (CA / Ser.) was calculated.
The hematological method deter-mined the composition of blood leuko-cytes in percent (leukocyte formula): eosinophils,%, basophils,%, band neutrophils,%, neutrophils,%, lym-phocytes,%, monocytes,%. As an in-tegration test, the adaptation index Garkavi was used, calculated the ratio of lymphocytes:neutrophils. Statistical processing was performed using the soft-ware package “Statistica v. 6.1”. The data are presented as X ± x, where X – is the arithmetic average, x – is the average er-ror. The Mann – Whitney U-test was used to estimate the difference between the average in pairwise unrelated samples, the difference of values was considered significant at p <0.05.
Results and discussion. Studies have shown that changes in the morpho-logical and functional parameters of the cells of the immune system in the exam-ined groups of children are characterized by significant differences (Table 1). First
of all, it was revealed that the level of cat-echolamines in lymphocytes of children living in conditions of the North (compari-son group) is significantly higher, and the level of serotonin is significantly lower than in children living in middle latitudes [6]. This ratio is probably related to the initially large voltage of adrenergic sys-tems, in extreme polar conditions, when the child’s organism is to some extent protected from the effect of their excess, by accumulating catecholamines mainly in the blood cells.
The inclusion of a multivitamin com-plex in the diets of children of the Po-lar region, made it possible to identify the dependence of the variability of the morphofunctional parameters of the im-mune system on the sex of the child. After vitaminization in children of the main group of Norilsk, revealed a de-crease in the content of СА and an in-crease in the level of serotonin in blood lymphocytes were found relative to the indicators of children in the comparison group (Table 1). So, when comparing the degree of decrease in the content in the lymphocytes of СA, it was found that in boys of the main group, the level of СA decreased by 2.6 times (p <0.001), whereas in girls only 1.5 times (p <0.01) relative to children comparison groups. Thus, after taking multivitamins in boys of the main group, the level of CA was
lower by 41.7% (p <0.001) than in girls.When comparing the degree of in-
crease in the serotonin content in the lymphocytes of children, it was found that in girls of the main group the level of serotonin increased 2 times (p <0.01) whereas in boys only 1.5 times (p <0.05) compared to children of the comparison group. Accordingly, the ratio of СA / Ser. in boys of the main group, it was lower by 3.8 times (p <0.01), and in girls it was only 2.5 times lower (p <0.01) rel-ative to the children of the comparison group. Thus, the ratio of СA / Ser. in boys 2 times lower (p<0.01) than in girls of the main group (Table 1).
By themselves, these facts indicate a possible decrease in the rate of capture of СA by lymphocytes or a decrease in their synthesis by cells. On the other hand, the level of monoamines characterizes sexu-al dimorphism of the reactivity of immune cells in schoolchildren of the Far North.
The decrease in this ratio in children of the North after vitaminization indicates a change in the balance of neurotransmit-ters, which play a huge role in the pro-cess of human adaptation to the condi-tions of the North. The study showed that the use of multivitamins selectively mod-ulates the activity of peripheral monoami-nergic structures,
Analysis of hematological parameters obtained by us (Table 2) in children of
he content of monoamines in the blood lymphocytes of children of two schools in Norilsk after vitaminization (X ± x)
IndicatorMain group Comparison group
Girlsn=15
Boysn=15
Girlsn=15
Boysn=15
Catecholamines (cu)Serotonin (cu)СA / Ser.
42.0± 3.57**130.8± 21.34**0.42± 0.09***
24.5± 1.9***127.7± 12*0.21± 0.02**
62.2± 3.9965.86± 6.141.05± 0.11
63.93± 3.2385.2± 5.110.8± 0.07
Note. In the Tables 1 and 2 statistically significant differences between the groups of children taking vitamins (main group) and the comparison group: * р<0,05; ** р<0,01; ***р<0,001.
Table 1
Leukocyte blood counts in children from two schools in the city of Norilsk after vitaminization (X ± x)
ПоказательГруппа основная Группа сравнения
девочкиn=15
мальчикиn=15
девочкиn=15
мальчикиn=15
Eosinophils, %Basophils, %Band neutrophils, %Neutrophils, % Lymphocytes, %Monocytes, %Lymphocytes : Neutrophils
5.3± 1.310.3± 0.16*4.7± 0.12*40.9± 1.7446.5± 1.692.3± 0.38**1.16± 0.08
4.47± 0.820.31± 0.114.15± 0.11*39.73± 2.0250± 1.921.26± 0.21.34± 0.1
4.2± 0.931.13± 0.28**3.13± 0.1541.93± 1.7948.13± 1.491.46± 0.281.19± 0.01
5.53± 0.650.26± 0.122.53± 0.1243.4± 1.6847.06± 1.871.2± 0.21.12± 0.08
Table 2

3’ 2019 87
the alien population of the Polar region (comparison group) showed that the characteristic of the cellular composition of peripheral blood is mainly subject to patterns, studied in detail and well known in the literature. In these groups, high val-ues of the Garkavi adaptation index are recorded, which correspond to the reac-tion of increased activation of the organ-ism.
The shift in the level of neurotransmit-ters we noted after prophylactic vitamini-zation is also reflected in the composition of the leukocyte formula. (Table 2). The initial structure of the blood composition indicators (the comparison group) by gender did not significantly differ among schoolchildren in the Polar region. We can only note that in the comparison group girls, the level of basophils is 80% (p<0.01) higher than in boys. Such a structure of blood parameters, apparent-ly, can be regarded as one of the variants of regional specificity.
We found that after vitaminization there are differences in the leukocyte formula between girls and boys. Thus, in the girls of the main group, a decrease in the basophil content by 3.76 times (p <0.05) relative to the girls of the compar-ison group was revealed. It is known that there is a close functional relationship between peripheral blood basophils and tissue basophils. It is noticed that with a decrease in cells of one type, the number of cells of another type increases [3]. Ac-tivation of tissue basophils is usually ac-companied by the release of biologically active components, such as serotonin [3]. Confirmation of this, we see that after vitaminization in the lymphocytes of chil-dren in the main group of Norilsk, the lev-el of serotonin was higher than in children of the comparison group.
Along with a change in the balance of neurotransmitters after taking multivi-tamins in children of the main group, a change in the percentage of band neutro-phils was revealed. In both girls and boys of the main group, an increase of 1.5-1.6 times (p<0,05) was observed in the percentage of band neutrophils relative to the children in the comparison group. The increased level of band neutrophils in the blood indicates the activation of bone marrow cells to enhance prolifera-tion and mitotic activity, probably due to multivitamins.
The results described clarify the idea that an increase in band neutrophils
usually occurs during acute or moder-ate chronic stress. The development of neutrophilic leukocytosis is mainly asso-ciated with an increased intake of bone marrow or vascular neutrophils from the cellular reserve into the circulation, which are recruited by glucocorticoid and monoamines. According to modern con-cepts, central adrenergic, dopaminergic and serotonergic structures play a co-ordinating role in the implementation of the response of the blood system to the effects of extreme irritants of various eti-ologies [2].
In addition, in the main group of girls, an increase of 45.2% (p<0.01) in the per-centage of monocytes relative to the main group of boys was established (Table 2)
After vitaminization in the main groups of schoolchildren, high values of the Garkavi adaptation index were also ob-served, which correspond to the reaction of increased activation of the organism.
Conclusion. The research results showed the complexity and multivariabili-ty of the functioning of the immune system of schoolchildren in the conditions of the Far North after the inclusion of multivita-mins in the diets. A change in the balance of regulatory indicators in schoolchil-dren's lymphocytes, which can change the functional activity of these cells, has been established. The decrease in the level of СА and the increase in the se-rotonin content are associated not only with the effect of the vitamin complex on biochemical mechanisms, the synthesis and decomposition of monoamines, but also with the state of the metabolic and regulatory systems of the inhabitants of the North.
Vitaminization among schoolchildren of the Polar region significantly changes the balance of the cellular elements of peripheral blood in children in this region.
1. Васильев А.В. Каспаров Э.В., Прахин Е.И. Перспективные задачи оптимизации питания на основе современных методов оценки пищевого статуса и энерготрат. Вопросы детской диетологии. 2010; 8(3): 44-46. [Vasilyev AV, Kasparov EV, Prakhin EI. Per-spective tasks of optimizing nutrition based on modern methods of assessing food status and energy expenditure. Voprosy detskoj dietologii. 2010; 8(3): 44-46 (In Russ).].
2. Дыгай А.М., Скурихин Е.Г. Моноами-нэргическая регуляция кроветворения при экстремальных воздействиях Бюллетень экспериментальной биологии и медицины. 2011;151(2):132-139. [Dygai AM, Skurikhin EG.
Monoaminergic regulation of blood formation un-der extreme conditions. Byulleten' eksperimen-tal'noj biologii i mediciny. 2011; 151(2): 132−139. (In Russ)].
3. Практические аспекты диагностики и лечения иммунных нарушений: руководство для врачей. Козлов В.А., Борисов А.Г., Смир-нова С.В. [и др.]. Новосибирск: Наука, 2009: 274. [Practical aspects of the diagnosis and treatment of immune disorders: a guide for phy-sicians. Kozlov VA., Borisov AG., Smirnova SV. [et al.].Novosibirsk: Nauka 2009: 274. (In Russ)].
4. Методические рекомендации. Нормы физиологических потребностей в энергии и пищевых веществах для различных групп населения РФ. МР 2.3.1. 24-32-08 от 18 декабря 2008. Вопросы детской диетологии. 2011; 9(6):62 −76. [Guidelines. Norms of physiological needs for energy and nutrients for various groups of the population of the Russian Federation. MR 2.3.1. 24-32-08 dated December 18, 2008. Vo-prosy detskoj dietologii 2011; 9(6): 62−76. (In Russ)].
5. Национальная программа по оптими-зации обеспеченности витаминами и мине-ральными веществами детей России: (и использованию витаминных и витаминно-минеральных комплексов и обогащенных продуктов в педиатрической практике) / Союз педиатров России [и др.]. М.: ПедиатрЪ. 2017: 152. [National Program on Optimization of the Provision of Vitamins and Minerals of Russian Children: (and the use of vitamin and vitamin-min-eral complexes and fortified products in pediatric practice) Union of Pediatricians of Russia [et al]. M.: Pediatr. 2017: 152. (In Russ)].
6. Новицкая В.П. Модификация метода определения моноаминов в лейкоцитах на мазках периферической крови. Клиническая лабораторная диагностика. 2000; 1: 24,33. [No-vitskaya VP. Modification of the method for the determination of monoamines in leukocytes on peripheral blood smears. Klinicheskaya labora-tornaya diagnostika. 2000; 1: 24.33. (In Russ)].
7. Шевченко И. Ю. Научное обоснование коррекции питания и пищевого статуса детей школьного возраста Красноярского края: автореф. дисс…. д-ра мед. наук Кемерово, 2009: 33. [Shevchenko IYu. Scientific rationale for the correction of nutrition and nutritional status of school-age children in the Krasnoyarsk Territo-ry: author. diss ... Dr. med Sciences. Kemerovo. 2009: 33.
8. Chavan SS, Tracey KJ. Essential Neurosci-ence in Immunology. J. Immunol. 2017; 198 (9): 3389 – 3397. DOI: 10.4049/jimmunol.1601613
9. Suboptimal micronutrient intake among children in Europe. Kaganov В, Caroli М, Mazur А, Singhal А, Vania А. Nutrients. 2015; 7(5): 3524 − 3535. DOI: 10. 3390/nu7053524
10. Nicholson LB. The immune system. Essays Biochem. 2016; 60 (3): 275 − 301. DOI:10.1042/EBC20160017
11. Sichet-Hellert W, Kersting M. Vitamin and mineral supplements use in German children and adolescents between 1986-2003: results of the DONALD study. Ann.Nut.Metab. 2004; 48 (6): 414− 419. DOI: 10. 1159/000083574
12. Use of multiple micronutrient powders for point-of-use fortification of foods consumed by infants and young children aged 6–23 months and children aged 2–12 years. WHO. 2016: 60. Licence: CC BY-NC-SA 3.0 IGO.
References

ЯКУТСКИЙ МЕДИЦИНСКИЙ ЖУРНАЛ88
Introduction. Sleep parameters are determined by a number of biological, environmental and social factors [3]. In modern society people spend a signifi-cant part of their time in a closed space, so it is logical to assume that the signals of social time play a major role in syn-chronizing the rhythm of sleep-wakeful-ness. On the other hand, a recent study
showed that the phase of the sleep-wake rhythm (chronotype) of a person is de-termined by the time of sunrise [18]. With the growth of industrialization of society, the difference between social and biological clocks is growing. Among the population of megacities, the fre-quency of detecting individuals with a late chronotype, which is characterized by desynchronization of the circadian system, called the “social jet lag” [2], is increased. For this reason, individu-als with a late chronotype exhibit lower school performance [14] and are prone to consume stimulants 2]. At school age, most children retain a sleep duration of 10–11 hours, however, increased edu-cational and physical activity can neg-atively affect a child’s sleep. These dis-orders often come in conjunction with attention deficit hyperactivity disorder (emotional reactions and cognitive im-pairment) [1]. Studies of daytime sleep-iness of schoolchildren in different coun-tries revealed a rather high frequency of spread, especially during puberty, from 51% in Turkey [15] to 63% in Japan [12] and 68% in Canada [20]. In Russia, this problem has hardly been studied among schoolchildren of primary school age.
The aim of our work was to study the influence of various factors on excessive daytime sleepiness of children and ado-lescents living in the north of the Europe-an part of Russia.
Materials and methods. The study was conducted in 2018 among students of grades 1-6 of secondary schools locat-ed in 8 settlements of the European North of the Russian Federation: in the Repub-lic of Karelia - Petrozavodsk, Kem, Ko-stomuksha, Vidlitsa, Rabocheostrovsk; in the Murmansk region - Apatity, Olene-gorsk, Umba. The research program was approved by the Committee on Bioethics
of the Institute of Biology of the Karelian Scientific Center of the Russian Acad-emy of Sciences and by the Joint Ethics Committee on Medical Ethics under the Ministry of Health of the Republic of Ka-relia (Protocol No. 41 from 08.01.2018). All respondents or their legal representa-tives were informed with the purpose of the upcoming study and signed an in-formed consent to participate in it. Ques-tionnaires were distributed to students by teachers or school psychologists. Incom-plete questionnaires and questionnaires with several answers instead of one were excluded from the analysis.
At the preliminary stage, we conducted a study to assess the reliability and valid-ity of the Russian version of the children's daily sleepiness scale (PDSS-RUS) [17]. Further, in the framework of the project, in a sample of schoolchildren it was pro-posed to evaluate the occurrence of vari-ous sleep disorders and to identify the relationship of sleep characteristics with various lifestyle factors. Assessed: de-mographic data, lifestyle, school perfor-mance and the self-adminstered scale of daytime sleepiness in children (Pediatric Daytime Sleepiness Scale). Each re-spondent was asked to answer questions regarding personal data, as well as fill out a questionnaire: Munich Chronotype As-sessment Test (MCTQ). Questionnaires were processed according to the work of MCTQ [18]. The chronotype was ex-pressed as the middle of the sleep phase on the day off in hours, adjusted for the "duty" of sleep accumulated over the school days. The higher the value of the indicator, the more a person belongs to a later chronotype. The average weekly sleep duration was calculated.
Statistical processing was performed in the PAST package (PALEONTOLOGI-CAL STATISTICS SOFTWARE PACK-
Parameters of sleep and excessive daytime sleepiness were studied in 601 children aged 7-12 years living in the Arctic zone of Russia. No gen-der differences in daytime sleepiness were found. Our work also found the delay in bedtime onset for most children 7-12 years old. Self-question-naires revealed awakenings in the middle of the night in almost half of the children, and insomnia was mild or moderate in 43.3% of the examined children in the European North of Russia. We have shown that children’s age affects the level of daytime sleepiness. Consequently, older children must sleep more than younger ones to achieve the same level of alertness and cognitive ability. Thus, children compensate for lack of sleep during the next day via daytime nap.
Keywords: daytime sleepiness, chronotype, children, Arctic, children, age, sex, sleep duration.
S.N. Kolomeichuk, A.V. Morozov, D.A. Petrashova, V.V. Pozharskaya, E.B. Stafeeva1, I.A. Vinogradova, M.V. Bochkarev, B.A. Tarasov
DAYTIME SLEEPINESS AND SLEEP PARAMETERS IN CHILDREN LIVINGIN THE EUROPEAN NORTH OF RUSSIADOI 10.25789/YMJ.2019.67.26
KOLOMEICHUK Sergey Nikolaevich Cand. Sci. (Biol.), Senior Researcher Laboratory of Genetics, Institute of Biology of the Karelian Scientific Center of the Russian Academy of Sciences, Petrozavodsk, Russian Federatrion: [email protected]; MOROZOV Artem Vladimirovich leading biologist Institute of Biology of the Karelian Scientific Center of the Russian Academy of Sciences, Petrozavodsk, Russian [email protected]; STAFEEVA Elena Borisovna Leading biologist Institute of Biology of the Karelian Scientific Center of the Russian Academy of Sciences, Petrozavodsk, Russian Federation [email protected]; PETRASHOVA Dina Aleksandrovna Cand. Sci. (Biol.), Senior Researcher, Head of the Laboratory of the medical and biological technologies, Kola Science Centre, Russian Academy of Sciences, Apatity [email protected]; POZHARSKAYA Viktoria Viktorovna Cand. Sci. (Biol.), researcher Research Center for Biomedical Problems of Human Adaptation in the Arctic, Kola Science Centre, Russian Academy of Sciences,, Apatity [email protected]; VINOGRADOVA Irina A. Doctor (Biol), Professor, Head of Dept Human & Animal Physiology, Pathology, Histology, Medical Institute, Petrozavodsk State University, Petrozavodsk, Russian Federation [email protected]; BOCHKAREV Mikhail V. junior research associate Almazov National Medical Research Centre, St. Petersburg, Russian Federation; TARASOV Boris A. Cand. Sci. (Biol.), Head of Expert Board Project Office for Arctic Development PORA Moscow, [email protected]

3’ 2019 89
Sleep disorders in children living in the European North of the Russian Federation, identified in the study (n = 601)
Low subjective sleep assessment, n (%) 341 (56.7)Night awakenings, n (%) 360 (58.3)
Duration of falling asleep, n (%)0-15 min15-30 min30-60 min>60 min
180 (30)350 (58.3)51 (8.4)20 (3.3)
Daytime sleepiness, n (%) 92 (15)
Insomnia severity scale, n (%)NoneLight
Moderate
341 (56.7)220 (36.6)40 (6.7)
AGE FOR EDUCATION AND DATA ANALYSIS, Norway).
Results and discussion. The aver-age age of the children was 10.62 ± 2.87 years. Table 1 presents information on the sex and age composition of the re-spondents. In the questionnaires, the an-swers to the questions corresponded to the normal distribution, and the average total score was 11.95 ± 6.2. We did not find gender differences on the daytime sleepiness scale. The reliability and reli-ability of the PDSS-RUS questionnaire is validated and confirms its one-factor structure. The Russian version of PDSS can be used in our study to assess sleep hygiene among Russian children and adolescents [17].
Most of the surveyed children showed excess daytime sleepiness within nor-mal limits (less than 16 points on the PDSS scale). Significant differences in the level of drowsiness were found in children of primary school age, both in northern Karelia and in the Murmansk re-gion (PDSS (May) M ± m (11.95 ± 6.24) versus PDSS (February) M ± m (12.75 ± 6.06, p <0.05) .For the group of indig-enous people of the same age category, there is a tendency to increase this indi-cator (PDSS (May) M ± m (12.01 ± 5.72) versus PDSS (October) M ± m (12.79 ± 5.79, p> 0.05), respectively ) (Fig. 1B). In addition, there was an inverse correlation for the duration of sleep with estimates of the drowsiness scale (r = -0.122, p =
0.02). This suggests that children com-pensate for the lack of drinking during the next day due to daytime sleep. Our work also shows a delay in bedtime for most children 7-12 years old. According to self-questionnaires, awakenings were revealed in the middle of the night in al-most half of the children, and in 43.3% of the examined children in the European North of Russia insomnia is expressed in mild or moderate degree (Table 2).
In all the settlements of the European North of the Russian Federation, where we conducted studies, it was found that daytime sleepiness increased with age (Fig. 1A). This fact is consistent with ear-lier studies for various ethnic groups [12, 4]. Thus, older children must sleep more than younger children in order to achieve the same level of alertness and cognitive ability [16, 20, 6]. Feinberg and Camp-bell suggested an alternative hypothesis - increased drowsiness in adolescents in the daytime is a consequence of the re-organization of their brain, which reduces the intensity of activity of the waking brain [11]. Surprisingly, these brain changes are not associated with puberty, but are reliably associated with age. Also, as a result of our research, it was found that gender is not associated with daytime sleepiness.
In most studies, PDSS was used as a tool for assessing drowsiness associated with sleep pathologies (respiratory, neu-rological and developmental disorders),
as well as for monitoring the monitoring of side effects of sleepiness treatment [13, 7]. In several works, the authors used a questionnaire to assess healthy children and adolescents [21, 19, 22]. In a number of works, scores ranged from 6.7 to 25.7, showing a tendency to excessive drowsi-ness in the daytime. In addition, higher PDSS scores were associated with de-creased overall sleep time, poor school performance, and frequent illnesses in different countries [18, 19]. The values obtained by us for the PDSS scale cor-respond to published data for healthy
Sample parameters
Variable ResultSex,
male/female, n (%) 321 / 280 (51.3 % / 48.7 %)
Age, n (%)7 years8 years9 years10 years11years12 years
42 (6.9%)135 (22.6%)111 (18.5%)118 (19.6%)124 (20.6%)71 (11.8%)
Physical activity1-2 per week
Every dayRarely
421 (70 %)90 (15%)90 (15%)
Caffeine consumption, n (%)DailyRarelyNever
120 (19.9 %)331 (55 %)
150 (25.1 %)
Alcohol consumption, n (%)Often (every week)
Never40(6.7%)
561(93.3%)
Smoking, n (%)YesNo
110 (18.3%)491(81.7%)
Table 1
Table 2
а
б
Fig. 1. Dynamics of infant drowsiness in chil-dren of the European North of the Russian Federation: a- age dependence, b – season dependence

ЯКУТСКИЙ МЕДИЦИНСКИЙ ЖУРНАЛ90
children from the USA [9], Argentina [19], China [5] and Italy [9]. It should be not-ed that the average age in this sample was 10.62 years. This fact explains why in our study, scores on the PDSS scale are slightly lower than in studies on the drowsiness of Brazilian [10] or Argentine-an children [4].
Conclusion. We have shown that the age of the child affects the level of daytime sleepiness, which, in turn, cor-responds to the level of sexual develop-ment. Consequently, older children must sleep more than younger children in or-der to achieve the same level of alertness and cognitive ability. Thus, children com-pensate for lack of sleep during the next day due to daytime sleep.
Acknowledgements. This work was supported by budget topics (No. 0218-2019-0077), (No. 0218-2019-0073), (No. 0226-2019-0064), (No. 0186-2019-0009). Also, the work was supported by a grant from the Expert Council of the Au-tonomous Non-Commercial Organization (Arctic Project Development Office).
The research was carried out using the equipment of the Core Facility of the Karelian Research Center of the Russian Academy of Sciences.
1. Полуэктов M.Г., Пчелина П.В. Сон у детей от физиологии к патологии. Медицинский совет. 2017; №9: 97-102. [Poluektov MG, Pchelina PV Sleep in children from physiology to pathology. Medical Council. 2017; V. 9: 97-102. (In Russ.)]
2. Roenneberg T, Kuehnle T, Juda M et al. A marker for the end of adolescence. Epidemiology of Human Circadian ClockSleep Med Rev. 2007; 11 (6): 429-38.
3. Roenneberg T, Kuehnle T, Pramstaller PP et al. A marker for the end of adolescence. Cur-rent Biology. 2004; 14:1038-1039.
4. Perez-Lloret S, Videla AJ, Richaudeau A et al. A multi-step pathway connecting short sleep duration to daytime somnolence, reduced atten-tion, and poor academic performance: an explor-atory cross-sectional study in teenagers. J Clin Sleep Med. 2012; 9: 469-473.
5. Gau SS-F, Shang C-Y, Merikangas KR et al. Association between morningness-eveningness and behavioral / emotional problems among ado-lescents. Journal of Biological Rhythms. 2007; 22: 268-274.
6. Carskadon MA, Acebo C, Jenni OG. Regu-lation of adolescent sleep: implications for behav-ior. Ann N Y Acad Sci.. 2004; 1021: 276–91.
7. Randazzo AC, Muehlbach MJ, Schweitzer PK, Walsh JK. Cognitive function following acute sleep restriction in children ages 10–14. Sleep. 1998; 6 (21): 861– 865.
8. Maganti R, Hausman N, Koehn M et al. Ex-cessive daytime sleepiness and sleep complaints among children with epilepsy. Epilepsy Behav. 2006; 8 (1): 272-277.
9. Esposito M, Antinolfi L, Gallai B et al. Ex-ecutive dysfunction in children affected by ob-structive sleep apnea syndrome: an observational study. Neuropsychiatr Dis Treat. 2013; 9: 1087-1094. doi: 10.2147 / NDT.S47287.
10. Ferrari Junior GJ, Drake CL, Barbosa DG et al. Factor structure of the Brazilian version of Pediatric Daytime Sleepiness Scale. Chronobiol-ogy Int. 2018; 35 (8): 1088-1094.
11. Feinberg I, Campbell IG Sleep EEG changes during adolescence: an index of funda-mental brain reorganization. Brain Cogn. 2010; 72 (1): 56-65. doi: 10.1016 / j.bandc.2009.09.09.008.
12. Komada Y, Bregelmans K. Social jetlag affects subjective daytime sleepiness in school-aged children and adolescents: A study using the
Japanese version of the Pediatric Daytime Sleep-iness Scale (PDSS-J). Chronobiology Int. 2016; 33: 1311-1319.
13. Pereira EF, Teixeira CS, Louzada FM. Sonolência diurna excessiva em adolescentes: Prevalência e fatores associados. Rev. Paul Pe-diatr. 2010; 28 (1): 98–103.
14. Randler C, Kolomeichuk SN, Morozov AV et al. Psychometric characterization of the Rus-sian version of the Pediatric Daytime Sleepiness Scale (PDSS). Heliyon. 2019; 5 (7): е02134. doi: 10.1016/j.heliyon.2019.e02134
15. Bektas M, Bektas I, Ayar D et al. Psycho-metric properties of Turkish version of Pediatric Daytime Sleepiness Scale (PDSS-T). Asian Nurs Res. (Korean SocNurs Sci.). 2016; 10 (1): 62-67.
16. Randler C, Frech D. Correlation between morningness–eveningness and final school leav-ing exams. Biol. Rhythm Res. 2006; 37: 233–239.
17. Rhie S, Lee S, Chae KY. Sleep patterns and school performance of Korean adolescents assessed using a Korean version of the pediatric daytime sleepiness scale. Korean J Pediatr. 2011; 54 (1): 29-35.
18. Roenneberg T, Merrow M. Entrainment of the human circadian clock. Cold Spring Harb. Symp. Quant. Biol. 2007; 72: 293–299.
19. Perez-Chada D, Perez-Lloret S, Videla AJ et al. Sleep disordered breathing and daytime sleepiness are associated with poor academic performance in teenagers. A study using the Pe-diatric Daytime Sleepiness Scale (PDSS). Sleep. 2007; 30: Р. 1698-1703.
20. Gibson ES, Powles AC, Thabane L et al. “Sleepiness” is serious in adolescence: two sur-veys of 3235 Canadian students. BMC Public Health. 2006; 6: 116.
21. Drake C, Nickel C, Burduvali E et al. The pediatric daytime sleepiness scale (PDSS): sleep habits and school outcomes in middle-school chil-dren. Sleep. 2003; 26 (455): 8.
22. Felden EP, Carniel JD, Andrade RD et al. Tradução e validação da Pediatric Daytime Sleepiness Scale (PDSS) para o português do Brasil. J Pediatr (Rio J). 2016; 92: 168–173.
Cardiovascular disease is one of the leading causes of morbidity and mortality among the adult population. In Russia, over a million people (around 700 people out of each 100 thousand population) die each year from cardiovascular diseases. The high prevalence of cardiovascular disease is observed in people living in the North, whose severe climatic conditions produce increased demands for a human body. Northern climatic factors lead to significant changes in human’s physiological functions based on modified functional condition of the endocrine sys-tem, metabolic processes, and lipid metabolism in particular. According to L.E. Panin’s concept (1978), in high-latitude regions we can observe “the changeover from carbohydrate-type metab-olism to the lipid one”. This concept states transformation of the lipid profile in residents of the North caused by a number of external factors frequently leading to changes in metabolic path-ways and abnormalities in lipid metabolism. Adequate assessment and correct interpretation of lipid metabolism variables are of major importance for early detection and timely prevention of cardiovascular pathology. The review considers key lipid metabolism indices. We also present our own data about the role of compound indices in lipid metabolism assessment in healthy inhabitants of the North.
Keywords: lipid metabolism, adaptation, North, cardiovascular disease, apolipoproteins.
E.R. Boyko, A.M. KanevaINDICES OF LIPID METABOLISM FOR THE EARLY DIAGNOSIS OF CARDIOVASCULAR DISEASE IN RESIDENTS OF THE NORTHDOI 10.25789/YMJ.2019.67.27
SCIENTIFIC REVIEWS AND LECTURES
References
BOJKO Evgeny Rafailovich – Doctor of Medical Sciences, Professor; Head of IPh Komi SC UB RAS, FRC Komi SC UB RAS; e-mail: [email protected]; tel. +7-8212-24-14-74; ORCID ID: 0000-0002-8027-898X. KANEVA Anastasiya Mikhailovna – Doctor in Biological Sciences; Senior Researcher of environmental and medical physiology depart-ment of IPh Komi SC UB RAS, FRC Komi SC UB RAS; tel. +7-8212-24-14-74; ORCID ID: 0000-0002-7789-4300.

3’ 2019 91
The issues related to preservation of health in the North are of great medical and social significance. The process of human adaptation to adverse northern factors is aimed at maintenance of stable functioning of various systems separately and of a human body as a whole to en-sure normal vital activities under inade-quate environmental conditions. Trans-formation of energy metabolism through changeover of all types of metabolism (of lipids, proteins, carbohydrates, vitamins, macro and microelements) plays an im-portant role in the complex sequence of adaptive changes [6, 28, 32]. According to the member of the Academy of Scienc-es L.E. Panin [27, 28], the northerners develop a peculiar type of metabolism – the so-called “polar metabolic type” characterized by decreased role of car-bohydrates and increased role of the proteins and lipids in energy metabolism. The increased significance of lipids in the energy metabolism of a human body finds its reflection in the changed lipid profile of blood [2, 4, 6, 13, 28]. Within L.E. Panin’s concept, we suggest the term “adaptive polar metabolic type” as a special type of metabolism typical for the adapted population of the North, in-cluding the indigenous residents of the Far North. Development of this “adaptive polar metabolic type” includes forming of a peculiar hormone profile and metabo-lism ensuring comfortable living in the Far North conditions in particular. For in-habitants of the North, if compared to res-idents of middle latitudes, such adaptive changes are related to the transformed metabolism, which is preconditioned by more active basal metabolic rate in par-ticular seasons of year and more short-term reactions connected with some en-vironmental factors of the North [6].
At present time, ideas of the regulari-ties of adaptive processes in residents of the North are based both on the studies of transformation mechanisms of physiolog-ical functions and biochemical processes in migrants, and on detection of mor-phofunctional features in the indigenous populations for which the subextreme and extreme conditions of the northern regions can be considered adequate. The analysis of the literature on metabo-lism in non-native residents of the North demonstrated that data on their lipid me-tabolism transformation are quite various and often contradictory, which is proba-bly related to the fact that most studies were carried out on migrants of the North found at different stages of the adapta-tion [1, 6, 21, 28, 31, 35]. According V.P. Kaznacheyev’s classification [13], in the process of a person’s adaptation to the
Northern environment one can observe a phase of regulatory and homeostatic pro-cesses destabilization (from 6 months to over 1 year long), a phase of regulatory and homeostatic processes stabilization and synchronization (10–15 years long) and a phase of lowered resistance of one’s body. It is considered that the stage of resistance in residents of the North is explained by efficient changeover from carbohydrate metabolism to the lipid one. Such lipid metabolism transformations occurring throughout the “polar metabolic type” development are to be accompa-nied by lipoprotein spectrum shifting to-wards an increase in the number of high density lipoproteins (HDL). However, multiple studies showed that migrants of the North do not develop an optimal meta-bolic background as a rule. Contrariwise, they develop “northern dyslipidemia” which is reflected as increased athero-genic lipid fractions in blood [8, 12, 30].
Metabolism with predominantly pro-tein-lipid metabolism (“arctic adaptive type”) is observed in the indigenous pop-ulations of the North. Descendants of several generations of migrants who had been adapting to the northern environ-ment for centuries possess similar ability to switch to the northern type of metab-olism. For the indigenous populations of the North, the change of energy metab-olism from the carbohydrate type to the lipid one comes on account of exoge-nous fats, i.e. food lipids [26]. In general, the basal metabolic rate in the northern aborigines is higher than the one in the residents of the middle latitudes [32]. The protein-fatty diet in the northerners implies primarily the use of lipids as the most energy intensive utilizable materi-al and is accompanied by the increased activity of lipolytic enzymes and activated lipid mobilizing processes [26, 35].
The indigenous inhabitants of the North following the traditional lifestyle and diet with their “polar” metabolic type demonstrate more favourable lipid me-tabolism profiles with regard to the risk of development of a cardiovascular disease than the non-native populations of the North. The indigenous residents of the North (Evenki Autonomous Area, Yakutia, Amur River Region, Khanty-Mansi Auton-omous Area, Yamal-Nenets Autonomous Area) have lower total cholesterol (TC) levels and its atherogenic fractions and higher levels of HDL cholesterol (HDL-C) in blood serum than migrants of the North [10, 11, 21-23, 25, 31].
However, social and economic chang-es of the recent decades, the inflow of migrants and urbanization have affected the traditional lifestyle and diet in the in-
digenous inhabitants, which has resulted in disturbed adaptive processes followed by increased morbidity. In addition, the in-digenous populations of the North suffer adverse metabolic changes with inten-sified carbohydrate metabolism and in-creased atherogenic lipid levels in blood more frequently now [3, 9, 18-20, 33].
Atherogenic disorders of lipid metab-olism play a major role in the pathogenic mechanism of atherosclerosis [17, 47]. At present time, atherosclerosis is one of the most relevant and important health problems. Atherosclerosis mostly affects aorta, arteries of heart, brain, lower limbs and kidneys. Therefore, coronary dis-ease, myocardial infarction, aortic aneu-rism rupture, ishemic and haemorrhagic stroke are among top causes of death. In this connection, diagnostics and pre-vention of lipid metabolism disorders are some of the most significant tasks of to-day’s medicine.
Currently, much attention is paid to studying the role of apolipoproteins in a human’s lipid metabolism. It is believed that the analysis of the level of apolipo-proteins in health and lipid metabolism disorders doubtlessly bring certain ben-efits, as it allows to identify accurately features and defects of lipoprotein me-tabolism. Apolipoproteins were discov-ered more than 40 years ago. Over 10 apoproteins have been identified and de-scribed so far. Apolipoproteins are clas-sified into major and minor proteins. The former ones include apoA, apoВ, apoC, apoD, apoЕ. Minor apolipoproteins in-clude apoF, apoJ, prolin-rich protein, etc. [34, 39]. Depending on the key role performed, apolipoproteins are condition-ally divided into two classes. One is apo-proteins forming the micellar structure of lipoprotein complexes and serving as lipoprotein “nucleus”. This group of apoli-poproteins includes apoВ (apoВ-100 and apoВ-48) and apoА (А-I and А-II) which are responsible for afferent and efferent transport of lipids. The other class con-tains apolipoproteins focusing on lipopro-tein and lipid metabolism regulation in the bloodstream and their internalization by cells. These apolipoproteins are present in lipoproteins in low concentrations and transfer between lipoprotein classes as protein-lipid complexes in the process of lipoprotein particles’ interconversion in the bloodstream. Key representatives of metabolically active apolipoproteins are apoЕ with three isoforms (Е2, Е3, Е4) and apoC (С-I, С-II, С-III) [34, 63]. Mean-while, the functional role of apolipopro-teins in lipid metabolism in residents of the North has not been studied thoroughly.
For the first time ever we have ana-

ЯКУТСКИЙ МЕДИЦИНСКИЙ ЖУРНАЛ92
lyzed plasma apoЕ levels in residents of the European North of Russia. It has been established that apoE levels in residents of the North shifted towards lower values [7, 16, 62]. This observation is consistent with the results of a large international re-search comparing apoE levels in people residing in six European countries. Ac-cording to results of this study, there is a north-south increasing gradient of apoE concentrations. The lowest apoE levels were observed in residents of Finland [38, 75]. Low apoE levels in the northerners can be considered as adaptive changes providing metabolic transformation, on the other hand, it can serve as a cause for adverse changes in the lipid pro-file. One of the key mechanisms for the “northern” dyslipidemia was determined during the research. It has been shown that a low apoE level is risk factor for the development of hypertriglyceridemia [7]. ApoE distribution among the major lipoprotein classes was also studied. It has been found that the preservation of constant concentration of apoE in HDL fraction due to its redistribution among lipoprotein classes is priority at decrease of the total plasma apoE level [15].
The levels of TC, HDL-C, low densi-ty lipoprotein cholesterol (LDL-C) and triglycerides (TG) are used as classic in-dicators of lipid metabolism. However, it has been recently established that these conventional lipid parameters do not al-ways reflect correctly the pro-atherogenic potential of blood [48, 51, 73]. Cases of atherosclerosis occurrence among sub-jects with normal TC levels have been de-scribed [60, 61, 65]. According to the liter-ature, determination of TC and TG levels contributes to detection of 50% of all lipid metabolism disorders only [29]. Several computed indices have been defined in an attempt to raise the clinical benefit of lipid metabolism indicators [56, 80].
There are several types of lipid indi-ces. Some indices reflect the balance be-tween atherogenic and anti-atherogenic lipids, these include atherogenicity coeffi-cient, Castelli 1 (TC/HDL-C) and Castelli 2 (LDL-C/HDL-C) indices, apoB/apoA-I ratio, and atherogenic index (ATH index). Their predictive capacity has been proved by many clinical examinations [36, 37, 47-49, 50, 55, 56]. Meanwhile, of these, the apoB/apoA-I ratio is the best marker of cardiovascular risk. The common method for assessing lipoprotein levels in blood by measuring cholesterol content in them does not always reflect the exact number of lipoproteins adequately. It is related to the fact that the amount of cholesterol within lipoproteins may vary widely due to active exchange of lipid components be-
tween lipoprotein particles [71]. Unlike li-poprotein cholesterol, the lipid-transport-ing apoproteins – apoВ and apoА-I do not leave the lipoprotein molecules they build [69]. Therefore, apoB and apoA-I are assumed to be superior markers for lipid abnormalities. ApoB (we mean apoВ-100) is an essential structural com-ponent of very low-density lipoproteins (VLDL), intermediate-density lipoproteins (IDL) and low-density lipoproteins (LDL). Because each particle of these lipopro-teins contains one molecule of apoB, the total atherogenic particles number can be accurately estimated by measuring the plasma level of this apoprotein. By contrast, apoА-I is the structural com-ponent of antiatherogenic HDL. So, the apoВ/apoА-I ratio displays the balance between atherogenic and antiatherogen-ic lipoproteins in blood and serves as an early potential marker for the cardiovas-cular risk [64, 70, 76, 78, 79].
Other indices (LDL-C/apoВ, TC/TG and atherogenic index of plasma (AIP)) are surrogate markers of LDL particle size [44, 54, 59, 77, 78]. These indices are thought to indicate the presence of small dense LDL particles which are known to be the most atherogenic lipoproteins. These particles are characterized by prolonged plasma half-life, lower resis-tance to oxidative stress, affinity to pro-teoglycans, and higher penetration into the arterial wall [66, 68]. Of note, since the determination of LDL-C levels in sub-jects with a predominance of small dense LDL leads to significant underestimation of the total amount of these lipoproteins [69-71], it explains the need to take the qualitative composition of this lipoprotein fraction into account as well. There are different views on the rationale for using the LDL-C/apoB ratio as a marker of LDL particle size. Some authors found high correlation between LDL-C/apoB values and the measured LDL particles’ size [43, 54, 57, 77], while the others do not recommend using this ratio as marker of small dense LDL particles [40, 53].
Clinical studies globally widely use lipid metabolism indices to characterize lipid profile changes in case of various pathologies or to monitor the results of hypolipidemic or hormone replacement therapy, as well as in prospective epide-miology research aimed at detection of predictive factors of atherosclerosis and related cardiovascular diseases [41, 42, 45-47, 54, 67, 72, 80]. At the same time, usefulness of composite indices in the overall evaluation of lipid metabolism in healthy subjects has hardly been stud-ied. The variation range for lipid metab-olism indices and functional relations be-
tween them have not been found out yet.The results of our studies made it pos-
sible to enlarge today’s view about the lipid metabolism in residents of the North and to define main indices for early de-tection and monitoring of dyslipidemia risk. The comprehensive study of the lip-id profile in apparently healthy residents of the North (157 men aged 20-59) with normolipidemia (TC<5.2 mmol/l, TG<1.7 mmol/l, HDL cholesterol>1.0 mmol/l) showed nonmanifest disturbances of lipid metabolism. Increased atheroge-nicity of the lipid profile in subjects with normolipidemia occurred as a distorted balance between atherogenic and an-tiatherogenic lipoproteins and changed qualitative composition of lipoproteins. The analysis of individual data revealed that values above the reference limits for the atherogenicity coefficient, Castelli 2 index, atherogenic index of plasma (AIP) and atherogenic index (ATH index) were observed in 7.0-10.2% of the men with normolipidemia. The study subjects most frequently demonstrated lower values of LDL-C/apoВ (26.0%) and higher apoB/apoA-I ratio (19.1%). Deviation of these indices from the reference range was ob-served on the background of low levels of apoE which is a regulatory protein of lipid transport system [14, 24, 52, 74]. It is known that insufficient amount of apoE leads to slower receptor-mediated elimi-nation and accumulation of TG-rich lipo-proteins in blood [5, 39, 58]. In our case, higher levels of TG in the subjects with the unfavorable LDL-C/apoВ and apoB/apoA-I ratios indicated the delayed clear-ance of TG-rich lipoproteins. Thus, the atherogenic changes of lipid profile ob-served in the healthy subjects with nor-molipidemia may be due to disturbances in catabolism and metabolic turnover of lipoproteins. Decrease of regulatory ef-fect of apoE on lipoprotein metabolism in healthy subjects at early stages is latent and it does not appear as hyperlipidemia. The LDL-C/apoВ and apoB/apoA-I ratios are more sensitive indices compared to conventional indicators and are capable to detect atherogenic changes of the lipid profile even in case of normolipidemia.
In general, it should be noted that the results of our own studies indicate the necessity to conduct determination of the apolipoprotein levels and calculation of compound lipid indices in addition to the conventional indicators of lipid me-tabolism, which makes it possible to de-tect metabolic disorders at early stages. Deviation of lipid metabolism indices from the reference range in case of nor-molipidemia can be considered as early predictor of metabolic transformations

3’ 2019 93
occurring on the background of changes in performance of regulatory systems, but not having shown any clinical impli-cations yet.
The study is supported by the Pro-gram for Fundamental Research of RAS (2017-2020), state registration number АААА-А17-117012310157-7.
1. Аверьянова И.В., Максимов А.Л. Сос-тояние липидного и углеводного обмена у студентов-аборигенов и европеоидов с раз-личными сроками проживания на территории Магаданской области. Экология человека. 2015;9:44-49. [Averyanova IV, Maximov AL. Lipid and carbohydrate metabolism observed in aborig-inal and European students having different terms of residing in the territory of Magadan region. Je-kologija cheloveka. 2015;9:44-49. (In Russ.).]
2. Бойко Е.Р., Канева А.М. Аполипопротеин Е и его значение в клинической физиологии. Успехи физиологических наук. 2009;40(1):3-15. [Boĭko ER, Kaneva AM. Apoprotein E and its availability in clinical physiology. Uspehi fiziolog-icheskih nauk. 2009;40(1):3-15. (In Russ.).]
3. Бойко Е.Р. Физиолого-биохимические основы жизнедеятельности человека на Севере. Екатеринбург, 2005 [Bojko ER. Physio-logical and biochemical basis of human vital activ-ity in the North. Yekaterinburg, 2005. (In Russ.).]
4. Бойко Е.Р., Канева А.М., Потолицына Н.Н. Функциональное значение аполипопротеина-Е в липидном обмене у жителей европейского Севера. Физиология человека. 2010;36(2):138-144. [Boĭko ER, Kaneva AM, Potolitsyna NN. Functional importance of apolipoprotein-E in lipid metabolism in inhabitants of the European North. Fiziologija cheloveka. 2010;36(2):138-144. (In Russ.).]
5. Агбалян Е.В., Клименко О.А., Буяк М.А., Шинкарук Е.В. Ведущие предикторы развития и дальнейшего прогрессирования ишемической болезни сердца среди мигрантов Арктики. Успехи современного естествознания. 2014;9:8-10. [Agbalyan EV, Kli-menko OA, Buyak MA, Shynkaruk EV. Leading predictors of the development and further pro-gression of ischemic heart disease among Arctic migrants. Uspehi sovremennogo estestvoznanija. 2014;9:8-10. (In Russ.).]
6. Даренская М.А. Особенности мета-болических реакций у коренного и пришлого населения Севера и Сибири. Бюллетень ВСНЦ СО РАМН. 2014;96(2):97-103. [Darenskaya MA. Peculiarities of metabolic reactions in indigenous and migrant populations of the North and Siberia. Bjulleten' VSNC SO RAMN. 2014;96(2):97-103. (In Russ.).]
7. Запесочная И.Л., Автандилов А.Г. Динамика липидного обмена при пятилетнем наблюдении у здоровых лиц, проживающих на Севере. Медицинская наука и образование Урала. 2013;14(3):23-26. [Zapesochnaya IL, Avtandilov AG. Lipid metabolism in the five year observation in healthy persons residing in the North. Medicinskaja nauka i obrazovanie Urala. 2013;14(3):23-26. (In Russ.).]
8. Казначеев В.П. Механизмы адаптации человека в условиях высоких широт. Л., 1980 [Kaznacheev VP. Mechanisms of human adap-tation in the high latitudes. Leningrad, 1980. (In Russ.).]
9. Канева А.М., Потолицына Н.Н., Бойко Е.Р. Соотношение холестерина липопротеидов низкой плотности к аполипопротеиду-В как
маркер размера частиц липопротеидов низкой плотности. Атеросклероз. 2018;14(2):25-31. [Kaneva AM, Potolitsyna NN, Bojko ER. The ratio of low-density lipoprotein cholesterol to apolipo-protein-B as a marker of low-density lipoprotein particle size. Ateroskleroz. 2018;14(2):25-31. (In Russ.).] DOI: 10.15372/ATER20180204
10. Канева А.М., Потолицына Н.Н., Бойко Е.Р. Количественное распределение аполипопротеина-Е между липопротеинами плазмы крови у здоровых мужчин. Моле-кулярная медицина. 2018;16(5):51–55. [Kaneva AM, Potolitsyna NN, Bojko ER. Quantitative dis-tribution of apolipoprotein-Е among blood plas-ma lipoproteins in healthy men. Molekuljarnaja medicina. 2018;16(5):51–55. (In Russ.).] DOI: 10.29296/24999490-2018-05-09
11. Климов А.Н., Никульчева Н.Г. Обмен липидов и липопротеидов и его нарушения: руководство для врачей. СПб., 1999 [Klimov AN, Nikul’cheva NG. Lipid and lipoprotein metab-olism and its disorder: guide for physicians. Saint Petersburg, 1999. (In Russ.).]
12. Кривощеков С.Г., Пинигина И.А., Махарова Н.В. Структурно-функциональные особенности сердечнососудистой системы и метаболические показатели у молодых жителей Якутии с нормальным и повышенным уровнем артериального давления. Бюллетень СО РАМН. 2009;29(6):100-108. [Krivoschekov SG, Pinigina IA, Maharova NV. Structurally func-tional features of cardiovascular system and met-abolic indicators at young inhabitants of Yakutia with the normal and raised level of arterial pres-sure. Bjulleten' SO RAMN. 2009;29(6):100-108. (In Russ.).]
13. Уварова Т.Е., Бурцева Т.Е., Софронова С.И., Ефремова С.Д., Гольдерова А.С. Липид-ный профиль крови и особенности нарушений липидного обмена у коренных малочисленных народов севера Якутии. Дальневосточный медицинский журнал. 2012;3:85-88. [Uvarova TE, Burtseva TE, Safronova SI, Efremova CD, Golderova AS. The blood lipid profile and the lipid metabolism disorders to indigenous people of the Yakutia. Dal'nevostochnyj medicinskij zhurnal. 2012;3:85-88. (In Russ.).]
14. Поляков Л.М., Розуменко А.А., Осипова Л.П., Куницын В.Г., Гольцова Т.В. Липидный спектр сыворотки крови у представителей коренного и пришлого населения Ямало-Ненецкого автономного округа. Сибирский научный медицинский журнал. 2015;35(6):66-69. [Polyakov LM, Rozumenko AA, Osipova LP, Kunitsyn VG, Goltsova TV. Serum lipid spectrum of indigenous and alien population of Yama-lo-Nenets autonomous okrug. Sibirskij nauchnyj medicinskij zhurnal. 2015;35(6):66-69. (In Russ.).]
15. Воевода М.И., Романова А.Н., Рагино Ю.И., Семаева Е.В. Некоторые особенности факторов риска коронарного атеросклероза у жителей Якутии. Бюллетень СО РАМН. 2010;30(3):52–57. [Voevoda MI, Romanova AN, Ragino YI, Semaeva EV. Some features of coro-nary atherosclerosis risk factors in the inhabitants of Yakutia. Bjulleten' SO RAMN. 2010;30(3):52–57. (In Russ.).]
16. Канева А.М., Потолицына Н.Н., Людинина А.Ю., Алисултанова Н.Ж., Бойко Е.Р. Низкое содержание аполипопротеина-Е как фактор риска повышения соотношения аполипопротеин-В/аполипопротеин-АI у здоровых мужчин с нормолипидемией. Клин. лаб. диагн. 2014;59(12):32-36. [Kaneva AM, Potolitsyna NN, Lyudinina AYu, Alisultanova NZh, Bojko ER. Low levels of apolipoprotein-E as risk factor for increase of apolipoprotein-B/apolipopro-tein-AI ratio in healthy men with normolipidemia. Klin. lab. diagn. 2014;59(12):32-36. (In Russ.).]
17. Панин Л.Е. Адаптация и питание человека в экстремальных условиях Арк-тики. Инновации и продовольственная безопасность. 2013;1(1):131-135. [Panin LE. Adaptation and a food of the person in extreme conditions of the Arctic. Innovacii i prodovol'st-vennaja bezopasnost'. 2013;1(1):131-135. (In Russ.).]
18. Панин Л.Е. Человек в экстремальных условиях Арктики. Бюллетень СО РАМН. 2010;30(3):92-98. [Panin LE. Man in extreme conditions in the Arctic. Bjulleten' SO RAMN. 2010;30(3):92-98. (In Russ.).]
19. Панин Л.Е. Энергетические аспекты адаптации. Л., 1978 [Panin LE. Energy aspects of adaptation. Leningrad, 1978. (In Russ.).]
20. Плющ М.Г., Самсонова Н.Н. Эффек-тивность лабораторных тестов для диагностики нарушений липидного обмена. Бюллетень НЦССХ им. А.Н. Бакулева РАМН Сердечно-сосудистые заболевания. 2012;13(S6):222. [Plyushch MG, Samsonova NN. The efficiency of laboratory tests for the diagnosis of lipid meta-bolic disorders. Bjulleten' NCSSH im. A.N. Baku-leva RAMN Serdechno-sosudistye zabolevanija. 2012;13(S6):222. (In Russ.).]
21. Ветошкин А.С., Шуркевич Н.П., Гапон Л.И., Губин Д.Г., Пошинов Ф.А., Велижанин С.Н. Повышенное артериальное давление и атеросклероз в условиях северной вахты. Артериальная гипертензия. 2018;24(5):548-555. [Vetoshkin AS, Shurkevich NP, Gapon LI, Gubin DG, Poshinov FA, Velizhanin SN. High blood pressure and atherosclerosis in the northern watch. Arterial'naja gipertenzija. 2018;24(5):548-555. (In Russ.).] DOI: 10.18705/1607-419X2018-24-5-548-555
22. Рябова Т.И., Попова Т.В. Липидный спектр сыворотки крови у коренного (эвены, нанайцы, ульчи) и пришлого населения Приамурья. Дальневосточный медицинский журнал. 2010;4:106–108. [Ryabova ТI, Popova TV. Lipid spectrum’s in blood serum in the na-tives population (nanais, ulchis, evenks) and new comers of the Amur river region. Dal'nevostochnyj medicinskij zhurnal. 2010;4:106–108. (In Russ.).]
23. Севостьянова Е.В. Особенности ли-пидного и углеводного метаболизма человека на Севере (литературный обзор). Бюллетень сибирской медицины. 2013;12(1):93-100. [Se-vostyanova YeV. Some features of human lipid and carbohydrate metabolism in the North. Bju-lleten' sibirskoj mediciny. 2013;12(1):93-100. (In Russ.).]
24. Климова Т.М., Федорова В.И., Балтахинова М.Е., Кривошапкин В.Г. Содер-жание холестерина и риск атеросклероза у сельского коренного населения Республики Саха (Якутия). Экология человека. 2014;4:22-27. [Klimova TM, Fedorova VI, Baltakhinova ME, Krivoshapkin VG. Cholesterol and risk of athero-sclerosis in rural indigenous population of Re-public of Sakha (Yakutia). Jekologija cheloveka. 2014;4:22-27. (In Russ.).]
25. Творогова М.Г. Аполипопротеины – свойства, методы определения, клиническая значимость. Лабораторная медицина. 2005;7:29-37. [Tvorogova MG. Apolipoproteins – properties, determination methods, clinical sig-nificance. Laboratornaja medicina. 2005;7:29-37. (In Russ.).]
26. Хаснулин В.И., Геворгян М.М., Бахтина И.А. Особенности липидного обме-на у пришлых жителей Севера, больных арте-риальной гипертензией. Мир науки, культуры, образования. 2011;29(4):280-283. [Hasnulin VI, Gevorgyan MM, Bakhtina IA. Lipid metabolism characteristics at the alien inhabitants of the North with arterial hypertension. Mir nauki, kul'tury,
References

ЯКУТСКИЙ МЕДИЦИНСКИЙ ЖУРНАЛ94
obrazovanija. 2011;29(4):280-283. (In Russ.).]27. Schiele F, De Bacquer D, Vincent-Viry
M et al. Apolipoprotein E serum concentra-tion and polymorphism in six European coun-tries: the ApoEurope project. Atherosclerosis. 2000;152(2):475-88.
28. Siest G, Pillot T, Regis-Bailly A et al. Apo-lipoprotein E: an important gene and protein to follow in laboratory medicine. Clin. Chem. 1995;41(8):1068-86.
29. Décary S, Dumont G, Lamarche B et al. Assessment of the validity of the frequently used lipid indices for predicting LDL peak particle diam-eter in a large cohort of 1955 normal and dyslipid-emic subjects. Clin. Biochem. 2010;43(4-5):401-6. DOI: 10.1016/j.clinbiochem.2009.11.010
30. Onat A, Can G, Kaya H et al. “Atherogen-ic index of plasma” (log10 triglyceride/high-den-sity lipoprotein-cholesterol) predicts high blood pressure, diabetes and vascular events. J. Clin. Lipidol. 2010;4(2):89-98. DOI: 10.1016/j.jacl.2010.02.005
31. Hattori Y, Suzuki M, Tsushima M et al. De-velopment of approximate formula for LDL-chol, LDL-apo B and LDL-chol/LDL-apo B as indices of hyperapobetalipoproteinemia and small dense LDL. Atherosclerosis. 1998;138(2):289-99.
32. Dobiasova M, Frohlich J. The plasma pa-rameter log (TG/HDL-C) as an atherogenic index: correlation with lipoprotein particle size and ester-ification rate in apoB-lipoprotein-depleted plasma (FER(HDL)). Clin. Biochem. 2001;34(7):583-8.
33. Yusuf S, Hawken S, Ounpuu S et al. Effect of potentially modifiable risk factors associated with myocardial infarction in 52 countries (the IN-TERHEART study): case-control study. Lancet. 2004;364(9438):937-52. DOI: 10.1016/S0140-6736(04)17018-9
34. Kaneva AM, Potolitsyna NN, Bojko ER.
Usefulness of the LDL-C/apoB ratio in the over-all evaluation of atherogenicity of lipid profile. Arch. Physiol. Biochem. 2017;123(1):16-22. DOI: 10.1080/13813455.2016.1195411
35. Furuya D, Yagihashi A, Nasu S et al. LDL particle size by gradient-gel electrophoresis can-not be estimated by LDL-cholesterol/apolipopro-tein B ratios. Clin. Chem. 2000;46(8):1202–3.
36. Wägner AM, Jorba O, Rigla M et al. LDL-cholesterol/apolipoprotein B ratio is a good predictor of LDL phenotype B in type 2 diabetes. Acta Diabetol. 2002;39(4):215-20. DOI: 10.1007/s005920200037
37. Millán J, Pintó X, Muñoz A et al. Lipopro-tein ratios: Physiological significance and clinical usefulness in cardiovascular prevention. Vasc. Health Risk Manag. 2009;5:757-65.
38. Mahley RW, Weisgraber KH, Huang Y. Apolipoprotein E: structure determines function, from atherosclerosis to Alzheimer's disease to AIDS. J. Lipid Res. 2009;50(Suppl):183-8. DOI: 10.1194/jlr.R800069-JLR200
39. Ma H, Lin H, Hu Y et al. Mean plate-let volume in relation to carotid atheroscle-rosis in normotensive, euglycemic, and normolipidemic Chinese middle-aged and el-derly adults. Angiology. 2014;65(6):512-8. DOI: 10.1177/0003319713520462
40. Noël B. Premature atherosclerosis in patients with xanthelasma. J. Eur. Acad. Der-matol. Venereol. 2007;21(9):1244-8. DOI: 10.1111/j.1468-3083.2007.02252.x
41. Kaneva AM, Bojko ER, Potolitsyna NN et al. Plasma levels of apolipoprotein-E in residents of the European North of Russia. Lipids Health Dis. 2013;12:43. DOI: 10.1186/1476-511X-12-43
42. Kondo A, Muranaka Y, Ohta I et al. Rela-tionship between triglyceride concentrations and LDL size evaluated by malondialdehyde-mod-
ified LDL. Clin Chem. 2001;47(5):893-900.43. Galeano NF, Al-Haideri M, Keyserman
F et al. Small dense low density lipoprotein has increased affinity for LDL receptor-independent cell surface binding sites: a potential mecha-nism for increased atherogenicity. J. Lipid Res. 1998;39(6):1263-73.
44. Sniderman AD, Pedersen T, Kjekshus J. Putting low-density lipoproteins at center stage in atherogenesis. Am. J. Cardiol. 1997;79(1):64-7.
45. Sniderman AD, Kiss RS. The strengths and limitations of the apoB/apoA-I ratio to predict the risk of vascular disease: a Hegelian analysis. Curr. Atheroscler. Rep. 2007;9(4):261-5.
46. Srinivasan SR, Berenson GS. Serum apo-lipoproteins A-I and B as markers of coronary ar-tery disease risk in early life: the Bogalusa Heart Study. Clin. Chem. 1995;41(1):159-64.
47. Kaneva AM, Potolitsyna NN, Bojko ER et al. The apolipoprotein B/apolipoprotein A-I ratio as a potential marker of plasma atherogenici-ty. Disease Markers. 2015;2015:591454. DOI: 10.1155/2015/591454
48. Haddy N, De Bacquer D, Chemaly MM et al. The importance of plasma apolipoprotein E concentration in addition to its common poly-morphism on inter-individual variation in lipid levels: results from Apo Europe. Europ. J. Hum. Genetics. 2002;10(12):841-50. DOI: 10.1038/sj.ejhg.5200864
49. Yoshida A, Kouwaki M, Matsutani Y et al. Usefulness of serum total cholesterol/triglyceride ratio for predicting the presence of small, dense LDL. J. Atheroscler. Thromb. 2004;11(4):215-9. DOI: 10.5551/jat.11.215
50. Walldius G. The apoB/apoA-I ratio is a strong predictor of cardiovascular risk, in Frank S., Kostner G. (Eds.), Lipoproteins in Health and Diseases. Rijeka, 2012, pp. 95-148.
Obesity is an increase in body fat, leading to the appearance of overweight, is a common chronic metabolic disease in Russia and the world that occurs at any age. Currently, there is an increase in overall morbidity and mortality from complications (metabolic syndrome, type 2 diabetes, liver steatosis, arterial hyper-tension, IHD, etc.) in this condition.
It is well known that the causes of obesity are: hereditary predisposition (increased activity of lipogenesis en-zymes and reduced activity of lipolysis enzymes), failure to follow the mode and nature of nutrition (frequent, excessive food), endocrine disorders, stressful situ-
ations (psychogenic overeating), hormo-nal drugs, a sedentary image life (motor mode must be combined with proper nu-trition and the rejection of bad habits).
Overweight is not only a socio-eco-nomic and cosmetic problem, but primar-ily a medical one. It is proved that the greater the body weight, the lower the life expectancy due to the development of serious diseases. In this regard, sig-nificant efforts of modern endocrinology are aimed at studying the causes and mechanisms of the development of over-weight and obesity [3; 12; 13] and their correction.
The epidemiology of obesity depends
This article presents a review of the literature. The authors conducted a scientific search on the epidemiology of obesity and overweight in different ethnic groups, using the relevant key-words, on the search engines PubMed and Google Scholar, on the Scopus, Web of Science, MedLine, The Global Health databases, CyberLeninka, eLIBRARY.RU and others. Obesity is widespread among children, adolescents and adults. Most of the epidemiological studies con-ducted to identify obesity and overweight used the most accessible method - the determination of body mass index (BMI). Data on ethnic origin can provide additional information for a person-alized prognosis; to date, there is no single classification for obesity and overweight for Asians.
Keywords: obesity, overweight, body mass index, ethnos, population, prevalence, compli-cations.
O.L. Moskalenko, O.V. Smirnova, E.V. KasparovOBESITY IN VARIOUS ETHNIC POPULATIONSDOI 10.25789/YMJ.2019.67.28
MOSKALENKO Olga Leonidovna, senior researcher, candidate of biological sciences, Federal State Budgetary Scientific Institution «Scientific Research Institute of medical prob-lems of the North», Krasnoyarsk, Krasnoyarsk territory (krai), Russia, 660022, 3g, Partizan Zheleznyaka str., Krasnoyarsk, Russia, E-mail: [email protected], тел. 8-923-289-96-25; SMIRNOVA Olga Valentinovna, MD, Head of the Laboratory of Clinical Pathophysiology, Research Institute of Medical Problems of the North, Federal State Budgetary Scientific Insti-tution «Scientific Research Institute of medical problems of the North», Krasnoyarsk, Kras-noyarsk territory (krai), Russia, 660022, 3g, Partizan Zheleznyaka str., Krasnoyarsk, Rus-sia, е-mail: [email protected]; KASPAR-OV Eduard Vilyamovich, MD, professor, Director Federal State Budgetary Scientific Institution «Scientific Research Institute of medical problems of the North» Krasnoyarsk, Krasnoyarsk territory (krai), Russia, 660022, 3g, Partizan Zheleznyaka str., Krasnoyarsk, Russia, e-mail: [email protected].

3’ 2019 95
on the characteristics of ethnic groups, many complications directly correlate with ethnicity.
In this regard, the study of the preva-lence of obesity in various ethnic popu-lations is one of the urgent problems of modern medicine. Russia, being a mul-tinational state, is characterized by a large ethnocultural diversity. The struc-ture of the Russian Federation includes 85 subjects: 46 - regions, 22 - republics 9 - edges, 3 - cities of federal value, 4 - autonomous regions, 1 - autonomous region. There are about 157 thousand settlements in the country.
In Russia, more than 2 million people are obese, and patients with overweight are even more, each year the problem only increases.
This review analyzes scientific studies on the epidemiology of obesity in various ethnic populations and, depending on the place of residence, urban or rural popula-tion.
The prevalence of obesity in the world according to WHO (2016) is 11% in men and 15% in women older than 18 years and 39% of men and 40% of women were determined to be overweight.
According to the results of studies conducted in the Republic of Buryatia in adolescents of ethnic groups in rural ar-eas, it was revealed that, regardless of their ethnicity, the risk factors for obesity and overweight are the presence of over-weight in the mother and the irregular nutrition of adolescents. Risk factors for adolescents of indigenous Asian ethnic groups (Buryats and Soyots) and Slavic ethnic groups can be social factors, such as children living in single-parent fami-lies, and in families where mothers do not work [16].
The prevalence of obesity and diabe-tes in various ethno-social populations of the urban and rural populations of the European Far North and the territories equated to the Far North from 1996 to 2006 was reported in studies [1]. It has been established that among the rural inhabitants of the European North, obe-sity is more pronounced among the lo-cal Russians of the Far North compared to the Komi who live in the territories of the Far North. The Komi people living in the Far North and leading a traditional lifestyle have a lower incidence of obe-sity compared with other populations of northerners [1].
Metabolic syndrome and type I diabe-tes are common in the Asian part of Rus-sia, and in the indigenous people of the North and the Far East both types of dia-betes are less common than among Cau-casians who live in the same regions [10].
Currently, the complex effect of genet-ic, geographical, socio-economic factors behind ethnic groups has been proven. Over the past few years, there has been a deterioration in the quality of life of small peoples living in conditions of the North and Siberia. Compared to the Rus-sians, the Buryat population is character-ized by a favorable course of diabetes, cardiovascular diseases, arterial hyper-tension [5].
When examining the population of Kyrgyz nationality, it was established that in this ethnic group the ATP III (2005) classification is the optimal classification for diagnosing MS. [20].
For comparison, in the population of Novosibirsk 45-69 years old, the preva-lence of abdominal obesity according to the NCEP ATP III criteria (2001) is only 43%, according to the criteria of VNOK (2009) 65% and according to the crite-ria of IDF (2005), IDF and AHA / NHLBI (2009 ) 67% [17, 8].
The prevalence of metabolic syn-drome increases significantly with age and has gender, ethnic and regional dif-ferences, with a significant role played by age and ethnicity. The IDF criteria (2005) emphasize the relevance of research in various ethnic groups in order to further refine the criteria [9].
Ethnic differences are revealed not only in MS, but also in normal body weight [22].
To this day, there is no classification of obesity and overweight for Asians. For example, for residents of Thailand they apply their own criteria, for the Ko-rean subpopulation - their own. Repre-sentatives of various Asian ethnic groups (Buryats, Yakuts, etc.) live on the territory of our country, so there are difficulties with the use of the classification [2].
The Asian population is characterized by a large amount of fat with a low BMI and waist circumference [23, 27].
It has been established that in women of the Far North, the prevalence of obe-sity is 34.7%, the metabolic syndrome is 14.6% and is more often recorded in non-indigenous women. The abdominal type of distribution of adipose tissue with low lipid metabolism was observed in the population of indigenous women. In non-indigenous women, the abdominal distribution of adipose tissue was formed mainly during obesity. The author deter-mined the high diagnostic value of MC markers, which are recommended by IDF (2005), for non-indigenous women of the Far North. In the population of indigenous women, the low diagnostic value of HDL cholesterol indicator was found, the eth-nic marker of MS was identified [11; 21].
Abdominal obesity and body mass in-dex of the elderly (Yakuts) of elderly and senile age were recorded less than those of non-indigenous (Caucasians), and patients who were not overweight, ab-dominal obesity and metabolic syndrome were observed equally in indigenous and non-indigenous [nineteen].
Obesity in the Chuvash Republic is (5.5-39.1%) depending on the area of residence. The prevalence of obesity in the Chuvash Republic is lower than in the Russian Federation, the author explains this by an ethnic factor: for the most part, the incidence among Chuvash ethnic groups, who live in this region is about 70% of the population, for the Russian population is comparable to the preva-lence of obesity in other regions of Russia. Factors affecting the formation of obesity: Russian ethnic group, female gender, city residence, age over 50 years [7].
According to the results of several studies, it was established that all pa-tients with arterial hypertension of the Russian and Mordovian nationalities, regardless of gender, had a predisposi-tion to overweight according to the defini-tion of BMI. This indicator was increased in 29.1% of Russian women and 33.0% in the Mokshan ethnic group, 22.9% Erzyan, which made it possible to iden-tify overweight. Obesity was observed in 64.1% of Russian women, 57.8% of moksha and 66.7% of Erzi. In men with hypertension, BMI was increased in 25.6% of Russians, 38.9% of mokshan and 35.5% of Erzyans, and with obesity, respectively, in 56.4%, 41.7% and 45.2% [4]. Thus, in the population of the Kyrgyz Republic, abdominal obesity is 52.3%, for women, abdominal obesity and arterial hypertension are typical, for men, hyper-triglyceridemia is observed [15].
In European countries, the prevalence of metabolic syndrome in the general population is 3-4 ‰ at the age of 18 to 40 years, in Russia this figure rises to 5.5 with a tendency to increase after 40 years [24-26].
The indigenous population of the Bai-kal region has a high degree of adaptation to the region in which they live relative to the alien population. The representatives of the Buryat ethnogroup have a higher incidence of arterial hypertension, car-diovascular diseases, and diabetes mel-litus type I than among Russians. Con-sequently, information on ethnic origin may provide additional information for a personalized forecast [6].
It should be noted that in the adult population of Cheboksary, in a random sample, a high incidence of traditional risk factors was recorded, such as eating
ЯКУТСКИЙ МЕДИЦИНСКИЙ ЖУРНАЛ96
disorders - 76.1%, hypercholesterolemia - 62%, a sedentary lifestyle - 52.6%, arterial hypertension - 39.2%, reduced cholesterol and HDL cholesterol - 25%, smoking in men, alcohol consumption 43% and 27.4%, and metabolic risk fac-tors: hypertriglyceridemia -27%, abdomi-nal obesity - 22.1% and elevated levels stress. Most of them have a linear depend-ence on age and gender differences [14].
Thus, obesity is widespread among children, adolescents and adults. Most of the epidemiological studies conducted to identify obesity and overweight used the most accessible method - the determina-tion of body mass index (BMI). Data on ethnic origin may provide additional infor-mation for a personalized prognosis, but to date there is no single classification for obesity and overweight for Asians.
1. Бабенко Л.Г., Бойко Е.Р. Этно-социальные особенности заболеваемости ожирением и сахарным диабетом населения европейского Севера. Известия Коми НЦ УрО РАН. 2010; 2(2):32-41. [Babenko L G, Boyko E R Ethno-social characteristics of the incidence of obesity and diabetes in the population of the Eu-ropean North. Izvestiya Komi NC UrO RAN. 2010; 2(2):32-41. (In Russ.).] https://elibrary.ru/item.as-p?id=15575258&
2. Беленькая Л.В. Критерии ожирения в азиатской популяции. Обзор литературы. Acta Biomedica Scientifica. 2018; 3(3): 99-102. [Belen-kaya L V The criteria for obesity in the Asian pop-ulation. Literature review. Acta Biomedica Scien-tifica. 2018; (3): 99-102. (In Russ.).] https://doi.org/10.29413/ABS.2018-3.3.15
3. Березина М.В., Михалева О.Г., Бардымова Т.П. Ожирение: механизмы раз-вития. Сибирский медицинский журнал. 2012;7:15-18. [Berezina M V, Mikhaleva O G, Bardymova T.P. Obesity: developmental mechanisms. Sibirskiy meditsinskiy zhurnal. 2012;7:15-18. (In Russ.).] https://elibrary.ru/item.asp?id=18336354
4. Гончарова Л.Н., Снеговской В.А., Кузовенкова О.Н. Распространенность факто-ров риска артериальной гипертонии среди коренного населения республики Мордовия. Казанский медицинский журнал. 2010; 91(1): 97-101. [Goncharova L N, Snegovskoy V A, Kuzovenkova O.N. The prevalence of risk fac-tors for arterial hypertension among the indig-enous population of the Republic of Mordovia. Kazanskiy meditsinskiy zhurnal. 2010; 91(1): 97-101. (In Russ.).] https://elibrary.ru/item.as-p?id=13610549
5. Даренская М.А. Этнические и региональные аспекты патологических процессов у человека. Бюллетень ВСНЦ СО РАМН. 2012; 2(84). 2: 152-159. [Darenskaya M A Ethnic and regional aspects of pathological pro-cesses in humans. Byulleten' VSNTs SO RAMN. 2012; 2(84). 2: 152-159. (In Russ.).] https://eli-brary.ru/item.asp?id=17942186
6. Колесникова Л.И., Даренская М.А., Первушина О.А. Этнические особенности патологических состояний у представителей коренной народности Прибайкалья (обзор литературы). Бюллетень ВСНЦ СО РАМН. 2013; 4(92): 160-165. [Kolesnikova L I, Da-
renskaya M A, Pervushina O.A. Ethnic features of pathological conditions in representatives of the indigenous people of the Baikal region (litera-ture review). Byulleten' VSNTs SO RAMN. 2013; 4(92): 160-165. (In Russ.).] https://elibrary.ru/item.asp?id=20251142
7. Маркова Т.Н., Кичигин В.А., Марков Д.С. Возрастно-половые и этнические особен-ности распространенности ожирения в Чу-вашской республике. Вестник Чувашского уни-верситета. 2012; 3: 436-441. [Markova T N, Kichigin V A, Markov D S Age, gender and ethnic characteristics of the prevalence of obesity in the Chuvash Republic. Vestnik Chuvashskogo uni-versiteta. 2012; 3: 436-441. (In Russ.).]. https://elibrary.ru/item.asp?id=18195680
8. Медико-демографические показатели Российской Федерации. 2006. Статистические материалы. 2007. 179 с. [Medical and demo-graphic indicators of the Russian Federation. 2006. Statistical materials. 2007; 179. (In Russ.).]
9. Небесных А.Л. Особенности проявлений метаболического синдрома в разных этнических группах. Сибирский медицинский журнал. 2013; 7: 19-23. [Nebesnykh A L Features of the manifestations of the metabolic syndrome in different ethnic groups. Sibirskiy meditsinskiy zhurnal. 2013; 7: 19-23. (In Russ.).] https://eli-brary.ru/item.asp?id=21082479
10. Никитин Ю.П., Воевода М.И., Симонова Г.И. Сахарный диабет и метаболический синдром в Сибири и на Дальнем Востоке. Вестник РАМН. 2012; 1: 66-74. [Nikitin Yu P, Vo-evoda M I, Simonova G I Diabetes mellitus and metabolic syndrome in Siberia and the Far East. Vestnik RAMN. 2012; 1: 66-74. (In Russ.).] htt-ps://doi.org/10.15690/vramn.v67i1.113
11. Новаковская Н.А. Клиникопатогенетичес-кие особенности метаболического синдрома в женской популяции репродуктивного возраста в условиях крайнего Севера: автореф…дис. канд. мед. наук. Самара. 2009: 24. [No-vakovskaya N A Clinical and pathogenetic fea-tures of the metabolic syndrome in the female population of reproductive age in the Far North: avtoref…dis. kand. med. nauk. Samara2009: 24. (In Russ.).]
12. Москаленко О.Л., Смирнова О.В., Каспаров Э.В. и др. Ожирение, как фактор риска сердечно-сосудистых заболе-ваний и патологических состояний, обусловлен-ных избыточным весом. В сборнике: Сложные системы в экстремальных условиях Материалы XIX Всероссийского симпозиума с международным участием. Федеральное государственное бюджетное научное учреждение «Федеральный исследо-вательский центр «Красноярский научный центр Сибирского отделения Российской академии наук». 2018: 147-149.
13. [Moskalenko O L, Smirnova O V, Kaspar-ov E. V. and others. Obesity as a risk factor for cardiovascular diseases and pathological con-ditions due to overweight. V sbornike: Slozhnye sistemy v ekstremal'nykh usloviyakh Materialy XIX Vserossiyskogo simpoziuma s mezhdun-arodnym uchastiem. Federal'noe gosudarstven-noe byudzhetnoe nauchnoe uchrezhdenie «Fed-eral'nyy issledovatel'skiy tsentr «Krasnoyarskiy nauchnyy tsentr Sibirskogo otdeleniya Rossiys-koy akademii nauk». 2018: 147-149. (In Russ.).] https://elibrary.ru/item.asp?id=35567147
14. Москаленко О.Л., Смирнова О.В., Каспаров Э.В. и др. Особенности полиморфизма генов PNPLA3 (RS738409), TM6SF2 (RS58542926), MBOAT7 (RS641738), как способ диагностики иммунопатологии при жировом гепатозе. Российский аллергологический журнал. 2018; 15. (S1-2):
64-66. [Moskalenko O L, Smirnova O V, Kasparov E V et al. Peculiarities of the gene polymorphism PNPLA3 (RS738409), TM6SF2 (RS58542926), MBOAT7 (RS641738), as a method for the diag-nosis of immunopathology in case of fatty hepato-sis. Rossiyskiy allergologicheskiy zhurnal. 2018; 15. (S1-2): 64-66. (In Russ.).] https://elibrary.ru/item.asp?id=36409808
15 Мамедов М.Н., Евдокимова А.А., Токарева З.Н., Шальнова С.А. и др. Оценка распространенности факторов риска в случайной городской выборке мужчин и женщин. Международный журнал сердца и сосудистых заболеваний. 2013; 1 (1): 52-60. [Mamedov M N, Evdokimova A A, Tokareva Z N, Shalnova S A et al. Assessment of the prevalence of risk factors in a random urban sample of men and women. Mezhdunarodnyy zhurnal serdtsa i sosudistykh zabolevaniy. 2013; 1 (1): 52-60. (In Russ.).] https://elibrary.ru/item.asp?id=28392146
16. Полупанов А.Г., Концевая А.В., Мамасаидов Ж.А., Халматов А.Н. и др. Рас-пространённость метаболического син-дрома и его компонентов среди жителей Кыргызской республики трудоспособного воз-раста. Казанский медицинский журнал. 2016; 97(4): 618-624. [Polupanov A G, Kontsevaya A V, Ma-masaidov Zh.A., Halmatov A.N. et al. The preva-lence of metabolic syndrome and its components among residents of the Kyrgyz Republic of work-ing age. Kazanskiy meditsinskiy zhurnal. 2016; 97(4): 618-624. (In Russ.).] https://elibrary.ru/item.asp?id=26460182
17. Рычкова Л.В., Аюрова Ж.Г., Погодина А.В., Косовцева А.С. Факторы риска развития ожирения у подростков этнических групп сельских районов Республики Бурятия: ре-зультаты поперечного исследования. Вопросы современной педиатрии. 2017; 16 (6): 509-515. [Rychkova L V, Ayurova Zh G, Pogodina A V, Kosovtseva A S Risk factors for obesity in ad-olescents of ethnic groups in rural areas of the Republic of Buryatia: results of a cross-sectional study. Voprosy sovremennoy pediatrii. 2017; 16 (6): 509-515. (In Russ.).] DOI: 10.15690/vsp.v16i6.1824
18. Симонова Г.И., Мустафина С.В., Щербакова Л.В. Распространенность абдо-минального ожирения в Сибирской популяции. Сибирский научный медицинский журнал. 2015; 35 (1): 60-64. [Simonova G I, Mustafina S V, Scherbakova L V The prevalence of abdom-inal obesity in the Siberian population. Sibirskiy nauchnyy meditsinskiy zhurnal. 2015; 35 (1): 60-64. (In Russ.).] https://elibrary.ru/item.as-p?id=23137187
19. Куликова Н.Г., Александрович Г.А., Байтокова Р.Р., Хаджимурадова М.А. Сов-ременные медико-этнические аспекты диабе-тологии. Медицинский вестник северного Кавказа. 2010; 2: 79-83. [Kulikova N G, Aleksan-drovich G A, Baitokova R R, Khadzhimuradova M A Modern medical and ethnic aspects of diabe-tology. Meditsinskiy vestnik severnogo Kavkaza. 2010; 2: 79-83. (In Russ.).] https://elibrary.ru/item.asp?id=15287689
20. Созонова К.К. Этнические особенности распространенности метаболического син-дрома у лиц пожилого, старческого возраста и долгожителей Якутска: автореф…дис. канд. мед. наук, Якутск. 2014; 24. [Sozonova K K Ethnic features of the prevalence of metabol-ic syndrome in elderly people and long-livers of Yakutsk: avtoref…dis. kand. med. nauk, Yakutsk. 2014; 24].
21. Молдокеева Ч.Б., Лунегова О.С., Кери-мкулова А.С., Миррахимов А.Э. и др. Сравнение различных классификаций метаболического синдрома в кыргызской этнической группе.
References

3’ 2019 97
Евразийский кардиологический журнал. 2011; 2: 54-60. [Moldokeeva Ch B, Lunegova O S, Ker-imkulova A S, Mirrahimov A E et al. Comparison of various classifications of metabolic syndrome in the Kyrgyz ethnic group. Evraziyskiy kardio-logicheskiy zhurnal. 2011; 1: 54-60. (In Russ.).] https://elibrary.ru/item.asp?id=19422492
22. Суплотова Л.А., Сметанина С.А., Но-ваковская Н.А. Распространённость метабо-лического синдрома и его компонентов у женщин в различных этнических группах. Ожирение и метаболизм. 2011; 2: 48-51. [Suplotova L A, Smetanina S A, Novakovska-ya N A The prevalence of metabolic syndrome and its components in women in various ethnic groups. Ozhirenie i metabolizm. 2011; 2: 48-
51.] https://elibrary.ru/item.asp?id=1730065423. Агаджанян Н.А., Макарова И.И.
Этнический аспект адаптационной физиологии и заболеваемости населения. Экология человека. 2014; 3: 3-13. [Agadzhanyan N A, Makarova I I The ethnic aspect of adaptive phys-iology and morbidity. Ekologiya cheloveka. 2014; 3: 3-13. (In Russ.).] https://elibrary.ru/item.as-p?id=21309472
24. Huxley R, Mendis S, Zheleznyakov E, Reddy S, Chan J. Body mass index, waist cir-cumference and waist hip ratio as predictors of cardiovascular risk: a review of the literature. Eur. J. Clin. Nutr. 2010; 64(1): 16-22. doi: 10.1038/ejcn.2009.68.
25. Califf R M Insulin resistance: a global ep-
idemic in need of effective therapies. Eur. Heart. J. Supplements. 2003; 5: 13-18.
26. Gonzalez-Ortiz M, Hernandez-Salazar E, KamRamos A M, Martinez-Abundis E. Effect of pioglitazone on insulin secretion in patients with both impaired fasting glucose and impaired glu-cose tolerance. Diabetes Res. Clin. Pract. 2007; 75: 115-118.
27. Simon J, Lecrubier Y, Ustun T B Somatic symptoms and psychiatric disorder: an interna-tional primary care study. Rev. Contemp. Phar-macotherapy. 2009: 279-285.
28. Park HS, Oh SW, Cho SI, Choi WH, Kim YS. The metabolic syndrome and associated life-style factors among South Korean adults. Int. J. Epidemiol. 2004; 33(2): 328-336.
The analysis of works published according to the results of studies by foreign and domestic authors on the role of the pulmonary neuroendocrine system in the functioning of the bronchi is carried out. Modern ideas about the endocrine mechanisms of bronchial control in patients with bronchial asthma are presented. A brief description of pro-inflammatory and anti-inflammatory peptide substances produced in the bronchopulmonary sys-tem is given. The possibilities of using some peptide substances as drugs in the treatment of patients with bronchial asthma are indicated.
Keywords: pro-inflammatory peptides, anti-inflammatory peptides, bronchopulmonary system, bronchial asthma.
N.U. Chamsutdinov, A.A. Huseynov, D.N. Abdulmanapova
ENDOCRINE MECHANISMS OF BRONCHIAL CONTROL IN PATIENTS WITH BRONCHIAL ASTHMADOI 10.25789/YMJ.2019.67.29
Introduction. According to GINA (2018), bronchial asthma (BA) is a het-erogeneous disease characterized by chronic inflammation of the airways and the presence of respiratory symptoms (wheezing, shortness of breath, conges-tion in the chest, cough), which vary in time and intensity and occur along with variable airway obstruction [16]. At the same time, the neurogenic and immune mechanisms of the development of BA are described in detail in the literature; at the same time, the role of the endocrine system in the development of this dis-ease has not been studied enough.
The active study of the role of the endo-crine system in the development of lung diseases, including bronchial obstruction, began at the end of the 20th century. The impetus for their active study in pulmonol-ogy was the confirmation by a number of scientists of the influence of gastrointes-tinal peptides previously detected in the gastrointestinal tract (GIT) on the bron-chopulmonary system (BPS) [1]. Later, endocrine cells secreting similar peptides were also detected in the BLS. One of the first to be identified was the Klara and Kulchitsky cells. By the beginning of the twenty-first century, a large number of endocrine-active cells were synthesized in the BPS, synthesizing peptides similar to gastrointestinal peptides: the tachyki-nin family, bradykinin, a peptide related to the calcitonin gene (PRCG), bombesin, a vasoactive intestinal peptide (VIP), pep-tide-histidine-methionine (PHM), adreno-medullin, neuropeptide "Y" and others. It was found that the effect of peptide sub-stances on the functioning of the lungs is carried out by means of receptors locat-ed throughout the BPS [12, 22, 23]. Their functional activity was manifested in the blockade of the parasympathetic and sympathetic nervous systems, in con-nection with which non-adrenergic and non-cholinergic, i.e. peptidergic system of functioning of the lungs.
Later it was proved that certain im-
mune competent cells (mast cells, mac-rophages, neutrophils, eosinophils and lymphocytes), as well as neurons, also have the ability to secrete peptides [22]. The presence of receptors for neuro-peptides on the surface of the cell mem-branes of immune-competent cells, as well as neurons, was found [12]. It has been found that neuropeptides, acting through different types of receptors, can lead to different pharmacological effects, i.e. possess multidirectional pharmaco-logical activity. The latter was the theoret-ical justification for a more in-depth study of the pro- and anti-inflammatory effects of various peptide substances on BPS in animal experiments and in patients with BA. It was found that the pro-inflamma-tory effect on the bronchi has: a family of tachykinins (substance P, neurokinins, chemokinin-1), bradykinin, PRCG, endo-thelin-1, bombesin, granin. The anti-in-flammatory peptides included: VIP, neu-ropeptide “Y”, neuropeptide pituitary ade-nylate cyclase-activating polypeptide-38 (PACAP-38), PHM, adrenomedullin, atri-al natriuretic peptide (ANP).
Pro-inflammatory peptides and their role in the development of inflammatory diseases of the lower respiratory tract
Tachykinins play an active part in the development of inflammatory processes in many organs, including the gastroin-testinal tract and BPS [23, 29, 30]. They
CHAMSUTDINOV Nabi U., MD, Professor, Head of the Faculty Therapy Department, Dagestan State Medical University, Makhach-kala, Republic of Dagestan, Russian Feder-ation, E-mail: [email protected]; mobile phone: 89604094661 (contact with editorial staff); ORCID iD: https://orcid.org/0000-0002-3124-0272; GUSEYNOV Ali A., MD, assoc., Professor, Department of Faculty Therapy, Dagestan State Medical University, Makhach-kala, Republic of Dagestan, Russian Federa-tion, E-mail: [email protected]; ORCID iD: https://orcid.org/0000-0002-1829-9077. ABDUL-MANAPOVA Jariyat N., PhD, assistant De-partment of Faculty Therapy, Dagestan State Medical University, Makhachkala, Republic of Dagestan, Russian Federation, E-mail: [email protected]; ORCID iD: https://orcid.org/0000-0002-9986-8840.

ЯКУТСКИЙ МЕДИЦИНСКИЙ ЖУРНАЛ98
are produced in the central nervous sys-tem and peripheral tissues, including in the BPS. They are synthesized in the BPS by epithelial cells of the mucous membrane of the bronchi, endothelial cells, endocrine and endocrine-active immune-competent cells of the lamina of the bronchial mucous membrane (mast cells, eosinophils, neutrophils, lympho-cytes, monocytes, macrophages), bron-chial smooth muscle cells, neurons. It has been established that the BPS of BA patients is more sensitive to tachykinins than the BPS of healthy individuals [22].
Tachykinins act through neurokinin re-ceptors: NK1 (substance P), NK2 (neu-rokinin-A, neurokinin B) and NK3. Tachy-kinins are important in the regulation of the peptidergic mechanisms of asthma and are by far the most studied neuro-peptides in pulmonology.
Allergic sensitization of the respiratory tract of guinea pigs leads to the induction of tachykinins (substance P, neurokinin A) and a peptide related to the calci-tonin gene (PRCG) by sensory neurons, which is one of the pathogenetic mecha-nisms of inflammation in the bronchi and bronchoconstruction [30]. Through NK1 receptors, tachykinins lead to the devel-opment of powerful inflammation in the mucous membrane of the bronchi caus-ing vasodilation, an increase in vascular permeability, hypersecretion, stimulation of mast cells, lymphocytes, and chemo-taxis of neutrophils and eosinophils, and through NK2 receptors they cause bron-chospasms. Bronchial hyperreactivity (BGR) develops as a result of the isola-tion of tachykinins from capsaicin-sensi-tive centripetal nerves via the NK1/NK2 receptors [30].
The substance P, which was discov-ered in 1931, is the most studied of the tachykinin family. Substance P is encod-ed by the preprotachikinin-A gene and is expressed predominantly in sensory neu-rons sensitive to capsaicin. Receptors, through which substance P functions, were found in the lamina propria of the bronchial mucosa, the smooth muscles of the bronchi, near blood vessels, gan-glia and nerve bundles of the submuco-sa. They are absent in the submucous glands and alveolar septa [12].
The substance P is actively synthe-sized in various immune inflammatory processes in the bronchi. It has been established that the content of sub-stance P increases in serum, sputum, bronchoalveolar lavage, endocrine and endocrine-active BPS cells and sensory neurons of patients with BA [5, 22, 27]. The latter implies the direct participation of substance P in the development of the
inflammatory process in the bronchial wall. Substance P affecting the vessels causes their dilatation, affecting the gob-let cells of the respiratory tract and sub-mucosal cells causes hypersecretion and stimulation of mucociliary clearance, af-fecting the smooth muscles of the bron-chi causing bronchospasm. Substance P activates inflammation of the bronchi through the activation of immune-com-petent cells (mast cells, eosinophils, neu-trophils, lymphocytes, monocytes, mac-rophages), chemotaxis of lymphocytes, neutrophils and eosinophils, as well as degranulation of target cells of allergies, predominantly mast cells [5, 22, 23].
Neurokinin-A, which has been active-ly studied in recent years, is a product of the preprotakhinin-A gene. As well as substance P, it is synthesized by immune, inflammatory, endothelial and epithelial cells, as well as by the smooth muscle cells of the bronchi in various immune inflammatory processes in the bronchi. It participates in the activation of immune cells, prolonging the inflammatory pro-cess in the bronchi [22]. There is an in-crease in its content in sensory neurons, as well as in endocrine and endocrine-ac-tive BPS cells of patients with BA. It caus-es contraction of smooth muscles, mainly in the BPS and gastrointestinal tract [13, 23, 31].
In patients with physical asthma, ex-ercise-induced sputum was collected at the beginning and 30 minutes after ex-ercise. In the induced sputum, secreted mucin 5AC, eicosanoids, cysteinyl leu-kotrienes, 15S-hydroxyethylisatetraenoic acid and tachykinins (neurokinin-A, sub-stance P) were determined. At the same time, there was a twofold increase in the induced sputum of asthma patients in the physical effort of mucin 5AC, as well as tachykinins: neurokinin A and substance P. The authors assumed that the release of mucin 5AC after exercise may occur through activation of sensory nerves of the respiratory tract associated with cys-teinyl leukotrienes tachykinins and the development of bronchial obstruction. Exercise-induced pathogenesis of bron-chial obstruction involves the release of mediators (including tachykinins) in re-sponse to physical exertion. However, the mechanism that prevents airflow ob-struction during exercise is not fully un-derstood [28].
The bronchoconstrictive effect of neurokinin-B has also been proven. This peptide is derived from the preprot-achikin-B gene and is acted upon by the NK3 receptors. Neurokinin-B and NK3 receptors are predominantly found in the central nervous system, as well as on the
periphery, mainly in the respiratory tract and gastrointestinal tract [19, 23].
Among proinflammatory neuropep-tides, the peptide of the tachykinin fam-ilies, chemokinin-1, has been actively studied in recent years, which, like sub-stance P, interacts through NK1 recep-tors. It is synthesized predominantly by leukocytes, as well as by immunocom-petent cells of the bronchial mucosa, including macrophages and causes a reduction in the bronchi in humans. In ex-perimental mice, it has been established that it is generated by activated mast cell allergens and contributes to experi-mental chronic allergic inflammation of the airways [34]. Chemokine-1-induced bronchial contraction can be mainly as-sociated with NK2 receptors in humans and with NK1 receptors in the guinea pig [15]. Chemokinin-1 800 times more powerful effect on the bronchi of people than neurokinin-A [22]. It has been es-tablished that chemokine-1 increases in patients with asthma and causes mast cell degranulation, an immune inflamma-tory process in the bronchial mucosa and bronchospasm [34].
As can be seen from the literature data presented, tachykinins are considered as possible mediators of asthma, and tachy-kinin receptor antagonists can be consid-ered as a new class of drugs in the treat-ment of patients with asthma [13, 23]. For example, it was established that bron-chospasm induced by inhalation of neu-rokinin-A in patients with BA is blocked by the double antagonist of NK1/NK2 recep-tors of the tachykinin DNK333 [13] and the antagonist of NK2 receptors of the tachykinin MEN11420 (nepadutant) [32]. It has been proven that dual NK1/NK2 receptor antagonists (DNK-333, AVE-5883 and MEN11420) have the property of weakening bronchial hypersensitivity (BHS) [13, 14, 32].
The NK2 receptor antagonist SR 48968 (saredutant) also prevents bron-choconstriction caused by neurokinin-A in patients with BA [5]. The NK2 recep-tor antagonist SR 144190 selectively in-hibits the binding of neurokinin A to NK2 receptors in humans and various animal species. It prevented BHS in guinea pigs caused by citric acid to acetylcholine [6].
The NK3 receptor antagonist osan-etant (SR142801) reduces the level of TNF-α and interleukin-6, as well as the activity of matrix metalloproteinase-9 in the inflammation of the respirato-ry tract caused by mouse endotoxin. A high anti-inflammatory activity in airway inflammation was observed in the com-bination of the NK1 receptor antagonist SR140333 and NK2 SR48968 [19].

3’ 2019 99
The bronchoconstrictive effect of chemokine-1 is blocked by the NK2 re-ceptor antagonist SR 48968, while the re-ceptor antagonist SR 140333 only slightly reduced the effects of chemokinin-1 [22].
The triple antagonist of the NK1/NK2/NK3 receptor CS-003 reduced BGR and bronchoconstriction caused by neuroki-nin-A in BA patients [31].
The presented data are convincing evidence of inhibition of bronchoconstric-tion by selective antagonists of tachykinin receptors in patients with BA, and open up broad prospects for their use.
The role of nonapeptide bradykinin in the development of inflammation has also been studied. It is established that he is one of the mediators of inflammation in asthma. Its content increases in the bron-choalveolar lavage of patients with BA. Bradykinin affects vascular tone and per-meability, causes hypersecretion and re-duces the smooth muscles of the bronchi through cholinergic mechanisms. By ac-tivating fibroblasts, it is directly involved in the remodeling of the bronchi. It has been proven that NK2 (SR48968) and NK3 receptor antagonists (SR142801 or SB223412) suppress cough caused by bradykinin in guinea pigs [25].
PRCG also belong to pro-inflammato-ry peptides. The main sources of PRCG in the respiratory tract are believed to be unmyelinated and fine myelin sensory nerve fibers and neuroendocrine cells. PRСG receptors, as well as substance P, are found in the lamina propria of the bronchial mucosa, near blood vessels, as well as in the ganglia and nerve bundles of the submucosa [12]. In its own plastic of the bronchial mucosa, PRCG is local-ized predominantly on CD3 + / CD4 + and CD68 + cells [4]. In the smooth muscles of the bronchi, in contrast to substance P, very few PRCG receptors are detected, and in the glands and alveolar septa they are absent [12].
It has been established that the con-tent of PRCG increases in bronchoalve-olar lavage, sputum, peptidergic nerves and sensory neurons of the lower respi-ratory tract of patients with asthma [27]. PRCG may contribute to the late phases of asthmatic reactions after provocation by respiratory allergens [5]. This peptide enhances the effect of substance P, caus-es potent vasodilation, hypersecretion, bronchial edema and bronchial smooth muscle spasm, more pronounced than in substance R. In addition, it contributes to the release of inflammatory mediators, in-cluding histamine from mast cells, which increases inflammatory reaction of the bronchi and bronchospasm. It has been established that in this case the broncho-
spasm is not blocked by histamine, ace-tylcholine and leukotriene antagonists [4].
Endothelin-1, refers to peptides with pro-inflammatory, profibrotic, bron-cho-and vasoconstrictive effects. It plays an important role in the development of airway inflammation and remodeling in asthma [17].
Bombesins are synthesized by the nervous system, as well as various types of neuroendocrine cells, including lung cells. In the lungs, bombesins contribute to the differentiation of epithelial cells and play an important role in modulating the physiology of the respiratory tract. They cause hypersecretion of mucus and marked bronchial obstruction and are one of the main mediators of inflamma-tion in patients with asthma. Broncho-spasm develops due to the direct effect of Bombesin on the receptors of the smooth muscles of the bronchi. At the same time, bronchial obstruction caused by Bombesin is not affected by atropine, hexametonium, propranolol, triprolidine, methysergide, Ro 19-3704 [10].
In recent years, interest in facets has revived, mainly chromium granules A and B. The study of serum granules today is used to diagnose lung tumors. Some re-searchers have reported that chromogr-anin A is increased in patients with bron-cho-obstructive diseases, including those with asthma. The relationship between the amount of serum chromogranin A, smoking, respiratory symptoms and spi-rometry indicators has been studied. Studies were conducted on smokers with normal lung function and bronchial ob-struction. At the same time, high figures of serum chromogranin A were detected in smokers with bronchial obstruction confirmed spirometrically, in contrast to smokers with a normal spirogram. At the same time, the increase in chromogranin A correlated with the degree of bronchial obstruction. The latter, according to the authors, suggests neuroendocrine acti-vation in inflammatory and remodeling processes in the lungs [18].
The role of anti-inflammatory peptides in the functioning of the bronchopulmo-nary system
Among the anti-inflammatory pep-tides, the most studied is the VIP, which causes vasodilation, has a pronounced bronchodilatory effect, has a positive ef-fect on bronchial secretion and mucocili-ary clearance. The bronchodilation activ-ity of the latter is 100 times higher than that of isoproterenol. It has been proven that VIP has a powerful anti-inflamma-tory effect and inhibits the migration of eosinophils [5, 11]. It is detected in the intestine, in the central and peripheral
nervous system, cardiovascular, respira-tory, urogenital and immune systems, as well as in the thyroid gland. VIP receptors are found in the smooth muscles of the pulmonary vessels, large bronchi, on the surface of epithelial and glandular cells, and are practically absent in the bronchi of small caliber. The latter is due to the lack of its influence on their tone. Their receptors are also present in the nerve fibers of normal lungs [8, 11]
In order to determine the VIP in the lungs in patients with BA, the lung tissue obtained during autopsy and lobectomy in 5 patients with BA and 9 without BA was examined. Conducted immunohis-tochemical staining of lung tissue for the detection of VIP and histological exam-ination of at least 80 sections of lung tis-sue of each patient. VIP was detected in more than 92% of the sites from the lungs of patients without BA. It was not found in any of the 468 sections of lung tissue of patients with BA. It was noted a signif-icant decrease in the number of VIP in the nerves in the tissue from the lungs in all patients with asthma. According to the authors, patients with asthma have a loss of VIP from the pulmonary nerve fibers. At the same time, it is unclear whether this loss is a cause or a result of BA [2].
A number of authors have established that IL-5, which is a key cytokine for BA, acts directly on the nociceptors of the respiratory tract and causes the release of VIP. VIP, in turn, stimulates CD4+ lym-phocytes, resulting in a Th2 response and allergic inflammation of the bronchi. Noci-ceptors are believed to enhance patho-logical adaptive immune responses [29].
It has been established that im-mune-competent cells involved in the development of inflammation in the mu-cous membrane of the bronchi (eosino-phils, mast cells, macrophages, neutro-phils) have the ability to release peptide substances that block the secretion of VIP [11]. Some authors suggest that in patients with BA, active peptidases, re-leased in a BPS, result in the destruction of some peptides, including VIP. It has also been proven that persistent respira-tory syncytial infection causes significant changes in the peptidergic innervation of the respiratory tract, namely, in this cate-gory of patients, VIP-reactive nerve fibers decreased [27].
VIP may be considered as a new an-ti-asthma drug due to its bronchodilating activity, vasodilation and immunomod-ulating and anti-inflammatory effects [9, 11]. When systemic injection of VIP has its drawbacks, such as hypotension, heart rate reduction. There have been attempts to use VIP as a drug in patients

ЯКУТСКИЙ МЕДИЦИНСКИЙ ЖУРНАЛ100
with asthma, however, its only and seri-ous drawback, restraining its use in these patients, is a very short half-life after in-travenous administration [9]. These pep-tide effects are minimized by inhalation administration. The development of high-ly active analogues of VIP and systems for their delivery to the respiratory tract is a promising direction for the pharma-cotherapy of broncho-obstructive dis-eases, including BA. Confirmation of the latter is the successful use of inhalation administration of the powder derivative VIP - [Arg 15, 20, 21, Leu17] - VIP-GRR (IK312532). The drug showed its high an-ti-inflammatory efficacy on the bronchi in the experiment [8].
PACAP-38 as well as VIP has anti-in-flammatory and bronchodilating effects. Its effects are mediated by three recep-tors associated with G-protein: PAC1R, VPAC1 and VPAC2, which have similar-ities with VIP. PACAP-38 and its recep-tors are present in the central nervous system and peripheral organs, including the endocrine system (adrenal glands, pancreas, ovaries, testicles), gastrointes-tinal tract, BPS, cardiovascular system, urinary system, and immune competent cells [21]. In the BPS, it is localized in the nerve fibers innervating the lungs. PA-CAP-38 released from peripheral nerve endings with neurogenic inflammation. Plays an important role in the functioning of the lungs. It is a powerful bronchodila-tor and causes marked dilatation of the pulmonary vessels. It plays the role of the regulator of respiration with the cat-echolaminergic system in the medulla oblongata [21]. It has been established that PACAP-38 reduces the release of inflammatory neuropeptides from nerve endings. Agonists PACAP-38 can also be considered as possible drugs for the treatment of asthma.
The effect of PHM on BPS was stud-ied. It resembles the action of VIP. How-ever, its bronchodilating activity is sever-al times higher than that of the VIP, the vasodilating activity is somewhat weaker. Secretory function is more pronounced as well. This peptide can also be consid-ered as a drug for the treatment of BA.
The neuropeptide "Y" was first isolat-ed from the pig hypothalamus in 1982. Its abnormal regulation is associated with the development of a wide range of diseases, including obesity, hyperten-sion, atherosclerosis, epilepsy, metabol-ic disorders, and many cancers [26]. At the end of the twentieth century, began to be widely studied in pulmonology. It is synthesized both in the peripheral and central nervous systems. The content of neuropeptide “Y” increases in the pep-
tidergic nerves of the lower respiratory tract and sensory neurons. In the smooth muscles of the bronchi, their number de-creases. The effect of the neuropeptide "Y" is closely related to the sympathetic nervous system. In patients with asthma, an increase in serum adrenaline, norepi-nephrine and neuropeptide "Y" was de-tected. Apparently, this peptide having a neuronal origin leads to the release of vasopressors, which is accompanied by vasoconstriction and bronchodilation. It plays an important role in the regulation of airway blood flow, smooth muscle con-traction and modulation of the immune response. Its content increases in the air-ways of patients with asthma. According to the authors, the neuropeptide "Y" can participate in the regulation of cytokines and the cellular activity of immune cells in asthma. At the same time, it remains unclear whether such an increase in it is a protective or compensatory mechanism [24]. Although some authors suggest a protective role of the peptide in patients with asthma. A decrease in its quantity contributes to the hypersecretion of mu-cus in patients with asthma. The content of neuropeptide "Y" is increased in the bronchoalveolar lavage. There was an increase in the content of neuropeptide “Y” in the serum of experimentally aller-genic mice. An inflammatory reaction of the respiratory tract was detected in these mice, which was confirmed by an increase in the content of neutrophils and eosinophils in bronchoalveolar la-vage. A direct strong correlation was not-ed between the content of neuropeptide “Y” in the serum and an increase in the bronchoalveolar lavage of experimental mice of neutrophils and eosinophils. An increase in the level of neuropeptide “Y” in peripheral blood was attributed by the authors to increased inflammation of the airways in allergenized mice [20].
In recent years, the role of ANP has been studied. Its receptors are found in the lung tissue, expressed by type II pneumocytes. Its concentration in the blood plasma increases with severe ex-acerbations of asthma. Intravenous ad-ministration of it to experimental animals significantly reduced bronchospasm pro-voked by inhalation administration of his-tamine. It has been proven that ANP has a powerful bronchodilator effect. The dis-advantage of this peptide is the short half-life, in connection with which the possibil-ities of inhalation administration of ANP for the purpose of bronchodilation and bronchoprotection are considered [7, 33].
Adrenomedullin was isolated in 1993 from human pheochromocytoma cells. It belongs to the family of PRCG and is
an effective vasoactive peptide. It is de-tected in the blood, heart, blood vessels, lungs, kidneys, endocrine glands, cere-brospinal fluid. Its main properties are: vasodilation, diuretic and natriuretic ef-fects, positive inotropic effect, inhibition of endothelial cell apoptosis, induction of angiogenesis, inhibition of cardiomyocyte apoptosis, suppression of aldosterone formation, anti-inflammatory effect and antioxidant activity. The physiological effects of adrenomedullin are mediated by the participation of type 1 receptors - PRCG. The amount of peptide increases during an attack of asthma. The peptide also acts as a bronchodilator. The effect of adrenomedullin on bronchoconstric-tion induced by histamine and / or ace-tylcholine in anesthetized guinea pigs in vivo was studied. At the same time, the peptide inhibited bronchoconstriction caused by acetylcholine and induced a prolonged bronchodilation response [3].
Conclusion. As the literature data show, the connection between the ner-vous, endocrine and immune systems is carried out by means of neuropeptides [22]. The classical definition of neuropep-tides has been changed in recent years, since they are not produced exclusively by neurons, but are also synthesized by endocrine and immunocompetent cells. They are considered as neuroendocrine immune modulators and play an import-ant role in the functioning of the gener-al neuroimmune-endocrine system [23]. Thus, the discoveries of recent years make it possible to isolate the neuroim-mune-endocrine mechanisms of the de-velopment of BA, i.e. combine neurogen-ic, immune and endocrine mechanisms into one.
Many peptide substances in animal experiments have proven their anti-in-flammatory and bronchodilation effects. This allows us to consider them as pos-sible drugs for the treatment of BA. A number of proinflammatory peptides, lead to the activation of the inflammato-ry process in the bronchi and bronchial obstruction through exposure through various receptors. The search for antag-onists acting on these receptors is a new direction of anti-inflammatory and bron-chodilatory therapy of asthma.
It is known that many anti-inflamma-tory neuropeptides reduce the inflamma-tory response by reducing inflammatory and regulating anti-inflammatory media-tors. Anti-inflammatory neuropeptide re-ceptors can also be promising targets in the treatment of BA [23].
Sometimes contradictory, but encour-aging data on the possibility of using peptides as drugs in pulmonology open

3’ 2019 101
up broad horizons in the treatment of patients with broncho-obstructive pulmo-nary diseases, including asthma.
1. Чамсутдинов Н.У., Абдулманапова Д.Н. Оценка состояния иммунной и эндокринной систем желудочно-кишечного тракта у пациен-тов с бронхиальной астмой. Вестник Дагестан-ской государственной медицинской академии. 2018; 27(2): 5-12. [Chamsutdinov NU, Abdul-manapova DN. Assessment of the immune and endocrine systems of the gastrointestinal tract in patients with bronchial asthma. Vestnik Dages-tanskoj gosudarstvennoj medicinskoj akademii. 2018; 27(2): 5-12. (In Russ.).].
2. Ollerenshaw S., Jarvis D., Woolcock A [et al.]. Absence of immunoreactive vasoac-tive intestinal polypeptide in tissue from the lungs of patients with asthma. URL: http://www.biomedsearch.com/nih/Absence-immunoreac-tive-vasoactive-intestinal-polypeptide/2610738.html (access date: 02.11.2018). DOI: 10.1056/nejm198905113201904.
3. Patel P., Mishra A., Sheikh AA. Adreno-medullin: A novel peptide hormone. Journal of Pharmacognosy and Phytochemistry. 2017; 6(6): 2068-2073. URL: http://www.phytojournal.com/archives/2017/vol6issue6/PartAC/6-6-72-527.pdf (access date: 29.10.2018).
4. Kay AB., Ali FR., Heaney LG [et al.] Airway expression of calcitonin gene-related peptide in T-cell peptide-induced late asthmatic reactions in atopics. Allergy. 2007; 62(5): 495-503. DOI: 10.1111/j.1398-9995.2007.01342.x.
5. Atanasova KR., Reznikov LR. Neuropep-tides in asthma, chronic obstructive pulmonary disease and cystic fibrosis. Respiratory Research. 2018; 19. URL: https://respiratory-research.biomedcentral.com/articles/10.1186/s12931-018-0846-4 (access date: 25.10.2018). DOI: 10.1186/s12931-018-0846-4.
6. Emonds-Alt X., Advenier C., Cognon C [et al.]. Biochemical and pharmacological activ-ities of SR 144190, a new potent non-peptide tachykinin NK2 receptor antagonist. URL: https://www.neuropeptidesjournal.com/article/S0143-4179(97)90039-1/pdf.(access date: 12.10.2018). DOI: 10.1016/s0143-4179(97)90039-1.
7. Calzetta L., Orlandi A., Page C. Brain na-triuretic peptide: Much more than a biomarker. International Journal of Cardiology. 2016; 221: 1031-1038. DOI: 10.1016/j.ijcard.2016.07.109.
8. Onoue S., Matsu T., Kato M [et al.]. Chemical synthesis and formulation design of a PEGylated vasoactive intestinal peptide deriva-tive with improved metabolic stability. European Journal of Pharmaceutical Sciences. 2013; 49(3): 382-389. DOI: 10.1016/j.ejps.2013.04.009.
9 Athari SS., Pourpak Z., Folkerts G [et al.]. Conjugated alpha-alumina nanoparticle with va-soactive intestinal peptide as a Nano-drug in treatment of allergic asthma in mice. European Journal of Pharmacology. 2016; 791: 811-820. DOI: 10.1016/j.ejphar.2016.10.014.
10. Lach E., Haddad EB., Gies JP. Contractile effect of bombesin on Guinea pig lung in vitro: in-volvement of gastrin-releasing peptide-preferring receptors. URL: https://www.ncbi.nlm.nih.gov/pubmed/8381599 (access date: 17.10.2018). DOI: 10.1152/ajplung.1993.264.1.l80.
11. Delgado M., Ganea D. Vasoactive intes-tinal peptide: a neuropeptide with pleiotropic im-mune functions. Amino Acids. 2013; 45(1): 25-39. DOI: 10.1007/s00726-011-1184-8.
12. Komatsu T., Yamamoto M., Shimoka-
ta K [et al.] Distribution of Substance P-Immu-noreactive and Calcitonin gene-related pep-tide-immunoreactive nerves in normal human lungs. URL: https://www.karger.com/Article/Ab-stract/235449 (access date: 06.11.2018). DOI: 10.1159/000235449.
13. Joos GF., Vincken W., Louis R [et al.]. Dual tachykinin NK1/NK2 antagonist DNK333 inhibits neurokinin A-induced bronchoconstr iction in asthma patients. URL: http://erj.ersjournals.com/content/23/1/76. (access date: 07.11.2018). DOI: 10.1183/09031936.03.00101902.
14. Boot JD., de Haas S., Tarasevych S [et al.]. Effect of an NK1/NK2 receptor antagonist on airway responses and inflammation to allergen in asthma. URL: https://www.atsjournals.org/doi/full/10.1164/rccm.200608-1186OC (access date: 18.10.2018). DOI: 10.1164/rccm.200608-1186oc.
15. Grassin-Delyle S., Naline E., Buenesta-do A [et al.]. Expression and function of human hemokinin-1 in human and guinea pig airways. Respiratory Research. 2010; 11(1). URL: http://respiratory-research.biomedcentral.com/arti-cles/10.1186/1465-9921-11-139 (access date: 01.10.2018). DOI: 10.1186/1465-9921-11-139.
16. Global Strategy for Asthma Management and Prevention. 2018. 160 p. URL: http://ginasth-ma.org/2018-gina-report-global-strategy-for-asth-ma-management-and-prevention/ (access date: 25.09.2018).
17. Goldie RG., Fernandes LB. A possible mediator role for endothelin-1 in respiratory dis-ease. URL: http://www.biomedsearch.com/nih/possible-mediator-role-endothelin-1/10949880.html (access date: 11.10.2018).
18. Sorhaug S., Langhammer A., Waldum HL [et al.]. Increased serum levels of chro-mogranin A in male smokers with airway ob-struction. URL: http://erj.ersjournals.com/con-tent/28/3/542 (access date: 28.10.2018). DOI: 10.1183/09031936.06.00092205.
19. Veron M., Guenon I., Nenan S [et al.]. In-teractions of tachykinin receptor antagonists with lipopolysaccharide-induced airway inflammation in mice. URL: http://booksc.org/book/9325352/b370ea (access date: 24.10.2018). DOI: 10.1111/j.1440-1681.2004.04061.x.
20. Lu Y., Ho RC. An association between neuropeptide Y levels and leukocyte subsets in stress-exacerbated asthmatic mice. Neu-ropeptides. 2016; 57: 53-58. DOI: 10.1016/j.npep.2015.11.091.
21. Diané A., Payne GW., Gray SL. Multi-faces of Pituitary Adenylate Cyclase-Activating Polypeptide (PACAP): From Neuroprotection and Energy Homeostasis to Respiratory and Cardiovascular Systems. Journal of Metabolic Syndrome. 2014; 3(4). URL: http://www.om-icsonline.org/open-access/multifaces-of-pitu-itary-adenylate-cyclaseactivating-polypeptide-pa-cap-2167-0943.1000162.pdf (access date: 30.09.2018). DOI: 10.4172/2167-0943.1000162.
22. Groneberg DA., Quarcoo D., Frossard N. [et al.]. Neurogenic mechanisms in bron-chial inflammatory diseases. URL: https://onlinelibrary.wiley.com/doi/full/10.1111/j.1398-9995.2004.00665.x (access date: 29.10.2018). DOI: 10.1111/j.1398-9995.2004.00665.x.
23. Pinter E., Pozsgai G., Hajna Z [et al.]. Neuropeptide receptors as potential drug targets in the treatment of inflammatory conditions. Brit-ish Journal of Clinical Pharmacology. 2014; 77(1): 5–20. DOI: 10.1111/bcp.12097.
24. Makinde TO., Steininger R., Agrawal DK. NPY and NPY receptors in airway structural and inflammatory cells in allergic asthma. Experimen-tal and Molecular Pathology. 2013; 94 (1): 45-50. DOI: 10.1016/j.yexmp.2012.05.009.
25. Hewitt MM., Adams G., Mazzone SB [et al.]. Pharmacology of Bradykinin-Evoked Cough-ing in Guinea Pigs. J. Pharmacol. Exp. Ther. 2016; 357(3): 620-628. DOI: 10.1124/jpet.115.230383.
26. M. Yi, H. Li, Z. Wu [et al.]. Promising Ther-apeutic Target for Metabolic Diseases: Neuropep-tide Y Receptors in Humans. Cellular Physiolo-gy and Biochemistry. 2018; 45(1): 88-107. DOI: 10.1159/000486225.
27. Tan YR., Yang T., Liu SP [et al.]. Pulmonary peptidergic innervation remodeling and develop-ment of airway hyperresponsiveness induced by RSV persistent infection. Peptides. 2008; 29(1): 47-56. DOI: 10.1016/j.peptides.2007.10.020.
28. Hallstrand TS., Debley JS., Farin FM [et. al.]. Role of MUC5AC in the pathogenesis of ex-ercise-induced bronchoconstriction. Journal of Allergy and Clinical Immunology. 2007; 119(5): 1092-1098. DOI: 10.1016/j.jaci.2007.01.005.
29. Talbot S., Abdulnour RE., Burkett PR [et al.]. Silencing nociceptor neurons reduces allergic airway inflammation. Neuron. 2015; 87(2): 341-354. DOI: 10.1016/j.neuron.2015.06.007.
30. Steinhoff MS., von Mentzer B., Geppetti P [et al.]. Tachykinins and their receptors: contribu-tions to physiological control and the mechanisms of disease. Physiological Reviews. 2014; 94(1): 265-301. DOI: 10.1152/physrev.00031.2013.
31. Schelfhout V., Louis R., Lenz W [et al.]. The triple neurokinin-receptor antagonist CS-003 inhibits neurokinin A-induced bronchocon-striction in patients with asthma. URL: https://orbi.uliege.be/bitstream/2268/17699/2/The%20tr iple%20neurokinin-receptor%20antago-nist%20CS-003%20inhibits%20neurokinin%20A-induced%20bronchoconstriction%20in%20patients.pdf (access date: 08.11.2018). DOI: 10.1016/j.pupt.2005.10.007.
32. Schelfhout V., Van De Velde V., Mag-gi C [et al.] The effect of the tachykinin NK(2) receptor antagonist MEN11420 (nepadutant) on neurokinin A-induced bronchoconstriction in asthmatics. Therapeutic Advances in Re-spiratory Disease. 2009; 3: 219-226. DOI: 10.1177/1753465809349741.
33. Wang Q., Jiang K., Zhang W [et al.]. Tracheal microenvironment, ANP metabolism and airway tone. Journal Science Bulletin. 2016; 61(20): 1551–1554. DOI: 10.1007/s11434-016-1170-3.
34. Manorak W., Idahosa C., Gupta K [et al.]. Upregulation of mas-related G protein coupled receptor X2 in asthmatic lung mast cells and its activation by the novel neuropeptide hemokinin-1. Respiratory Research. 2018; 19(1). URL: http://respiratory-research.biomedcentral.com/arti-cles/10.1186/s12931-017-0698-3 (access date: 01.10.2018). DOI: 10.1186/s12931-017-0698-3.
Authors’ information:Chamsutdinov Nabi U., MD, Professor, Head
of the Faculty Therapy Department, Dagestan State Medical University, Makhachkala, Republic of Dagestan, Russian Federation, E-mail: [email protected]; mobile phone: 89604094661 (contact with editorial staff); ORCID iD: https://orcid.org/0000-0002-3124-0272;
Guseynov Ali A., MD, assoc., Professor, De-partment of Faculty Therapy, Dagestan State Medical University, Makhachkala, Republic of Dagestan, Russian Federation, E-mail: [email protected]; ORCID iD: https://orcid.org/0000-0002-1829-9077.
Abdulmanapova Jariyat N., PhD, assis-tant Department of Faculty Therapy, Dagestan State Medical University, Makhachkala, Repub-lic of Dagestan, Russian Federation, E-mail: [email protected]; ORCID iD: https://orcid.org/0000-0002-9986-8840.
References

ЯКУТСКИЙ МЕДИЦИНСКИЙ ЖУРНАЛ102
The article presents the analysis of 3D modeling laboratory efficiency after its introduction in the departments of radio diagnostics. Prospects and risks of the work of this unit is presented in the study. The calculation of economic indicators shows that the payback is around 2 years, the breakeven point is 60 – 70 clients per month. Results obtained economically and technologically justify active deployment labs 3D simulation in medical institutions.
Keywords: healthcare, economy, 3D modeling.
B.O. Shcheglov, I.V. Galkina, S.N. Shcheglova,M.Yu. ShchelkanovEFFECTIVENESS OF 3D-MODELLING LABORATORY IMPLEMENTATION INTO THERAPEUTIC AND DIAGNOSTIC MEDICAL INSTITUTIONSDOI 10.25789/YMJ.2019.67.30
POINT OF VIEW
Using of 3D-modeling in medical in-stitutions has not yet become a routine procedure, but it is in this direction that a qualitative breakthrough in the field of personalized medicine is the most likely [11, 16] since a technological basis has already been formed for this and in the process of its practical testing it should additionally take shape relevant organi-zational, economic and ethical standards. In this regard, a systematic analysis of the effectiveness of the implementation of these decisions in medical practice is necessary [7, 8].
The department of radiation diagnos-tics, which is standard for Russian med-ical institutions [2], could be the most suitable unit for the implementation of 3D modeling and printing. Firstly, a 3D modeling group is better positioned as an independent technological unit bearing in mind its transformation into a sepa-rate laboratory in the event of a signifi-
cant increase in the volume of work [8, 13, 14]. It should be noted that the trend of increasing volumes of medical activi-ty using medical imaging, and data pro-cessing technologies with an ever-grow-ing consumer market has been observed everywhere in the last decade [18]. For example, steady increase in mortality from malignant neoplasms of the brain and spinal cord recorded in Russia re-quires significant optimization of their diagnosis and treatment [1]. Due to the rapidly improving Big Data technologies, increasing the productivity of electronic computing power, it is possible to over-come the lack of radiation diagnostic data and accelerate digital processing [15]. High quality hardware / software com-plex, management and good work orga-nization aimed at achieving continuous improvement of preanalytical, analytical, and postanalytic phases in diagnosis are an integral guarantee of making a correct diagnosis (Table 1).
Today, it has already become possible to qualitatively supplement and improve the differentiation of diseases of various genesis with the help of slicer programs that convert 2D data of radiation diagnos-
tics into full-fledged three-dimensional models, so the doctor has a chance to carry out preliminary surgical preparation and choose the most effective and opti-mal tactics for performing surgical opera-tions with minimal risk for the patient and a decrease in the trauma of healthy tis-sues. Successful high-quality recognition of diseases of various origins in the ra-diation laboratory complex also reduces the need for repetition of studies and time saving, leading to an increase in the effi-ciency of staff and the medical institution as a whole [3, 10, 12, 17].
The main threats to the work of the 3D modeling laboratory are hacking and theft of information by hackers (Table 1). This problem can be solved by using more ad-vanced cryptography algorithms, using specialized security software, Blockchain technologies and integrated security sys-tems for user authentication [4, 5, 9].
The introduction of the laboratory with the addition of information processing of data can improve the organization of la-bor, save time and more carefully control of the research process [6, 19]. At the first stage, this new technology requires addi-tional investments, the financial viability
Analysis of prospects for the implementation of 3D modeling laboratory
Opportunities Threats
Strengths
Increased productivity and lower costs resulting from using of machine
learning, categorization, artificial intelligence algorithms
Certified software and integrated security systems
WeaksDependence on electronic computing
power and access to specialized databases
Imperfection of authentication and personification systems when working
with databases
Table 1
SHCHEGLOV Bogdan Olegovich, Head of the Student Association “3D-Modeling in Biomedicine” of the Center for Project Activi-ties, Far Eastern Federal University (Vladivo-stok); e-mail: [email protected]; mobile: 89147189825. GALKINA Irina Vyachesla-vovna, PhD in medicine, Leader Researcher of the International Scientific and Educational Center of Molecular Technologies, School of Biomedicine, Far Eastern Federal University (Vladivostok); e-mail: [email protected]; mobile: 89031705864. SHCHEGLOVA Svet-lana Nikolaevna, PhD in pedagogy, Head of the Department of Higher Mathematics, North-eastern State University (Magadan); e-mail: [email protected]; mobile: 89148624028. SHCHELKANOV Mikhail Yurievich, Doctor of Biological Sciences, Head of the Interna-tional Scientific and Educational Center of Molecular Technologies, School of Biomed-icine, Far Eastern Federal University (Vlad-ivostok); e-mail: [email protected]; mobile: 89032689098.

3’ 2019 103
of which can be characterized by com-paring the expected costs and revenues [13]. The time variation of these econom-ic values in relation to the economic con-ditions of the Primorsky Krai is presented in Fig.: for the 3D modeling laboratory, the payback period is about 2 years, the break-even point is 60-70 clients per month; the net present value with a rate of 10% and an investment of 500,000 ru-bles is 187,734 rubles (Table 2).
The creation of a 3D modeling labora-tory in medical institutions as an addition-al module to the department of radiation diagnostics or autonomous education allows us to significantly expand existing methods of non-invasive examination and use them in the areas of preopera-tive planning and prosthetics. The results obtained during the work economically substantiate the creation of this laborato-ry in hospitals and clinics to improve the quality of medical services to the popu-lation.
1. Каприн А.Д., Старинский В.В., Петрова Г.В. (ред.) Злокачественные новообразования в России в 2017 году (заболеваемость и смерт-ность). М.: Московский научно-исследователь-ский онкологический институт им. П.А. Герце-на, 2018: 250. [Kaprin AD, Starinsky VV, Petrova GV (eds.) Malignant neoplasms in Russia in 2017 (morbidity and mortality). Moscow: PA Herzen Moscow Scientific-Research Institute; 2018: 250 (In Russ.).]
2. О совершенствовании службы лучевой диагностики. Приказ Министерства здравоох-ранения РСФСР № 132 от 02.08.1991 с изме-нениями от 05.04.1996. [About the improvement of service for radiation diagnostics. The order of RSFSR Ministry of Public Health № 132 dated at August 02, 1991 with changes dated at April 5, 1996. (In Russ.).]
3. Юрьев В.К. , Пузырев В.Г., Глущенко В.А. и др. Экономика здравоохранения: учеб-ное пособие для студентов педиатрического, лечебного и стоматологического факульте-тов. СПб.: Изд-во СПбГПМУ, 2015: 72. [ Yuryev VK, Puzyrev VG, Glushchenko VA et al. Health economics: a manual for students of pediatric, medical and dental faculties. SPb: GPMU, 2015: 72. (In Russ.).]
4. P Cao, S Toyabe, S Kurashima et al. A modified method of activity-based costing for objectively reducing cost drivers in hospitals. Methods of Information in Medicine. 2006; 4 (45): 462-469.
5. AuBuchon PJ. Optimizing the cost-effectiveness of quality assurance in transfusion medicine. Archives of Pathology and Laboratory Medicine. 1999; 7 (123): 603-606.
6. Brueckner JK. Lectures on urban economics. Cambridge: The MIT Press, 2011: 296.
7. Smith BR, Wells A, Alexander CB et al. Curriculum content and evaluation of resident competency in clinical pathology (laboratory medicine): a proposal. Clinical Chemistry. 2006; 6 (52): 917-949. doi: 10.1373/clinchem.2005.066076
8. Lin BY, Chao TH, Yao Y et al. How can
References
Eco
nom
ic in
dica
tors
(rub
les)
for
the
3D m
odel
ing
labo
rato
ry
Indi
cato
rM
onth
s2
46
810
1214
1618
2022
24Pr
ofit f
rom
1 c
lient
2500
2500
2500
2500
2500
2500
2500
2500
2500
2500
2500
2500
Num
ber o
f cus
tom
ers p
er m
onth
6356
7043
7373
5363
7343
7373
Tota
l rev
enue
s15
7500
1400
0017
5000
1075
0018
2500
1825
0013
2500
1575
0018
2500
1075
0018
2500
1825
00Pa
ymen
t of u
tility
serv
ices
5000
050
000
5000
050
000
5000
050
000
5000
050
000
5000
050
000
5000
050
000
Sala
ry75
200
7520
075
200
7520
075
200
7520
075
200
7520
075
200
7520
075
200
7520
0Pa
ymen
t for
com
mun
icat
ion
serv
ices
1500
1500
1500
1500
1500
1500
1500
1500
1500
1500
1500
1500
Taxe
s50
0050
0050
0050
0050
0050
0050
0050
0050
0050
0050
0050
00C
ost o
f raw
mat
eria
ls10
000
1000
010
000
1000
010
000
1000
010
000
1000
010
000
1000
010
000
1000
0C
apita
l exp
ense
s56
5000
00
00
00
00
00
0Eq
uipm
ent d
epre
ciat
ion
cost
s50
0050
0050
0050
0050
0050
0050
0050
0050
0050
0050
0050
00Th
e to
tal c
ost o
f pro
duct
ion
7117
0014
6700
1467
0014
6700
1467
0014
6700
1467
0014
6700
1467
0014
6700
1467
0014
6700
Hos
pita
l net
pro
fit-5
5420
0-6
700
2830
0-3
9200
3580
035
800
-142
0010
800
3580
0-3
9200
3580
035
800
Dis
coun
ted
flow
-511
530
-618
026
120
-361
8033
040
3304
0-1
3110
9970
3304
0-3
6180
3304
033
040
Am
ount
of i
nitia
l inv
estm
ent
2500
000
00
00
00
00
00
Profi
t / lo
ss fo
r an
indi
vidu
al e
ntre
pren
eur
-147
3230
-133
3230
-115
8230
-105
0730
-868
230
-685
730
-553
230
-395
730
-213
230
-105
730
7677
025
9270
The
tota
l cos
t of p
rodu
ctio
n65
6700
9170
091
700
9170
091
700
9170
091
700
9170
091
700
9170
091
700
9170
0H
ospi
tal n
et p
rofit
-499
200
4830
083
300
1580
090
800
9080
040
800
6580
090
800
1580
090
800
9080
0D
isco
unte
d flo
w-4
6076
044
580
7689
014
580
8381
083
810
3766
060
730
8381
014
580
8381
8381
0Th
e am
ount
of s
econ
dary
inve
stm
ent
2500
000
00
00
00
00
00
Profi
t / lo
ss fo
r the
hos
pita
l-1
3674
60-1
2274
60-1
0524
60-9
4496
0-7
6246
0-5
7996
0-4
4746
0-2
8996
0-1
0746
040
1825
4036
5040
Tabl
e 2

ЯКУТСКИЙ МЕДИЦИНСКИЙ ЖУРНАЛ104
activity-based costing methodology be performed as a powerful tool to calculate costs and secure appropriate patient care? Journal of Medical Systems. 2007; 2 (31): 85-90. https://doi.org/10.1007/s10916-005-9010-z
9. Clemens J, Gottlieb JD. In the shadow of a giant: medicares’s influence on private physician payments. Journal of Political Economy. 2017: 1 (125): 1-39. doi: 10.1086/689772
10. Doyle Jr JJ. Returns to local-area health care spending: evidence from health shocks to patients far from home. American Economic Journal: Applied Economics. 2011; 3 (3): 221-243. https://www.jstor.org/stable/41288644
11. Turetta M, Ben FD, Brisotto G et al.
Emerging technologies for cancer research: towards personalized medicine with microfluidic platforms and 3D tumor models. Current Medical Chemistry. 2018; 35 (25): 4616-4637. doi: 10.2174/0929867325666180605122633.
12. Fisher ES, Bynum JP, Skinner JS. Slowing the growth of health care costs – lessons from regional variation. New England Journal of Medicine. 2009; 9 (360):849-852. doi: 10.1056/NEJMp0809794
13. Friedman BA. The total laboratory solution: a new laboratory E-business model based on a vertical laboratory meta-network. Clinical Chemistry. 2001; 8 (47): 1526-1535.
14. Li J. Intermediate input sharing in the
hospital service industry. Regional Science and Urban Economics. 2013; 6 (43): 888–902. doi: 10.1016/j.regsciurbeco.2013.09.004
15. McDonald JF. Back to the future - The integration of big data with machine learning is re-establishing the importance of predictive correlations in ovarian cancer diagnostics and therapeutics. Gynecologic Oncology. 2018; 2 (149): 230-231. doi: 10.1016/j.ygyno.2018.03.053.
16. Warnken ZN, Smyth HDC, Davis DA et al. Personalized medicine in nasal delivery: the use of patient-specific administration parameters to improve nasal drug targeting using 3D-printed nasal replica casts. Molecular Pharmaceutics. 2018; 4 (15): 1392-1402. doi: 10.1021/acs.molpharmaceut.7b00702.
17. Ricos C, Garcia-Victoria M, de la Fuente B. Quality indicators and specifications for the extra-analytical phases in clinical laboratory management. Clinical Chemistry and Laboratory Medicine. 2004; 6 (42):578–582. doi: 10.1515/CCLM.2004.100
18. Total global market for personalized medicine from 2015 to 2022 (in billion U.S. dollars): [Electronic resource]. URL: https://www.statista.com/statistics/728124/global-market-for-personalized-medicine/ [Accessed: February 25, 2018].
19. Zaninotto M, Plebani M. The hospital central laboratory: automation, integration and clinical usefulness. Clinical Chemistry and Laboratory Medicine. 2010; 7 (48): P. 911-917. doi: 10.1515/CCLM.2010.192
The study was conducted in patients of elderly and senile age, representatives of the indigenous and non-indigenous ethnic group. It has been established that the development and progression of chronic cerebral ischemia occurs in parallel with the progression of chronic kidney disease. At the same time, representatives of the non-indigenous population showed more severe neurological symptoms due to structural changes in the cerebral vascular bed due to hypertension and atherosclerosis, as well as severe renal dysfunction. Evens had milder clinical symptoms of chronic cerebral ischemia and lower renal abnormalities.
Keywords: ethnos, elderly and senile age, chronic brain ischemia, chronic kidney disease.
P.I. Kudrina, S.I. Sofronova, O.V. Tatarinova
ETHNIC AND AGE-RELATED CHARACTERISTICS OF NEUROLOGICAL SYMPTOMS AND FUNCTIONAL STATE OF THE KIDNEYS IN ELDERLY AND SENILE AGE PEOPLE OF YAKUTIADOI 10.25789/YMJ.2019.67.31
The problem of cerebro-renal interac-tions in elderly and senile age patients suffering from chronic cerebral ischemia (CCI) in modern medicine is relevant pri-marily due to the large medical and social significance. This is due to the fact that impaired renal function plays a significant role in accelerating the development and
progression of CCI associated with ath-erosclerosis and arterial hypertension [1]. The high prevalence of CCI is ex-plained not only by demographic chang-es in modern society with an increase in the proportion of elderly and senile age people, but also by an increase in the prevalence of risk factors, which include arterial hypertension, atherosclerosis, diabetes and obesity [3]. It is known that each ethnic group of the population de-termines its own characteristics in the epidemiology of a disease. CCI in combi-nation with chronic kidney disease (CKD) is no exception.
The aim of the study was to research the ethnic and age-related characteristics
of neurological symptoms and functional state of the kidneys in elderly and senile age people of Yakutia.
Materials and research methods.This study was performed in the con-
fines of the neurological department of the Geriatric Center of the Republican Hospital of Sakha (Yakutia) "Republican Hospital №3". 522 patients from 60 to 89 years, of comparable age and sex, were examined. CCI was diagnosed ac-cording to the Classification of Vascular Brain Lesions of the Institute of Neurol-ogy, Russian Academy of Medical Sci-ences (1985), the diagnosis was worded in accordance with ICD-10. The criterion for the diagnosis was instrumentally con-
Profit / loss dynamics in the process of introducing a 3D modeling laboratory in state medical institutions
Profi
t/ lo
ss
Months
Yakutsk, Republic Sakha (Yakutia), Russia: KUDRINA Polina Ivanovna - PhD, neurolo-gist of the Republican Hospital No. 2 - Cen-ter for Emergency Medicine, [email protected]; SOFRONOVA Sargylana Ivanovna - PhD, chief researcher, head of Department of YSC CMP, ORCID

3’ 2019 105
firmed lesion of cerebral vessels with the corresponding clinical picture of the stag-es of CCI in accordance with the classi-fication of E.V. Schmidt (1985) - patients with chronic cerebral ischemia stage I (CCI I) and patients with chronic cerebral ischemia stage II (CCI II).
The following diseases were excluded:- identified malignant neoplasms or
operations for such pathology in the pa-tient’s medical history;
- diseases of the blood system, includ-ing anemia;
- angina pectoris of the 4th FC, as well as acute myocardial infarction (up to 40 days), the presence of congestive heart failure of the 3rd and more functional class (NYHA, New York, 1964);
- Alzheimer's disease and vascular de-mentia;
- chronic renal failure >3rd stage ac-cording to M.A. Ratner;
- acute inflammatory pathology of the articular apparatus;
- chronic obstructive diseases of the bronchopulmonary apparatus with res-piratory failure (RF) stage II-III and mani-festations of chronic pulmonary heart disease;
- obliterating arteriopathy of the lower limbs stages III-IV according to Fontaine.
Strict elimination criteria are justified by the fact that the clinical manifesta-tions of the diseases listed above come to the forefront, changing the clinical pic-ture and the course of chronic cerebral ischemia.
All patients were divided into three ethnic groups:
1st group - 174 patients of the Even nationality (representatives of small in-digenous peoples of the North), living in the Arctic zone. 87 people were in the subgroup of CCI I, CCI II - 87.
2nd group - 177 patients of the Yakut nationality (CCI I - 90, CCI II - 87),
3rd group - 171 patients of the Russian nationality (CCI I - 86, CCI II - 85).
The age of the examined patients ranged from 60 to 89 years; the aver-age age of the examined was 72.7 ± 7.2 years, for men - 72.9 ± 7.2, for women - 72.6 ± 7.2 years. The age groups were formed based on the WHO classification: early elderly people - 60-74 years, late el-derly people - 75-89 years.
In order to study the functional state of the kidneys and assess the severity of chronic kidney disease (stage) in patients with different stages of CCI, depending on ethnicity, the level of glomerular filtra-tion rate was calculated, the parameter most correctly (in the form of one specific numerical value) reflecting global kidney function. The speed of the glomerular fil-
tration rate was determined by two com-putational methods with the subsequent determination of the stages of chronic kidney disease:
Cockcroft&Gault GFR (ml/min) = (140-age) × body
weight (kg) × Е blood creatinine (µmol/l), where Е-1,23 for men and 1,04 for
womenMDRD:GFR (ml/min/1.73 м2) = 186 x (serum
creatinine (mg/dL)-1.154 x (age)-0.203 x (0.742 for women).
The stages of chronic kidney disease were determined in accordance with the classification of the National Kidney Foundation of the USA [4].
Statistical processing of the research results was performed using the SPSS 19.0 software package. To describe the quantitative data, an average value with a standard deviation was calculated. Qualitative attributes are presented in the form of frequency tables containing absolute values and the relative share of the attribute (percentage). Verification of the laws of distribution of quantitative traits for compliance with the normal law was performed using the Kolmogorov-Smirnov test. The test results showed that the distribution of the studied param-eters differs from the normal distribution. The Mann-Whitney paired test was used to compare the average values of the studied parameters. In all statistical crite-ria used, the value of p <0.05 was taken as the threshold level of significance.
Results and discussion. The main objective of our work was to study the functional state of the kidneys, which was determined by the decrease in the glo-merular filtration rate, a parameter that most correctly (as one specific numerical value) reflects global kidney function, and an assessment of the severity of chronic kidney disease (stage) by the glomeru-lar filtration rate [2]. The value was de-termined by two computational methods with subsequent determination of the stages of chronic kidney disease.
As shown in table 2, manifestations of renal dysfunction with glomerular fil-tration rate from 58.78 to 77.87 are ob-served in all patients with CCI, a more pronounced decrease in renal func-tion is observed in the representatives of the 3rd group in both computational formulas. In patients of the 1st group, the glomerular filtration rate is higher than in patients of the 2nd and 3rd
Distribution of patients with chronic cerebral ischemia by ethnicity and age groups
Age group Evensn=174
Yakutsn=177
Russiansn=171
n % n % n %CCI I
60-74 years 42 48.3 61 67.8 54 62.875-89 years 45 51.7 29 32.2 32 37.2
CCI II60-74 years 46 52.9 58 66.7 40 47.175-89 years 41 47.1 29 33.3 45 52.9
Table 1
The
ave
rage
val
ue o
f glo
mer
ular
filtr
atio
n ra
te b
y ca
lcul
atio
n fo
rmul
as (u
nit)
Form
ula
Subg
roup
Even
sYa
kuts
Rus
sian
sP e-
yaP e-
rP ya
-rМ
mМ
mМ
mC
ockr
oft&
Gau
ltC
CI I
74.2
12.
3472
.19
2.26
72.6
42.
570.
536
0.65
20.
895
MD
RD
77.9
72.
4872
.54
2.23
73.9
32.
630.
669
0.99
10.
687
Coc
krof
t&G
ault
CC
I II
70.0
62.
3165
.05
2.22
58.7
82.
250.
121
0.00
10.
005
MD
RD
77.8
77.
1766
.52
2.29
67.8
710
.00
0.19
40.
416
0.89
5
Not
e: M
- av
erag
e va
lue,
m -
stan
dard
err
or o
f the
mea
n
Tabl
e 2

ЯКУТСКИЙ МЕДИЦИНСКИЙ ЖУРНАЛ106
groups. Statistically significant differenc-es were observed in patients with CCI II in Evens and Yakuts compared with Rus-sians.
Old age and CCI increasing severity decreases GFR in all ethnic groups (ta-ble 3). In Yakuts and Russians with CCI I and CCI II of all age groups GFR is lower compared with the Evens. Significant differences were noted in patients with CCI I of the Yakut nationality compared
with Evens in the elderly (60-74 y/o) age group and in Russians compared with the Evens in the senile (75-89 y/o) age group according to the two computational for-mulas. In patients with CCI II, statistically significant differences were noted only in Russians aged 75-89 years compared with the Evens in the same group. De-crease in GFR, depending on the stage
of CCI, is less pronounced in Evens, more in Russians, Yakuts occupy an intermediate position.
Evaluation of the functional state of the kidneys in patients using the computational formu-las revealed a high incidence of the formation of chronic kidney disease in patients with CCI. In our opinion, the cause of such relationships may be the parallel-ism of atherogenesis processes.
Thus, in patients with CCI, both in stage I and stage II, in the elderly and the senile, the best indicators of kidney function are observed in Evens rather than in Yakuts and Russians. Moreover, with age, the severity of chronic kidney disease increases in par-allel with the stage of chronic
cerebral ischemia in each ethnic group.We also carried out a comparative
analysis of the dependence of the neu-rological symptoms of chronic cerebral ischemia on the mean value of the glo-merular filtration rate in the elderly and senile, taking into account national iden-tity and age group (Table 4). We have
The average values of glomerular filtration rate, depending on age and ethnicity
CC
I I
Calculation formula
Evens Yakuts Russians Pe-ya Pe-r Pya-rM m M m M m60-74 years
Cockroft&Gault 91.81 2 81.72 2.29 86.54 2.08 0.002 0.078 0.127MDRD 90.25 2.96 81.89 2.25 85.87 2.29 0.025 0.521 0.66
75-89 yearsCockroft&Gault 57.79 2.15 53.13 2.40 49.18 2.81 0.092 0.016 0.434
MDRD 58.78 2.19 52.88 2.41 50.40 2.71 0.083 0.018 0.501
CC
I II
60-74 yearsCockroft&Gault 78.10 2.86 70.67 2.57 70.79 2.96 0.057 0.81 0.976
MDRD 78.27 2.89 74.44 2.68 69.9 20.65 0.145 0.552 0.31975-89 years
Cockroft&Gault 61.04 3.21 53.80 3.44 48.10 2.43 0.136 0.002 0.169MDRD 77.42 14.97 54.88 3.43 48.29 2.42 0.213 0.048 0.123
Table 3
Neurological symptoms in the studied patients by age depending on the magnitude of the glomerular filtration rate
Neurological symptoms Evens Yakuts Russians Pe-ya Pe-r Pya-rM m M m M m60-74 years
Vestibulopathy 74.81 4.26 70.83 3.63 71.83 3.54 0.083 0.595 0.844CCF 82.28 2.29 76.04 1.91 78.53 2.05 0.039 0.225 0.377Extrapyramidal syndrome 85.95 9.47 65.86 9.45 51.56 11.34 0.19 0.083 0.381MCI 76.11 4.55 71.10 3.39 71.50 4.17 0.384 0.462 0.941POR 41.04 2.96 39.09 4.83 54.45 17.87 0.753 0.589 0.544Ataxia 77.62 4.03 73.30 3.67 72.52 4.18 0.432 0.385 0.889Pyramidal syndrome 77.32 4.19 71.79 3.23 71.95 3.52 0.303 0.334 0.973Pathological reflexes 50.00 9.12 36.77 2.20 43.32 3.65 0.282 0.552 0.209Vegetative symptoms 84.07 3.92 78.20 5.04 82.87 2.48 0.368 0.798 0.418Sensory disorders 85.04 5.14 76.45 4.99 80.01 3.86 0.238 0.441 0.575Reflex asymmetry 89.35 5.51 85.24 3.70 85.48 3.78 0.544 0.570 0.965Vestibular-ataxic disorders 95.55 4.31 85.57 3.21 92.50 3.74 0.078 0.60 0.172Changes in muscle tone 102.09 5.50 86.95 7.56 84.66 5.04 0.141 0.044 0.807
75-89 yearsVestibulopathy 59.87 4.36 54.78 7.64 47.78 2.71 0.576 0.026 0.417CCF 59.20 2.39 53.13 2.26 49.71 1.95 0.069 0.003 0.256Extrapyramidal syndrome 79.85 6.69 37.28 1.05 52.29 5.27 0.125 0.235 0.035MCI 60.47 6.31 55.02 4.14 48.75 3.41 0.408 0.124 0.250POR 41.41 2.29 38.79 6.04 54.83 6.77 0.742 0.101 0.152Ataxia 56.33 4.74 52.92 4.08 48.10 3.23 0.590 0.161 0.361Pyramidal syndrome 62.93 4.52 54.34 5.50 44.89 2.41 0.239 0.001 0.134Pathological reflexes 39.29 1.25 38.23 1.43 40.97 2.29 0.588 0.537 0.335Vegetative symptoms 54.54 4.23 50.07 4.12 41.93 3.02 0.457 0.022 0.429Sensory disorders 61.68 5.93 51.54 4.61 49.69 3.50 0.192 0.098 0.751Reflex asymmetry 56.81 6.23 52.44 3.15 51.38 5.95 0.547 0.540 0.879Vestibular-ataxic disorders 54.05 5.20 53.47 3.33 55.20 4.36 0.926 0.818 0.756Changes in muscle tone 49.55 4.21 50.24 1.87 45.66 8.78 0.809 0.846 0.657
Table 4

3’ 2019 107
identified changes in the clinical picture, neurological status. Persons of Russian nationality had more pronounced chang-es in the clinical picture of neurological symptoms.
At the same time, according to the symptoms, high numbers of GFR are observed in elderly Evens, except for primitive oral reflexes (POR). Yakuts have low GFR, except for extrapyrami-dal syndrome, ataxia and changes in muscle tone. Russians have a high GFR with POR, a low with extrapyramidal syn-drome, ataxia.
Among the senile, the Evens have a more favorable clinical picture, with the exception of POR, pathological re-flex, vestibular-ataxic disorders (VAD), changes in muscle tone. Renal dysfunc-tion is expressed in Russians, apart from extrapyramidal syndrome, POR, patho-logical reflexes, VAD. Late elderly Yakuts occupy an intermediate position, except for the extrapyramidal syndrome, POR, pathological reflexes, VAD, where there are lower rates of GFR.
An interesting fact is that in the elderly the low rate of GFR is observed in repre-sentatives of all nationalities with POR and pathological reflexes, which explains the parallelism of the stages of CKD and CCI.
In the senile Evens, GFR is reduced with all objective symptoms of CCI, ex-
cept for the extrapyramidal syndrome, it is mild cognitive impairment (MCI), pyramidal syndrome, and sensory dis-orders. A more pronounced decrease in GFR is also observed in representa-tives of all nations with POR, pathological reflexes, in addition, in Evens, with the changes of the muscle tone, in Yakuts with extrapyramidal syndrome, ataxia, in Russians with vestibulopathy, CCF (craniocerebral failure), MCI, ataxia, py-ramidal syndrome, and sensitive disor-ders, change in muscle tone.
Thus, the presence of chronic kidney disease was associated with the most pronounced cognitive and neurological disorders, and a worsening of symptoms with the severity of CCI was noted.
Conclusion. Based on our study, it can be stated that in the studied elder-ly and senile age patients, the develop-ment and progression of chronic cere-bral ischemia occurs in parallel with the progression of chronic kidney disease. At the same time, more severe neuro-logical symptoms were discovered in the representatives of the non-indigenous population due to structural changes in the cerebral vascular bed due to arteri-al hypertension and atherosclerosis, as well as severe renal dysfunction. The Evens, the indigenous inhabitants of the northern regions of Yakutia, who re-
tained a calmer, more traditional lifestyle and nutrition of the peoples of Yakutia, had lighter clinical symptoms of chronic cerebral ischemia and lower renal abnor-malities.
1. Арьев А.Л., Чесноков А.А., Дзахова С.Д. [и др.]. Мультиморбидность как один из предикторов развития контраст–индуциро-ванной нефропатии в гериатрической практике. Нефрология. 2017; 21 (1):.34-37. [Ariev AL, Chesnokov AA, Dzakhova SD et al. Multimorbidity as one of the predictors of the de-velopment of contrast-induced nephropathy in geriatric practice. Nefrologiya. 2017; 21 (1): 34-37. (In Russ.)]
2. Мухин Н.А. Снижение скорости клубочковой фильтрации – общепопуляцион-ный маркер неблагоприятного прогноза. Терапевтический архив. 2007; 6: 5-10. [Mukhin NA. Decrease in glomerular filtration rate - gen-eral population marker of unfavorable prognosis. Terapevticheskij arhiv. 2017; 6: 5-10. (In Russ.)] http://www.fesmu.ru/elib/Article.aspx?id=166933
3. Мякотных В.С. Некоторые проблемы современной геронтологии и гериатрии в Российской Федерации: взгляд врача-клинициста. Успехи геронтологии. 2012; 2(25): 197-204. [Myakotnykh VS. Some problems of modern gerontology and geriatrics in the Russian Federation: a view of a clinician. Uspekhi geron-tologii. 2012; 2(25): 197-204. (In Russ.)] https://elibrary.ru/item.asp?id=17830261
4. National Kidney Foundation. K/DOQI Clini-cal practice guidelines for chronic kidney disease: evaluation, classification, and stratification. Am J Kidney Dis 2002; 39 (Suppl 1): SI-266.
Since the 70-s of the last century, anti-gens of the HLA system have been wide-ly used for genetic characterization of populations along with other polymorphic systems. On the basis of allele frequen-cies, similarities or differences between individual populations were identified, and phylogenetic trees were constructed. At the end of the 20th century, a new ap-proach to the study of population genet-ics appeared, called genetic archeology. The new approach pays great attention
to the study of haplotypes, since it can provide more specific information about some population events.
For the new approach, the HLA sys-tem with highly polymorphic and closely linked loci is a very convenient tool for studying the genetic history of popula-tions. From the literature data on the fre-quencies of alleles and haplotypes of the HLA system from different populations, one can determine the critical moments in their history, the age of expansion of those or other haplotypes, and associate them with a specific historical event.
According to V.V. Fefelova [23] L. Degos and J. Dausset believed that
the HLA-A1 and HLA-B8 genes, also HLA-A1/B8 haplotype are Indo-Europe-an, since they appeared in Europe to-gether with Indo-European tribes. At the time, Indo-Europeans in Siberia distrib-uted the haplotype HLA-A1/B17. There-fore, this paper discusses the distribution of haplotypes HLA-A1/B17 and HLA-A1/B8 over the territory Eurasia.
To calculate the age of the haplotype in population, the formula according to [3] is used:
S1/2 = 1 – p1/n,where S is the genetic distance be-
tween the loci under study, p is the level stability (the proportion of chromosomes
The age of the “Indo-European” haplotypes HLA-A1/B17 and HLA-A1/B8 is calculated for different populations of Eurasia. The obtained data are compared with historical events. The results show that the most ancient carriers of the HLA-A1/B17 haplotype are Latvians, and the HLA-A1/B8 haplotype are the Turks. The distribution of the HLA-A1/B17 haplotype in populations is consistent with the migration patterns of Indo-European tribes. This is not observed for HLA-A1/B8; therefore, it has been suggested that the majority of Indo-European tribes did not have this haplotype.
A definition of allele frequencies is proposed by directly counting the number of haplotypes by alleles without using the Bernstein formula.Keywords: Inlo-Europeans, HLA system, haplotype, population, founder effect.
I.P. GourievDISTRIBUTION OF CARRIERS OF “INDO-EUROPEAN” HAPLOTYPES OF HLA SYSTEM ON THE TERRITORY OF EURASIADOI 10.25789/YMJ.2019.67.32
References
GURYEV Innokenty Pavlovich - Candidate of Agricultural Sciences, [email protected]
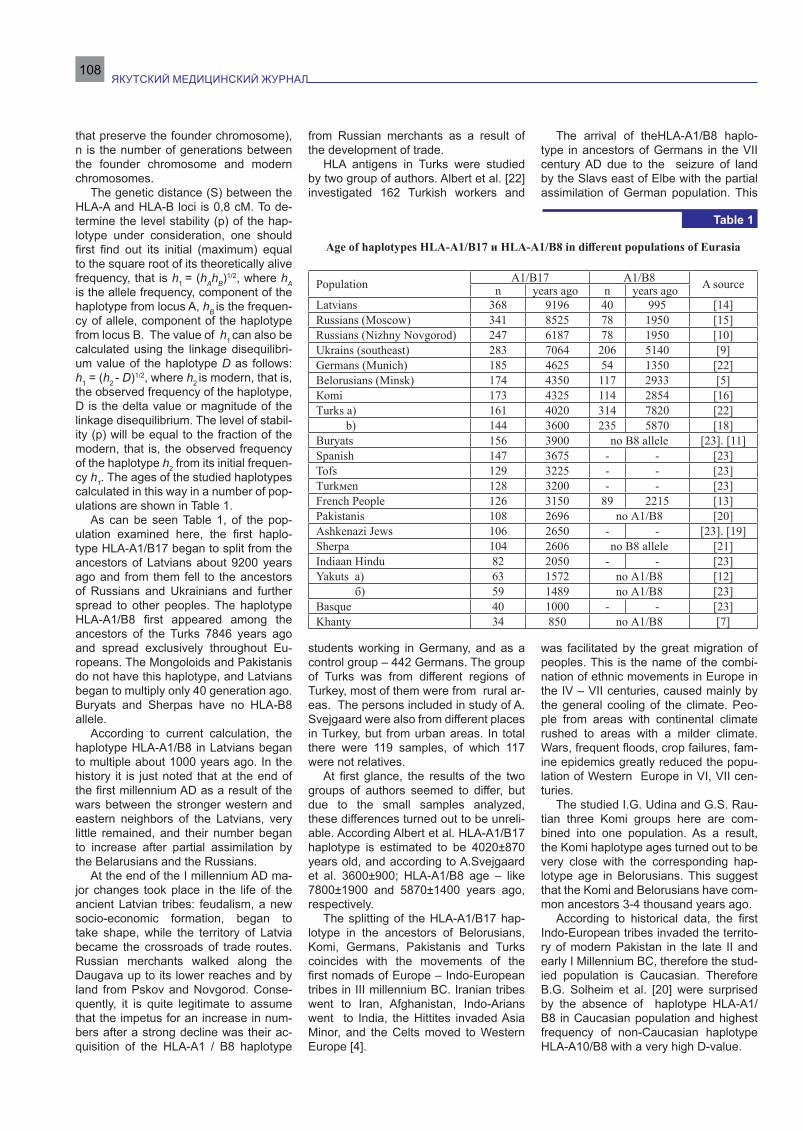
ЯКУТСКИЙ МЕДИЦИНСКИЙ ЖУРНАЛ108
that preserve the founder chromosome), n is the number of generations between the founder chromosome and modern chromosomes.
The genetic distance (S) between the HLA-A and HLA-B loci is 0,8 cM. To de-termine the level stability (p) of the hap-lotype under consideration, one should first find out its initial (maximum) equal to the square root of its theoretically alive frequency, that is h1 = (hАhВ)1/2, where hА is the allele frequency, component of the haplotype from locus A, hВ is the frequen-cy of allele, component of the haplotype from locus B. The value of h1 can also be calculated using the linkage disequilibri-um value of the haplotype D as follows: h1 = (h2 - D)1/2, where h2 is modern, that is, the observed frequency of the haplotype, D is the delta value or magnitude of the linkage disequilibrium. The level of stabil-ity (p) will be equal to the fraction of the modern, that is, the observed frequency of the haplotype h2 from its initial frequen-cy h1. The ages of the studied haplotypes calculated in this way in a number of pop-ulations are shown in Table 1.
As can be seen Table 1, of the pop-ulation examined here, the first haplo-type HLA-A1/B17 began to split from the ancestors of Latvians about 9200 years ago and from them fell to the ancestors of Russians and Ukrainians and further spread to other peoples. The haplotype HLA-A1/B8 first appeared among the ancestors of the Turks 7846 years ago and spread exclusively throughout Eu-ropeans. The Mongoloids and Pakistanis do not have this haplotype, and Latvians began to multiply only 40 generation ago. Buryats and Sherpas have no HLA-B8 allele.
According to current calculation, the haplotype HLA-A1/B8 in Latvians began to multiple about 1000 years ago. In the history it is just noted that at the end of the first millennium AD as a result of the wars between the stronger western and eastern neighbors of the Latvians, very little remained, and their number began to increase after partial assimilation by the Belarusians and the Russians.
At the end of the I millennium AD ma-jor changes took place in the life of the ancient Latvian tribes: feudalism, a new socio-economic formation, began to take shape, while the territory of Latvia became the crossroads of trade routes. Russian merchants walked along the Daugava up to its lower reaches and by land from Pskov and Novgorod. Conse-quently, it is quite legitimate to assume that the impetus for an increase in num-bers after a strong decline was their ac-quisition of the HLA-A1 / B8 haplotype
from Russian merchants as a result of the development of trade.
HLA antigens in Turks were studied by two group of authors. Albert et al. [22] investigated 162 Turkish workers and
students working in Germany, and as a control group – 442 Germans. The group of Turks was from different regions of Turkey, most of them were from rural ar-eas. The persons included in study of A. Svejgaard were also from different places in Turkey, but from urban areas. In total there were 119 samples, of which 117 were not relatives.
At first glance, the results of the two groups of authors seemed to differ, but due to the small samples analyzed, these differences turned out to be unreli-able. According Albert et al. HLA-A1/B17 haplotype is estimated to be 4020±870 years old, and according to A.Svejgaard et al. 3600±900; HLA-A1/B8 age – like 7800±1900 and 5870±1400 years ago, respectively.
The splitting of the HLA-A1/B17 hap-lotype in the ancestors of Belorusians, Komi, Germans, Pakistanis and Turks coincides with the movements of the first nomads of Europe – Indo-European tribes in III millennium BC. Iranian tribes went to Iran, Afghanistan, Indo-Arians went to India, the Hittites invaded Asia Minor, and the Celts moved to Western Europe [4].
The arrival of theHLA-A1/B8 haplo-type in ancestors of Germans in the VII century AD due to the seizure of land by the Slavs east of Elbe with the partial assimilation of German population. This
was facilitated by the great migration of peoples. This is the name of the combi-nation of ethnic movements in Europe in the IV – VII centuries, caused mainly by the general cooling of the climate. Peo-ple from areas with continental climate rushed to areas with a milder climate. Wars, frequent floods, crop failures, fam-ine epidemics greatly reduced the popu-lation of Western Europe in VI, VII cen-turies.
The studied I.G. Udina and G.S. Rau-tian three Komi groups here are com-bined into one population. As a result, the Komi haplotype ages turned out to be very close with the corresponding hap-lotype age in Belorusians. This suggest that the Komi and Belorusians have com-mon ancestors 3-4 thousand years ago.
According to historical data, the first Indo-European tribes invaded the territo-ry of modern Pakistan in the late II and early I Millennium BC, therefore the stud-ied population is Caucasian. Therefore B.G. Solheim et al. [20] were surprised by the absence of haplotype HLA-A1/B8 in Caucasian population and highest frequency of non-Caucasian haplotype HLA-A10/B8 with a very high D-value.
Age of haplotypes HLA-A1/B17 и HLA-A1/B8 in different populations of Eurasia
Population А1/В17 А1/В8 A sourcen years ago n years agoLatvians 368 9196 40 995 [14]Russians (Moscow) 341 8525 78 1950 [15]Russians (Nizhny Novgorod) 247 6187 78 1950 [10]Ukrains (southeast) 283 7064 206 5140 [9]Germans (Munich) 185 4625 54 1350 [22]Belorusians (Мinsk) 174 4350 117 2933 [5]Кomi 173 4325 114 2854 [16]Тurks а) 161 4020 314 7820 [22] b) 144 3600 235 5870 [18]Buryats 156 3900 no В8 allele [23]. [11]Spanish 147 3675 - - [23]Тоfs 129 3225 - - [23]Тurkмеn 128 3200 - - [23]French People 126 3150 89 2215 [13]Pakistanis 108 2696 no А1/В8 [20]Ashkenazi Jews 106 2650 - - [23]. [19]Sherpa 104 2606 no В8 allele [21]Indiaan Hindu 82 2050 - - [23]Yakuts а) 63 1572 no А1/В8 [12] б) 59 1489 no А1/В8 [23]Basque 40 1000 - - [23]Khanty 34 850 no А1/В8 [7]
Table 1

3’ 2019 109
Сalculation from the data of B.G. Solheim et al. [20] showed that with the invasion of the Indo-Europeans in Paki-stan, the haplotypes HLA-A1/B5 (since 980 BC) and HLA-A1B17 (since 724 BC) spread, and haplotype began to multiply later, since 312 BC. At the time, Pakistan was ruled by Persian Sassanid dynasty, which ruled from Asia Minor to Central Asia. At the end of III, beginning of the IV century a number of regions in East dis appeared from the Empire. These territories were conquered during the reign of Shapur II in 309-372 BC. There-fore, due to coincidence of time, Shapur II is supposed to be founder in Pakistan of the chromosome with the haplotype HLA-A10/B8.
From the data of Table 1 it is seen that the first Indo – European influence of the Siberian peoples were the Buryats - at the beginning of the II Millennium BC. Probably the ancestors of the Buryats gained haplotype HLA-A1/B17 with pen-etrated into Western Mongolia Indo-Euro-peans who inhabited this region in D. E. Eremeev [4] at the turn of III-II Millennium BC, the ancestors of Turkmens Tofs and this haplotype came seven centuries af-ter drilled.
The emergence of the haplotype HLA-A1 / B17 in Western Europe – 3675 years ago in Spain and 3150 years ago in France, in all probability, due to the Celts. They caused a great genetic change in Spain – with their conquest, the men be-fore them in the Iberian Peninsula com-pletely disappeared from the gene pool, as can be seen from the Y-chromosome [“New Scientist”].
The Celts were called Gauls by the Romans. Apparently, they gave the French the haplotype HLA-A1/B8 – 236 BC during the first Millennium BC the Greeks, Romans and Carthaginians had established colonies on the Mediter-ranean coast and coastal Islands. The Roman Empire captured the southern part of Gaul and turned it into a province called Norbonne Gaul.at the end of the II century BC.
The population of Ashkenazi Jews passed through the "bottleneck" of a small number 106 generations ago, after which the haplotype HLA-A1/B17 began to multiply. At this time, the Kingdom of Israel was greatly weakened by the divi-sion into two kingdoms – Jewish and Is-raeli, and by rivalry between them. This was not slow to take advantage of the neighbors.
First, the Egyptian Pharaoh Shes-honk II raided Judea, took Jerusalim and robbed many other cities of the country. In 722 BC, the capital of the Northern
Kingdom of Israel – Samaria-was defeat-ed by the warriors of Assyria, and its pop-ulation was resettled by the Assyrians in media and there was lost among the sur-rounding peoples. In 586 BC the Babylo-nians conquered the Kingdom of Judah, destroyed the temple of Jerusalem, and took the color of its population to Baby-lon (the Babylonian captivity). 70 years later, due to the generous Cyrus of Per-sia, who broke the power of Babylon, the Jews were able to return to their land and build a new Temple in Jerusalem, which helped to restore the number of Jews.
In 1972, the Sherpas had a popula-tion of approximately 13,000 living in solu Khumbu in the Eastern Nepal re-gion. Sherpas come from a small group of families who, according to historical documents, came from the city of Salmo Ganges in the Eastern Tibetan province of Han and who migrated West to settle in the high valleys near Everest. This mi-gration occurred around 1530 A.D. the Sherpas ' Single families established so-called tribal villages where only mem-bers of the clan's family, not foreigners, are allowed to live. Clans of Sherpas was established in strictly patrilineal fashion, which in the genealogies record the names of only through the male line. Sherpas marry only members of other Sherpas clans, but do not mix with other populations. The rule of exogamy is very strictly enforced. Therefore, inbreeding does not occur in the Sherpa population [21]. As can be seen from table1, Cauca-sian haplotype HLA-A1/B17 introduced Sherpa 104 generations ago in 624 BC, that is, in the Eastern Tibetan.
The expansion of the haplotype HLA-A1 / B17 in Hindus (2050 years ago) historically coincides with the formation of the Indo-Saka state, which began with king Maues. According to numismatic data, beginning his rule applies no later than the middle of the I century BC. After Maues there were five kings in this dy-nasty [2].
Previously it was published that the Yakuts have mainly Mongoloid antigen frequencies of the HLA system, and the Indo-European haplotype HLA-A1/B17 began to split them 70 generations ago. This result was obtained from the work of V. V. Fefelova [23] by calculating the frequency of genes from the frequen-cy of antigens according to the formula h = 1 – . But in the Table 3 in Fefelova there is no blank graph and the sum of haplotype frequencies by al-leles. Because of this, it is impossible to understand whether the number of chro-mosomes corresponds to the number of people in alleles. The article shows that
the antigen A1 was found in 97 people and B17-in 96, and the sum of chromo-somes with such alleles turned out only 92. It is clear that 5 people have haplo-type A1/Bx and 4 people – Ax / B17. In the same way, it can be understood that 12 people are carriers of the haplotype Ax/B27 (Table 2)
Layout by haplotypes shows that the actual frequency of alleles in the work of V. V. Fefelova other than that specified in article, for example, the frequency of A1 is 01414, not 0,1531, frequency B17 – 0,1399, not 0,1514. With the correction of data, the age of the haplotype HLA-A1/B17 in Yakuts changes from 70 genera-tions to 59. From this we can conclude that in such works a more accurate re-sult will come out when the frequencies of alleles and haplotypes will be derived by direct counting after the layout of hap-lotypes in the lattice, without the use of Bernstein's formula h = 1 – .
In the paper “About the Yakuts ori-gin…” (Genetics, 2004), we hypothesized that the haplotype HLA-A1/B17 fell to the Yakuts, as well as to the Indians, from the Saks. You can still add the hypothesis that the introduction of this haplotype with the Huns. When comparing the English language belonging to the German group of languages and the Yakut language be-longing to the Turkic group, the matches of the words of the compared languages in sound and meaning were revealed. Therefore, linguists express the ancient historical connection of the Huns (Tur-kic-speaking tribes) with the Germanic tribes. It is known that the Huns in the 70s of the IV century, subordinated a number of Germanic tribes. Among turkologists there is an opinion that the direct descen-dants of the Hun substrate of those times are modern Yakuts, as part of the Huns migrated to the East, to Central Asia and further [17].
Basques – a people that lives in the mountains and the Atlantic ocean between Spain and France and speaks in cryptic language eskuara. The strange thing is that the Indo-European haplotype HLA-A1/B17 was introduced to the Spaniards 3675 years ago, the French 3150 years ago, and the Basques only 1000 years ago. In-deed, in history it is noted that the Basques did not submit to any invader and kept their language and traditions, although they were pushed to the mountains and clamped to the ocean. According to the cal-culations of haplotype HLA-A1/B17 got to the Basque population in the period of the Reconquista. So called the process of win-ning the Iberian Peninsula from the yoke of Mauritania, which lasted from 718 to 1492.
In 905-925 Basque king Sancho Garc-

ЯКУТСКИЙ МЕДИЦИНСКИЙ ЖУРНАЛ110
es strengthens the Kingdom of Pamplona and proclaims the Kingdom of Navarra. It was one of the outposts of the Re-conquista. Under Sancho III the Great (970-1035) the Kingdom expanded the borders of their possessions in the South and distributed the authority over all of Christian Spain. At this point, the Basque haplotype HLA-A1/B17 appeared. There-fore, Sancho III the Great can be consid-ered to have spread in the Basque stud-ied haplotype from Spanish Christians.
V.P. Alekseev points out that the reset-tlement of Indo-Europeans began in the south-east of Europe rushing west, they occupied all of Europe as far as the Atlan-tic. Part of the Indo-European tribes that spread to the north and east did not go further than the Ural Mountains. In this re-gard, the age of the HLT-A1 / B17 in Khanty is only 850 years old, showing the acqui-sition of the haplotype in the XII century.
Since the turn of the X-XI centuries, the role of fur hunting, acquiring com-mercial value, has been growing. In the X-XIII centuries, Komi-Zyryan and Rus-sian Novgorod merchants, “industrial people” (fur hunters) penetrated to the north of the Urals and Western Siberia. In this regard, it is assumed the appear-ance of the European haplotype HLA-A1 / B17 among the Khanty from Russian or Komi-Zyrian traders.
Perhaps, the ancestors of the Rus-sians were Indo-Europeans or faced In-do-Europeans in the 7th millennium BC in the steppes of the Black Sea or Cas-pian region. They could come on horse-back from the Urals, as there at that time the horse was domesticated.
Тhe most ancient remains of a do-
mestic horse found in the southern Urals in the Parking lots of Mullino and Dav-lekanovo. They are dated by C-14 by the turn of VII-VI millennia BC [6]. This is also consistent with the opinion of most sci-entists who consider the black sea and Caspian steppes to be the probable an-cestral home of Indo-Europeans. Then, at the beginning of the VI Millennium BC Indo-Europeans could conquer Eastern Anatolia.
Haplotype HLA-A1/B17 spread to all populations conquered by Indo-Europe-an tribes, and the time of its appearance coincides with historical events, but the appearance of haplotype HLA – A1/B8 - not quite often. The fact that the repre-sentatives of the Indo – Aryan people-Pa-kistanis this haplotype is absent, and mi-grated to Western Europe Celts spread there only haplotype HLA-A1/B17, indi-cates that neither the Arians nor the Celts haplotype HLA-A1/B8 was not.
Probably it arose by mutation only arrived in Asia Minor and the Hittites, and from them came the ancestors of the Ukrainians. The rest of the Europe-ans this haplotype spread much later. Probably, the frequency of HLA-B8 hap-lotype and the HLA-A1/B8 Europeans increased, as suggested by V. Bodmer, after the pandemics of plague, smallpox and cholera. It was later found that car-riers of haplotype HLA-A1/B8/DR3 were highly resistant to infections regardless of the nature of their pathogens [8]. If this is the case, it is not the founder's effect, but the natural selection that changed the immunogenetic profile of Europeans in antiquity, the Middle Ages and the Re-naissance as a result of epidemics.
1. Алексеев В.П. Европеоидная раса в Юж-ной Сибири и Центральной Азии, её участие в происхождении современных народов. Про-исхождение аборигенов Сибири и их языков: материалы межвузовской конференции 11-13 мая 1969 г. Томск: изд. Томского ун-та; 1969: 196-198. [Aleхeev VP. Caucosoid race in South Siberia and Central Asia, its participation in the origin of modern people. The descent of the ab-origines of Siberia and their languages: proceed-ings of the inter-university conference May 11-13 1969 Tomsk: Ed. Tomsk University; 1969: 196-198. (In Russ.)].
2. Бонгард-Левин Г.М., Ильин Г.Ф. Ин-дия в древности. М.: Наука, 1985: 738. [Bon-gard-Levin GV, Ilyin GF. India in antiquity. Mos-cow: Nauka, 1985: 738. (In Russ.)].
3. Евграфов О.В. Генетическая археология: новый подход к исследованию генетической истории популяций. Докл. РАН, 1994; 6 (338): 822-826. [Evgrafov OV. Genetic archeology: a new approach to the study of the genetic history of populations. Dokl. RAS. 1994; 6 (338): 822-826. (In Russ.)].
4. Еремеев Д.Е. На стыке Азии и Европы. Очерки о Турции и турках. М.: Nauka, 1980: 238. [Yeremeev DE. At the junction of Asia and Europe. Essays on Turkey and the Turks. Mos-cow: Nauka, 1980: 238. (In Russ.)].
5. Семенов Г.В., В.И. Левин В.И., Гошко Н.Н. и др. Иммуногенетические параметры HLA (локусы С и DR) жителей Минска. Анти-гены гистосовместимости и заболевания: Сб. науч. тр., СПб; 1991; 9-16. [Semenov GV, Levin VI, Goshko NN et al. Immunogenetic parameters of HLA (C and DR loci) of Minsk residents. Sb. nauch. tr. Histocompatibility antigens and diseas-es. Sat scientific works. St-Peterburg; 1991: 9-16. (In Russ.)].
6. Матюшин Г.Н. Археологический словарь. М.: Просвещение: АО «Учеб. лит.», 1996; 304. [Matyushin GN. Archeological dictionary. M.: En-lightenment: AO “Teaching. lit.”; 1996: 304. (In Russ.)].
7. Абрамов В.Ю., Зарецкая Ю.М., Кривцо-ва Л.А., Оточева Л.А. Особенности полимор-физма генетической системы HLA в популя-ции хантов. Генетика. 1990; 26(6): 1087-1091. [Abramov VYu, Zarethkaya YuM, Krivthova LA, Otocheva LA. Feature of the polymorphism of the genetic system HLA in the population of Khanty. Genetics; 1990; 26(6): 1087-1091(In Russ.)].
8. Хаитов Р.М. и др. Полиморфизм генов им-мунного ответа и его роль в противоинфекци-онной защите Иммунология. 2013; 3:132-144. [Khaitov RM et al. Polymorphism of genes of the immune response and its role in anti-infective pro-tection. Immunology. 2013; 3:132-144(In Russ)].
9. Тимошенко Л.И., Бурка Н.И., Бай Е.Н., Минченко Ж.Н. Популяционно-генетическое изучение лейкоцитарных антигенов системы HLA у жителей юго-восточной географической зоны УССР. Проблемы гематологии и перели-вания крови. 1992; 27(1): 37-40. [Timoshenko LI, Burka NI, Bay EN, Minchenko ZhN. Genetic study of the leucocytic HLA system antigens in the population of the south-eastern geno-geo-graphicl zone of the Ukrainian SSR. Problems of hematology and blood transfusion. 1982 27(1): 37-40. (In Russ)].
10. Казакова И.М., Сидорова Т.И. Козло-ва Н.Л. и др. Распределение лейкоцитарных антигенов и частота аллосенсибилизации к различным антигенам системы HLA среди жи-телей Нижнего Новгорода. Антигены гистосов-местимости и заболевания: Сб. науч. тр. СПб;
Distribution of haplotypes in Yakuts (п = 343)
HLA A1 A2 A3 A9 A10 A11 Aw19 A28 Ax TotalN 97 183 35 186 24 19 7 1
B5 37 0 16 3 7 2 1 1 0 7 37B7 16 1 10 3 4 0 0 0 0 0 18B8 6 0 2 1 2 4 0 1 0 0 10B12 31 4 11 11 6 0 0 0 0 0 32B13 21 6 5 0 15 0 2 0 0 0 28B15 126 2 59 9 37 3 9 5 1 1 126B16 2 1 0 0 2 0 0 0 0 0 3B17 96 60 17 1 10 2 0 1 1 4 96
Bw22 2 0 0 0 1 0 1 0 0 0 2B27 59 3 7 2 30 1 4 0 0 12 59B35 53 7 23 4 25 3 0 0 0 0 62B40 139 8 59 2 67 11 5 2 0 0 154Bx 5 0 0 0 0 0 0 0 54 59
Total 97 209 36 206 26 22 10 2 78 686
Note: the number of samples is written in italics, otherwise the number of haplotypes.
Table 2 References

3’ 2019 111
1991: 20-25. [Kazakova IM, Sidorova TI, Kozlova NL et al. The distribution of leykocyte antigens and the frequency of allosensitization to various antigens of the HLA system among the inhabi-tants of Nizhny Novgorod. Histocompatibility an-tigens and diseases. Sb. nauch. tr. St-Peterburg; 1991: 0-25. (In Russ).
11. Сибирякова Л.Г. Распределение HLA-антигенов у лиц бурятской национальности. Антигены гистосовместимости и заболевания. Сб. науч. тр.; СПб; 1991: 25-29. [Sibiryakova LG. Distribution of HLA-antigens among Buryat people. Histocompatibility antigens and diseas-es. Sb. nauch. tr.; St-Petersburg; 1991: 25-29. (In Russ.)].
12. Cибирякова Л.Г., Серова Л.Д., Алексеев Л.П. Распределение HLA-антигенов I и II клас-сов у лиц якутской национальности. Антигены гистосовместимости и заболевания. Сб. науч. тр.; СПб; 1991: 30-35. [Sibiryakova LG., Serova LD, Alexeev LP. Distribution of HLA antigens of I and II classes among Yakut people. Histocom-patibility antigens and diseases. Sb. nauch. tr.; St-Peterburg.; 1991: 30-35. (In Russ.)].
13. Cнелл Дж., Доссе Ж., Нэтенсон С. Со-вместимость тканей. Пер. с англ. М.; Мир,
1979: 502. [Snell J., Dausset J., Natenson S. Compatibility of fabrics. Trans. from English. Mos-cow: Mir, 1979: 502. (In Russ.)].
14. Сочнев А.М. Частота генов и гаплоти-пов HLA, HLA-А, HLA-В антигенов среди ла-тышей. Иммунология. 1982; 1: 43-46. [Sochnev AM. The frecuency of genes and gaplotypes of HLA, HLA-A, HLA-B antigens among Latviens. Immunology. 1982; 1: 43-46. (In Russ.)].
15. Тананов А.Т., Кутьина Р.М. HLA-система антигенов и ее значение при трансплантации органов и тканей. Научный обзор. М., 1980: 60. [Tananov AT., Kutyina RM. HLA-system of anti-gens and its value in the transplantation of organs and tissues. Scientific Review. Moscow;1980: 60.
16. Удина И.Г., Раутиан Г.С. Генетический полиморфизм системы HLA у коми и коми-пер-мяков. Генетика. 1994; 30 (7): 982-991. [Udina IG, Rautian GS. Genetic polymorphism of the HLA-system in Komi and Komi-Permyak people. Genetics. 1994; 30 (7): 982-991. (In Russ.)].
17. Фомин М.М. О связях германских и тюркских языков. Язык – миф – культура на-родов Сибири. Якутск, 1988: 49-55. [Fomin MM. On relations between German and Turkic languages. Language – myth – culture of peo-
ples of Siberia. Yakutsk; 1988: 49-55. (In Russ.)]. 18. Svejgaard A, Staub Nielsen L, Jersild C.
et al. HL-A and Other Polymorphisms in Turks. Histocompatibility Testing. Copenhagen: Munks-gaard, 1972: 139-146.
19. Bonne-Tamir B, Bodmer JD, Bodmer WF et al. HLA polymorphism in Israel. IX. An overall comparative analysis. Tissue Antigens. 1978; 11: 235-250.
20. Solheim BG, Bratlie A, Thorsby E. A Study of the HL-A System in a West Pakistan Popula-tion. Histocompatibility Testing. Copenhagen: Munksgaard; 1972: 171-174.
21. Albert ED, McClelland JD, Hammer C. et al. A Study of the HL-A System in the Nepalese Sherpa Population. Histocompatibility Testing. Copenhagen: Munksgaard; 1972: 227-232.
22. Albert ED, Scholz S., Rosenthal I. et al. A Study of the HL-A System in the Turkish and German Populations. Histocompatibility Testing. Copenhagen: Munksgaard; 1972: 147-152.
23. Fefelova VV. Participation of Indo-Europe-an tribes in Ethnogeny of the Mongoloid popula-tion of Siberia: Analysis of the HLA Antigen dis-tribution in Mongoloids of Sibеria. Amer. J. Hum. Genet. 1990; 47: 294-301.
The authors described the clinical observation of postoperative sternomediastinitis. The feasibility of a two-stage surgical treatment of this pa-thology was noted: the first stage is the removal of ligatures and necrectomy of the sternum, the second is the resection of the sternum with plastic replacement of the wound defect. At the integrity of the sternum, the authors propose to perform surgical intervention, including the preservation of bone tissue, sternal rheosteosynthesis.
Keywords: osteomyelitis of the sternum, sternomediastinitis.
A. A Shevchenko, E. A Kashkarov, N. G Zhila., A.V Koshevoy
CLINICAL CASE OF SUCCESSFUL APPLICATION OF REOSTEOSYNTHESIS STERNUM IN CHRONIC POSTOPERATIVE STERNOMEDIASTINITISDOI 10.25789/YMJ.2019.67.33
CLINICAL CASE
Postoperative sternal wound infec-tions is a severe threatening complication of open cardiac surgery and it is associ-
ated with high mortality [2, 4]. Clinical ex-perience of postoperative sternal wound infections treatment [1, 3, 5, 6] indicates the need for two-stage treatment of this pathology, due to the severe general con-dition of patients in the onset of the dis-ease, the severity of concomitant chron-ic pathology and the inability to perform wound plastic operation in purulent ne-crotic infection conditions.
According to the accepted technique of treatment in the Regional Clinical Hos-pital №1 in Khabarovsk [5], the first stage is the wound surgical treatment, including the removal of foreign bodies, necrecto-my of infected bone fragments of the sternum. Due to the inflammatory nature of the wound, it is not sutured and open treatment is carried out by bandaging. As the wound is cleaned, which is controlled macroscopically and microbiologically, the second stage is the extensive resec-
tion of the sternum with plastic replace-ment of the chest wall wound defect. However, it should be noted that it does not always achieve a positive result in the form of primary healing. In this regard, in our view, this clinical case of the reos-teosynthesis execution in the process of two-stage treatment of the patient with postoperative sternal wound infections with a positive outcome would be inter-esting to experts.
18.04.18 Patient K. aged 70, first entered the Thoracic Department of the Regional Clinical Hospital №1 in Khabarovsk. At the time of admission, he complained of pain in the lower third of the sternum, the presence of fistulas in the middle third of the scar with purulent discharge. During examination: the chest in the region of the median line had the sternotomy immature scar in the lower third of which there was a fistula sized 0.2
SHEVCHENKO Alexander Alexandrovich, candidate of medical Sciences, associate Pro-fessor of the Department of Surgery FESMU, Far Eastern State Medical University, 680000, 35 Muravyov-Amursky St, phone 8-914-770-34-77, e-mail: [email protected]; KASH-KAROV Evgeniy Alexandrovich, the head of the department of Thoracic Surgery Regional Clinical Hospital No.1, 680000, 9 Krasno-darskaya St., e-mail: [email protected]; ZHILA Nikolai Grigorievich, doctor of medi-cal Sciences, Professor of department of sur-gical diseases of childhood Saint Petersburg state pediatric medical University, 194100, Saint Petersburg, 2 Litovskaya St, e-mail: [email protected]; KOSHEVOY Alexander Vlad-imirovich, a thoracic surgeon of the depart-ment of Thoracic Surgery Regional Clinical Hospital No. 1680000, 9 Krasnodarskaya St.

ЯКУТСКИЙ МЕДИЦИНСКИЙ ЖУРНАЛ112
x 0.5 cm with purulent discharge. There was redness of the skin and swelling of the edges of the tissues around the fis-tula. At palpation moderate soreness in the lower third of the sternum was deter-mined. SCT showed the features of the sternum subtotal osteomyelitis.
From the history of the disease: 2.04.2018 in the Federal Center of Car-diovascular Surgery in Khabarovsk, the sternotomic access surgery mammaro-coronary bypass of the anterior descend-ing artery, autovenous bypass of the artery of the blunt edge, posterior inter-ventricular artery were performed. In the postoperative period, after discharging, 12.04.2018 there was redness of the skin on the sternal scar, the occurrence of pain, and 17.04.2018 in the lower third of the scar fistula with purulent discharge opened. He was examined by a thorac-ic surgeon and then sent to the Thoracic Department in Regional Clinical Hospital №1 for treatment. Anamnesis of life: Cor-onary heart disease: Stable angina of FC III. Postinfarction cardiosclerosis (2008). Atherosclerosis of the coronary arteries: the defeat of several vessels. Hyperten-sion, stage III, degree 2, risk 4. CH2 A, II FC by NYHA. Prostate cancer T2NxM0, II CL. gr.. ICD (DT 2016). CKD 2 st. (GFR 68 ml/min). Chronic cholecystitis, adi-pose hepatosis, chronic obstructive pul-monary disease, remission phase.
The patient was hospitalized in the Thoracic Surgery Department with the acute postoperative sternal wound infec-tions diagnosis (fistula formation). At the first stage of the treatment (18.04.18 - 25.05.18) a surgical revision of the wound was performed (24.04.18), the sternal ligatures were removed, the sanation of the mediastinum was performed. In the process of surgical intervention the con-solidation of the sternum was not stated, the severe acute sternal wound infection was observed. In the postoperative pe-riod, open wound care was performed. The patient got a course of antibacterial (cefepime, ciprofloxacin, vancomycin), anti-inflammatory and cardiotropic ther-apy, bandages with antiseptics, includ-ing vacuum bandages, were used. As a result of the therapeutic measures, the patient’s condition was stabilized, the discharge from the wound decreased, became meager and mucous. The micro-biological spectrum of the wound allowed to continue further surgical treatment.
The patient returned to the hospital for the second stage (02.07.18 – 03.08.18) of the surgical treatment (Fig. 1). Taking
the integrity of the sternum (there was an isolated fracture of the left half of the ster-num) and absence of purulent changes in the bone tissue we decided to perform sternal rheosteosynthesis.
20.07.2018 there was the operation - mediastinotomy excision, the sternal rheosteosynthesis. In the process of surgery, the edges of the mediastinotomy were cut; the skin wound was expanded in the cranial direction to the edge of the sternal hilt. Fragments of the sternum were mobilized from the anterior mediastinum, while the right pleural cavity in the lower third of the sternotomy was opened. The drainage of the right pleural space was performed in the 5th intercostal space along the middle clavicle line of the PVC drainage valve along the Bulau. The revision revealed a transverse fracture of the upper third of the left half of the sternum. The thorough curettage of the surface of the sternal fragments with partial edge resection of the protruding edges, the scraping of the granulation tissue were conducted. The mediastinum was sanitized. The sternum fragments were fixed with three 8-shaped and one U-shaped sutures. The wound was sutured tightly. The postoperative period passed without complications, the patient got vancomycin, metrogil, kvamatel and cardiac medications. The pleural drainage was removed on the fifth day. The wound was healed by the primary intention. On the 14th the patient was discharged with detailed recommendations for further outpatient treatment.
Conclusion. In the treatment of sternomediastinitis, in our opinion, it is advisable to use a two-stage method of the surgical treatment: on the first stage it is necessary to perform a resternotomy,
remove foreign bodies and sequesters of the sternum; the second stage is the implementation of resection of the sternum with plastic replacement of the wound defect of the chest wall. In the case of the sternum integrity, the absence of pus and adequate microbiological purity of the wound the implementation of sternal rheosteosynthesis is justified as the second stage.
1. Вишневский А.А., Печетов А.А. Совре-менное многоэтапное хирургическое лечение больных хроническим послеоперационным медиастинитом. Практическая медицина. 2010;8(47):4-8. [Vishnеvskiy AA, Pechetov AA. Modern multi-stage surgical treatment of patients with chronic postoperative mediastinitis. Praktich-eskaya medicina. 2010; 8(47):4-8. (In Russ.). ]
2. Корымасов Е.А, Пушкин С.Ю., Бенян А.С., Медведчиков-Ария М.А. Стратегия и так-тика хирургического лечения инфекционных осложнений после стернотомии. Раны и ране-вые инфекции. 2015;2(4):15-25. [Korimasov EA, Pushkin CU, Benyan AS, Medvedchikov-Ariya M.A. Strategy and tactics of surgical treatment of infectious complications after sternotomy. Rani i ranevie infekcii. 2015; 2(4):15-25 (In Russ.). ]
3. Национальные клинические рекомен-дации. Торакальная хирургия / под ред. П.К. Яблонского. – М.: ГЭОТАР-Медиа, 2014:160. [National clinical guidelines. Thoracic surgery. PK Yablonsky, editor. Moscow: GEOTAR-Media; 2014:160.
4. Вишневский А.А., Рудаков С.С., Ми-ланов Н.О. и др Хирургия грудной стенки. Руководство. – М.: Издательский дом Видар – М, 2005:312. [Vishnevsky AA, Rudakov SS, Milanov NA, Surgery of the chest wall. Moscow: Publishing house Vidar; 2005].
5. Шевченко А.А., Жила Н.Г., Кашкаров Е.А. Анализ лечения послеоперационного остео-миелита грудины и стерномедиастинита Даль-невосточный медицинский журнал 2017;1:30-33. [Shevchenko A. A., Zhila N. G., Kashkarov E. A. Analysis of postoperative osteomyelitis of the sternum and sternomediastinitis. Dalnevostochnij medicinskij zhurnal. 2017; 1:30-33 (In Russ.). ]
6. Yue-Dong Shi, Fa-Zhi Qi, Yong Zhang. Treatment of sternal wound infections after open-heart surgery. Asian Journal of Surgery. 2014; 37:24 – 29.
Fig. 1. Patient K., 70 years old: the appear-ance of a wound in the sternum area before the second stage of surgical treatment
а b
Fig. 2. a) Mobilized half of the sternumb) Fixation of the sternum
References

3’ 2019 113
In the treatment of cold injuries for maximum tissue recovery is very important temperature. The frostbitten area must be warmed up due to the natural heat exchange by the blood circulation, for this the condition of maximum thermal insulation of the affected area must be observed. The article describes the method and provides data on the laboratory determination of thermal conductivity and heat transfer resistance of the material from which the heat-insulating sheaths are made for treatment frostbitten limbs. The results were obtained by the method of stationary thermal conditions at the facility assembled in the department of heat and mass transfer processes of the IPTPN SB RAS. In this paper, a climate chamber, a precision “Tercon” signal converter and non-standard heat flux transducers of the PTP-1B type with integrated temperature sensors are used.
Keywords: climatic chamber, frostbite, low temperatures, heat insulation, thermal conductivity.
The Republic Sakha (Yakutia) is fa-mous for its extremely low temperatures, it is here that the so-called “Pole of Cold” is located - Oymyakon village, where the air temperature in winter falls to -71.2°C. In severe climatic conditions, the problems associated with frostbite and hypothermia of people is of indisputable relevance. During the winter, about 200 people come to hospitals in the Republic of Sakha (Yakutia) with frostbite of the ex-tremities and in a state of profound hypo-thermia. Proper, timely provision of medi-cal care in the regions of the Far North is largely ensured by qualitative preliminary clinical and technical research [2].
The vast majority of cold injuries cause frostbite of the extremities. In case of severe frostbite of the extremities, for
the maximum possible tissue repair, it is necessary to observe the condition of slow and gradual warming of frostbitten tissues due to natural heat exchange by the blood circulation. To this end, the in-jured limb is thermally insulated as much as possible and various means are used to accelerate blood circulation [1]. One of the original solutions is "Hotutent" devel-oped and produced by the Yakut devel-oper’s multilayer insulating material.
The purpose of the work is to deter-mine the thermal conductivity of a heat-insulating material “Hotutent”, which is used as thermal insulation for extremities of people, who received frostbite under conditions of low climatic temperatures.
A rectangular sample of material “Ho-tutent” with dimensions of 29.5 cm by 26 cm was examined. The material is stitched through the seams and has a layered structure.
The structure of the material consists of 8 layers:
1. Outer layer: oxford fabric.2. Bamboo heating insulation filler.3. Insulation №1. Fuzz4. Insulation number 2: Deer wool.6. Bamboo heating insulation filler.7. Oxford fabric.8. Inner layer: heat reflective mate-
rial (foil).Thermal conductivity was determined
by the stationary method at the facility assembled in the department of heat and mass transfer processes of the IPTPN SB RAS. To create a constant tempera-ture difference across the sample thick-ness, the BINDER MK-53 climate cham-ber was used. The working temperature range of this chamber is from -40 to +180 °C. Thermostat accuracy in a chamber is ± 1 °C. One side of the plate is main-tained at a negative temperature in the
chamber of -30 °C, and the other side is at room temperature + 22 °C.
The temperature and heat flux were recorded using a multichannel, preci-sion Terсon signal converter. Converter is coupled with IBM PC through a seri-al interface type RS -232 C , and allows you to record measurement data of heat fluxes and temperatures in the form of a table or graph.
PTP-1B converters, developed by the Institute of engineering thermophysics of the National academy of sciences of Ukraine (Kiev), were used to measure the heat flux. The PTP-1B sensor is a round thin plate made of a PCB with a diameter of 100 mm and a thickness of 2 mm with six leads. The PTP-1B sensor also con-tains a resistance thermometer, where the Pt 100 platinum thermometer with a nominal static characteristic W100 = 1.385 is used as sensitive element. The nomi-nal value of the resistance thermometer at 0 °C is 100 Ω. The limit of permissible basic relative error of heat flux measure-ment is ± 4%, and the limit of permissible absolute error of temperature measure-ment is ± 0.5 K [3].
Such combined sensors are very con-venient for use in the experimental de-termination of resistance to heat transfer and thermal conductivity of materials, since when placing them on both sides of the sample under study, we obtain a com-plete set of initial data for the calculation.
To place the sample in the boundary plane between the chamber and the room, an extruded polystyrene foam screen with a size of 550 × 550 × 100 mm was made with an opening in the center for the dimensions of the sample plate.
After reaching the specified negative temperature in the climate chamber, the value of which was chosen as - 30 °C,
V.A. Ivanov, K.N. Bolshev, R.Z. Alekseev, A.S. Andreev
DETERMINATION OF THE THERMAL CHARACTERISTICS OF THE MATERIAL OF THE INSULATING SHEATH FOR THE TREATMENT OF COLD INJURIES
DOI 10.25789/YMJ.2019.67.34
EXPERIENCE EXCHANGE
IVANOV Vasiliy Alekseevich, doctor of technical sciences, leading researcher of the heat and mass transfer department Institute of physical and technical problems of the North named after V.P. Larionov Siberian branch of the Russian academy of sciences, [email protected] Yakutsk, 677000, Russia. BOL-SHEV Konstantin Nikolaevich, candidate of technical sciences, head of the department of heat and mass transfer, Institute of physical and technical problems of the North named after V.P. Larionov Siberian branch of the Rus-sian academy of sciences, [email protected] Yakutsk, 677000, Russia. ALEKSEEV Revo Zakharovich, doctor of medical sciences, professor, senior researcher of the depart-ment for the study of adaptation mechanisms, Yakut science Centre of Complex medical problems, [email protected] Yakutsk, 677000, Russia. ANDREEV Aleksandr Semenovich, lead engineer of the heat and mass transfer department, Institute of physical and technical problems of the North named after V.P. Lari-onov Siberian branch of the Russian academy of sciences, [email protected] Yakutsk, 677000, Russia.

ЯКУТСКИЙ МЕДИЦИНСКИЙ ЖУРНАЛ114
and the establishment of a stationary mode, data recording continues for an-other 5 minutes for calculations, we took the values of fluxes and temperatures av-eraged over this stationary period.
The value of thermal resistance to heat transfer is determined by the formu-la 1 [4]:
Where t2, t1, are temperatures on the warm and cold surfaces of the plate, °C;
- the average density of the heat flux W / m2, determined by the formula 2:
Where u2, u1 , – voltage signals from two heat meters, mV; K2, K1, – the corre-sponding values of the conversion coeffi-cients, W / (m2 · mV).
The value of thermal conductivi-ty λ plate, W / (m·°C) is determined by the formula 3:
Where - h is the plate thickness, m; RK – calculated by the formula (1) ther-mal resistance to heat transfer, (m2 ·°C) / W. The thickness h was taken as the av-erage profile of about 3 centimeters.
In fig. 3 and fig. 4 shows the graphs of the development of the density of the heat flux and temperatures on the surfac-es of the sample.
Thermal resistance to heat transfer of the heat-insulating material for isolation of frostbitten extremities is equal to 1.050 (m 2 ∙ K) / W. Thermal conductivity of the material corresponding to the given thick-ness is 0.028 W / (m · K).
These results confirm declared ther-mal insulation properties of the mate-rial. The obtained value of thermal con-
ductivity is below the tabulated values of thermal conductivity of materials such as mineral wool and low density polystyrene insulation (0.045 W/(m*K)) [5].
1. Алексеев Р.З., Большев К.Н., Томский М.И., Пугач В.Н., Андреев А.С. Внедрение автоматизированного прибора для монито-ринга температуры конечностей человека при лечении хладотравм. Якутский медицинский журнал. 2017; 4(60):60-62. [Alekseev RZ, Bol-shev KN, Tomsky MI, Pugach VN, Andreev AS. Introduction of an automated device for monitor-ing the temperature of human extremities in the treatment of cold traumas. Yakut Medical Journal. 2017; 4(60): 60-62 (In Russ.).]
2. Алексеев Р.З., Стручков Н.А., Нифонтов К.Р., Андреев А.С. Изменение общих клинических параметров и показателей сер-дечно сосудистой системы при холодовой травме у собак. Якутский медицинский журнал. 2017; 1(57): 54-56. [Alekseev RZ, Struchkov NA, Nifontov KR, Andreev AS. Changes in general clinical parameters and indices of the cardiovas-cular system during cold injury in dogs. Yakut medical journal. 2017; 1(57): 54-56 (In Russ.).]
3. Малышев А.В., Степанов А.В. Определение термического сопротивления теплопередаче слоя жидкого керамического теплоизоляционного покрытия «Броня». Евразийский союз ученых IV международная научно-практическая конференция «Совре-менные концепции научных исследований». 26-27сентября. Москва. 2014; 6. Часть 6:40-43. [Malyshev AV, Stepanov AV. Determination of the thermal resistance of the heat transfer layer of liq-uid ceramic insulation coating "Armor". Eurasian Union of Scientists IV International Scientific and Practical Conference "Modern Concepts of Sci-entific Research". September 26-27. Moscow. 2014; 6. Part 6: 40-43 (In Russ.).].
4. ГОСТ 7076-99 Материалы и изделия строительные. Метод определения теплопро-водности и термического сопротивления при стационарном тепловом режиме. Госстрой России. - М., 2000; 23 с. [GOST 7076-99 Build-ing materials and products. Method for determin-ing thermal conductivity and thermal resistance under stationary thermal conditions. Gosstroy of Russia. – M., 2000; 23 p. (In Russ.)].
5. Ivanov VA, Bolshev KN, Stepanov AA, Malyshev AV, Andreev AS. Estimation of the basalt-reinforced material of thermal resistance. East European Scientific Journal. 2017; 9 (25): 62-64.
Fig.1. Installation for measuring thermal con-ductivity
Fig.2. Diagram of the measurement setup
Fig. 3. Graphs of change in the density of the heat flux on the warm and cold sides of the sample on time
Fig. 4. The graphs change the temperature of the warm and cold sides of the sample over time
(1)
(2)
(3)
References

3’ 2019 115
In this article the authors studied the temporary disability cases in patients with the maxillofacial area diseases that received treatment and rehabilitation in the dental medical organizations in the period of 2007-2016.
Methods.The groups of the maxillofacial area diseases that lead to restriction and/or loss of capacity for work of the adult population in the Re-public of Tatarstan: inflammatory (of odontogenic and neodontogenic genesis), traumatic, benign and malignant lesions, secondary jaw edentulism (full or partial), as well as tooth eruption diseases.
Results. The odontogenic inflammatory processes made the largest share in the causes of temporary disability in patients of dental medical organizations (66.1% of cases), the injuries took a second place (13.9%), the secondary jaw edentulism observed in 7.4% of cases took the third place.
Conclusions. The authors found that during the period under study, the statistically significant changes in the duration of temporary disability cases with odontogenic inflammatory processes, tooth eruption diseases, secondary jaw edentulism, injuries and neoplasms were noted. The analysis showed statistically significant differences in the structure of temporary disability cases by nosological groups, depending on sex, age and year of observation.
Keywords: stomatology, dental medical organization, treatment and rehabilitation of patients, examination of temporary disability, maxillofacial area diseases.
R.A. Saleev, A.B. Abdrashitova
COMPARATIVE ANALYSIS OF MAXILLOFACIAL AREA DISEASES, WHICH LED TO TEMPORARY DISABILITY IN DENTAL MEDICAL ORGANIZATIONS
Introduction. The examination of temporary disability (ETD) is a type of medical activity aimed at assessing the patient’s health status, the quality and effectiveness of the treatment, the possi-bility of professional activities, determin-ing the timing of temporary disability [3]. The examination of temporary disability in the Russian Federation is regulated by the following orders: On approval of Procedure for Issuing Sheets of Disability No. 624н dated June 29, 2011; On Intro-duction of Changes in Procedure for Is-suing Sheets of Disability No. 31н dated January 24, 2012; On Approval of Proce-dure for Examination of Temporary Dis-ability No. 625н dated August 23, 2016; On Introduction of Form for Registration of Clinical and Expert Work in Treatment and Prevention Institutions No. 154 dat-ed May 21, 2002. Among the nosologies with temporary disability, the digestive system diseases occupy the sixth place after the respiratory and circulatory organ diseases, injuries and poisonings, and
musculoskeletal system diseases [1,2]. When appealing to a dental medical or-ganization, the patient is given a tempo-rary sheet of disability based on the pa-tient’s testimony, the duration of which is determined by the time of treatment and the patient rehabilitation for a full return to the work process. Many authors in their studies assert that the case of tem-porary or total disability with the disease of any organs and systems of the body leads to the patient’s somatic and mental imbalance [4,5,6]. The person of working age: women - up to 55 years, men - up to 60 years makes the main category of patients seeking medical dental care. Most patients almost always present a temporary sheet of disability to the social insurance fund for the payment of corre-sponding allowance.
Duration of disability by a patient may depend on various factors, such as the type and course of the maxillofacial area disease, seasonality, individual charac-teristics of the organism. The estimated periods of temporary disability for diges-tive diseases (class XI according to ICD-10) are established relative to the group of the maxillofacial area diseases in the Russian Federation. However, we have not revealed any data on the effect of var-ious factors on the duration of temporary disability in the patient with maxillofacial area disease during treatment in dental medical organizations.
The purpose of the study is to analyze temporary disability cases in the maxil-lofacial area diseases in dental practice over a period of 10 years.
Material and methods. The temporary disability cases, established by the den-
tal medical organizations of the Republic of Tatarstan served as a source of the information was (analysis of accounting and reporting forms 16-ВН, 036/у, 035/у, 043/у for the period 2007-2016). The ma-terial of the study was subjected to sta-tistical processing using the methods of parametric and nonparametric analysis in accordance with the results of testing the compared populations for the normal distribution. The accumulation, updating, systematization of the initial information and visualization of the obtained results were carried out in Microsoft Office Excel 2016. The statistical analysis was carried out using the IBM SPSS Statistics 23.
Results and discussion. The maxil-lofacial area is an important element of the anatomical and functional unity of the human body. Taking into account the pe-culiarities of the structure of soft tissues, maxillofacial bones, their blood supply and innervation, we have defined the groups of the maxillofacial area diseases that lead to the limitation and/or loss of the working capacity of the adult popu-lation: inflammatory (of odontogenic and non-dontogenous genesis), traumatic, benign and malignant lesions, secondary jaw edentulism (full or partial), as well as tooth eruption diseases. When appealing to a dental medical organization, as a rule, in most cases, the sheet of disability is issued by a dentist-surgeon, somewhat less often by a dentist-therapist.
The total number of temporary disabil-ity cases studied by us in dental medical organizations of the Republic of Tatarstan for 2007-2016 totaled 12,891 units, which we accepted as the general population. The statistical analysis was carried out by
DOI 10.25789/YMJ.2019.67.35
SALEEV Rinat Akhmedullovich, Doctor of Medical Science, Dean of Faculty of Dentist-ry of Kazan State Medical University Federal State Budgetary Educational Institution of Higher Education of the Ministry of Health of Russia, 49 Butlerov St, 420012 Kazan, Rus-sia, e-mail: [email protected]._ ORCID: 0000-0003-3604-7321. ABDRASHITOVA Alena Borisovna, Candidate of Medical Sci-ence, Associate Professor of Pediatric Den-tistry of Kazan State Medical University Fed-eral State Budgetary Educational Institution of Higher Education of the Ministry of Health of Russia, 49 Butlerov St, 420012 Kazan, Rus-sia, e-mail: [email protected]. ORCID: 0000-0002-3315-7560

ЯКУТСКИЙ МЕДИЦИНСКИЙ ЖУРНАЛ116
the method of a sample, in which, based on mathematical calculations, the num-ber was 5,204 cases. The distribution of temporary disability cases in the Re-public of Tatarstan by years is shown in Figure 1.
According to the presented figure, the greatest number of temporary disability cases due to dental diseases was regis-tered in 2013 (904 cases), the smallest - in 2009 (253 cases). At this stage of our study, we estimated the time dependence of the incidence of temporary disability from various factors, including the no-sological group of the disease, sex, age, and doctor’s experience.
The results of the comparison of the duration of temporary disability cases, depending on the nosological group to which the underlying disease was relat-ed, are presented in Table 1.
According to the study, the duration of temporary disability cases in maxillofacial area diseases had statistically significant differences, depending on the nosologi-cal group to which the underlying disease belonged (p<0.001). The mean duration of the case was greatest in patients with abnormalities of maxillofacial area de-velopment and with injuries, amounting to 12.18±1.26 and 11.79±0.36 days, re-spectively. The lowest values were taken in the case of odontogenic inflammatory processes in the maxillofacial area and tooth eruption diseases (5.61±0.08 and 6.13±0.35 days, respectively).
Comparison of the duration of tem-porary disability cases corresponding to certain nosological groups was also per-formed in dynamics. The following dia-gram was obtained for the group of odon-togenic inflammatory processes (Fig. 2).
In accordance with the results of a single-factor analysis of variance, the statistically significant differences in the duration of cases of odontogenic inflam-matory processes in dynamics over 10 years were established (p<0.001). During the study period, there was a significant increase in the average from 2008 to 2013 from 4.88 to 6.47 days. In 2015, the average duration of cases fell sharply to 5.29 days, and in 2016 it fell to 5.05 days.
When comparing the duration of cas-es of temporary disability caused by tooth eruption diseases, the data presented in Figure 3 were obtained in the dynamics.
Based on the data obtained, the statis-tically significant differences in the dura-tion of cases of tooth eruption diseases, depending on the year of observation, were noted (p=0.006). At the same time, the average duration of cases took the maximum values in 2009 and 2012 (8.0 and 9.36 days, respectively), in the re-
maining years the fluctuations of the in-dicator were insignificant, ranging from 4.68 days in 2010 to 6.54 days in 2008.
The results of the comparison of the duration of cases of temporary disability due to secondary jaw edentulism in the dynamics from 2009 to 2016 (in 2007-2008 there was a small number of cases of this pathology) are shown in Figure 4.
The analysis made it possible to reveal statistically significant differences in the duration of cases of temporary disability at secondary jaw edentulism in dynamics (p<0.001). When comparing the values of the indicator, the significantly differ-ent average duration of the case in 2015 came under our notice, which was 17.29 days, which was almost twice as high as the next largest indicator of 2013, equal to 9.36 days. We associate the growth of this indicator with an insignificant number of cases of temporary disability at jaw edentulism in the structure of the maxil-lofacial area diseases leading to the oc-currence of the case of temporary loss of capacity for work by the patient, hence, in this case, the median fluctuation was minimal.
The average levels of the duration of cases of temporary disability caused by maxillofacial area injuries were com-pared in dynamics in Figure 5.
As in the case of other studied diseas-es, the changes in the duration of cases of temporary disability due to maxillo-facial area injuries in 2007-2016 were
statistically significant (p<0.001). For this indicator, a gradual decrease from 14.89 to 7.88 days, observed from 2008 to 2015, was characteristic. However, in 2016 the average duration of the case increased significantly, reaching 15.92 days. The growth of this indicator we as-sociate with the increase of cases of joint treatment and rehabilitation of patients with the maxillofacial area injuries in the dental medical organization in 2016 and the conditions of the maxillofacial depart-ment of the profile hospital.
The next nosological group, for which the dynamics of the average duration of cases of temporary disability was studied, were the maxillofacial area neoplasms. In this section of our study, we consider the maxillofacial area neoplasms of only be-nign genesis, treatment and rehabilitation of these patients was performed in the dental medical organizations or the max-illofacial department of the profile hospi-tal according to indications. The resulting graph is shown in Figure 6.
In accordance with the data obtained, the average duration of the case was characterized by statistically significant positive dynamics, increasing during the study period from 4 to 17 days (p<0.001).
According to the results of the analy-sis, the differences in the duration of cas-es of temporary disability with non-dental inflammatory diseases and maxillofacial anomalies, depending on the year of ob-servation, were statistically insignificant (p=0.125 and 0.257, respectively).
In the study, we also revealed the ef-fect of the patient’s sex on the duration of temporary disability in various nosol-ogies of maxillofacial area diseases. The results are shown in Table 2.
According to the presented Table, the statistically significant differences in the duration of cases of temporary dis-ability, depending on sex were noted in most nosological groups. The index took significantly higher values among men in
Distribution of temporary disability cases in a sample during the period under study
Comparison of duration of temporary disability cases, depending on affiliation of disease to particular nosological group
Nosological groups Duration of cases, daysM±m
Odontogenic inflammatory processes of maxillofacial area 5.61±0.08Tooth eruption diseases 6.13±0.35Secondary jaw edentulism 8.57±0.36Maxillofacial area injuries 11.79±0.36Neodontogenic inflammatory processes of maxillofacial area 7.61±0.46Maxillofacial area neoplasms 7.83±0.63Anomalies in maxillofacial area development 12.18±1.26Polypathia 8.15±0.8
Table 1
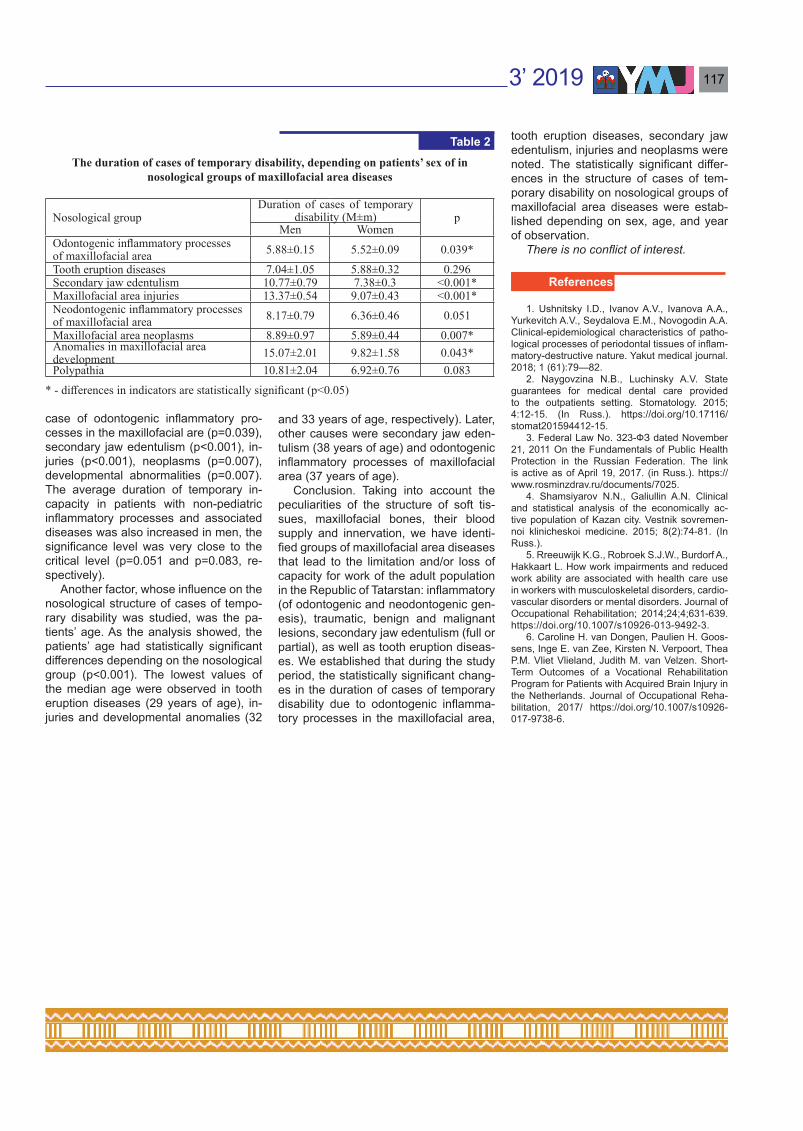
3’ 2019 117
case of odontogenic inflammatory pro-cesses in the maxillofacial are (p=0.039), secondary jaw edentulism (p<0.001), in-juries (p<0.001), neoplasms (p=0.007), developmental abnormalities (p=0.007). The average duration of temporary in-capacity in patients with non-pediatric inflammatory processes and associated diseases was also increased in men, the significance level was very close to the critical level (p=0.051 and p=0.083, re-spectively).
Another factor, whose influence on the nosological structure of cases of tempo-rary disability was studied, was the pa-tients’ age. As the analysis showed, the patients’ age had statistically significant differences depending on the nosological group (p<0.001). The lowest values of the median age were observed in tooth eruption diseases (29 years of age), in-juries and developmental anomalies (32
and 33 years of age, respectively). Later, other causes were secondary jaw eden-tulism (38 years of age) and odontogenic inflammatory processes of maxillofacial area (37 years of age).
Conclusion. Taking into account the peculiarities of the structure of soft tis-sues, maxillofacial bones, their blood supply and innervation, we have identi-fied groups of maxillofacial area diseases that lead to the limitation and/or loss of capacity for work of the adult population in the Republic of Tatarstan: inflammatory (of odontogenic and neodontogenic gen-esis), traumatic, benign and malignant lesions, secondary jaw edentulism (full or partial), as well as tooth eruption diseas-es. We established that during the study period, the statistically significant chang-es in the duration of cases of temporary disability due to odontogenic inflamma-tory processes in the maxillofacial area,
tooth eruption diseases, secondary jaw edentulism, injuries and neoplasms were noted. The statistically significant differ-ences in the structure of cases of tem-porary disability on nosological groups of maxillofacial area diseases were estab-lished depending on sex, age, and year of observation.
There is no conflict of interest.
1. Ushnitsky I.D., Ivanov A.V., Ivanova A.A., Yurkevitch A.V., Seydalova E.M., Novogodin A.A. Clinical-epidemiological characteristics of patho-logical processes of periodontal tissues of inflam-matory-destructive nature. Yakut medical journal. 2018; 1 (61):79—82.
2. Naygovzina N.B., Luchinsky A.V. State guarantees for medical dental care provided to the outpatients setting. Stomatology. 2015; 4:12-15. (In Russ.). https://doi.org/10.17116/stomat201594412-15.
3. Federal Law No. 323-ФЗ dated November 21, 2011 On the Fundamentals of Public Health Protection in the Russian Federation. The link is active as of April 19, 2017. (in Russ.). https://www.rosminzdrav.ru/documents/7025.
4. Shamsiyarov N.N., Galiullin A.N. Clinical and statistical analysis of the economically ac-tive population of Kazan city. Vestnik sovremen-noi klinicheskoi medicine. 2015; 8(2):74-81. (In Russ.).
5. Rreeuwijk K.G., Robroek S.J.W., Burdorf A., Hakkaart L. How work impairments and reduced work ability are associated with health care use in workers with musculoskeletal disorders, cardio-vascular disorders or mental disorders. Journal of Occupational Rehabilitation; 2014;24;4;631-639. https://doi.org/10.1007/s10926-013-9492-3.
6. Caroline H. van Dongen, Paulien H. Goos-sens, Inge E. van Zee, Kirsten N. Verpoort, Thea P.M. Vliet Vlieland, Judith M. van Velzen. Short-Term Outcomes of a Vocational Rehabilitation Program for Patients with Acquired Brain Injury in the Netherlands. Journal of Occupational Reha-bilitation, 2017/ https://doi.org/10.1007/s10926-017-9738-6.
The duration of cases of temporary disability, depending on patients’ sex of in nosological groups of maxillofacial area diseases
Nosological groupDuration of cases of temporary
disability (M±m) pMen Women
Odontogenic inflammatory processes of maxillofacial area 5.88±0.15 5.52±0.09 0.039*Tooth eruption diseases 7.04±1.05 5.88±0.32 0.296Secondary jaw edentulism 10.77±0.79 7.38±0.3 <0.001*Maxillofacial area injuries 13.37±0.54 9.07±0.43 <0.001*Neodontogenic inflammatory processes of maxillofacial area 8.17±0.79 6.36±0.46 0.051Maxillofacial area neoplasms 8.89±0.97 5.89±0.44 0.007*Anomalies in maxillofacial area development 15.07±2.01 9.82±1.58 0.043*Polypathia 10.81±2.04 6.92±0.76 0.083
* - differences in indicators are statistically significant (p<0.05)
Table 2
References

ЯКУТСКИЙ МЕДИЦИНСКИЙ ЖУРНАЛ118
The authors present their research of factors, possibly influencing the duration of persistent patent ductus arteriosus (PDA) in the neonates with congenital heart defects (CHDs) in the Republic Sakha (Yakutia). Such factors as multiple pregnancy, operative delivery, gestational arterial hypertension, preeclampsia, fetoplacental insufficiency, anemia in pregnancy, threatened miscarriage, congenital heart defects in future mother, and ethnicity of a mother or a father are examined.
A retrospective clinical research work was based on the data of the Perinatal Centre of the Republican hospital No1, National Centre of med-icine. A research work is based on clinical results of medical tests, taken from 162 medical records of the patients with a diagnosed “Congenital heart disease” (CHD).
According to the results of statistical analysis there were revealed most significant risk factors for long-term persistent arterial ducts among the neonate population of the Republic Sakha (Yakutia). They may be associated with: complicated course of pregnancy, i.e. gestational arterial hypertension with or without proteinuria, pregnancy edema associated with presence or absence of proteinuria, fetoplacental insufficiency, anemia of the current pregnancy and presence of CHD in the mother’s past history.
Keywords: congenital heart defect, arterial duct, hemodinamically insignificant patent ductus arteriosus.
M.S. Savvina, S.A. Evseeva, T.I. Nelunova, T. Е. Burtseva M.P. Slobodchikova
RISK FACTORS INFLUENCING THE PERSISTENCE OF PATENT DUCTUS ARTERIOSUS IN NEONATES WITH CHD IN THE REPUBLIC SAKHA (YAKUTIA)
Introduction. The prevalence of the patent ductus arteriosus (PDA) in the newborns remains unknown as there are no distinct criteria from what period of gestation PDA is considered pathologic. Nominally it is supposed to close with-in the first two weeks after birth. Under such criteria the prevalence of the isolat-ed pathology is 0.14-0.3 per 1,000 live-born children, 7% among all the CHDs and 3% among all the critical defects [7]. Persistence of the arterial duct consid-erably depends on the term of gestation besides that the data that some factors of the mother, such as intrauterine hypoxia, non-steroid anti-inflammatory medication
intake etc., are known. A number of sev-eral factors which can be associated with high risk of long-term persistence of PDA in neonates are not well studied in the ter-ritory of the Republic of Sakha (Yakutia).
Objectives: The factors that are pos-sibly associated with the long-term per-sistence of PDA in neonates with CHDs are studied.
Methods and materials: A retrospec-tive clinical research work was based on the data of the Perinatal Centre of the Republican hospital No1, National Cen-tre of medicine. A research work is based on clinical results of medical tests, taken from 162 medical records of the patients with a diagnosed “Congenital heart dis-ease” (CHD). The time distance of the medical records is registered two times, thus from 2001 to 2003 and from 2013 to 2015. The CHD is recorded according to Q20-Q28 (ICD-10, chapter XVII: Con-genital malformations, deformations and chromosomal abnormalities). The deliv-ery case reports (#010u) and patient’s discharge statistic card (#066/u-02) were the initial documentations for analysis.
All the neonates had experienced ul-trasound examination (Doppler echocar-diography) of the heart to evaluate the anatomical structure and cardiovascular function. The selection is based on the cases with bypass through interatrial septum according to the results of ultra-sound investigation. The functioning ac-tivity of the arterial duct was evaluated by colour Doppler test to define additional flow in the vessel projection, i.e. pulmo-nary trunk. According to the results of the ultrasound investigation, all the selection
of CHDs was divided into groups: the 1st group consists of the patients with non-re-vealed shunting according to the Doppler monitoring of the vessel with pulmonary artery projection, non-functioning arteri-al flow; the 2nd group consists of the pa-tients with revealed systolic and diastolic disorders or systolic shunting, according to the Doppler monitoring of the vessel with pulmonary artery projection, func-tioning arterial flow; the 3rd group con-sists of all cases of CHD. The research was performed from 2001 to 2003 on the base of ATL-HDI-3000 Philips, from 2013 to 2015 on the base of EPIQ-7 Philips.
The age of the neonates included in the selective group was from 17 to 40 for mothers and from 17 to 48 for fathers. The period of gestation at the moment of birth of a child with CHD was from 25 to 41 weeks. The body weight at moment of the birth was from 564 gr to 4,500 gr. The height at the moment of the birth was from 30 cm to 58cm.
The family history of the both parents was retrospectively evaluated. Thus, the following factors were included: 1) the fac-tors complicating pregnancy (gestational hypertension with or without proteinuria, edema with or without proteinuria for the current pregnancy, preeclampsia, feto-placental insufficiency, anemia during the current pregnancy, multiple pregnancy, threatened miscarriage, operative deliv-ery of the current pregnancy); 2) CHD in the mother’s past history; 3) ethnicity of the parents (was registered by self-deter-mination of the survey).
On data processing χ2 criteria were used (comparing binary / nominal vari-
DOI 10.25789/YMJ.2019.67.36
SAVVINA Maya Semyonovna – Ph.D., se-nior staff scientist of the laboratory of pediatric health level monitoring, Yakut science Centre of complex medical problems, Yakutsk, Rus-sia, e-mail: [email protected]; NELUN-OVA Tuyara Ivanovna – cardiologist of the Perinatal Center of the Republican hospital No1, postgraduate, St. Petersburg state pe-diatric medical university, St. Petersburg, Russia; EVSEYEVA Sardana Anatolievna – Ph.D., senior staff scientist of the laborato-ry of pediatric health level monitoring, Yakut science Centre of complex medical problems, Yakutsk, Russia; BURTSEVA Tatiana Egor-ovna – MD, professor of the department of pe-diatrics and pediatric surgery, Medical institute of the North-Eastern federal university, a head of the laboratory of the Yakut science Centre of complex medical problems, Yakutsk, Russia; SLOBODCHIKOVA Maya Pavlovna – a se-nior lecturer of the department of foreign lan-guages with the course of Russian language, St. Petersburg state pediatric medical univer-sity, St. Petersburg, Russia.

3’ 2019 119
ables) and the Mann-Whitney U test (comparing continuous variables). When p<0.05 the intergroup accuracy was con-sidered significant. The initial data were accumulated in the database by means of Microsoft® Excel software, all the statistic operations were conducted by means of SPSS® Statistics software (IBM® USA).
Results and discussion. The statis-tical analysis of the repeated ultrasound investigations of one and the same child with CHD confirming the presence or ab-sence of PDA was carried out. 162 cases were selected. A possible association of multiple pregnancy with the risk of long-term persistence of the ductus arteriosus during the medical reexaminations was analyzed (Table 1).
The following factors aggravating pregnancy were investigated, i.e. gesta-tional arterial hypertension and edema with or without proteinuria, preeclampsia, fetoplacental insufficiency, anemia of the current pregnancy and threatened mis-carriage, as well as operative delivery.
According to the research statistically unconfirmed results were obtained, i.e. the results were higher for multiple preg-nancies among hemodinamically insignif-icant patent ductus arteriosus (HIS-PDA) (n=86) – 5.8% than in groups with the hemodinamically significant patent duc-tus arteriosus (HS-PDA) (n=76) – 1.3%. Multiple pregnancy as a predictor of long-term persistence of the patent ductus ar-teriosus among all the selections became statistically unsatisfactory.
The association of the gestational ar-terial hypertension with or without pro-teinuria of the current pregnancy with a risk of persistence of PDA (p=0.948) was revealed, but the results are not statisti-cally verified. In 34% of all cases of re-ex-amination of the arterial duct (n=162) the following factors were registered. The prevalence of the gestational arterial hypertension with or without proteinuria, and edema of the pregnancy with or without proteinuria in the structure of the arterial duct was equal in both groups: HIS-PDA– 33.7% (n=86) and HS-PDA – 34.2% (n=76).
According to the results, preeclampsia of the current pregnancy was registered in 72.8% of all cases of CHDs and was more significantly associated with the risk of long-term persistence of the ductus arteriosus. A part of preeclampsia in the groups of HIS-PDA (n=86) was higher – 73.1%, (in a case of the patent ductus ar-teriosus (n=76) – 65.8%). These results were statistically unverified (p=0.058).
The results show an equal association of fetoplacental insufficiency with the risk of persistence arterial duct and closure of the
arterial duct (p=0.157), the revealed data are not statistically confirmed. The feto-placental insufficiency of the current preg-nancy was registered in 36.4% of all cases born with CHDs (n=162). A higher asso-ciation of the fetoplacental insufficiency with a risk of persistence of PDA (p=0.157) in comparison with closure of PDA are noticed, but not confirmed statistically.
Anemia in pregnancy was most com-mon for the group of HIS-PDA (n=86), in the group of the patent ductus arteriosus (n=76), it composed 56.6% and 50.0% respectively. The revealed data were not statistically confirmed (p=0.402), but they showed possible association of anemia with a risk of persistence of PDA, never-theless a part of anemic turned consid-
erably higher in both groups and were of the same degree (Table 1).
Threatened miscarriage of the current pregnancy in the past history of the neo-nates as a possible predictor of a long-term persistence of the arterial duct was also studied. According to the common data, threatened miscarriage was re-vealed in 38.3% of all the selected groups of the arterial duct. The results of this re-search show that threatened miscarriage most commonly occurred in groups of HIS-PDA (n=86)-45.3% than in groups of PDA (n=76) – 30.3%. The results are not statistically verified (p=0.049) and show the association of the threatened miscar-riage with a risk of persistence of PDA as well as closure of PDA.
The proportion of factors aggravating the course of pregnancy in groups of newborns with HIS-PDA and PDA
Group No factor multiple pregnancy p1 n=86 94.2 5.8 0.1302 n=76 98.7 1.3 0.130
Total n=162 96.3 3.7 0.130
No factor Gestational arterial hypertension with or without proteinuria
1 n=86 66.3 33.7 0.9482 n=76 65.8 34.2 0.948
Total n=162 66.0 34.0 0.948No factor Preeclampsia
1 n=86 20.9 73.1 0.0582 n=76 34.2 65.8 0.058
Total n=162 27.2 72.8 0.058
No factor Fetoplacental insufficiency
1 n=86 68.6 31.4 0.1572 n=76 57.9 42.1 0.157
Total n=162 63.6 36.4 0.157No factor Anemia
1 n=86 50.0 50.0 0.4022 n=76 43.4 56.6 0.402
Total n=162 46.9 53.1 0.402No factor Threatened miscarriage
1 n=86 54.7 45.3 0.0492 n=76 63.7 30.3 0.049
Total n=162 61.7 38.3 0.049No factor Mothers with CHD
1 n=86 93.0 7.0 0.0752 n=76 84.2 15.8 0.075
Total n=162 88.9 11.1 0.075No factor Operative delivery
1 n=86 53.5 46.5 0.8212 n=76 55.3 44.7 0.821
Total n=162 54.3 45.7 0.821
Note. In the Tables 1-2 1st group - there were no signs of the functioning of the ductus arteriosus during re-examination (HIS-PDA); 2nd group - signs of the functioning of the arterial duct (PDA) were revealed.
Table 1

ЯКУТСКИЙ МЕДИЦИНСКИЙ ЖУРНАЛ120
Also the cases of CHD in the mother’s past history of a CHD neonate as a pos-sible predictor of long-term persistence of PDA are also studied. The research data show that mother’s CHD was reg-istered in 11.1% of all selected groups. Statistically unconfirmed data showed association of mother’s CHD in PDA groups (p=0.075). In PDA groups (n=76) this factor far doubled than in groups of HIS-PDA (n=76), it was 15.8% and 7.0% respectively.
The operative delivery of the current pregnancy as a factor of possible long-term persistence of the ductus arteriosus turned to be statistically unsatisfactory, it was common for HIS-PDA group of neo-nates – 46.5% (Table 1).
The ethnicity of the mothers and fa-thers in children with PDA and HIS-PDA was investigated (Table 2).
Among all the cases of reexamina-
tion of the arterial ducts (n=162), it was most common for the Yakut and Russian mothers 71.6% and 16.0% respectively, Evenks - 8.6%, peoples of the Caucasus – 3.1%. Statistically unconfirmed data (p=0.601) of the distribution according to mothers’ ethnicity were received when comparing the groups of arterial ducts. According to the results of the research there were Yakut mothers in both groups almost equally – 72.2% and 71.1% re-spectively. Evens were only in PDA group (n=76), 1.2%. It was most common for Russian 17.1% and Evenks 9.2%
in PDA group rather than in HIS-PDA group (16.1% and 8% respectively). In a group of HIS-PDA 4.7% corresponded to the peoples of Caucasus (1.3% in PDA group).
Among the fathers of the CHD neo-nates it was most common for Yakuts and Russian 73.51% and 17.3% respectively. There were 14.9% for Evenks, 2.5% for peoples of Caucasus and other nations (Ukrainians, Polishes, Germans, Tatars, Buryats, Kumyks and Khakasses) – 0.6% for each group. Statistically unconfirmed results show that the ethnicity of the fa-ther is associated with groups of arterial ducts (p=0.565). The research revealed that PDA group was most common for Yakuts (75%). Russian and Evenks com-monly occurred in the groups of HIS-PDA (n=86) – 18.6% and 5.8%, and in a group PDA (n=76) – 15.8% and 3.9%. Other na-tions (Evens, peoples of the Caucasus,
Ukranians, Polishes, Germans, Tatars, Buryats, Kumyks and Khakasses) were present only in a group of PDA.
Conclusions:1. Multiple pregnancy as a predictor
of long-term persistence of arterial ducts on reexamination, according to current research, occurred statistically unreli-able. Preeclampsia and operative deliv-ery of the current pregnancy as factors of possible association with long-term persistence of PDA turned statistically unreliable, and most commonly occurred in groups of HIS-PDA.
2. The association of a risk of per-sistent PDA and PDA closure with such factors as gestational hypertension with or without proteinuria, pregnancy edema associated with presence or absence of proteinuria, anemia in pregnancy and threatened miscarriage was statistically unconfirmed.
3. The association of fetoplacental insufficiency with risk of persistent PDA was unconfirmed statistically.
4. The association of mother’s CHD in a group of PDA was also unconfirmed statistically.
According to the results of statistical analysis there were revealed most signif-icant risk factors for long-term persistent arterial ducts among the neonate popu-lation of the Republic Sakha (Yakutia). They may be associated with complicat-ed course of pregnancy, i.e. gestational arterial hypertension with or without pro-teinuria, pregnancy edema associated with presence or absence of proteinuria, fetoplacental insufficiency, anemia of the current pregnancy and presence of CHD in the mother’s past history.
The reported study was funded by RFBR according to the research project #18-05- 60035_Arctica.
1. Володин Н.Н. Протокол ведения недоно-шенных детей с гемодинамически значимым функционирующим артериальным протоком. Российский государственный медицинский университет Росздрава. 2009. [Volodin NN. Preterm infants with hemodynamically significant patent ductus arteriosus guidelines. Rossiiskii go-sudarstvennii medicinskii universitet Roszdrava. 2009. (In Russ.).]
2. Гераськин А.В. Детская хирургия. Клини-ческие разборы. ГЭОТАР – Медиа. 2011. [Ger-askin AV. Pediatric surgery. Clinical examinations. Geotar-Media. 2011. (In Russ.).]
3. Детская хирургия: национальное руко-водство. ГЭОТАР – Медиа. 2009. [Pediatric surgery: national guideline. Geotar-Media. 2009. (In Russ.).]
4. Гриффин Б. Кардиология. Практика. 2008; 150-152. [Griffin B. Cardiology. Practica. 2008; 150-152. (In Russ.).]
5. Прахов А.В. Неонатальная кардиология. НГМА. 2008. [Prakhov AV. Neonatal cardiology. NGMA. 2008. (In Russ.).]
6. Руководство по перинатологии. Информ – Навигатор. 2015. [Perinatology guidelines. In-form-Navigator. 2015; 22. (In Russ.).]
7. Шарыкин А.С. Кардиология. Бином, 2009; 50-51. [Sharykin AS. Cardiology. Binom. 2009; 50-51. (In Russ.).]
Ethnicity of Parents of Newborns with HIS-PDA and PDA
Groups of arterial duct Mother ethnicity, %P=1 2 3 4 5 6 7 8
1 n=86 72.1 15.1 0.0 8.1 0.0 4.7 0.0 0.0 0.6012 n=76 71.1 17.1 1.2 9.2 0.0 1.3 0.0 0.0 0.601
Total n=162 71.6 16.0 0.6 8.6 0.0 3.1 0.0 0.0 0.601Father ethnicity. %
P=1 2 3 4 5 6 7 81 n=86 72.1 18.6 0.0 5.8 1.3 0.0 0.0 0.0 0.5852 n=76 75.0 15.8 1.3 3.9 1.3 1.3 0.0 1.3 0.585
Total n=162 73.5 17.3 0.6 4.9 0.6 2.5 0.0 0.6 0.585
Note. 1 – Yakuts, 2 – Russians, 3 – Evens, 4 – Evenks, 5 – other indigenous small-numbered peoples of the North, Siberia and the Far East: Dolgans, Yukaghirs, Chukchis, 6 – peoples of the Caucasus, 7 – peoples of the Central Asia, 8 – others: Ukranians, Polishes, Germans, Tatars, Buryats, Kumyks and Khakasses.
Table 2
References