issn 1936-5349 (print) issn 1936-5357 (online) harvard · 2017-05-01 · issn 1936-5349 (print)...
TRANSCRIPT

ISSN 1936-5349 (print) ISSN 1936-5357 (online)
HARVARD
JOHN M. OLIN CENTER FOR LAW, ECONOMICS, AND BUSINESS FELLOWS’ DISCUSSION PAPER SERIES
THE RISE OF MARKET CONCENTRATION AND RENT SEEKING IN THE FINANCIAL SECTOR
Jeffery Y. Zhang
Discussion Paper No. 72
04/2017
Harvard Law School Cambridge, MA 02138
Contributors to this series are John M. Olin Fellows or Terence M. Considine Fellows in Law and Economics at Harvard University.
This paper can be downloaded without charge from:
The Harvard John M. Olin Fellow’s Discussion Paper Series:
http://www.law.harvard.edu/programs/olin_center

The Rise of Market Concentration and Rent Seeking in the Financial Sector
Jeffery Y. Zhang*
April 25, 2017
Abstract
This article investigates the impact of consolidation within the banking sector on rent seeking. The Riegle-Neal Interstate Banking and Branching Efficiency Act of 1994 removed all remaining geographical barriers to interstate bank expansion in the United States. This resulted in a tidal wave of interstate mega-mergers in the banking industry, which led to greater market power for large banks across the country. The analysis contributes to the scholarship by showing that the increased market concentration skewed the wage distribution of employees in the financial sector, as large banks were able to capture economic rents. Specifically, the increase in income at the higher end of the wage distribution was not justified by a proportional increase in productivity, either through greater economies of scale or higher human capital. Rather, part of the increase is explained by a decline in bank charter values and a rise in risk taking. * Ph.D. Yale University (2017), J.D. Harvard University (2017). The author is an Economist at the Board of Governors of the Federal Reserve System. The author thanks Christine Desan, Howell Jackson, Louis Kaplow, Kenneth Mack, Steven Shavell, and the participants of the Harvard Law and Economics Seminar for helpful discussions. The views expressed in this article are the author’s alone and do not necessarily represent the views of the Federal Reserve or the United States government.

1
Table of Contents
I. INTRODUCTION ........................................................................................................................ 2
II. RECENT HISTORY OF BANKING EXPANSION AND CONCENTRATION ................ 5
III. LITERATURE REVIEW ........................................................................................................ 9
IV. DOCUMENTING AND EXPLAINING THE EMPIRICAL PHENOMENON ............... 12 A. THE SUDDEN JUMP IN BANKER PAY ....................................................................................... 13 B. JUMP IN INCOME DOES NOT EXIST IN OTHER INDUSTRIES ..................................................... 15 C. NO COMMENSURATE PRODUCTIVITY GAINS THROUGH BANK MERGERS .............................. 16 D. NO COMMENSURATE PRODUCTIVITY GAINS THROUGH SECURITIZATION .............................. 18 E. NO COMMENSURATE PRODUCTIVITY INCREASE VIA HUMAN CAPITAL .................................. 20 F. INTERNATIONAL COMPARISONS SUPPORT THE RENT SEEKING THEORY ................................. 22
V. CONCLUSION ......................................................................................................................... 24
APPENDIX A ................................................................................................................................. 27
APPENDIX B ................................................................................................................................. 28
2
I. Introduction
This article explores the impact of consolidation within the banking sector on rent seeking. The Riegle-Neal Interstate Banking and Branching Efficiency Act of 1994 effectively removed any remaining geographical barriers to banking in the United States. This resulted in a tidal wave of mergers and acquisitions in the banking industry,1 and it led to greater market power for large banks across the country.2 This article argues that the increased market concentration skewed the wage distribution of employees in the banking sector, as large banks were able to compensate its employees far above their marginal productivities. That is, the sudden increase in banker income was not due to a commensurate increase in productivity.3
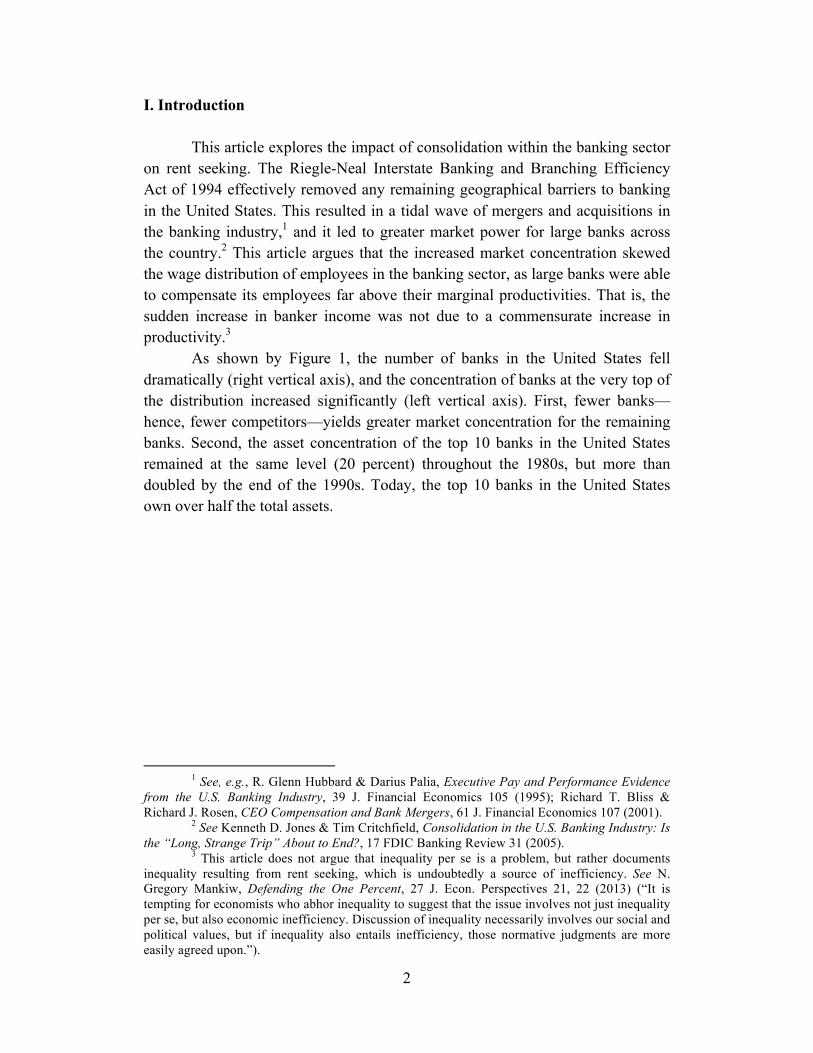
As shown by Figure 1, the number of banks in the United States fell dramatically (right vertical axis), and the concentration of banks at the very top of the distribution increased significantly (left vertical axis). First, fewer banks—hence, fewer competitors—yields greater market concentration for the remaining banks. Second, the asset concentration of the top 10 banks in the United States remained at the same level (20 percent) throughout the 1980s, but more than doubled by the end of the 1990s. Today, the top 10 banks in the United States own over half the total assets.
1 See, e.g., R. Glenn Hubbard & Darius Palia, Executive Pay and Performance Evidence
from the U.S. Banking Industry, 39 J. Financial Economics 105 (1995); Richard T. Bliss & Richard J. Rosen, CEO Compensation and Bank Mergers, 61 J. Financial Economics 107 (2001).
2 See Kenneth D. Jones & Tim Critchfield, Consolidation in the U.S. Banking Industry: Is the “Long, Strange Trip” About to End?, 17 FDIC Banking Review 31 (2005).
3 This article does not argue that inequality per se is a problem, but rather documents inequality resulting from rent seeking, which is undoubtedly a source of inefficiency. See N. Gregory Mankiw, Defending the One Percent, 27 J. Econ. Perspectives 21, 22 (2013) (“It is tempting for economists who abhor inequality to suggest that the issue involves not just inequality per se, but also economic inefficiency. Discussion of inequality necessarily involves our social and political values, but if inequality also entails inefficiency, those normative judgments are more easily agreed upon.”).

3
Figure 1: Number Banks and Asset Concentration
Under standard economic theory, factors of production are paid incomes
that reflect their productivity. Economic rents are the return to a factor of production—for example, labor or capital—in excess of what would be needed to keep it in the market, in excess of their marginal productivity.4 This article argues that, following the Riegle-Neal Act, the income of bankers in the top end of the distribution increased dramatically relative to that of the median banker, but the productivities of those bankers did not experience a commensurate increase. The analysis in section IV shows that the sudden income spike is not due to synergies gained via mergers and acquisitions or financial innovation. Put simply, the banking sector did not increase the size of the economic pie, but rather cut itself a bigger slice of the pie.5
Notably, rent seeking in this context does not correspond to the traditional meaning of monopolists charging their customers astronomical prices, thereby
4 See JOSEPH E. STIGLITZ, THE PRICE OF INEQUALITY 32 (2012) (defining rent seeking as “grabbing a larger share of the wealth that would otherwise have been produced without their effort”); see also Josh Bivens & Lawrence Mishel, The Pay of Corporate Executives and Financial Professional as Evidence of Rents in Top 1 Percent Incomes, 27 J. Econ. Perspectives 57, 62 (2013) (similarly defining rent as income received “in excess of what was needed to induce the person to supply labor and capital”).
5 Colin Gordon, The Problem of Economic “Rent,” Growing Apart: A Political History of American Inequality (accessed on Apr. 26, 2016), available at http://scalar.usc.edu/works/growing-apart-a-political-history-of-american-inequality//sidebar-the-problem-of-economic-rent; this economic rent seeking argument is also made for the financial sector generally: “Increased employment in finance has been accompanied by accelerating rates of compensation in the sector, from about $20,000 per year per employee (including secretaries and clerks) in 1980 to nearly $100,000 today. This is of course exaggerated at the top of the income spectrum.”
0
2,000
4,000
6,000
8,000
10,000
12,000
14,000
16,000
0
5
10
15
20
25
30
35
40
45
50
1980 1983 1986 1989 1992 1995 1998 2001
Asset Concentration
Number of Banks

4
creating a situation where income to a factor of production exceeds its marginal productivity. Rather, rent seeking in this context refers to bankers taking sub-optimally high risks, thereby leading to paydays above their marginal productivity.6
To explain this story, section IV argues that high industry concentrations can materialize in two very different ways. The first concentrated-industry equilibrium results from a substantial amount of government regulation. For example, Canada only has a handful of banks—the “Big Five”—operating in the entire country,7 and those banks have very high charter values thanks to Canadian regulations and the lack of competition.8 U.S. banks were in this equilibrium in the 1970s, when banking was considered a stable and boring job. In fact, banking in the United States used to follow the “3-6-3 rule”: receive deposits at 3 percent interest, lend out at 6 percent interest, and leave for the golf course by 3 pm.9 The second equilibrium is created via deregulation. Cutting significant amount of red tape unleashes competitive forces that lead to stronger firms acquiring their weaker competitors, or firms merging together to fend off competitors. It unfortunately also leads to sub-optimally higher levels of risk taking by the affected firms. This second equilibrium is the one that U.S. financial companies transitioned to in the 1980s and particularly in the 1990s, once the Riegle-Neal Act removed restrictions on banking expansion. Bankers working in the large megabanks magnified their profits as they took greater risks using larger balance sheets.
Section II presents a brief overview of the financial landscape in the 1970s and documents the deregulatory wave that swept across the United States. Section III reviews the literature and describes the contribution of this article to the scholarship. In particular, this article confirms the empirical finding that pay in the financial sector increased disproportionately in the 1990s; however, this article disagrees that the sudden income increase was caused by higher productivity. Section IV presents the substantive analysis supporting these claims. The data show that the income spike is not fully explained by synergies gained via mergers and acquisitions, or by financial innovations like securitization, or by an
6 The easy and straightforward way to see why the behavior was sub-optimally risky is to see that such behavior led to the financial crisis in 2008.
7 See Bernard Simon, Canadian Lenders Not Immune (Nov. 30, 2008), The Financial Times, available at https://www.ft.com/content/78f66854-bf08-11dd-ae63-0000779fd18c.
8 Cf. Paul Krugman, Good and Boring (Jan. 31, 2010), The New York Times, available at http://www.nytimes.com/2010/02/01/opinion/01krugman.html (“Above all, Canada’s experience seems to support those who say that the way to keep banking safe is to keep it boring — that is, to limit the extent to which banks can take on risk. The United States used to have a boring banking system, but Reagan-era deregulation made things dangerously interesting. Canada, by contrast, has maintained a happy tedium.”).
9 See John R. Walter, The 3-6-3 Rule: An Urban Myth?, 92 Federal Reserve Bank of Richmond Economic Quarterly 51 (2006).

5
inflow of higher human capital. Section V concludes by connecting these findings to the existing literature on income inequality.
II. Recent History of Banking Expansion and Concentration In the 1970s, no states permitted banks to expand across state lines, and
many states even prohibited branching within state lines.10 Within a decade, however, state legislatures began the process of removing within-state and across-state restriction on bank expansion. For instance, the interstate blockade empowered by the Douglas Amendment eventually showed signs of weakening. In 1978, Maine became the first state to open up its borders to other states in a quid pro quo fashion.11 Alaska and New York followed in 1982, and then there was an avalanche.12 The aftermath of this deregulatory episode was an unprecedented wave of mergers and acquisitions and the consolidation of the banking industry,13 which “proceeded at breakneck pace” after the Riegle-Neal Act in 1994.14
Though fewer in number, interstate mergers involved greater assets. Figure 2 plots the amount involved in mergers from 1980 through 2003. The amount of assets involved in mergers in the late 1980s increases significantly. Moreover, of the 248 large mergers between 1980 and 1998—defined as mergers in which the acquiring bank and target bank have more than $1 billion in assets—nearly 68 percent of those mergers were interstate mergers.15
10 Philip E. Strahan, The Real Effects of U.S. Banking Deregulation, Working Paper
(Nov. 2002), available at https://research.stlouisfed.org/conferences/policyconf/papers/Strahan.pdf.
11 Id. 12 Id. 13 See Markham, supra note 15, at 256 (“A new form of bank was emerging in the early
1990s. These were super-regional banks.”). 14 Hoffmann, supra note 16, at 2. While the Riegle-Neal Act did not fully take effect until
1997, the “merger and acquisition frenzy among banks rushing to get big—and therefore more competitive in the global market, according to one rationale for the move—immediately followed its passage.” Id. at 233.
15 See Stephen A. Rhoades, Bank Mergers and Industrywide Structure, 1980-94, Federal Reserve Staff Report 169, at 8 (1996).

6
Figure 2: Aggregate Assets in Mergers
Between 1980 and 1995, the number of banks fell from over 14,000 to
10,000.16 Figure 3 below shows this unmistakable trend. Indeed, “[i]n every year but one, mergers and acquisitions were the single largest contributor to the net decline in banking organizations.”17 Over the course of these two decades, a handful of very large financial institutions arose to control a growing concentration of banking industry assets.18 As feared by the rural anti-deregulatory lobby many decades ago, almost all the decline in the number of banks came in the community bank sector.19 The large banks swallowed the smaller banks, and it occurred throughout the country.20
16 Id. at 255. 17 Kenneth D. Jones & Tim Critchfield, Consolidation in the U.S. Banking Industry: Is
the “Long, Strange Trip” About to End?, 17 FDIC Banking Review 31, 33 (2005). 18 Id. at 32. 19 Id. at 33. 20 See id. (noting that the decline of community banks occurred proportionally across
“rural markets, small metropolitan markets, and suburban and urban parts of large metropolitan markets”).
0
100
200
300
400
500
600
700
800
1980 1982 1984 1986 1988 1990 1992 1994 1996 1998 2000 2002

7
Figure 3: Number of Commercial Banks in the United States
If one defines a large bank as having more than $10 billion in assets (in
real terms), then the share of banking assets controlled by large banks increased from 42 percent in 1984 to 73 percent in 2003.21 In a 20 year window, this share increased by 31 percentage points. Unsurprisingly, the story is reversed for small community banks, that is, for those with under $1 billion in assets (in real terms). In 1984, community banks controlled 28 percent of assets in the banking sector; in 2003, the share was halved to 14 percent.22 If one slices the data more finely, one sees that banks with under $100 million in assets (in real terms) experienced an even more disproportionate fate. These banks controlled 8 percent of industry assets in 1984; twenty years later, they held only 2 percent.23 FDIC data indicate the same story holds when analyzing deposits (instead of assets). For example, Bank of America by itself held nearly 10 percent of total deposits in the industry at year-end 2003.24
21 Id. at 35. 22 Id. 23 Id. 24 Id.

8
Figure 4: Comparison of Asset Concentrations
There were several reasons for banks to pursue the path of expanding via
mergers and acquisitions after geographic restrictions were removed. From a macroeconomic perspective, banks were profitable in the 1990s, had large cash holdings, and enjoyed a favorable interest-rate environment.25 A record-breaking stock market boosted the valuation of banks to unprecedented levels, thereby encouraging banks to use their stocks to acquire other banks. This factor played a significant role in cases where bank managers believed their own stocks were priced above fair market value.26 Bank executives could maximize their firms’ value by selling to an acquirer at record market-to-book valuations. In addition, technological progress in financial engineering resulted in new services—derivatives contracts, ATMs, online banking—that could be exploited through economies of scale.27
The microeconomic reasons for mergers and acquisitions were even more influential. By microeconomic reasons, the literature means “management’s chosen strategy for maximizing or preserving firm value in the face of increased competitive pressure.”28 For instance, a manager could think that increasing the size of his or her bank would achieve economies of scale and scope, which would result in higher revenues. The manger could also believe that acquiring other banks would increase geographic diversification, thereby reducing the downside
25 Id. at 38; see also Allen N. Berger, Rebecca S. Demsetz & Philip E. Strahan, The Consolidation of the Financial Services Industry: Causes, Consequences, and Implications for the Futures, 23 J. BANK. & FIN. 135, 149 (1999).
26 Jones & Critchfield, supra note 48, at 38. 27 Berger et al., supra note 56, at 148. 28 Jones & Critchfield, supra note 48, at 40.
42
30
6
14
8
73
13
4
8
2
0
10
20
30
40
50
60
70
80
> $10 B $1 to $10 B $500 M to $1 B $100 M to $500 M < $100 M
1984
2003

9
risk of insolvency. These are the long-run economic reasons in support of mergers and acquisitions, and were likely the main motivating factors behind the wave of mergers post-deregulation. However, researchers have also suggested more cynical, self-serving factors29: fighting off competitors for the sake of entrenchment,30 hubris,31 increasing managerial compensation,32 or enjoying an implicit government subsidy by becoming “too-big-to-fail.”33
III. Literature Review
The literature has documented the dramatic rise in income—and income inequality—in the financial sector. But the literature attributes the phenomenon to increased productivity through greater economies of scale or higher human capital. In other words, the literature believes that higher incomes were mostly justified by higher productivity. This article argues that there was no commensurate rise in productivity from the creation of megabanks that could satisfactorily explain the rapid transformation of the income distribution in the banking sector.
This article is related to three lines of scholarship. First, and most directly, this article follows up on two papers investigating financial deregulation and changes in income inequality. First, Thorsten Beck et al. (2010) use state-level
29 See generally DeYoung et al., supra note 3, at 95-96 (summarizing the literature’s
finding on non-profit maximization motives behind mergers and acquisitions); Berger et al., supra note 56, at 146-48 (similarly discussing the non-value maximizing motivates behind mergers and acquisitions).
30 See Allen N. Berger, The Efficiency Effects of Bank Mergers and Acquisitions: A Preliminary Look at the 1990s Data, Bank Mergers and Acquisitions 79, 106 (1998) (“Merger participants in the 1990s appear to be more focused on cutting costs quickly through mergers—for example, they often announce goals for employee layoffs, branch closings, and total cost savings in advance of mergers.”).
31 See Richard Roll, The Hubris Hypothesis of Corporate Takeovers, 59 J. BUS. 197, 197 (1986) (“The empirical evidence in mergers and tender offers is reconsidered in the hubris context. It is argued that the evidence supports the hubris hypothesis as much as it supports other explanations such as taxes, synergy, and inefficient target management.”).
32 See Richard T. Bliss & Richard J. Rosen, CEO Compensation and Bank Mergers, 61 J. Financial Economics 107, 130 (2001) (“Acquiring a bank results in an increase in CEO compensation.”); see also Berger et al., supra note 56, at 136 (“In our framework, the main motivation behind consolidation is to maximize shareholder value, although we also consider the motives of other stakeholders, particularly managers and governments. Value may be maximized through [mergers and acquisitions] primarily by increasing the participating firms’ market power in setting prices or by improving their efficiency, and in some cases by increasing their access to the safety net.”).
33 See María Fabiana Penas & Haluk Unal, Gains in Bank Mergers: Evidence from the Bond Markets, 74 J. FIN. ECON. 149, 150 (2004) (“[T]he federal deposit insurer might consider the combined bank too big to fail (TBTF) as a result of the merger. This strategy allows all uninsured liabilities to have de facto insurance coverage and thereby maximizes the value of the implicit guarantees received from the government.”).
10
panel regressions to conclude that the deregulation of intrastate restrictions reduced inequality, as measured by the state-level Gini coefficient.34 In particular, the authors find that inequality fell via a tightening of the bottom half of the distribution. Indeed, deregulation appears to have increased the relative wages of unskilled workers. Second, Philippon and Reshef (2012) investigate wages and education in the financial sector from 1909 to 2006 and find that deregulation in the 1980s explains the sudden increase of finance wages.35 Their story is that regulation inhibited the creativity of employees in the financial sector. Once those regulations were removed, drastically in the 1980s and 1990s, human capital flowed in and productivity increased.
This article also speaks to a second line of scholarship addressing deregulation and the mitigation of rent seeking. Empirical analysis on deregulation in the airline and trucking industries supports the thesis that monopolistic firms and workers might share in economic rents.36 First, Rose (1987) analyzes rent sharing in the trucking industry, and concludes that following deregulation—one that actually increased the number of competitors, that is, made the industry less concentrated—the wage premium of union workers to non-union workers fell from 50 percent to less than 30 percent.37 Rose notes that the regulatory regime previously in place gave rise to firms with significant market power, and those firms were able to profit handsomely (economic rent seeking).38 This supports the idea that rent sharing existed in an environment with fewer competitors and was subsequently reduced when the firms had more competitors and less market power. Similarly, Card (1996) shows that more competitors and less market concentration caused declines in the wages of workers in the airline industry from 1980 to 1990.39 The era of increased competition in the airline industry was ushered in by the Airline Deregulation Act of 1978. Over the span of just a few years, the number of U.S. airlines tripled.40 Along with that surge in the number of competitors, airline workers’ relative
34 See Thorsten Beck, Ross Levine & Alexey Levkov, Big Bad Banks? The Winners and
Losers from Bank Deregulation in the United States, 65 J. FIN. 1637 (2010). 35 See Thomas Philippon & Ariell Reshef, Wages and Human Capital in the U.S. Finance
Industry: 1909-2006, 127 Q. J. ECON. 1551 (2012). 36 Furman & Orszag, supra note 146. 37 Nancy L. Rose, Labor Rent Sharing and Regulation: Evidence from the Trucking
Industry, 95 J. Political Economy 1146 (1987). 38 See id. at 1148-49 (“From 1935 through the mid- 1970s, ICC regulation of the trucking
industry included stringent entry controls, restrictions on partially regulated and exempt carriers, and collective rate making. This system raised trucking rates above competitive levels, ensuring high economic profits for regulated trucking firms. . . . The transformation of regulation in the late 1970s led to substantial entry of new firms, expansion of existing firms, and enhanced price competition.”).
39 David Card, Deregulation and Labor Earnings in the Airline Industry, NBER Working Paper 5687 (1996).
40 Id. at 1.

11
earnings fell 10 percent. The declines were felt across the board in the industry, including pilots, secretaries, and managers.41 Thus, Card’s analysis shows that before deregulation, the airline industry was in the business of rent seeking and sharing those rents with their employees.
Finally, the analysis in this article is informed by a third line of research, one that focuses on the connection between deregulation and banker pay. For example, Bliss and Rosen (2001) conduct an empirical investigation of the link between bank mergers and CEO compensation during the period 1986 to 1995. The authors argue that mergers are associated with an increase in executive compensation packages. They also point out that “growth through any means adds similar amounts to compensation, that is, any growth is good for CEO compensation.”42 Thus, acquiring other firms is a sure and fast way to increase managerial compensation. Interestingly, when the authors investigate the converse—does compensation affect the decision of the CEO to acquire?—they discover that managers are motivated by the form of their compensation package. If they are rewarded more in cash than in performance stocks, they will seek to grow their company quickly and acquire more outside firms. However, if their compensation is more in stock than in cash—if more of the pay is conditioned on actual performance—then they are less likely to acquire other banks.43 The latter is consistent with a self-serving rationale underlying mergers and acquisitions activity.
Recall that the geographic deregulation in the 1980s and 1990s resulted in a wave of mergers and acquisitions in the banking industry. While this deregulation certainly increased competition, in the sense that more banks could compete to service the same geographic area, it eventually led to large banks swallowing up community banks across the country and the creation of megabanks such as Bank of America and Citi. This process of mergers and acquisitions therefore led to greater market concentration, as seen in Figure 1 above. The subsequent analysis argues that this process furnished the condition for a sudden jump in compensation that was not justified by a commensurate increase in productivity.
41 Id. at 2-3. 42 Bliss & Rosen, supra note 142, at 135. 43 Id. at 135-36.
12
IV. Documenting and Explaining the Empirical Phenomenon
This section first confirms the empirical phenomenon—the sudden jump in top banker pay in the mid-1990s. The analysis looks at microdata to measure the distribution of income in the banking sector of each state. The source of the microdata is the Current Population Survey (CPS), which is sponsored jointly by the U.S. Census Bureau and the U.S. Bureau of Labor Statistics. It is the primary source of labor force statistics for the population of the United States.44 The CPS contains data on individuals, and the data are available at a monthly frequency going back to January 1976, with annual data going back to 1962. For the purposes of this project, the analysis utilizes data on an individual’s employment status, his or her industry of employment, and his or her income.
The time period used for this analysis is a year, and the annual earnings data come from the “Banking and Credit Agencies” and “Security and Commodity Brokerage and Investment Companies” categories within FIRE (Finance, Insurance, and Real Estate). Insurance and real estate are excluded. Only full-time workers are included. Notably, the CPS dataset captures a variety of workers in the banking sector: secretaries, entry-level analysts, mid-level associates, etc. It does not capture only the dynamics of top-end management. The lack of income data at the very top end of the income distribution is not a problem for the present analysis for two reasons. First, the literature already shows that CEO compensation increased dramatically after deregulation. That is not in dispute. Second, and more importantly, the objective is to analyze the increase in pay for an entire segment of the distribution, not just individual CEOs. The analysis focuses specifically on comparisons to the median and performs robustness checks using numerous percentile slices at the top, not just those potentially capped by top coding.
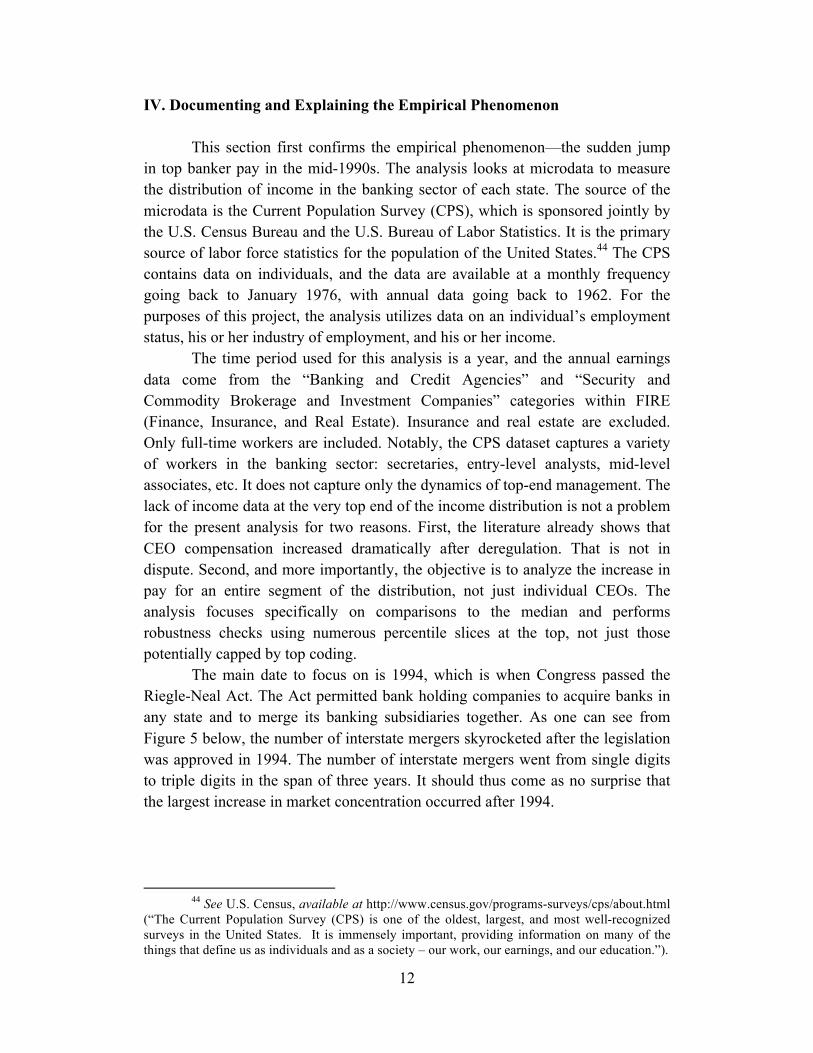
The main date to focus on is 1994, which is when Congress passed the Riegle-Neal Act. The Act permitted bank holding companies to acquire banks in any state and to merge its banking subsidiaries together. As one can see from Figure 5 below, the number of interstate mergers skyrocketed after the legislation was approved in 1994. The number of interstate mergers went from single digits to triple digits in the span of three years. It should thus come as no surprise that the largest increase in market concentration occurred after 1994.
44 See U.S. Census, available at http://www.census.gov/programs-surveys/cps/about.html
(“The Current Population Survey (CPS) is one of the oldest, largest, and most well-recognized surveys in the United States. It is immensely important, providing information on many of the things that define us as individuals and as a society – our work, our earnings, and our education.”).

13
Figure 5: Number of Interstate Mergers
A. The Sudden Jump in Banker Pay
Figure 6 below motivates the analysis. It overlays a few series on top of the interstate deregulation graph in Figure 5. The right axis of the graph shows the number of interstate mergers that occurred in the time period. The new addition is the left axis, which shows the ratio of total income earned at the 99th percentile (of a state’s banking sector) to that of the median. First, note that this ratio is not affected by inflation because it constructed with two nominal income series. Put another way, inflation is divided out. Second, changes in this ratio show the evolution of the income distribution of bankers in a state over time. Third, given the small state sample sizes, the 99th percentile is typically the highest earner in a state’s sample; however, as the analysis later shows, the results are qualitatively identical when using the 90th or 75th percentiles. Finally, it should be noted that this jump in pay in the mid-1990s is not overly controversial. This result is easily reproducible using CPS data, and an aggregate version of this time series is presented by Philippon and Reshef (2012).45
45 See Thomas Philippon & Ariell Reshef, Wages and Human Capital in the U.S. Finance
Industry: 1909-2006, 127 Q. J. Econ. 1551 (2012).

14
Figure 6: Deregulation and the P99/P50 Income Ratio
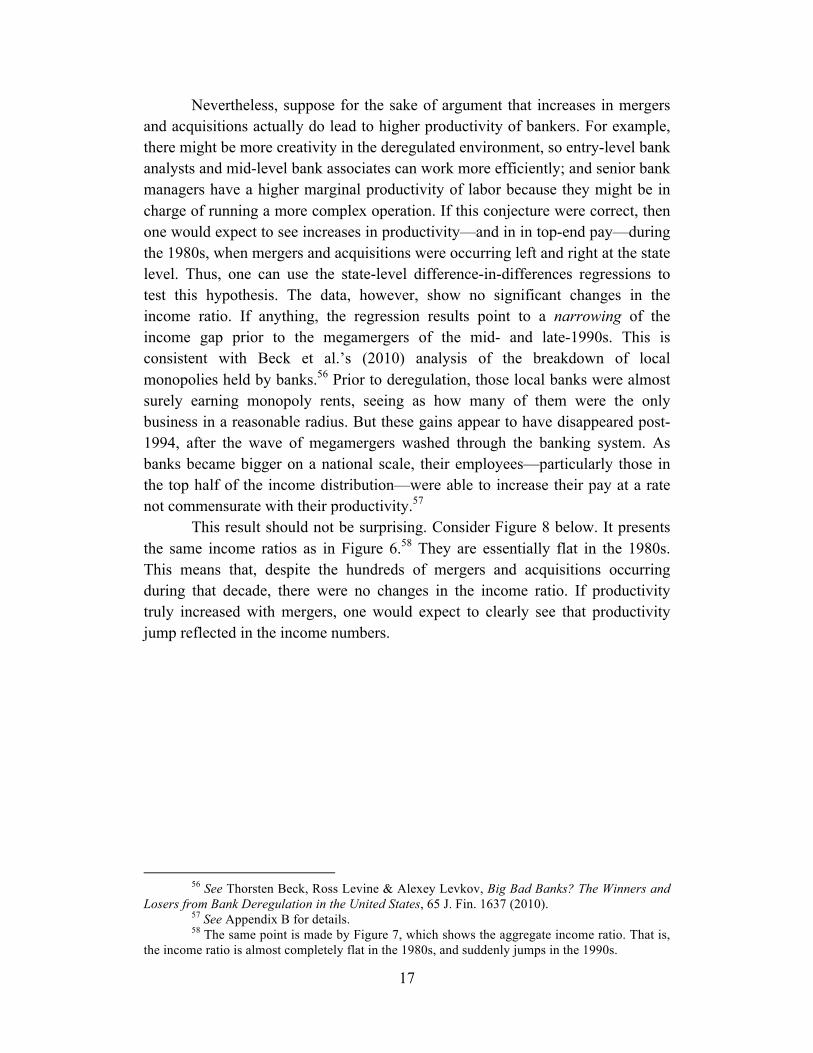
The different ratios—the red, blue, orange, and green lines—illustrate the
evolution of the income distribution in states with different levels of banking mergers and acquisitions. The measure for intensity of banking mergers and acquisitions is constructed by looking at how active the banks were in such activities from 1980 to 1994. The top five most active states—California, Florida, Illinois, New York, and Texas—each acquired more than $50 billion worth of bank assets in the years leading up to Riegle-Neal.46 The banks in the next 16 states47 acquired assets of between $20 billion and $50 billion in the same time period. The banks in the 16 states48 after those acquired between $6 billion and $20 billion in other banks’ assets. Finally, the banks in the bottom 14 states49 acquired under $6 billion in assets from 1980 to 1994. The main reason for these numerical cutoffs is to more easily demonstrate the effect of mergers and acquisitions on the income distribution. It would be incredibly difficult to visually inspect a chart with 51 lines in it, one for every state plus the District of Columbia. (This is where statistical regressions come into play.) Grouping the states in this fashion—by intensity of merger and acquisition activity in the
46 See Stephen A. Rhoades, Bank Mergers and Industrywide Structure, 1980-94, Federal Reserve Staff Report 169 (1996).
47 The states are: Arizona, Colorado, Connecticut, Georgia, Indiana, Kentucky, Maryland, Massachusetts, Michigan, New Jersey, Ohio, Pennsylvania, Tennessee, Virginia, Washington, and Wisconsin.
48 The states are: Delaware, District of Columbia, Iowa, Kansas, Louisiana, Maine, Minnesota, Mississippi, Missouri, Nebraska, Nevada, New Mexico, North Carolina, Oklahoma, South Carolina, and West Virginia.
49 The states are: Alabama, Alaska, Arkansas, Hawaii, Idaho, Montana, New Hampshire, North Dakota, Oregon, Rhode Island, South Dakota, Utah, Vermont, and Wyoming.
15
banking industry—drives home the main point: states with more active banks in the mergers market experienced the greatest change in the income distribution of its banking sector. The result is monotonic, which means that the states with more merger activity pre-1994 experienced greater changes in its income distribution than the states with less merger activity pre-1994. This observation is not caused by one or two CEOs making more money after merging with another bank. The compensation increase flows down the chain. This is further supported by the fact that the results are qualitatively identical if one analyzes the P90/P50 series or the P75/P50 series.
This result is all the more striking because the increase occurred within the span of a few short years post-1994. Notice that the trends in the red, blue, orange, and green lines were essentially identical from 1980 through 1994. They were flat. The interpretation is that the overall income distribution in the banking sector did not change much in the years before Riegle-Neal. The bank employees may have earned more or less on an absolute scale, but not relative to each other. This was the case in states with more aggressive banks and in states with less aggressive banks. To be sure, CEOs were compensated handsomely during that period,50 but this added compensation did not flow out of the C-Suite. After Riegle-Neal, the top banks employees, particularly those at larger banks, experienced a significant increase in compensation.51
B. Jump in Income Does Not Exist in Other Industries A valid question is whether all, or numerous, industries experienced a
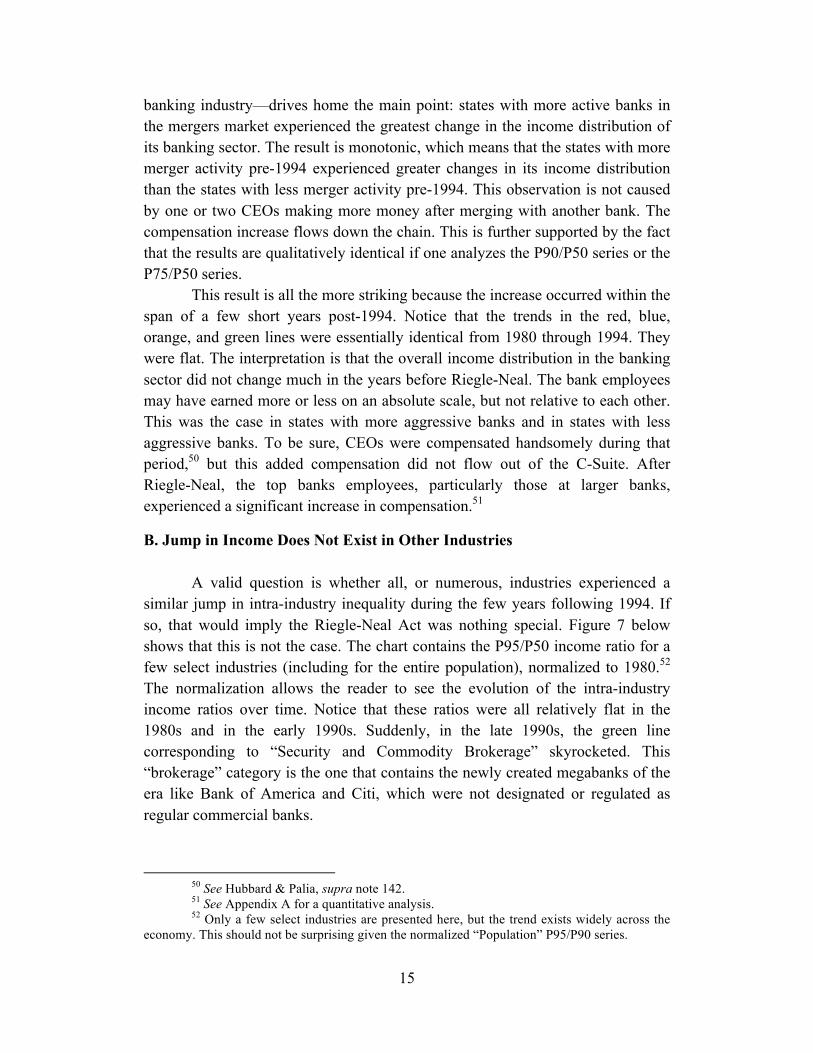
similar jump in intra-industry inequality during the few years following 1994. If so, that would imply the Riegle-Neal Act was nothing special. Figure 7 below shows that this is not the case. The chart contains the P95/P50 income ratio for a few select industries (including for the entire population), normalized to 1980.52 The normalization allows the reader to see the evolution of the intra-industry income ratios over time. Notice that these ratios were all relatively flat in the 1980s and in the early 1990s. Suddenly, in the late 1990s, the green line corresponding to “Security and Commodity Brokerage” skyrocketed. This “brokerage” category is the one that contains the newly created megabanks of the era like Bank of America and Citi, which were not designated or regulated as regular commercial banks.
50 See Hubbard & Palia, supra note 142. 51 See Appendix A for a quantitative analysis. 52 Only a few select industries are presented here, but the trend exists widely across the
economy. This should not be surprising given the normalized “Population” P95/P90 series.

16
Figure 7: P95/P50 Income Ratio, Normalized to 198053
C. No Commensurate Productivity Gains Through Bank Mergers Given the robustness of the empirical phenomenon, the analysis now pivots to asking why it came about. Recall that the definition of rent seeking is obtaining profits in excess of what is required to keep the factor of production in the market. This begs the question: Did productivity increase proportionally to make these factors of production more costly to hire? Indeed, note that “financial gains generated by [mergers and acquisitions] emanate from one of two sources: improvements in operational efficiency or increases in market power.”54 Therefore, an important counterargument to the above claim is that mergers and acquisitions increased the operating efficiency of the banking sector. Looking at Figure 6, one could reasonably think that employees at larger banks received larger pay increases because their employers benefited from mergers. This could be a valid counterpoint to the rent seeking hypothesis.
First, the academic literature does not support this position. Using data from the mid-1980s through the mid-1990s, academic studies “provide no consistent evidence regarding whether, on average, the participating financial firms benefit from [mergers and acquisitions].”55
53 This figure uses P95 to avoid concerns regarding top coding. Similar results hold for
P90. 54 Robert DeYoung, Douglas D. Evanoff & Philip Molyneux, Mergers and Acquisitions
of Financial Institutions: A Review of the Post-2000 Literature, 36 J. Financial Services Research 87, 89 (2009).
55 Id. at 88, 90.
0.0
0.5
1.0
1.5
2.0
2.5
1980 1984 1988 1992 1996 2000 2004
Nor
mal
ied
Inco
me
Rat
io
Survey Year
Population
Banking
Brokerage
Construction
Engineering
Medical
17
Nevertheless, suppose for the sake of argument that increases in mergers and acquisitions actually do lead to higher productivity of bankers. For example, there might be more creativity in the deregulated environment, so entry-level bank analysts and mid-level bank associates can work more efficiently; and senior bank managers have a higher marginal productivity of labor because they might be in charge of running a more complex operation. If this conjecture were correct, then one would expect to see increases in productivity—and in in top-end pay—during the 1980s, when mergers and acquisitions were occurring left and right at the state level. Thus, one can use the state-level difference-in-differences regressions to test this hypothesis. The data, however, show no significant changes in the income ratio. If anything, the regression results point to a narrowing of the income gap prior to the megamergers of the mid- and late-1990s. This is consistent with Beck et al.’s (2010) analysis of the breakdown of local monopolies held by banks.56 Prior to deregulation, those local banks were almost surely earning monopoly rents, seeing as how many of them were the only business in a reasonable radius. But these gains appear to have disappeared post-1994, after the wave of megamergers washed through the banking system. As banks became bigger on a national scale, their employees—particularly those in the top half of the income distribution—were able to increase their pay at a rate not commensurate with their productivity.57
This result should not be surprising. Consider Figure 8 below. It presents the same income ratios as in Figure 6.58 They are essentially flat in the 1980s. This means that, despite the hundreds of mergers and acquisitions occurring during that decade, there were no changes in the income ratio. If productivity truly increased with mergers, one would expect to clearly see that productivity jump reflected in the income numbers.
56 See Thorsten Beck, Ross Levine & Alexey Levkov, Big Bad Banks? The Winners and
Losers from Bank Deregulation in the United States, 65 J. Fin. 1637 (2010). 57 See Appendix B for details. 58 The same point is made by Figure 7, which shows the aggregate income ratio. That is,
the income ratio is almost completely flat in the 1980s, and suddenly jumps in the 1990s.
18
Figure 8: Income Ratio Unchanged in the 1980s
D. No Commensurate Productivity Gains Through Securitization Besides looking at the productivity gains (or lack thereof) through
mergers, some may point to the invention of securitization and similar financial instruments as proof of increased productivity in the banking sector. While those certainly evince creativity, one should bear in mind that those financial instruments were already around and in use during the 1980s. Yet the use of securitization did not yield a multiple fold increase in productivity during that era. The spike in the income ratio occurred in the mid- to late-1990s.
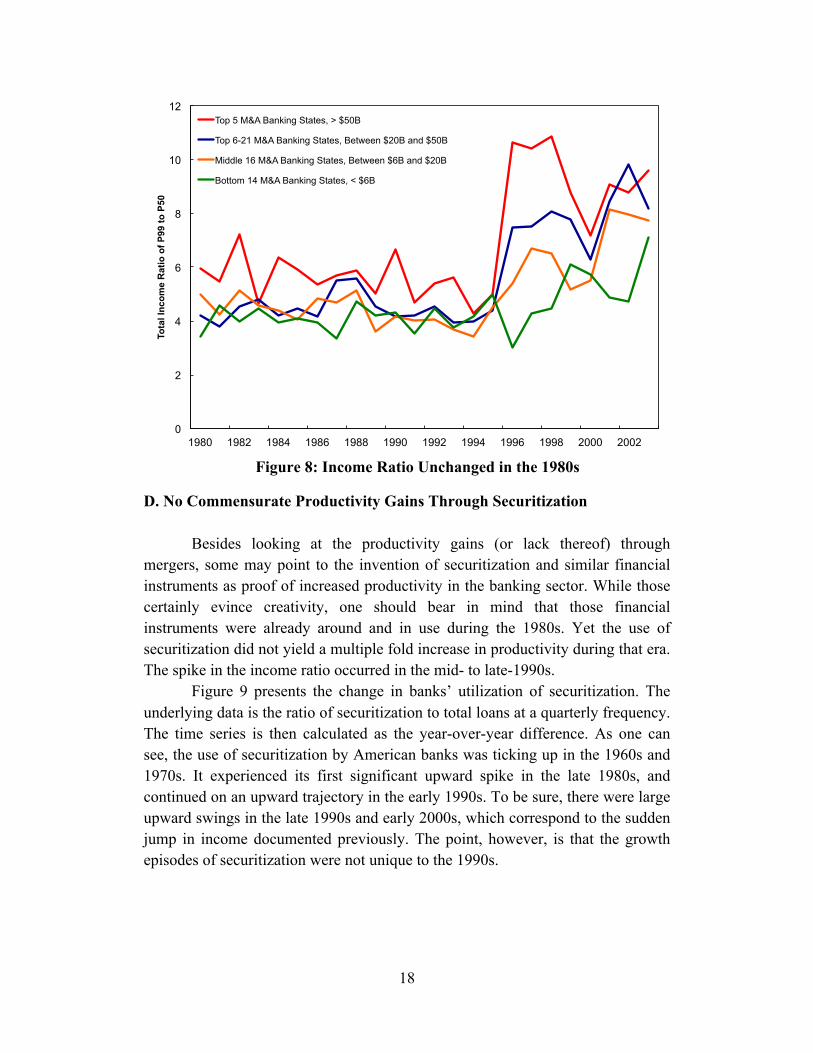
Figure 9 presents the change in banks’ utilization of securitization. The underlying data is the ratio of securitization to total loans at a quarterly frequency. The time series is then calculated as the year-over-year difference. As one can see, the use of securitization by American banks was ticking up in the 1960s and 1970s. It experienced its first significant upward spike in the late 1980s, and continued on an upward trajectory in the early 1990s. To be sure, there were large upward swings in the late 1990s and early 2000s, which correspond to the sudden jump in income documented previously. The point, however, is that the growth episodes of securitization were not unique to the 1990s.
0
2
4
6
8
10
12
1980 1982 1984 1986 1988 1990 1992 1994 1996 1998 2000 2002
Tota
l Inc
ome
Rat
io o
f P99
to P
50
Top 5 M&A Banking States, > $50B
Top 6-21 M&A Banking States, Between $20B and $50B
Middle 16 M&A Banking States, Between $6B and $20B
Bottom 14 M&A Banking States, < $6B
19
Figure 9: Annual Growth in Use of Securitization
Given the time series in Figure 9, it is difficult for one to believe that these
financial instruments suddenly increased efficiency by several multiples in the few short years after the Riegle-Neal Act was passed. Again, keep in mind that this article does not argue there was no increase in productivity whatsoever. It does point out that the sudden, large widening of the bankers’ income distribution cannot be explained by productivity increases alone. The increased concentration following the wave of megamergers in the 1990s must have led to a nontrivial degree of rent seeking.
To see this securitization argument from another perspective, consider the banking productivity series constructed by the Bureau of Labor Statistics (BLS). Royster (2012) creates a new measure of banking productivity specifically designed to capture “the changes that have occurred in the industry, including deregulation, advances in technology, and the development of new banking services.”59 The productivity measure weights different aspects of bank services like loans, deposits, trusts, investment banking, insurance, and securitization.60 Thus, it adjusts for the fact that banking has evolved significantly since the 1980s, when deposits made up a larger share of banks’ revenues and when investment banking and securitization were not as prevalent. The revised method yields a
59 See Sara E. Royster, Improved Measures of Commercial Banking Output and
Productivity, Monthly Labor Review (July 2012). 60 See id. at 6.
-6
-4
-2
0
2
4
6
1952 1958 1964 1970 1976 1982 1988 1994 2000 2006 2012

20
productivity series that is noticeably higher than the one where such changes were not accounted for.61 Yet, per Figure 10 below, the Royster (2012) productivity series shows only a gradual increase in banking output and productivity. Again, the revised productivity series explicitly accounts for the improvement in financial technology over the past two decades and still finds nothing that mirrors the sudden increase in income disparity. Notably, the growth series in Figure 10 follows the same trend as the growth series of securitization in Figure 9 over the sample period. This is not surprising since non-traditional sources of banking like securitization receive much greater weight in the productivity series.
Figure 10: Growth of Productivity in Banking Sector
E. No Commensurate Productivity Increase Via Human Capital
There is no doubt that human capital of American workers increased during the 1970s, 1980s, and 1990s. More educated people entered the workforce, and they have been earning more than their less educated peers. One can see this from Figure 11 below, which is a combination of the widely cited Figures 1 and 2 in Acemoglu and Autor (2011).62 The rising blue line in Figure 11 corresponds to the wage premium that workers with a bachelor’s degree enjoy over those with a high school degree. The rising red line corresponds to the supply of workers with a bachelor’s degree relative to workers with a high school degree. The common story behind this figure is that structural changes in the economy have favored a
61 See id. at 9. 62 Daron Acemoglu & David Autor, Skills, Tasks and Technologies: Implications for
Employment and Earnings, 4b Handbook of Labor Economics 1043 (2011).
-0.04
-0.02
0.00
0.02
0.04
0.06
0.08
0.10
0.12
1988 1991 1994 1997 2000 2003 2006 2009 2012 2015

21
more skilled workforce, and the disparity between the skilled and non-skilled workers have risen dramatically in the past few decades. This, however, does not fully explain the sudden jump in financial sector pay in the 1990s.
Figure 11: College to High-School Weekly Wage Ratio63
An important lesson to draw from Figure 11 is that U.S. firms, including
the top financial institutions, did not suddenly start recruiting qualified students from elite universities in 1994, on the eve of the big pay jump. This very robust aggregate trend of hiring well-educated workers had existed for decades. Thus, it is unlikely that firms suddenly shipped in a talented cohort of Ivy League graduates in 1994 and experienced a productivity revolution.
It could, however, very well be the case that the human capital in the financial industry was being held back in the 1970s and 1980s due to regulatory
63 From Acemoglu and Autor (2011), the source is “March CPS data for earnings years
1963-2008. Log weekly wages for full-time, full-year workers are regressed separately by sex in each year on four education dummies (high school dropout, some college, college graduate, greater than college), a quartic in experience, interactions of the education dummies and experience quartic, two race categories (black, non-white other), and a full set of interactions between education, experience, and sex. The composition-adjusted mean log wage is the predicted log wage evaluated for whites at the relevant experience level (5, 15, 25, 35, 45 years) and relevant education level (high school dropout, high school graduate, some college, college graduate, greater than college). The mean log wage for college and high school is the weighted average of the relevant composition adjusted cells using a fixed set of weights equal to the average employment share of each sex by potential experience group.”
0.0
0.2
0.4
0.6
0.8
1.0
1.2
1.4
1.6
1.4
1.5
1.6
1.7
1.8
1.9
2.0
1963 1967 1971 1975 1979 1983 1987 1991 1995 1999 2003 2007
Rel
ativ
e Su
pply
Rel
ativ
e W
age
Relative Wage
Relative Supply

22
red tape. When the last bit of regulation was erased in 1994, the untapped potential of human capital was suddenly put to better use—top workers became more creative and could also scale up their creative inventions. Once again, the counterargument is timing. Creative inventions that contributed to productivity—like securitization—were already in use prior to 1994, as described in the previous sub-section. Moreover, regulations were already being weakened or eliminated in the late 1970s and certainly throughout the 1980s. If educated workers were already in the banking sector, one would expect to see significant increases after deregulatory episodes during the 1980s. Yet those did not materialize.
F. International Comparisons Support the Rent Seeking Theory Synergies from mergers do not justify the sudden jump in income; financial innovations like securitization do not justify it; higher human capital also does not do the trick. This is not surprising. Large banks in Canada, Japan, and Western Europe should benefit from economies of scale; they have access to advanced financial tools like securitization; they have access to world-class universities and smart math students. Bankers in those countries, however, do not earn the same as U.S. bankers. While there is no doubt that economies of scale, securitization, and human capital increase productivity, the point is that they did not do so overnight in the 1990s.
What happened in the 1990s if bankers did not suddenly become more productive? Two facts are known for sure—banks suddenly became larger following the Riegle-Neal Act of 1994, and they became larger through deregulation, not regulation. On the first point, large bank size and industry consolidation can materialize in two opposite ways. The first channel is through a substantial amount of government regulation. For instance, Canada only has a handful of banks dominating the country’s market share due to relatively restrictive government involvement.64 The second channel is via deregulation. Cutting a significant amount of red tape promotes competition that leads to stronger firms acquiring their weaker competitors, or to firms merging with each other to fend off competitors. It also leads to sub-optimally higher levels of risk taking by the affected firms. This second channel is the one that U.S. financial companies transitioned through in the 1990s, once the Riegle-Neal Act removed remaining interstate restrictions on bank expansion.
The larger size of their post-deregulatory, post-merger balance sheets allowed megabanks to take more risk; and, given the macroeconomic conditions of the era, they made a killing. The takeaway is that greater institutional size and
64 See Bernard Simon, Canadian Lenders Not Immune (Nov. 30, 2008), The Financial
Times, available at https://www.ft.com/content/78f66854-bf08-11dd-ae63-0000779fd18c.
23
industry concentration is a necessary but not sufficient condition for increased rent seeking. Charter value is the key. If the financial institutions are in an equilibrium that is more or less subsidized by the government, then they are more likely to play it safe and stay complacent. If, on the other hand, the financial institutions are in a more competitive environment, then greater size and concentration can result in higher risk and rent seeking.
The handful of banks in Canada—like banks in many nations in the rest of the developed world—have fewer competitors and a stronger partnership with the central government than U.S. banks. In technical terms, Canadian banks have higher charter values, where a charter is the legal document establishing a bank. Intuitively, banks with higher charter values have lower incentives to take risks, because that would lead to a higher risk of failure and the loss of the valuable charter.65 On the other hand, increased competition reduces the value of a charter and induces banks to take greater risks.66 This is why regulators and academics in the 1960s debated whether banking monopolies were socially beneficial. The justification was less competition meant less risk taking, which meant greater stability for the entire financial system.67
According to scholars, bank charter values fell in the 1980s due to regulatory changes and competition from banks and nonbanks.68 Banks faced heightened competition from other banks in the 1980s due to the loss of geographic monopolies. Banks also received competition from nonbanks: On the liability side of the balance sheet, banks had competition from nonbanks like MMFs due to Regulation Q’s cap on interest rates. On the asset side, the banks had competition from non-banks in the form of junk bonds. As a result, bank profits fell, and banks began to increase risk-taking and maintaining a lower level of capital.69 Thus, scholars believe that the increased competition led to riskier innovations like securitization.70
65 See GORTON at 58 (“But the panics appeared to end in the U.S. when deposit insurance
was legislated in 1934. Combined with valuable bank charters and oversight by bank examiners, the Quiet Period was created.”). Canada, for example, has both valuable bank charters (due to tight regulations) and greater oversight by bank examiners.
66 See Alan J. Marcus, Deregulation and Bank Financial Policy, 8 J. BANK. & FIN. 557, 557 (1984) (pointing out that “as the value of the bank charter falls, the risk-taking strategy is more apt to dominate,” thereby increasing the probability of insolvency).
67 See David A. Alhadeff, A Reconsideration of Restrictions on Bank Entry, 76 Q. J. ECON. 246, 246 (1962) (“In the case of banking, however, public policy seeks to protect the public interest by preventing undue competition.”).
68 See generally GARY B. GORTON, MISUNDERSTANDING FINANCIAL CRISES: WHY WE DON’T SEE THEM COMING 126-129 (2012) (describing the decline in charter values in the 1980s); see also David A. Alhadeff, A Reconsideration of Restrictions on Bank Entry, 76 Q. J. ECON. 246 (1962).
69 See Gary B. Gorton, The History and Economics of Safe Assets, NBER Working Paper 22210 (Apr. 2016), available at ______, at 23; see also Gary Gorton & Richard Rosen, Corporate Control, Portfolio Choice, and the Decline of Banking, 50 J. FIN. 1377 (1995); Allen N. Berger,

24
Notably, such competition does not exist in Canada and in many other developed countries, where the is less competition and the public safety net guarantees a high charter value and dis-incentivizes risk taking beyond a certain point. This version of banking used to be the norm in the United States during the 1970s, when charter values were higher and banking was a more boring job. After the state-level and national-level deregulatory episodes, and after the wave of mergers and acquisitions, bankers did not become more productive. Instead, they took on more risk with their larger balance sheets, and their actions translated into astronomical paydays. Notably, this is not enhanced productivity.
V. Conclusion
This article explores the impact of consolidation within the banking sector on rent seeking. It argues that the Riegle-Neal Interstate Banking and Branching Efficiency Act of 1994 led to increased market concentration, lower charter values, and increased risk taking. This, in turn, skewed the wage distribution of employees in the banking sector because the large banks were able to capture economic rents.
This article also provides a generalizable theory that could explain part of the inequality story in the United States. The theory is that an increase in market power from deregulation leads to the large firms capturing economic rents. This led to higher pay for certain bankers and also greater income inequality within the sector.
Some believe that increased inequality in the finance industry is not enough to move the needle on aggregate inequality. They argue that there are not enough financiers in the country to cause the widespread increase in income inequality witnessed the 1980s and 1990s. However, Bakija, Cole, and Heim (2012) present evidence suggesting otherwise.71 The authors use individual income tax data, courtesy of the U.S. Treasury, to tabulate the occupational composition of the “Top 1%” and the “Top 0.1%.” Their data are collected from
Anil K. Kashyap & Joseph M. Scalise, The Transformation of the U.S. Banking Industry: What a Long, Strange Trip It’s Been, Brookings Papers on Economic Activity (1995); Michael C. Keeley, Deposit Insurance, Risk, and Market Power in Banking, 80 American Economic Review 1183 (1990).
70 See GORTON, supra note _____; see also Rebecca S. Demsetz & Philip E. Strahan, Diversification, Size, and Risk at Bank Holding Companies, 29 J. Money, Credit & Banking 300, 300 (1997) (noting that large bank holding companies pursued riskier lending after obtaining a larger and more diversified portfolio).
71 Jon Bakija, Adam Cole, Bradley T. Heim, Jobs and Income Growth of Top Earners and the Causes of Changing Income Inequality: Evidence from U.S. Tax Return Data (Apr. 2012), Working Paper, available at https://web.williams.edu/Economics/wp/BakijaColeHeimJobsIncomeGrowthTopEarners.pdf.

25
Form 1040 and many of the supporting schedules. The data include wages and salaries, dividends and interest, capital gains, and income from lonely held businesses.
The authors first document the existence of a nontrivial group of managers at the very top of the income distribution. In 2004, for instance, approximately 40.9 percent of the Top 0.1% report their occupation as an executive, manager, or supervisor of a firm in a non-financial industry. This is a strong counterargument to those who believe that managers represent too small of a share of top income earners to explain rising inequality at the very top.
The second finding is that financial managers have played a significant role in the inequality buildup. The percentage of “executives, managers, supervisors (non-finance)” in the Top 1% fell from 36 percent to 31 percent between 1979 and 2005. The decline, however, was made up by the increase in finance management. Thus, “total executives, managers, supervisors, and finance” actually ticked up from 43.7 percent to 44.9 percent in the time period. See Table 2 in Bakija et al. (2012). The same pattern holds for the Top 0.1%.
The most important contribution of their paper is arguably the calculation of the managerial contribution to the rising Top 1% income share. See Table 6 in Bakija et al. (2012). In 1979, 48.6 percent of the Top 1% share of national income went to executives and managers (=4.47/9.18). That fraction increased to 53.7 percent (=9.12/16.97) in 2005. The data show that 60 percent of the increase in the Top 1%’s share of national income between 1979 and 2005 was due to executives and managers (=(9.12-4.47)/(16.97-9.18)). The story is even stronger story for the Top 0.01%.
Consider the findings of Bakija et al. in the context of this article. The income distribution within the financial sector widened significantly in the 1990s. Most of that dispersion, if not all of it, occurred in the top end of the distribution. That undoubtedly reflected the disproportionate increase in financial managers’ pay. Given the importance of financial managers to managerial income inequality—and given the importance of managerial income inequality to overall income inequality since the 1970s—it logically follows that financial deregulation has played a sizeable role in the growth of income inequality in the United States.
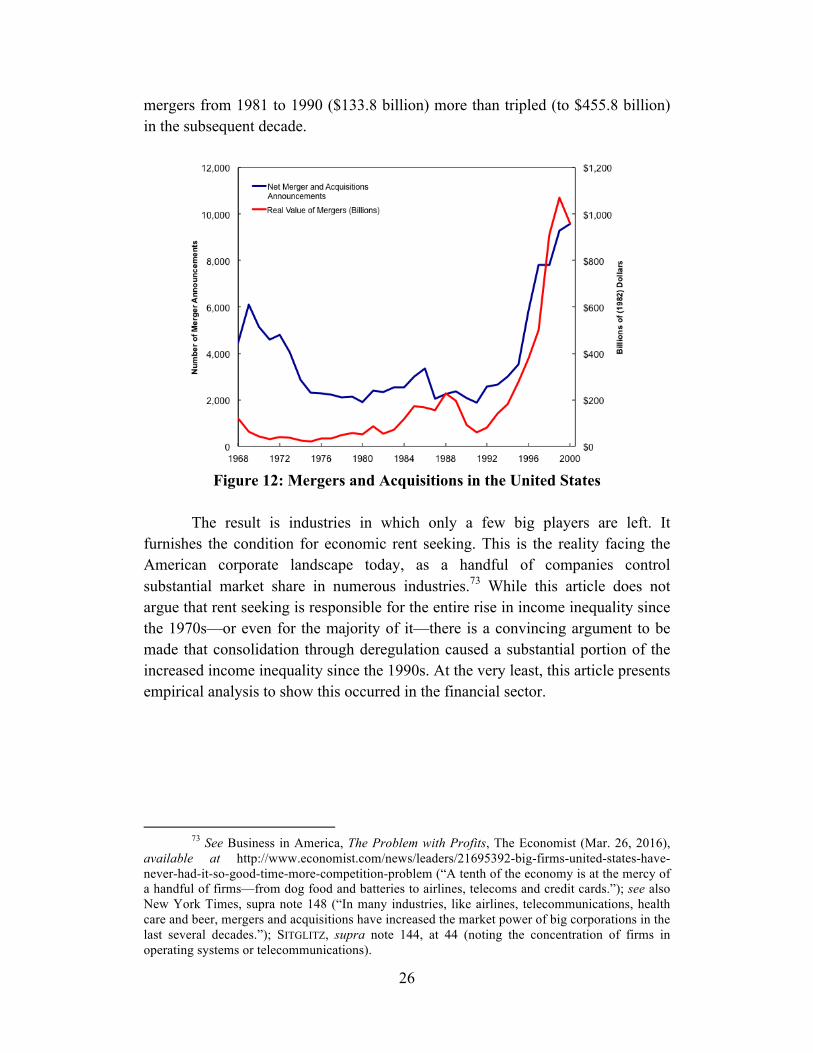
More generally, the 1990s witnessed an explosion in mergers across various industries as regulations were weakened or removed. Figure 12 below shows this clearly.72 From 1981 to 1990, there were an average of nearly 2,500 announced mergers per year. From 1991 to 2000, that annual average more than doubled to 5,392. Similarly, the average amount of assets involved in annual
72 The data come from Table 1 of Paul A. Pautler, Evidence on Mergers and Acquisitions,
Federal Trade Commission (Sept. 25, 2001).
26
mergers from 1981 to 1990 ($133.8 billion) more than tripled (to $455.8 billion) in the subsequent decade.
Figure 12: Mergers and Acquisitions in the United States
The result is industries in which only a few big players are left. It
furnishes the condition for economic rent seeking. This is the reality facing the American corporate landscape today, as a handful of companies control substantial market share in numerous industries.73 While this article does not argue that rent seeking is responsible for the entire rise in income inequality since the 1970s—or even for the majority of it—there is a convincing argument to be made that consolidation through deregulation caused a substantial portion of the increased income inequality since the 1990s. At the very least, this article presents empirical analysis to show this occurred in the financial sector.
73 See Business in America, The Problem with Profits, The Economist (Mar. 26, 2016),
available at http://www.economist.com/news/leaders/21695392-big-firms-united-states-have-never-had-it-so-good-time-more-competition-problem (“A tenth of the economy is at the mercy of a handful of firms—from dog food and batteries to airlines, telecoms and credit cards.”); see also New York Times, supra note 148 (“In many industries, like airlines, telecommunications, health care and beer, mergers and acquisitions have increased the market power of big corporations in the last several decades.”); SITGLITZ, supra note 144, at 44 (noting the concentration of firms in operating systems or telecommunications).
27
Appendix A
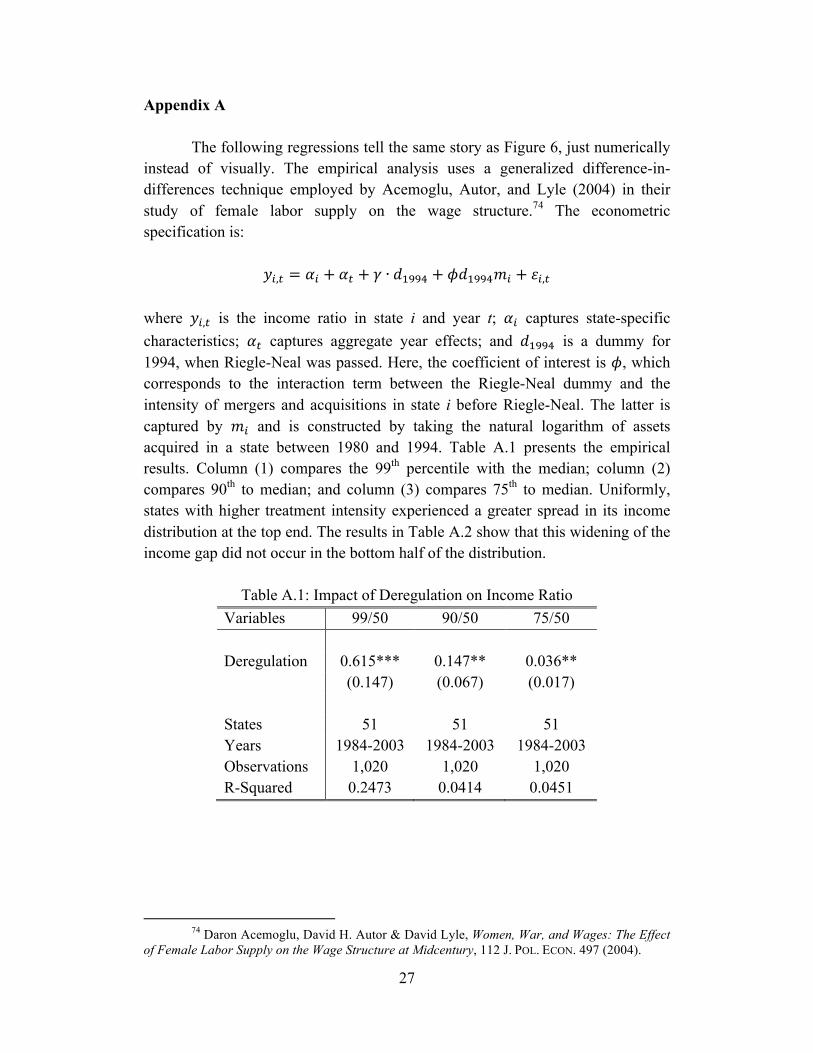
The following regressions tell the same story as Figure 6, just numerically instead of visually. The empirical analysis uses a generalized difference-in-differences technique employed by Acemoglu, Autor, and Lyle (2004) in their study of female labor supply on the wage structure.74 The econometric specification is:
𝑦!,! = 𝛼! + 𝛼! + 𝛾 ∙ 𝑑!""# + 𝜙𝑑!""#𝑚! + 𝜀!,!
where 𝑦!,! is the income ratio in state i and year t; 𝛼! captures state-specific characteristics; 𝛼! captures aggregate year effects; and 𝑑!""# is a dummy for 1994, when Riegle-Neal was passed. Here, the coefficient of interest is 𝜙, which corresponds to the interaction term between the Riegle-Neal dummy and the intensity of mergers and acquisitions in state i before Riegle-Neal. The latter is captured by 𝑚! and is constructed by taking the natural logarithm of assets acquired in a state between 1980 and 1994. Table A.1 presents the empirical results. Column (1) compares the 99th percentile with the median; column (2) compares 90th to median; and column (3) compares 75th to median. Uniformly, states with higher treatment intensity experienced a greater spread in its income distribution at the top end. The results in Table A.2 show that this widening of the income gap did not occur in the bottom half of the distribution.
Table A.1: Impact of Deregulation on Income Ratio Variables 99/50 90/50 75/50
Deregulation 0.615*** 0.147** 0.036** (0.147) (0.067) (0.017)
States 51 51 51 Years 1984-2003 1984-2003 1984-2003 Observations 1,020 1,020 1,020 R-Squared 0.2473 0.0414 0.0451
74 Daron Acemoglu, David H. Autor & David Lyle, Women, War, and Wages: The Effect
of Female Labor Supply on the Wage Structure at Midcentury, 112 J. POL. ECON. 497 (2004).

28
Table A.2: Impact of Deregulation on Income Ratio Variables 50/20 50/30 50/40
Deregulation -0.0004 0.0004 0.0013 (0.0.015) (0.007) (0.004)
States 51 51 51 Years 1984-2003 1984-2003 1984-2003 Observations 1,020 1,020 1,020 R-Squared 0.0195 0.0145 0.0128
Appendix B
Suppose for the sake of argument that mergers and acquisitions do lead to higher productivity of bankers. For example, there might be more creativity in the deregulated environment, so entry-level bank analysts and mid-level bank associates can work more efficiently; and senior bank managers have a higher marginal productivity of labor because they might be in charge of running a more complex operation. If this hypothesis were correct, then we would expect to see increases in productivity—and in in top-end pay—during the 1980s. Recall that there were numerous mergers and acquisitions that occurred in that decade. One can use the state-level difference-in-differences regressions to test this hypothesis. The data, however, show no significant changes in the income ratio.
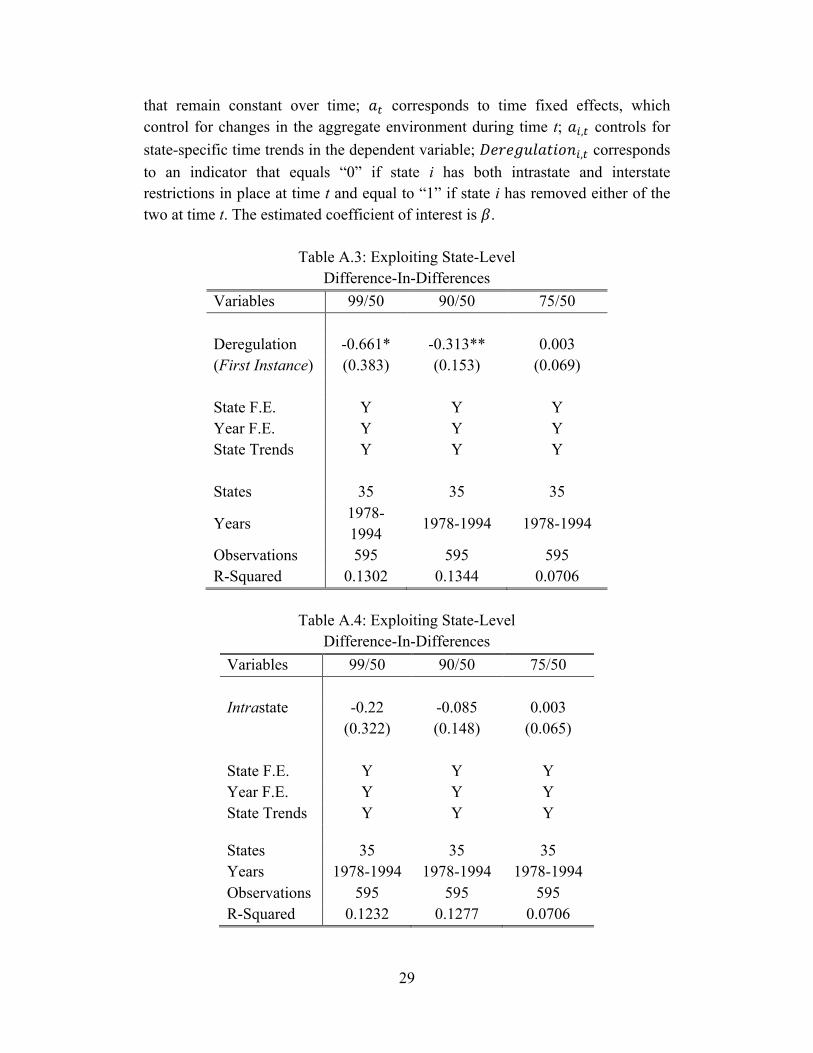
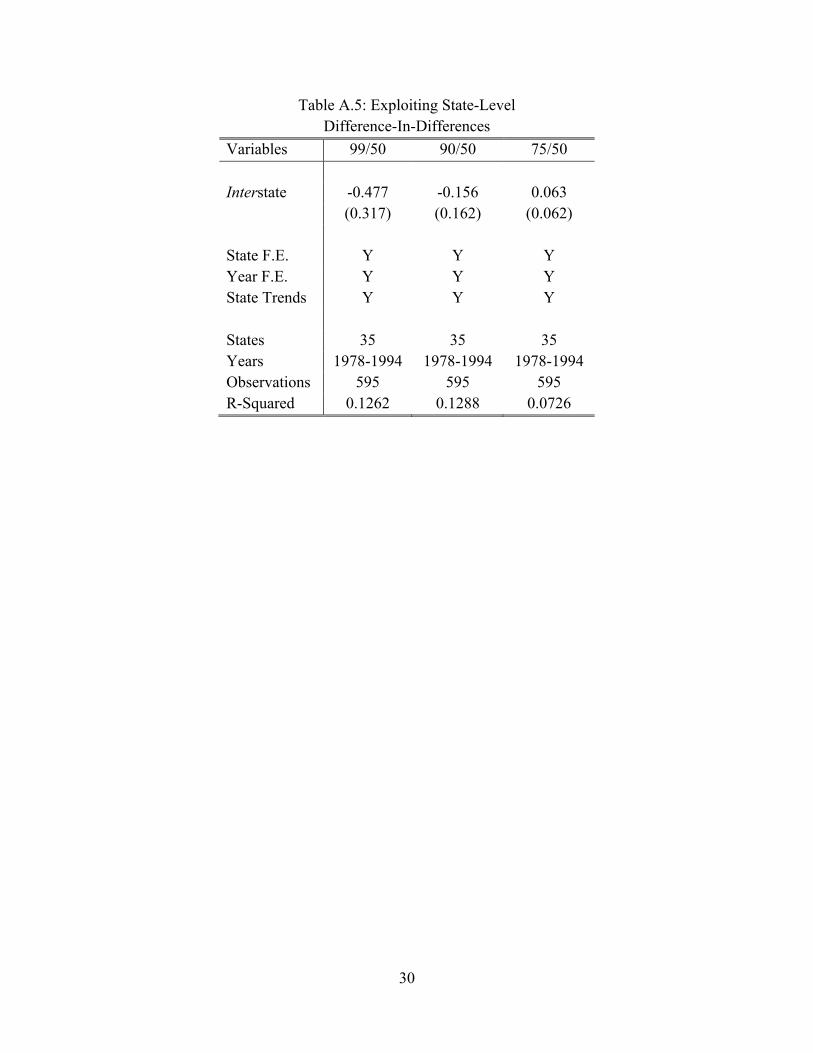
Tables A.3, A.4, and A.5 below shows no significant, positive change in this ratio for (a) the first instance of deregulation, (b) intrastate deregulation, or (c) interstate deregulation, respectively. If anything, the regression results point to a narrowing of the income gap prior to the megamergers of the mid- and late-1990s. This is consistent with the breakdown of local monopolies held by banks thanks to state restrictions on expansion. Prior to deregulation, those local banks were almost surely earning monopoly rents, seeing as how many of them were the only business in a reasonable radius. But these gains appear to have disappeared post-1994, after the wave of megamergers washed through the banking system. As banks became bigger on a national scale, their employees—particularly those in the top half of the income distribution—were able to increase their pay at a rate not commensurate with their productivity. The econometric specification used is:
𝐼𝑛𝑐𝑜𝑚𝑒 𝑅𝑎𝑡𝑖𝑜!,! = 𝑎! + 𝑎! + 𝑎!,! + 𝛽×𝐷𝑒𝑟𝑒𝑔𝑢𝑙𝑎𝑡𝑖𝑜𝑛!,! + 𝜀!,!
where the dependent variable is the income ratio in state i at time t; 𝑎! corresponds to state fixed effects, which capture idiosyncratic features of state i
29
that remain constant over time; 𝑎! corresponds to time fixed effects, which control for changes in the aggregate environment during time t; 𝑎!,! controls for state-specific time trends in the dependent variable; 𝐷𝑒𝑟𝑒𝑔𝑢𝑙𝑎𝑡𝑖𝑜𝑛!,! corresponds to an indicator that equals “0” if state i has both intrastate and interstate restrictions in place at time t and equal to “1” if state i has removed either of the two at time t. The estimated coefficient of interest is 𝛽.
Table A.3: Exploiting State-Level Difference-In-Differences
Variables 99/50 90/50 75/50
Deregulation -0.661* -0.313** 0.003 (First Instance) (0.383) (0.153) (0.069) State F.E. Y Y Y Year F.E. Y Y Y State Trends Y Y Y
States 35 35 35
Years 1978-1994
1978-1994 1978-1994
Observations 595 595 595 R-Squared 0.1302 0.1344 0.0706
Table A.4: Exploiting State-Level
Difference-In-Differences Variables 99/50 90/50 75/50
Intrastate -0.22 -0.085 0.003 (0.322) (0.148) (0.065) State F.E. Y Y Y Year F.E. Y Y Y State Trends Y Y Y
States 35 35 35 Years 1978-1994 1978-1994 1978-1994 Observations 595 595 595 R-Squared 0.1232 0.1277 0.0706
30
Table A.5: Exploiting State-Level Difference-In-Differences
Variables 99/50 90/50 75/50
Interstate -0.477 -0.156 0.063
(0.317) (0.162) (0.062)
State F.E. Y Y Y Year F.E. Y Y Y State Trends Y Y Y
States 35 35 35 Years 1978-1994 1978-1994 1978-1994 Observations 595 595 595 R-Squared 0.1262 0.1288 0.0726