issn = 1980-993x (online) · system analyst tiago dos santos agostinho, unitau, br secretary and...
TRANSCRIPT

ISSN = 1980-993X (Online) http://www.ambi-agua.net
43th Edition of Revista Ambiente & Água - An Interdisciplinary Journal of Applied Science, Taubaté, V. 13, N. 2, p. 1-13 Mar./Apr. 2018. (doi:10.4136/ambi-agua.v13.n2)
i
EDITORIAL BOARD Editors
Getulio Teixeira Batista (Emeritus Editor) Universidade de Taubaté - UNITAU, BR
Nelson Wellausen Dias (Editor-in-Chief), Fundação Instituto Brasileiro de Geografia e Estatística - IBGE, BR
Associate Editors
Ana Aparecida da Silva Almeida Universidade de Taubaté (UNITAU), BR
Marcelo dos Santos Targa Universidade de Taubaté (UNITAU), BR
Editorial Commission
Amaury Paulo de Souza Universidade Federal de Viçosa (UFV), BR
Ana Aparecida da Silva Almeida Universidade de Taubaté (UNITAU), BR
Andrea Giuseppe Capodaglio University of Pavia, ITALY
Antonio Evaldo Klar Universidade Est. Paulista Júlio de Mesquita Filho (UNESP), BR
Antonio Teixeira de Matos Universidade Federal de Viçosa (UFV), BR
Apostol Tiberiu University Politechnica of Bucharest, Romênia
Carlos Eduardo de M. Bicudo Instituto de Botânica, IBT, BR
Claudia M. dos S. Cordovil Centro de estudos de Engenharia Rural (CEER), Lisboa, Portugal
Dar Roberts University of California, Santa Barbara, United States
Delly Oliveira Filho Universidade Federal de Viçosa (UFV), BR
Gabriel Constantino Blain Instituto Agronômico de Campinas, IAC, BR
Giordano Urbini University of Insubria, Varese, Italy
Gustaf Olsson Lund University, Lund, Sweden
Hélio Nobile Diniz Inst. Geológico, Sec. do Meio Amb. do Est. de SP (IG/SMA), BR
Ignacio Morell Evangelista University Jaume I- Pesticides and Water Research Institute, Spain
János Fehér Debrecen University, Hungary
João Vianei Soares Instituto Nacional de Pesquisas Espaciais (INPE), BR
José Carlos Mierzwa Universidade de São Paulo, USP, BR
Julio Cesar Pascale Palhares Embrapa Pecuária Sudeste, CPPSE, São Carlos, SP, BR
Luis Antonio Merino Institute of Regional Medicine, National University of the Northeast,
Corrientes, Argentina
Marcelo dos Santos Targa Universidade de Taubaté (UNITAU), BR
Maria Cristina Collivignarelli University of Pavia, Depart. of Civil Engineering and Architecture, Italy
Massimo Raboni LIUC - University "Cattaneo", School of Industrial Engineering, Italy
Petr Hlavínek Brno University of Technology República Tcheca
Richarde Marques da Silva Universidade Federal da Paraíba (UFPB), BR
Silvio Jorge Coelho Simões Univ. Est. Paulista Júlio de Mesquita Filho (UNESP), BR
Stefan Stanko Slovak Technical University in Bratislava Slovak, Eslováquia
Teresa Maria Reyna Universidad Nacional de Córdoba, Argentina
Yosio Edemir Shimabukuro Instituto Nacional de Pesquisas Espaciais (INPE), BR
Zhongliang Liu Beijing University of Technology, China
Text Editor Theodore D`Alessio, FL, USA, Maria Cristina Bean, FL, USA
Reference Editor Liliane Castro, Bibliotecária - CRB/8-6748, Taubaté, BR
Peer-Reviewing Process Marcelo Siqueira Targa, UNITAU, BR
System Analyst Tiago dos Santos Agostinho, UNITAU, BR
Secretary and Communication Luciana Gomes de Oliveira, UNITAU, BR
Library catalog entry by Liliane Castro CRB/8-6748
Revista Ambiente & Água - An Interdisciplinary Journal of Applied Science / Instituto de Pesquisas
Ambientais em Bacias Hidrográficas. Taubaté. v. 13, n.2 (2006) - Taubaté: IPABHi, 2018. Quadrimestral (2006 – 2013), Trimestral (2014 – 2016), Bimestral (2017), Publicação Contínua a partir de
Janeiro de 2018.
Resumo em português e inglês. ISSN 1980-993X
1. Ciências ambientais. 2. Recursos hídricos. I. Instituto de Pesquisas Ambientais em Bacias Hidrográficas.
CDD - 333.705
CDU - (03)556.18

ii
TABLE OF CONTENTS COVER:
Map showing an area in central Mato Grosso State, Brazil, where albedo variation values of forest, burned
vegetation, water, and crop areas were analyzed in this Amazon-Cerrado transition zone
Source: FARIA, T. O. et al. Surface albedo in different land-use and cover types in Amazon forest region.
Rev. Ambient. Água, Taubaté, vol. 13 n. 2, p. 1-13, 2018. doi:10.4136/ambi-agua.2120
ARTICLES
01
Social and environmental innovations of Brazilian companies
doi:10.4136/ambi-agua.2145
Celso Machado Junior; Maria Tereza Saraiva de Souza; Roberto Bazanini; Daielly Melina Nassif
Mantovani; Cristiane Jaciara Furlaneto
1-15
02
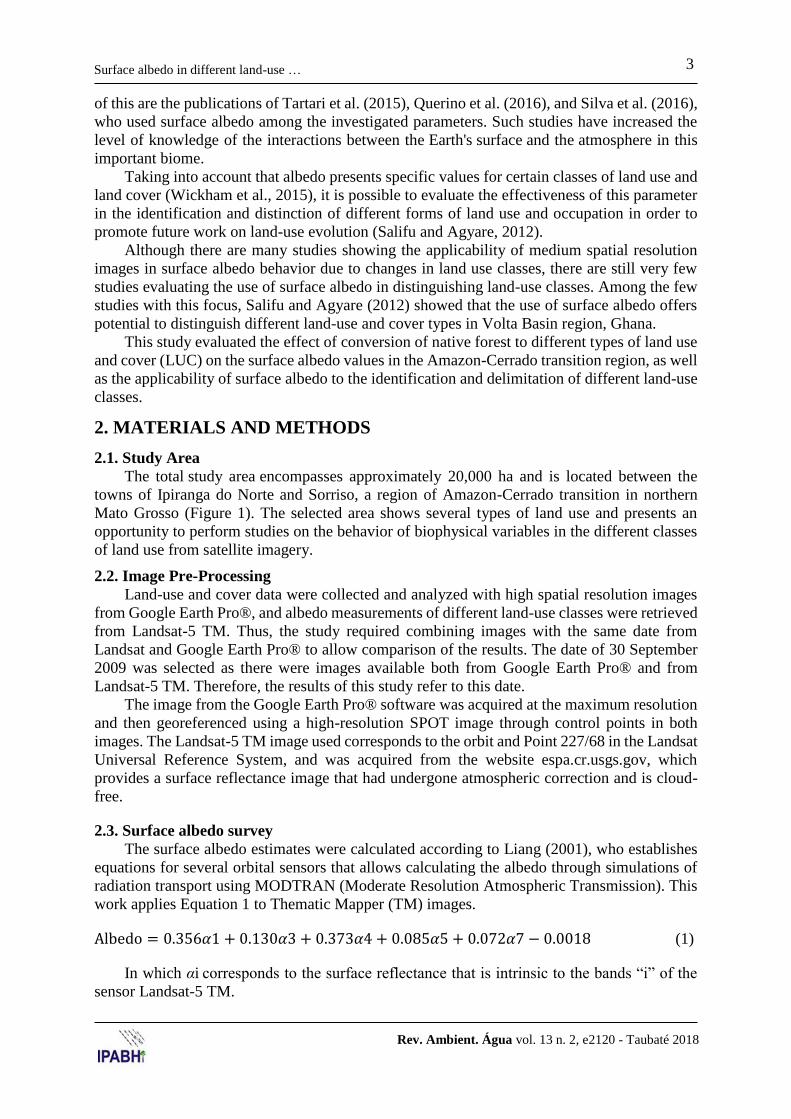
Surface albedo in different land-use and cover types in Amazon forest region
doi:10.4136/ambi-agua.2120
Thiago de Oliveira Faria; Thiago Rangel Rodrigues; Leone Francisco Amorim Curado; Denilton Carlos
Gaio; José de Souza Nogueira
1-13
03
Production of energy (biodiesel) and recovery of materials (biochar) from pyrolysis of urban waste
sludge
doi:10.4136/ambi-agua.2128
Arianna Callegari; Petr Hlavinek; Andrea Giuseppe Capodaglio
1-14
04
Characterization of controlled landfill leachate from the city of Guaratinguetá - SP, Brazil
doi:10.4136/ambi-agua.2136
André Luis de Castro Peixoto; Rodrigo Fernando dos Santos Salazar; Jayne Carlos de Souza Barboza;
Hélcio José Izário Filho
1-16
05
The historical influence of tributaries on the water and sediment of Jacuí’s Delta, Southern Brazil
doi:10.4136/ambi-agua.2150
Leonardo Capeleto de Andrade; Rodrigo da Rocha Andrade; Flávio Anastácio de Oliveira Camargo
1-12
06
Segregation of solid waste from a fish-processing industry: a sustainable action
doi:10.4136/ambi-agua.2155
Yeda dos Santos Silva; Liliana Pena Naval
1-15
07
Assessment of the water quality and trophic state of the Ribeirão Guaraçau Watershed, Guarulhos
(SP): a comparative analysis between rural and urban areas
doi:10.4136/ambi-agua.2170
Reinaldo Romero Vargas; Márcia da Silva Barros; Antonio Roberto Saad; Regina de Oliveira Moraes
Arruda; Fernanda Dall'Ara Azevedo
1-13
08
Effects of different operating conditions on total nitrogen removal routes and nitrous oxide
emissions in a lab-scale activated sludge system
doi:10.4136/ambi-agua.2174
Renato Pereira Ribeiro; Débora Cynamon Kligerman; William Zamboni de Mello; Denise da Piedade
Silva; Renatah da Fonseca Correia; Jaime Lopes da Mota Oliveira
1-15

iii
09
Use of agricultural and agroindustrial residues as alternative adsorbents of manganese and iron in
aqueous solution
doi:10.4136/ambi-agua.2181
Fernanda Lansa Furlan; Nelson Consolin Filho; Marcilene Ferrari Barriquello Consolin; Morgana Suzsek
Gonçalves; Patrícia Valderrama; Aziza Kamal Genena
1-12
10
Determination of carbamazepine and diazepam by SPE-HPLC-DAD in Belém River water,
Curitiba-PR/Brazil
doi:10.4136/ambi-agua.2196
Beatriz Böger; Bianca do Amaral; Priscila Lagner da Silveira Estevão; Ricardo Wagner; Patricio
Guillermo Peralta-Zamora; Eliane Carneiro Gomes
1-12
11
Determination of estrogenic hormones in sewage and effluent of a decentralized sewage treatment
plant by activated sludge
doi:10.4136/ambi-agua.2059
Rossana Borges Teixeira; Carolina Alves Marques; Natália Rodrigues de Carvalho; Luiz Eduardo Thans
Gomes; Flávio Teixeira da Silva; Teresa Cristina Brazil de Paiva
1-10
12
Combined use of O3/H2O2 and O3/Mn2+ in flotation of dairy wastewater
doi:10.4136/ambi-agua.2078
Marta Cristina Silva Carvalho; Alisson Carraro Borges; Magno dos Santos Pereira; Fernanda Fernandes
Heleno; Leda Rita D´Antonino Faroni; Luiza Cintra Campos
1-15
13
Assessment of a subtropical riparian forest focusing on botanical, meteorological, ecological
characterization and chemical analysis of rainwater
doi:10.4136/ambi-agua.2140
Vanessa Graeff; Ivi Galetto Mottin; Ledyane Rocha-Uriartt; Daniela Montanari Migliavacca Osório; Jairo
Lizandro Schmitt
1-16
14
Urban solid waste challenges in the BRICS countries: a systematic literature review
doi:10.4136/ambi-agua.2157
Andriani Tavares Tenório Gonçalves; Flávia Tuane Ferreira Moraes; Guilherme Lima Marques; Josiane
Palma Lima; Renato da Silva Lima
1-20
15
Quality of water used by beach kiosks
doi:10.4136/ambi-agua.2003
Diésse Nascimento Norete; Quezia Botelho Correia; Jackline Freitas Brilhante São José
1-8
16
Seasonal and spatial evaluation of the surface water quality in the Longá river watershed, Piauí,
Brazil
doi:10.4136/ambi-agua.2054
Waneska Maria Vasconcelos Medeiros; Carlos Ernando da Silva; Ruceline Paiva Melo Lins
1-17
17
Seasonal evaluation of surface and groundwater quality in the area of influence of the Lixão de
Salinópolis, PA
doi:10.4136/ambi-agua.2072
Régia Simony Braz Da Silva; Adriano Marlisom Leão de Sousa; Silvana do Socorro Veloso Sodré; Maria
Isabel Vitorino
1-18

Ambiente & Água - An Interdisciplinary Journal of Applied Science
ISSN 1980-993X – doi:10.4136/1980-993X
www.ambi-agua.net
E-mail: [email protected]
This is an Open Access article distributed under the terms of the Creative Commons
Attribution License, which permits unrestricted use, distribution, and reproduction in any
medium, provided the original work is properly cited.
Social and environmental innovations of Brazilian companies
ARTICLES doi:10.4136/ambi-agua.2145
Received: 07 Jun. 2017; Accepted: 06 Feb. 2018
Celso Machado Junior1*; Maria Tereza Saraiva de Souza2; Roberto Bazanini3;
Daielly Melina Nassif Mantovani4; Cristiane Jaciara Furlaneto5
1Faculdades Metropolitanas Unidas (FMU), São Paulo, SP, Brasil
Mestrado Profissional em Administração em Governança Corporativa (MPAGC)
E-mail: [email protected] 2Fundação Educacional Inaciana Pe. Sabóia de Medeiros (FEI), São Bernardo do Campo, SP, Brasil
Programa de Mestrado e Doutorado em Administração (PMDA). E-mail: [email protected] 3Universidade Paulista (UNIP), São Paulo, SP, Brasil
Programa de Mestrado em Administração. E-mail: [email protected] 4Faculdades Metropolitanas Unidas (FMU), São Paulo, SP, Brasil
Programa de Pós-Graduação em Administração (PPGA). E-mail: [email protected] 5Universidade Paulista (UNIP), São Paulo, SP, Brasil
Conselho Superior de Ensino, Pesquisa e Extensão. E-mail: [email protected] *Corresponding author
ABSTRACT This paper focuses on the social and environmental innovations of Brazilian companies,
rather than on merely economic innovations. These innovations are discussed within the context
of sustainability. Data were collected via a qualitative and descriptive study from the annual
Guia Exame de Sustentabilidade magazine (2014 Edition). The magazine stated that 228
companies responded to the questionnaire. Of these, 61 companies stood out in Brazil for their
policies and practices in sustainability and had their results published. The social innovations
were geared towards meeting the needs of the surrounding communities. Environmental
innovations appeared in greater numbers, connoting a higher stage of attention and interest from
Brazilian companies. Environmental innovations were intended to evolve or improve processes
and products and to reduce the consumption of resources.
Keywords: efficient processes, reduction of greenhouse gases, socio-technical context.
Inovações sociais e ambientais das empresas brasileiras
RESUMO Neste artigo, se investiga as inovações voltadas para aspectos sociais e ambientais, ao invés
da análise de aspectos meramente econômicos, proporcionando assim o contexto da
sustentabilidade. Este propósito é estabelecido para identificar as inovações sociais e
ambientais desenvolvidas pelas empresas brasileiras. Os dados foram coletados através de um
estudo qualitativo e descritivo da revista anual Guia Exame de Sustentabilidade (edição de
2014). A publicação de 2014 da revista identificou que 228 empresas responderam ao
questionário. Destas, 61 empresas se destacaram no Brasil por suas políticas e práticas de
sustentabilidade e publicaram seus resultados. As inovações sociais foram voltadas para atender
às necessidades das comunidades vizinhas. As inovações ambientais apareceram em maior

Rev. Ambient. Água vol. 13 n. 2, e2145 - Taubaté 2018
2 Celso Machado Junior et al.
número, em estágio mais elevado de atenção e interesse em relação as sociais pelas empresas
brasileiras. As inovações ambientais foram destinadas a desenvolver ou melhorar processos e
produtos, bem como para a redução do consumo de recursos.
Palavras-chave: contexto sócio técnico, processos eficientes, redução de gases de efeito estufa.
1. INTRODUCTION
Social and environmental innovations, rather than merely economic innovations, are of
interest to society. This research identifies Brazilian companies’ social and environmental
innovations through an investigation of 61 companies that disclosed details of their
performance in the magazine Guia Exame de Sustentabilidade (2014).
The theory of economic development proposed by Schumpeter (1997) explains the
elements that support the evolution of markets, countries and companies. According to this
author, innovation has a close relationship with the establishment of new markets and the
emergence of entrepreneurs. It is important that a government support research and
development for its country’s economic growth. In this way, Dosi (2006) argues that the growth
and competitiveness of an industrial society can be encouraged by carrying out scientific and
technological research, confirming Schumpeter’s approach.
Through the Oslo Manual, the Organization for Economic Co-operation and Development
(OECD, 2005) classifies innovation into four areas: product, process, marketing and
organization. This division positions an innovation in the area from which it originated or in
the area that had greater participation in it.
The Oslo Manual (OECD, 2005) is an international benchmark to measure innovation.
Despite the greater attention paid to innovation in the industrial sector, the Oslo Manual enables
the interpretation of innovation in various spheres of society. However, it focuses primarily on
economic development, moving away from social and environmental issues, which, together
with the economic variable, lay the foundations of sustainability.
In the context of economic innovation, Schumpeter (1997) argues that this can be achieved
by producing new things, producing the same things in a new way (in various combinations of
materials and forces) and making new combinations that bring financial returns.
The innovations that occur within the companies are thus important for the whole of society
and influence the development of the country. Thus, this research identifies innovations of
Brazilian companies that had social and environmental impact.
Design innovation based solely on financial returns is far from a sustainable development
proposal. Concern for sustainability is a reality in most companies, whose management teams
focus not only on economic aspects but also social and environmental aspects. The engagement
of enterprises in the context of sustainability involves the need to change practices to address
sustainable development. Barbieri et al. (2010) point out that in the process of innovation,
organizations should incorporate the mitigation of social and environmental aspects. In this
sense, besides benefiting the economy, innovation should contemplate society and the
environment, consolidating the concept of sustainable development.
Authors like Bhatt and Altinay (2013) and Maclean et al. (2013) indicate that research on
social innovation is in the embryonic stage, lacking theoretical and empirical studies. To
Cajaiba-Santana (2014), social innovation studies are fractionated and diluted among various
fields of knowledge. Bignetti (2011) identifies that research on social innovation is rare and
rudimentary. The research field is still emerging. Bouchard (2012) proposes that social
innovations aimed at social change present a new vision – a new way to evaluate and define
problems and possible solutions.

3 Social and environmental innovations of Brazilian companies
Rev. Ambient. Água vol. 13 n. 2, e2145 - Taubaté 2018
While sustainable development is a scientific field still developing, there are important
studies with the potential to direct relevant research on this topic. Within the existing body of
research, this study highlights contributions that support the discussion to be developed with
the collected data. It is worth noting that the definition of social innovation is viewed as an
innovative resolution that is designed to meet human needs (Mulgan, 2006) and to help to solve
the social and environmental problems that afflict humanity (Maurer and Silva, 2014).
The innovation can be incremental that stems from improving or complementing
something that already exists in the market, or radical that occurs abruptly implanting novelties
in the market and discontinued what was in force. Foster and Heeks (2013) highlights the
importance of the diffusion of new technologies in the economy and points out that such
diffusion has four dimensions: management or technological trajectory; rhythm or rate of
diffusion; conditions; and economic, social and environmental factors.
According to Chambon et al. (1982), social innovations are dynamics that allow an
individual or a group of individuals to meet social demands or sets of social needs that are
currently not met satisfactorily. Also, according to the authors, social innovation gives
individuals a better condition than at present, characterizing a degree of novelty. For the
authors, social innovation has four dimensions: (i) form – it is immaterial, represented by
actions and practices; (ii) process – it requires involvement and commitment from conception
to implementation; (iii) actors – consider people and their interaction with the environment; and
(iv) change objectives – it solves social problems, allowing the unfolding of everyday life.
For Kanter (1999), social problems are also economic problems. The author points out the
existence of companies that identify a favorable environment for social innovation and migrate
corporate social responsibility to corporate social innovation. Thus, the author proposes that the
commitment of companies to change involves the whole of society but differently than
philanthropy; it identifies opportunities for learning and business development via research and
development (R&D). According to the author, social innovation seeks to solve the problems
that affect society, such as those related to health, education and economic development.
The study of Holmes and Smart (2009) reviews open innovation in the context of
corporate social responsibility, which approximates social innovation and social
entrepreneurship. The authors also highlight the importance of businesses expanding their
borders as a phenomenon that strengthens the process of innovation and social legitimacy.
The existence of links among diversity management, the process of innovation and
superior performance in companies with greater attention to social aspects was observed in
research conducted by Bridgstock et al. (2010). The authors position social innovation as the
convergence of cultural aspects, in which the emphasis is on the importance of ideas and the
understanding that social conditions could be different and better. Thus, social innovation meets
currently unmet human and social needs, differing from business innovation that worries only
about the consumer and the market. Attention to people and communities, not commercial gain,
is what characterizes social innovation, according to Dawson and Daniel (2010). It is
distinguished by developing concepts, strategies and tools to support social aspects in the
improvement process. For these authors, social innovation is developed collaboratively in order
to tackle social problems and relies on the generation and implementation of ideas undertaken
collectively.
The aforementioned theoretical context establishes the first hypothesis of this research:
H1 – Social innovations made by companies are aimed at solving social problems.
Within the context of sustainability is also a concern for the environment. The
environmental approach considers aspects related to energy consumption, reduction in the
consumption of natural resources, and in the generation of pollution. Thus, new products and
processes must contemplate innovative solutions that are not restricted to benefits for users, but

Rev. Ambient. Água vol. 13 n. 2, e2145 - Taubaté 2018
4 Celso Machado Junior et al.
also for the environment. Concern about environmental innovation comes from various
segments of society. In the academic context, the journal Environmental Innovation and
Societal Transitions (EIST) is exclusively dedicated to environmental innovation. In addition,
magazines such as the Journal of Cleaner Production, the Journal of Industrial Ecology,
Ecological Economics, Revista de Gestão Social e Ambiental and Revista Metropolitana de
Sustentabilidade deal with issues related to environmental sustainability. Magazines such as
Policy Research, Technological Forecasting and Social Change and the Journal of
Evolutionary Economics deal with innovation. The areas of sustainability and innovation also
manifest in the dissemination of research regarding environmental innovation.
Kemp and Pearson (2007) present environmental innovation as a concern surrounding the
entire product lifecycle or service. For the authors, environmental innovation includes a new
product, production process, service, management type or business model for the organization,
causing a reduction in environmental risk, pollution and other possible negative impacts
resulting from the use of resources in comparison with relevant alternatives.
Rennings (2000) defines environmental innovation or eco-innovation as innovation that
contributes to sustainable development. Thus, in the industrial context, the development and
use of environmental innovations have the potential to be mechanisms to achieve sustainability.
Coenen and Díaz Lópes (2010) propose that environmental and social innovations undertaken
responsibly provide technological, institutional and organizational shifts, which modify the
basis of knowledge of production systems. Thus, to Van den Bergh et al. (2011), in industry,
the significant transition towards sustainability is based on new forms of environmental
innovation. Incremental improvements that seek to increase the environmental efficiency of
existing production technologies and systems are not sufficient to achieve the demanded radical
changes to establish sustainable development. However, the authors believe that environmental
innovation is now incremental.
Environmental innovation designed to provide sustainable development in the industrial
sector incorporates a systemic approach (Coenen and Díaz Lópes, 2010) involving socio-
technical systems that cover manufacturing, consumption and distribution. For Jacobsson and
Bergek (2011) and Markard et al. (2012), environmental innovations contribute to
sustainability, which in turn is positioned as an important large-scale transformation inductor,
involving users, institutions, technological advances, the economy, political structures and
other aspects. Markard et al. (2012) emphasize that research into socio-technical systems (such
as power supply, water supply and urban transport) enhances the understanding of how different
green technologies, competing with each other, enable the creation of new products, services,
business models and organizations. In this regard, environmental innovation is established as
an important component of sustainability and differentiation in the market.
As noted, the benefits resulting from environmental innovation are significant. However,
studies identify the importance of considering the costs involved in the implementation of
environmental improvements. Jorgenson et al. (2009) emphasize that the development of
innovations involves long periods of research and costly investments. Their analysis indicates
that the reduction of pollutant emissions in the coming decades will be more related to
environmental regulation than to the intention of developing new products or services. In this
conception, environmental innovation is a response of companies to meet legislation, not a
natural vocation of the companies. Van den Bergh et al. (2011) emphasize that environmental
innovations are geared towards meeting the pressing problems of society, which, however, are
associated with external costs and do not enter the calculation of the direct cost to the polluter,
for example, air pollution and solid waste disposal. If an industrial agent (a polluter) is not
encouraged to invest in environmental innovations or new environmentally friendly
technologies, it will affect its internal costs. In this context, the existence of laws is an important

5 Social and environmental innovations of Brazilian companies
Rev. Ambient. Água vol. 13 n. 2, e2145 - Taubaté 2018
incentive for environmental innovation, as it includes variable social costs that are borne by
society in general.
Van den Bergh et al. (2011) also point out that several empirical studies on environmental
innovation have focused on variable costs. In this sense, cost (present and future projections)
materializes as an important factor affecting both producers and consumers, who are more
sensitive to initial costs than long-term costs.
From this context emanates the second hypothesis of this research:
H2 – Environmental innovations are geared towards meeting the demands of the socio-
technical system.
Combined with innovation focused on economic growth, social and environmental
innovations are important variables for sustainable development. Thus, the innovation process
must consider all the variables involved in order to ensure the sustainable development of
society and that the demands of society are met in full.
2. METHODOLOGY
This study, according to its general purpose, can be characterized as qualitative and
descriptive, using secondary data. Data were collected from the annual magazine Guia Exame
de Sustentabilidade (2014 edition), published by Editora Abril publishing company. The first
edition was published in 2000, and the magazine follows a methodology developed by the
Center for Sustainability of the Fundação Getúlio Vargas (Guia Exame de Sustentabilidade,
2014). The publication has focused attention on the process of establishing a ranking of
companies that declare that their management teams focus attention on sustainability. The 2014
magazine stated that 228 companies responded to the questionnaire. Of these, 61 companies
stood out in Brazil for their policies and practices in sustainability and had their results
published.
In addition to the indicators presented, the 2014 magazine allowed companies to describe
three recently deployed sustainability reports, which described the benefits and results in
2013/2014 and those that were incomplete. The reports could discuss projects, programs,
initiatives and practices related to sustainability. Each company was able to offer three accounts
of sustainability along the following themes: governance and sustainability, human rights,
community relations, supplier management, water management, biodiversity management,
waste management, climate change (including management energy), relationships with
customers/consumers, and transparency and fighting corruption. If a company wished, it could
be exempted from presenting a sustainability report.
This study develops content analysis that, through pre-analysis, in line with the work of
Bardin (2009), makes it possible to establish the categorization and codification of the reports
submitted by the companies. This process seeks to identify social and environmental
innovations. All reports presented in the 2014 Guia Exame de Sustentabilidade are referenced
in a new list and classified into two categories, namely, social innovation and environmental
innovation. The search for a framework for reports based on environmental and social
innovation is justified both by the reporting approach of reports that should portray recent
activities and incomplete activities, and the demand for companies to present new solutions that
meet the paradigms of sustainability. Table 1 presents the concepts used to frame the reports
submitted by the companies. Note that these concepts were presented in the theoretical chapter.

Rev. Ambient. Água vol. 13 n. 2, e2145 - Taubaté 2018
6 Celso Machado Junior et al.
Table 1. Concepts used to classify sustainability reports.
Category Concept
Social Innovation Proposals aimed at social change present a new vision – a new way to evaluate
and define problems and possible solutions (Bouchard, 2012).
Social innovations are dynamics that allow an individual or a group of
individuals to meet social demands or sets of social needs that are currently not
met satisfactorily (Chambon et al., 1982).
Social innovation is the convergence of cultural aspects, in which the emphasis
is on the importance of ideas and the understanding that social conditions could
be different and better (Bridgstock et al., 2010).
Environmental Innovation Environmental innovation includes a new product, production process, service,
management type or business model for the organization, causing a reduction
in environmental risk, pollution and other possible negative impacts of
resource use in comparison with relevant alternatives (Kemp and Pearson,
2007).
Environmental innovation is designed to provide sustainable development in
the industrial sector and incorporates a systemic approach (Coenen and Díaz
Lópes, 2010).
Environmental innovations contribute to sustainability, which in turn is
positioned as an important large-scale transformation inductor, involving users,
institutions, technological advances, the economy, political structures and
other aspects (Jacobsson and Bergek, 2011; Markard et al. 2012).
In environmental innovation, cost (present and future projections) materializes
as an important behavioral factor of producers and consumers, who are more
sensitive to initial costs than long-term costs (Van den Bergh et al., 2011).
Source: Prepared by the authors, based on the references cited.
The next chapter presents the data observed in the content analysis through the
classifications of environmental innovation and social innovation.
3. PRESENTATION AND ANALYSIS OF DATA
The synthesis of the collected data is presented in Table 2. All the data obtained can be
seen in Appendix A, presented at the end of this article, with the classification of the reports of
companies into environmental innovation (EI) or social innovation (SI).
The data show 49 environmental innovations and 22 social innovations, and it was
established that 11 companies had both environmental and social innovations. Bradesco was
the only company not to present environmental or social innovations. The innovations
highlighted by the company related to the technological field, with the potential to result in
environmental and social benefits; however, the account of the company did not make this
relationship clear. Figure 1 shows the distribution of companies with environmental and/or
social innovations.
The data present four groups of companies. The first group presents only environmental
innovations with 38 companies (62.3%); the second group with 11 companies (18%) present
both environmental and social innovations; the third group with 11 companies (18%) present
only social innovations; and the last group with a company that presents an innovation that does
not fit as environmental or social. Thus, in the aggregate of the companies of the first group
with those of the second group, a total of 49 companies (80.3%) are identified investing in
environmental innovations, showing that this practice is of most interest to companies.

7 Social and environmental innovations of Brazilian companies
Rev. Ambient. Água vol. 13 n. 2, e2145 - Taubaté 2018
Table 2. Synthesis of reports highlighted by companies, from Appendix A.
Sector Number
of firms
Number of
innovations
introduced
% of
innovation
in the
sample
Number of
environmental
innovation
introduced
Number of
Social
Innovation
introduced
Agribusiness 3 3 4.22% 2 1
Auto Industry 2 2 2,82% 2 0
Capital Goods 2 2 2,82% 2 0
Consumer Goods 6 7* 9,86% 5 2
Construction 1 2 2,82% 1 1
Consulting and IT
Management 3 4* 5,63% 3 1
Electronics 5 6* 8,45% 5 1
Energy 8 9* 12,68% 7 2
Hotels 1 1 1,41% 1 0
Infrastructure 2 2 2,82% 1 1
Financial
Institutions 4 3** 4.22% 1 2
Construction
Materials 2 3* 4.22% 2 1
Mining and Steel
Mills 7 9* 12,68% 7 2
Paper and Cellulose 2 3* 4.22% 2 1
Chemistry 5 5 7,05% 4 1
Health Services 4 4 5,63% 1 3
Telecommunications 2 3* 4.22% 1 2
Transportation and
Logistics 1 1 1,41% 1 0
Small and medium
enterprises. 1 2* 2,82% 1 1
Total 61 71 100% 49 22
Source: Prepared by the authors, based on the references cited.
Note: * there are institutions that present more than one innovation, ** One of the institutions presented
innovation, but it does not fit as either environmental or social.
Figure 1. Distribution of companies with environmental and/or social innovations. Source: research data.

Rev. Ambient. Água vol. 13 n. 2, e2145 - Taubaté 2018
8 Celso Machado Junior et al.
Table 3 indicates the benefit themes of the social innovations of the companies. Social
innovations present unique benefits. The social actions developed by the companies result in
more social benefits than those listed; however, for the purposes of this research, the data are
restricted to those reported by the companies. The relation of social innovations and their
respective benefits can be seen in the Appendix A.
Supporting the community with nine occurrences (41%) was established as a major focus
of the companies that carried out social innovations. Next was enhancing professional capacity:
in two situations, the target audiences were outside the companies, and in one situation it was
the employees themselves. Next were establishing partnerships with collectors and mitigating
the effects of the activities of the companies. With just one occurrence each were working with
local suppliers, providing education for transit, providing financial education, fighting
corruption, ensuring gender equality and improving digital inclusion.
Table 3. Benefit themes of the social innovations.
Theme Quantity % Theme Quantity %
Support the community 9 41,0 Education for transit 1 4,5
Enhance professional capacity 3 13,6 Financial education 1 4,5
Partnerships with collectors 2 9,2 Fighting corruption 1 4,5
Mitigate the effects of activities 2 9,2 Gender equality 1 4,5
Local suppliers 1 4,5 Digital inclusion 1 4,5
Source: research data.
Table 4 shows the benefit themes of the environmental innovations of the companies. Note
that environmental innovations can address various topics related to the environment; thus,
Table 4 expresses all the benefits from the changes reported by the companies. Thus, an
innovation can generate more than one benefit. It is worth mentioning that a total of 100 benefits
were identified because of environmental innovations. The relationship of environmental
innovations and their respective benefits can be observed in the Appendix A.
Table 4. Benefit themes of the environmental innovations.
Theme Quantity % Theme Quantity %
Efficiency 20 20 Mitigate environmental impacts 4 4
Electricity 20 20 Environmental certification 3 3
Water 10 10 Environmental education 2 2
Reuse/recycling 8 8 Good habits 1 1
Reduction of GGEs 7 7 Carbon credit 1 1
Supply chains / suppliers 6 6 Biotechnology – genetic improvement 1 1
Waste reduction 6 6 Risk assessment 1 1
Reduction in resource consumption 5 5 Forest recovery 1 1
New products 4 4
Source: research data.
The data show greater attention paid to the search for efficiency and electricity
management. The quest for efficiency in most cases was related to improvements that resulted
in a lower consumption of natural resources and lower impacts of the byproducts and processes
involved. Electricity was positioned as one of the resources that receives most attention from
companies, followed by water. Reuse/recycling was in fourth position, which involves
repurposing the leftovers or waste produced by the activities of the companies. The reduction
of GGEs had seven occurrences. With six occurrences were improving supply chains / suppliers
and ensuring waste reduction. The reduction in resource consumption had five occurrences, and
new products had four occurrences. Environmental certification had three occurrences, while

9 Social and environmental innovations of Brazilian companies
Rev. Ambient. Água vol. 13 n. 2, e2145 - Taubaté 2018
environmental education had two. With one occurrence each were good habits, carbon credit,
biotechnology – genetic improvement, risk assessment and recovery of forests.
The following chapter discusses the survey data using the theoretical framework developed
to support the research.
4. DISCUSSION
The data relating to social innovation indicate that it receives less attention from these
companies than environmental innovation does. The data confirm the embryonic position of
social innovation, as pointed out by Bhatt and Altinay (2013) and Maclean et al. (2013). In this
sense, not only is social innovation research embryonic but the innovation process is also geared
towards social change.
Supporting the community with nine occurrences represented 41% of the social
innovations and was thus positioned as the subject of a greater volume of innovations. This
theme incorporates, in most cases, actions that occur in the surroundings of companies and that
aim to improve the social conditions of people nearby. This position matches the approach of
Chambon et al. (1982), in which social innovation is intended to meet social needs that are not
yet answered satisfactorily, or, as Mulgan (2006) proposes, is intended to meet human needs.
Enhancing professional capacity and creating partnerships with collectors have more-
direct relationships with the need to provide people with their own conditions of subsistence.
In this sense, social innovations are also configured as economic innovations, as proposed by
Kanter (1999). In this case, the author indicates that social innovations offer opportunities for
learning and business development, moving away from philanthropy. Actions to mitigate the
effects of the company’s activities are intended to prevent possible future problems; however,
they are also a form of social innovation, based on the understanding that social conditions
could be better and different, as proposed by Bridgstock et al. (2010).
Other matters dealt with by the companies’ social innovations were quite diluted and
addressed the following topics: local suppliers, education for transit, financial education,
fighting corruption, gender equality and digital inclusion. This diversity of themes converges
with the approach of Cajaiba-Santana (2014), who indicates that social innovation studies are
diluted across different areas. Thus, the great diversity of social innovation studies is probably
due to the multiplicity of subject matters of social innovation.
The accounts of social innovations developed by the companies did not point to obtaining
commercial profit from these – a condition that adheres to the proposal of Dawson and Daniel
(2010), for whom social innovation is developed collaboratively in order to solve social
problems. This context confirms the first hypothesis established by this research.
The environmental innovations identified by the companies were geared towards
efficiency, electricity, water, reuse/recycling, supply chains/suppliers, reduced consumption of
resources, new products, mitigating environmental impacts, environmental education,
biotechnology and the recovery of forests. These are types of sustainable development,
according to the definition provided by Rennings (2000). This context confirms the proposition
of Van den Bergh et al. (2011), that industry relies on innovation to achieve environmental
sustainability.
The data show three companies, indicating their implementation of environmental
certification processes. This was probably related to legal requirements, mainly due to wood
exports. This mirrors the approach of Jorgenson et al. (2009), which highlights the influence of
environmental regulations as a stimulating factor.
It was possible to identify a set of 20 innovations aimed at electricity consumption,
matching the data of Van den Bergh et al. (2011), which highlights the concerns of producers
and consumers with cost in the current context and in the future. Markard et al. (2012) found

Rev. Ambient. Água vol. 13 n. 2, e2145 - Taubaté 2018
10 Celso Machado Junior et al.
that environmental research is focused on socio-technical systems, which focus on electricity,
water and urban transport. This research found that the organizations identified energy and
water as company management elements, but urban transport was not identified. For Coenen
and Díaz Lópes (2010) environmental innovations fall within the socio-technical context but
they expand to a larger universe, which incorporates manufacturing, distribution and
consumption. Thus, this research identified the main forms of environmental innovation as
relating to efficiency, the consumption of electricity and water, reuse/recycling, the reduction
of GGEs, supply chains / suppliers, waste reduction and reducing resource consumption. All of
these actions relate to manufacturing, consumption and distribution. The results obtained
confirmed the second hypothesis.
5. CONCLUSION
This paper proposed to identify Brazilian companies’ social and environmental
innovations. The developed research enabled us to identify several actions of social and
environmental innovations practiced by Brazilian companies. Because the data used in this
study were made available in a trade magazine accessible to any interested party, it can be
inferred that the Brazilian companies disclosed their social and environmental innovations with
this in mind.
Social innovations were presented in a smaller volume and were largely geared towards
meeting the needs of surrounding communities. Social innovation actions also related to
learning and business development, a condition that is far from a philanthropic approach.
Environmental innovations appeared in greater numbers than social innovations did,
connoting a higher stage of attention and interest from Brazilian companies. Environmental
innovations fall within the socio-technical context, with measures to develop or improve
processes and/or resources. Among the topics of interest of the identified environmental
innovations were searches for efficiency, reduced consumption of energy and water,
reuse/recycling, the reduction of GGEs, supply chains / suppliers, reducing waste and reducing
the consumption of resources.
One limitation of this study was the retrieval of data from a single publication. However,
this limitation was due to the scarcity of publications dedicated to the area of sustainable
innovation. This context limited the search for other sources of data.
This study reflects the current stage of social and environmental innovation of companies.
However, because it is a topic of growing interest to companies, this study establishes the merit
for further research to replicate this study in order to identify the progress and expansion of the
interest in the subject. It is worth noting that a possible Brazilian economic contraction and
increased disputes between businesses could result in reduced interest of companies in the issue,
but there remains a need for studies to identify the variations that occur and the possible
causative agents behind these changes.
6. REFERENCES
BARBIERI, J. C.; VASCONCELOS, I. F. G. de; ANDREASSI, T.; VASCONCELOS, F. C.
de. Inovação e sustentabilidade: novos modelos e proposições. Revista de
Administração de Empresas RAE, v. 50, n. 2, p. 146–154, 2010.
BARDIN, L. Análise de conteúdo. 5. ed. Lisboa: Edições 70, 2009.
BHATT, P.; ALTINAY, L. How social capital is leveraged in social innovations under
resource constraints. Management Decision, v. 51, n. 9, p. 1772–1792, 2013.
https://doi.org/10.1108/MD-01-2013-0041

11 Social and environmental innovations of Brazilian companies
Rev. Ambient. Água vol. 13 n. 2, e2145 - Taubaté 2018
BIGNETTI, L. P. As inovações sociais: uma incursão por ideias, tendências e focos de pesquisa.
Ciências Sociais Unisinos, v. 47, n. 1, p. 3–14, 2011. 10.4013/csu.2011.47.1.01
BOUCHARD, M. J. Social innovation, an analytical grid for understanding the social economy:
the example of the Quebec housing sector. Service Business, v. 6, n. 1, p. 47–59, 2012.
https://doi.org/10.1007/s11628-011-0123-9
BRIDGSTOCK, R.; LETTICE, F.; ÖZBILGIN, M. F.; TATLI, A. Diversity management for
innovation in social enterprises in the UK. Entrepreneurship and Regional
Development, v. 22, n. 6, p. 557–574, 2010.
https://doi.org/10.1080/08985626.2010.488404
CAJAIBA-SANTANA, G. Social innovation: moving the field forward: a conceptual
framework. Technological Forecasting and Social Change, v. 82, p. 42–51, 2014.
https://doi.org/10.1016/j.techfore.2013.05.008
CHAMBON, J. L.; DAVID, A.; DEVEVEY, J. M. Les innovations sociales. Paris: Presses
Universitaires de France, 1982.
COENEN, F.; DÍAZ LÓPES, F. J. The greening of the chemical industry: past, present and
challenges ahead. In: SANGHI, R.; SINGH, V. (Eds.). Green Chemistry for
Environmental Remediation. Salem: John Wiley & Sons, 2010. p. 35–78.
DAWSON, P.; DANIEL, L. Understanding social innovation: a provisional framework.
International Journal of Technology Management, v. 51, n. 1, p. 9–21, 2010.
https://doi.org/10.1504/IJTM.2010.033125
DOSI, G. Mudança técnica e transformação industrial. Campinas: Editora da Unicamp,
2006.
FOSTER, C.; HEEKS, R. Conceptualising inclusive innovation: Modifying systems of
innovation frameworks to understand diffusion of new technology to low-income
consumers. The European Journal of Development Research, v. 25, n. 3, p. 333-355,
2013. https://doi.org/10.1057/ejdr.2013.7
GUIA EXAME DE SUSTENTABILIDADE. São Paulo: Abril, 2014.
HOLMES, S.; SMART, P. Exploring open innovation practice in firm-nonprofit
engagements: a corporate social responsibility perspective. R & D Management, v.
39, n. 4, p. 394–409, 2009. 10.1111/j.1467-9310.2009.00569.x
JACOBSSON, S.; BERGEK, A. Innovation system analyses and sustainability transitions:
contributions and suggestions for research. Environmental Innovation and Societal
Transitions, v. 1, n. 1, p. 41–57, 2011. https://doi.org/10.1016/j.eist.2011.04.006
JORGENSON, D.; GOETTLE, R.; SING HOC, M.; WILCOXEN, P. Cap and trade climate
policy and U.S. economic adjustments. Journal of Policy Modeling, v. 31, n. 3, p. 362–
381, 2009.
KANTER, R. M. From spare change to real change: the social sector as beta site for business
innovation. Harvard Business Review, v. 77, n. 3, p. 122–132, 1999.
KEMP, R.; PEARSON, P. (Eds.). Final Report MEI Project about Measuring Eco-
Innovation. Maastricht: University of Maastricht, 2007.

Rev. Ambient. Água vol. 13 n. 2, e2145 - Taubaté 2018
12 Celso Machado Junior et al.
MACLEAN, M.; HARVEY, C.; GORDON, J. Social innovation, social entrepreneurship and
the practice of contemporary entrepreneurial philanthropy. International Small
Business Journal, v. 31, n. 7, p. 747–763, 2013.
https://doi.org/10.1177%2F0266242612443376
MARKARD, J.; RAVEN, R.; TRUFFER, B. Sustainability transitions: an emerging field of
research and its prospects. Research Policy, v. 41, n. 6, p. 955–967, 2012.
https://doi.org/10.1016/j.respol.2012.02.013
MAURER, A. M.; SILVA, T. N. Dimensões analíticas para identificação de inovações
sociais: evidências de empreendimentos coletivos. Brazilian Business Review, v. 11,
n. 6, p. 127–150, 2014.
MULGAN, G. The process of social innovation. Innovations: Technology, Governance,
Globalization, v. 1, n. 2, p. 145–162, 2006.
ORGANIZATION FOR ECONOMIC CO-OPERATION AND DEVELOPMENT - OECD.
Manual de Oslo: diretrizes para coleta e interpretação de dados sobre inovação. 3.
ed. Rio de Janeiro: FINEP, 2005.
RENNINGS, K. Redefining innovation – eco-innovation research and the contribution from
ecological economics. Ecological Economics, v. 32, n. 2, p. 319–332, 2000.
SCHUMPETER, A. Teoria do desenvolvimento econômico: uma investigação sobre lucros,
capital, crédito, juro e ciclo econômico. São Paulo: Nova Cultural, 1997.
https://doi.org/10.1016/S0921-8009(99)00112-3
VAN DEN BERGH J. C. J. M.; TRUFFER, B.; KALLIS, G. Environmental
innovation and societal transitions: introduction and overview.
Environmental Innovation and Societal Transitions, v. 1, n. 1, p. 1–23,
2011. https://doi.org/10.1016/j.eist.2011.04.010

13 Social and environmental innovations of Brazilian companies
Rev. Ambient. Água vol. 13 n. 2, e2145 - Taubaté 2018
Appendix A. Reports highlighted by the companies.
Sector Company Featured Actions Class*
Agribusiness
Bunge
Efficiency, reducing greenhouse gas emissions (GGEs), logistics – invested in logistics,
with a 20% reduction in the route of grain and a 20% reduction in the emission of carbon originating from transport – reduction of 100,000 truck trips. Restrictions on suppliers that
violate environmental and labor standards.
EI
Amaggi Environmental and social certification – invested in international certification to avoid
the risk of having products barred abroad for social or environmental issues. EI
Odebrecht
Agro-
industrial
Supported communities – invested in the training of bricklayers and bakers, to meet labor
shortages in the cities where they are installing their industries. SI
Auto Industry
Volvo
Efficiency, energy, reduction in GGEs, reuse – invested in productive efficiency. Decrease of 63% in the energy needed to manufacture a vehicle and a 50% reduction in
GGEs. Currently, 90% of the waste of raw materials – iron and plastic – is processed at the factory.
EI
Eaton Efficiency, power, water – searched for more-efficient uses of resources, causing a 15%
reduction in water consumption and a 28% reduction in electricity consumption. EI
Capital Goods
Tetra Pak Using sustainable resources – the use of renewable materials in 2014 went from 75% to
82%. Expanded the use of recycled materials in the production process. EI
Weg
Energy efficiency – became one of the first companies in the country to apply
international standards of energy management: ISO50001. A reduction of 13% of
electricity consumption in the assembly lines. EI
Consumer Goods
Unilever Supplier certification – working with its suppliers to achieve the target of 100% of agricultural raw materials having certification of origin by the end of the decade.
EI
Brasil Kirin
Reduction of materials in packaging, collectors – has programs to reduce raw materials
in packaging. In 2013, it saved 4,000 tons of plastic resin. Works with partnership collectors for collecting discarded packaging material.
EI
SI
Coca-Cola Development of poor communities – invested in the development of small-scale suppliers of extractive communities in the Amazon.
SI
Grupo Boticário
Energy efficiency – invested in the efficient use of natural resources. In the reform of its
first plant, it reduced the consumption of electricity by 20%, and its new plant has been
designed with attention to the better use of natural resources.
EI
Kimberly-
Clark
Reduction in water consumption – invested in reducing water consumption in the paper
manufacturing process. In 2013, it needed 5,000 liters of water to produce 1 ton of paper. EI
Natura Efficiency, mitigation, networking – The company proposes a business management that
makes possible a positive impact on the environment. EI
Construction Even
Efficiency, energy, water, mitigation of problems caused by its operations – has a program to alleviate the inconvenience that the construction of its buildings causes for
those who live nearby. Invested in new properties that have a lower consumption of water
and electricity.
EI
SI
Consulting and
IT Management
Promon
Efficiency, water, collectors – specializes in developing environmental solutions with
positive social impacts. Implemented a recycling system that benefits recycling
cooperatives and a closed-loop water system that eliminates the need for the collection and disposal of water.
EI SI
Ecofrotas Carbon credits – developed a methodology that allows the sale of carbon credits with the adoption of ethanol in the car fleet.
EI
EY Sustainable logistics chain – created a methodology for building sustainable supply
chains and applied its knowledge in planning the 2016 Olympics in Rio de Janeiro. EI
Electronics
Philips Efficiency of products – invested in the development of products with higher energy
efficiency and lower costs. One example is LED lamps – the price dropped 70% in two
years.
EI
Embraco Reuse – invested in its business based on the reuse of material that would be discarded. Reused 96% of solid waste from industrial processes.
EI
HP Efficient products and processes, reuse – implemented the circular economy concept and developed partnerships with suppliers to reduce resource consumption and increase
the efficiency of products. Its products were also made more energy efficient.
EI
Schneider
Electric
Supplier development, GGE reduction, supporting the community – developed the sustainability of its suppliers. Reduction in GGEs. Training 15,000 people from
disadvantaged communities through electrician courses.
EI
SI
Whirlpool Water saving – saved water in appliance manufacturing and encouraged consumers to do
the same by purchasing its washing machines. EI
Continue...

Rev. Ambient. Água vol. 13 n. 2, e2145 - Taubaté 2018
14 Celso Machado Junior et al.
Continued...
Energy
AES Brasil Sustainable energy – diversified its sources of power generation. Installed solar plants with
hydroelectric plants to take advantage of the structure. It aimed to double the capacity of its power generation via sustainable energy by 2016.
EI
Ampla Electricity consumption hours – by 2015, it aimed for customers in the city of Buzios to be
able to choose appropriate tariffs based on their spending habits. EI
Coele
Consumer awareness, supporting communities – implemented programs offering discounts
in exchange for recyclable waste and the replacement of inefficient electric appliances.
Encouraged customers to use less electricity.
EI
CPFL
Energia
Alternative energy – expanded investments in renewable sources of electricity and imposed
sustainability goals for its executives. EI
EPD
Energy, supporting communities – invested 430 million reais (162 million dollars as of
December 31, 2014) in social and environmental programs in communities affected by its new hydroelectric plants.
EI
SI
Elektro Local suppliers – promoted the economy in its concession areas. In 2014, 75% of business
was done with local partners. SI
Itaipu
Binacional
Use of electricity – invested in sustainable forms of electricity use. Supported the development
of electric cars. EI
Light Reduction in energy theft – invested in the fight against energy theft, which drains 16% of the
energy distributed by the company in Rio de Janeiro. EI
Hotels Grupo Rio Quente
Environmental education – educational programs are the foundation of the sustainability policy of Rio Quente Group. Sourced alternative energy – heating shower water was done by
solar panels.
EI
Infrastructure
CCR Education for transit – has a program that contributes to training future drivers and decreasing accident rates on the roads.
SI
Ecoro-dovias Energy efficiency – its road modernization includes energy efficiency with the introduction of
LED lamps and solar panels. EI
Financial
Institutions
Itaú
Unibanco Financial education – offered financial education for internal employees and business clients
in order to reduce default rates. SI
Bradesco Investment in technology – invested in digital channels to keep customers away from the
rows of bank tellers. The cost of digital transactions is 5% of that in banks.
Grupo BB
and Mapfre
Risk assessment in contracts, reduction of resources – included sustainability issues in risk
assessments. It simplified the terms of the contracts, reducing paper usage by 88%. EI
HSBC Fighting corruption – improved its internal controls and trained employees to prevent bribery
cases. SI
Construction
Materials
Masisa Integration of suppliers, professional training – achieved integration of the supply chain by
establishing a focus on sustainability. It operated in the training of professionals in the area and the growth of the furniture sector.
EI SI
Duratex Waste reduction – aimed to reduce industrial waste sent to landfill. In 2013, it recycled 33%
of its waste. EI
Mining and Steel Mills
Arcelor-
mittal
Energy efficiency, water consumption, reduction of GGEs – initiated a project to take advantage of the gases from the burning charcoal used in the production process to generate
electricity. Achieved GGE reduction. Reused and treated water.
EI
Alcoa Forest recovery – invested in a mined area rehabilitation technique in Pará and created an alternative income for the community.
EI SI
AngloGold
Ashanti
Water saving – its wastewater treatment facility in underground mining helped to save water,
achieving a 7% rate of water reuse and a 58% reduction in the volume of water pumped. EI
Aperam Waste reduction, efficiency – in six years, the steel mill Aperam halved the generation of
waste in the manufacture of steel. The goal was to clear the remains of the production process. EI
Vale
Efficiency, reducing consumption of natural resources – aimed to extract iron ore while
having a minimal impact on the environment. In the new plant, there was a 90% reduction in
the volume of water used. Ore transportation was done by electric mats, not by 300 trucks. EI
Voto-rantim
Metais
Efficiency, waste reduction, supporting the community, public managers – invested in
recycling electric arc furnace dust, the main waste generated in its plants. The goal is zero
waste from productive activity by 2020. The Forest Ecos program focuses on developing
public awareness and training entrepreneurs and managers.
EI
SI
Yamana Efficiency, reduced energy consumption – the company’s strategy was to streamline costs,
seek efficiency and reduce electric and diesel power consumption. EI
Continue…

15 Social and environmental innovations of Brazilian companies
Rev. Ambient. Água vol. 13 n. 2, e2145 - Taubaté 2018
Source: Authors based on Guia Exame de Sustentabilidade (2014).
Notes: Class* = classification: EI or SI.
SME: Small and medium enterprises.
Continued…
Paper and Cellulose
Fibria
Efficiency, waste reduction, supporting the surrounding community – invested in biotechnology in the genetic improvement of eucalyptus in order to reduce the area
planted. Reduced solid waste going to landfill. It has social actions aimed at improving
the lives of neighboring communities.
EI
SI
Klabin
Environmental certification – invested in FSC (Forest Stewardship Council)
certification of good practices in forest management for small providers acting in the
form of associations. EI
Chemistry
Beraca Social project – developed a project to support low-income communities in Piauí through access to clean water and education.
SI
Basf
Efficiency, reducing consumption – performed a review of the processes of its unit in
São Bernardo do Campo to improve the consumption of water and electricity and to reduce environmental impacts, waste generation and GGEs.
EI
Braskem
Product innovation – invested 200 million reais (75 million dollars as of December 31,
2014) in the year to drive innovation in green products. Developed raw materials derived from sugar cane to replace oil.
EI
Dow Brasil Product innovation – developed a filter system that promises to reduce water treatment
costs by 40%. The technology began to be used on the São Paulo coast. EI
White
Martins
Product innovation, efficiency – developed products and services to increase the
efficiency of its customers. It has also internally acted to increase its efficiency. EI
Health Services
Sabin Female work – supported female-dominated labor with constant training. SI
Fleury Group
Employee training – encouraged employees to give suggestions to improve business
processes. In 2013, the program generated savings of 4 million reais (1.5 million dollars
as of December 31, 2014).
SI
Albert
Einstein
Hospital
Supporting needy communities – the hospital provided care to more than 10,000 children in the second largest slum in São Paulo.
SI
Sírio-Libanês
Hospital
Reducing the impacts of activities – adopted an international agenda to reduce the
impact of its activities in ten themes, including sustainable construction technologies,
green hospitals and a health-based international network. EI
Telecommunications
Algar Telecom
Environmental design, supplier development – developed a recycling project that
combines environmental, educational and social objectives. Collected banners and
transformed them into school materials, which were then donated to the public. It ensured its suppliers were committed to sustainability.
EI SI
Telefônica
Vivo
Digital inclusion – provided Internet access to rural schools. In 2014, its digital
inclusion program benefited 4,000 rural schools. The goal was to connect 22,000 rural
schools. SI
Transportation and
Logistics
Libra
Group
GGE reduction, replacing diesel with electricity – invested in electrical equipment for
the transport of loads to reduce the GGEs in port operations. EI
SMEs Zanzini Relationships with society, recycling – invested in relationships with social actors and
the use of recycled materials.
EI SI

Ambiente & Água - An Interdisciplinary Journal of Applied Science
ISSN 1980-993X – doi:10.4136/1980-993X
www.ambi-agua.net
E-mail: [email protected]
This is an Open Access article distributed under the terms of the Creative Commons
Attribution License, which permits unrestricted use, distribution, and reproduction in any
medium, provided the original work is properly cited.
Surface albedo in different land-use and cover types in Amazon forest
region
ARTICLES doi:10.4136/ambi-agua.2120
Received: 04 Apr. 2017; Accepted: 20 Jan. 2018
Thiago de Oliveira Faria1; Thiago Rangel Rodrigues2*;
Leone Francisco Amorim Curado1; Denilton Carlos Gaio1; José de Souza Nogueira1
1Universidade Federal de Mato Grosso (UFMT), Cuiabá, MT, Brasil
Programa de Pós-Graduação em Física Ambiental. E-mail: [email protected],
[email protected], [email protected], [email protected] 2Universidade Federal do Mato Grosso do Sul (UFMS), Campo Grande, MS, Brasil
Laboratório de Ciências Atmosféricas (LCA). E-mail: [email protected] *Corresponding author
ABSTRACT Albedo is the portion of energy from the Sun that is reflected by the earth's surface, thus
being an important variable that controls climate and energy processes on Earth. Surface albedo
is directly related to the characteristics of the Earth’s surface materials, making it a useful
parameter to evaluate the effects of original soil cover replacement due to human occupation.
This study evaluated the changes in the surface albedo values due to the conversion of
vegetation to other land uses and to analyze the applicability of the use of albedo in the spatial
delimitation of land-use classes in the transitional region between the Cerrado and Amazon
biomes. Surface albedo measurements were obtained from processing of Landsat Thematic
Mapper data in the Geographic Information System (GIS), and land-use information were
collected using Google Earth high-resolution images. The results show that human activities
such as the cultivation of crops and burning have contributed substantially to variations in the
surface albedo, and that albedo estimates from Landsat imagery have the potential to help in
the recognition and delimitation of features of land use and cover.
Keywords: Landsat 5, reflectance, remote sensing.
Albedo de superfície em diferentes classes de uso e cobertura do solo
em região de floresta amazônica
RESUMO Albedo é a porção de energia solar refletida pela superfície terrestre, sendo assim, uma
importante variável que controla os processos climáticos e energéticos sobre a Terra. Albedo
da superfície está diretamente relacionado com as características dos materiais da superfície da
Terra, tornando-se um parâmetro útil para avaliar os efeitos da substituição de cobertura do solo
original devido à ocupação humana. Este estudo objetivou avaliar as alterações nos valores de
albedo da superfície em função da conversão da vegetação em outras formas de uso do solo, e
analisar a aplicabilidade do uso do albedo na delimitação espacial de classes de uso do solo em
região de transição entre os biomas Cerrado e Amazônia. As medidas de albedo da superfície
foram obtidas a partir de processamento de dados Landsat Thematic Mapper em sistema SIG e
as informações de uso do solo foram obtidas usando imagem de alta resolução do Google Earth.

Rev. Ambient. Água vol. 13 n. 2, e2120 - Taubaté 2018
2 Thiago de Oliveira Faria et al.
Os resultados demonstram que ações antrópicas sobre a superfície, como desenvolvimento de
lavouras e queimadas contribuem substancialmente para as mudanças no albedo de superfície,
e que as estimativas de albedo a partir de imagens Landsat apresentam potencial para auxiliar
na identificação e delimitação de feições de uso e cobertura do solo.
Palavras-chave: Landsat 5, reflectância, sensoriamento remoto.
1. INTRODUÇÃO
The Amazon rainforest exchanges large amounts of water and energy with the atmosphere,
and is therefore important in controlling the regional and global climate (Meir and Grace, 2005).
However, the spatial distribution and temporal variation of rainfall (Curado et al., 2016), as
well as duration of droughts (Rodrigues et al., 2016a), can have a profound impact on the
dynamics of energy exchange by affecting the partitioning of energy between sensible and
latent heat fluxes (Vourlitis et al., 2008; 2014; Rocha et al., 2009; Rodrigues et al., 2013; 2014).
Because our current knowledge of the climate system is still insufficient to solve some of the
divergent predictions about this topic, it is important to improve the understanding of
mechanisms of vegetation-climate interaction in forested regions such as the Amazon
(Gonçalves et al., 2013), whose seasonal patterns of certain biophysical and climatic parameters
show complex interactions (Vourlitis et al., 2014; Rodrigues et al., 2016b).
The process of agricultural expansion and deforestation taking place in the Amazon,
mainly in the region known as the ‘Arch of Deforestation’, has resulted in more intensive land-
use and forest disturbance as a consequence of the conversion of original vegetation to different
forms of land use and cover (Neeff et al., 2005; Soares-Filho et al., 2006; Costa and Pires,
2010).
One of the biophysical parameters influenced by the modification of original vegetation in
forested regions is the surface albedo, which is the fraction of incident radiation reflected by a
surface that acts as a factor for distribution of solar radiation and energy flow between the
surface and atmosphere (Wang et al., 2006; Novais et al., 2015). Albedo is a parameter that
varies both spatially and temporally given changes in surface properties, such as soil moisture
and vegetation cover as well as changes in local natural light conditions (Franch et al., 2014).
It influences the prediction of variables like near-surface temperature and relative humidity
(Boussetta et al., 2015). Studies relating landscape features to land cover transformation may
help in the understanding and planning of changes in landscape conditions over time, including
projections of future land use as well as comparisons between alternative landscape scenarios
(Paudel and Yuan, 2012; Swann et al., 2015).
Strongly influenced by anthropic occupation affecting land use in originally natural
environments, the surface albedo is a parameter that both influences the radiation balance and
modifies the absorption of shortwave radiation (Betts et al., 2007).
Thus, studies on albedo changes as a consequence of modifications in land use and land
cover may contribute to the understanding of impacts resulting from human-environment
interaction (Barnes et al., 2013; Boisier et al., 2013). There are still many regions, such as the
Amazon region of the Brazilian state of Mato Grosso (Schwaiger and Bird, 2010), that require
further investigation of the effects caused by land use and cover, since this region has
experienced an expansion in economic activity over the last decades (Roberts et al., 2003).
Remote-sensing techniques can contribute to obtaining different information about the
earth’s surface in relatively large areas (Ban-Weiss et al., 2015) by allowing, for example, the
investigation of albedo variations along different land-use and cover scenarios (Gao et al.,
2014). Some researchers have explored the advantages of the use of biophysical parameters
from satellite imagery in studies in the vast territory of the Brazilian Amazon. Some examples
3 Surface albedo in different land-use …
Rev. Ambient. Água vol. 13 n. 2, e2120 - Taubaté 2018
of this are the publications of Tartari et al. (2015), Querino et al. (2016), and Silva et al. (2016),
who used surface albedo among the investigated parameters. Such studies have increased the
level of knowledge of the interactions between the Earth's surface and the atmosphere in this
important biome.
Taking into account that albedo presents specific values for certain classes of land use and
land cover (Wickham et al., 2015), it is possible to evaluate the effectiveness of this parameter
in the identification and distinction of different forms of land use and occupation in order to
promote future work on land-use evolution (Salifu and Agyare, 2012).
Although there are many studies showing the applicability of medium spatial resolution
images in surface albedo behavior due to changes in land use classes, there are still very few
studies evaluating the use of surface albedo in distinguishing land-use classes. Among the few
studies with this focus, Salifu and Agyare (2012) showed that the use of surface albedo offers
potential to distinguish different land-use and cover types in Volta Basin region, Ghana.
This study evaluated the effect of conversion of native forest to different types of land use
and cover (LUC) on the surface albedo values in the Amazon-Cerrado transition region, as well
as the applicability of surface albedo to the identification and delimitation of different land-use
classes.
2. MATERIALS AND METHODS
2.1. Study Area
The total study area encompasses approximately 20,000 ha and is located between the
towns of Ipiranga do Norte and Sorriso, a region of Amazon-Cerrado transition in northern
Mato Grosso (Figure 1). The selected area shows several types of land use and presents an
opportunity to perform studies on the behavior of biophysical variables in the different classes
of land use from satellite imagery.
2.2. Image Pre-Processing
Land-use and cover data were collected and analyzed with high spatial resolution images
from Google Earth Pro®, and albedo measurements of different land-use classes were retrieved
from Landsat-5 TM. Thus, the study required combining images with the same date from
Landsat and Google Earth Pro® to allow comparison of the results. The date of 30 September
2009 was selected as there were images available both from Google Earth Pro® and from
Landsat-5 TM. Therefore, the results of this study refer to this date.
The image from the Google Earth Pro® software was acquired at the maximum resolution
and then georeferenced using a high-resolution SPOT image through control points in both
images. The Landsat-5 TM image used corresponds to the orbit and Point 227/68 in the Landsat
Universal Reference System, and was acquired from the website espa.cr.usgs.gov, which
provides a surface reflectance image that had undergone atmospheric correction and is cloud-
free.
2.3. Surface albedo survey
The surface albedo estimates were calculated according to Liang (2001), who establishes
equations for several orbital sensors that allows calculating the albedo through simulations of
radiation transport using MODTRAN (Moderate Resolution Atmospheric Transmission). This
work applies Equation 1 to Thematic Mapper (TM) images.
Albedo = 0.356𝛼1 + 0.130𝛼3 + 0.373𝛼4 + 0.085𝛼5 + 0.072𝛼7 − 0.0018 (1)
In which αi corresponds to the surface reflectance that is intrinsic to the bands “i” of the
sensor Landsat-5 TM.

Rev. Ambient. Água vol. 13 n. 2, e2120 - Taubaté 2018
4 Thiago de Oliveira Faria et al.
Figure 1. Top left: State of Mato Grosso in mid-western Brazil;
Top right: towns of Sorriso and Ipiranga do Norte; Bottom: study
area.
2.4. Land use and land cover
In order to identify and outline the types of soil use and cover, a high-resolution image
dated 30 September 2009 was obtained from the Google Earth Pro® software for which
vectorization class was later carried out using ArcGIS 10.1® at a scale of 1:5,000.
The following classes of land use and cover were considered for the study area: crop,
forest, burned area and water. Crop areas were targeted through characteristic polygons that
occur in the region in the form of squares, rectangles and circles in which the cultivation process
is carried out. This class was not distinguished in terms of the different steps involved in the
production process, such as planting and harvesting. The class mapped as forest corresponds to
areas of dense vegetation, with visual appearance similar to those of the Amazon forest
observed in high-spatial resolution images. The burned-area class is identified due to the
characteristic visual appearance of an area that underwent combustion in which several band
compositions of the Landsat-5 TM were further attempted following the procedures of Roza
and Ribeiro (2013). Water areas are represented especially by water courses and abandoned
meander channels.
The analysis of the surface albedo in each one of the classes of land use and occupation
was carried out at a scale of 1: 25,000, and all the geoprocessing routines were performed using
the ArcGIS 10.1® software.

5 Surface albedo in different land-use …
Rev. Ambient. Água vol. 13 n. 2, e2120 - Taubaté 2018
3. RESULTS AND DISCUSSION
Land-use and land-cover mapping shows a large predominance of crop and forest classes
(Figure 2) that occupies 48.75 and 47.45% of the total study area, respectively. Burned areas
and water bodies occupy a more restricted portion of the study area, making up 2.74 and 1.06%,
respectively.
Figure 2. Soil use and soil cover.
Burned area mapping included analysis of false-color composites (RGB: 4,3,1) and (RGB:
5,4,3) of Landsat-5 TM, which allowed recognition of burned areas through dark (almost black)
and purple tones, respectively, according to the criteria adopted by Roza and Ribeiro (2013) to
identify burned areas using Landsat-5 TM images.
Figure 3 shows the surface albedo map of the study area with color-coded values. This
map has an overall mean of 0.153 and a standard deviation of 0.021.

Rev. Ambient. Água vol. 13 n. 2, e2120 - Taubaté 2018
6 Thiago de Oliveira Faria et al.
Figure 3. Surface albedo.
Summary statistics with mean, median and standard deviation of the surface albedo for
each land use class are shown in Table 1. Figure 4 presents a box-plot of the summary statistics
of the surface albedo for all classes of land use.
Table 1. Summary statistics of surface albedo for the classes
of soil use and cover.
Land use and cover Mean Median Standard Deviation
Crop 0.163 0.164 0.013
Forest 0.142 0.140 0.011
Burned area 0.094 0.090 0.010
Water 0.083 0.075 0.029

7 Surface albedo in different land-use …
Rev. Ambient. Água vol. 13 n. 2, e2120 - Taubaté 2018
Figure 4. Box-plot showing summary statistics of surface albedo in each land
use class.
The regions occupied by forests presented a mean albedo value of 14.2%, which is similar
to that of albedo of tropical rainforests (Berbet and Costa, 2003; Querino et al., 2006; Liberato,
2011). The results indicate that the variation of the albedo values for forest is relatively low,
suggesting that forest has albedo with substantially homogeneous behavior in the study area.
The small variation of albedo values for forest regions can be caused by variation of vegetation
types in this class of land use.
The mean albedo of the crop areas was 16.7%, which represents the highest mean among
the classes of land use and cover. This land use class showed a large range between the values
of albedo, which can be due to the presence of different stages of agricultural production in the
study area, such as planting and harvesting.
The burned area was the class that presented the lowest variation of surface albedo values,
and its standard deviation was 1.0%. The mean albedo for burned area was of 9.4%, which is
significantly lower than the classes of crop and forest. This low value is explained by the
decrease in reflectance due to the loss of photosynthetically active material and by the
accumulation of ashes on the soil (Cardozo et al., 2014).
Albedo values for burned areas vary according to the time elapsed after burning, but the
mean value found in this study is relatively similar to the values for burned areas identified by
other authors, although for different types of vegetation. Pereira et al. (2007) found a mean
albedo value of 9.3% for recently burned areas in the Pantanal region of Mato Grosso do Sul,
whereas Cardozo et al. (2014) identified a mean albedo value of 6% for burned areas in the
state of Rondônia.
The water class shows a mean albedo value of 8.3%, which is the lowest value among all
of the land-use classes studied. This value is within the range found by other authors (Giongo
et al., 2010; Liberato, 2011). The water class presented a standard deviation (2.9%) and
variation of albedo values significantly higher than the other studied classes. The highest
standard deviation is largely due to pixel contamination given the limited spatial resolution of
Landsat images. This was mainly observed in the area of the Rio Branco River, an affluent of
the Rio Verde River, whose mean width is around 20 meters and, therefore, below the spatial
resolution of Landsat TM images used in the study. The appearance of mixed pixels is a
consequence of albedo values influenced by other features of the terrain other than water.
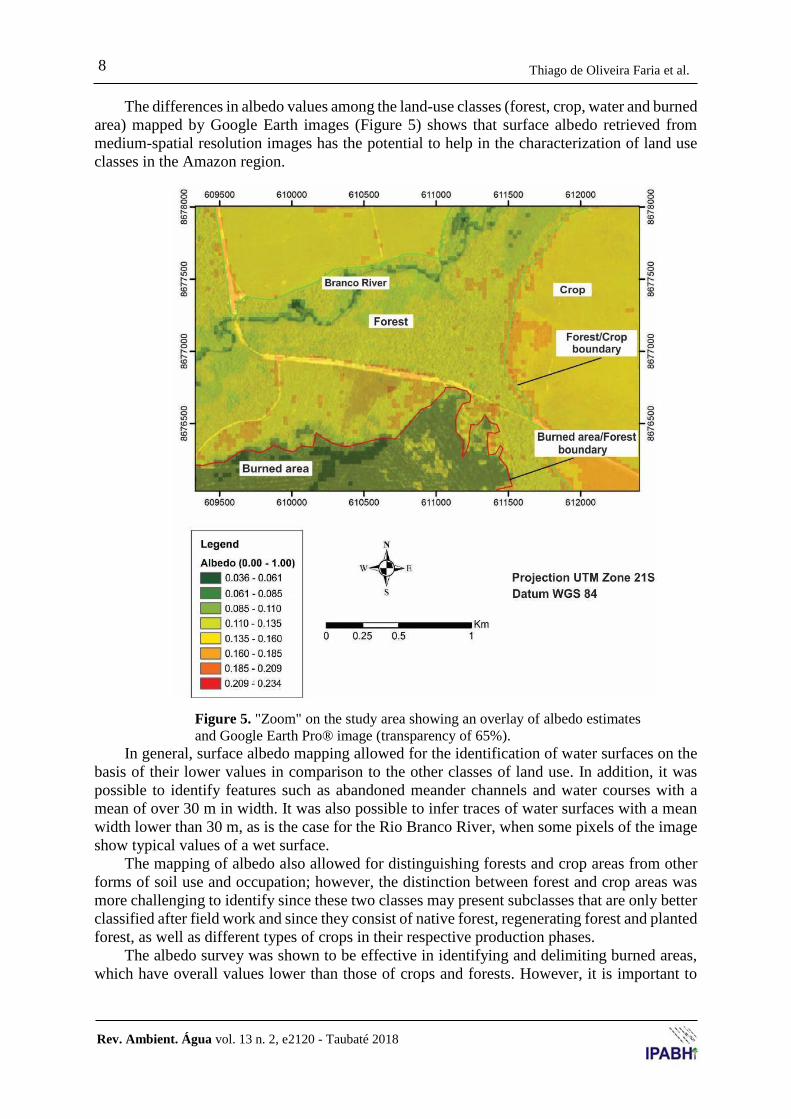
Rev. Ambient. Água vol. 13 n. 2, e2120 - Taubaté 2018
8 Thiago de Oliveira Faria et al.
The differences in albedo values among the land-use classes (forest, crop, water and burned
area) mapped by Google Earth images (Figure 5) shows that surface albedo retrieved from
medium-spatial resolution images has the potential to help in the characterization of land use
classes in the Amazon region.
Figure 5. "Zoom" on the study area showing an overlay of albedo estimates
and Google Earth Pro® image (transparency of 65%).
In general, surface albedo mapping allowed for the identification of water surfaces on the
basis of their lower values in comparison to the other classes of land use. In addition, it was
possible to identify features such as abandoned meander channels and water courses with a
mean of over 30 m in width. It was also possible to infer traces of water surfaces with a mean
width lower than 30 m, as is the case for the Rio Branco River, when some pixels of the image
show typical values of a wet surface.
The mapping of albedo also allowed for distinguishing forests and crop areas from other
forms of soil use and occupation; however, the distinction between forest and crop areas was
more challenging to identify since these two classes may present subclasses that are only better
classified after field work and since they consist of native forest, regenerating forest and planted
forest, as well as different types of crops in their respective production phases.
The albedo survey was shown to be effective in identifying and delimiting burned areas,
which have overall values lower than those of crops and forests. However, it is important to

9 Surface albedo in different land-use …
Rev. Ambient. Água vol. 13 n. 2, e2120 - Taubaté 2018
pinpoint that a reliable interpretation of burned areas requires a complementary analysis using
band composites able to highlight this soil cover class.
Therefore, the results showed that the estimation of surface albedo from orbital sensors,
which was calculated according to Liang (2001), in combination with the resulting
interpretation of band combinations as proposed by Roza and Ribeiro (2013), favors the
identification and delimitation of burned areas in forests of the Amazon-Cerrado transition
region.
The comparison between surface albedo values calculated for forests and crop classes
shows that the conversion of forests to agriculture produced an albedo increase of 0.025. This
increase due to large-scale deforestation, as suggested by other studies (Culf et al., 1996;
Giambelluca et al., 1997), tends to have a direct effect on the radiation budget and energy
partition given the lower amount of energy absorbed by the earth's surface.
4. CONCLUSIONS
The values of albedo surveyed for classes of soil use and cover in the Amazon-Cerrado
boundary in Mato Grosso are reasonably similar to those found in the literature in previous
studies. Concerning areas of crops and forests, due to their heterogeneity there may be areas
where the boundary between these two classes is difficult to establish using only albedo
estimates. However, as a rule-of-thumb, crops have significantly higher albedo values than
those of forest areas and other land-use classes studied here.
The albedo estimates calculated from the Landsat image show a significant potential to
help in the identification and delimitation of anthropic and natural features in the Amazon-
Cerrado transition region once the classes of soil use and cover have distinctive albedo values
that allows them to be distinguished from each other using medium-spatial resolution
images.Among the classes considered in this study, albedo estimates were more effective to
spot burned areas as well as water features, such as abandoned meander channels and water
courses, especially when these features have a mean width of over 30 meters.
5. ACKNOWLEDGEMENTS
The research was supported by the Universidade Federal de Mato Grosso (UFMT),
Programa de Pós Graduação em Física Ambiental (PPGFA) IF/UFMT, Coordenação de
Aperfeiçoamento de Pessoal do Ensino Superior (CAPES) and Conselho Nacional de
Desenvolvimento Científico e Tecnológico (CNPq) for financial support to the research project:
CNPq/407998/2016-0 and CNPq/424915/2016-2.
6. REFERENCES
BAN-WEISS, G. A.; WOODS, J.; LEVINSON, R. Using remote sensing to quantify albedo of
roofs in seven California cities, Part 1: Methods. Solar Energy, v. 115, p. 777-790, 2015.
https://doi.org/10.1016/j.solener.2014.10.022
BARNES, C. A.; ROY, D. P.; LOVELAND, T. R. Projected surface radiative forcing due to
2000–2050 land-cover land-use albedo change over the eastern United States. Journal of
Land Use Science, v. 8, n. 4, p. 369-382, 2013.
BERBET, M. L. C.; COSTA, M. H. Climate change after tropical deforestation: seasonal
variability of surface albedo and its effects on precipitation change. Journal of Climate,
v. 16, p. 2099-2104, 2003. https://doi.org/10.1175/1520-
0442(2003)016%3C2099:CCATDS%3E2.0.CO;2

Rev. Ambient. Água vol. 13 n. 2, e2120 - Taubaté 2018
10 Thiago de Oliveira Faria et al.
BETTS, R. A.; FALLOON, P. D.; GOLDEWIJK, K. K.; RAMANKUTTY, N. Biogeophysical
effects of land use on climate: Model simulations of radiative forcing and large-scale
temperature change. Agricultural and Forest Meteorology, v. 142, n. 2-4, p. 216-233,
2007. https://doi.org/10.1016/j.agrformet.2006.08.021
BOISIER, J. P.; DE NOBLET-DUCOUDRÉ, N.; CIAIS, P. Inferring past land use-induced
changes in surface albedo from satellite observations: a useful tool to evaluate model
simulations. Biogeosciences, v. 10, n. 3, p. 1501-1516, 2013.
http://dx.doi.org/10.5194/bgd-9-12505-2012
BOUSSETTA, S.; BALSAMO, G.; DUTRA, E.; BELJAARS, A.; ALBERGEL, C.
Assimilation of surface albedo and vegetation states from satellite observations and their
impact on numerical weather prediction. Remote Sensing of Environment, v. 163, p.
111-126, 2015. https://doi.org/10.1016/j.rse.2015.03.009
CARDOZO, F. D. S.; PEREIRA, G.; SHIMABUKURO, Y. E.; MORAES, E. C. Análise das
mudanças dos parâmetros físicos da superfície derivados das queimadas no estado de
Rondônia. Boletim de Ciências Geodésicas, v. 20, n. 4, p. 830-854, 2014.
COSTA, M. H.; PIRES, G. F. Effects of Amazon and Central Brazil deforestation scenarios on
the duration of the dry season in the arc of deforestation. International Journal of
Climatology, v. 30, n. 13, p. 1970-1979, 2010. http://dx.doi.org/10.1002/joc.2048
CULF, A. D.; ESTEVES, J. L.; MARQUES FILHO, A. O.; ROCHA, H. R. Radiation,
temperature and humidity over forest and pasture in Amazonia. In: NOBRE, C. A.;
ROBERTS, J. R.; VICTORIA, R. L. Amazonian deforestation and climate. New York:
John Wiley & Sons, 1996. p. 175-191.
CURADO, L. F. A.; MUSIS, C. R.; CUNHA, C. R.; RODRIGUES, T. R.; PEREIRA, V. M.
R.; NOGUEIRA, J. S. et al. Modeling the reflection of Photosynthetically active radiation
in a monodominant floodable forest in the Pantanal of Mato Grosso State using
multivariate statistics and neural networks. Anais da Academia Brasileira de Ciências,
v. 88, p. 1387-1395, 2016. http://dx.doi.org/10.1590/0001-3765201620150176
FRANCH, B.; VERMOTE, E. F.; CLAVERIE, M. Intercomparison of Landsat albedo retrieval
techniques and evaluation against in situ measurements across the US SURFRAD
network. Remote Sensing of Environment, v. 152, p. 627-637, 2014.
https://doi.org/10.1016/j.rse.2014.07.019
GAO, F.; HE, T.; WANG, Z.; GHIMIRE, B.; SHUAI, Y.; MASEK, J. et al. Multiscale
climatological albedo look-up maps derived from moderate resolution imaging
spectroradiometer BRDF/albedo products. Journal of Applied Remote Sensing, v. 8, n.
1, 2014. https://doi.org/10.1117/1.JRS.8.083532
GIAMBELLUCA, T. W.; HÖLSCHER, D.; BASTOS, T. X.; FRAZÃO, R. R.; NULLET, M.
A.; ZIEGLER, A. D. Observations of albedo and radiation balance over post-forest land
surfaces in the eastern Amazon Basin. Journal of Climate, v. 10, n. 5, p. 919-928, 1997.
https://doi.org/10.1175/1520-0442(1997)010%3C0919:OOAARB%3E2.0.CO;2
GIONGO, P. R.; MOURA, G. B. D. A.; SILVA, B. B.; ROCHA, H. R.; MEDEIROS, S. R. R.
de.; NAZARENO, A. C. Albedo à superfície a partir de imagens Landsat 5 em áreas de
cana-de-açúcar e cerrado. Revista Brasileira de Engenharia Agrícola e Ambiental, v.
14, n. 3, p. 279-287, 2010. http://producao.usp.br/handle/BDPI/11493

11 Surface albedo in different land-use …
Rev. Ambient. Água vol. 13 n. 2, e2120 - Taubaté 2018
GONÇALVES, L. G. G.; BORAK, J. S.; COSTA, M. H.; SALESKA, S. R.; BAKER, I.;
RESTREPO-COUPE, N. et al. Overview of the large-scale biosphere-atmosphere
experiment in amazonia data model intercomparison project (LBA-DMIP). Agricultural
and Forest Meteorology, v. 182-183, p. 111-127, 2013.
https://doi.org/10.1016/j.agrformet.2013.04.030
LIANG, S. Narrowband to broadband conversions of land surface albedo I: Algorithms.
Remote Sensing of Environment, v. 76, n. 2, p. 213-238, 2001.
https://doi.org/10.1016/S0034-4257(00)00205-4
LIBERATO, A. M. Albedo à superfície a partir de imagens Landsat 5 - TM m áreas de floresta
em pastagem na Amazônia. Revista de Geografia (UFPE), v. 28, n. 1, p. 110-119, 2011.
MEIR P.; GRACE, J. The response to drought by tropical rain forest ecosystems. In: MALHI,
Y.; PHILIP, O. L. (Eds.). Tropical forests and global climate change. Oxford: Oxford
University Press, 2005. p.75-84.
NEEFF, T.; GRAÇA, P. M. de A., DUTRA, L. V.; FREITAS, C. da C. Carbon budget
estimation in Central Amazonia: Successional forest modeling from remote sensing data.
Remote Sensing of Environment, v. 94, p. 508-522, 2005.
https://doi.org/10.1016/j.rse.2004.12.002
NOVAIS, J. W. Z.; SANCHES, L.; MACHADO, N. G.; SILVA, L. B.; AQUINO, A. M.;
RODRIGUES, T. R. Variação horária e sazonal da radiação solar incidida e refletida e
suas relações com variáveis micrometeorológicas no pantanal norte mato-grossense.
Revista Brasileira de Ciências Ambientais, v. 38, p. 96-108, 2015.
http://dx.doi.org/10.5327/Z2176-947820150053
PAUDEL, S.; YUAN, F. Assessing landscape changes and dynamics using patch analysis and
GIS modeling. International Journal of Applied Earth Observation and
Geoinformation, v. 16, p. 66-76, 2012. https://doi.org/10.1016/j.jag.2011.12.003
PEREIRA, G.; MORAES, E. C.; ARAI, E.; OLIVEIRA, L. G. L. Estudo preliminar da
estimativa da reflectância e albedo de microssistemas pantaneiros a partir de imagens de
satélite. Revista Brasileira de Cartografia, v. 59, n. 01, p. 55-61, 2007.
QUERINO, C. A. S.; MOURA, M. A. L.; LYRA, R. F. DA F.; MARIANO, G. L. Avaliação e
comparação de radiação solar global e albedo com ângulo zênital na região amazônica.
Revista Brasileira de Meteorologia, v. 21, n. 3a, p. 42-49, 2006.
QUERINO, C. A. S.; BENEDITTI, C. A.; MACHADO, N. G.; SILVA, M. J. G.; QUERINO,
J. K. A. S.; SANTOS NETO, L. A. et al. Spatiotemporal NDVI, LAI, albedo, and surface
temperature dynamics in the southwest of the Brazilian Amazon forest. Journal of
Applied Remote Sensing, v. 10, n. 2, 2016. http://dx.doi.org/10.1117/1.JRS.10.026007
ROBERTS, A.; KELLER, M.; SOARES, J. V. Studies of land-cover, land-use, and biophysical
properties of vegetation in the Large Scale Biosphere Atmosphere experiment in
Amazônia. Remote Sensing of Environment, v. 87, n. 4, p. 377-388, 2003.
https://doi.org/10.1016/j.rse.2003.08.012
ROCHA, H. R. DA; MANZI, A. O.; CABRAL, O. M.; MILLER, S. D.; GOULDEN, M. L.;
SALESKA, S. R. et al. Patterns of water and heat flux across a biome gradient from
tropical forest to savanna in Brazil. Journal of Geophysical Research, v. 114, n. 1, p.
01-08, 2009. http://dx.doi.org/10.1029/2007JG000640

Rev. Ambient. Água vol. 13 n. 2, e2120 - Taubaté 2018
12 Thiago de Oliveira Faria et al.
RODRIGUES, T. R.; PAULO, S. R. de.; NOVAIS, J. W. Z.; CURADO, L. F. A.; NOGUEIRA,
J. S.; OLIVEIRA, R. G. et al. Temporal Patterns of Energy Balance for a Brazilian
Tropical Savanna under Contrasting Seasonal Conditions. International Journal of
Atmospheric Sciences, v. 2013, n. JUNE, p. 1-9, 2013.
http://dx.doi.org/10.1155/2013/326010
RODRIGUES, T. R.; VOURLITIS, G. L.; LOBO, F. A.; OLIVEIRA, R. G.; NOGUEIRA, J.
D. S. Seasonal variation in energy balance and canopy conductance for a tropical savanna
ecosystem of south central Mato Grosso, Brazil. Journal of Geophysical Research:
Biogeosciences, v. 119, n. 1, p. 1-13, 2014. http://dx.doi.org/10.1002/2013JG002472
RODRIGUES, T. R.; VOURLITIS, G. L.; LOBO, F. A.; SANTANNA, F. B.; ARRUDA, P. H.
Z; NOGUEIRA, J. S. Modeling canopy conductance under contrasting seasonal
conditions for a tropical savanna ecosystem of south central Mato Grosso, Brazil.
Agricultural and Forest Meteorology, v. 218-219: p. 218-229, 2016a.
https://doi.org/10.1016/j.agrformet.2015.12.060
RODRIGUES, T. R.; CURADO, L. F. A.; PEREIRA, V. M. R.; SANCHES, L.; NOGUEIRA,
J. S. Hourly interaction between wind speed and energy fluxes in Brazilian Wetlands –
Mato Grosso - Brazil. Anais da Academia Brasileira de Ciências, v. 88, n. 4, p. 2195-
2209, 2016b. http://dx.doi.org/10.1590/0001-3765201620150130
ROZA, W. S. S.; RIBEIRO, S. R. A. Detecção e estimativa de área queimada entre o limite do
Parque Estadual de Vila Velha – PR e sua zona de amortecimento mediante
sensoriamento remoto. Sociedade e Território, v. 25, n. 1, p. 102-118, 2013.
SALIFU, T.; AGYARE, W. A. Distinguishing land use types using surface albedo and
normalized difference vegetation index derived from the sebal model for the Atankwidi
and Afram Sub- Catchments in Ghana. ARPN Journal of Engineering and Applied
Sciences, v. 7, p. 69-80, 2012.
SCHWAIGER, H. P.; BIRD, D. N. Integration of albedo effects caused by land use change into
the climate balance: Should we still account in greenhouse gas units? Forest Ecology
and Management, v. 260, n. 3, p. 278-286, 2010.
https://doi.org/10.1016/j.foreco.2009.12.002
SILVA, L. C.; CUNHA, L. M.; MACHADO, N. G.; CAMPOS, M. C. C.; BIUDES, M. S.
Estimativa do balanço de radiação por sensoriamento remoto de diferentes usos de solo
no sudoeste da Amazônia brasileira. Sociedade & Natureza, v. 28, n. 1, p. 131-146,
2016. http://dx.doi.org/10.1590/1982-451320150211
SOARES-FILHO, B. S.; NEPSTAD, D. C.; CURRAN, L. M.; CERQUEIRA, G. C.; GARCIA,
R. A.; RAMOS, C. A. et al. Modelling conservation in the Amazon basin. Nature, v. 440,
n. 7083, p. 520-523, 2006. http://dx.doi.org/10.1038/nature04389
SWANN, A. L. S.; LONGO, M.; KNOX, R. G.; LEE, E.; MOORCROFT, P. R. Future
deforestation in the Amazon and consequences for South American climate. Agricultural
and Forest Meteorology, v. 214-215, p. 12-24, 2015.
https://doi.org/10.1016/j.agrformet.2015.07.006
TARTARI, R.; MACHADO, N. G.; ANJOS, M. R.; CUNHA, J. M.; MUSIS, C. R.;
NOGUEIRA, J. S.; BIUDES, M. S. Análise de índices biofísicos a partir de imagens TM
Landsat 5 em paisagem heterogênea no Sudoeste da Amazônia. Revista Ambiente &
Água, v. 10, n. 4, 943-953, 2015. http://dx.doi.org/10.4136/ambi-agua.1663

13 Surface albedo in different land-use …
Rev. Ambient. Água vol. 13 n. 2, e2120 - Taubaté 2018
VOURLITIS, G. L.; NOGUEIRA, J. S.; LOBO, F. A.; SENDALL, K. M.; PAULO, S. R.;
DIAS, C. A. A. Energy balance and canopy conductance of a tropical semi-deciduous
forest of the southern Amazon Basin. Water Resources Research, v. 44, n. 3, p. 1-14,
2008. http://dx.doi.org/10.1029/2006WR005526
VOURLITIS, G. L.; NOGUEIRA, J. S.; LOBO, F. A.; PINTO JUNIOR, O. B. Variations in
evapotranspiration and climate for an Amazonian semi-deciduous forest over seasonal,
annual, and El Niño cycles. International Journal of Biometeorology, v. 59, n. 2, p.
217-230, 2014. https://doi.org/10.1007/s00484-014-0837-1
WANG, S.; TRISHCHENKO, A. P.; KHLOPENKOV, K. V.; DAVIDSON, A. Comparison of
International Panel on Climate Change Fourth Assessment Report climate model
simulations of surface albedo with satellite products over northern latitudes. Journal of
Geophysical Research, v. 111, n. D21, p. 1-17, 2006.
http://dx.doi.org/10.1029/2005JD006728
WICKHAM, J.; BARNES, C. A.; NASH, M. S.; WADE, T. G. Combining NLCD and MODIS
to create a land cover-albedo database for the continental United States. Remote Sensing
of Environment, v. 170, p. 143-152, 2015. https://doi.org/10.1016/j.rse.2015.09.012

Ambiente & Água - An Interdisciplinary Journal of Applied Science
ISSN 1980-993X – doi:10.4136/1980-993X
www.ambi-agua.net
E-mail: [email protected]
This is an Open Access article distributed under the terms of the Creative Commons
Attribution License, which permits unrestricted use, distribution, and reproduction in any
medium, provided the original work is properly cited.
Production of energy (biodiesel) and recovery of materials (biochar)
from pyrolysis of urban waste sludge
ARTICLES doi:10.4136/ambi-agua.2128
Received: 27 Apr. 2017; Accepted: 05 Jan. 2018
Arianna Callegari1; Petr Hlavinek2; Andrea Giuseppe Capodaglio1*
1Università degli Studi di Pavia, Pavia, Italy
E-mail: [email protected], [email protected] 2Brno University of Technology, Brno, Czech Republic
E-mail: [email protected] *Corresponding author
ABSTRACT Safe disposal of sewage sludge is one of the most pressing issues in the wastewater
treatment cycle: at the European Union level, sludge production is expected to reach 13 Mt by
year 2020. Sludge disposal costs may constitute up to, and sometimes above, 50% of the total
cost of operation of a WWTP, and contribute to over 40% of its GHGs emissions. The most
common disposal options at the moment are landfilling, disposal in agriculture (about 40% EU-
wide), incineration or co-incineration, and use in the industrial production of bricks, asphalts
and concrete. Sewage sludge, however, still contains beneficial resources such as nutrients, that
can be recovered through specific processes (e.g. precipitation as struvite) and energy,
recoverable through a variety of approaches. Microwave-assisted pyrolysis of urban waste
sludge was applied for the production of oil, (Syn)gas, and biochar that were afterwards
characterized and compared to mainstream alternative fuels (biodiesels) and other material
recovery options. Sustainability issues related to the production of biodiesel/biochars from
urban wastewater treatment sludge are also discussed. The paper shows that waste urban sludge
can indeed be a full component of the urban circular economy by allowing, if properly
processed, recovery of energy resources at multiple levels: bio-oils (biodiesel), syngas and bio-
char, all having definite advantages for final residues use and disposal. Biodiesel, in particular,
allowing energy recovery as liquid fuel, offers a much more flexible and efficient utilization.
Keywords: biochar, biodiesel, materials, microwaves, pyrolysis, sustainable energy, urban waste
sludge.
Produção de energia (biodiesel) e recuperação de materiais (biochar)
a partir da pirólise de resíduos de lodo urbano
RESUMO A eliminação segura das lamas de esgoto é uma das questões mais urgentes no ciclo de
tratamento de águas residuais: a nível da União Européia, espera-se que a produção de lamas
atinja 13 Mt até o ano 2020. Os custos de disposição das lamas podem constituir-se e às vezes
acima de 50% Custo total de operação de uma ETAR e contribui para mais de 40% das emissões
de GEEs. As opções de eliminação mais comuns no momento são: aterro, eliminação na
agricultura (cerca de 40% em toda a escala), incineração ou co-incineração, uso na produção

Rev. Ambient. Água vol. 13 n. 2, e2128 - Taubaté 2018
2 Arianna Callegari et al.
industrial de tijolos, asfaltos, concreto. As lamas de esgoto, no entanto, ainda contêm recursos
benéficos, como nutrientes, que podem ser recuperados através de processos específicos (por
exemplo, precipitação como estruvita) e energia, recuperável através de uma variedade de
abordagens. A pirólise assistida por microondas de lama de lixo urbano foi aplicada para a
produção de petróleo, gás (Syn) e biochar que posteriormente foram caracterizados e
comparados aos principais combustíveis alternativos (biodiesels) e outras opções de
recuperação de materiais. São discutidos os problemas de sustentabilidade relacionados à
produção de biodiesel / biochars de lamas de tratamento de águas residuais urbanas. O
documento mostra que o lodo urbano residual pode de fato ser um componente completo da
economia circular urbana, permitindo, se devidamente processado, a recuperação de recursos
energéticos em vários níveis: bio-óleos (biodiesel), gás de síntese e bio-carbon, todos com
vantagens definidas para o uso e eliminação de resíduos finais. O biodiesel, em particular, que
permite a recuperação de energia como combustível líquido, oferece uma utilização muito mais
flexível (e eficiente).
Palavras-chave: biochar, biodiesel, energia sustentável, lodo de resíduos urbanos, micro-ondas,
pirólise.
1. INTRODUCTION
Residual urban sludge disposal costs may constitute up to, and sometimes above, 50% of
the total cost of operation of Wastewater Treatment Plants (WWTPs) and contribute more than
40% of the total greenhouse gas (GHG) emissions associated with their operation (Liu et al.,
2013). The safe disposal of such sludge is literally a “big” issue in urban wastewater treatment:
at the European Union level, the 2020 sludge production is expected to reach close to 13 Mt by
year 2020, an increase of more than 30% from today’s levels. According to Machado (2001),
urban waste sludge production in Brazil is much lower (about 150 Kt per year) since about 80
million people in Brazil do not have their wastewater collected by centralized systems, but
disposed of through separate unitary (septic tanks) systems, in which there is no centralized
control over the final destination of excess organic solids. Part of the population have their
wastewater collected by communal systems, but not yet treated. In practice, only less than 45
million Brazilians get their wastewater treated. Clearly, the size of the issue will inevitably
increase as wastewater collection and treatment in Brazil increases, as has been seen elsewhere
in the world. In 2008, the United Nations Human Settlement Programme more than doubled
the previous estimate by Machado for the country, updating it to 370 kt per year (Mateo-Sagasta
et al., 2015).
Traditionally, wastewater sludges are processed for: a) reduction of total weight and
volume to facilitate their transport and subsequent treatments; b) stabilization of contained
organic material and destruction of pathogenic microorganisms, elimination of noxious odours,
and reduction of putrefaction potential; and, for the last few decades, and at an increasing
degree, c) value addition by developing economically viable recovery of energy and residual
constituents, such as nutrients, that can be recovered through specific processes (e.g.
precipitation as struvite), and energy, recoverable through a variety of approaches.
Wastewater still contains significant amounts of resources (i.e. nutrients) and energy; most
of these end up, after treatment, immobilized in residual sludge. According to Shizas and
Bagley (2004) the theoretical chemical energy content of wastewater is approximately
3 kJ/g (dry w.), which is roughly 10 times the energy expenditure necessary to treat the same
wastewater in a current-technology WWTP. As of today, conventional technology allows the
recovery, through anaerobic sludge digestion, of just a small fraction of that estimated value,
allowing WWTPs to cover at most ¼ to ½ of their energy needs (Capodaglio et al., 2017). By

3 Production of energy (biodiesel) and recovery …
Rev. Ambient. Água vol. 13 n. 2, e2128 - Taubaté 2018
sheer mass balance proportions, wastewater sludge can be shown to contain about 5 times the
energy stored in wastewater. Table 1 illustrates some figures reported by different researchers.
Table 1. Energy content estimates (kJ/g dry w.) for different sludge types.
Primary Sludge Secondary Sludge Digested Sludge Source
15.9 12.4 12.7 Shizas and Bagley (2004)
15 13.5 11.4 Zanoni and Mueller (1982)
n.a. n.a. 12.6 Vesilind and Ramsey (1996)
In Table 1, digested sludge refers to sludge processes through secondary (anaerobic)
digestion after a first-stage liquid treatment. In Brazil and other South American countries, it is
common practice nowadays to treat urban wastewaters through UASB processes (Capodaglio,
2017) as this process is much less energy-intensive, and could be almost as efficient as
traditional aerobic processes used in EU and the USA, due to the local, favorable climatic
conditions. UASB processes can, in theory, also allow energy recovery from wastewater;
however, in the few full-scale applications visited by the authors, this was rarely implemented
in practice. In any case, the residual energetic value of anaerobic sludge after a UASB process
should be comparable to the values indicated in Table 1 for digested sludge.
The EU Landfill Directive 99/31/EC sets restrictions (quantitative targets) for
biodegradable municipal wastes (such as sewage sludge) disposed of in landfills; in addition,
the national legislation of some Member States have set very strict limits for organic matter or
total organic carbon (TOC) contained in disposed-of sludge, prohibiting de facto its landfilling.
According to recent Eurostat data, in fact, significant abandonment of sludge landfilling
practices is occurring in most of Europe, except for Italy, Denmark, and Estonia. Sewage Sludge
Directive 86/278/EEC, concerning beneficial use of sludge on soils, initially sought to
encourage safe use of sewage sludge in agriculture, regulating this form of disposal to prevent
harmful effects. After concerns raised about possible harmful accumulation of compounds in
soils, 16 (out of 27) EU countries have set more stringent requirements for heavy metals in
sludge, compared to the Directive’s provisions, and 10 countries set stricter limit values for
heavy metals in soil. Such restrictions are being strengthened periodically, while most EU
countries have outright prohibited the disposal of untreated sludge in soil. Composting is
applied more often in the new EU-12 countries, compared to the old EU-15.
Finally, incineration is enforced in most EU-15 countries. Greece, Slovenia, Germany and
Netherlands present the greatest increasing trends, even though the first two countries export
sludge for incineration; Denmark, Austria, Belgium and Italy show instead decreasing
incineration trends (Kelessidis and Stasinakis, 2012).
Thermal processing of sludge remains, however, a convenient and efficient approach for
the disposal of waste urban sludge without causing excess secondary pollution, which is used
as much as possible in many countries. Thermal utilization of sludge comes into play when the
sludge does not comply with, or is in excess of, requirements for disposal in agriculture, and
allows forms of energetic recovery. Thermal processing of sludges can take several forms. Co-
firing in power plants and heating plants with coal (approximately 5% sludge) does not
significantly decrease the temperature of the combustion process, and usually does not require
extra investment costs for off-gas cleaning, as existing filters and separators can handle this
extra component. Co-firing in cement kilns was considered the most convenient technology in
terms of both sludge disposal and utilization: one ton of dried sludge can substitute up to 0.33
t of raw material and, since ash from sludge is bound to cement clinker, this can actually be
considered a waste-less technology. This is also considered a ‘‘waste-to-energy’’ system, and
is acceptable if no other environmentally friendly technology can be applied (Capodaglio et al.,

Rev. Ambient. Água vol. 13 n. 2, e2128 - Taubaté 2018
4 Arianna Callegari et al.
2016a). Incineration (with urban solid waste, or in special sludge incinerators) is another option,
where the energy contained in the sludge contributes to the energy balance of the process.
Sewage sludge is usually processed, prior to disposal, in anaerobic tanks to produce biogas,
a mixture of CH4 and CO2 that can be used as such, or further refined to obtain bio-methane, a
renewable fuel with characteristics practically identical to those of fossil methane (Capodaglio
et al., 2016b).
However, recent work has demonstrated that the production of biodiesel using lipids
extracted from sewage sludge could be economically feasible because of the remarkably high
yield of oil and low cost of this feedstock.
Recent work has demonstrated that production of biodiesel from lipids contained in sewage
sludge, largely regardless of its upstream production processes (i.e. WWTP technology), could
be an alternative, economically feasible technique for energy recovery from waste biological
sludges, , as compared to conventional biodiesel feedstocks (Bharathiraja et al, 2014), thanks
to high oil yields, as shown in several studies (Olkiewicz et al., 2012; Capodaglio et al., 2016c).
Furthermore, while conventional biodiesel feedstocks is usually expensive and competing
with other uses (e.g. food for animals, or people), waste sludge is abundant, costly to dispose
of under traditional schemes, and therefore should be available almost everywhere at very low,
or no cost, as a feedstock.
Brazil has a standing tradition of biodiesel uses, derived from both food and non-food
crops, and from various food-waste products (e.g. spent frying oils). This type of solution is
widely supported by the Brazilian government within its Biodiesel Production and Use Program
(BPUP), which favours renewable energies, specifically addressing energy self-sustainability
of isolated rural communities (Torres et al., 2013). No references were found, however,
concerning the recovery of biodiesel and materials from urban waste sludge in Brazil. This is
probably due to the fact that the sludge disposal problem has not reached critical proportions as
it did in several in several EU member states.
Several technologies have been studied for this purpose worldwide. While
transesterification is perhaps the most-used biodiesel-extraction process in Brazil, pyrolysis
could be a technology to consider, not only in urban waste sludge processing, but also in other
energy/materials recovery chains, as it allows useful recovery of energy and materials at
different levels. These include pyrolysis, hydrothermal liquefaction, wet oxidation, supercritical
water oxidation, sequential methane/hexanol distillation (Demirbas, 2001). These, once
process-validated and industrially tested, could be considered not only as viable alternative
processes for sludge disposal, but also sustainable, environmental-compliant biodiesel
production processes. In addition to biodiesel, waste urban sludge may provide, as by-products,
other substrates of notable energetic and material values, such as biochar.
Studies show that for oil extracted from waste sludge, the energy gain is up to 29.7 GJ/ton
(Zhang et al., 2013). Furthermore, GHG emissions studies show that biodiesel production from
sludge is a net carbon dioxide capture process, with the highest capture being around 40 t CO2/t
biodiesel produced. Sludge-derived biodiesel, finally, has a lower Global Warming Potential
(GWP) than most other renewable biodiesels (Table 2) with the exception of biodiesel derived
from waste vegetable oils (Dufour and Iribarren, 2012).
Table 2. Comparison of GWP (kg CO2 equivalent) of different biofuels.
Biodiesel
type
Waste
vegetable
oil
Beef
tallow
Poultry
fat
Sewage
sludge Soybean Rapeseed
Low-
sulphur
Fossil
Diesel
GWP
(kg CO2-eq) 16.97 23.32 23.55 20.84 26.18 63.23 83.69

5 Production of energy (biodiesel) and recovery …
Rev. Ambient. Água vol. 13 n. 2, e2128 - Taubaté 2018
This paper illustrates experimental findings from the application of pyrolysis treatment to
urban waste sludge, and describes possible recovery pathways of energy and materials from
that feedstock. In addition to the benefits in potentially contributing to solve the significant
problem of the ultimate disposal of urban waste sludge, this technology could be instrumental
in supporting current government commitments (e.g. EU’s under Directive 2003/30/EC, on the
promotion of biofuels for transport) to achieve in the next coming years higher fractional targets
of bio-oils’ content in commercial fuels (e.g. 10% by 2020 in the EU) (Raboni et al., 2015).
2. MATERIALS AND METHODS
Pyrolysis is a thermal-decomposition process, carried out in the absence of O2, that
converts biomass into solid charcoal (biochar), bio-oil (biodiesel, or SSPO, Sewage Sludge
Pyrolysis Oil), and gaseous products (syngas) at elevated temperatures (generally more than
500oC) and atmospheric pressure. It is one of the most efficient processes for biomass
conversion discovered and industrially adopted to date. Recovered SSPOs are a complex
mixture of aliphatic, aromatic and poly-aromatic hydrocarbons, long carbon-chain organic
acids and alcohols, etc. (Pokorna et al., 2009), very similar in properties to diesel fuel (hence
the alternative term, “biodiesel”).
Pyrolysis not only can be used to transform biomass of various origins and other waste
materials (e.g. rubber tyres) into bio-oil, biochar, and syngas, of varied characteristics
(depending on initial feedstock and actual process operating conditions), but also allows for
variation in the ratios between different product fractions, according to process temperature
profiles and duration. In a sense, pyrolysis allows the user to choose among the three possible
final products, according the best-fitting combination required by local reuse/recycle needs
(Capodaglio et al., 2016c).
While the advantage of obtaining sludge-derived liquid fuels is easily obvious to most,
more so than gaseous fuel, which is subject to greater transportation and use challenges than
the former, the solid fraction residue from the process (biochar) also has been found to have
several useful, unexpected applications. Biochar is a new technical term indicating “the porous
carbonaceous solid produced by the thermochemical conversion of organic materials in an
oxygen depleted atmosphere that has physicochemical properties suitable for safe and long-
term storage of carbon in the environment” (Shackley et al., 2012). Biochar could in theory be
used to generate energy (it has an energy content that, depending on the process used for its
production, can be even > 18 MJ/kg); however, biochar is recently getting much attention from
the scientific community due to its various use potentials. Given its properties, it is clear that
the concept of biochar production from sewage sludge has become increasingly popular in
recent years.
Microwave technology has recently emerged as one of the most promising methods of
enhancing and accelerating chemical reactions, due to efficient heat-transfer profiles. It is
therefore being adopted as one of the best technologies available in pyrolytic processes, since
it reduces residence time and brings significant energy savings (Motasemi and Azfal, 2013).
Microwave-assisted pyrolysis (MAP) technology is an alternative heating method already in
use in biomass pyrolysis for biofuels production, presenting several advantages over
conventional pyrolysis, including: uniform internal heating for material particles, since
electromagnetic energy is directly converted into heat at a molecular level; ease of control due
to its instantaneous response; simple set-up, facilitating its adaptation to large-scale industrial
processes; reduced need for feedstock grinding; and low cost, as microwave is a mature and
energy-efficient technology. The different heating mechanisms make MAP products retain
different characteristics from those obtained with conventional heating. In addition, MAP takes
a much shorter process time than conventional pyrolysis (Menendez et al., 2002; Leszczynski,
2006), as the heating of the feedstock biomass is more uniform.

Rev. Ambient. Água vol. 13 n. 2, e2128 - Taubaté 2018
6 Arianna Callegari et al.
Using monomodal microwave synthesizers (MMS) instead of multimodal ones, the need
for preliminary mixing dry sludge with microwaves receptors additives reported by earlier
researchers could also be eliminated, and the process temperature needed for process
completion is significantly lowered (as low as 270oC), allowing the production of a larger liquid
product (biodiesel) fraction (Capodaglio et al., 2016c). Detailed description of pyrolysis, MAP
and MMS-driven pyrolysis are given by Masek et al. (2013).
The apparatus shown in Figure 1 was used to expose sludge samples to MAP. The
experimental apparatus consists of a pure quartz cuvette (Fig. 1[a]), capable of withstanding
high temperatures exceeding 1000oC, with a cavity (Fig. 1 [b]) containing the sludge sample
(15-25 g) being treated. A MMS, unlike a conventional (multimodal) cooking microwave oven,
is capable of matching the impedance between the load to be irradiated and the microwave-
generator (magnetron), thus maximizing the power transfer to the samples. With an MMS
appropriately tuned, it is also possible to irradiate dry samples, eliminating the need reported
by previous researchers to add microwave receptors to the sludge, a task impossible to achieve
with traditional microwave ovens that heat contents indirectly, by agitation of the water
molecules contained in the samples. A triple-stub matching device (MD, Alter Systems, Fig.
1[e]) connected with the magnetron was used to balance reflective coefficients within the
system, allowing the creation of an optimal electric field intensity in the cavity containing the
sample.
Sludge samples were prepared from dewatered waste sludge obtained from the local
municipal WWTP that had already undergone an anaerobic digestion process. Samples were
further desiccated at 60oC for 24 hours in order to further reduce their water content to around
73.5%, while minimizing any possible reaction that could modify their organic content. This
desiccation phase will be the object of additional considerations about the sustainability of the
process at the full-scale. The desiccated sample was then ground to a fine powder, and
pyrolyzed in this apparatus.
Determination of oil content was made after condensation of process evaporate with a
Soxhlet extractor after each test (See Tests 1-7 in Table 3), and its chemical characterization
was then performed by GC-MS spectrometry. Test conditions varied according to maximum
temperature achieved in the cuvette, time of sample exposure to maximum temperature, time-
to maximum temperature (heating rate of sample). Biochar characterization was achieved after
grinding and sieving to < 0.5 mm the resulting product. Determination of volatile matter and
ash content was conducted according to ASTM-D1752-84, elemental composition (C, H, N)
assessed by an elemental analyser (Thermo Fisher Scientific, MA. USA), O content by Vario
El Cube (Elementar Analysensysteme, GmbH).
Table 3 shows temperature, duration and quantity of extracted oils from the tests
conducted. The greatest oil yields were observed between 270 and 500oC. Below 200oC, the
oil quantity obtained is very small; over 500oC, there is still some production.
3. RESULTS AND DISCUSSION
The highest oil yield was obtained at the test temperature of 280ºC (25.0% oil to organics
sludge fraction, 12.52% oil to total sludge, weight basis) and short process duration. Higher
temperatures and longer process times tend to increase the amounts of generated gaseous and
solid fractions.
GC-MS analysis of extracted oil samples, diluted with dichloromethane, show the
following composition (Figure 2). Toluene and styrene do not show in some of the graph lines
due to the high dilution ratio adopted for analysis; however, they were detected in the raw oil
samples. From lower to higher retention times (left to right in the graphs) MS identifies aromatic

7 Production of energy (biodiesel) and recovery …
Rev. Ambient. Água vol. 13 n. 2, e2128 - Taubaté 2018
hydrocarbons (containing one or more aromatic rings in their molecular structure), nitrogenous
compounds, alkanes, carboxylic acids (containing the –COOH or the –OH groups linked to a
carbonyl group C=O), sterols and derivatives.
The lower calorific value (LCV) of the biodiesel obtained, is slightly lower than the one
obtained from energy crops. Sludge-derived biodiesel LCV was about 33 kJ/g (in the range
33-35 kJ/g for all tests), against that from corn and safflower at 42-43 kJ/g, or the one from
coconut feedstock at 38 kJ/g commonly reported (Capodaglio et al., 2016c). Compared with
fossil diesel, therefore, this sludge-derived oil has an LCV that is about 30% lower. LCV will
vary according to process conditions: at higher process temperatures, the LCV of obtained bio-
oil will tend to be lower for the same feedstock.
Figure 1. The experimental MMS apparatus.
Table 3. Tests conditions and oil yields.
Max Test
Temp. oC
Time at
TMAX
[min]
Total
process
Time [min]
% oil to
total
sludge
% oil to
sludge
org. fraction
SLUDGE AS IS 60 = = 3.57* 7*
TEST 1 180 28 50 3.30 7
TEST 2 270 20 55 9.68 19
TEST 3 280 2 8 12.52 25
TEST 4 400 2 18 10.77 22
TEST 5 490 1 54 10.25 21
TEST 6 600 3 56 8.71 17
TEST 7 650 - 60 7.38 15
*extraction with solvent from original sample.
Rev. Ambient. Água vol. 13 n. 2, e2128 - Taubaté 2018
8 Arianna Callegari et al.
Figure 2. Superimposed GC-MS analytical results for the oil extracted
in the different tests (From Capodaglio et al., 2016c).
Syngas is primarily composed of H2 and CO, with smaller quantities of CH4, CO2, H2O,
and other low molecular-weight volatile organics. While its heating value is low (~6 MJ kg-1)
compared to natural gas (~54 MJ kg-1), it can provide fuel for hot water, sludge pre-drying or
electricity onsite. Given the low LCV and its “dirty” composition, it is usually not considered
worthy of further processing (unless purposefully generated in high quantities). Some time ago,
before widespread availability of natural gas, syngas was generated to provide energy for home
heating, cooking, street lighting, etc. (a.k.a. “town gas”). At the moment, although providing
some residual energetic value, syngas is the least interesting product of waste sludge pyrolysis.
Biochar is the solid residue of the process, with high energy content, that can be therefore
burned in systems fed with pulverized coal. NOx emissions from biochar combustion are
comparable to those of coal, requiring similar abatement technologies. Some types of feedstock
(i.e. urban sludge) may contain relatively high levels of metals that concentrate in the biochar
after pyrolysis. Biochars, however, may also have many other attractive, high value uses, in
fields such as chemistry, metallurgy, agriculture, waste treatment, etc. Table 4 shows
characteristics of biochar derived from sewage sludges with traditional and microwave-assisted
pyrolysis, by the authors and in other studies. As it can be seen, the characteristics of the
material vary according to the process adopted and depending on the origin of the feedstock
material. Table 5 shows some of the main ash components of sewage sludge biochar from
different origins. Process operational temperature has a substantial effect on the quality of
biochar produced: biochar produced at low temperatures is most suitable for agricultural uses,
due to carbon content and nutrient availability, while higher temperatures can improve its
porosity and thus enhance its effectiveness in adsorbing contaminants present in soils (Agrafioti
et al., 2013). Researchers have also shown that the pyrolysis process can suppress heavy metal
release by non-impregnated biochars, resulting in an extremely low environmental risk using
sludge-derived biochar as soil amendment (unlike the case of sludge as is). Biochars can be
obtained under different processes and feedstocks; they significantly differ from one to another
in their properties, depending on the type of biomass used to produce them, its growth
conditions and also on pyrolysis operating conditions.

9 Production of energy (biodiesel) and recovery …
Rev. Ambient. Água vol. 13 n. 2, e2128 - Taubaté 2018
It has already been recognized that oils derived from wastewater sludge are comparable
replacements of traditional biodiesel production feedstock (Bharathiraja et al., 2014). In order
to assess the sustainability of biodiesel production from this source, energy balance and
greenhouse gas (GHG) emissions are also essential factors to consider.
It has been reported that biodiesel produced from two major food crop feedstocks, soybean
and sunflower oils, has an energetically unfavorable energy balance, due to the low-oil yield of
the crops, translating to a process energy loss of 32% for soybean, and 118% for sunflower
(Pimentel and Patzek, 2005). Therefore, replacement of traditional feestock with better-suited
raw or recovered materials is continuously being investigated. Wastewater sludge fulfils the
basic general requirements of alternative feedstocks, that should be abundant, sustainable, and
energetically favorable (i.e. generate a positive energy balance).
Sludge-derived biodiesel thus has a lower Global Warming Potential (GWP) than most
other renewable biodiesels with the exception of biodiesel derived from waste vegetable oils
(Dufour and Iribarren, 2012; Capodaglio and Callegari, 2017). Compared to conventional low-
sulphur diesel as a benchmark, a 75.1% reduction for use of sludge-derived biodiesel can be
achieved.
The transformation of waste sludge in biochar by pyrolysis has also some relevant
environmental advantages. In the introductory section a brief review of the existing methods of
excess sewage sludge disposal was presented. In addition to the saved costs for the otherwise
necessary disposal of sewage sludge, this section shows the beneficial (added-values) uses by
which biochar can become a resource.
The most appealing feature of biochar is the fact that it is an inexpensive, sustainable and
easily-produced material with potentially extensive applications. Even though most of those
applications are still in their infancy, biochar already has a number of identified applications
with potentially extraordinary effects, including soil amendment, catalysis, water purification,
and many others still to be invented or discovered.
Beneficial effects of biochar on agricultural crops yield and properties of soil have been
studied, showing significant improvement in the yield of crops (Chan et al., 2008). Biochar
addition is known to improve nitrogen fertiliser-use efficiency by improving the chemical
properties of soil. It significantly increases soil C content, and improves crop productivity.
Wastewater sludge biochar application was specifically found to increase soil cation exchange
capacity (CEC) by up to 40%, and soil pH by up to one unit (Hossain et al., 2010), with
improvement of plant available nutrients, and carbon sequestration.
Biochars are receptive to complex metal ions present in the soil on their surfaces and
therefore reduce their bioavailability, resulting in a reduced risk. Studies detected insignificant
bioaccumulation in crops of metals present in wastewater-sludge biochar. In addition, biochar
is known to have positive effects on soil quality, as it enhances soil aeration, increasing water
holding capacity and improved environmental conditions for the growth and development of
plant root systems.

10
1
1
1
1
Arianna Callegari et al. 10
Rev. Ambient. Água vol. 13 n. 2, e2128 - Taubaté 2018
Table 4. Characteristics of biochar derived from sewage sludges with traditional and microwave-assisted pyrolysis.
Source Zielinska et al. (2015) Lu et al. (2013) Agrafioti et al. (2013) Antunes et al. (2013) Authors (this paper)
Type of sludge Municipal WWTPs (4) Municipal WWTPs (3) Municipal WWTP Municipal WWTP Municipal WWTP
Pyrolysis process Traditional slow Traditional slow Traditional MAP Monomodal Microwave-
assisted
Sample/Temp. oC Original 500 600 700 Original 300 600 Original 300 500 Original 300 800 Original 270 500
Yield (% dry w.) - 45-54 43-51 40-49 - n.d. n.d. - 58.1-64 27-31 - 91 77 - - -
Ash content (%) 55.8-61.3 64-73 63-77 68-79 n.d. n.d. n.d. 25.9 n.d n.d. 55.5 55.8 63.3 52-55 54-57 58-61
Carbon (C, %) 21.6-26.2 18.9-26.6 18.4-27.7 18.1-27.8 23.8-33.2 21.7-31.5 15.2-26 37.9 39.7 9.8 19.9 22-25 20-22 17-21
(O+N)/C 0.32-0.66 0.25-0.29 0.15-0.28 0.09-0.21 n.d. n.d. n.d. n.d. n.d. n.d. 1 - - -
Smicro (m2g−1)
(Micropore surf.) - 7.1-19.4 2.8-7.7 1.4-27.7 - 4-6.7 6.3-18.2 - 0.5-18 4-90 16.64 50.06 64.67 - - -
pH 7.01-7.39 7.08-7.25 80.5-11.4 12.2-13.1 6.08 6.2 9.6 5.9 6.0 11.6 6.13 6.42 6.6 7.2-7.45 7.3-7.55 7.5-7.88
Table 5. Main ash components for some reported biomass feedstocks.
Source Zielinska et al. (2015) Lu et al. (2013)
(note different data units)
Authors
(this paper)
Sample/Temp oC Original 500 600 700 Original 300 600 Original 270 500
Fe (% d.w.) 1.1-6.8 2.4-11.5 2.37-12.5 2.6-13.2 0.8-23.2* 18.6-37.6* 0.06-43.2* 2.2-4.9 2.8-7.3 3.68-9.4
Si (% d.w.) 2.5-5.8 4.8-9.1 5.1-9.4 5.5-97 - - - 2.8-5.3 3.6-8.6 4.6-10.2
P (% d.w.) 3.4-4.9 5.4-9.6 5.3-9.2 5.6-9.5 20-28.4* 29.5-42.6* 35.5-57.6* 3.6-4.5 4.72-7.18 5.2-9.82
S (% d.w.) 1.5-3.8 1.37-4.6 1.2-3.97 1.37-5.2 0.7-1.1 0.5-0.67 0.43-0.57 1.65-4.02 1.88-4.5 1.85-4.3
Al (% d.w.) 1.8-2.5 2.3-3.3 2.6-3.7 2.7-3.9 26.2-31* 38.1-52* 50.8-55.2* 1.98-2.75 2.17-2.94 2.15-3.33
Mg (% d.w.) 0.57-2 0.9-3.3 1.08-2.6 1.1-2.4 4.1-6.3* 8.2-11* 9.3-14.5* 0.8-2.3 0.85-2.87 1.03-3.06
K (% d.w.) 0.5-0.8 0.9-1.4 1.0-1.55 1.1-1.64 0.8-1.2* 1.6-2.1* 2.6-2.8* 0.6-0.95 0.7-1.1 0.69-1.6

11 Production of energy (biodiesel) and recovery ...
Rev. Ambient. Água vol. 13 n. 2, e2128 - Taubaté 2018
Benefits associated with applying biochars to soils, comparable to those of activated
carbon, have been reported (Beesley et al., 2011). It was shown that increasing the pyrolysis
temperature of biochars increases their degree of carbonisation, surface area, and reduces the
abundance of amorphous organic matter. This also increases biochars’ capability to also adsorb
organic contaminants (Yu et al., 2009). Biochars obtained at high temperatures (“activated”)
will have the highest organic contaminant remediation potential.
Lately, biochar has been indicated as a possible substitute resource for several industrial
applications in electronic and industrial applications (Huggins et al., 2014; Liu et al., 2012; Tan
et al., 2015).
4. CONCLUSIONS
It has been herein shown that waste urban sludge can be a full component of the urban
circular economy by allowing, if properly processed, recovery of energy resources at multiple
levels: bio-oils (biodiesel), syngas and bio-char. These have properties that make them
particularly attractive as secondary resources: bio-oils are similar in characteristics to diesel
fuels, and could be used as transportation fuel or as a source of chemicals extraction; biochar
has some very interesting agricultural and non-agricultural applications, and these will
undoubtedly increase in the future. Biofuels’ future production and use in the transport sector
will be much more diversified, with biodiesel playing a greater role. The estimated growth of
biodiesel production presents a fundamental issue of social sustainability due to land use for
energy crops rather than food. The use of alternative renewable feedstocks such as wastewater
sludge could provide support to the development of this sector, while solving a specific
problem. Quantities of sewage sludge produced worldwide are increasingly growing,
demanding environmentally and economically sound management in compliance with laws and
regulations. Traditional disposal pathways are increasingly costly and may not be practicable
in the future, due to new regulations or to diminishing public acceptance.
Use of urban waste sludge as oil-and-char feedstock has definite advantages for final
residues’ use and disposal; energy recovery as liquid fuel offer much more flexible (and
efficient) utilization possibilities. Flexibility and multiple possibilities in the use of biochar may
soon become an interesting economic issue in orienting the production of pyrolysis by-products
towards economic maximization of possible returns, while significantly reducing overall GHGs
emissions due to urban waste sludge disposal.
5. REFERENCES
AGRAFIOTI, E.; BOURAS, G.; KALDERIS, D.; DIAMADOPOULOS, E. Biochar
production by sewage sludge pyrolysis. Journal of Analytical and Applied Pyrolysis,
v. 101, p. 72–78, 2013. https://doi.org/10.1016/j.jaap.2013.02.010
ANTUNES, E.; SCHUMANN, J.; BRODIE, G.; JACOB, M. V.; SCHNEIDER, P. A. Biochar
produced from biosolids using a single-mode microwave: Characterisation and its
potential for phosphorus removal. Journal of Environmental Management, v. 196, p.
119-126, 2017. https://doi.org/10.1016/j.jenvman.2017.02.080
BEESLEY, L.; MORENO-JIMÉNEZ, E.; GOMEZ-EYLES, J. L.; HARRIS, E.; ROBINSON,
B.; SIZMUR, T. A review of biochars’ potential role in the remediation, revegetation and
restoration of contaminated soils. Environmental Pollution, v. 159, p. 3269-3282, 2011.
https://doi.org/10.1016/j.envpol.2011.07.023
BHARATHIRAJA, B.; YOGENDRAN, D.; RANJITH KUMAR, R.; CHAKRAVARTHY,
M.; PALANI, S. Biofuels from sewage sludge-A review. International Journal of
ChemTech Research, v .6, n. 9, p. 4417-4427, 2014.

Rev. Ambient. Água vol. 13 n. 2, e2128 - Taubaté 2018
12 Arianna Callegari et al.
CAPODAGLIO, A. G. Integrated, Decentralized Wastewater Management for Resource
Recovery in Rural and Peri-Urban Areas. Resources, v. 6, n. 2, p. 22, 2017.
http://dx.doi.org/10.3390/resources6020022
CAPODAGLIO, A. G.; CALLEGARI, A. Feedstock and process influence on biodiesel
produced from waste sewage sludge. Journal of Environmental Management, 2017
http://dx.doi.org/10.1016/j.jenvman.2017.03.089
CAPODAGLIO, A. G.; CALLEGARI, A.; CECCONET, D.; MOLOGNONI, D. Sustainability
of decentralized wastewater treatment technologies. Water Practice And Technology,
v. 12, n. 2, p. 463-477, 2017. http://dx.doi.org/10.2166/wpt.2017.055
CAPODAGLIO, A. G.; RANIERI, E.; TORRETTA, V. Process enhancement for maximization
of methane production in co digestion biogas plants. Management of Environmental
Quality: An International Journal, v. 27, n. 3, 2016a. https://doi.org/10.1108/MEQ-04-
2015-0059
CAPODAGLIO, A. G.; CALLEGARI, A.; LOPEZ, M. V. European Framework for the
Diffusion of Biogas Uses: Emerging Technologies, Acceptance, Incentive Strategies, and
Institutional-Regulatory Support. Sustainability, v. 8, n. 4, 2016b.
http://dx.doi.org/10.3390/su8040298
CAPODAGLIO, A. G.; CALLEGARI, A.; DONDI, D. Microwave-Induced Pyrolysis for
Production of Sustainable Biodiesel from Waste Sludges. Waste Biomass Valorization,
v. 7, p. 703, 2016c. https://doi.org/10.1007/s12649-016-9496-2
CHAN, K. Y.; VAN ZWIETEN, L.; MESZAROS, I.; DOWNIE, A.; JOSEPH, S. Using poultry
litter biochar as soil amendments. Australian Journal of Soil Research, v. 46, p. 437–
444, 2008. https://doi.org/10.1071/SR08036
DEMIRBAS, A. Biomass resource facilities and biomass conversion processing for fuels and
chemicals. Energy Conversion and Management, v. 42, n. 1, p. 1357–1378, 2001.
https://doi.org/10.1016/S0196-8904(00)00137-0
DUFOUR, J.; IRIBARREN, D. Life cycle assessment of biodiesel production from free fatty
acid-rich wastes. Renewable Energy, v. 38, p. 155-162, 2012.
https://doi.org/10.1016/j.renene.2011.07.016
HOSSAIN, H. K.; STREZOV, V.; CHAN, K. Y.; NELSON, P. F. Agronomic properties of
wastewater sludge biochar and bioavailability of metals in production of cherry tomato
(Lycopersicon esculentum). Chemosphere, v. 78, p. 1167–1171, 2010.
https://doi.org/10.1016/j.chemosphere.2010.01.009
HUGGINS, T.; WANG, H.; KEARNS, J.; JENKINS, P.; REN, Z. J. Biochar as a sustainable
electrode material for electricity production in microbial fuel cells. Bioresource
Technology, v. 157, p. 114–9, 2014. https://doi.org/10.1016/j.biortech.2014.01.058
KELESSIDIS, A.; STASINAKIS, A. S. Comparative study of the methods used for treatment
and final disposal of sewage sludge in European countries. Waste Management, v. 32,
p. 1186–1195, 2012. https://doi.org/10.1016/j.wasman.2012.01.012
LESZCZYNSKI, S. Pyrolysis of sewage sludge and municipal organic waste. Acta
Metallurgica Slovaca, v. 12, p. 257 – 261, 2006.

13 Production of energy (biodiesel) and recovery …
Rev. Ambient. Água vol. 13 n. 2, e2128 - Taubaté 2018
LIU, B.; WEI, Q.; ZHANG, B. et al. Life cycle GHG emissions of sewage sludge treatment and
disposal options in Tai Lake watershed, China. Science of the Total Environment, v.
447, p. 361–369, 2013. https://doi.org/10.1016/j.scitotenv.2013.01.019
LIU, M-C.; KONG, L-B.; ZHANG, P.; LUO, Y-C.; KANG, L. Porous wood carbon monolith
for high-performance supercapacitors. Electrochimica Acta, v. 60, p. 443–8, 2012.
https://doi.org/10.1016/j.electacta.2011.11.100
LU, H.; ZHANG, W.; WANG, S.; ZHUANG, L.; YANG, Y.; QIU, R. Characterization of
sewage sludge-derived biochars from different feedstocks and pyrolysis temperatures.
Journal of Analytical and Applied Pyrolysis, v. 102, p. 137–143, 2013.
https://doi.org/10.1016/j.jaap.2013.03.004
MACHADO, M. F. de S. A situação brasileira dos biossólidos 2001. 828f. Dissertação
(Mestrado) - FEC - Universidade de Campinas, Campinas, 2001.
MASEK, O.; BUDARIN V.; GRONNOW, M.; CROMBIE, W.; BROWNSORT, P.;
FITZPATRICK, E.; HURST, P. Microwave and slow pyrolysis biochar—Comparison of
physical and functional properties. Journal of Analytical and Applied Pyrolysis, v. 100,
p. 41–48, 2013. https://doi.org/10.1016/j.jaap.2012.11.015
MATEO-SAGASTA, J.; RASHID-SALLY, L.; THEBO, A. Global Wastewater and sludge
production, treatment and use. In: DRECHSEL, P.; QADIR, M.; WICHELNS, D. (Eds.).
Wastewater, Economic Asset in an Urbanizing World. Dordrecht: Springer, 2015.
MENENDEZ J. A.; INGUANZO, M.; PIS, J. J. Microwave-induced pyrolysis of sewage
sludge. Water Research, v. 36, n. 13, p. 3261-64, 2002. https://doi.org/10.1016/S0043-
1354(02)00017-9
MOTASEMI, F.; AFZAL, M. T. A review on the microwave-assisted pyrolysis technique.
Renewable and Sustainable Energy Reviews, v. 28, p. 317–330, 2013.
https://doi.org/10.1016/j.rser.2013.08.008
OLKIEWICZ, M.; FORTUNY, A.; STÜBER, F.; FABREGAT, A.; FONT, A.; BENGOA, C.
Evaluation of different sludges from WWTP as a potential source for biodiesel
production. Procedia Engineering, v. 42, p. 634 – 643, 2012.
https://doi.org/10.1016/j.proeng.2012.07.456
PIMENTEL, D.; PATZEK, T. W. Ethanol production using corn, switchgrass, and wood;
biodiesel production using soybean and sunflower. Natural Resour Research, v. 14, n.
1, p. 65, 2005. https://doi.org/10.1007/s11053-005-4679-8
POKORNA, E.; POSTELMANS, N.; JENICEK, P.; SCHREURS, S.; CARLEER, R.;
YPERMAN, J. Study of bio-oils and solids from flash pyrolysis of sewage sludges. Fuel,
v. 88, n. 8, p. 1344–1350, 2009. https://doi.org/10.1016/j.fuel.2009.02.020
RABONI, M.; VIOTTI, P.; CAPODAGLIO, A. G. A comprehensive analysis of the current
and future role of biofuels for transport in the European union (EU). Revista Ambiente
& Agua, v. 9, n. 10, 2015. http://dx.doi.org/10.4136/ambi-agua.1492
SHACKLEY, S.; CARTER, S.; KNOWLES, T.; MIDDELINK, E.; HAEFELE, S.; SOHI, S.
et al, Sustainable gasification-biochar systems? A case-study of rice-husk gasification in
Cambodia, Part 1: Context, chemical properties, environmental and health and safety
issues. Energy Policy, v. 42, p. 49–58, 2012.
https://doi.org/10.1016/j.enpol.2011.11.026

Rev. Ambient. Água vol. 13 n. 2, e2128 - Taubaté 2018
14 Arianna Callegari et al.
SHIZAS, I.; BAGLEY, D. M. Experimental Determination of Energy Content of Unknown
Organics in Municipal Wastewater Streams. Journal of Energy Engineering, v. 130, n.
2, 2004. https://doi.org/10.1061/(ASCE)0733-9402(2004)130:2(45)
TAN, X.; LIU, Y.; ZENG, G.; WANG, X.; HUA, X.; GU, Y.; YANG, Z. Application of biochar
for the removal of pollutants from aqueous solutions. Chemosphere, v. 125, p. 70–85,
2015. https://doi.org/10.1016/j.chemosphere.2014.12.058
TORRES, E. A.; CERQUEIRA, G. S.; FERRER, T. M.; QUINTELLA, C. M.; RABONI, M.;
TORRETTA, V. et al. Recovery of different waste vegetable oils for biodiesel
production: A pilot experience in Bahia State, Brazil, Waste Management, v. 33, p.
2670–2674, 2013. https://doi.org/10.1016/j.wasman.2013.07.030
VESILIND, P. A.; RAMSEY, T. B. Effect of drying temperature on the fuel value of
wastewater sludge. Waste Management & Research, v. 14, n. 2, p. 189–196, 1996.
https://doi.org/10.1177%2F0734242X9601400208
YU, X. Y.; YING, G. G.; KOOKANA, R. S. Reduced plant uptake of pesticides with biochar
additions to soil. Chemosphere, v. 76, p. 665-671, 2009.
https://doi.org/10.1016/j.chemosphere.2009.04.001
ZANONI, A. E.; MUELLER, D. L. Calorific value of wastewater plant sludges. Journal of the
Environmental Engineering Division (ASCE), v. 108, n. 1, p. 187–195, 1982.
ZHANG, X.; YAN, S.; TYAGI, R. G.; SURAMPALLI, Y. R. Energy balance and greenhouse
gas emissions of biodiesel production from oil derived from wastewater and wastewater
sludge. Renewable Energy, v. 55, p. 392-403, 2013.
https://doi.org/10.1016/j.renene.2012.12.046
ZIELINSKA, A.; OLESZCZUK, P.; CHARMAS, B.; SKUBISZEWSKA-ZIEBA, J.;
PASIECZNA-PATKOWSKA, Z. Effect of sewage sludge properties on the biochar
characteristic. Journal of Analytical and Applied Pyrolysis, v. 112, p. 201–213, 2015.
https://doi.org/10.1016/j.jaap.2015.01.025

Ambiente & Água - An Interdisciplinary Journal of Applied Science
ISSN 1980-993X – doi:10.4136/1980-993X
www.ambi-agua.net
E-mail: [email protected]
This is an Open Access article distributed under the terms of the Creative Commons
Attribution License, which permits unrestricted use, distribution, and reproduction in any
medium, provided the original work is properly cited.
Characterization of controlled landfill leachate from the city of
Guaratinguetá - SP, Brazil
ARTICLES doi:10.4136/ambi-agua.2136
Received: 21 May 2017; Accepted: 07 Jan. 2018
André Luis de Castro Peixoto1; Rodrigo Fernando dos Santos Salazar2*;
Jayne Carlos de Souza Barboza3; Hélcio José Izário Filho3
1Instituto Federal de Educação, Ciência e Tecnologia de São Paulo (IFSP), Capivari, SP, Brasil
Departamento de Química. E-mail: [email protected] 2Universidade de Cruz Alta (UNICRUZ), Cruz Alta, RS, Brasil
Centro de Ciências da Saúde e Agrárias (CCSA), Departamento de Engenharia Ambiental e Sanitária
E-mail: [email protected] 3Escola de Engenharia de Lorena (EEL-USP), Lorena, SP, Brasil
Departamento de Engenharia Química. E-mail: [email protected], [email protected] *Corresponding author
ABSTRACT This research evaluated the physicochemical parameters of a leachate sample from a
controlled landfill in the city of Guaratinguetá-SP. The evaluation was conducted using
spectrometric and spectrophotometric methods in order to assess the formation of persistent
compounds. The selection of parameters was based on the CETESB Article 18 and CONAMA
357/05 Article 34, as well as organic characterization methods, such as FTIR, NMR (1H-NMR,
13C-NMR and APT), GC-MS, molar mass distribution and elemental analysis (CHN).
Chemical and physical stability were also verified. The ammoniacal nitrogen concentration is
20 times greater than tolerance limit established by law (20 mg L-1). The Ba and Ni presented
concentrations above those permitted by the legislation (CETESB Article 18 and CONAMA
357/05 Article 34). Those values of chemical oxygen demand (COD) and total organic carbon
(TOC) were 1013 mg L-1 and 286 mg L-1, respectively. It was not possible to determine the
biochemical oxygen demand (BOD) of slurry sample. In this sense, the biodegradability
parameter for the slurry studied was Non-Determinable (ND), indicating that the organic matter
of the slurry studied is recalcitrant. Recalcitrant humic substances of landfill leachate the
present low polydispersity. These refractory acids play a detached role in carrying pollutants in
the environment with regard to carrying toxic metals and pesticides. Finally, it was possible to
verify that the humic acids’ complexing capacity indicates that hydroxyl and carboxyl groups
may exist in larger quantities than the nitrogen and sulfur groups. Further, the high content of
metals may indicate that the waste was not properly separated.
Keywords: landfill leachate, leachate, physicochemical characterization, solid waste management,
spectroscopic methods.

Rev. Ambient. Água vol. 13 n. 2, e2136 - Taubaté 2018
2 André Luis de Castro Peixoto et al.
Caracterização do chorume proveniente do aterro controlado da
cidade de Guaratinguetá – SP, Brasil
RESUMO O objetivo deste trabalho foi avaliar os atributos físico-químicos do lixiviado de aterro
controlado na cidade de Guaratinguetá-SP por métodos espectrométricos e
espectrofotométricos para avaliar a formação de compostos persistentes. Além dos métodos de
caracterização orgânica, como FTIR, RMN (RMN 1H, RMN 13C e APT), CG-MS, distribuição
de massa molar e análise elementar (CHN), os parâmetros proporcionados no Artigo 18 da
CETESB e no artigo 34 do CONAMA 357/05. A estabilidade química e física foi verificada
medida que foi sendo feita a caracterização analítica. A concentração de nitrogênio amoniacal
é 20 vezes maior que a fornecida (20 mg L-1). Os Ba e Ni apresentaram concentrações acima
das permitidas pela legislação (Artigo 18 da CETESB e Artigo 34 da CONAMA 357/05). Os
valores de demanda química de oxigênio (DQO) e carbono orgânico total (TOC) foram de 1013
mg L-1 e 286 mg L-1, respectivamente. A demanda bioquímica de oxigênio não foi determinada.
Não foi possível determinar a demanda bioquímica de oxigênio (DBO), indicando que a matéria
orgânica da pasta estudada é recalcitrante. Substâncias húmicas recalcitrantes de aterros
lixiviam a baixa polidispersidade presente. Estes ácidos refractários desempenham um papel
destacado no transporte de poluentes no ambiente para ser capaz de transportar metais tóxicos
e pesticidas. Por fim, foi possível verificar a capacidade de complexação de ácidos húmicos que
indica que os grupos hidroxila e carboxila podem existir em maiores quantidades do que os
grupos nitrogênio e enxofre. Além disso, o alto teor de metais pode indicar que os resíduos não
foram adequadamente separados.
Palavras-chave: caracterização físico-química, chorume, gerenciamento de resíduo sólido, lixiviado de
aterro, métodos espectroscópicos.
1. INTRODUCTION
Solid wastes are defined by standard NBR 10.004:2004 (ABNT, 2004) as wastes in the
solid and semi-solid state resulting from industrial, domestic, hospital, commercial,
agricultural, services and sweeping activities (Silva et al., 2016; 2017). Their physical, chemical
and biological characteristics vary according to their source or generating activity (Klein et al.,
2017; Zhang et al., 2017a). Economic, social, geographic, educational, cultural, technological
and legal factors affect the solid-waste-generation process concerning the qualitative and
quantitative attributes (Li et al., 2017; Peng, 2017). Once generated, the waste may have its
characteristics altered due to the management employed, which may result in waste with great
harmful potential to public health and to the environment (Mandal et al., 2017; Silva et al.,
2016; 2017; Li et al., 2017).
The formerly controlled landfill in the city of Guaratinguetá, in the State of São Paulo, in
the Paraíba Valley region, worked as a garbage disposal site for 30 years, being deactivated in
2006. The controlled landfill had a total area of 30,000 m2, located on Estrada Américo Ranieri,
in the Santa Luzia Neighborhood. For many years, the landfill’s major characteristics were
stench, fly and insect proliferation, and a large number of garbage diggers with varying age
ranges. According to information from the Secretariat of Urban Services of Guaratinguetá
(Municipal Administration 2004/2007), the municipality landfill received about 60 tons of
garbage a day, produced by around 110,000 inhabitants. This controlled landfill was used to
dispose of solid urban waste (SUW) which was compacted after being deposited in the site. The

3 Characterization of controlled landfill leachate …
Rev. Ambient. Água vol. 13 n. 2, e2136 - Taubaté 2018
place is currently an Ecological Park, an initiative by the Guaratinguetá Autonomous Water and
Sewage Services (SAAEG Municipal Company).
Although the controlled landfill has been deactivated, the slurry and wastewater keep being
generated once the landfill keeps presenting decomposition reactions of the organic parcel until
the wastes disposed of have been fully stabilized (Klein et al., 2017; Mandal et al., 2017; Van
Turnhout, 2018). However, the liquid waste generated will be a polluting source of underground
waters of the whole region circumscribed for a number of years, owing to the toxic character
of the slurry gradually liberated with the decomposition of the organic matter and of the
inorganic load leaching, since the effluent is not adequately collected by means of blanket and
lateral ducts (Peng, 2017; Zhang et al, 2017a; 2017b). This occurs because this landfill does not
meet some design requirements listed in the National Policy for Solid Wastes (Brazil) (Silva et
al., 2016; 2017). It is therefore necessary to permanently characterize the physical-chemical
parameters of the leachate material from the controlled landfill as a way of monitoring the
landfill activity, and to propose solutions to possible remediation (Gomes et al., 2016; Peng,
2017; Mandal et al., 2017; Mohammad-Pajooh et al., 2017).
Nuclear Magnetic Resonance (NMR) is able to provide chemical structure information of
whole organic matter, allowing the investigation of humus-containing samples without
extraction and fractionation. Resonance regions can be assigned to lignin aromatic, alkyl, O-
substituted alkyl, carboxyl- and carbonyl-C (Lü et al., 2018). The principle means to explain
FTIR spectra is by identifying the bands relating to humus generation (e.g. unsaturated C=C,
aromatic C=C) and organic matter degradation (e.g., aliphatic, hydroxyl phenols, carboxylic
acids, N–H stretching, peptidic, C=O of carboxylic acids, ketones, and aldehydes, COO of
carboxylic acids, polysaccharides, alcohols, amines, amide, alkenes, ethers, esters). Despite the
amount of FTIR, and NMR data discussed in the literature, the mechanism of humification of
municipal waste is not yet completely understood (Lü et al., 2018). Lenz et al. (2016) studied
six different abandoned Austrian municipal landfills wherein different sections were sampled
quarterly over a period of 15 months. Several functional groups were assigned such as primary
amides, aliphatic methylene, thiole, aromatic ring modes, amines, aromatic compounds,
carboxylic acids, carboxyl groups, etc. Xiaoli et al. (2013) studied elemental analysis, Fourier
transform infrared spectroscopy (FTIR), and Carbon-13 Cross-Polarization Magic-Angle-
Spinning Nuclear Magnetic Resonance (13C CP/MAS NMR) were carried out to characterize
the chemical and structural properties of humic acids (HA) extracted from the leachate of both
semi-aerobic and anaerobic full-scale landfills. According to the study of Xiaoli et al. (2013),
when the FTIR spectra of HA from the semi-aerobic and anaerobic landfills were compared,
appreciable differences in resolution and strength of assigned peaks were found. The FTIR
spectra for the semi-aerobic landfill HA displayed relatively higher adsorption intensity at
1560 cm-1 than the anaerobic HA, which suggested that it may have more aromatic ring or NH
structures. By comparison, the relative adsorption intensity at 1120 cm-1 and 1046 cm-1 of the
anaerobic landfill was stronger than that of the HA from the semi-aerobic landfill, which
indicated that the anaerobic landfill HA contained more stabilized components, such as
polysaccharides or polysaccharide-like substances. The FTIR spectra of peaks at
1560–1575 cm-1 and 1640–50 cm-1, which, associated with aromatic C=C, strongly increased
with the extension of the stabilization process. The peaks eventually merged to become one
adsorption band at 1601–1645 cm-1. This finding suggested that the aromatic group content in
HA rose significantly over time. The FTIR spectra of intensive peaks at 1400 cm-1 relates to for
the aliphatic group content in HA. It decreased as stabilization proceeded and ultimately
disappeared, which indicates that the aliphatic group component decreased over time.
Gel Permeation Chromatography (GPC) and Elemental CHN analysis are able to
complement the characterization information from NMR and FTIR. Xiao et al. (2013)
investigated degradation of landfill leachate after its characterization (sanitary landfill from

Rev. Ambient. Água vol. 13 n. 2, e2136 - Taubaté 2018
4 André Luis de Castro Peixoto et al.
Beijing, China). The chromatogram of raw leachate had a molecular weight (MW) distribution
of UV254 active components with a retention time between 11–15 min. According to the
separation mechanism of GPC, higher MW compounds were eluted earlier. The raw leachate
consisted of higher MW compounds ranging from 300 to 2000 Da. Morozesk et al. (2017)
characterized humic acids, derived from landfill leachate (Brazil, 20° 27′ 28″ S 40° 23′ 21″ W)
by elemental analysis. The authors found C content of 398.47 g kg-1, H of 70.60 g kg-1, N of
59.78 g kg-1, and O of 471.15 g kg-1. The C/N ratio of 56.50 in landfill HA was due to high
nitrogen levels in these compounds, evidencing their potential as an important nitrogenous
source.
In this sense, we here assessed the physical-chemical and microbiological attributes of the
leachate of the controlled landfill in the city of Guaratinguetá-SP by spectrometric and
spectrophotometric methods, according to the parameters provided in CETESB Article 18 (São
Paulo, 1976) and CONAMA 357/05 Article 34 (CONAMA, 2005), and also emplyed organic
characterization methods, such as FTIR, NMR (1H-NMR, 13C-NMR and APT), GC-MS, molar
mass distribution and elemental analysis (CHN); concurrently, chemical and physical stability
was verified over time as a way of assessing the formation of compounds and complexes more
refractory to those at the moment of sampling.
2. MATERIALS AND METHODS
2.1. Sampling, reagents and solutions
The landfill of the municipality of Guaratinguetá received about 60 tons of household
waste per day, produced by about 110 thousand inhabitants. The leachate was collected in 2006
in channels arranged at the base of the municipal landfill (22° 48' 16.7" S 45° 13' 39.8" W).
Initially, the slurry “in natura” (untreated landfill slurry) was homogenized by manual stirring
in a plastic barrel, to ensure the reproducibility of the analytical results, seeing that the sample
has complex physical-chemical characteristics (elements in the colloidal form or associated to
the matter in suspension). The slurry was collected from the controlled landfill of Guaratinguetá
a single time and homogenized by mechanical stirring, finally being stored at 4ºC. The sampling
was performed according to standard NBR 9898:1987 (ABNT, 1987).
All the chemical reagents were of the P.A. degree. The mineral acids used were of the
Dinâmica brand. The metallic patterns used, with 1-mg mL-1 concentration, were of the SpecSol
brand with NIST traceability, Reagent organic solvents and other chemical reagents of the
Vetec brand.
The solutions were prepared by employing analytical degree reagents, ultrapure water
obtained from using Milli-Q (Millipore Corp, de Billerica, MA, EUA) water system at
18.2 MΩ cm resistivity, nitric and chloridric acid distilled in quartz sub-boiling (Milestone,
Sorisole, Italy). To prevent contamination, the vials, glassware and polypropylene materials
were washed and soaked in 10% v v-1 HNO3 and fully washed with deionized water.
2.2. Instrumentation
All the analytical determinations of the metallic elements of interest in the samples “in
natura” were performed in an atomic absorption spectrometer (graphite flame and oven), using
an Aanalyst 800 Model by PerkinElmer. The equipment presents a double-beam optical system
(single beam for graphite oven operation); motorized monochrome of the Littrow type for
automatically selecting wavelength, adjustment and alignment; work range from 185 to
870 nm, with 1800-line/mm diffraction grating and solid-state detector; background correction
for flame, for deuterium lamp. The graphite oven has transversal heating, providing an even
temperature profile, with background correction by longitudinal Zeeman effect.

5 Characterization of controlled landfill leachate …
Rev. Ambient. Água vol. 13 n. 2, e2136 - Taubaté 2018
Multi-elemental characterization constitutes of element determination at trace level
(μg L-1) (Ag, As, Cd, Cr, Hg, Pb and Se) and macroelements (mg L-1) (B, Ba, Cu, Sn, Fe, Mn,
Ni and Zn). The trace elements, macroelements and Hg were determined by employing
GFAAS, FAAS and CVAAS, respectively.
2.2.1. Sample preparation for multi-element determination by AAS
To reduce the interference caused by the organic matter, and to convert metals associated
to particles in a form capable of being atomized and characterized by atomic absorption
spectrometry (AAS), the recommendation is to conduct an acid-digestion stage of the effluent
(slurry) (APHA et al., 2012). Thus, the slurry acid digestion was carried out in closed system
with reflow for later determining the elements of interest based on a procedure proposed by
(Bianchi et al., 2012).
The metallic and semi-metallic elements determined in the slurry are provided by the
CETESB Article 18 (São Paulo, 1976) and by CONAMA 430 (CONAMA, 2011), specifically
dealing with characteristics of effluents to be discarded in receiving sources. The analytical
characterization of the metals was performed by the atomic absorption spectrometry technique,
with flame atomization and by graphite oven, according to the metal concentration in the
sample. To assess the repeatability and reproducibility of the sample preparations by acid
digestion, the analytical determination of the metallic elements was based on studies reporting
the use of addition and recovery tests and the use of certified reference material for
quantification by spectrometric techniques used for environmental samples (Salazar et al.,
2011a; Bianchi et al., 2012; Gomes et al., 2016).
2.3. Analysis of Chemical Oxygen Demand (COD)
Due to the complex characteristics of the samples, adjustments of 5220 methodology D.
Closed Reflux, Colorimetric Method from APHA Standard Methods were necessary to increase
the reliability of analytical results (Peixoto et al., 2008; Salazar et al., 2011b).
In this procedure, the sample was heated for 2 hours with a strong oxidizing agent,
potassium dichromate, in a closed system. The oxidation of organic compounds result from
reducing the dichromate ion to green chromic ion. The COD reagent also contains silver and
mercury ions. Silver is a catalyst, and mercury is used to control chloride interferences. To
determine the accuracy of the method, a standard solution of 850 mg L-1 potassium biphthalate
was used as the sample, which should present a result of 1,060 mg L-1 O2 (Peixoto et al., 2008).
2.4. Analysis of Total Organic Carbon (TOC) of the dissolved fraction
The samples were filtered in 0.45 μm filter and injected in the equipment with a high
temperature oven (680ºC), containing platinum catalyst under an oxygen atmosphere. The CO2
generated is analyzed by non-dispersive infrared (NDIR). For determining TOC, Shimadzu
equipment was used, Model TOC 5000A.
2.5. Physical-chemical characterization of the slurry
The physical-chemical characterization of the slurry consisted in analyzing the following
parameters: multi-elemental analysis (Ag, As, B, Ba, Cd, Co, Cr-total, Fe, Fe+2, F-1, Hg, Mn,
Ni, Pb, Se, Sn and Zn), cyanide (CN-1), phenol, odor, oils and (mineral) greases, oils and
greases, pH (25ºC), S-2, sedimentable and surfactant solids. The procedures for the physical-
chemical characterizations were extracted from Standard Methods for Examination of Water
and Wastewater (APHA et al., 2012), as presented in Table 1.

Rev. Ambient. Água vol. 13 n. 2, e2136 - Taubaté 2018
6 André Luis de Castro Peixoto et al.
Table 1. Methods and standards from Standard Methods for Examination of Water and Wastewater
22nd Ed (APHA et al., 2012) for characterizing the slurry samples.
Physical and physical-chemical Parameters Protocol or analytical method
Arsenic (As) 3114C.
Total barium (total Ba) 3111D.
Boron (B) 4500-B C.
Total Cadmium (total Cd) 3111B.
Total lead (total Pb) 3111B.
Total cyanide (total CN) 4500 CN F.
Total copper (total Cu) 3111B.
Total chromium (total Cr) 3111D.
Biochemical oxygen demand (BOD) 5210 B and Lima et al. (2006)
Tin (Sn) 3111D.
Total phenols 5530D. (Direct)
Total iron (total Fe) 3111B.
Fluoride (F-1) 4500F. D
Ferrous ion (Fe+2) 3500-Fe B
Manganese (Mn) 3111B.
Mercury (Hg) 3112B.
Total nickel (total Ni) 3111B.
Nitrogen total (mg L-1) 4500 N org B and 4500 NH3 B
Oils and greases 5520D.
pH a 25ºC NBR 9251:1986 (ABNT, 1986)
Silver (Ag) 3111B.
Selenium (Se) 3114C.
Sedimentable solids 2540F.
Sulfide (S-2) 4500- S2 D.
Surfactants 5540C.
Temperature (ºC) APHA et al. (2012)
Total zinc (total Zn) 3111B.
2.6. Organic spectroscopy characterization
2.6.1. Sample pre-treatment: extraction in organic solvent
First, 100.00 mL of leachate “in natura” were acidified up to pH 1, employing HCl
concentration. Next, the slurry was placed in a 500-mL separatory funnel. The organic matter
extraction procedure was carried out by using 3 100.00-mL aliquots of the n-hexane solvent.
After extraction for a period of 5 min each, the 3 solvent fractions were combined and the
aqueous residue was removed with anhydrous Na2SO4. The organic phase was finally
transferred to a 500-mL round-bottomed flask. After the extraction procedure stage, the organic
solvent was evaporated in a rotary evaporator (vacuum system and 50ºC bath temperature). The
same former extraction procedure was also performed by using dichloromethane and ethyl
acetate solvents. The residual matter was used for organic characterization by employing the
following analytical techniques: infrared (FTIR), nuclear magnetic resonance (protons, carbon
13 and APT - Attached Proton Test) and CHN (carbon, hydrogen and nitrogen elemental
analysis).
2.6.2. Nuclear magnetic resonance (NMR) analysis of protons, of carbon-13 and APT
NMR analyses of proton (NMR 1H), carbon 13 (NMR 13C) and APT were performed in
VARIAN equipment, Mercury Model. The sample (extraction residue) was dissolved in 0.6 mL
of deuterated chloroform – CDCl3 (99.98%) containing tetramethylsilane (TMS). The NMR

7 Characterization of controlled landfill leachate …
Rev. Ambient. Água vol. 13 n. 2, e2136 - Taubaté 2018
1H analysis was performed at a 300 MHz frequency, with 32 accumulations (nt=32). Analysis
by carbon resonance – NMR 13C and APT - was performed at a 75-MHz frequency.
2.6.3. Analysis in the infrared region (FTIR)
The sample dissolved in volatile organic solvent (chloroform) was dispersed in a tablet of
sodium chloride (NaCl), forming a film after the solvent evaporation. Spectra in the infrared
region were obtained by Fourier transform (FTIR), from 4000 to 400 cm-1, using Perkin-Elmer
equipment, Spectrum One model.
2.6.4. Elemental analysis (CHN)
The analyses of the carbon, hydrogen and nitrogen elements present in the extraction
residue (5.0 mg), were performed by the equipment Perkin-Elmer CHN 2400. The combustion
process occurred at 925ºC, using oxygen with 99.995% purity.
2.6.5. Analysis of molar mass distribution (GPC)
The molar mass distribution of the slurry was determined from the dissolved organic
fraction, using the gel permeation chromatography technique. The slurry, previously
homogenized, was filtered in 0.45 μm filter, and a 1.00 mL aliquot was diluted in a 10.0 mL
volumetric flask with the eluent (Na2HPO4.7H2O at 50 mmol L-1 + NaCl 0.15 mol L-1, in pH
12). The sample was then injected in the gel permeation chromatography instrument (GPC),
keeping the mobile phase at a constant 0.7 mL min-1 flow. The absorbance measurements were
made in three wavelength values: 210, 254 and 280 nm. GE equipment, Model ÄKTA 10
Purifier, was used with a Superose 12 column, 10/300 GL. The calibration curve was made with
standard Blue Dextran (2000 kDa), albumin (66 kDa), carbonic anhydrase (29 kDa),
cytochrome C (12.4 kDa), aprotinin (6.5 kDa) and acetone (58 Da), obtaining R2 = 0.998.
3. RESULTS AND DISCUSSION
3.1. Physicochemical characterization of the untreated landfill slurry
The physical, chemical and biological characteristics of the leachates depend on the type
of waste, on the degree of decomposition, climate, season of the year, landfill age, depth of
waste, type of landfill operation, among other things. It can thus be stated that the composition
of leachates may considerably vary from one place to another, as well as in the same site and
with the seasons of the year (MOHAMMAD-PAJOOH et al., 2017). It is therefore necessary
to obtain the largest amount of information about a particular leachate under study, correlating
its physical and chemical characteristics with the treatment processes involved. Among the
major parameters used for characterizing leachate liquids are total organic carbon (TOC),
biochemical oxygen demand (BOD), chemical oxygen demand (COD), pH, nitrogen and
ammoniacal total, solid series, and heavy metals, among other things. Table 2 shows the
physical and chemical characterization of the slurry “in natura” of the former controlled landfill
of the city of Guaratinguetá-SP, according to the CETESB Article 18 (São Paulo, 1976) and
CONAMA 430 (CONAMA, 2011) parameters.
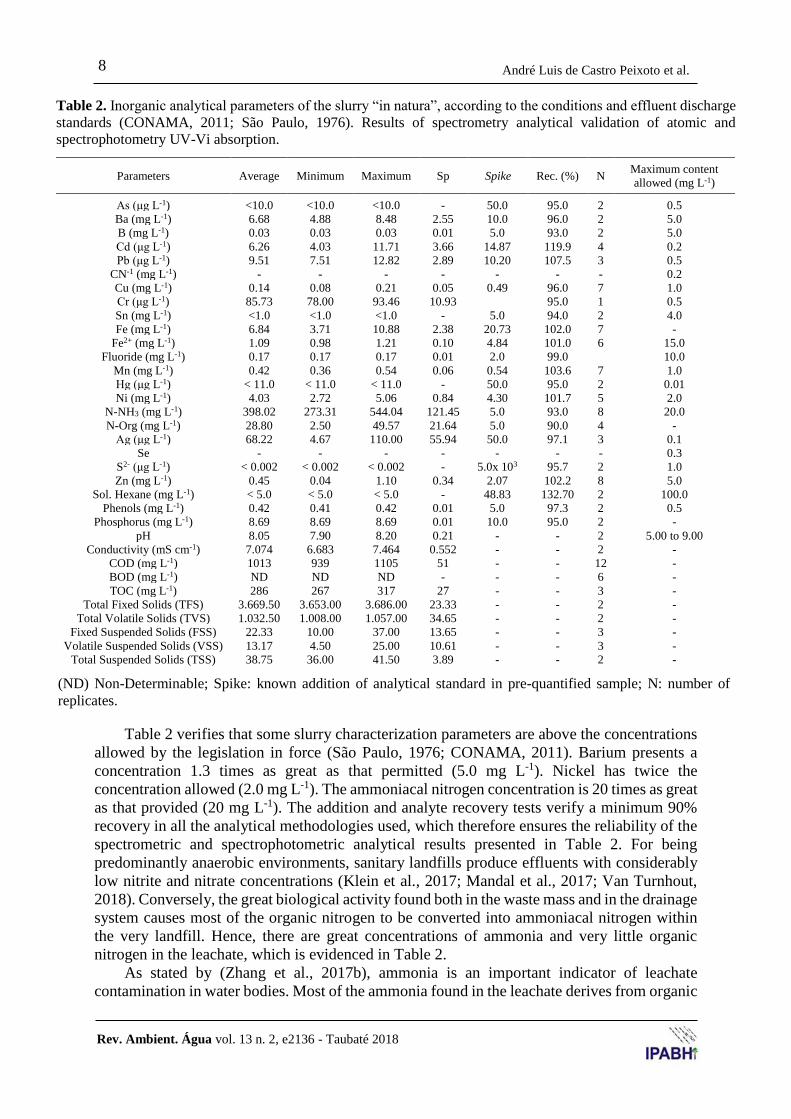
Rev. Ambient. Água vol. 13 n. 2, e2136 - Taubaté 2018
8 André Luis de Castro Peixoto et al.
Table 2. Inorganic analytical parameters of the slurry “in natura”, according to the conditions and effluent discharge
standards (CONAMA, 2011; São Paulo, 1976). Results of spectrometry analytical validation of atomic and
spectrophotometry UV-Vi absorption.
(ND) Non-Determinable; Spike: known addition of analytical standard in pre-quantified sample; N: number of
replicates.
Table 2 verifies that some slurry characterization parameters are above the concentrations
allowed by the legislation in force (São Paulo, 1976; CONAMA, 2011). Barium presents a
concentration 1.3 times as great as that permitted (5.0 mg L-1). Nickel has twice the
concentration allowed (2.0 mg L-1). The ammoniacal nitrogen concentration is 20 times as great
as that provided (20 mg L-1). The addition and analyte recovery tests verify a minimum 90%
recovery in all the analytical methodologies used, which therefore ensures the reliability of the
spectrometric and spectrophotometric analytical results presented in Table 2. For being
predominantly anaerobic environments, sanitary landfills produce effluents with considerably
low nitrite and nitrate concentrations (Klein et al., 2017; Mandal et al., 2017; Van Turnhout,
2018). Conversely, the great biological activity found both in the waste mass and in the drainage
system causes most of the organic nitrogen to be converted into ammoniacal nitrogen within
the very landfill. Hence, there are great concentrations of ammonia and very little organic
nitrogen in the leachate, which is evidenced in Table 2.
As stated by (Zhang et al., 2017b), ammonia is an important indicator of leachate
contamination in water bodies. Most of the ammonia found in the leachate derives from organic
Parameters Average Minimum Maximum Sp Spike Rec. (%) N Maximum content
allowed (mg L-1)
As (μg L-1) <10.0 <10.0 <10.0 - 50.0 95.0 2 0.5
Ba (mg L-1) 6.68 4.88 8.48 2.55 10.0 96.0 2 5.0
B (mg L-1) 0.03 0.03 0.03 0.01 5.0 93.0 2 5.0
Cd (μg L-1) 6.26 4.03 11.71 3.66 14.87 119.9 4 0.2
Pb (μg L-1) 9.51 7.51 12.82 2.89 10.20 107.5 3 0.5
CN-1 (mg L-1) - - - - - - - 0.2
Cu (mg L-1) 0.14 0.08 0.21 0.05 0.49 96.0 7 1.0
Cr (μg L-1) 85.73 78.00 93.46 10.93 95.0 1 0.5
Sn (mg L-1) <1.0 <1.0 <1.0 - 5.0 94.0 2 4.0
Fe (mg L-1) 6.84 3.71 10.88 2.38 20.73 102.0 7 -
Fe2+ (mg L-1) 1.09 0.98 1.21 0.10 4.84 101.0 6 15.0
Fluoride (mg L-1) 0.17 0.17 0.17 0.01 2.0 99.0 10.0
Mn (mg L-1) 0.42 0.36 0.54 0.06 0.54 103.6 7 1.0
Hg (μg L-1) < 11.0 < 11.0 < 11.0 - 50.0 95.0 2 0.01
Ni (mg L-1) 4.03 2.72 5.06 0.84 4.30 101.7 5 2.0
N-NH3 (mg L-1) 398.02 273.31 544.04 121.45 5.0 93.0 8 20.0
N-Org (mg L-1) 28.80 2.50 49.57 21.64 5.0 90.0 4 -
Ag (μg L-1) 68.22 4.67 110.00 55.94 50.0 97.1 3 0.1
Se - - - - - - - 0.3
S2- (μg L-1) < 0.002 < 0.002 < 0.002 - 5.0x 10³ 95.7 2 1.0
Zn (mg L-1) 0.45 0.04 1.10 0.34 2.07 102.2 8 5.0
Sol. Hexane (mg L-1) < 5.0 < 5.0 < 5.0 - 48.83 132.70 2 100.0
Phenols (mg L-1) 0.42 0.41 0.42 0.01 5.0 97.3 2 0.5
Phosphorus (mg L-1) 8.69 8.69 8.69 0.01 10.0 95.0 2 -
pH 8.05 7.90 8.20 0.21 - - 2 5.00 to 9.00
Conductivity (mS cm-1) 7.074 6.683 7.464 0.552 - - 2 -
COD (mg L-1) 1013 939 1105 51 - - 12 -
BOD (mg L-1) ND ND ND - - - 6 -
TOC (mg L-1) 286 267 317 27 - - 3 -
Total Fixed Solids (TFS) 3.669.50 3.653.00 3.686.00 23.33 - - 2 -
Total Volatile Solids (TVS) 1.032.50 1.008.00 1.057.00 34.65 - - 2 -
Fixed Suspended Solids (FSS) 22.33 10.00 37.00 13.65 - - 3 -
Volatile Suspended Solids (VSS) 13.17 4.50 25.00 10.61 - - 3 -
Total Suspended Solids (TSS) 38.75 36.00 41.50 3.89 - - 2 -

9 Characterization of controlled landfill leachate …
Rev. Ambient. Água vol. 13 n. 2, e2136 - Taubaté 2018
matter degradation. The major nitrogenous organic compounds which act as a source of
ammonia are proteins. Proteins are organic macromolecules formed by the combination of a
large number of amino acids. In biological decomposition, proteins are first broken into their
amino acids, which then undergo deamination (removal of the amine group). Part of the
ammonia produced is incorporated in the cell growth and its excess is released as ammonium
ion (NH4+) (Van Turnhout, 2018).
Even though phosphorous is not provided by CETESB Article 18 (São Paulo, 1976) or by
CONAMA 357/05 article 34 (CONAMA, 2005), its concentration in the slurry is considerable,
and its high contents significantly influence the eutrophication processes of aquatic biota. The
main chemical element used to control eutrophication is phosphorous, since the cyanobacteria
are capable of fixing atmospheric nitrogen, not allowing the reduction in nitrogen concentration
with the reduction in affluent load (Von Sperling, 2005; Peng, 2017). Practically the whole of
the phosphorus found in leachates is in the form of orthophosphates (Van Turnhout, 2018).
They act as an alkaline cover, contributing to the partial alkalinity (pH=8.05, Table 2).
Phosphates derive mainly from organic matter (Li et al., 2017).
Table 2 shows the low results for COD (1,013 mg L-1), for BOD (ND) and for TOC
(286 mg L-1). The biodegradability parameter obtained for the slurry studied was Non-
Determinable (ND), indicating that the organic matter of the slurry studied is recalcitrant (Fan
et al., 2007). BOD5/COD ratio values below 0.05 are characteristic of stabilized leachates, non-
treatable by biological methods (Deng, 2007). The fraction of organic matter oxidizable by
potassium dichromate, in the COD technique, was obtained by the TOC/COD ratio, with a 0.28
response (Li et al., 2017; Peng, 2017; Van Turnhout, 2018).
The BOD and COD concentrations tend to suffer reductions during the degradation of the
landfill wastes over the years. However, BOD decreases faster in relation to COD, which
remains in the leachate due to the organic matter, which is difficult to degrade. Theoretically,
these stability stages of sanitary landfills can be divided in function of the BOD/COD ratio
observed in the leachates; namely: BOD/COD > 0.5 mg L-1 indicates a new and unstable
landfill; 0.1 < BOD/COD < 0.5 indicates a moderately stable landfill; BOD/COD < 0.1 indicates
an old and stable landfill. All this information justifies the low COD (1,013 mg L-1) value and
the negligible value of BOD (< 5.0 mg L-1), once the former controlled landfill of Guaratinguetá
- SP had been active for about 30 years, on the date the leachate studied was collected. Also
verified were the concentrations of the total inorganic and organic solids, which, despite not
considering specificity, the results help to analytically assess the untreated landfill slurry (Peng,
2017; Van Turnhout, 2018; Zhang et al., 2017b).
Table 2 includes the STF/STV ratio, which shows that the total inorganic fraction found in
the leachate is 3.6 times as great as the total organic fraction. Part of the STF is indicated by the
inorganic compounds shown in Table 2. The suspension matter, however, shows that the
organic fraction, given by the SSV/SSF ratio, corresponds to about 59% of the total. Heavy
metals do not originate in chemical reactions; they will only appear in the leachate if they have
been introduced in the landfill. These metals are not necessarily a symptom that there are
industrial wastes being illegally disposed of. Metals are present in all materials, including living
beings. Domestic wastes, especially when not adequately separated at their origin, may be a
significant source of metals. Moreover, another highly important metal source, especially iron,
is the clayey soil used in cover layers and in waterproofing systems. The minerals found in the
clay used in cover layers may be degraded by the carbonic acid found in rainwater, which
derives from the atmosphere CO2. This process releases metals which infiltrate the landfill
together with water, and may or not become a part of the leachate (Peng, 2017; Van Turnhout,
2018; Zhang et. al., 2017a).
During the organic matter stabilization process, the biodegradable fraction of the
compounds discharged in the municipal landfill is consumed, being replaced with refractory

Rev. Ambient. Água vol. 13 n. 2, e2136 - Taubaté 2018
10 André Luis de Castro Peixoto et al.
organic compounds. It is therefore necessary to collect a larger amount of information about
this class of compounds, which predominate in leachates, by means of different chemical
characterization techniques, including FTIR and NMR (protons, carbon 13 and APT)
spectroscopy analyses, besides the distribution of molecular mass and of elemental analysis.
Figure 1 shows the FTIR graph of the slurry “in natura” obtained after the liquid-liquid
extraction procedure.
Figure 1. Infrared spectrum by Fourier transform (FTIR) of the slurry “in
natura” residue obtained by extraction in ethyl acetate.
The spectrum in the infrared region by Fourier transform (FTIR) presented in Figure 1 is
characterized by transmittance bands corresponding to the aromatic, aliphatic, carboxylic and
hydroxyl groups (Christensen et al., 1998). A wide band is verified in the region between 2300
and 3600 cm-1, characteristic of organic acids, as expected in slurry, the main group of organic
compounds of which are humic and fulvic acids, with a marked presence of carboxylic groups
and of weak acid groups, such as the phenolic ones (Christensen et al., 1998). In 3419 cm-1,
there is a characteristic band of hydroxyls. A 3047 cm-1 transmittance band is characteristic of
aromatic rings in general, and may correspond, for example, to phenolic groups. 2961, 2927
and 2873 cm-1 bands correspond to carbon/hydrogen bonds of the CH, CH2 and CH3 types of
organic aliphatic chains. At 1726 cm-1, the carbonyl band (C=O) predominates and, at
1367 cm-1, CH3 groups bonded to carbonyl (Chai et al., 2007; Huo et al., 2008). The main
mechanism for adsorbing pollutants (e.g. metals and pesticides) in organic matter dissolved in
underground waters, including the class of humic acids, is ionic exchange involving the
hydroxyl groups (3419 cm-1 transmittance band) and carbonyls from carboxylic acids
(1,726 cm-1) (Dia et al., 2017; Van Turnhout et al, 2018).
The analyses by nuclear magnetic resonance provide basic structural information on the
organic matter found in the leachate under study, confirming and complementing the data
presented by the FTIR technique. By analyzing NMR 1H, relative quantitative mass information
can be obtained, as opposed to the FTIR technique, which is essentially qualitative. Table 3
shows the results from the de NMR 1H and 13C analyses, and Figure 2 shows the ATP spectrum
of the slurry “in natura”.

11 Characterization of controlled landfill leachate …
Rev. Ambient. Água vol. 13 n. 2, e2136 - Taubaté 2018
Table 3. Regions of chemical displacement of 1H and the respective relative contributions
of the organic compounds extracted from the slurry “in natura”.
Regions δ (ppm) of
chemical displacement Attribution
Relative
contribution (%)
I (0.4-1.7) Protons of terminal CH3 and protons of CH2, CH
from methylene chains, etc.
72.3
II (1.7-3.3) Protons of CH3, CH2 and CH linked to aromatic
or carboxylic groups, etc.
16.1
III (3.3-4.6) Protons of carbon α linked to oxygen,
carbohydrates, etc.
7.1
IV (6.5-8.1) Aromatic protons (including quinone, phenol,
etc.)
4.5
Characteristic peaks of aromatic protons were verified in the region between 8.1 and
7.5 ppm. The intense peak found in the 7.27 ppm region corresponds to the deuterated
chloroform solvent used in the analysis. Peaks between 4.6 and 3.3 correspond to carbon
protons linked to oxygen (e.g. carbohydrates). Peaks from 1.7 to 0.4 ppm, are characteristic of
CH3, CH2 and CH of aliphatic chains. In the proton spectrum, the different regions were
quantified, according to (Kang et al., 2002).
Most of the protons analyzed (about 72%) derive from CH3, CH2 and CH of aliphatic
chains. Also found in large proportions (~16%) were CH3, CH2 and CH protons linked to
aromatic groups and/or carboxylic groups. Carbon protons linked to oxygen (~7%) and
aromatic protons (4,5%) were found in small proportions.
Figure 2. NMR 13C spectrum of the extraction residue of the slurry “in
natura”.
NMR 13C analyses indicated intense and well-defined peaks in the region of the chemical
displacement from 0 to 50 ppm, corresponding to aliphatic carbons. In a region comprehended
between 50 and 70 ppm, characteristic peaks of methyl and methylene groups close to
heteroatoms were found, such as CH3 of the acetyl group. Between 120 and 140 ppm, the
presence of aromatic carbons was verified. Lastly, peaks between 160 and 180 ppm were
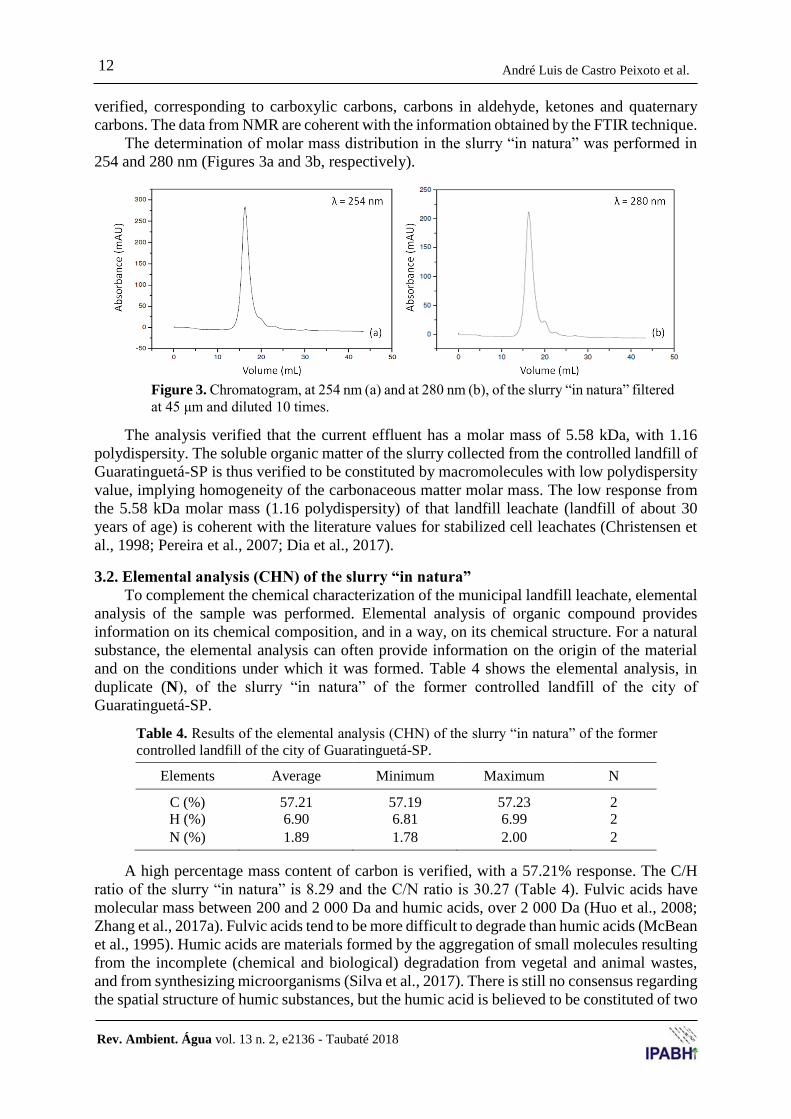
Rev. Ambient. Água vol. 13 n. 2, e2136 - Taubaté 2018
12 André Luis de Castro Peixoto et al.
verified, corresponding to carboxylic carbons, carbons in aldehyde, ketones and quaternary
carbons. The data from NMR are coherent with the information obtained by the FTIR technique.
The determination of molar mass distribution in the slurry “in natura” was performed in
254 and 280 nm (Figures 3a and 3b, respectively).
Figure 3. Chromatogram, at 254 nm (a) and at 280 nm (b), of the slurry “in natura” filtered
at 45 μm and diluted 10 times.
The analysis verified that the current effluent has a molar mass of 5.58 kDa, with 1.16
polydispersity. The soluble organic matter of the slurry collected from the controlled landfill of
Guaratinguetá-SP is thus verified to be constituted by macromolecules with low polydispersity
value, implying homogeneity of the carbonaceous matter molar mass. The low response from
the 5.58 kDa molar mass (1.16 polydispersity) of that landfill leachate (landfill of about 30
years of age) is coherent with the literature values for stabilized cell leachates (Christensen et
al., 1998; Pereira et al., 2007; Dia et al., 2017).
3.2. Elemental analysis (CHN) of the slurry “in natura”
To complement the chemical characterization of the municipal landfill leachate, elemental
analysis of the sample was performed. Elemental analysis of organic compound provides
information on its chemical composition, and in a way, on its chemical structure. For a natural
substance, the elemental analysis can often provide information on the origin of the material
and on the conditions under which it was formed. Table 4 shows the elemental analysis, in
duplicate (N), of the slurry “in natura” of the former controlled landfill of the city of
Guaratinguetá-SP.
Table 4. Results of the elemental analysis (CHN) of the slurry “in natura” of the former
controlled landfill of the city of Guaratinguetá-SP.
Elements Average Minimum Maximum N
C (%) 57.21 57.19 57.23 2
H (%) 6.90 6.81 6.99 2
N (%) 1.89 1.78 2.00 2
A high percentage mass content of carbon is verified, with a 57.21% response. The C/H
ratio of the slurry “in natura” is 8.29 and the C/N ratio is 30.27 (Table 4). Fulvic acids have
molecular mass between 200 and 2 000 Da and humic acids, over 2 000 Da (Huo et al., 2008;
Zhang et al., 2017a). Fulvic acids tend to be more difficult to degrade than humic acids (McBean
et al., 1995). Humic acids are materials formed by the aggregation of small molecules resulting
from the incomplete (chemical and biological) degradation from vegetal and animal wastes,
and from synthesizing microorganisms (Silva et al., 2017). There is still no consensus regarding
the spatial structure of humic substances, but the humic acid is believed to be constituted of two

13 Characterization of controlled landfill leachate …
Rev. Ambient. Água vol. 13 n. 2, e2136 - Taubaté 2018
main components: aromatic rings deriving from lignin and nitrogen from microorganism
proteins (Dia et al., 2017). These rings are linked among them, be they condensed or not. The
humic acids complexing capacity indicates that hydroxyl and carboxyl groups may exist in
larger quantities than the nitrogen and sulfur groups. Carbon corresponds to 58% of the mass.
This, added to the set of results presented for COD, BOD, FTIR, NMR, GPC and CHN,
therefore indicates that the slurry of Guaratinguetá-SP is mainly constituted of humic acids, of
difficult biodegradation, and able to form chelates with the metals present in aqueous medium
(Table 2), solubilizing them even in basic medium (pH=8.05, Table 2).
These refractory acids play an important role by conveying pollutants to the environment
by being able to form metallic chelates, for transporting pesticides in general and for being
precursors of mutagenic products with supply-water chlorination (Wiszniowski et al., 2004).
Humic substances have varied chemical composition. The variations in the degree of
polymerization, in the number of lateral and radical chains that may be found in humic
substances, account for there not being two identical humic molecules.
4. CONCLUSIONS
The leachate from the municipal landfill of Guaratinguetá (Sao Paulo, Brazil) is composed
of a high content of salts, ammonia, and of recalcitrant humic substances. Ba and Ni with
concentrations above those permitted by legislation is an indication that domestic wastes are
not adequately separated in the households. Furthermore, the recalcitrant humic substances
presented low polydispersity, with molecular mass characteristic of leachates from stabilized
municipal landfills, with marked presence of aliphatic chains, aromatic rings in general,
phenolic, and carboxylic groups. These refractory acids play a detached role in carrying
pollutants in the environment by being able to carry toxic metals (forming metallic chelates
even in basic medium) and pesticides in general; further, these substances are precursors of
mutagenic products with the chlorination of supply water.
5. REFERENCES
AMERICAN PUBLIC HEALTH ASSOCIATION - APHA; AMERICAN WATER WORKS
ASSOCIATION – AWWA; WATER ENVIRONMENT FEDERATION - WEF.
Standard methods for examination of water and wastewater. 22nd. ed. Washington,
DC, 2012.
ASSOCIAÇÃO BRASILEIRA DE NORMAS TÉCNICAS - ABNT. NBR 9251: Water -
Determination of pH - Electrometric method - Test method. 1 ed. Rio de Janeiro, 1986.
ASSOCIAÇÃO BRASILEIRA DE NORMAS TÉCNICAS - ABNT. NBR 9898: Preservation
and sampling techniques of liquid effluents and receptor bodies – Procedure. 1 ed. Rio de
Janeiro, 1987.
ASSOCIAÇÃO BRASILEIRA DE NORMAS TÉCNICAS - ABNT. NBR 10004: Solid waste
– Classification. 1 ed. Rio de Janeiro, 2004.
BIANCHI, S. R. et al. Evaluation of a Collision-Reaction Interface (CRI) for Carbon Effect
Correction on Chromium Determination in Environmental Samples by ICP-MS.
Analytical Letters, v. 45, n. 18, p. 2845–2855, 30 Nov. 2012.
https://doi.org/10.1080/00032719.2012.702176
CHAI, X. et al. Spectroscopic studies of the progress of humification processes in humic
substances extracted from refuse in a landfill. Chemosphere, v. 69, n. 9, p. 1446–1453,
Nov. 2007. https://doi.org/10.1016/j.chemosphere.2007.04.076

Rev. Ambient. Água vol. 13 n. 2, e2136 - Taubaté 2018
14 André Luis de Castro Peixoto et al.
CHRISTENSEN, J. B. et al. Characterization of the dissolved organic carbon in landfill
leachate-polluted groundwater. Water Research, v. 32, n. 1, p. 125–135, 1998.
https://doi.org/10.1016/S0043-1354(97)00202-9
CONSELHO NACIONAL DO MEIO AMBIENTE – CONAMA. Resolução nº 357/2005, de
17 de março de 2005. Diário Oficial [da] União, Brasília, n. 53, p. 58-63, 18 mar. 2005.
CONSELHO NACIONAL DO MEIO AMBIENTE – CONAMA. Resolução nº 430/2011, de
13 de maio de 2011. Diário Oficial [da] União, Brasília, n. 92, p. 89, 16 maio 2011.
DENG, Y. Physical and oxidative removal of organics during Fenton treatment of mature
municipal landfill leachate. Journal of Hazardous Materials, v. 146, n. 1–2, p. 334–
340, 2007. https://doi.org/10.1016/j.jhazmat.2006.12.026
DIA, O. et al. Electrocoagulation of bio-filtrated landfill leachate: Fractionation of organic
matter and influence of anode materials. Chemosphere, v. 168, p. 1136–1141, 2017.
https://doi.org/10.1016/j.chemosphere.2016.10.092
FAN, H.-J. et al. Using FeGAC/H2O2 process for landfill leachate treatment. Chemosphere,
v. 67, n. 8, p. 1647–1652, 2007. https://doi.org/10.1016/j.chemosphere.2006.09.075
GOMES, B. C. V. et al. Potencial toxicológico de metais presentes em solos de cemitérios de
Santa Maria - RS. Revista Ambiente & Agua, v. 11, n. 1, 2016.
https://doi.org/10.4136/ambi-agua.1723
HUO, S. et al. Characteristics of dissolved organic matter (DOM) in leachate with different
landfill ages. Journal of Environmental Sciences, v. 20, n. 4, p. 492–498, 2008.
https://doi.org/10.1016/S1001-0742(08)62085-9
KANG, K.-H.; SHIN, H. S.; PARK, H. Characterization of humic substances present in landfill
leachates with different landfill ages and its implications. Water Research, v. 36, n. 16,
p. 4023–4032, 2002. https://doi.org/10.1016/S0043-1354(02)00114-8
KLEIN, K. et al. A pilot study of three-stage biological–chemical treatment of landfill leachate
applying continuous ferric sludge reuse in Fenton-like process. Clean Technologies and
Environmental Policy, v. 19, n. 2, p. 541-551, 2017. https://doi.org/10.1007/s10098-
016-1245-5
LENZ, S.; BÖHM, K.; OTTNER, R.; HUBER-HUMER, M. Determination of leachate
compounds relevant for landfill aftercare using FT-IR spectroscopy. Waste
Management, v. 55, p. 321-329, 2016. https://doi.org/10.1016/j.wasman.2016.02.034
LI, Y. L. et al. Simultaneous chemical oxygen demand removal, methane production and heavy
metal precipitation in the biological treatment of landfill leachate using acid mine
drainage as sulfate resource. Journal of Bioscience and Bioengineering, v. 124, n. 1, p.
71-75, 2017. https://doi.org/10.1016/j.jbiosc.2017.02.009
LIMA, L. S.; IZÁRIO FILHO, H. J.; CHAVES, F. J. M. Determinação da demanda bioquímica
de oxigênio para teores≤ 5 mg L-1 O2. Revista Analítica, v. 25, n. 2, p. 52-57, 2006.
LÜ, F. et al. Application of advanced techniques for the assessment of bio-stability of biowaste-
derived residues: A minireview. Bioresource Technology, v. 248, p. 122-133, 2018.
https://doi.org/10.1016/j.biortech.2017.06.045
MANDAL, P. et al. Review on landfill leachate treatment by electrochemical oxidation:
Drawbacks, challenges and future scope. Waste Management, v. 69, p. 250-273, 2017.
https://doi.org/10.1016/j.wasman.2017.08.034

15 Characterization of controlled landfill leachate …
Rev. Ambient. Água vol. 13 n. 2, e2136 - Taubaté 2018
MCBEAN, E. A.; ROVERS, F. A.; FARQUHAR, G. J. Solid waste landfill engineering and
design. New Jersey: Prentice-Hall PTR, 1995.
MOHAMMAD-PAJOOH, E.; WEICHGREBE, D.; CUFF, G. Municipal landfill leachate
characteristics and feasibility of retrofitting existing treatment systems with
deammonification – A full scale survey. Journal of Environmental Management, v.
187, p. 354–364, 2017. https://doi.org/10.1016/j.jenvman.2016.10.061
MOROZESK, M. et al. Effects of humic acids from landfill leachate on plants: An integrated
approach using chemical, biochemical and cytogenetic analysis. Chemosphere, v. 184,
p. 309-317, 2017. https://doi.org/10.1016/j.chemosphere.2017.06.007
PEIXOTO, A. L. C. et al. Prediction of chemical oxygen demand in mature landfill leachate
doped with Fenton’s reagent, using empirical mathematical model obtained by full
factorial design. Química Nova, v. 31, n. 7, 2008. http://dx.doi.org/10.1590/S0100-
40422008000700008
PENG, Y. Perspectives on technology for landfill leachate treatment. Arabian Journal of
Chemistry, v. 10, p. S2567-S2574, 2017. https://doi.org/10.1016/j.arabjc.2013.09.031
PEREIRA, J. A. et al. Walnut (Juglans regia L.) leaves: Phenolic compounds, antibacterial
activity and antioxidant potential of different cultivars. Food and Chemical Toxicology,
v. 45, n. 11, p. 2287–2295, 2007. https://doi.org/10.1016/j.fct.2007.06.004
SALAZAR, R. F. S.; ALCÂNTARA, M. A. K. DE; IZÁRIO FILHO, H. J. Evaluation of sample
preparation methods and optimization of nickel determination in vegetable tissues.
Revista Brasileira de Ciência do Solo, v. 35, n. 1, p. 241–248, 2011a.
http://dx.doi.org/10.1590/S0100-06832011000100022
SALAZAR, R. F. S.; CARROCCI, J. S.; IZÁRIO FILHO, H. J. Employment of factorial design
to evaluate the organic loading and aeration of biological systems in the degradation of
dairy wastewater. Revista Ambiente & Água, v. 6, n. 3, p. 98-109, 2011b.
https://doi.org/10.4136/ambi-agua.522
SÃO PAULO (Estado). Decreto nº 8468, de 8 de setembro de 1976. Prevenção e o controle da
poluição do meio ambiente. Diário Oficial [do] Estado, São Paulo, p. 4, 9 set. 1976.
SILVA, T. F. C. V. et al. An innovative multistage treatment system for sanitary landfill
leachate depuration: Studies at pilot-scale. Science of The Total Environment, v. 576,
p. 99–117, 2017. https://doi.org/10.1016/j.scitotenv.2016.10.058
SILVA, T. F. C. V. et al. Scale-up and cost analysis of a photo-Fenton system for sanitary
landfill leachate treatment. Chemical Engineering Journal, v. 283, p. 76-88, 2016.
https://doi.org/10.1016/j.cej.2015.07.063
VAN TURNHOUT, A. G. et al. Theoretical analysis of municipal solid waste treatment by
leachate recirculation under anaerobic and aerobic conditions. Waste Management, v.
71, p. 246-254, 2018. https://doi.org/10.1016/j.wasman.2017.09.034
VON SPERLING, M. Introdução à qualidade das águas e ao tratamento de esgotos. 3. ed.
Belo Horizonte: UFMG, 2005.
WISZNIOWSKI, J. et al. Solar photocatalytic degradation of humic acids as a model of organic
compounds of landfill leachate in pilot-plant experiments: influence of inorganic salts.
Applied Catalysis B: Environmental, v. 53, n. 2, p. 127–137, Oct. 2004.
https://doi.org/10.1016/j.apcatb.2004.04.017

Rev. Ambient. Água vol. 13 n. 2, e2136 - Taubaté 2018
16 André Luis de Castro Peixoto et al.
XIAOLI, C. et al. Spectroscopic studies of the effect of aerobic conditions on the chemical
characteristics of humic acid in landfill leachate and its implication for the environment.
Chemosphere, v. 91, n. 7, p. 1058-1063, 2013.
https://doi.org/10.1016/j.chemosphere.2013.01.052
ZHANG, C. et al. Degradation of refractory organics in biotreated landfill leachate using high
voltage pulsed discharge combined with TiO 2. Journal of Hazardous Materials, v.
326, p. 221–228, 2017a. https://doi.org/10.1016/j.jhazmat.2016.12.034
ZHANG, W. et al. Optimization for zeolite regeneration and nitrogen removal performance of
a hypochlorite-chloride regenerant. Chemosphere, v. 178, p. 565–572, 2017b.
https://doi.org/10.1016/j.chemosphere.2017.03.091

Ambiente & Água - An Interdisciplinary Journal of Applied Science
ISSN 1980-993X – doi:10.4136/1980-993X
www.ambi-agua.net
E-mail: [email protected]
This is an Open Access article distributed under the terms of the Creative Commons
Attribution License, which permits unrestricted use, distribution, and reproduction in any
medium, provided the original work is properly cited.
The historical influence of tributaries on the water and sediment of
Jacuí’s Delta, Southern Brazil
ARTICLES doi:10.4136/ambi-agua.2150
Received: 15 Jun. 2017; Accepted: 07 Jan. 2018
Leonardo Capeleto de Andrade1*; Rodrigo da Rocha Andrade2; Flávio Anastácio de
Oliveira Camargo1
1Universidade Federal do Rio Grande do Sul (UFRGS), Porto Alegre, RS, Brasil
Departamento de Solos. E-mail: [email protected], [email protected] 2Departamento Municipal de Água e Esgotos (DMAE), Porto Alegre, RS, Brasil
E-mail: [email protected] *Corresponding author
ABSTRACT The high population density in a metropolis leads to socio-environmental impacts that
directly affect local water resources. This work evaluated the historical data (between 2000 and
2014) of water and sediment monitoring in the Jacuí’s Delta region and analyzed the
relationship between these sites. Seven monitoring sites around the Jacuí's Delta were
evaluated: the outflow of the rivers Jacuí, Caí, Sinos, and Gravataí; the channels Ilha da Pintada
and Navegantes; and Lake Guaíba. Water data were evaluated for: air and water temperature;
depth; pH; electrical conductivity; transparency; turbidity; dissolved oxygen; biochemical
oxygen demand; phosphorus; nitrogen; total residues; and escherichia coli. Sediment were
evaluated for pseudo-total concentrations of metals (Al, Fe, Ca, Mn, Ba, V, Zn, Cu, Pb, Cr, Ni,
Co, Li, Be, Cd, Hg, As, and Ag). The quality of water and sediment in the Jacuí's Delta are
linked with the tributaries and priority flows of the channels. The historical data of water and
sediment around the Jacuí's Delta shows the influence of the tributaries with low quality in the
downstream points. The pollution of the rivers Caí, Sinos, and Gravataí negatively affects the
environmental quality of the channel Navegantes and Lake Guaíba (catchment points to water
supply). The water in those sites presents reductions in dissolved oxygen and high values of
coliforms, and the sediment shows high concentrations of metal Zn, Pb, Cr, and Hg. Despite
the reduction in Pb and Hg values in the sediment over the past years, pollution from the
tributary rivers still persists.
Keywords: monitoring, pollution, watershed.
A influência histórica dos afluentes na água e sedimento do Delta do
Jacuí, RS, Brasil
RESUMO A grande densidade populacional nas metrópoles gera impactos socioambientais que
afetam diretamente os recursos hídricos locais. O objetivo deste trabalho foi avaliar os dados
históricos (entre 2000 e 2014) de monitoramento de água e sedimentos na região Delta de Jacuí
e analisar a relação entre esses locais. Foram avaliados sete locais de monitoramento entorno
do Delta de Jacuí: foz dos rios Jacuí, Caí, Sinos e Gravataí; canais Ilha da Pintada e Navegantes;
e Lago Guaíba. Os dados de água foram avaliados para: temperatura do ar e da água;

Leonardo Capeleto de Andrade et al.
Rev. Ambient. Água vol. 13 n. 2, e2150 - Taubaté 2018
2
profundidade; pH; condutividade elétrica; transparência; turbidez; oxigênio dissolvido;
demanda bioquímica de oxigênio; fósforo; nitrogênio; resíduos totais; e escherichia coli. Os
sedimentos foram avaliados para concentrações pseudo-totais de metais (Al, Fe, Ca, Mn, Ba,
V, Zn, Cu, Pb, Cr, Ni, Co, Li, Be, Cd, Hg, As e Ag). A qualidade da água e dos sedimentos no
delta de Jacuí está ligada aos afluentes e fluxos prioritários dos canais. Os dados históricos de
água e sedimentos no Delta de Jacuí mostram a influência dos afluentes com baixa qualidade
nos pontos a jusante. A poluição dos rios Caí, Sinos e Gravataí afeta negativamente a qualidade
ambiental do canal Navegantes e do Lago Guaíba (pontos de captação para abastecimento
hídrico). A água nesses locais apresenta reduções no oxigênio dissolvido e grandes valores de
coliformes e o sedimento apresenta grandes concentrações dos metais Zn, Pb, Cr e Hg. Apesar
da redução ao longo dos anos nos valores de Pb e Hg no sedimento, a poluição dos rios
tributários ainda persiste.
Palavras-chave: bacia hidrográfica, monitoramento, poluição.
1. INTRODUCTION
The large expansion of big cities results in environmental impacts on local water resources,
which often serve as a source of water for the same populations (Cavalcanti et al., 2014). Trace
metals entering aquatic ecosystems through runoff or atmospheric deposition and eventually
accumulate in sediments (Bing et al., 2016).
Lake Guaíba is the major source of water in the capital of the Rio Grande do Sul State. The
lake has had historical, economic and cultural importance for the region since the 18th century.
With almost 500 km² of shallow waters, Lake Guaíba is the final destination of the rivers Jacuí,
Caí, dos Sinos, and Gravataí - accumulating potential liabilities generated in the drainage basin.
Water pollution in Lake Guaíba’s watershed has been noted since the end of 1950 (Freitas,
1962; Roessler, 2005), persisting for decades as a public perception. Nowadays, the waters have
multiples uses: as water supply, sewage dilution, navigation, as well as fishing (Andrade et al.,
2018).
The Jacuí’s Delta (Figure 1) is an area of protection and great socio environmental interest,
being the archipelago of a State Conservation Unit. This work evaluated the historical data
(between 2000 and 2014) of water and sediments monitoring, developed by the Municipal
Department of Water and Sewage (Dmae) of Porto Alegre in the Jacuí’s Delta region. This
work also analyzed the relationship between the sites.

3 The historical influence of tributaries …
Rev. Ambient. Água vol. 13 n. 2, e2150 - Taubaté 2018
Figure 1. Sampling sites (31 - Gravataí River; 36 – Navegantes Channel; 41B -
Lake Guaíba; 57 - Jacuí River; 58 - Caí River; 59 - dos Sinos River; 86A – Ilha
da Pintada Channel) of water and sediment in Jacuí’s Delta. The darker area in
the state map represents the lake’s drainage basin. Source: Google Maps.
2. MATERIALS AND METHODS
Analyses of water and sediment monitoring were carried out by the Municipal Department
of Water and Sewage (Dmae) of Porto Alegre, RS, between 2000 and 2014. The seven sites
evaluated around the Jacuí's Delta (Figure 1) were: 31 - Gravataí River outflow
(29°58'12,6" S; 51°11'53,6" W); 36 – Navegantes Channel (30°00'52,1" S; 51°12'54,2" W);
41B - Lake Guaíba (30°03'32,7" S; 51°14'10,3" W); 57 - Jacuí River outflow
(29°57'07,3" S; 51°19'21,2" W); 58 - Caí River outflow (29°55'51,7" S; 51°17'05,3" W);
59 - Sinos River outflow (29°55'49,0" S; 51°14'14,9" W); and 86A – Ilha da Pintada Channel
(30°00'49,0" S; 51°15'34,2" W). Some of these sites are points of water catchment for Water
Treatment Plants (WTP): 36 - São João and Moinhos de Ventos; 41B - Menino Deus; and 86A
- Ilha da Pintada. Site numbers are standards codes defined by Dmae.
Water data, with monthly repetitions between the years 2000 and 2014, were evaluated
for: air and water temperature; depth; pH; electrical conductivity (EC); transparency (secchi
disk); turbidity (NTU); dissolved oxygen (DO - modified Winkler); biochemical oxygen
demand (BOD5 - manometric); total phosphorus (P - titulometric); total nitrogen (N -
titulometric); total residues at 105°C (TR105 - gravimetric); and escherichia coli (enzymatic
substrate). Sediment (bulk) was oven-dried (50°C) and evaluated, with two annual repetitions
in distinct seasons between the years of 2000 and 2011, to pseudo-total (USEPA, 2007)
concentrations (dry basis) of metals (Al, Fe, Ca, Mn, Ba, V, Zn, Cu, Pb, Cr, Ni, Co, Li, Be, Cd,
Hg, As, and Ag) and analyzed by atomic absorption spectrophotometry.
Data were submitted to analysis of variance (ANOVA) and, when significant, means were
compared by Tukey test with a 95% confidence interval (p<0.05). All graphs and statistical
analyzes were developed in Statistica® v13 software.

Leonardo Capeleto de Andrade et al.
Rev. Ambient. Água vol. 13 n. 2, e2150 - Taubaté 2018
4
3. RESULTS AND DISCUSSION
The quality of water and sediment in the Jacuí's Delta are linked with the tributaries and
priority flows of the channels (Figure 1). Lake Guaíba has a historical mean water inflow of
780 m³ s-1 (with occasional events exceeding 3000 m³ s-1). This inflow is composed mostly
(85%) of waters from Jacuí River (point 57) and the remaining by the Rivers Sinos, Caí, and
Gravataí (flowing into the Jacuí's Delta), as well as small streams along the margins (Menegat
et al., 2006; Andrade Neto et al., 2012; Porto Alegre, 2017b).
The relationship of the forming rivers with the Jacuí's Delta is observed in the cluster
analysis (Figure 2a), such at Points 57 (Jacuí River outflow) and 86A (the channel of the Jacuí
Delta - Ilha da Pintada). However, the greatest influence of the tributaries is verified by the
accumulation of liabilities of the Rivers Caí (58), Sinos (59), and Gravataí (31) over the channel
Navegantes (36) and Lake Guaíba (41B). The Rivers Caí and Sinos flow through regions with
many industries, especially leather and footwear; and Gravataí River flows through the
metropolitan region of Porto Alegre.
The pollution from tributaries can be verified by the increase in electrical conductivity
(EC), biochemical oxygen demand (BOD5), P, N, TR105, and coliforms in water (Table 1),
and metals (such as Zn, Cu, Pb, Cr, Ni, and Hg) in the surface sediment (Table 2) in the
downstream points (such as 36 and 41B). Consequences of these changes are reductions in pH,
dissolved oxygen (DO), and water transparency - which can result in damage to local biota.
These parameters have direct and indirect connections with the urban pollution commonly
present in metropolitan regions (Figure 2b). Metals and other pollutants enter the aquatic
environment by various ways and sources (natural and anthropogenic), such as runoff, sewage,
atmospheric deposition, and vehicular traffic (Smol, 2008; Bing et al., 2016). High vehicular
traffic has been reported around the world as a potential source of pollution by metals (Zhang
et al., 2016; Sharley et al., 2016). Motor vehicles have a variety of emissions and releases
involving many toxic metals (such as Zn, Cr, Cu, Hg, Ni, and Pb), which damage human health
and the environment (Adamiec et al., 2016).

5 The historical influence of tributaries …
Rev. Ambient. Água vol. 13 n. 2, e2150 - Taubaté 2018
Figure 2. Analysis of (a) clusters for the sites and (b) principal components for water
and sediment in Jacuí's Delta.

6
1
1
1
1
Leonardo Capeleto de Andrade et al. 6
Rev. Ambient. Água vol. 13 n. 2, e2150 - Taubaté 2018
Table 1. Historical means (2000 to 2014) of water parameters around the Jacuí's Delta.
Parameters 31 36 41B 57 58 59 86A
Gravataí River Navegantes Lake Guaíba Jacuí River Caí River Sinos River Ilha da Pintada
air temperature (ºC) 22.0±0.4 a 21.8±0.4 a 21.0±0.4 a 21.0±0.4 a 21.2±0.4 a 21.5±0.4 a 21.5±0.4 a
water temperature (ºC) 21.6±0.4 a 21.2±0.4 a 21.2±0.4 a 21.1±0.4 a 20.8±0.4 a 20.9±0.4 a 21.1±0.4 a
depth (m) 4.5±0.1 ed 6.6±0.0 c 9.6±0.1 a 8.7±0.0 b 4.4±0.1 e 4.6±0.0 d 4.0±0.0 f
pH 6.9±0.0 d 7.0±0.0 bc 7.0±0.0 b 7.2±0.0 a 7.0±0.0 b 6.9±0.0 cd 7.2±0.0 a
EC (µS cm-1) 185.6±7.7 a 88.1±1.4 cd 80.8±1.1 d 54.0±0.6 e 97.6±2.7 c 132.8±3.9 b 54.4±0.7 e
Transparency (cm) 26.1±0.7 d 43.1±1.2 bc 44.6±1.3 abc 54.2±2.3 a 48.4±1.9 abc 39.2±1.1 c 51.3±2.7 ab
Turbidity (NTU) 38.9±1.6 a 31.1±1.1 a 32.5±1.4 a 36.4±2.6 a 36.6±2.5 a 33.2±1.5 a 36.7±2.3 a
DO (mg O2 L-1) 2.65±0.16 e 5.92±0.09 c 6.06±0.07 bc 7.93±0.08 a 6.54±0.09 b 3.86±0.12 d 7.76±0.08 a
BOD5 (mg O2 L-1) 8.22±0.48 a 1.95±0.06 bc 1.77±0.06 bcd 0.77±0.04 e 1.22±0.06 cde 2.64±0.11 b 0.87±0.05 de
Phosphorus (mg L-1) 0.54±0.03 a 0.19±0.01 bc 0.16±0.00 cd 0.08±0.00 e 0.12±0.01 de 0.21±0.00 b 0.08±0.00 e
Nitrogen (mg L-1) 5.96±0.27 a 2.17±0.07 c 2.00±0.06 c 1.29±0.03 d 1.97±0.05 c 3.17±0.12 b 1.26±0.04 d
TR105 (mg L-1) 161.1±4.4 a 104.5±2.2 d 99.8±1.8 d 93.8±3.2 d 118.3±2.9 c 131.9±2.9 b 92.8±2.7 d
Coliforms (NMP 100mL-1) 3.8x10⁴±2x10³ a 1.5x10⁴±1x10³ b 1.2x10⁴±690 b 210±46 c 446±117 c 2.9x10³±249 c 423±79 c
N 170 161 161 173 174 173 162
The means (±SE) followed by the same letter (in the comparative between sites) did not differ statistically from each other by the Tukey test at 95% confidence.
EC - Electrical Conductivity; DO - Dissolved Oxygen; BOD5 - Biochemical Oxygen Demand; TR105 = Total solid residue at 105°C. N = average number of data
per sampling site.

Rev. Ambient. Água vol. 13 n. 2, e2150 - Taubaté 2018
7
1
1
1
1
The historical influence of tributaries … 7
Table 2. Historical means (2000 to 2011) of metals in surface sediments around the Jacuí's Delta.
Parameters 31 36 41B 57 58 59 86A
Gravataí River Navegantes Lake Guaíba Jacuí River Caí River Sinos River Ilha da Pintada
Al (mg g-1) 45.9±3.2 abc (1) 54.3±4.3 a 44.5±5.5 abc 33.9±2.5 bc 47.7±3.5 ab 30.4±2.9 c 31.5±2.9 bc
Fe (mg g-1) 28.6±2.9 b 38.4±1.9 b 34.4±4.6 b 36.3±3.5 b 52.5±2.9 a 30.6±2.9 b 32.2±1.8 b
Ca (mg g-1) - 3.6±0.2 a 1.9±0.3 b - - - 2.3±0.2 b
Mn (mg kg-1) 276.4±12.4 d 484.7±36.0 bc 423.6±40.8 cd 661.7±48.6 b 929.2±42.4 a 438.6±31.8 cd 539.3±62.7 bc
Ba (mg kg-1) 179.1±11.5 ab 196.0±11.4 a 138.7±16.9 bc 196.9±11.2 a 229.0±9.4 a 121.9±9.1 c 187.5±14.7 ab
V (mg kg-1) - 120.0±10.6 a 72.5±13.7 a 60.0 (2) - - 110.4±11.4 a
Zn (mg kg-1) 295.8±19.8 a 347.7±16.7 a 131.3±16.4 b 79.3±5.1 c 141.1±8.4 b 172.5±15.0 b 74.5±4.6 c
Cu (mg kg-1) 64.3±4.7 b 103.5±6.2 a 41.0±6.7 c 52.4±5.0 bc 65.5±4.5 b 43.2±3.7 c 39.2±3.1 c
Pb (mg kg-1) 50.0±4.2 a 62.7±4.6 a 26.1±3.7 b 20.7±3.4 b 29.9±3.5 b 19.7±3.5 b 24.8±2.9 b
Cr (mg kg-1) 33.1±3.6 b 51.8±3.6 a 22.1±2.8 bc 21.6±1.7 bc 51.1±4.8 a 54.4±4.4 a 18.0±1.2 c
Ni (mg kg-1) 22.8±2.1 b 37.3±2.5 a 18.9±2.5 b 22.9±2.3 b 42.2±2.9 a 26.2±2.6 b 20.8±2.0 b
Co (mg kg-1) - 28.5±1.8 a 15.3±2.0 b 15.0 (2) - - 21.6±1.6 b
Li (mg kg-1) - 14.8±1.1 a 8.2±1.5 b - - - 8.3±0.7 b
Be (mg kg-1) - 2.53±0.30 a 2.11±0.34 a 1.00 (2) - - 2.26±0.33 a
Cd (mg kg-1) 0.22±0.02 a 0.25±0.04 a 0.21±0.03 a 0.25±0.03 a 0.29±0.04 a 0.20±0.03 a 0.23±0.03 a
Hg (mg kg-1) 0.16±0.01 b 0.43±0.04 a 0.12±0.02 bc 0.05±0.00 c 0.08±0.01 bc 0.16±0.02 b 0.06±0.00 c
As (mg kg-1) ND ND ND ND ND ND ND
Ag (mg kg-1) ND ND ND ND ND ND ND
N 16 16 17 17 16 17 16
(1) The means (±SE) followed by the same letter (in the comparative between sites) did not differ statistically from each other by the Tukey test at 95% confidence. (2) No repetitions. ND = not detected. N = average number of data per sampling site.

8
Rev. Ambient. Água vol. 13 n. 2, e2150 - Taubaté 2018
Leonardo Capeleto de Andrade et al.
According to the Brazilian reference values for surface waters (Table 3), Conama No.
357 – Class 2 (Conama, 2005), Points 31 (Gravataí River) and 59 (dos Sinos River) surpass the
mean values for DO and Coliforms (Table 1). However, self-purification re-establishes the DO
levels in the Navegantes Channel (36), but does not reduce the coliform levels below the
resolution limits.
According to the Brazilian reference values for dredged sediments (Level 1) of Conama
No. 454 (Conama, 2012), the mean values were above the limits proposed in sediment for Zn
(at Points 31, 36, 41B, 58, and 59), Pb (31 and 36), Cr (36, 58, and 59) and Hg (36). The site
that presented the most values above the limits (besides the highest concentrations) was 36
(Navegantes Channel), where the water flow from all those rivers accumulate . Sites 57 (Jacuí
River) and 86A (Ilha da Pintada Channel) did not present any values above the proposed limits.
Site 41B (Lake Guaíba) only presents the concentrations of Zn above the limit.
The association of the analyzed parameters is corroborated by the correlation (r) of their
attributes. The increase in P and N concentrations leads to an increase in BOD5 (0.72 and 0.70,
respectively; p<0.05), which in turn reduces DO concentrations (-0.62; p<0.05). This chain
reaction occurs by the eutrophication of the water, consuming the oxygen available for the
decomposition of the organic compounds from urban pollution (Andrade and Giroldo, 2014).
Previous studies in the Jacuí’s Delta and Lake Guaíba show seasonal variations and the
negative influence of pollution on river water quality and phytoplankton composition
(Rodrigues et al., 2007; Andrade et al., 2012; Andrade and Giroldo, 2014). These studies point
to the Gravataí River outflow (Point 31) as a highly degraded point relative to other points, as
can be seen in the cluster analysis (Figure 2a).
Considering the historical values, the time (years) and the seasonality (months) had
influence on the water parameters (Table 3) in Lake Guaíba (site 41B). Time (years) presents
correlations (r) with the depth (-0.80), pH (-0.73), and electrical conductivity (0.73); and the air
temperature (seasonal variation in the months) presents correlations (r) with the depth (-0.86),
pH (0.83), dissolved oxygen (-0.85) and phosphorus (-0.80). The monthly variations (depth,
pH, DO, and P) can be explained by the rainy seasons, with more rainfall in the winter (Aug -
140 mm) and less between the summer-autumn (Apr - 86 mm), influencing the water flow in
the lake (Porto Alegre, 2017a). The reduction in the depth through the years (2000-2014) is
natural, due to the deposition of sediments. However, the reduction of pH and increase of
electrical conductivity (EC) probably occurred due to pollution.
Time (years) influenced the sediment (Table 4), reducing the concentration of some
elements (Ca, Mn, Ba, V, Pb, Co, Li, Be, and Hg). The reduction in values of Pb (r -0.90; R²
0.80) and Hg (r -0.82; R² 0.67) is especially significant given the high toxicity of both metals.
This decrease occurred throughout the world by the environmental pressure to control these
priority metals (Bing et al., 2016).
The Rivers Caí, Gravataí, and Sinos are publicly known for their pollution, flowing
through industrial areas in a metropolitan region, suffering many environmental impacts. Thus,
the remediation and protection of Jacuí's Delta and Lake Guaíba are made even more complex
by the liabilities upstream.

9
1
1
1
1
9 The historical influence of tributaries …
Rev. Ambient. Água vol. 13 n. 2, e2150 - Taubaté 2018
Table 3. Historic data (means) of water parameters in the site 41B - Lake Guaíba.
Parameters air water depth pH EC Secchi Turbidity DO BOD5 P N TR105 Coliforms
dates ºC ºC m - µS cm-1 cm NTU mg L-1 mg L-1 mg L-1 mg L-1 mg L-1 MPN
2000 20.7 21.2 10.5 7.4 79.9 27.9 47.0 6.19 1.72 - 2.15 112.2 12,575
2001 23.1 22.2 10.4 7.2 73.3 31.7 38.4 5.68 1.66 - 2.40 103.6 13,575
2002 21.7 21.0 10.8 7.2 72.1 35.8 32.6 6.32 1.63 0.14 1.58 97.4 10,191
2003 22.8 22.1 10.3 7.0 77.9 36.8 36.9 5.65 1.44 0.19 1.77 91.0 7,339
2004 20.4 21.1 9.8 6.9 80.5 48.8 27.7 6.37 2.01 0.15 1.66 92.0 9,591
2005 21.4 21.3 9.2 7.1 84.3 52.5 25.1 6.46 2.15 0.14 1.78 99.4 12,091
2006 21.3 21.5 9.5 7.1 82.3 53.3 27.2 6.24 2.01 0.15 2.40 90.7 11,308
2007 21.6 21.3 9.3 6.8 77.7 44.6 31.9 5.88 1.65 0.15 2.15 112.3 11,083
2008 19.5 21.2 9.4 7.0 79.8 46.7 29.4 5.95 1.87 0.19 1.95 104.3 14,854
2009 20.6 21.2 9.4 7.0 80.8 46.3 31.0 6.06 1.55 0.15 1.97 99.7 13,308
2010 19.6 20.3 9.5 7.1 80.4 40.0 32.0 6.38 1.48 0.17 1.84 93.7 13,366
2011 21.0 20.6 8.7 6.8 79.7 41.3 36.4 6.26 1.95 0.18 2.47 93.3 19,250
2012 22.0 22.0 8.7 7.0 92.9 53.8 28.6 5.72 2.28 0.15 2.56 104.7 9,336
2013 19.5 20.7 8.5 6.9 88.1 44.5 29.3 5.72 1.51 0.15 2.04 99.4 14,872
2014 17.3 17.8 9.7 6.9 88.6 36.7 40.4 5.60 1.05 0.14 2.08 113.5 6,750
r year -0.62 -0.57 -0.80 -0.73 0.73 0.41 -0.26 -0.29 -0.16 -0.01 0.29 0.10 0.14
Jan 27.2 27.1 9.3 7.2 75.5 48.2 25.9 5.79 1.59 0.14 1.82 92.3 9,743
Feb 26.5 27.2 9.3 7.2 81.4 49.3 22.3 5.84 1.82 0.12 1.76 82.7 10,057
Mar 26.2 25.7 9.3 7.1 76.2 50.0 24.4 5.64 1.63 0.13 1.54 96.1 10,621
Apr 22.0 22.6 9.2 7.1 84.3 54.6 25.2 6.02 1.72 0.14 1.58 86.7 10,909
May 18.0 18.3 9.7 6.9 84.1 51.3 25.1 6.33 1.48 0.15 1.85 100.1 12,260
Jun 17.0 16.0 9.9 7.0 85.3 43.5 30.8 6.69 1.70 0.18 2.10 101.6 16,115
Jul 13.3 14.8 9.8 6.9 86.9 37.5 47.3 6.86 2.35 0.20 2.48 110.4 13,564
Aug 16.7 15.8 9.7 6.9 81.1 37.9 35.0 6.56 1.70 0.17 2.30 108.4 11,179
Sep 17.1 17.7 9.9 7.0 78.3 32.5 41.0 6.23 1.91 0.17 1.96 105.4 13,254
Oct 20.6 20.7 9.8 6.9 76.6 34.7 45.0 5.57 1.69 0.18 2.19 111.2 13,847
Nov 23.9 23.7 9.4 7.1 80.6 33.9 41.2 5.53 1.82 0.17 2.30 101.9 11,577
Dez 23.5 24.9 9.5 7.1 79.6 43.2 26.4 5.71 1.90 0.16 1.82 99.9 14,700
r air ºC - 0.99 -0.86 0.83 -0.62 0.45 -0.60 -0.85 -0.43 -0.80 -0.65 -0.71 -0.59
Conama No. 357 - - - 6 - 9 - - 100 5 5 0.05 3.7 - 1,000

10 Leonardo Capeleto de Andrade et al.
Rev. Ambient. Água vol. 13 n. 2, e2150 - Taubaté 2018
Table 4. Historic data (means) of metals in surface sediments in the site 41B - Lake Guaíba.
Year Al Fe Ca Mn Ba V Zn Cu Pb Cr Ni Co Li Be Cd Hg
mg g-1 mg kg-1
2000 45.8 57.0 2.7 680 275 130 218 81.0 49.0 38.5 23.0 23.0 18.0 4.0 0.30 0.25
2001 72.4 47.7 2.8 696 220 185 219 - 50.0 40.5 36.5 27.0 17.5 3.5 0.25 0.24
2002 69.5 47.1 2.8 695 - 130 209 - 30.0 39.0 42.0 33.0 13.0 4.0 0.10 0.21
2003 - - - - - - - - - - - - - - - -
2004 27.3 25.5 1.7 425 140 75 93.0 - 25.0 11.0 16.5 13.5 6.00 1.5 0.30 0.08
2005 13.6 15.3 1.3 281 85 35 83.0 28.0 30.0 9.5 11.0 11.5 2.00 1.0 0.10 0.08
2006 13.6 18.5 1.2 317 80 30 70.5 28.5 25.0 13.0 12.0 10.0 2.50 1.0 0.20 0.07
2007 33.6 28.3 1.0 505 175 70 125 49.0 10.0 22.0 19.5 14.0 9.50 2.0 0.10 0.06
2008 40.7 34.4 - 335 140 40 212 68.0 13.0 33.5 27.5 18.5 8.00 1.0 0.30 0.14
2009 84.9 - - 313 93 24 65.5 27.1 11.4 14.5 9.19 5.50 4.50 - 0.16 0.08
2010 48.5 - - 214 75 20 58.2 28.0 10.3 12.0 8.21 5.14 3.78 0.6 0.17 0.04
2011 60.1 - - 249 70 20 78.0 23.0 16.0 14.0 9.00 6.00 4.00 1.0 0.10 0.07
R² 0.00 0.54 0.92 0.76 0.66 0.76 0.47 0.44 0.80 0.42 0.47 0.67 0.59 0.72 0.15 0.67
r 0.02 -0.74 -0.96 -0.87 -0.81 -0.87 -0.69 -0.66 -0.90 -0.65 -0.69 -0.82 -0.77 -0.85 -0.39 -0.82
mean 46.4 34.2 1.93 428 135 69.0 130 41.6 24.5 22.5 19.5 15.2 8.07 1.96 0.19 0.12
±se 7.1 5.3 0.31 56 22 16.9 21 7.8 4.4 3.8 3.5 2.8 1.74 0.43 0.03 0.02
No detection for As and Ag. No differences between months. R² - coefficient of determination; r - correlation coefficient; ±se – standard error.

The historical influence of tributaries …
Rev. Ambient. Água vol. 13 n. 2, e2150 - Taubaté 2018
11
4. CONCLUSIONS
The historical data of water and sediment around the Jacuí's Delta shows the influence of
the tributaries with low quality in the downstream points. The pollution of the Rivers Caí, Sinos,
and Gravataí negatively affect the environmental quality of Navegantes Channel and Lake
Guaíba (catchment points to water supply). The water in those sites present reductions in
dissolved oxygen and high values of coliforms, and the sediment shows high concentrations of
metal Zn, Pb, Cr, and Hg. Despite a reduction in past years in Pb and Hg values in the sediment,
pollution from the tributary rivers persists.
5. ACKNOWLEDGEMENTS
We thank the Municipal Department of Water and Sewage (Dmae) of Porto Alegre for the
data and the National Council for Scientific and Technological Development (CNPq) for the
doctoral scholarship to the first author.
6. REFERENCES
ADAMIEC, E.; JAROSZ-KRZEMINSKA, E.; WIESZALA, R. Heavy metals from non-
exhaust vehicle emissions in urban and motorway road dusts. Environmental
Monitoring and Assessment, v. 188, n. 6, p. 369-379, 2016.
http://dx.doi.org/10.1007/s10661-016-5377-1
ANDRADE NETO, J. S.; RIGON, L. T.; TOLDO JR., E. E.; SCHETTINI, C. A. F. Descarga
sólida em suspensão do sistema fluvial do Guaíba, RS, e sua variabilidade temporal.
Pesquisas em Geociências, v. 39, n. 2, p. 161-171, 2012.
ANDRADE, L. C.; TIECHER, T.; OLIVEIRA, J. S.; ANDREAZZA, R.; INDA, A. V.;
CAMARGO, F. A. O. Sediment pollution in margins of the Lake Guaíba, Southern Brazil.
Environmental Monitoring and Assessment, n. 190, n. 3, p. 13, 2018.
http://dx.doi.org/10.1007/s10661-017-6365-9
ANDRADE, R. R.; COLARES, E. R. C.; KRIGGER, S. S.; MAIZONAVE, C. R. M.;
MORANDI, I. C. Lago Guaíba (RS): índice de qualidade da água – IQA, 2000 a 2009.
ECOS Técnica, n. 4, p. 5-14, 2012.
ANDRADE, R. R.; GIROLDO, D. Limnological characterisation and phytoplankton seasonal
variation in a subtropical shallow lake (Lake Guaíba, Brazil): a long-term study. Acta
Limnologica Brasiliensia, v. 26, n. 4, p. 442-456, 2014.
http://dx.doi.org/10.1590/S2179-975X2014000400011
BING, H.; WU, Y.; ZHOU, J.; LI, R.; WANG, J. Historical trends of anthropogenic metals in
Eastern Tibetan Plateau as reconstructed from alpine lake sediments over the last century.
Chemosphere, v. 148, p. 211-219, 2016.
http://dx.doi.org/10.1016/j.chemosphere.2016.01.042
CAVALCANTI, P. P.; RODRIGUES, L. C. A.; BEIJO, L. A.; BARBOSA, S.; XAVIER, T.
T.; MAGALHÃES, F. Contamination from an affluent of Furnas reservoir by trace
metals. Brazilian Journal of Biology, n. 74, p. 877-885, 2014.
http://dx.doi.org/10.1590/1519-6984.07013

Leonardo Capeleto de Andrade et al.
Rev. Ambient. Água vol. 13 n. 2, e2150 - Taubaté 2018
12
CONSELHO NACIONAL DO MEIO AMBIENTE – CONAMA (Brasil). Resolução No. 357,
de 17 de março de 2005. Dispõe sobre a classificação dos corpos de água e diretrizes
ambientais para o seu enquadramento, bem como estabelece as condições e padrões de
lançamento de efluentes, e dá outras providências. Diário Oficial [da] União, Brasília,
DF, 18 mar 2005.
CONSELHO NACIONAL DO MEIO AMBIENTE – CONAMA (Brasil). Resolução No. 454,
de 01 de novembro de 2012. Estabelece as diretrizes gerais e os procedimentos
referenciais para o gerenciamento do material a ser dragado em águas sob jurisdição
nacional. Diário Oficial [da] União, Brasília, DF, 08 set 2012.
FREITAS, A. F. R. O destino dos esgotos de Porto Alegre em face da poluição do Guaíba.
Porto Alegre: Ed. da Universidade do Rio Grande do Sul, 1962. 39 p.
MENEGAT, R.; PORTO, M. L.; CARRARO, C. C.; FERNANDES, L. A. A. (Coord.). Atlas
ambiental de Porto Alegre. 3. ed. Porto Alegre: Editora da UFRGS, 2006. 228 p.
PORTO ALEGRE. Centro Integrado de Comando - CEIC. Dados históricos das estações
meteorológicas. Available in:
http://www2.portoalegre.rs.gov.br/ceic/default.php?p_secao=28. Access in May 2017.
PORTO ALEGRE. Departamento Municipal de Água e Esgotos - Dmae. Lago Guaíba.
Available in: http://www2.portoalegre.rs.gov.br/dmae/default.php?p_secao=197. Access
in: Feb. 2017.
RODRIGUES, S. C.; TORGAN, L.; SCHWARZBOLD, A. Composição e variação sazonal da
riqueza do fitoplâncton na foz de rios do delta do Jacuí, RS, Brasil. Acta Botanica
Brasilica, v. 21, n. 3, p. 707-721, 2007. http://dx.doi.org/10.1590/S0102-
33062007000300017
ROESSLER, H. L. O Rio Grande do Sul e a ecologia. 2. ed. Porto Alegre: Governo do Estado
do Rio Grande do Sul/SEMA/FEPAM, 2005. 219 p.
SHARLEY, D. J.; SHARP, S. M.; BOURGUES, S.; PETTIGROVE, V. J. Detecting long-term
temporal trends in sediment-bound trace metals from urbanized catchments.
Environmental Pollution, v. 219, p. 705-713, 2016.
http://dx.doi.org/10.1016/j.envpol.2016.06.072
SMOL, J. P. Pollution of lakes and rivers: a paleoenvironmental perspective. 2nd ed. Malden:
Blackwell Publishing, 2008.
UNITED STATES. Environmental Protection Agency - USEPA. Method 3051A: Microwave
assisted acid digestion of sediments, sludges, soils, and oils. Washington, 2007.
ZHANG, Z.; WANG, J. J.; ALI, A.; DELAUNE, R. D. Heavy metals and metalloid
contamination in Louisiana Lake Pontchartrain Estuary along I-10 Bridge.
Transportation Research Part D: Transport and Environment, v. 44, p. 66-77, 2016.
http://dx.doi.org/10.1016/j.trd.2016.02.014
Ambiente & Água - An Interdisciplinary Journal of Applied Science
ISSN 1980-993X – doi:10.4136/1980-993X
www.ambi-agua.net
E-mail: [email protected]
This is an Open Access article distributed under the terms of the Creative Commons
Attribution License, which permits unrestricted use, distribution, and reproduction in any
medium, provided the original work is properly cited.
Segregation of solid waste from a fish-processing industry:
a sustainable action
ARTICLES doi:10.4136/ambi-agua.2155
Received: 07 Jul. 2017; Accepted: 17 Jan. 2018
Yeda dos Santos Silva1; Liliana Pena Naval2*
1Universidade Federal do Tocantins (UFT), Palmas, TO, Brasil
Programa de Pós-Graduação em Ciências do Ambiente. E-mail: [email protected] 2Universidade Federal do Tocantins (UFT), Palmas, TO, Brasil
Departamento de Engenharia Ambiental. E-mail: [email protected] *Corresponding author
ABSTRACT
Segregation techniques represent a sustainable alternative to minimize wastes of raw
material in processing industries. This study considered the premise; its purpose was to use
segregation techniques to determine the theoretical removal rate of solid compounds present in
processing effluents, in order to support the sustainable development of the fish industry. The
removal rates obtained for different treatments were evaluated for the parameters: total solids,
organic matter and oils and greases, and the efficiency of the segregation of the effluent streams
in the different stages of fish processing was evaluated through descriptive statistical analysis.
The segregation recovered from 31% to 70% of total solids; from 15% to 97.50% of organic
matter, and from 10% to 63% of oils and greases. These results indicates that the raw material
can be used in new products, leading to reduced final-effluent concentration.
Keywords: effluent streams, fish industry, separation processes.
Segregação dos resíduos sólidos na indústria processadora de pescado:
uma ação sustentável
RESUMO A segregação é uma alternativa para redução do desperdício de matéria-prima durante o
processamento do pescado, uma vez que removem das correntes de efluentes, os resíduos
sólidos. Considerando-se a premissa, objetivou-se neste estudo, determinar a taxa de remoção
teórica de compostos sólidos presentes em efluentes do processamento, empregando técnicas
de segregação, como ação voltada para o desenvolvimento sustentável da indústria do pescado.
Foram avaliadas taxas de remoção alcançadas, por diferentes tratamentos, para os parâmetros:
sólidos totais, matéria orgânica e óleos e graxas, e verificada a eficiência da segregação das
correntes de efluente, nas diferentes etapas do processamento do pescado, por meio de análise
estatística descritiva. A segregação recuperou de 31% a 70% de sólidos totais; de 15% a 97,50%
de matéria orgânica, e de 10% a 63% de óleos e graxas, que poderão ser empregados como
matéria prima para novos produtos, permitindo minimizar a concentração do efluente final.
Palavras-chave: correntes de efluente, indústria do pescado, processos de separação.

Rev. Ambient. Água vol. 13 n. 2, e2155 - Taubaté 2018
2 Yeda dos Santos Silva et al.
1. INTRODUCTION
Food waste is a current reality, from initial processing through distribution to the final
consumer, part of the raw material that reaches the food-processing industries is wasted. This
factor contributes to the generation of liquid and solid waste (ONU, 2012), which reduces food
availability and increases the polluting potential of the food industry. The fish-processing
industry is considered to be one of the industries that generate waste with maximum load
(Chowdhury et al., 2010; Cristovão et al., 2012; 2015).
The effluent generated during the processing of this product includes soluble, colloidal and
particulate forms of organic contaminants (Chowdhury et al., 2010), including proteins,
nutrients, oils and greases (Muthukumaran and Baskaran, 2013). The main solid waste
produced consists of scales, meat, bones, cartilage and viscera (Anh et al., 2011). In processing,
the disposal of these residues is between 50 and 70% of the processed fish Hernández et al.,
2013; Feltes et al., 2010, Herpandi et al., 2011; Monteiro, 2013; Rustad et al., 2011; Silva et al.,
2014). Of this volume of generated waste, approximately half is equivalent to organic materials
(Bugalo et al., 2012), and lacks a suitable site for disposal (Morais et al., 2013). However, due
to the high organic load, the potential pollutant of the final effluent is high, and should be
considered (Cosmann et al., 2009; Hernández et al., 2013; Bugalo et al., 2012).
However, the search for sustainability generates goals such as the reduction of waste and
the search for an increase in the efficiency of the production chain (Love et al., 2015; ONU,
2012), food availability and natural resources. Also, cleaner production, such as reuse,
recycling, and other green technologies is encouraged instead of using the disposal and the end-
of-pipe treatment for waste management (Wu et al., 2013). This necessitates the search for
alternatives applicable to food processing, which reduce the volume of the waste generated, as
well as economic valuation for the by-products produced (Lago, 2015; Lopes et al., 2015; FAO,
2014).
In this scenario, segregation presents itself as a management option for the waste
generated, and can be applied during the processing of the food or later, in the pre-treatment
phase, before the processing effluent comes into contact with the effluent generated in the pre-
treatment phase, in order to reduce the risk of contamination, minimize the effluent flow, and
reduce the cost of treatment and final disposal of the waste (Johanson, 2014; Alonso et al.,
2010; Lopes et al., 2015; Mittal, 2006). Segregation is accomplished by adopting several
techniques including: decantation, sieving, and filtration, which are unitary operations and can
be used to recover part of the solid waste present in the effluent, the presence of which increases
the pollutant load and requires more complexes treatments (Bezama et al., 2012).
The segregation depends on the characteristics of the constituent material. Thus, for
example, different operations are required when the sedimentation, sedimentation capacity and
density difference of the material are preponderant, so that the process takes place efficiently.
For sieving and filtration, which use the same principle of particle separation, one should
consider the size of the material to be separated (Johanson, 2014; Sutherland, 2011; 2013). It is
necessary to study the fish production process and the effluent generated in the different steps.
The implementation of segregation depends on the type and volume of effluent produced and
the chief generating points. This study analyzed the theoretical efficiency of segregation applied
to the different streams of effluents produced in a fish warehouse to reduce solids, organic
matter and oils and greases, in order to support the sustainable development for the fish-
processing industry.

3 Segregation of solid waste from …
Rev. Ambient. Água vol. 13 n. 2, e2155 - Taubaté 2018
2. MATERIALS AND METHODS
2.1. Processing of raw material
The study was carried out in a fish warehouse located in the northern region of Brazil,
which processes 1687.50 kg/month of fish. The species processed were Colossoma
macropomumi (tambaqui), Brycon cephalus (matrinxã), Pseudoplatysto macorruscans
(pintado) and Leporinus freiderici (piau). The raw material was processed through evisceration
and cooling in four steps: initial (I); Evisceration (II) cooling (III) and global (IV) (Figure 1).
Figure 1. Fish processing in the refrigerator under study with indication of collection points of
effluent samples for physical and chemical characterization.
Step I was configured for receiving, weighing, sanitizing and transporting the raw material
to the subsequent step, the processing. Step I was therefore characterized by the generation of
liquid effluent with the presence of pieces of fish, oils and greases. Step II was evisceration,
which employs a cutting or abdominal incision table and subsequent evisceration. The fish was
placed on the evisceration table, the viscera was manually removed, the product weighed,
cleaned, stored and subsequent routed to refrigeration. This stage is characterized by the
generation of liquid effluent with pieces of fish, oils and greases, viscera, and blood.
Step III, the cooling room, is the storage location for the product and the waste. The product
was conditioned and cooled in monoblocs until distribution to market and the waste goes to the
treatment plant. This step was characterized by the washing of the monoblocs, with the
generation of liquid effluent accompanied by blood and residues of the material used in the
cleaning of the place. Step IV corresponds to the effluent created during fish processing and
monobloc washing.
2.2. Sampling points, effluent characterization and evaluation of effluent segregation
Effluent samples were collected at the following points: I (Initial step), after the washing
cylinder; II (Processing step), after the fish evisceration table; III (Cooling step); and IV, after

Rev. Ambient. Água vol. 13 n. 2, e2155 - Taubaté 2018
4 Yeda dos Santos Silva et al.
packing the product in refrigerated space monoblocs. The samples were taken at the effluent
junction site (from processing and administrative area).
The analysis of the effluent was carried out as follows: total solids (ST) Ref. 2540-G Total,
fixed, and volatile solids in solid and semisolid samples), biochemical oxygen demand (BOD),
technique Ref. 5210 B. 5-Day BOD Test), chemical oxygen demand (COD) Ref. 5220 Closed
reflux titrimetal method), and oils and greases (Ref. 5520-B Partition gravimetric method). The
analyses were performed as described in the Standard methods for the examination of water
and wastewater (APHA, 2005).
2.3. The segregation of effluent streams
In order to determine the rate of removal of the pollutants from the application of
segregation in the effluent streams of each of the processing stages, the percentages of removal
were determined for the studied compounds (total solids, organic matter, and oils and greases)
obtained theoretically when employed in different unit operations and processes, namely:
- the percentage of theoretical removal for the separation of total solids was determined by
the following techniques: screening; screen combined with filter and catch basin; screen, filter
and catch basin with removal; screening with microfiltration, ultrafiltration, nanofiltration and
reverse osmosis; flotation by dissolved air.
- the following techniques were used to determine the segregation of organic matter:
screens; rotating filter; rotary sieve; ultrafiltration; prefiltration conjugated to nanofiltration.
- for the segregation of oils and greases, the membrane filtration processes associated with
electrocoagulation were studied, specified by dynamic membrane and electrocoagulation,
ceramic and electrocoagulation membrane, ceramic membrane, and dynamic membrane.
To determine the efficiency of the application of the segregation, descriptive statistical
analysis was used, adopting the calculation of summary measures, taking into account the
nature of the variables involved. For the inferential analysis of the results, parametric tests were
used, taking into account the nature of the distributions of the values or the variability of the
measurements made. This was accomplished using the Microsoft Office Excel 2007 statistical
package.
3. RESULTS AND DISCUSSION
For the characterization of the effluent from Steps I, II, III and IV of the fish processing,
the total solid parameters were analyzed, adopting the parameters: total solids, organic matter
(BOD5, 20, and COD) and oils and greases. For the total solids (Figure 2a) the following average
concentrations were found: 1740 g L–1 (Step I); 2714 g L–1 (Step II); 444.1 g L–1 (Step III), and
2094 g L–1 (Step IV). The concentrations were similar to those found in other studies
(Chowdhury et al., 2010; Garde, 2011). They presented the typical characteristics of the
processing in the industry, whose final product is only gutted fish, not filleting, or preserving,
for example, that increase solids in effluents.
Using the COD test, the organic matter showed a mean concentration of 1446 g L–1 in
Stage I, 1811 g L–1 in Stage II, 167.6 g L–1 in Stage III and 1592 g L–1 in Stage IV (Figure
2b). A high content of organic matter was found in the steps that correspond to the processing
itself and in the global effluent, due to the added load which originated in the processing. This
is similar to the findings of other studies (Alexandre et al., 2014; Cristovão et al., 2012; 2015;
Chowdhury et al., 2010; Garde, 2011; Anh, 2011; Queiroz et al., 2013).
When analyzing the BOD, the results were compatible with those obtained in the COD
analysis and the concentrations were close to those obtained in other fish processing industries
(Alexandre et al., 2014; Cristovão et al., 2012; 2015; Chowdhury et al., 2010; Garde, 2011;
Anh, 2011; Queiroz et al., 2013). The mean BOD concentrations of 699.1 g L–1 in Step I;

5 Segregation of solid waste from …
Rev. Ambient. Água vol. 13 n. 2, e2155 - Taubaté 2018
908 g L–1 in Step II; 80.3 g L–1, in Step III and 742.5 g L–1 in Step IV were found in this study
(Figure 2c). The highest concentration of organic matter in Step II was associated with
evisceration and hygiene activities, which added solid waste to the effluent collection network,
such as viscera, the residue most generated in the warehouse studied, besides blood and pieces
of the fish, increasing the biodegradability of the effluent. It is observed that the reduction of
the organic matter content is primordial, indicative of the necessity of the segregation of this
effluent.
For the oils and greases, a concentration of 0.172 g L–1 was obtained in Stage I,
0.837 g L–1 in Stage II, 0.0316 g L–1 in Stage III and 0.701 g L–1in Stage IV (Figure 2d). All
steps studied presented upper and lower limits in relation to the quality standard recommended
by the legislation CONAMA Resolution 357/2005 and complementary 430/2011 (CONAMA,
2006; 2011). As expected, Step II presents a higher concentration among the other stages
studied due to the characteristics of the residues generated in this as a result of evisceration.
This parameter differs greatly from industry to industry, since those that process preserves add
oil to the product, so these data may be divergent from study to study, such as those performed
by Mosquera-Corral et al. (2001), Cristovão et al. (2012; 2015), whose concentrations were
between 156 g L–1 and 2841 g L–1 of oils and greases.
Figure 2. Concentration of total solids (a), Chemical demand for oxygen (b), biochemical oxygen
demand (c), and oils and greases (d) found in the effluent generated during fish processing.
Based on the characterization of the effluent generated in the fish processing industry, a
study can determine the concentrations of the parameters of interest. When applied to the
segregation of effluent streams, this would aid in verifying the efficiency in reducing the
concentration of these in the final effluent and in evaluating the possibility of recovery of co-
products. This is especially important because the concentration of pollutants in effluent is
equivalent to the concentration of final waste from the processing industry, even for different
raw materials such as fish, seafood and crustaceans (Alexandre et al., 2014; Anh et al., 2011).

Rev. Ambient. Água vol. 13 n. 2, e2155 - Taubaté 2018
6 Yeda dos Santos Silva et al.
The implementation of technical segregation minimizes the final concentration of the pollutant,
facilitating the operations involved in the treatment and also allowing the use of co-products,
as previously mentioned. The theoretical percentages of removal obtained from the use of
different segregation techniques for the studied compounds (total solids, organic matter, oils
and greases) (Table 1) were used in the processing steps (I, III, II and IV) of the industry under
study.
Table 1. Segregation techniques and percentages of removal achieved for the compounds studied.
Technician employed Theoretical
adopted
References
Total Solids (%)
Screen 31 - 60 Bezama et al. (2012); Almandoz et al. (2015)
Screen combined with filter and catch basin 40 - 70 FAO (2014)
Screening combined with microfiltration,
ultrafiltration, nanofiltration and reverse
osmosis
100 Gebreyohannes et al. (2016)
Dissolved air flotation 80 - 90 Colic et al. (2007)
Organic matter (COD and BOD)
Screens 25 - 60 Mittal (2006)
Rotary filter 15 Cowi (2008)
Rotary Sieve 25 Cowi (2008)
Nanofiltration conjugated pre-filtration 56 Gebreyohannes et al. (2016)
Ultrafiltration 36 Gebreyohannes et al. (2016)
Nanofiltration 60 - 80 Gebreyohannes et al. (2016)
Dissolved air flotation 30 - 90 Mittall, 2006; Bustillo-Lecompte e Mehrvar
(2015)
Coagulation-flotation 90 Lefebvre e Moletta (2006)
Reverse osmosis 97.5 Gebreyohannes et al. (2016)
Oils and greases
Membrane filtration associated with
electrocoagulation 65 Yang et al. (2015)
Ceramic membrane and electrocoagulation 50 Yang et al. (2015)
Ceramic membrane 2 Yang et al. (2015)
Dynamic membrane 10 Yang et al. (2015)
Floating 37 - 63 Colic et al. (2007)
Screen 10 - 20 Colic et al. (2007)
The results when using the theoretical percentages of removal, related to the total solids
found in the effluents from Steps I, II, III and IV according to the segregation techniques
adopted. When simplified techniques are used, the reduction is from 25 to 60% (Figure 3a and
b). However, reductions of up to 90% are achieved when the techniques are associated (Figure
3c).
For the techniques that considered the removal of total solids, using screening, the removal
achieved was 31% (Figure 3a); the screen 40% to 60% (Figure 3b); filter screen and catch
basin 40% to 70% (Figure 3c), and 80% to 90% dissolved air flotation (FAD) (Figure 3d).
For removal of organic matter, the highest theoretical percentages were associated with
segregation techniques that operate through nanofiltration, dissolved air flotation, coagulation-
flotation and reverse osmosis (Figure 4). These segregation techniques were able to remove up
to 97.50% of the organic matter (Figure 4), that results in a quality effluent to be directly
released into a water body, or to be reused or recycled in the processing, according to Brazilian
legislation in force (Resolution CONAMA 430/2011 (CONAMA, 2011) and Resolution
54/2005 of the CNRH (2006). If the effluent from segregation is treated, a simplified system

7 Segregation of solid waste from …
Rev. Ambient. Água vol. 13 n. 2, e2155 - Taubaté 2018
will suffice. When the less efficient techniques are adopted, such as screens, it is still possible
to achieve a 25 to 60% reduction, which is important, when the compound is to be minimized,
as organic matter considered as one of the big problems for the treatment of effluents.
Figure 3. Estimation of total solids concentration in the processing effluent after application of segregation
techniques.
Legends: (a) Screening; (b) Screen; (c) Screen combined with filter and catch basin; (d) Dissolved air flotation
(DAF).
In general, the rate of removal of organic matter obtained when using screens was 25% to
60% (Figure 4a); rotary filters reached 15% (Figure 4b); rotating sieve reached 25% (Figure
4c); nanofiltration conjugated prefiltration reached 56% (Figure 4d); ultrafiltration reached
30% to 36% (Figure 4e); nanofiltration reached 60% to 80% (Figure 4f); dissolved air flotation
reached 30% to 90% (Figure 4g); coagulation-flotation reached 90% (Figure 4h), and reverse
osmosis 97.50% (Figure 4i).
The removal rates obtained for oils and greases, when theoretical removal is applied:
membrane filtration associated with electrocoagulation, 65% (Figure 5ba); Ceramic membrane
and electrocoagulation, 50% (Figure 5b); Ceramic membrane, 2% (Figure 5c); dynamic
membrane, 10% (Figure 5d); flotation, 37% and 63% (Figure 5e); and screen, 10% to 20%
(Figure 5f).
Oils and greases must be removed from fish-processing effluents, because they interfere
with oxygen transfer, and cause operational problems in treatment systems (Alexandre et al.,
2014); but primary treatments are sufficient to remove this contaminant, at least in part
(Muthukumaran and Baskaran, 2013). In this study, when used at the theoretical removal rate
achieved by the segregation techniques studied (Figure 5), it was possible to reduce up to 65%
of the initial concentration when membrane filtration associated with electrocoagulation was
adopted (Figure 5a).
Flotation reached from 37% to 63% removal for the parameter (Figure 5e). Due to the
importance of this parameter, even the lowest rates of reduction contribute to both effluent
treatment and disposal. It is also important to consider the possibility that this compound can
be used to produce biofuels (Jayasinghe and Hawboldt, 2012; Alonso et al., 2010; Adeoti and
Hawboldt, 2014).

Rev. Ambient. Água vol. 13 n. 2, e2155 - Taubaté 2018
8 Yeda dos Santos Silva et al.
Figure 4. Theoretical removal of organic matter from the studied effluent in concentrations (g L–1) of (a)
Biochemical Oxygen Demand and (b) Chemical Oxygen Demand of effluent from segregation.
Legend: (a) Screens; (b) Rotary filter; (c) Rotary sieve; (d) Nanofiltration conjugated prefiltration; (e),
Ultrafiltration; (f) Nanofiltration; (g) Dissolved air flotation; (h) Coagulation-flotation; (i) Reverse Osmosis.
Figure 5. Oils and greases in mg/L per step after application of the rates of removal by segregation
technique present in the effluent in fish-processing industry.
Legend: (a) Membrane filtration associated with electrocoagulation; (B) Ceramic membrane and
electrocoagulation; (C) Ceramic membrane; (D) Dynamic membrane; (E) Flotation; (F) Screen.
Analyzing the results, segregation proved to be an efficient technique to minimize
concentrations of the studied compounds: total solids, organic matter and oils and greases
(Table 2). However, it does not exempt the final treatment effluent. The COD/BOD ratio below
2.5 indicates biodegradable matter, so there is an indication that it requires treatment for
stabilization.

9 Segregation of solid waste from …
Rev. Ambient. Água vol. 13 n. 2, e2155 - Taubaté 2018
The segregation techniques have been shown to be effective in keeping waste out of the
drain and reducing effluent treatment costs (Watson, 2003), as well as to be technologies used
for the fish processing residues in order to foster development of the socioeconomic and
environmental sustainability of the industry (Anbe, 2011). Studies of the valuation of by-
products of fish processing conclude that the segregated material can be used in the creation of
new products, with low raw material and production costs, increasing industry profit and
reducing environmental impact (Arvanitoyannis and Kassaveti, 2008; Monteiro, 2013; Silva et
al., 2015); with this favors the generation of new jobs.
The alternatives of reuse of fish-processing residues are available for animal and human
consumption, which can contribute to the establishment of a fishing sector committed to
environmental issues (Alonso et al, 2010). It is also possible to use the residues for the
production of collagen and antioxidant isolation for cosmetics, biogas/biodiesel, fertilizers,
dietary applications (chitosan), food packaging (gelatin), enzyme isolation (proteases)
(Arvanitoyannis and Kassaveti, 2008; Oliveira et al., 2015) and fishmeal, as the most common
reuse alternative (Jayasinghe and Hawboldt, 2012; Jayasinghe and Hawboldt, 2013; Adeoti and
Hawboldt, 2014; Lin and Li, 2009). The purpose of this improvement in the production process
is to improve the performance of the market in response to the demand for new food products
or as required by governing legislation (Bar, 2015).

10
1
1
1
1
Yeda dos Santos Silva et al. 10
0
Rev. Ambient. Água vol. 13 n. 2, e2155 - Taubaté 2018
Table 2. Methods of segregation employed in-fish processing industry for the removal of total solids, organic matter and oils and greases, and maximum
efficiency when applied in the following processing Steps: I (Initial stage) after the washing cylinder; II (Processing stage), after the fish-evisceration table; III
(Cooling stage), after packing the product in monoblocs in refrigerated space; and IV (Processing effluent stage and administrative area).
Total Solids
Techniques Theoretical removal [C]inicial (mg/L) I (mg/L) II (mg/L) III (mg/L) IV ( mg/L)
Screening 31% 1740 1201 1873 306 1445
Screen 40% a 60% 1740 870 1357 222 1047
Screen combined with filter and catch basin 40% a 70% 1740 783 1221 200 942
Dissolved air flotation (FAD) 80% a 90% 1740 348 407 67 314
Organic matter
Techniques Theoretical removal [C]inicial I (mg/L) II (mg/L) III (mg/L) IV (mg/L)
DQO (mg/L) DBO (mg/L)
Screens 25% a 60% 699 8314 1041,3 96,37 915,4
Rotary filter 15% 699.1 594.2 771.8 68.2 820..6
Rotary Sieve 25% 699.1 524.3 681 60.22 594
Nanofiltration conjugated prefiltration 56% 1446 636.2 796.8 73.74 628.7
Ultrafiltration 30% a 36% 1446 925.44 1159 107.2 859.7
Nanofiltration 60%a 80% 1446 433.8 543.3 50.3 658.0
Dissolved air flotation 30% a 90% 699.1 279.6 363.2 32.12 387.3
Coagulation-flotation 90% 699.1 69.9 90.8 8.03 222.7
Osmose Reversa 97,50% 1446 36 35 4 40
Oils and greases
Techniques Theoretical removal [C]inicial I (mg/L) II (mg/L) III (mg/L) IV (mg/L)
Membrane filtration associated with electrocoagulation 65% 0.17 0.06 0.29 0.001 0.25
Ceramic membrane and electrocoagulation 50% 0.17 0.09 0.42 0.02 0.35
Ceramic membrane 2% 0.17 0.17 0.82 0.03 0.69
Dynamic membrane 10% 0.17 0.15 0.75 0.03 0.63
Floating 37% e 63% 0.17 0.09 0.42 0.02 0.35
Screen 10% a 20% 0.17 0.15 0.71 0.03 0.60

11 Segregation of solid waste from …
Rev. Ambient. Água vol. 12 n. 6 Taubaté – Nov. / Dec. 2017
4. CONCLUSION
The segregation techniques studied showed that, for the effluent under study, higher rates
of removal of solids, organic matter and oils and greases were reached when conjugated
processes were adopted. The result is a final effluent with less polluting potential, thus requiring
a more-simplified treatment.
Segregation of total solids, organic matter and oils and greases showed a better result in
Step II (evisceration step) as a function of the solid waste load, such as pieces of fish, viscera
and blood generated during processing.
Due to the low load of total solids, organic matter and oils and greases of Stage III
(monobloc wash), the implementation of segregation techniques would result in an effluent in
accordance with Brazilian legislation in force.
The introduction of segregation processes in the effluent streams not only allows the
production of a better final effluent, but also the reduction of by-product loss.
5. ACKNOWLEDGEMENTS
The authors are grateful to the Brazilian governmental agency National Council for
Scientific and Technological Development (CNPq) for the project funding (Process number:
407728/ 2012-0) and a scholarship (Process number: 312697/ 2014-7).
6. REFERENCES
ADEOTI, I. A.; HAWBOLDT, K. A review of lipid extraction from fish processing by-product
for use as a biofuel. Biomass and Bioenergy, v. 63, p. 330–340, 2014.
https://doi.org/10.1016/j.biombioe.2014.02.011
ALONSO, A. A. et al. Contributing to fisheries sustainability by making the best possible use
of their resources: the befair initiative. Trends in food science & technology, v. 21, n.
11, p. 569-578, 2010. https://doi.org/10.1016/j.tifs.2010.07.011
ALEXANDRE, V. M. F.; VALENTE, A. M.; CAMMAROTA, M. C.; FREIRE, D. M. G.
Performance of anaerobic bioreactor treating fish-processing plant wastewater pre-
hydrolyzed with solid enzyme pool. Renew Energy, v. 36, p. 3439–3444, 2014.
https://doi.org/10.1016/j.renene.2011.05.024
ALMANDOZ, M. C.; PAGLIERO, C. L.; OCHOA, N. A.; MARCHESE, J. Composite ceramic
membranes from natural aluminosilicates for microfiltration applications. Ceramics
International, v. 41, p. 5621–5633, 2015.
https://doi.org/10.1016/j.ceramint.2014.12.144
ANBE, L. Prospecção de componentes bioativos em resíduos do processamento do pescado
visando a sustentabilidade da cadeia produtiva. 2011. Dissertação (Mestrado) - Escola
Superior de Agricultura Luiz de Queiroz, Universidade de São Paulo, Piracicaba, 2011.
ANH, P. T. et al. Towards eco-agro industrial clusters in aquatic production: the case of shrimp
processing industry in Vietnam. Journal of Cleaner Production, v. 19, p. 2107-2118,
2011. https://doi.org/10.1016/j.jclepro.2011.06.002
AMERICAN PUBLIC HEALTH ASSOCIATION - APHA. Standard methods for the
examination of water and wastewater. 20th ed. Washington D.C., 2005.

Rev. Ambient. Água vol. 13 n. 2, e2155 - Taubaté 2018
12 Yeda dos Santos Silva et al.
ARVANITOYANNIS, I. S.; KASSAVETI, A. Fish industry waste: treatments, environmental
impacts, current and potential uses. International Journal of Food Science &
Technology, v. 43, p. 726–745, 2008. https://doi.org/10.1111/j.1365-2621.2006.01513.x
BAR, E. S. A case study of obstacles and enablers for green innovation within the fish
processing equipment industry. Journal of Cleaner Production, v. 90, p. 234–243, 2015.
https://doi.org/10.1016/j.jclepro.2014.11.055
BEZAMA, A. et al. Evaluation of the environmental impacts of a Cleaner Production
Agreement by frozen fish facilities in the Biobío Region, Chile. Journal of Cleaner
Production, v. 26, p. 95–100, 2012. https://doi.org/10.1016/j.jclepro.2011.12.029
BUGALLO, P. M.; STUPAK, A.; ANDRADE, L. C.; LÓPEZ, R. T. Material flow analysis in
a cooked mussel processing industry. Journal of Food Engineering, v. 113, n. 1, p. 100-
117, 2012. https://doi.org/10.1016/j.jfoodeng.2012.05.014
BUSTILLO-LECOMPTE, C. F.; MEHRVAR, M. Slaughterhouse wastewater characteristics,
treatment, and management in the meat processing industry: A review on trends and
advances. Journal of Environmental Management, v. 161, n. 15, p. 287-302, 2015.
https://doi.org/10.1016/j.jenvman.2015.07.008
CHOWDHURY, P.; VIRARAGHAVAN, T.; SRINIVASAN, A. Biological treatment
processes for fish processing wastewater – A review. Bioresearches Technology, v. 101,
p. 439-449, 2010. https://doi.org/10.1016/j.biortech.2009.08.065
COLIC, M. et al. Case study: fish processing plant wastewater treatment. Proceedings of the
Water Environment Federation, v. 2007, n. 7, p. 1-27, 2007.
https://doi.org/10.2175/193864707787781557
CONSELHO NACIONAL DO MEIO AMBIENTE - CONAMA (Brasil). Resolução nº 430,
de 13 de maio de 2011. Dispõe sobre as condições de lançamento de efluentes,
complementa e altera a Resolução n° 357. Diário Oficial [da] União, Brasília, DF, n. 92,
16 maio 2011, p. 89.
CONSELHO NACIONAL DE RECURSOS HÍDRICOS – CNRH (Brasil). Resolução n° 54,
de 28 de novembro de 2005. Estabelece modalidades, diretrizes e critérios gerais para a
prática de reuso direto não potável de água, e dá outras providências. Diário Oficial [da]
União, Brasília, DF, 09 mar. 2006.
COSMANN, N. J.; GOMES, S. D.; ANDRADE, L.; KUMMER, A. C. B. Caracterização do
efluente de processamento de pescado e desempenho da lagoa anaeróbia. In: SIMPÓSIO
INTERNACIONAL SOBRE GERENCIAMENTO DE RESÍDUOS DE ANIMAIS
TRATAMENTO DE DEJETOS DE ANIMAIS, 1., 11- a 13 de Março de 2009,
Florianópolis, SC. Anais… Brasília: Embrapa, 2000.
COWI CONSULTING ENGINEERS AND PLANNERS AS. Cleaner production assessment
in meat processing. Paris: 2008.
CRISTÓVÃO, R. O.; BOTELHO, C. M. S.; MARTINS, R. J.;E.; BOAVENTURA, R. A.;R.
Fish canning industry wastewater treatment for water reuse e a case study. Journal of
Cleaner Production, v. 87, p. 603–612, 2015.
https://doi.org/10.1016/j.jclepro.2014.10.076

13 Segregation of solid waste from …
Rev. Ambient. Água vol. 13 n. 2, e2155 - Taubaté 2018
CRISTÓVÃO, R. O.; BOTELHO, C. M. S.; MARTINS, R. J. E.; BOAVENTURA, R. A. R.
Chemical and biological treatment of fish canning wastewaters. International Journal
of Bioscience, Biochemistry and Bioinformatics, v.2, p. 237-242, 2012.
http://dx.doi.org/10.7763/IJBBB.2012.V2.108
FOOD AND AGRICULTURE ORGANIZATION OF THE UNITED NATIONS - FAO. The
State of World Fisheries and Aquaculture: opportunities and challenges. Rome, 2014.
223 p.
FELTES, M. C. M. et al. Alternativas para a agregação de valor aos resíduos da industrialização
de peixe. Revista Brasileira de Engenharia Agrícola e Ambiental, v. 14, n. 6, p. 669–
677, 2010. https://doi.org/10.1590/S1415-43662010000600014
GARDE, J. Treatment of wastewater from a fish conservation industry: flocculation
experiment and analysis. 2011. Tese (Mestrado) - Schoolof Business and Engineering,
Halmstad University, 2011.
GEBREYOHANNES, A. Y.; MAZZEI, R.; GIOR, L. Trends and current practices of olive mill
wastewater treatment: application of integrated membrane process and its future
perspective. Separation and Purification Technology, v. 162, 2016.
https://doi.org/10.1016/j.seppur.2016.02.001
HERNÁNDEZ, C. et al. Use of tuna industry waste in diets for nile tilapia,
oreochromisniloticus, fingerlings: effect on digestibility and growth performance.
Latinamerican Jornal of Aquatic Research, v. 41, n. 3, p. 468-478, 2013.
https://doi.org/103856/vol41-issue3-fulltext-10
HERPANDI, N. H.; ROSMA, A.; WAN NADIAH, W. A. The Tuna Fishing Industry: A New
Outlook on Fish Protein Hydrolysates. Comprehensive Reviews in Food Science and
Food Safety, v.10, p.195–207, 2011. https://doi.org/10.1111/j.1541-4337.2011.00155.x
JAYASINGHE, P.; HAWBOLDT, K. A review of bio-oils from waste biomass: Focus on fish
processing waste. Renewable and Sustainable Energy Reviews, v. 16, p.798–821,
2012. https://doi.org/10.1016/j.rser.2011.09.005
JAYASINGHE, P.; HAWBOLDT, K. Biofuels from fish processing plant effluents – waste
characterization and oil extraction and quality. Sustainable Energy Technologies and
Assessments, v. 4, p. 36-44, 2013. https://doi.org/10.1016/j.seta.2013.09.001
JOHANSON, K. Review of new segregation tester method by dr. Kerry Johanson, P.E. Powder
technology, v. 257, , p. 1-10, 2014. https://doi.org/10.1016/j.powtec.2014.02.021
LAGO, A. M. T. Embutido tipo salsicha utilizando carne mecanicamente separada de
tilápia: uma alternativa para o aproveitamento de resíduo da filetagem. 2015. 231 p.
Dissertação (Mestrado em Ciência dos Alimentos) - Universidade Federal de Lavras,
Lavras, 2015.
LEFEBVRE, O.; MOLETTA, R. Treatment of organic pollution in industrial saline wastewater:
a literature review. Water Research, v. 40, n. 20, p. 3671–3682, 2016.
https://doi.org/10.1016/j.watres.2006.08.027
LIN, C.-Y.; LI, R.-J. Engine performance and emission characteristics of marine fish-oil
biodiesel produced from the discarded parts of marine fish. Fuel Processing Technology,
v. 90, p. 883–888, 2009. https://doi.org/10.1016/j.fuproc.2009.04.009

Rev. Ambient. Água vol. 13 n. 2, e2155 - Taubaté 2018
14 Yeda dos Santos Silva et al.
LOPES, C. et al. Valorisation of fish by-products against waste management treatments –
comparison of environmental impacts. Waste Management, v. 46, p. 103–112, 2015.
https://doi.org/10.1016/j.wasman.2015.08.017
LOVE, D. C. et al. Wasted seafood in the United states: quantify in gloss from production to
consumption and moving to Ward solutions. Global Environmental Change, v. 35, p.
16–124, 2015. https://doi.org/10.1016/j.gloenvcha.2015.08.013
MITTAL, G. S. Treatment of waste water from abattoirs before land application- a review.
Bioresource Technology. Ed.97, n .9, p. 1119-1135, 2006.
https://doi.org/10.1016/j.biortech.2004.11.021
MONTEIRO, M. L. G. Aproveitamento de resíduos de tilápia(Oreochromisniloticus) para
elaboração de novos produtos com valor agregado. 2013. Tese (Doutorado em Higiene
Veterinária e Processamento Tecnológico de Produtos de Origem Animal) - Universidade
Federal Fluminense, Rio de Janeiro, 2013.
MORAIS, J. P. S.; LEITÃO, C. R.; FIGUEIRÊDO, M. C. B.; SAMPAIO, A. P. C.; SOUZA
FILHO, E. F. M. M. S. M.; RODRIGUES, M. L. L. et al. Balanço de massa na obtenção
de carne mecanicamente separada (CMS) de tilápia. Fortaleza: EMBRAPA, 2013.
MOSQUERA-CORRAL, A. et al. Simultaneous methanogenesis and denitrification of
pretreated effluents from a fish canning industry. Water Research, v. 35, n. 2, p. 411–
418, 2001. https://doi.org/10.1016/S0043-1354(00)00288-8
MUTHUKUMARAN, S.; BASKARAN, K. Organic and nutrient reduction in a fish processing
facility e A case study. International Biodeterioration & Biodegradation. v. 85, p.
563-570, 2013. https://doi.org/10.1016/j.ibiod.2013.03.023
OLIVEIRA, I. S. D. et al. Composition of MSM from Brazilian catfish and technological
properties of fish flour. Food Control, v. 50, p. 38-44, 2015.
https://doi.org/10.1016/j.foodcont.2014.08.018
ORGANIZAÇÃO DAS NAÇÕES UNIDAS - ONU. Fatos sobre alimentação. Rio de Janeiro,
2012.
QUEIROZ, M. I. et al. Fish processing wastewater as a platform of the microalgal biorefineries.
Biosystems Engineering, v. 115, p. 195-202, 2013.
https://doi.org/10.1016/j.biosystemseng.2012.12.013
RUSTAD, T.; STORRO, I.; SLIZYTE, R. Possibilities for the utilisation of marine by-products.
International Journal of Food Science & Technology, v. 46, p. 2001–2014, 2011.
https://doi.org/10.1111/j.1365-2621.2011.02736.x
SILVA, A. J. et al. Utilization of tilapia processing waste for the production of fish protein
hydrolysate. Animal Feed Science and Technology, v. 196, n. 11, p. 96–106, 2014.
https://doi.org/10.1016/j.anifeedsci.2014.06.010
SILVA, R. A.; BONNAS, D. S.; SILVA, P. F. Aproveitamento dos resíduos gerados no
processamento de postas de surubim (Pseudoplatystoma corruscans) para elaboração de
nuggets. Contextos da Alimentação. Revista de Comportamento, Cultura e Sociedade,
v. 3, n. 2, 2015.
SUTHERLAND, K. Filter media guidelines: Selecting theright filter media. Filtration +
Separation, v. 48, n. 3, p. 21-22, 2011. https://doi.org/10.1016/S0015-1882(11)70117-3

15 Segregation of solid waste from …
Rev. Ambient. Água vol. 13 n. 2, e2155 - Taubaté 2018
SUTHERLAND, K. Half a century of developments in filtration – Part 3.
Filtration+Separation, v. 50, n. 3, p. 23–27, 2013.
YANG, T. et al. Improving performance of dynamic membrane assisted by electrocoagulation
for treatment of oily wastewater: Effect of electrolytic conditions. Desalination, v. 363,
p. 134-143, 2015. https://doi.org/10.1016/j.desal.2015.01.010
WATSON, R. Trials to Reduce Water and Effluent Charges in Fish Processing. [S.l.]: The
Sea Fish Industry Authority, 2003. Seafish Report N.SR541.
WU, T. Y.; MOHAMMAD, A. W.; LIM, S. L.; LIM, P. N.; HAY, J. X. W. Recent advances in
the reuse of wastewaters for promoting sustainable development. In: SHARMA, S. K.;
SANGHI, R. (Eds.). Wastewater Reuse and Management. Netherlands: Springer,
2013. p. 47-103. https://doi.org/10.1007/978-94-007-4942-9_3

Ambiente & Água - An Interdisciplinary Journal of Applied Science
ISSN 1980-993X – doi:10.4136/1980-993X
www.ambi-agua.net
E-mail: [email protected]
This is an Open Access article distributed under the terms of the Creative Commons
Attribution License, which permits unrestricted use, distribution, and reproduction in any
medium, provided the original work is properly cited.
Assessment of the water quality and trophic state of the Ribeirão
Guaraçau Watershed, Guarulhos (SP): a comparative analysis
between rural and urban areas
ARTICLES doi:10.4136/ambi-agua.2170
Received: 27 Jul. 2017; Accepted: 16 Jan. 2018
Reinaldo Romero Vargas1*; Márcia da Silva Barros2; Antonio Roberto Saad1;
Regina de Oliveira Moraes Arruda1; Fernanda Dall'Ara Azevedo3
1Universidade de Guarulhos (UNG), Guarulhos, SP, Brasil
Mestrado em Análise Geoambiental (MAG). E-mail: [email protected],
[email protected], [email protected]
2Centro Universitário Anhanguera de São Paulo (UNIAN), São Paulo, SP, Brasil
Departamento de Ciências Exatas. E-mail: [email protected] 3Universidade de Guarulhos (UNG), Guarulhos, SP, Brasil
Programa de Pós-Graduação em Análise Geoambiental
E-mail: [email protected] *Corresponding author
ABSTRACT The urbanization process through which large urban centers have been passing has affected
drastically the availability and especially the quality of water. The Ribeirão Guaraçau
Watershed, located in the northern part of the Guarulhos municipality, includes rural and urban
areas of different land-use classes. The goal of this study is to assess the water quality and to
diagnose the eutrophication stage of the surface waters of the Ribeirão Guaraçau, the main
water course of the Ribeirão Guaraçau Watershed. To assess environmental quality, physical-
chemical analyses (temperature, pH, turbidity, conductivity, and total phosphorus) and
microbiological analyses (E. coli) were carried out during a period of 12 months. The Trophic
State Index (TSI) was used to ascertain the environmental degradation conditions of lotic and
lentic environments. The surface waters of the Ribeirão Guaraçau in the rural area are already
compromised, with worsening of the water quality upstream indicated by high total phosphorus
and E. coli caused by fecal contamination due to lack of basic sanitation in the region.
Characteristic sites of the rural areas already present signs of degradation with trophic levels
varying from oligotrophic to hypereutrophic. The need to provide sewage collectors and sewage
treatment systems at the Bonsucesso Sewage Treatment Station, inaugurated in 2011, and the
control of the occupation in areas that produce good quality water is paramount.
Keywords: eutrophication, São Paulo Metropolitan Region, urban waters, water pollution.
Avaliação da qualidade da água e do estado trófico da bacia de
Ribeirão Guaraçau, Guarulhos (SP): uma análise comparativa entre
áreas rurais e urbanas
RESUMO O processo de urbanização pelo qual os grandes centros urbanos passaram afetou
drasticamente a disponibilidade e, em especial, a qualidade da água. A bacia hidrográfica de

Rev. Ambient. Água vol. 13 n. 2, e2170 - Taubaté 2018
2 Reinaldo Romero Vargas et al.
Ribeirão Guaraçau, localizada na parte norte do município de Guarulhos, inclui áreas rurais e
urbanas de diferentes classes de uso da terra. O objetivo deste estudo é avaliar a qualidade da
água e diagnosticar o estágio de eutrofização das águas superficiais do Ribeirão Guaraçau, o
principal curso de água da Bacia do Ribeirão Guaraçau. Para avaliar a qualidade ambiental,
foram realizadas análises físico-químicas (temperatura, pH, turbidez, condutividade e fósforo
total) e análises microbiológicas (E. coli) durante um período de 12 meses. O Índice de Estado
Trófico (IET) foi utilizado para determinar as condições de degradação ambiental de ambientes
lóticos e lênticos. As águas superficiais do Ribeirão Guaraçau na área rural já estão
comprometidas, com o piora da qualidade da água a montante indicada pelo alto fósforo total e
E. coli causada por contaminação fecal devido à falta de saneamento básico na região. Os locais
característicos das áreas rurais já apresentam sinais de degradação com níveis tróficos que
variam de oligotróficos a hipereutróficos. A necessidade de fornecer coletores de esgoto e
sistemas de tratamento de esgoto na Estação de Tratamento de Esgoto de Bonsucesso,
inaugurada em 2011, e o controle da ocupação em áreas que produzem água de boa qualidade
é primordial.
Palavras-chave: águas urbanas, eutrofização, poluição das águas, Região Metropolitana de São Paulo.
1. INTRODUCTION
The development of modern society, mainly in the urban areas, has occurred in a
disordered way, devoid of any planning, and with increasing levels of environmental
degradation. As a result of this disequilibrium, significant impacts can be observed, which put
environmental quality at risk, notably when it comes to great metropolises. The Guarulhos
Municipality, located in the Metropolitan Region of São Paulo (MRSP), is considered the
second greatest city of São Paulo State. It is in full urban expansion, characterized by planning
problems induced by industrial development, road, airport, utilities operations and significant
civil works, for example, the construction of the northern segment of the Mario Covas Ring
Highway (Oliveira et al., 2009; Mesquita, 2011).
The environmental impacts caused by deforestation, agricultural, urban and industrial
development, plus the lack of basic sanitation, lead to an increase of nutrient concentrations in
the aquatic ecosystems. These nutrients, especially phosphorus and nitrogen, lead to the growth
of algae, including potentially toxic cyanobacteria, which endangers the ecosystem, besides
increasing water treatment costs (Esteves, 2011). Such a process, named eutrophication, can be
quantified by means of the Trophic State Index (TSI), which is used to classify water bodies at
different trophic degrees (Lamparelli, 2004). The index classifies the water body in six trophic
classes, according to the total phosphorus concentrations in water. The conditions favorable to
eutrophication are those of a lentic environment, characterized by the presence of nutrients,
high temperatures, high radiation levels, low turbidity and high residence time of the water.
Lotic environment water bodies classified as eutrophic, supereutrophic and hypereutrophic
rarely present eutrophication due to the movement of their waters. However, it is through rivers
and brooks that a great part of nutrient inflow to lakes and reservoirs takes place (ANA, 2013).
Depending on the land use and occupation, different trophic levels are observed in the
water bodies. Cunha et al. (2010) studied three tropical rivers with different levels of anthropic
interference. These authors observed that in more-preserved regions, with 70% of the area
covered by forests, the trophic levels varied from oligotrophic to mesotrophic. On the other
hand, in regions occupied by industry, trophic levels were hypereutrophic. In another study of
a watershed with 65% of the urbanized area characterized by the presence of stilt houses, where
domestic waste is disposed of in natura in the water bodies, trophic levels varied from
supereutrophic to hypereutrophic. In the same study, in another river with the presence of

3 Assessment of the water quality and trophic …
Rev. Ambient. Água vol. 13 n. 2, e2170 - Taubaté 2018
settlements and rural activity, the trophic levels varied from mesotrophic to supereutrophic
(Silva et al., 2014).
Taking the concept of watershed as a study unit (Machado and Torres, 2012), the Ribeirão
Guaraçau Watershed (RGW), mostly located in the northern part of the Guarulhos municipality,
was selected for this study. Water producing areas are located in watershed zones (Andrade et
al., 2008). Taking the municipal zoning into account, rural and urban zones are located in this
watershed, each showing different forms of land use and representing foci of water quality
change. The main objective of this study is the assessment of water quality and the diagnosis
of the eutrophication stage of the Ribeirão Guaraçau surficial waters in rural and urban areas of
the Ribeirão Guaraçau Watershed.
1.1. Geoenvironmental characteristics of the study area
The Guarulhos municipality is one of 39 municipalities located in the northeastern portion
Metropolitan Region of São Paulo (MRSP), together with the neighboring Arujá,
Itaquaquecetuba, Mairiporã, Nazaré Paulista, São Paulo and Santa Isabel municipalities (Figure
1). The municipality is characterized by a humid, subtropical climate with annual mean rainfall
of 1470 mm. The annual rainfall indices were 1897 mm in 2015 and 1570 mm in 2016 (INMET,
2016). The mean annual temperatures in the coldest months reached 17-19oC, whereas in the
summer they varied between 23oC and 24oC (Oliveira et al., 2009). The municipality is divided
into five basins, the largest being the Baquirivu-Guaçu Watershed (BGW), 149 km2 in area,
encompassing the study area.
Figure 1. Location of the da Ribeirão Guaraçau Watershed (RGW), Guarulhos (SP).
Source: UnG Geoprocessing Laboratory.
The Ribeirão Guaraçau Watershed (RGW) is 20.5 km² in area, 8350 m long, maximum
5600 m wide, and 990 m of maximum and 750 m of minimum altitude (Ribeiro et al., 2013).
RGW landforms and rock types are listed in Table 1.

Rev. Ambient. Água vol. 13 n. 2, e2170 - Taubaté 2018
4 Reinaldo Romero Vargas et al.
Table 1. Characteristics of the Ribeirão Guaraçau Watershed (RGW) physical environment.
ZONE CHARACTERISTICS DO PHYSICAL ENVIRONMENT
Landforms Rock types
RURAL
Mountains and hills higher than 1000 m Predominant metamorphic rocks
(phyllites; iron formation);
igneous rocks (granites); local
alluvial sediments.
High hills higher than 900 m
Hillocks
Restricted fluvial plains
URBAN
Low hills Metasediments (phyllites).
Hillocks Clastic sediments (coarse to fine
sandstones; argillites); alluvial
sediments.
Small mounds
Ample and restricted alluvial plains
Source: Ribeiro et al. (2013).
2. MATERIALS AND METHODS
2.1. Land-use Map
The land-use map was prepared by upgrading the map produced by Ribeiro et al. (2013).
The first step in this upgrade was to export the vector file (shapefile) of this base map to the
format Keyhole Markup Language (kml) of the ArcGIS program – Version 10 (ESRI, 2013).
The next step was to import from kml to Google Earth, which was overlain to an IKONOS II
image, Sensor PSM, 1-m resolution, September 28, 2016, where the vertices of the vector were
updated. The last step was to import the updated kml file to ArcGIS and export it to the shapefile
format.
2.2. Water sampling and analysis
To assess the water quality along the Ribeirão Guaraçau, five points (P1 to P5) were
selected, and six bi-monthly sampling campaigns were carried out from September 2015 to
August 2016. The selection of the sampling points (Figure 2) was made considering the size of
the drained surface and the different types of land use, so that points P1 to P4 are located in
predominantly rural areas and point P5 in the urban zone. Point P1 (23º21’26.93’’ S and
46º24’22.60’’ W) is located in a more-preserved area, with the predominance of arboreal
formations. Point P2 (23º21’42.98’’ S and 46º24’16.55’’ W) is located at the exit of Lago Azul.
Point P3 (23º22’14.45’’ S and 46º24’3.95’’ W) is located in the northern portion of the
watershed and receives the inflow of the households of the Água Azul neighborhood, including
a high-density disordered urban occupation (slums) with no sewerage. Point P4
(23º22’50.74’’ S and 46º23’44.67’’ W), although located in an agricultural area surrounded by
vegetated areas, it gathers the contributions from the upstream points. Point P5
(23º24’3.14’’ S and 46º24’0.82’’ W) is located in area characterized by high-density, ordered
urban occupation.
Water analysis in the field was performed using properly calibrated analytical instruments
and obtaining triplicate measurements for the following physico-chemical parameters:
Temperature (Digimed DM-3 conductivity meter), pH (Digimed DM-2 pH meter),
Conductivity (Digimed DM-3 conductivity meter), and Turbidity (Quimis Q279P
turbidimeter). The other samples were collected following the National Guide for Collecting
and Preservation of Samples (ANA, 2011) for Total Phosphorus and Escherichia coli, analyzed
in triplicate, as recommended by the Standard Methods for Examination of Water and
Wastewater (APHA et al., 2012).

5 Assessment of the water quality and trophic …
Rev. Ambient. Água vol. 13 n. 2, e2170 - Taubaté 2018
Figure 2. Land-use and occupation map for 2016, with the location of the water-sampling points
and land-use classes and their percentages (%) in the Ribeirão Guaraçau Watershed (RGW) in 2007
and 2016.
Source: UnG Geoprocessing Laboratory.
The results of these analyses were compared to standards established by CONAMA
Resolution 357/2005 (CONAMA, 2005) and State Decree #10755, which assigns water bodies
to the classification provided by the State Decree #8468, dated September 8, 1976. The
Baquirivu-Guaçu River and all its tributaries up to the confluence with the Tietê River in the
Guarulhos municipality belong to Class 3 (São Paulo, 1977). This class of water is destined for
the supply for human consumption, after conventional or advanced treatment; irrigation of tree
and forage crops; amateur fishing; secondary contact recreation; and animal watering.
2.3. Trophic State Index (TSI)
The calculation of TSI (TP), according to Lamparelli’s (2004) methodology, took into
account total phosphorus (TP) measured at points P1 to P5 (µg.L-1).
The TSI values are distributed in the six trophic state classes as follows (CETESB, 2007;
Lamparelli, 2004): TSI ≤47 (ultraoligotrophic); 47 <TSI ≤52 (oligotrophic);
52 <TSI ≤59 (mesotrophic); 59 <TSI ≤63 (eutrophic); 63 <TSI ≤67 (supereutrophic), and
TSI >67 (hypereutrophic).
3. RESULTS AND DISCUSSION
The Ribeirão Guaraçau Watershed (RGW) contemplates zones with both rural and urban
characteristics. From Point P1 to Point P4, arboreal formations, grassy vegetation and low-

Rev. Ambient. Água vol. 13 n. 2, e2170 - Taubaté 2018
6 Reinaldo Romero Vargas et al.
density urban occupations predominate, which characterizes this region as a rural area (Figure
2). The consolidated urban zone predominantly occupies the southern portion of the basin. In
the surroundings of Point P5, which is the last sampling point of the Ribeirão Guaraçau, there
are high-density, ordered urban occupations, which are essentially of urban characteristics.
During the last ten years, from 2007 to 2016, RGW has undergone little changes regarding
occupation (Figure 2). A negative aspect is that in this period, despite the minor contribution of
the high-density disordered occupations (slums), there has been an increase of approximately
108% of this type of occupation along RGW, from the rural to the urban area. The increase of
these areas devoid of sewage collecting systems has led to the worsening of the quality of the
watershed water bodies. Another relevant change regarding water quality was the 33% decrease
in agricultural areas. The land-use and occupation map shows that the majority of the
agricultural areas were replaced by grassy vegetation in 2007, as reported by Ribeiro et al.
(2013). However, there was not an increase of grassy vegetation areas, due to the 10% increase
of low-density urban occupations in the rural region.
Upstream Point P1, which is located in a low-density urban occupation area, a more
preserved region is composed of arboreal formations. As a consequence, all the measured
parameters indicate the very good quality of the surficial waters (Table 2). Only the mean value
of the microbiological parameter (E. coli) is above the established in the CONAMA Resolution
for Class 3 water bodies (CONAMA, 2005). This high value is explained by the fact that there
are small animal farms surrounding Point 1. The total phosphorus analysis for this point, despite
being below the limit established in the legislation, yielded a mean value close to the limit and
a maximum value above the limit. Even though it is not high, this corroborates the fecal
contamination of the water body, probably caused by animal feces.
Water temperature (Table 2) varied according to the occupation of the surroundings, the
lowest mean value being obtained at Point P1 and corresponding to the most vegetated area,
and the highest at Point P5, corresponding to the urban area. Several studies indicate that the
presence of a vegetated area in the surroundings of a water body causes a decrease in water
temperatures. Conversely, more urbanized areas with little vegetation significantly increase
water temperature (Fia et al., 2015; Vargas et al., 2015; Pereira et al., 2016; Carvalho et al.,
2016).
For all the analyzed points, pH did not vary significantly along the watershed, with low
coefficient of variation and mean pH values within the limits established by CONAMA
Resolution 357/05, even in areas characterized by industrial activity, agriculture and lack of
basic sanitation.
Turbidity values for points P1 to P4 are below the maximum limit established by
CONAMA 357/05. However, turbidity values for Point P5 exceeded the limit, due to the fact
that domestic and chemical industrial wastes are discharged in the Ribeirão Guaraçau. The
highest turbidity values were found in the rainy season, which was also observed by Sardinha
et al. (2008), Ríos-Villamizar et al. (2011), Fia et al. (2015) and Andrietti et al. (2016). In this
period the dragging of solids in suspension occurs by means of runoff processes, mainly in
regions with exposed soil in the proximity of water bodies.
Many studies have reported the use of electric conductivity to assess the impact of pollutants in
the aquatic environment, both rivers (Uwidia and Ukulu, 2013; Thompson et al., 2012; Vargas
et al., 2015) and lakes (Das et al., 2006; Costa and Henry, 2010). The water of each region
presents characteristic electric conductivity, which depends mainly on the rock types the water
permeates (Tong and Chen, 2002). Mean conductivity values increased from Point P1 to Point
P5 (Table 2), which indicates an increase of ion concentrations upstream to downstream. It is
worth mentioning the high conductivity value (860 μS/cm) at Point P4, located in an agricultural
area. The use of fertilizers, such as inorganic nitrogen and phosphorus salts, leads to an increase

7 Assessment of the water quality and trophic …
Rev. Ambient. Água vol. 13 n. 2, e2170 - Taubaté 2018
in conductivity at P4. This can also be confirmed by the increase in total phosphorus (TP) at
this Point P4 in relation to Point P3 (Table 2). The contribution of other water bodies between
Points P4 and P5 causes the decrease of conductivity by dilution at Point P5 (671 μS.cm-1).
Vargas et al. (2015) obtained similar results for the Córrego Taquara do Reino, which belongs
to the homonymous watershed located north of the Guarulhos municipality. According to the
authors, the lack of basic sanitation caused an increase in electric conductivity.
Table 2. Values of the physical-chemical and microbiologic parameters of Ribeirão Guaraçau Watershed
waters from September 2015 to August 2016.
Parameter Points Mean s.d. Min. Max. CV (%) CONAMA 357 Class 3
T (oC)
P1 18.5 4.2 13.0 24.3 22.9
N.E.
P2 20.9 4.3 14.5 26.0 20.7
P3 20.7 4.0 14.9 24.9 19.5
P4 19.5 4.2 13.6 23.9 21.6
P5 21.8 4.0 15.3 25.6 18.5
pH (upH)
P1 6.1 0.4 5.6 6.6 5.8
6 to 9
P2 6.9 0.4 6.5 7.5 5.8
P3 7.3 0.8 5.98 8.1 11.4
P4 7.5 0.6 6.9 8.4 7.7
P5 7.0 0.7 6.5 8.3 10.7
TU (NTU)
P1 10 15 2 40 152
max. 100
P2 22 20 2 55 88
P3 30 11 12 39 36
P4 14 10 2 30 68
P5 206 204 32 532 99
CE (μS.cm-1)
P1 83 24 51 107 28.6
N.E.
P2 138 23 115 172 16.5
P3 242 107 156 457 44.4
P4 860 415 446 1603 48.3
P5 671 235 421 956 35
TP (mg.L-1)
P1 0.117 0.197 0.007 0.5 168 0.05 (lentic)
0.15 (lotic)
P2 0.123 0.285 0.007 0.71 231
P3 1.88 2.1 0.007 5.14 112
P4 2.54 1.58 0.007 4.18 63
P5 4.84 3.57 0.13 9.32 74
E. coli (UFC.100 mL-1)
P1 4.7E+03 2.2E+03 2.5E+03 8.0E+03 47
max. 2400
P2 6.3E+03 4.1E+03 2.4E+03 1.3E+04 65
P3 5.5E+05 1.1E+06 1.2E+04 2.8E+06 205
P4 7.9E+05 1.1E+06 1.2E+05 3.0E+06 145
P5 2.2E+07 2.3E+07 3.0E+06 5.4E+07 104
P2 lentic body (Lago Azul). The other points: lotic body.
Abbreviations: s.d. (standard deviation); CV (coefficient of variation); T (temperature); TU (turbidity);
CE (electric conductivity); TP (total phosphorus); E. coli (Escherichia coli); N.E (Not established).
Ribeirão Guaraçau reaches other water courses that flow towards the Lago Azul, which
was an old open pit for sand exploitation (Mesquita, 2011). At present, the lake is used for
recreation, such as swimming and fishing. At Point P2, total phosphorus values for lentic bodies
and especially the microbiologic parameter exceeded the values established by the legislation.
Fecal contamination from regular and irregular occupations, plus the lack of sewerage and
farming lead to the values above those permitted by legislation and certainly this demands
attention from municipal authorities, given that the use of Lago Azul for recreational activities
is encouraged by them. Point P3, in the northern portion of the watershed, is the confluence of
contributions from households of the Água Azul neighborhood, in particular the high-density

Rev. Ambient. Água vol. 13 n. 2, e2170 - Taubaté 2018
8 Reinaldo Romero Vargas et al.
disordered urban occupation (slums) with no sewerage. Such a degradation scenario is
confirmed when comparing Point P2 to Point P3. There is an increase of 15 times in total
phosphorus mean concentration and 87 times in E. coli mean values. These values continuously
increase along the basin, and the highest values are found at Point P5, which receives the inflow
of urban area located in neighborhoods Chácara Recreio Rober and Vila Carmela.
The behavior of total phosphorus and E. coli was distinct during rainy periods. Total
phosphorus values were higher during dry periods, with the exception of Point P4, indicating
that in rainy periods dilution of phosphorus concentrations takes place in the surficial waters.
The mean total phosphorus values and standard deviations for the dry and rainy periods were
respectively at P1: 0.176 ± 0.281 and 0.059 ± 0.089; at P2: 0.240 ± 0.403 and 0.007 ± 0.000; at
P3: 2.577 ± 2.335 and 1.175 ± 2.023; at P4: 2.463 ± 1.056 and 2.607 ± 2.268, and at P5: 5.350
± 3.838 and 4.329 ± 4.035. The very close phosphorus values at Point P4 can be related to the
constant use of fertilizers in the agricultural area (Figure 2). Saad et al. (2013) also observed
the dilution effect in total phosphorus concentrations during rainy periods and, according to the
authors, this effect was more pronounced in the consolidated urban area and impervious soil.
Peláez-Rodríguez (2001) also observed an increase in the concentration of nutrients during the
dry season and attributed this fact to the increase in nutrient concentration due to decrease in
water flow. Similarly, Stacciarini (2002), when assessing the quality of the water resources in
Paulínia (State of São Paulo), observed that in the majority of the points he analyzed phosphorus
concentrations were higher in the dry period. Cruz (2003), assessing the quality of the Uberaba
River waters (State of Minas Gerais), obtained the same trends regarding total phosphorus in
rainy and dry periods.
Farage et al. (2010) observed in the region of the Pombas River (State of Minas Gerais)
that during the rainy period, runoff in anthropized areas contributed to a higher discharge of
phosphorus, increasing its concentration, even with higher river flows. The authors attributed
this increase in total phosphorus to runoff occurring in the rainy periods mainly on soils devoid
of vegetation or with predominant grassy cover, as on the margins of the Pomba River.
According to Prada and Oliveira (2006), the increase in phosphorus in river waters during the
rainy period can also be related to the re-suspension of bottom sediments as the river flow
increases.
The amount of microorganisms present in surficial waters was higher in the rainy period,
in special at the least-preserved points, as indicated by the E. coli logarithmic values during the
rainy and dry periods, respectively for P3: 5.36 ± 1.20 and 4.46 ± 0.14; for P4: 5.96 ± 0.55 and
5.14 ± 0.10, and for P5: 7.25 ± 0.41 and 6.92 ± 0.70. Saad et al. (2013) obtained similar results
for the Ribeirão Tanque Grande Watershed, which presents geomorphological characteristics
similar to those of RGW. Due to the higher declivity, runoff takes place with the transport of
microorganisms to the water bodies, preventing water infiltration in the soil (Chaves and
Santos, 2009; De Azevedo Lopes and Magalhães Júnior, 2010; Andrietti et al., 2016).
The Trophic State Index was calculated using total phosphorus (TP) values. Figure 3 shows
that TSI values increase from rural to urban zones.

9 Assessment of the water quality and trophic …
Rev. Ambient. Água vol. 13 n. 2, e2170 - Taubaté 2018
Figure 3. Trophic State Index behavior along Ribeirão Guaraçau Watershed from
September 2015 to August 2016.
In Points P1 and P2, which are the most-preserved, trophic state levels vary from
oligotrophic to mesotrophic, indicating the presence of clean water bodies, in which unwanted
interferences resulting from the presence of nutrients, in special phosphorus, do not occur. For
the other points, progressive worsening of the water body trophic state is observed (Figure 3).
In the rainy periods, TSI (TP) values were favorably lower, thanks to the dilution of the
nutrients. For Point P3, the supereutrophic level predominates, but with ample variation from
oligotrophic to hypereutrophic. The presence of small farms and the irregular occupation in the
surroundings of Point P3, plus the temporal effect, besides the paving works during the
sampling period, caused such variations in the trophic level. Similar results were obtained by
Saad et al. (2013) and Vargas et al. (2015) for other watersheds of the Guarulhos municipality.
The trophic levels at Point P4 got worse, varying from eutrophic to hypereutrophic. Agricultural
activities close to this point cause the worsening of the trophic level, due to contamination by
fertilizers used in plantations (Farage et al., 2010; Gonçalves and Rocha, 2016; Zhou et al.,
2016). Point P5 reached hypereutrophic levels in all determinations, indicating a water body
significantly affected by high organic matter and nutrient concentrations, compromising the use
of the water at that point.
4. CONCLUSIONS
The recent hydric crisis that affected the southeastern region of Brazil from 2014 to 2016
and that still affects a large part of the Brazilian northeastern region calls attention to
preservation policies and control of watershed areas. The expansion of urban areas towards
these watershed areas directly affects the quality of surficial and underground waters, in
particular in developing countries due mainly to the lack of sewage treatment, which is directly
discharged in rivers, causing pollution and impacts on the environment. Urbanization favors
impermeabilization of the soil, leading to flooding and making aquifer recharge difficult.
Several areas in the northern part of the Guarulhos municipality produce water but
unfortunately the studies of the watersheds, in particular of the Baquirivu-Guaçu River
Watershed, have pointed to the degradation of the water bodies. The present study of the
Ribeirão Guaraçau Watershed shows that the Ribeirão Guaraçau surficial waters in the rural
area are already compromised in the surroundings of the Lago Azul (point P2). The other points,

Rev. Ambient. Água vol. 13 n. 2, e2170 - Taubaté 2018
10 Reinaldo Romero Vargas et al.
P3 to P5, reveal the worsening of the water quality in respect to total phosphorus and E. coli,
indicating fecal contamination due to the lack of basic sanitation. The increase of disordered
developments close to Lago Azul has contributed to the worsening of the water quality. The
values of both parameters at these sampling points exceeded the limit established by CONAMA
Resolution 357/05 for Class 3 water bodies. Points P3 and P4 in the rural zone present signs of
degradation, with trophic levels varying from oligotrophic to hypereutrophic and predominance
of the supereutrophic level at Point P3, and worse conditions at Point P4, with the predominance
of the hypereutrophic level and variations from eutrophic to hypereutrophic.
The Bonsucesso Sewage Treatment Station, located downstream from the Ribeirão
Guaraçau Watershed, was inaugurated in December 2011 to attend to a sewage treatment
demand for 260 thousand inhabitants (SAAE, 2013). The necessity to build a collecting net and
sewage treatment installations in the Bonsucesso Station is herein emphasized (Vargas et al.,
2017).
5. ACKNOWLEDGMENTS
To São Paulo Research Foundation for the financial support to Research Project Proc.
2015/07406-4.
6. REFERENCES
AGÊNCIA NACIONAL DE ÁGUAS (Brasil). Guia nacional de coleta e preservação de
amostras: água, sedimento, comunidades aquáticas e efluentes líquidos. São Paulo:
CETESB; Brasília: ANA, 2011.
AGÊNCIA NACIONAL DE ÁGUAS (Brasil). Conjuntura dos recursos hídricos no Brasil:
2013. Brasília, 2013.
ANDRADE, M. R. M.; OLIVEIRA, A. O.; QUEIROZ, E.; SATO, S. E.; BARROS, E. J.;
BAGATTINI, G. et al. Aspectos fisiográficos da paisagem guarulhense. In: OMAR, E.
E. H. (Org.) Guarulhos tem história: questões sobre história natural, social e cultural.
São Paulo: Ananda, 2008. p. 25-37.
ANDRIETTI, G.; FREIRE, R.; DO AMARAL, A. G.; DE ALMEIDA, F. T.; BONGIOVANI,
M. C.; SCHNEIDER, R. M. Índices de qualidade da água e de estado trófico do rio Caiabi,
MT/Water quality index and eutrophication indices of Caiabi River, MT. Revista
Ambiente & Água, v. 11, n. 1, p. 162 - 175, 2016. http://dx.doi.org/10.4136/ambi-
agua.1769
AMERICAN PUBLIC ASSOCIATION - APHA; AMERICAN WATER WORKS
ASSOCIATION - AWWA; WATER ENVIRONMENT FEDERATION - WEF.
Standard Methods for Examination of Water and Wastewater. 21 ed. Washington,
2012.
CARVALHO, A. de P.; BALDUINO, Â. R.; MACIEL, G. F.; PICANÇO, A. P. Avaliação da
poluição em rios utilizando índices de qualidade da água: um estudo de caso no Ribeirão
São João em Porto Nacional–TO. Geociências (São Paulo), v. 35, n. 3, p. 472-484, 2016.
CONSELHO NACIONAL DO MEIO AMBIENTE – CONAMA (Brasil) Resolução nº 357 de
17 de março de 2005. Dispõe sobre a classificação dos corpos de água e diretrizes
ambientais para o seu enquadramento, bem como estabelece as condições e padrões de
lançamento de efluentes, e dá outras providências. Diário Oficial [da] União, Brasilia, DF,
17 mar. 2005.

11 Assessment of the water quality and trophic …
Rev. Ambient. Água vol. 13 n. 2, e2170 - Taubaté 2018
COMPANHIA AMBIENTAL DO ESTADO DE SÃO PAULO - CETESB. Relatório de
qualidade das águas interiores no estado de São Paulo: 2006. São Paulo, 2007.
CHAVES, H. M. L.; SANTOS, L. B. Ocupação do solo, fragmentação da paisagem e qualidade
da água em uma pequena bacia hidrográfica. Revista Brasileira de Engenharia Agrícola
e Ambiental, v. 13, p. 922-930, 2009.
COSTA, M. L. R.; HENRY, R. Phosphorus, nitrogen, and carbon contents of macrophytes in
lakes lateral to a tropical river (Paranapanema River, São Paulo, Brazil). Acta Limnologica
Brasiliensia, v. 22, n. 2, p. 122-132, 2010. http://dx.doi.org/10.4322/actalb.02202002
CUNHA, D. G. F.; BOTTINO, F.; CALIJURI M. C. Land use influence on eutrophication-
related water variables: case study of tropical rivers with different degrees of anthropogenic
interference. Acta Limnologica Brasiliensia, v. 22, n. 1, p. 35-45, 2010.
http://dx.doi.org/10.4322/actalb.02201005
CRUZ, L. B. S. Diagnóstico ambiental da bacia do Rio Uberaba, MG. 2003. 180f. Tese
(Doutorado em Água e Solo) -Faculdade de Engenharia Agrícola, Universidade Estadual
de Campinas, 2003.
DAS, R.; SAMAL, N. R., ROY, P. K.; MITRA, D. Role of Electrical Conductivity as an
Indicator of Pollution in Shallow Lakes. Asian Journal of Water, Environment and
Pollution, v. 3, n 1, p. 143-146, 2006.
DE AZEVEDO LOPES, F. W.; MAGALHÃES JR., A. P. M. Influência das condições naturais
de pH sobre o índice de qualidade das águas (IQA) na bacia do Ribeirão de Carrancas.
Geografias, v. 6, n. 2, p. 134-147, 2010.
ENVIRONMENTAL SYSTEMS RESEARCH INSTITUTE - ESRI. ArcGIS Professional
GIS for the desktop, version 10.0. Redlands, 2013.
ESTEVES, F.A. Fundamentos de Limnologia. 3. ed. São Paulo: Interciência, 2011.
FARAGE, J. D. A. P.; MATOS, A. T.; SILVA, D. D.; BORGES, A. C. Determinação do índice
de estado trófico para fósforo em pontos do rio Pomba. Revista Engenharia na
Agricultura, v. 18, n. 4, p. 322-329, 2010. https://doi.org/10.13083/reveng.v18i4.98
FIA, R.; TADEU, H.C.; MENEZES, J. P. C; FIA, F. R. L; OLIVEIRA, L. F. C. Qualidade da
água de um ecossistema lótico urbano. Revista Brasileira de Recursos Hídricos, v.20,
n.2, p. 267 – 275, 2015.
GONÇALVES, D. R. P.; ROCHA, C. H. Indicadores de qualidade da água e padrões de uso da
terra em bacias hidrográficas no Estado do Paraná. Pesquisa Agropecuária. Brasileira,
v. 51, n. 9, p. 1172-1183, 2016.
INSTITUTO NACIONAL DE METEOROLOGIA - INMET. BDMEP - Banco de Dados
Meteorológicos para Ensino e Pesquisa. Available at
http://www.inmet.gov.br/portal/index.php?r=bdmep/bdmep. Accessed on: 18th October
2016.
LAMPARELLI, M. C. Grau de trofia em corpos d’água do estado de São Paulo: avaliação
dos métodos de monitoramento. 2004. 235f. Tese (Doutorado), Instituto de Biociências,
Universidade de São Paulo, São Paulo, 2004.

Rev. Ambient. Água vol. 13 n. 2, e2170 - Taubaté 2018
12 Reinaldo Romero Vargas et al.
MACHADO, P. J. O.; TORRES, F. T. P. Introdução à Hidrogeografia. São Paulo: Cengage
Learning, 2012.
MESQUITA, M. V. Degradação do meio físico em loteamento nos bairros Invernada,
Fortaleza e Água Azul, como estudos de casos da expansão urbana do município de
Guarulhos (SP). 2011. Tese (Doutorado) - Instituto de Geociências e Ciências Exatas,
Universidade Estadual Paulista Júlio de Mesquita Filho, Rio Claro, 2011.
OLIVEIRA, A. M. S.; ANDRADE, M. R. M.; QUEIROZ, W.; SATO, S. Bases Geoambientais
para um Sistema de Informações Ambientais do Município de Guarulhos. Guarulhos:
Universidade Guarulhos, 2009. p. 179.
PELÁEZ-RODRÍGUEZ, M. Avaliação da qualidade da água da Bacia do Alto Jacaré-
Guaçú – SP (Ribeirão do Feijão e Rio Monjolinho) através de varáveis Físicas,
Químicas e Biológicas. 2001. 144f. Tese. (Doutorado em Ciências da Engenharia.
Ambiental) - Universidade de São Paulo, São Carlos, 2001.
PEREIRA, B. W. de F.; MACIEL, M. D. N. M.; DE ASSIS OLIVEIRA, F.; DA SILVA
ALVES, M. A. M.; RIBEIRO, A. M.; FERREIRA, B. M. et al.. Uso da terra e degradação
na qualidade da água na bacia hidrográfica do rio Peixe-Boi, PA, Brasil/Land use and water
quality degradation in the Peixe-Boi River watershed. Revista Ambiente & Água, v. 11,
n. 2, p. 472, 2016. http://dx.doi.org/10.4136/ambi-agua.1802
PRADA, S. M.; OLIVEIRA, E. de. Distribuição de nutrientes (C, N e P) em testemunhos de
sedimentos do reservatório das Garças, Cotia – SP. In: REUNIÃO ANUAL DA
SOCIEDADE BRASILEIRA DE QUÍMICA, 29., 2006, São Paulo. Anais… Available at
http://sec.sbq.org.br/cd29ra/resumos/T1855-2.pdf. Accessed on: 18th October 2016.
RIBEIRO, T. F. B.; ANDRADE, M. R. M.; SATO, S. E.; Dos SANTOS, M. T.; SAAD, A. R.
Análise geoambiental da bacia hidrográfica do Ribeirão Guaraçau, Guarulhos (SP), com
base no mapa de uso da terra e aspectos morfométricos. Revista Universidade Guarulhos.
Geociências, v. 12, n. 1, p. 49 -62, 2013.
RÍOS-VILLAMIZAR, E. A.; MARTINS JUNIOR, A. F.; WAICHMAN, A. V. Caracterização
físico-química das águas e desmatamento na bacia do rio Purus, Amazônia Brasileira
Ocidental. Revista Geografia Acadêmica, v. 5, n. 2, p. 54-65, 2011.
SAAD, A. R.; VARGAS, R. R.; LOPES, J. C.; ARRUDA, R. O. M.; QUEIROZ, W. Índice de
estado trófico da bacia hidrográfica do Ribeirão Tanque Grande, Guarulhos (SP): análise
comparativa entre as zonas rural e urbana. Geociências, v. 32, n. 4, p. 611-624, 2013.
SERVIÇO AUTÔNOMO DE ÁGUA E ESGOTO DE GUARULHOS - SAAE. 2013. Sistema
de esgoto. Available at: http://www.saaeguarulhos.sp.gov.br:8081/sistema-de-esgoto.
Accessed on 19th September 2016.
SÃO PAULO. Decreto no 10.755, de 22 de novembro de 1977. Dispõe sobre o enquadramento
dos corpos de água receptores na classificação prevista no Decreto no 8.468, de 8 de
setembro de 1976, e dá providências correlatas. Diário Oficial [do] Estado, São Paulo,
1977.
SARDINHA, D. S.; CONCEIÇÃO, F. T.; SOUZA, A. D. G.; SILVEIRA, A.; JULIO, M.;
GONÇALVES, J. C. S. I. Avaliação da qualidade da água e autodepuração do Ribeirão do
Meio, Leme (SP). Engenharia Sanitária e Ambiental, v. 13, n.3, p. 329-338, 2008.

13 Assessment of the water quality and trophic …
Rev. Ambient. Água vol. 13 n. 2, e2170 - Taubaté 2018
SILVA, G. S.; SANTOS, E. A.; CORRÊA, L. B.; MARQUES, A. L. B.; MARQUES, E. P.;
SOUSA, E. R. et al. Avaliação integrada da qualidade de águas superficiais: grau de trofia
e proteção da vida aquática nos rios Anil e Bacanga, São Luís (MA). Engenharia
Sanitária Ambiental v. 19, n. 3, p. 245-251, 2014. http://dx.doi.org/10.1590/S1413-
41522014019000000438
STACCIARINI, R. Avaliação da qualidade dos recursos hídricos junto ao Município de
Paulínia, Estado de São Paulo, Brasil. 2002. 214f. Tese (Doutorado) - Faculdade de
Engenharia Agricola, Universidade Estadual de Campinas, Campinas, 2002.
THOMPSON, M. Y.; BRANDES, D.; KNEY, A. D. Using electronic conductivity and
hardness data for rapid assessment of stream water quality. Journal of Environmental
Management, v. 104, p. 152-157, 2012. https://doi.org/10.1016/j.jenvman.2012.03.025
TONG, S. T. Y.; CHEN, W. Modeling the relationship between land use and surface water
quality. Journal of Environmental Management, v. 66, p. 377-393, 2002.
https://doi.org/10.1006/jema.2002.0593
UWIDIA, I. E.; UKULU, H. S. Studies on electrical conductivity and total dissolved solids
concentration in raw domestic wastewater obtained from an estate in Warri, Nigeria.
Greener Journal of Physical Sciences. v. 3, n. 3, p. 110-114, 2013.
VARGAS, R. R.; SAAD, A. R.; DALMAS, F. B.; ROSA, A.; ARRUDA, R. O. M.;
MESQUITA, M. V. et al. Water Quality Assessment in the Córrego Taquara do Reino
Watershed, Guarulhos Municipality (São Paulo State - Brazil): Effects of Environmental
Degradation. Anuário do Instituto de Geociências, v. 38, n. 2, p. 137-144, 2015.
VARGAS, R. R.; GONÇALVES, J. J. S.; DALMAS, F. D.; SAAD, A. R.; ARRUDA, R. O. M.;
FERREIRA, A. T. S. The contribution of the Guarulhos Municipality (São Paulo State) to
the water quality of the Alto Tietê System. Pesquisas em Geociências, v. 44, n. 1, p. 109-
121, 2017.
ZHOU, P.; HUANG, J.; PONTIUS JÚNIOR, R. G.; HONG, H. New insight into the
correlations between land use and water quality in a coastal watershed of China: Does point
source pollution weaken it? Science of the Total Environment, v. 543, p.591–600, 2016.
https://doi.org/10.1016/j.scitotenv.2015.11.063

Ambiente & Água - An Interdisciplinary Journal of Applied Science
ISSN 1980-993X – doi:10.4136/1980-993X
www.ambi-agua.net
E-mail: [email protected]
This is an Open Access article distributed under the terms of the Creative Commons
Attribution License, which permits unrestricted use, distribution, and reproduction in any
medium, provided the original work is properly cited.
Effects of different operating conditions on total nitrogen removal
routes and nitrous oxide emissions in a lab-scale activated sludge
system
ARTICLES doi:10.4136/ambi-agua.2174
Received: 23 Aug. 2017; Accepted: 20 Jan. 2018
Renato Pereira Ribeiro1; Débora Cynamon Kligerman2; William Zamboni de Mello3;
Denise da Piedade Silva4; Renatah da Fonseca Correia2; Jaime Lopes da Mota Oliveira2*
1Instituto Federal de Educação, Ciência e Tecnologia do Rio de Janeiro (IFRJ), Nilópolis, RJ, Brasil
E-mail: [email protected] 2Fundação Oswaldo Cruz (FIOCRUZ), Rio de Janeiro, RJ, Brasil
Departamento de Saneamento e Saúde Ambiental (DSSA). E-mail: [email protected],
[email protected], [email protected] 3Universidade Federal Fluminense (UFF), Niterói, RJ, Brasil
Departamento de Geoquímica (GEO). E-mail: [email protected] 4Universidade Federal do Rio de Janeiro (UFRJ), Rio de Janeiro, RJ, Brasil
Centro de Ciências da Saúde (CCS). E-mail: [email protected] *Corresponding author
ABSTRACT This study sought to determine the effects of different operating conditions, such as
variable organic loading, different sludge retention times (SRTs) and airflow rates, limited
dissolved oxygen (DO) concentrations and ammonium (NH4+) shock loading on total nitrogen
(TN) removal routes and nitrous oxide (N2O) emissions in a lab-scale activated sludge system.
Short SRT (5 days) combined with very low DO levels (0.5 mg L-1) were responsible for lower
TKN oxidation efficiencies and, consequently, negligible NO2- accumulation rates. These
results suggest that nitrification efficiency was hampered by the oxidation of organic matter,
with a large part of TN removed by sludge waste process. As the SRT increased (from 5 to 10
days) and DO was set to 1.0 mg L-1, TKN oxidation rates and NO2- accumulation reached their
maxima, which are thought to be the optimal conditions for both organic matter oxidation and
partial nitrification. Under these conditions, gas transfer to the atmosphere became the
preferential route for TN removal instead of incorporation into the sludge waste. However, N2O
contribution is estimated as less than 5.6% (with respect to TN in the influent). Insufficient
aeration and stress conditions (such as NH4+ shock loading) can cause limited DO conditions
and NO2- accumulation, leading to higher amounts of emitted N2O. Therefore, the adequate
control of DO concentrations is a key factor to avoid NO2- accumulation and consequently high
N2O emissions.
Keywords: activated sludge, dissolved oxygen, nitrite accumulation rate, nitrogen removal routes,
nitrous oxide emission.

Rev. Ambient. Água vol. 13 n. 2, e2174 - Taubaté 2018
2 Renato Pereira Ribeiro et al.
Efeito das diferentes condições operacionais nas rotas de remoção do
nitrogênio total e emissões de óxido nitroso em um sistema de lodos
ativados em escala de bancada
RESUMO O principal objetivo deste estudo foi determinar os efeitos das diferentes condições
operacionais, tais como carga orgânica variável, diferentes idades do lodo e taxas de aeração,
limitação das concentrações de oxigênio dissolvido (OD) e choque de carga de amônio (NH4+),
nas rotas de remoção do nitrogênio total (NT) e nas emissões de óxido nitroso (N2O)
provenientes de um sistema de lodos ativados em escala de bancada. Idades do lodo reduzidas
(5 dias) combinadas com baixas concentrações de OD (0,5 mg L-1) foram responsáveis por uma
baixa eficiência de oxidação do NT Kjeldahl (NTK) e, consequentemente, negligenciáveis taxas
de acúmulo de nitrito (NO2-). Esses resultados sugerem uma perda na eficiência da nitrificação
completa em razão do maior comprometimento do OD com à oxidação da matéria orgânica,
com a maior parcela do N removida pela incorporação ao lodo excedente. O aumento da idade
do lodo (de 5 para 10 dias) combinada com o aumento da concentração de OD para
1,0 mg L-1, levaram ao alcance das taxas máximas de oxidação do NTK e de acúmulo de
NO2-, o que representou uma condição ótima para ambos os processos de oxidação da matéria
orgânica e nitrificação incompleta. Sob essas condições, a transferência de gás para a atmosfera
tornou-se a rota preferencial de remoção do NT. No entanto, a contribuição do N2O foi estimada
em até 5,6% da carga de NT afluente. Condições de stress (choque de carga de NH4+) e aeração
insuficiente podem causar períodos de limitação de OD e acúmulo de NO2-, podendo levar
assim à maiores emissões de N2O. Portanto, o controle adequado das concentrações de OD é o
fator chave para evitar o acúmulo de NO2- e, consequentemente, maiores emissões de N2O.
Palavras-chave: emissão de óxido nitroso, lodo ativado, oxigênio dissolvido, rotas de remoção de
nitrogênio, taxa de acúmulo de nitrito.
1. INTRODUCTION
The biological pathway for N removal in WWTPs is nitrification, followed by
denitrification processes (Wrage et al., 2001; Law et al., 2012). The activated sludge process
can provide optimal conditions for the conversion of ammonium (NH4+) to nitrate (NO3
-)
(complete nitrification: NH4+ → NO2
- → NO3-), especially in tropical regions (Wrage et al.,
2001). However, to combine both processes, the design and operation of a traditional WWTP
must be altered (i.e. an anoxic zone and internal recirculation systems must be added) to allow
for the complete denitrification process, the key process for the effective removal of N as
molecular nitrogen (N2) (NO3- → NO2
- → NO → N2O → N2) (Wrage et al., 2001). Another
route for N removal is by the sludge waste process (Lee et al., 2008; Bernat et al., 2011).
Recently, several studies have addressed N removal processes under many controlled operating
conditions, such as hydraulic retention time (HRT), sludge retention time (SRT), dissolved
oxygen (DO) concentrations and organic loading rates, among others (Bernat et al., 2011;
Rassol et al., 2014; Xiang et al., 2014; Lu et al., 2015). However, only some of these studies
calculated the total N (TN) balance (Lee et al., 2008; Bernat et al., 2011).
WWTPs with biological N removal (BNR) are an effective way to decrease the discharge
of oxidized N forms (as NO3-) into water bodies and thus prevent eutrophication. On the other
hand, nitrous oxide (N2O) emissions from WWTPs are an issue of international concern and
should also be taken into account (Keller and Hartley, 2003; IPCC, 2006). Currently,
wastewater treatment systems are thought to contribute with about 10% of total anthropogenic

3 Effects of different operating conditions on total …
Rev. Ambient. Água vol. 13 n. 2, e2174 - Taubaté 2018
N2O emissions, when including both manure and sewage treatments (Desloover et al., 2012).
N2O is one of the most important substances from an environmental point of view, since it is
linked to global warming and climate change. It is a greenhouse gas with a global warming
potential 310 times that of carbon dioxide (CO2), contributing approximately 7% to overall
greenhouse gases (IPCC, 2013). In addition, N2O is indirectly responsible for the depletion of
stratospheric ozone (O3) by its reaction with excited oxygen atoms and nitric oxide (NO)
production: N2O + O (1D) → 2 NO and NO + O3 → NO2 + O2 (Crutzen, 1979; Ravishankara et
al., 2009). Ravishankara et al. (2009) believe that N2O will become the major dominant ozone-
depleting substance before the end of this century.
During nitrification and denitrification processes, respectively, N2O is formed as a
by-product of NH4+ oxidation to nitrite (NO2
-) and as an intermediate of the reduction of
oxidized N forms to N2 (Wrage et al., 2001). Generally, there is no single N2O emission
mechanism from WWTPs and the pathways related to its production are dependent on the
WWTP design and closely related to operating conditions (Ahn et al., 2011; Hu et al., 2013).
Nitrification is reported as the main source of N2O emission under DO limitations and,
consequently, high NO2- concentrations. However, the denitrification process can contribute
significantly to higher N2O emissions under an insufficient organic carbon source (C/N ratio)
with high NO2- concentrations (Kampschreur et al., 2009; Law et al., 2012). Thus, the operating
conditions that lead to the accumulation of NO2- concentrations are subject to high N2O
emissions. Therefore, further studies are required to elucidate the importance of controlling
operational conditions in order to reduce NO2- concentrations and thus mitigate N2O emissions
(Desloover et al., 2012).
In this context, this study sought to determine the effects of different operating conditions,
such as variable organic loading, different SRTs and airflow rates, limited DO concentrations
and NH4+ shock loading, on TN removal routes and N2O emissions in a lab-scale activated
sludge system.
2. MATERIALS AND METHODS
2.1. Lab-scale system and regular operating condition
A continuous lab-scale reactor (total volume = 20 L) consisting of four adjacent and
interconnected chambers (V = 5 L) was monitored over 212 days (Figure 1). For the first 135
days, the lab-scale system functioned with some small variations of load (denoted as regular
operating condition) to promote the acclimatization of the biomass to the synthetic wastewater.
These some small variations occurred as a function of the storage conditions of the synthetic
sewage used to supply the reactor. The first chamber (C1; average DO < 0.1 mg L-1) was used
as a biological selector (with pre-denitrification) and a mixing zone of the synthetic wastewater
and biological sludge that returns from the settler (V = 2 L). The other three chambers
(V = 15 L) were aerated so as to maintain DO concentrations near 2.0 mg L-1. During this
period, HRT and SRT were maintained at 12 hours and 10 days, respectively. The continuous
flow rate of synthetic wastewater was 1.7 L h-1. Sludge recycling was performed by a peristaltic
pump, pumping the biological sludge from the settler to the anoxic chamber (C1), at a flow of
1.7 L h-1. Internal recirculation was present, in order to allow for the return of NO2- and NO3
-
to the reactor, at a flow rate of 3.7 L h-1.

Rev. Ambient. Água vol. 13 n. 2, e2174 - Taubaté 2018
4 Renato Pereira Ribeiro et al.
Figure 1. Schematic design of the lab-scale activated sludge system.
2.2. Operating conditions to determine the distribution of the routes of TN removal
To determine the relative distribution of the TN removal routes (sludge and atmosphere)
under different operating conditions, the reactor was submitted to a two-phased experimental
condition (Phases 1 and 2), between the 135th and the 212nd monitoring days, with different
SRTs, limited DO concentrations (in C2-C4) and variable organic loading. Phase 1 was carried
out between the 135th and the 169th day, under a SRT of 5 days and DO concentration of
0.5 mg L-1, and Phase 2, between the 169th and the 212nd day, under a SRT of 10 days and DO
concentration of 1.0 mg L-1. The SRT was maintained for 5 or 10 days by controlling sludge
wastage and monitoring the concentration of volatile suspended solids (VSS) in the reactor and
the sludge recirculation line. In both phases, the HRT was maintained at 12 hours. The first 19
days of Phase 1 were considered an adaptation period (from the 135th to the 154th day), and the
same was set for the first 21 days of Phase 2 (from the 170th to the 191st day). The process was
performed at room temperature, at approximately 25ºC.
2.3. Operating conditions to determine the magnitude of N2O emissions
After conducting the experiment described previously (item 2.2.), the system was
discontinued due to problems in its three peristaltic pumps used for the input of synthetic
wastewater, sludge recirculation and internal recirculation. With the acquisition of new pumps
(Masterflex), the continuous lab-scale system was restarted for a new 80-day experiment. The
system was operated under the same operating condition as Phase 2 (SRT of 10 days and DO
concentrations near 1.0 mg L-1). The purpose was to achieve the accumulation of NO2-
concentrations, and, after the 72nd monitoring day, to determine the magnitude of N2O
emissions (and the N2O/Natmosphere ratio) under different operating conditions, such as variable
organic loading and different air flow rates applied to promote different DO levels (in C2-C4)
(and NO2- concentrations) in the reactor. Four experimental conditions (EC) were performed
varying the air flow rates, as follows, in chronological order: 200 mL min-1 (EC 1: 74th day),
50 mL min-1 (EC 2: 76th day), 300 mL min-1 (EC 3: 78th day) and 400 mL min-1
(EC 4: 80th day). The stabilization period for each EC was of 24 hours.
2.4. Biological sludge and wastewater composition
The biological sludge used in this work was collected from a WWTP and the reactor was
fed with the synthetic wastewater. The synthetic wastewater was prepared mixing casein
peptone (320 mg L-1), meat extract (220 mg L-1), urea (60 mg L-1), potassium monohydrogen
phosphate (56 mg L-1), sodium chloride (14 mg L-1), calcium chloride dihydrate (8 mg L-1) and
magnesium sulfate heptahydrate (4 mg L-1) (Holler and Trösch, 2001). The pH of the synthetic
wastewater ranged between 7 and 8. Variations in chemical oxygen demand (COD) and TN
concentrations were obtained by increasing or decreasing the amount of substances, like casein
peptone, meat extract and urea, in the synthetic wastewater.

5 Effects of different operating conditions on total …
Rev. Ambient. Água vol. 13 n. 2, e2174 - Taubaté 2018
2.5. Sampling and analytical procedures
Table 1 displays the sampling strategy used for the different operating conditions of the
continuous lab-scale system. Liquid samples of synthetic and treated wastewaters were
regularly collected to determine COD, TKN and TN concentrations. Liquid and gas samples
from the four chambers were collected during the experimental operating conditions to
determine the relative distribution of TN removal routes (Phases 1 and 2) and the magnitude of
N2O emissions (ECs 1-4). Liquid samples were filtered through 0.22 µm cellulose acetate
membrane filters for the determination of dissolved inorganic nitrogen (DIN = NH4+, NO2
- and
NO3-) forms. In addition, VSS and TN sampling and analyses were carried out in the reactor
and sludge recycler. The DO concentrations in the reactor were directly measured by a
multiparameter Hanna portable meter (Model HI9828).
Gas samples were collected every 15 minutes, totaling 180 minutes per monitoring day
(between the 74th and the 80th days), covering the four chambers of the lab-scale reactor for the
determination of the N2O emissions. A modified upturned funnel was used as the gas sampling
technique (on a lab-scale). This same technique has been applied by our group in full-scale
WWTP studies (Mello et al., 2013; Ribeiro et al., 2015; Brotto et al., 2015). The N2O emission
rate (ER) for the reactor was calculated by multiplying the ΔN2O concentration, which is the
difference between the upturned funnel headspace and the atmospheric N2O concentrations, by
the emerging airflow rate (Qair), as displayed in Equation (1). The latter was measured at the
surface of the reactor using the upturned funnel and a digital rotameter, and the result was scaled
up for the entire reactor.
N2O ER (mg N h-1) = ΔN2O concentration × Qair × (Areactor/Aupturned funnel) (1)
Table 1. Sampling strategy for the different operating conditions.
Samples Items 2.1 and 2.2 Item 2.3
(0-135th day)a (135-212nd day)b (0-72nd day)c (74-80th day)d
Synthetic wastewater COD and TN COD, TKN and TN TKN and TN TKN and TN
Lab-scale reactor DO and VSS DIN, DO and VSS DIN, DO and VSS DIN, N2O, DO and VSS
Sludge excess VSS TN and VSS VSS TN and VSS
Treated wastewater COD and TN COD, TKN and TN TKN and TN TKN and TN
aRegular operating condition (no experiments). bOperating conditions to determine the distribution of the TN removal routes (Phases 1 and 2). cSame operating condition as Phase 2. dOperating conditions to determine the magnitude of N2O emissions (EC 1-4).
In the laboratory, N2O determinations were performed on a Shimadzu gas chromatograph
(Model GC-17) equipped with an electron capture detector with 63Ni source. The limits of
detection and quantification were of 30 and 300 ppb, respectively. All analytical procedures
followed APHA et al. (2012) protocols. COD, TKN and TN were determined using the closed
reflux colorimetric, block digestion and direct persulfate digestion methods, respectively. VSS
concentrations were determined by the gravimetric method. NH4+ concentrations were
measured using an ammonia ion-selective electrode method coupled to an Orion pH-meter
(Model Star 5). NO2- and NO3
- concentrations were determined by ion chromatography with
chemical suppression of eluent conductivity on a Methrohm ion chromatograph (Model 790
Personal). The limits of quantification were of 0.03 mg L-1 for NH4+, 0.1 mg L-1 for NO2
- and
NO3-, and 10 mg N L-1 for TN. The analytical precision of the analyses performed in triplicate
was within ± 5%.

Rev. Ambient. Água vol. 13 n. 2, e2174 - Taubaté 2018
6 Renato Pereira Ribeiro et al.
3. RESULTS AND DISCUSSION
3.1. Regular operating condition
During the first 135 monitoring days, influent COD and TN concentrations (and volumetric
COD and TN loads) varied from 447 to 1054 mg L-1 (0.5 and 1.3 kg m-3 day-1) and from 59 to
130 mg L-1 (0.1 and 0.2 kg m-3 day-1), respectively. The average COD and TN removal
efficiencies (± standard deviation) were 92% (± 1.4%) and 57% (± 6.6%), respectively. Using
a lab-scale sequential batch reactor (SBR) system with fixed low volumetric COD load (0.4 kg
m-3 day-1), Lee et al. (2008) found COD and TN removal efficiencies of 92% and 65%,
respectively. Similar values were reported by Vaiopoulou et al. (2007) for COD (74-97%),
although their TN removal efficiency was somewhat higher, around 70%. They operated a
differential lab-scale activated sludge system with a denitrification cascade and worked with a
wide range of influent volumetric COD loads applied to the system (0.3 to 2.0 kg m-3 day-1).
Vaiopoulou et al. (2007) reported that the higher influent flow rate distribution to the reactor
zones (denitrification cascade) explained the higher TN removal rates, in contrast to our study,
that operated only with pre-denitrification.
The variability of the organic loading did not have any effect on COD removal efficiency,
although lower TN removal efficiencies were related to lower influent TN concentrations.
Between the 9th and the 21st monitoring day, influent TN concentrations dropped to about 30%,
resulting in a decrease in TN removal efficiency, from 63 to 48% (Figure 2A). The same
happened between the 55th and the 76th monitoring day, when the influent TN concentration
dropped about 40% and TN removal efficiency decreased from 67 to 41%. These results
indicate that significant decreases in influent TN concentrations result in decreasing TN
removal efficiencies, given that TN concentrations and its removal efficiencies are positively
correlated (r = 0.68; n = 10; p < 0.01) (Figure 2B). Liu et al. (2012) observed losses in TN
removal efficiency when applying lower volumetric NH4+ loads from a SBR using a completely
autotrophic nitrogen-removal via nitrite (CANON) process. On the other hand, Zhang et al.
(2014) demonstrated that maximal TN removal efficiency (90%) was obtained in a lab-scale
sequencing batch biofilm reactor (SBBR) after 132 days of operation, where the volumetric TN
load was gradually increased from 0.08 to 0.6 kg m-3 day-1.
3.2. The relative distribution of TN removal routes
The fate of the removed TN was determined based on mass flow rates of the influent
wastewater, liquid effluent and sludge waste. TN removal via mass transfer to the atmosphere
was calculated by the difference between the influent TN load and TN removal via liquid
effluent and sludge waste, as displayed in Equation 2.
TNatmosphere = TNinfluent – (TNliquid effluent + TNsludge waste) (2)
Figure 3 shows the relative distribution of TN loss (and removal) calculated for the three
different outlet routes from the 154th to the 169th day (Phase 1) and from the 191st to the
212nd day (Phase 2). The average TN removal efficiency of the system in the Phase 1 was of
approximately 50%, of which about 40% was incorporated by the sludge waste and 10%
released to the atmosphere. This result can be explained by the short SRT (5 days) and very low
DO levels (DO = 0.5 mg L-1). Short SRT can lead to an increased net sludge production rate
and, consequently, higher TN removal by biomass production. During this phase, the net sludge
production rate increased from 9 to 13 g VSS day-1 under high volumetric COD (on average:
1 kg m-3 day-1) and TN (on average: 0.1 kg m-3 day-1) loading conditions. Bernat et al. (2011)
reported that a high biomass production was responsible for 16-26% of the TN removed in a
SBR at limited DO concentrations (< 0.7 mg L-1) and that these values were the result of a low

7 Effects of different operating conditions on total …
Rev. Ambient. Água vol. 13 n. 2, e2174 - Taubaté 2018
specific biomass decay rate. In addition, Lee et al. (2008) reported that 50% of the influent TN
in a SBR was removed by the sludge waste process.
Figure 2. (A) Influent TN concentrations (mg L-1)
and TN removal efficiencies (%) of the lab-scale
activated sludge system. (B) Correlation between TN
removal efficiencies and influent TN concentrations.
During Phase 2, the average TN removal efficiency was approximately 60% (Figure 3).
Throughout this phase, TN removal via mass transfer to the sludge waste decreased from 40 to
15%. Concomitantly, the fraction transferred to the atmosphere increased from 10 to 50%. This
can be explained by the increasing SRT (from 5 to 10 days) and DO levels
(from 0.5 to 1.0 mg L-1). Longer SRT can lead to decreases in the sludge mass by endogenous
metabolism and, consequently, lower TN removal by biomass production. During this period,
the net sludge production rate decreased from 13 to 6 g VSS day-1 even under the same
volumetric COD and TN loadings applied to Phase 1.
Figure 3. TN distribution (%) (regarding TN in the influent) in the
different system lines (sludge waste, atmosphere and liquid effluent).

Rev. Ambient. Água vol. 13 n. 2, e2174 - Taubaté 2018
8 Renato Pereira Ribeiro et al.
Figure 4 displays the effects of DO limitation on DIN concentrations during Phases 1 and
2. NH4+ was the predominant form of N in the reactor during Phase 1 (Figure 4A), due to lower
TKN oxidation efficiencies (40-60%) (Figure 4B). Consequently, NO2- accumulation rates
(NAR) were below 15% when the airflow rate was set to maintain DO levels close to
0.5 mg L-1, with a SRT of 5 days. For the calculation of NAR the equation cited by Wei et al.
(2014) was used. These results suggest loss of nitrification efficiency with no accumulation of
NO2-, since DO was restricted by organic matter oxidation. Therefore, the operational condition
applied in Phase 1 was characterized by loss of nitrification activity, which explains the highest
TN removal efficiencies by the sludge waste (Figure 3).
During Phase 2, NH4+ concentrations dropped below 10 mg L-1, with NO2
- as the major
form of DIN after the 200th monitoring day (Figure 4A). The NAR then began to prevail and
increased up to 80%, with TKN oxidation reaching efficiencies above 80% (Figure 4B). At DO
set near 1.0 mg L-1 with a SRT of 10 days, this phase showed optimal conditions for both
organic matter oxidation and partial nitrification. Ruiz et al. (2003) reported that around 65%
of the influent TN load was converted into NO2- in a lab-scale activated sludge reactor,
operating at DO around 0.7 mg L-1. These authors reported that when DO was below
0.5 mg L-1, NH4+ accumulated in the system. The effect of increasing DO concentrations (from
0.5 to 1.0 mg L-1) seems to explain the accumulation of NO2-, since Pollice et al. (2002) reported
that NO2- accumulation took place regardless of the SRT during oxygen-limiting conditions
(DO < 2 mg L-1) in a lab-scale activated sludge reactor. Therefore, in conditions that favor
partial nitrification, it is probable that the priority route of nitrogen removal will be through the
atmospheric path (Figure 3).
Figure 4. (A) Average DIN (NH4
+, NO2- and NO3
-)
concentrations (mg N L-1) in the three aerobic chambers,
(B) TKN oxidation (%), NO2- accumulation rates (NAR)
(%) and DO concentrations (mg L-1) during the 154th to
212th monitoring days in the lab-scale reactor.

9 Effects of different operating conditions on total …
Rev. Ambient. Água vol. 13 n. 2, e2174 - Taubaté 2018
3.3. Under the same operating condition as Phase 2
In order to achieve NO2- accumulation, the system was restarted and operated under the
same conditions as Phase 2. During the first 37 days, NH4+ concentrations ranged from 5 to
10 mg L-1 in the reactor (Figure 5A) with high TKN oxidation efficiencies (80-95%) (Figure
5B). These values are similar to those found in Phase 2, displayed in Figure 4. On the other
hand, NO3- was the predominant form of N in the reactor, with low NO2
- concentrations
(< 0.9 mg N L-1) (Figure 5A). These results suggest favorable conditions for the completion of
the nitrification process (and negligible NAR), since DO concentrations were above
1.0 mg L-1 (ranging from 0.9 to 1.8 mg L-1) (Figure 5B). However, when DO concentrations
dropped to ≤ 1 mg L-1 (ranging from 0.7 to 1.1 mg L-1), NO2- became the main form of oxidized
N in the reactor, without loss of TKN oxidation efficiency. Interestingly, NH4+ concentrations
were remained constant throughout the last monitoring days, especially between the 37th and
the 72nd day. In addition, NAR increased from 0 to 90% and NO3- concentrations were low
(< 1 mg N L-1). These results indicate the transition from complete to partial nitrification, and,
thus, the greater fraction of N was transferred to the atmosphere, as observed previously in
Phase 2 (Figure 3).
Figure 5. (A) Average DIN (NH4
+, NO2- and NO3
-)
concentrations in the three aerobic chambers; (B) TKN
oxidation (%), NO2- accumulation rate (NAR) (%) and DO
concentrations (mg L-1) during 72 monitoring days.
3.4. Extent of N2O emissions
Figure 6 displays the average DIN concentrations in the three aerobic chambers of the lab-
scale reactor (Figure 6A), as well as TKN oxidation and NAR values (Figure 6B) under the
different experimental conditions (EC 1-4). In addition, Figure 6C displays the N2O emission
variations and DO concentrations in the four experimental conditions. In EC 1
(Qair = 200 mL min-1), NH4+ was the predominant form of N in the reactor, followed by NO2
-
and NO3-, respectively, 64% (11 mg N L-1), 30% (5.2 mg N L-1) and 6% (1.1 mg N L-1) (Figure
6A). In addition, TKN oxidation and NAR were 76% and 84%, respectively (Figure 6B). More

Rev. Ambient. Água vol. 13 n. 2, e2174 - Taubaté 2018
10 Renato Pereira Ribeiro et al.
of the influent TN was converted to NO2- (11%) than to NO3
- (2%). In this experimental
condition, DO concentrations varied from 0.9 to 1.1 mg L-1 (Figure 6C). These results are
similar to those observed by Ruiz et al. (2003), that reported NO2- accumulation with DO
concentrations close to 0.7 mg L-1. Significant variations in N2O emissions were observed
within the range of 1.4 to 4.1 mg N h-1, representing on average 2.6 mg N h-1 and 5.4% when
normalized by influent TN load.
Similar NH4+ concentrations (9.6 mg N L-1) and TKN oxidation rates (73%) were observed
in EC 2 (Qair = 50 mL min-1) operating at an airflow rate four-fold lower than EC 1 (Figures
6A and 6B). However, NO3- (0.6 mg N L-1) and, especially, NO2
- (0.1 mg N L-1) concentrations
were low, and, consequently, with NAR of 14%. In this condition, the DO concentrations were
much lower (0.1-0.3 mg L-1) due to the lower airflow rate applied to the system (Figure 6C).
Therefore, under anoxic conditions, both NO2- and NO3
- were probably reduced by complete
denitrifying activity, without significant N2O emissions (< 0.5 mg N h-1), which represented,
on average, 0.1 mg N h-1 and 0.3% of the influent TN load. In a lab-scale system with activated
sludge, Wunderlin et al. (2012) reported that N2O emissions under anoxic conditions are likely
to be of minor importance when operated without significant NO2- accumulation
(< 2 mg N L-1).
Figure 6. (A) Average DIN (NH4
+, NO2- and NO3
-)
concentrations (mg N L-1) in the three aerobic chambers,
(B) TKN oxidation (%) and NO2- accumulation rate
(NAR) (%) and (C) N2O emissions (mg N h-1) and DO
concentrations (mg L-1) in the lab-scale reactor for each
of the four experimental conditions.
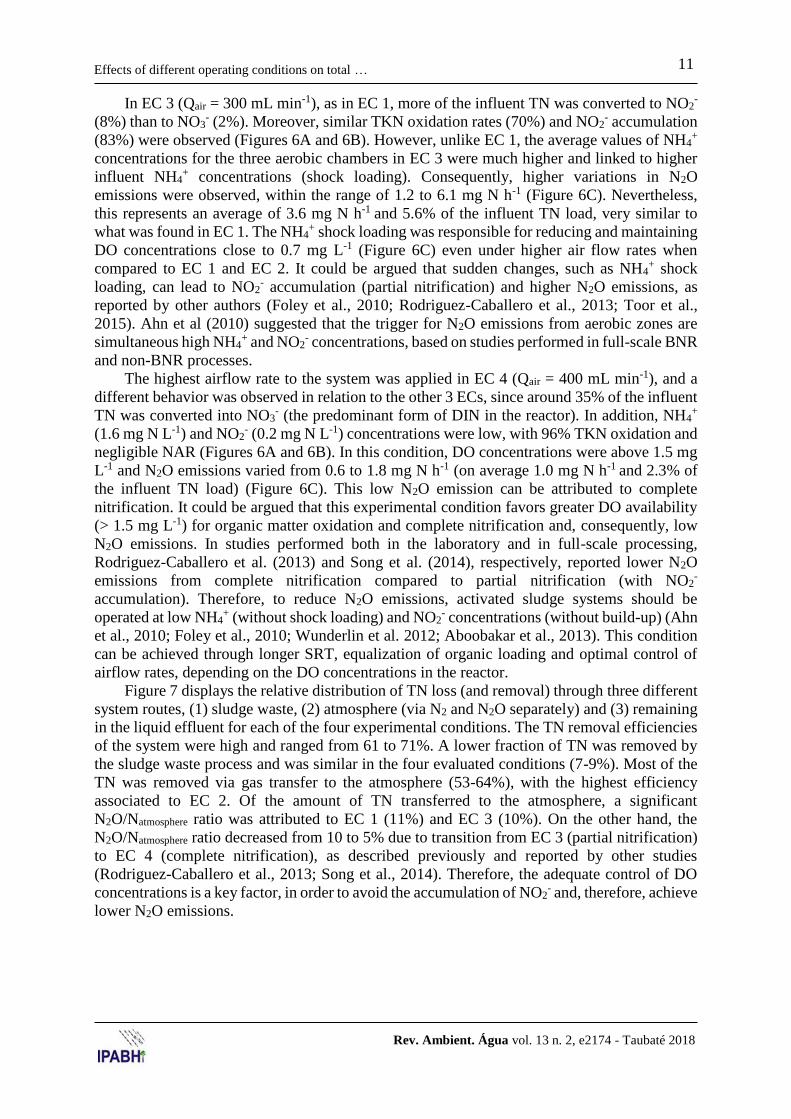
11 Effects of different operating conditions on total …
Rev. Ambient. Água vol. 13 n. 2, e2174 - Taubaté 2018
In EC 3 (Qair = 300 mL min-1), as in EC 1, more of the influent TN was converted to NO2-
(8%) than to NO3- (2%). Moreover, similar TKN oxidation rates (70%) and NO2
- accumulation
(83%) were observed (Figures 6A and 6B). However, unlike EC 1, the average values of NH4+
concentrations for the three aerobic chambers in EC 3 were much higher and linked to higher
influent NH4+ concentrations (shock loading). Consequently, higher variations in N2O
emissions were observed, within the range of 1.2 to 6.1 mg N h-1 (Figure 6C). Nevertheless,
this represents an average of 3.6 mg N h-1 and 5.6% of the influent TN load, very similar to
what was found in EC 1. The NH4+ shock loading was responsible for reducing and maintaining
DO concentrations close to 0.7 mg L-1 (Figure 6C) even under higher air flow rates when
compared to EC 1 and EC 2. It could be argued that sudden changes, such as NH4+ shock
loading, can lead to NO2- accumulation (partial nitrification) and higher N2O emissions, as
reported by other authors (Foley et al., 2010; Rodriguez-Caballero et al., 2013; Toor et al.,
2015). Ahn et al (2010) suggested that the trigger for N2O emissions from aerobic zones are
simultaneous high NH4+ and NO2
- concentrations, based on studies performed in full-scale BNR
and non-BNR processes.
The highest airflow rate to the system was applied in EC 4 (Qair = 400 mL min-1), and a
different behavior was observed in relation to the other 3 ECs, since around 35% of the influent
TN was converted into NO3- (the predominant form of DIN in the reactor). In addition, NH4
+
(1.6 mg N L-1) and NO2- (0.2 mg N L-1) concentrations were low, with 96% TKN oxidation and
negligible NAR (Figures 6A and 6B). In this condition, DO concentrations were above 1.5 mg
L-1 and N2O emissions varied from 0.6 to 1.8 mg N h-1 (on average 1.0 mg N h-1 and 2.3% of
the influent TN load) (Figure 6C). This low N2O emission can be attributed to complete
nitrification. It could be argued that this experimental condition favors greater DO availability
(> 1.5 mg L-1) for organic matter oxidation and complete nitrification and, consequently, low
N2O emissions. In studies performed both in the laboratory and in full-scale processing,
Rodriguez-Caballero et al. (2013) and Song et al. (2014), respectively, reported lower N2O
emissions from complete nitrification compared to partial nitrification (with NO2-
accumulation). Therefore, to reduce N2O emissions, activated sludge systems should be
operated at low NH4+ (without shock loading) and NO2
- concentrations (without build-up) (Ahn
et al., 2010; Foley et al., 2010; Wunderlin et al. 2012; Aboobakar et al., 2013). This condition
can be achieved through longer SRT, equalization of organic loading and optimal control of
airflow rates, depending on the DO concentrations in the reactor.
Figure 7 displays the relative distribution of TN loss (and removal) through three different
system routes, (1) sludge waste, (2) atmosphere (via N2 and N2O separately) and (3) remaining
in the liquid effluent for each of the four experimental conditions. The TN removal efficiencies
of the system were high and ranged from 61 to 71%. A lower fraction of TN was removed by
the sludge waste process and was similar in the four evaluated conditions (7-9%). Most of the
TN was removed via gas transfer to the atmosphere (53-64%), with the highest efficiency
associated to EC 2. Of the amount of TN transferred to the atmosphere, a significant
N2O/Natmosphere ratio was attributed to EC 1 (11%) and EC 3 (10%). On the other hand, the
N2O/Natmosphere ratio decreased from 10 to 5% due to transition from EC 3 (partial nitrification)
to EC 4 (complete nitrification), as described previously and reported by other studies
(Rodriguez-Caballero et al., 2013; Song et al., 2014). Therefore, the adequate control of DO
concentrations is a key factor, in order to avoid the accumulation of NO2- and, therefore, achieve
lower N2O emissions.

Rev. Ambient. Água vol. 13 n. 2, e2174 - Taubaté 2018
12 Renato Pereira Ribeiro et al.
Figure 7. TN distribution (%) (regarding TN in the influent) through
three different system routes: sludge waste, atmosphere (via N2 and N2O
separately) and liquid effluent for each of the four experimental
conditions. In addition, TN removal (%) and N2O/Natmosphere ratio (%)
are also displayed.
4. CONCLUSION
The effects of different operating conditions, such as variable organic loading, different
SRTs and airflow rates, limited DO concentrations and NH4+ shock loading on TN removal
routes and N2O emissions were studied in a lab-scale activated sludge system and the major
conclusions are:
● The variable organic loading did not interfere with COD removal efficiency under the
applied operating conditions. However, lower TN removal efficiencies were related to
lower TN loads.
● Short SRT (5 days) resulted in a large part of TN removal in sludge waste. As the SRT
increased from 5 to 10 days, TN removal decreased in the sludge waste and increased
via the atmospheric route.
● Low DO levels (0.5 mg L-1) were responsible for lower TKN oxidation efficiencies,
suggesting that nitrification efficiency was hampered by the oxidation of organic
matter. For DO set to 1 mg L-1, TKN oxidation rates and NO2- accumulation reached
their maxima, the best condition for both organic matter oxidation and partial
nitrification.
● Part of the N transferred to the atmosphere is attributed to N2O emissions (reaching a
maximum N2O/Natmosphere ratio of 10%), which varied from 0.3 to 5.6% of the influent
TN load.
● The presence of combined remnant NH4+ and high NO2
- concentrations due to partial
nitrification strongly triggered N2O emissions.
● Insufficient aeration and stress conditions (such as NH4+ shock loading) can cause
limited DO conditions, NO2- accumulation and, consequently, higher N2O emissions.
● The adequate control of DO concentrations is a key factor to avoid NO2- accumulation
and, consequently, high N2O emissions.

13 Effects of different operating conditions on total …
Rev. Ambient. Água vol. 13 n. 2, e2174 - Taubaté 2018
5. ACKNOWLEDGMENTS
This work was supported by Coordenação de Aperfeiçoamento de Pessoal de Nível
Superior (Capes).
6. REFERENCES
ABOOBAKAR, A.; CARTMELL, E.; STEPHENSON, T.; JONES, M.; VALE, P.; DOTRO,
G. Nitrous oxide emissions and dissolved oxygen profiling in a full-scale nitrifying
activated sludge treatment plant. Water Research, v. 47, p. 524-534, 2013.
https://doi.org/10.1016/j.watres.2012.10.004
AHN, J.O.; KIM, S.; PARK, H.; RAHM, B.; PAGILLA, K.; CHANDRAN, K. N2O emissions
from activated sludge processes, 2008-2009: results of a national monitoring survey in
the United States. Environmental Science and Technology, v. 44, p. 4505-4511, 2010.
http://dx.doi.org/10.1021/es903845y
AHN, J. H.; KWAN, T.; CHANDRAN, K. Comparison of partial and full nitrification processes
applied for treating high-strength nitrogen wastewaters: microbial ecology through
nitrous oxide production. Environmental Science and Technology, v. 45, n. 7, p. 2734-
2740, 2011. http://dx.doi.org/10.1021/es103534g
AMERICAN PUBLIC HEALTH ASSOCIATION/AMERICAN WATER WORKS
ASSOCIATION/WATER ENVIRONMENT FEDERATION. Standard Methods for
the Examination of Water and Wastewater. 22th ed. Washington DC, 2012.
BERNAT, K.; KULIKOWSKA, D.; ZIELINSKA, M.; CYDZIK-KWIATKOWSKA, A.;
WOJNOWSKA-BARYLA, I. Nitrogen removal from wastewater with a low COD/N
ratio at a low oxygen concentration. Bioresource and Technology, v. 102, n. 7, p. 4913-
4916, 2011. https://doi.org/10.1016/j.biortech.2010.12.116
BROTTO, A. C.; KLIGERMAN, D. C.; ANDRADE, S. A.; RIBEIRO, R. P.; OLIVEIRA, J.
L. M.; CHANDRAN, K.; DE MELLO, W. Z. Factors controlling nitrous oxide emissions
from a full-scale activated sludge system in the tropics. Environmental Science and
Pollution Research International, v. 22, p. 11840-11849, 2015.
https://doi.org/10.1007/s11356-015-4467-x
CRUTZEN, P. J. The role of NO and NO2 in the chemistry of the troposphere and stratosphere.
Annual Review of Earth and Planetary Sciences, v. 7, p. 443-472, 1979.
https://doi.org/10.1146/annurev.ea.07.050179.002303
DESLOOVER, J.; VLAEMINCK, S. E.; CLAUWAERT, P.; VERSTRAETE, W.; BOON, N.
Strategies to mitigate N2O emissions from biological nitrogen removal systems. Current
Opinion in Chemical Biology, v. 23, p. 474-482, 2012.
https://doi.org/10.1016/j.copbio.2011.12.030
FOLEY, J.; DE HAAS, D.; YUAN, Z.; LANT, P. Nitrous oxide generation in full-scale
biological nutrient removal wastewater treatment plants. Water Research, v. 44, p. 831-
844, 2010. https://doi.org/10.1016/j.watres.2009.10.033
HOLLER, S; TRÖSCH, W. Treatment of urban wastewater in a membrane bioreactor at high
organic loading rates. Journal of Biotechnology, v. 92, n. 2, p. 95-101, 2001.
https://doi.org/10.1016/S0168-1656(01)00351-0

Rev. Ambient. Água vol. 13 n. 2, e2174 - Taubaté 2018
14 Renato Pereira Ribeiro et al.
HU, Z.; ZHANG, J.; XIE, H.; LIANG, S.; LI, S. J. Minimization of nitrous oxide emission from
anoxic-oxic biological nitrogen removal process: effect of influent COD/NH4+ ratio and
feeding strategy. Journal of Bioscience and Bioengineering, v. 115, p. 272-278, 2013.
https://doi.org/10.1016/j.jbiosc.2012.09.016
INTERGOVERNMENTAL PANEL ON CLIMATE CHANGE - IPCC. IPCC Guidelines for
National Greenhouse Gas Inventories, v. 5. Kanagawa, 2006.
INTERGOVERNMENTAL PANEL ON CLIMATE CHANGE – IPCC. Climate Change: the
physical science basis. Cambridge: Cambridge University Press, 2013.
KAMPSCHREUR, M. J.; TEMMINK, H.; KLEEREBEZEM, R.; JETTEN, M. S. M.; VAN
LOOSDRECHT, M. C. M. Nitrous oxide emission during wastewater treatment. Water
Research, v. 43, p. 4093-4103, 2009. https://doi.org/10.1016/j.watres.2009.03.001
KELLER, J.; HARTLEY, K. Greenhouse gas production in wastewater treatment: Process
selection is the major factor. Water Science and Technology, v. 47, n. 12, p. 43-48,
2003.
LAW, Y.; YE, L.; PAN, Y.; YUAN, Z. Nitrous oxide emissions from wastewater treatment
processes. Philosophical Transactions of the Royal Society B, v. 367, n. 1593, p. 1265-
1277, 2012. http://dx.doi.org/10.1098/rstb.2011.0317
LEE, J. K.; CHOI, C. K.; LEE, K. H.; YIM, S. B. Mass balance of nitrogen, and estimates of
COD, nitrogen and phosphorus used in microbial synthesis as a function of sludge
retention time in a sequencing batch reactor system. Bioresource and Technology, v. 99,
n. 16, p. 7788-7796, 2008. https://doi.org/10.1016/j.biortech.2008.01.057
LIU, T.; LI, D.; ZENG, H.; LI, X.; ZENG, T.; CHANG, X.; CAI, Y.; ZHANG, J. Biodiversity
and quantification of functional bacteria in completely autotrophic nitrogen-removal over
nitrite (CANON) process. Bioresource and Technology, v. 118, p. 399-406, 2012.
https://doi.org/10.1016/j.biortech.2012.05.036
LU, Q.; WU, H.; LI, H.; YANG, D. Enhanced biological nutrient removal in modified carbon
source division anaerobic-anoxic-oxic process with return activated sludge pre-
concentration. Chinese Journal of Chemical Engineering, v. 23, n. 6, p. 1027-1034,
2015. https://doi.org/10.1016/j.cjche.2014.11.013
MELLO, W. Z. de; RIBEIRO, R. P.; BROTTO, A. C.; KLIGERMAN, D. C.; PICCOLI, A. S.;
OLIVEIRA, J. L. M. Nitrous oxide emission from an intermittent aeration activated
sludge system of an urban wastewater treatment plant. Química Nova, v. 36, p. 16-20,
2013. http://dx.doi.org/10.1590/S0100-40422013000100004
POLLICE, A.; TANDOI, V.; LESTINGI, C. Influence of aeration and sludge retention time on
ammonium oxidation to nitrite and nitrate. Water Research, v. 36, n. 10, p. 2541-2546,
2002. https://doi.org/10.1016/S0043-1354(01)00468-7
RASOOL, K.; AHN, D. H.; LEE, D. S. Simultaneous organic carbon and nitrogen removal in
an anoxic-oxic activated sludge system under various operating conditions. Bioresource
Technology, v. 162, p. 373-378, 2014. https://doi.org/10.1016/j.biortech.2014.03.108
RAVISHANKARA, A. R.; DANIEL, J. S.; PORTMAN, R. W. Nitrous oxide (N2O): the
dominant ozone depleting substance emitted in the 21st century. Science, v. 326, p. 123-
125, 2009. http://dx.doi.org/10.1126/science.1176985

15 Effects of different operating conditions on total …
Rev. Ambient. Água vol. 13 n. 2, e2174 - Taubaté 2018
RIBEIRO, R. P.; ALVIM, R. B.; ANDRADE, S. A.; KLIGERMAN, D. C.; DE ALMEIDA, P.
A.; OLIVEIRA, J. L. M.; et al. Controlling factors of nitrous oxide emissions from a
conventional activated sludge wastewater treatment plant. Engevista, v. 17, n. 3, p. 375-
384, 2015. https://doi.org/10.22409/engevista.v17i3.698
RODRIGUEZ-CABALLERO, A.; RIBERA, A.; BALCÁZAR, J. L.; PIJUAN, M. Nitritation
versus full nitrification of ammonium-rich wastewater: Comparison in terms of nitrous
and nitric oxides emissions. Bioresource and Technology, v. 139, p. 195-202, 2013.
https://doi.org/10.1016/j.biortech.2013.04.021
RUIZ, G.; JEISON, D.; CHAMY, R. Nitrification with high nitrite accumulation for the
treatment of wastewater with high ammonia concentration. Water Research, v. 37, n. 6,
p. 1371-1377, 2003. https://doi.org/10.1016/S0043-1354(02)00475-X
SONG, K.; SUENAGA, T.; HAMAMOTO, A.; SATOU, K.; RIYA, S.; HOSOMI, M. et al.
Abundance, transcription levels and phylogeny of bacteria capable of nitrous oxide
reduction in a municipal wastewater treatment plant. Journal of Bioscience and
Bioengineering, v. 118, n. 3, p. 289-297, 2014.
https://doi.org/10.1016/j.jbiosc.2014.02.028
TOOR, U. A.; HAN, D. W.; KIM, D. J. Effect of organics on nitrous oxide emission during
wastewater nitrification with enriched nitrifiers. International Biodeterioration and
Biodegradation, v. 102, p. 94-99, 2015. https://doi.org/10.1016/j.ibiod.2015.03.011
VAIOPOULOU, E.; MELIDIS, P.; AIVASIDIS, A. An activated sludge treatment plant for
integrated removal of carbon, nitrogen and phosphorus. Desalination, v. 211, n. 1-3, p.
192-199, 2007. https://doi.org/10.1016/j.desal.2006.02.092
XIANG, H.; LI, X.; HOJAE, S.; SHANFA, Z.; YANG, D. Biological nutrient removal in a full-
scale anoxic/anaerobic/aerobic/pre-anoxic-MBR plant for low C/N ratio municipal
wastewater treatment. Chinese Journal of Chemical Engineering, v. 22, n. 4, p. 447-
454, 2014. https://doi.org/10.1016/S1004-9541(14)60064-1
WEI, D.; SHI, L.; ZHANG, G.; WANG, Y.; SHI, S.; WEI, Q. et al. Comparison of nitrous
oxide emissions in partial nitrifying and full nitrifying granular sludge reactors treating
ammonium-rich wastewater. Bioresource Technology, v. 171, p. 487-490, 2014.
https://doi.org/10.1016/j.biortech.2014.08.071
WRAGE, N.; VELTHOF, G. L.; VAN BEUSICHEM, M. L.; OENEMA, O. Role of nitrifier
denitrification in the production of nitrous oxide. Soil Biology and Biochemistry, v. 33,
n. 12-13, p. 1723-1732, 2001. https://doi.org/10.1016/S0038-0717(01)00096-7
WUNDERLIN, P.; MOHN, J.; JOSS, A.; EMMENEGGER, L.; SIEGRIST, H. Mechanisms of
N2O production in biological wastewater treatment under nitrifying and denitrifying
conditions. Water Research, v. 46, n. 4, p. 1027-1037, 2012.
https://doi.org/10.1016/j.watres.2011.11.080
ZHANG, J.; ZHOU, J.; HAN, Y.; ZHANG, X. Start-up and bacterial communities of single-
stage nitrogen removal using anammox and partial nitritation (SNAP) for treatment of
high strength ammonia wastewater. Bioresource and Technology, v. 169, p. 652-657,
2014. https://doi.org/10.1016/j.biortech.2014.07.042

Ambiente & Água - An Interdisciplinary Journal of Applied Science
ISSN 1980-993X – doi:10.4136/1980-993X
www.ambi-agua.net
E-mail: [email protected]
This is an Open Access article distributed under the terms of the Creative Commons
Attribution License, which permits unrestricted use, distribution, and reproduction in any
medium, provided the original work is properly cited.
Use of agricultural and agroindustrial residues as alternative
adsorbents of manganese and iron in aqueous solution
ARTICLES doi:10.4136/ambi-agua.2181
Received: 13 Sep. 2017; Accepted: 17 Jan. 2018
Fernanda Lansa Furlan1; Nelson Consolin Filho2*;
Marcilene Ferrari Barriquello Consolin2; Morgana Suzsek Gonçalves3;
Patrícia Valderrama2; Aziza Kamal Genena1
1Universidade Tecnológica Federal do Paraná (UTFPR), Medianeira, PR, Brasil
Programa de Pós-Graduação em Tecnologia de Alimentos. E-mail: [email protected],
[email protected] 2Universidade Tecnológica Federal do Paraná (UTFPR), Campo Mourão, PR, Brasil
Departamento de Química. E-mail: [email protected], [email protected], [email protected] 3Universidade Tecnológica Federal do Paraná (UTFPR), Campo Mourão, PR, Brasil
Departamento de Engenharia Ambiental. E-mail: [email protected] *Corresponding author
ABSTRACT The increase in the volume of agricultural and agroindustrial waste, associated with
improper disposal, is a growing worldwide problem. The recovery of those residues is of crucial
importance, since it reduces environmental impacts, protects public health, and allows the
addition of value to the materials. One of the ways of exploiting adsorbents is related to the
capacity of some wastes to be used as alternative adsorbents in the efficient removal of
microcontaminants in aqueous systems. This work assessed the use of agricultural and
agroindustrial residues: maize straw, wheat straw, soybean straw and soybean hulls for the
production of alternative adsorbents to remove iron (Fe) and manganese (Mn) in water. For
each residue investigated, two different polymers were obtained for use as adsorbents, a natural
polymer (cellulose/lignin) and an EDTA-modified polymer (ethylenediaminetetraacetic acid).
The adsorbents were characterized through FTIR (Fourier transform infrared spectroscopy) and
nitrogen content. To evaluate the efficiency of the adsorbents, kinetic tests in batch mode and
determination of Lagergren pseudo-first and pseudo-second order kinetic constants were
performed. The results found that the modified polymer obtained from soybean hulls (SHE)
showed increased Fe (96%) and Mn (88%) removal rate, in which the pseudo-second order
kinetic model presented closer results between the experimental adsorption rates and the
calculated ones for the two microcontaminants under study. In general, the modified soybean
hulls proved to be a promising alternative adsorbent for the removal of iron and manganese in
water treatment.
Keywords: adsorption, agribusiness, microcontaminants, waste recovery.

Rev. Ambient. Água vol. 13 n. 2, e2181 - Taubaté 2018
2 Nelson Consolin Filho et al.
Uso de Resíduos Agrícolas e Agroindustriais como Adsorventes
Alternativos de manganês e ferro em Sistema Aquoso
RESUMO O aumento do volume de resíduos agrícolas e agroindustriais gerados, acompanhados do
descarte inadequado dos mesmos é um problema mundial crescente. O aproveitamento desses
resíduos é de extrema importância, já que resulta na redução de impactos ambientais,
preservação da saúde da população, e permite agregar valor à esses materiais. Uma das formas
de aproveitamento está relacionada à capacidade de alguns resíduos serem utilizados como
adsorventes alternativos na remoção eficiente de micro-contaminantes em sistemas aquosos.
Este trabalho teve como objetivo investigar o uso dos resíduos agrícolas e agroindustriais: palha
de milho, palha de trigo, palha de soja e casca de soja para produção de adsorventes alternativos
para remoção de ferro (Fe) e manganês (Mn) em água. Para cada resíduo investigado, dois
diferentes polímeros foram obtidos para uso como adsorventes, um polímero natural
(celulose/lignina) e um polímero modificado com EDTA (ácido etilenodiaminotetraacético).
Os adsorventes foram caracterizados por FTIR (espectroscopia de infravermelho por
transformada de Fourier) e teor de nitrogênio. Para a avaliação da eficiência dos adsorventes
foram realizados testes cinéticos, em regime batelada, e determinação das constantes cinéticas
de pseudo-primeira e pseudo-segunda ordem de Lagergren. Os resultados obtidos indicaram
que o polímero modificado obtido da casca de soja apresentou maior remoção de Fe (96%) e
Mn (88%), em que o modelo cinético de pseudo-segunda ordem apresentou resultados mais
aproximados entre os valores de quantidade adsorvida experimentais e os calculados para os
dois micro-contaminantes em estudo. De modo geral, a casca de soja modificada mostrou ser
um adsorvente alternativo promissor para a remoção de ferro e manganês no tratamento de
águas.
Palavras-chave: adsorção, agroindústria, aproveitamento de resíduos, micro-contaminantes.
1. INTRODUCTION
Water is a basic necessity worldwide and is of immeasurable environmental importance
since it is the primitive requirement for human life (Bushra et al., 2017, Carolin et al., 2017).
Inorganic and organic chemicals are major life-threatening factors of water pollution (Sharma
et al., 2017). Metal ion pollution is a most concerning topic of investigation in the present era
due to its alarming rate of increase (Naushad et al., 2016). Domestic and industrial wastewaters
containing metal ions are increasingly discharged into the environment and these metal ions are
of significant importance as they are not biodegradable and cannot be metabolized by the
environment but tend to accumulate in living organisms, causing various diseases and disorders
(Hasanzadeh et al., 2017). Most of the metals are carcinogenic and/or pose severe health
problems, such as organ damage, reduced growth and development, oxidative stress, and
nervous system impairments (Naushad et al., 2015).
The presence of micro contaminant compounds in groundwater, and eventually in drinking
water, is a serious environmental problem which poses a substantial risk to local resource users
and to the natural environment (Adekola et al., 2016). For example, iron overload in animal
models and humans increases oxidative stress and induces cardiomyopathy that may contribute
to increased cardiovascular risk (Marques et al., 2015). Manganese (Mn) might be toxic at
excess exposure. Elevated concentrations of Mn in drinking water were associated with
impaired child development and indicated an adverse effect on birth length in pregnant women
(Rahman et al., 2015). In order to get safe drinking water, excessive iron and manganese must
be removed (Rangreez et al., 2017).

3 Use of agricultural and agroindustrial residues …
Rev. Ambient. Água vol. 13 n. 2, e2181 - Taubaté 2018
The removal of toxic metals from water and wastewater has been achieved by several
processes such as coagulation, electrochemical treatment, ion exchange, membrane separation,
chemical precipitation and adsorption (Alqadami et al., 2016, Naushad et al., 2017, Reiad et al.,
2012). In the last decade, the adsorption technique has been widely used for the removal of
toxic metal from aqueous mediums (Ahamad et al., 2017) and has become one of the most
preferred methods due to its high efficiency and low operational cost, making it a cost-effective
method (Al-Othman et al., 2012). Furthermore, based on the regeneration, since adsorbents can
be recreated by the desorption process, adsorption is also considered an environmentally
acceptable method.
The selection of suitable precursors for the adsorption of metal ions from aqueous solutions
is very important (Alqadami et al., 2017). The biosorption process using agricultural
waste/plant material is an eco-friendly and easy method. Rapid industrialization associated with
the population growth and intensive agricultural activities has prompted an increase in the
amount and variety of agricultural and agroindustrial wastes produced (Asim et al., 2015). Most
agricultural waste consists of three main structural components: lignin, cellulose and
hemicellulose. These compounds possess adsorptive sites, such as ether, carbonyl, carboxyl,
amine and hydroxyl groups, capable of absorbing metal species through ion exchange or
complexation processes (Salleh et al., 2011).
Many agricultural wastes have directly or indirectly been used as sorbents for metal
adsorption from water and wastewater which included rice husk, sunflower, potato, canola and
walnut shell residues (Feizi and Jalili, 2015), peanut shell and orange peel (Surovka and Pertile,
2017).
In the light of the above, the present study investigated the use of agricultural and
agroindustrial maize, soybean and wheat residues for producing alternative adsorbents, and
their application in the removal of iron and manganese from aqueous solution.
2. MATERIALS AND METHODS
2.1. Agricultural and Agroindustrial Waste
Maize straw (MS), wheat straw (WT) and soybean straw (SS) soil residues were collected
directly in the field after the harvest of the crops, respectively, in rural properties located in
Campo Mourão, State of Paraná, Brazil and Peabiru, State of Paraná, Brazil, which use the no-
tillage technique. Agroindustrial soybean hulls (SH) residues were provided by the COAMO –
Agroindustrial Cooperativa warehouse located in the city of Araruna, PR, Brazil.
2.2. Preparation of Adsorbents
From each agricultural and agroindustrial residue, hemicelluloses were extracted to obtain
a polymer composed of cellulose and lignin, known as a natural adsorbent of maize straw (MS),
wheat straw (WT), soybean straw (SS) and soybean hull (SH). The stages of preparation and
getting of e natural adsorbents followed the methodology described by Schafhauser et al.
(2015).
For each residue, preparation of the adsorbent consisted of drying at 60oC in an oven for
24 h, grinding with a cutting mill and screening (10 mesh).
Subsequently, for hemicellulose removal, 30 g of the sample were weighed on an analytical
balance and the extraction was carried out following an eluotropic series of solvents
(n-hexane/alcohol/water) in Soxhlet-type extractors with a hot plate. After extraction using each
solvent of the series, the residues were dried in an oven at 60°C for 24 h, weighed and returned
to the Soxhlet system for further extraction with the other solvents. After extraction with water,

Rev. Ambient. Água vol. 13 n. 2, e2181 - Taubaté 2018
4 Nelson Consolin Filho et al.
the material was dried and weighed and the hemicellulose-free natural polymer composed of
cellulose and lignin, i.e., the natural adsorbent, was obtained.
Part of this product (natural adsorbent) was put aside and the other part was modified with
EDTA (ethylenediaminetetraacetic acid) to obtain a modified polymer called modified maize
straw (MSE), wheat straw (WTE), soybean straw (SSE) and soybean hulls (SHE) adsorbent,
obtained from the natural adsorbent.
The introduction of EDTA into the cellulose fibers of the adsorbents was carried out in a
50 mL round-bottomed flask fitted with a ball condenser. Each flask contained 5 g of natural
adsorbent, 15 g of disodium salt EDTA and 210 mL of DMF (dimethylformamide). The mixture
was stirred and heated on a magnetic stirrer with a heating plate at 75°C for 24 h and then
vacuum-filtered on a sintered plate funnel with porosity of 40-60 μm. The material trapped on
the filter was subjected to sequential washing with solvents and then dried at 75°C for 24 h on
a drying oven until constant mass, in order to obtain EDTA-modified natural polymer (Pereira
et al., 2010).
2.3. Characterization of Adsorbents
In order to characterize the adsorbents, they were weighed in an analytical balance,
followed by a FTIR analysis (Fourier transform infrared spectroscopy) and total nitrogen
determination.
For the FTIR analysis performed on a FTIR (IRAffinity-1S, Shimadzu) spectrometer, the
pellets were prepared using 1 mg of adsorbent and 100mg of spectroscopic grade KBr. The
spectra were collected over the 4000 to 400 cm-1 wavenumber range at a resolution of 4 cm-1
and 32 scans.
The determination of total nitrogen was carried out using the Kjeldahl method.
The analyses of the elements C, H, N and O for SHE and SS were carried using an
elemental analyzer Eurovector EA 3000-S.
2.4. Kinetic Study
Kinetic tests of Fe or Mn adsorption in aqueous solution, in batch mode, were performed
for each of adsorbent obtained. For each test, 20 mL of metal (Fe or Mn) standard solution
(1g.L-1), 1980 mL of distilled water and 3 drops of nitric acid were added to 4 g of adsorbent,
resulting in a solution of 10 mg.L-1 for metal species and a concentration of 2 mg.mL-1 of
adsorbent material in solution. The solution was continuously stirred at 160 rpm, and kept at
25°C and pH of 6.8. The adsorption time ranged from 0 to 180 min, in which 20 mL-aliquots
were collected at predetermined intervals, followed by sample filtration in a sintered glass filter
and the analysis of the Fe or Mn concentration through atomic absorption spectrophotometry,
using an Analytik Jena NOVAA300 spectrophotometer.
The amount of Fe and Mn adsorbed (q), in mg.g-1, was calculated by Equation 1:
𝐪 =(𝐂0−𝐂𝐞)𝐕
𝐦 (1)
in which C0 and Ce correspond to the initial concentration of the micro-contaminant and
the equilibrium concentration (mg.L-1), respectively; V is the volume of solution (L) and m is
the amount of adsorbent used (g).
The adsorption efficiency of Fe and Mn from the aqueous solution was calculated by
Equation 2:
%𝐀𝐝𝐬𝐨𝐫𝐛𝐞𝐝 =𝐂0−𝐂𝐞
𝐂0× 100 (2)

5 Use of agricultural and agroindustrial residues …
Rev. Ambient. Água vol. 13 n. 2, e2181 - Taubaté 2018
The results of the kinetic tests were fitted to Lagergren pseudo-first and pseudo-second
order kinetic models (Equation 3 and 4):
𝐥𝐨𝐠(𝐪𝐞 − 𝐪𝐭) = 𝐥𝐨𝐠 𝐪𝐞 −𝐤1
2,303𝐭 (3)
𝐭
𝐪𝐭=
1
𝐤2𝐪𝐞2 +
𝐭
𝐪𝐞 (4)
in which qe and qt are the adsorbed quantities (mg.g-1) at equilibrium and time t,
respectively; k1 is the pseudo-first order adsorption constant (min-1) and k2 is the pseudo-second
order adsorption constant (g.mg-1.min-1).
3. RESULTS AND DISCUSSION
3.1. Collection of Adsorbents
Table 1 shows the quantity and the respective percentage of extracts (hemicelluloses)
removed in each extraction step using the eluotropic series of different solvents for each waste
assessed.
Table 1. Waste weight before and after extractions using the eluotropic and total percentage rate of extractives
removed.
Waste Initial weight
(g)
Weight after extraction (g)
Final weight
(g)
Percentage of
Removed
Extracts (%)
Extraction solvent
N-Hexane Ethanol Water
MS 30.00 28.35 25.75 20.95 9.05 30.17
WT 30.00 28.00 26.15 21.00 9.00 30.00
SS 30.00 28.13 25.74 20.35 9.65 32.17
SH 30.00 26.00 24.10 19.25 10.75 35.83
The process of removing extractives from the adsorbent material is an extremely important
step when one aims at performing adsorption in aqueous solution, since hemicellulose, which
is the most soluble constituent among lignocellulosic biomass materials, must be completely
removed from the medium in order to prevent its solubilization and, consequently, the
complexation of microcontaminants and the impairment of the final adsorption result. This
process also avoids fungal and bacterial attack, increasing the useful life of adsorbent materials.
At the end of the process, all agricultural byproducts showed a reduction in total weight,
demonstrating their efficiency in the extraction process. The biggest extraction occurred with
SS (35.83%).
Similar results were reported by Schafhauser et al. (2015) in extractions using the same
solvents, in the same order, in maize straw. The authors observed that, at the end of the process,
the total percentage of extractives removed was 30.15%.
In order to obtain modified adsorbents, part of the natural adsorbents (MS, WT, SS, SH)
were subjected to chemical modification with EDTA, followed by filtration, washing and
drying. After those steps, the weight gain of modified adsorbents (MSE, WTE, SSE, SHE) was
assessed to verify the EDTA’s inclusion in the adsorbent materials: 10.75% for MSE, 11.00%
for WTE, 8.80% for SSE and 33.00% for SHE.
Weight gain was observed in the four types of adsorbent materials after modifications with
EDTA, confirming the introduction of this chelating agent into the structures of the
lignocellulosic fibers forming straws and hulls.

Rev. Ambient. Água vol. 13 n. 2, e2181 - Taubaté 2018
6 Nelson Consolin Filho et al.
EDTA is a biodegradable and active agent containing two anhydride groups per molecule
that can be used to introduce chelating abilities to the lignocellulosic materials through
esterification reaction. This reaction allows introducing carboxylic and amine functional
groups that present high ability to form stable complexes with heavy metal ions (Pereira et al.,
2010). Therefore, the weight gain observed in modified adsorbent materials confirms that the
carboxylate functions have been released and the amine functions have been conveyed into
them.
3.2. Fourier Transform Infrared Spectroscopy
IR spectra for natural and modified adsorbents obtained are shown in Figures 1 (a) and (b),
respectively. A comparison between the spectra revealed an increase and the appearance of
strong bands in EDTA-modified straws and hulls at 1743-1747 cm-1, which can be attributed to
the axial deformation C = O of ester, at 1633 cm-1 due to the asymmetric axial deformation of
the carboxylate, and at 1402-1408 cm-1 due to the symmetrical axial deformation of the
carboxylate. This finding evidences the incorporation of two types of carbonyls, ester and
carboxylate, and also confirms the introduction of EDTA into the modified adsorbents.
Figure 1. IR spectra for natural adsorbents (SH, SS, WT and MS) and modified adsorbents
(SHE, SSE, WTE and MSE).
The results obtained in the present study are consistent with those reported by Pereira et
al. (2010), who characterized through FTIR wood sawdust, EDTA-modified wood sawdust
(SE), sugarcane bagasse (B) and EDTA-modified sugarcane bagasse (BE). When comparing
the spectra of the modified materials with those of the starting materials, they observed the
appearance of strong bands at 1742 cm-1 for SE and at 1741 cm-1 for BE, which correspond to
stretching ester vibration. They also observed the presence of strong bands at 1634 cm-1,
1596 cm-1 and 1403 cm-1 for SE and at 1633 cm-1, 1602 cm-1 and 1406 cm-1 for BE, related to
asymmetric and symmetrical stretch of the carboxylate ion, respectively. These bands indicate
that EDTA was introduced via ester linkages accompanied by a release of carboxylic functional
groups.
Gusmão et al. (2013) studied the adsorption of methylene blue (MB) and gentian violet
(GV) in aqueous solution with unmodified sugarcane bagasse (B) and sugarcane bagasse
modified with EDTA dianhydride (EB). When comparing the infrared spectra of EB with the
unmodified bagasse spectrum, they observed the appearance of strong bands at 1741 cm-1,
which can be attributed to the axial deformation of the ester bond (–O–C O), and bands at
1633 and 1406 cm-1, which are probably due to axially asymmetric and symmetrical
deformations of carboxylate (-COO-). These bands confirmed the introduction of EDTA

7 Use of agricultural and agroindustrial residues …
Rev. Ambient. Água vol. 13 n. 2, e2181 - Taubaté 2018
dianhydride through the formation of ester bonds with the subsequent release of carboxylate
functions.
3.3. Determination of Total Nitrogen
Data related to nitrogen analysis are presented in Table 2. A considerable increase in the
nitrogen content after chemical modification with EDTA is observed. This finding also helps
to confirm the introduction of EDTA in the materials through the incorporation of nitrogen in
the modified adsorbents (WTE, MSE, SSE and SHE).
Table 2. Nitrogen content (%)
of natural and modified
adsorbents.
Adsorbents Nitrogen (%)
WT 0.16
WTE 0.87
SS 0.16
SSE 2.46
MS 0.07
MSE 0.78
SH 1.36
SHE 3.75
Similar results were reported by Pereira et al. (2010) and Gusmão et al. (2013) with
dianhydride of EDTA (EDTAD) modifications in sugarcane bagasse in the adsorption
processes in aqueous solution. Both researchers verified that the nitrogen rate of sugarcane
bagasse before EDTAD modification was 0.13% and after modification was 2.32%. They
explain that this fact occurred due to the incorporation of amine functions in the bagasse after
esterification of hydroxyl, proving the introduction of EDTAD into it.
3.4. Kinetics of Fe and Mn Adsorption
The kinetic curve of manganese (Figure 2a and 2b) showed that the optimum adsorption
time was approximately 15 min for SHE and 60 min for WT, SS, SH, MSE, WTE and SSE. In
relation to the natural adsorbent of maize straw (MS), equilibrium was not reached up to 180
min.
Overall, natural adsorbents showed reduced efficiency in the removal of manganese
(Figure 2a). The maximum adsorbed amount was 16% for MS, 19% for WT, 13% for SS and
6% for SH.
Among modified adsorbents, the amounts of manganese removed were higher than that
observed with natural adsorbents, except for the MSE, which showed a removal rate below 5%.
The maximum removal was achieved using the modified soybean hulls adsorbent (SHE), with
88%.
Tavlieva et al. (2015) used rice husk ash to remove Mn ions in aqueous solutions. The
results showed that the Mn removal rate was 26.62%, much lower than that obtained in the
present study with modified soybean hulls (SHH).
Regarding the kinetic tests for iron removal with the natural adsorbents, the kinetic curve
(Figure 2c) shows that the optimum adsorption time was approximately 30 min for MS and
WT, 60 min for SS and 180 min for SH. The maximum iron removal level achieved with natural
adsorbents was 78%, using soybean hulls (SH).

Rev. Ambient. Água vol. 13 n. 2, e2181 - Taubaté 2018
8 Nelson Consolin Filho et al.
Figure 2. Adsorption kinetics of manganese and iron by the following materials (a) MS,
WT, SS and SH and (b) MSE, WTE, SSE and SHE.
Tavlieva et al. (2015) used rice husk ash to remove Mn ions in aqueous solutions. The
results showed that the Mn removal rate was 26.62%, much lower than that obtained in the
present study with modified soybean hulls (SHH).
Regarding the kinetic tests for iron removal with the natural adsorbents, the kinetic curve
(Figure 2c) shows that the optimum adsorption time was approximately 30 min for MS and
WT, 60 min for SS and 180 min for SH. The maximum iron removal level achieved with natural
adsorbents was 78%, using soybean hulls (SH).
The adsorption of Fe with modified adsorbents (Figure 2d) revealed that the time required
for the system to balance is approximately 15 min for MSE, WTE and SHE. There was no
equilibrium for SSE up to 180 min.
It was also observed that the modified adsorption systems were more efficient in the
removal of iron in comparison with the natural ones, reaching values 77% for MSE, 93% for
SSE, 85% for WTE and 96% for SHE.
Considering only the modified soybean adsorbent (SHE), which showed the best results in
Fe and Mn adsorption, the pseudo-second order kinetic model evidenced results that more
closely match the experimental and calculated qe values (Table 3), with higher coefficients of
determination (R2) in comparison with the pseudo-first order kinetic model, describing better
the adsorption process.
1
2
1 (a) (b) 2
0 20 40 60 80 100 120 140 160 180 200
-2
0
2
4
6
8
10
12
14
16
18
20%
Ad
so
rbe
d
Time (min.)
MS/Mn
WT/Mn
SS/Mn
SH/Mn
0 20 40 60 80 100 120 140 160 180 200
0
5
10
15
20
25
30
35
40
45
50
55
60
65
70
75
80
85
90
% A
dso
rbe
d
Time (min.)
MSE/Mn
WTE/Mn
SSE/Mn
SHE/Mn
1 (c) (d) 2
0 20 40 60 80 100 120 140 160 180 200
15
20
25
30
35
40
45
50
55
60
65
70
75
80
85
% A
dso
rbe
d
Time (min.)
MS/Fe
WT/Fe
SS/Fe
SH/Fe
0 20 40 60 80 100 120 140 160 180 200
70
75
80
85
90
95
100
% A
dso
rbe
d
Time (min.)
MSE/Fe
WTE/Fe
SSE/Fe
SHE/Fe
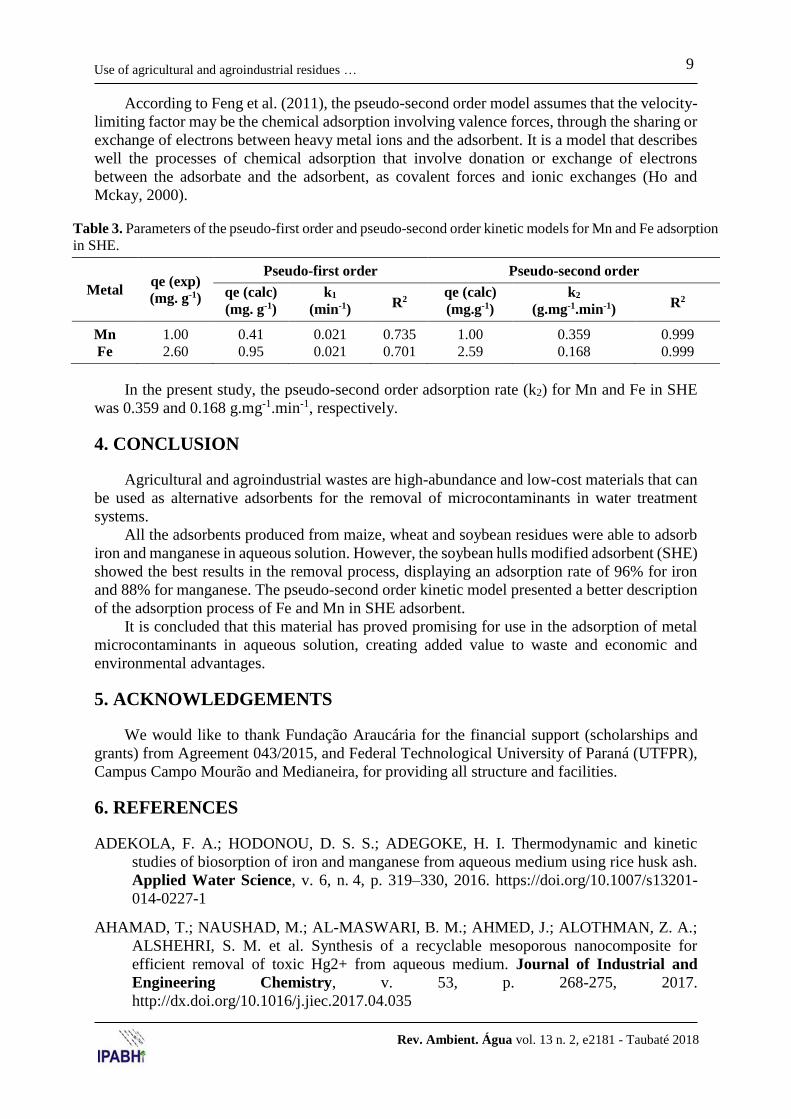
9 Use of agricultural and agroindustrial residues …
Rev. Ambient. Água vol. 13 n. 2, e2181 - Taubaté 2018
According to Feng et al. (2011), the pseudo-second order model assumes that the velocity-
limiting factor may be the chemical adsorption involving valence forces, through the sharing or
exchange of electrons between heavy metal ions and the adsorbent. It is a model that describes
well the processes of chemical adsorption that involve donation or exchange of electrons
between the adsorbate and the adsorbent, as covalent forces and ionic exchanges (Ho and
Mckay, 2000).
Table 3. Parameters of the pseudo-first order and pseudo-second order kinetic models for Mn and Fe adsorption
in SHE.
Metal qe (exp)
(mg. g-1)
Pseudo-first order Pseudo-second order
qe (calc)
(mg. g-1)
k1
(min-1) R2 qe (calc)
(mg.g-1)
k2
(g.mg-1.min-1) R2
Mn 1.00 0.41 0.021 0.735 1.00 0.359 0.999
Fe 2.60 0.95 0.021 0.701 2.59 0.168 0.999
In the present study, the pseudo-second order adsorption rate (k2) for Mn and Fe in SHE
was 0.359 and 0.168 g.mg-1.min-1, respectively.
4. CONCLUSION
Agricultural and agroindustrial wastes are high-abundance and low-cost materials that can
be used as alternative adsorbents for the removal of microcontaminants in water treatment
systems.
All the adsorbents produced from maize, wheat and soybean residues were able to adsorb
iron and manganese in aqueous solution. However, the soybean hulls modified adsorbent (SHE)
showed the best results in the removal process, displaying an adsorption rate of 96% for iron
and 88% for manganese. The pseudo-second order kinetic model presented a better description
of the adsorption process of Fe and Mn in SHE adsorbent.
It is concluded that this material has proved promising for use in the adsorption of metal
microcontaminants in aqueous solution, creating added value to waste and economic and
environmental advantages.
5. ACKNOWLEDGEMENTS
We would like to thank Fundação Araucária for the financial support (scholarships and
grants) from Agreement 043/2015, and Federal Technological University of Paraná (UTFPR),
Campus Campo Mourão and Medianeira, for providing all structure and facilities.
6. REFERENCES
ADEKOLA, F. A.; HODONOU, D. S. S.; ADEGOKE, H. I. Thermodynamic and kinetic
studies of biosorption of iron and manganese from aqueous medium using rice husk ash.
Applied Water Science, v. 6, n. 4, p. 319–330, 2016. https://doi.org/10.1007/s13201-
014-0227-1
AHAMAD, T.; NAUSHAD, M.; AL-MASWARI, B. M.; AHMED, J.; ALOTHMAN, Z. A.;
ALSHEHRI, S. M. et al. Synthesis of a recyclable mesoporous nanocomposite for
efficient removal of toxic Hg2+ from aqueous medium. Journal of Industrial and
Engineering Chemistry, v. 53, p. 268-275, 2017.
http://dx.doi.org/10.1016/j.jiec.2017.04.035

Rev. Ambient. Água vol. 13 n. 2, e2181 - Taubaté 2018
10 Nelson Consolin Filho et al.
AL-OTHMAN, Z. A.; ALI, R.; NAUSHAD, M. Hexavalent chromium removal from aqueous
medium by activated carbon prepared from peanut shell: Adsorption kinetics, equilibrium
and thermodynamic studies. Chemical Engineering Journal, v. 184, p. 238-247, 2012.
http://dx.doi.org/10.1016/j.cej.2012.01.048
ALQADAMI, A. A.; NAUSHAD, M.; ABDALLA, M. A.; AHAMAD, T.; ABDULLAH
ALOTHMAN, Z. et al. Synthesis and characterization of Fe3O4 @TSC nanocomposite:
highly efficient removal of toxic metal ions from aqueous medium. RSC Advances, v. 6,
n. 27, p. 22679-22689, 2016.
ALQADAMI, A. A.; NAUSHAD, M.; ABDALLA, M. A.; AHAMAD, T.; ABDULLAH
ALOTHMAN, Z. et al. Efficient removal of toxic metal ions from wastewater using a
recyclable nanocomposite: A study of adsorption parameters and interaction mechanism.
Journal of Cleaner Production, v. 156, p. 426-436, 2017.
http://dx.doi.org/10.1016/j.jclepro.2017.04.085
ASIM, N.; EMDADI, Z.; MOHAMMAD, M.; YARMO, M. A.; SOPIAN, K. Agricultural solid
wastes for green desiccant applications: an overview of research achievements,
opportunities and perspectives. Journal of Cleaner Production, v. 91, p. 26-35, 2015.
https://doi.org/10.1016/j.jclepro.2014.12.015
BUSHRA, R.; NAUSHAD, M.; SHARMA, G.; AZAM, A.; ALOTHMAN, Z. A. Synthesis of
polyaniline based composite material and its analytical applications for the removal of
highly toxic Hg2+ metal ion: Antibacterial activity against E. coli. Korean Journal of
Chemical Engineering, v. 34, n. 7, p. 1970-1979, 2017. https://doi.org/10.1007/s11814-
017-0076-3
CAROLIN, C. F.; KUMAR, P. S.; SARAVANAN, A.; JOSHIBA, G. J.; NAUSHAD, M.
Efficient techniques for the removal of toxic heavy metals from aquatic environment: A
review. Journal of Environmental Chemical Engineering, v. 5, n. 3, p. 2782-2799,
2017. http://dx.doi.org/10.1016/j.jece.2017.05.029
FEIZI, M.; JALILI, M. Removal of heavy metals from aqueous solutions using sunflower,
potato, canola and walnut shell residues. Journal of the Taiwan Institute of Chemical
Engineers, v. 54, p. 125-136, 2015. https://doi.org/10.1016/j.jtice.2015.03.027
FENG, N.; GUO, X.; LIANG, S.; ZHU, Y.; LIU, J.; Biosorption of heavy metals from aqueous
solutions by chemically modified orange peel. Journal of Hazardous Materials, v. 185,
p. 49-54, 2011. https://doi.org/10.1016/j.jhazmat.2010.08.114
GUSMÃO, G. A. K.; GURGEL, A. V. L.; MELO, S. M. T.; GIL, F. L. Adsorption studies of
methylene blue and gentian violet on sugarcane bagasse modified with EDTA
dianhydride (EDTAD) in aqueous solutions: Kinetic and equilibrium aspects. Journal of
Environmental Management, v. 118, p. 135-143, 2013.
http://doi.org/10.1016/j.jenvman.2013.01.017
HASANZADEH, R.; MOGHADAM, P. N.; BAHRI-LALEH, N.; SILLANPÄÄ, M. Effective
removal of toxic metal ions from aqueous solutions: 2- Bifunctional magnetic
nanocomposite base on novel reactive PGMAMAn copolymer@Fe3O4 nanoparticles.
Journal of Colloid and Interface Science, v. 490, p. 727-746, 2017.
http://dx.doi.org/10.1016/j.jcis.2016.11.098
HO, Y. S.; MCKAY, G. The kinetics of sorption of divalent metal ions onto sphagnum moss
peat. Water Research, v. 34, p. 735-742, 2000. https://doi.org/10.1016/S0043-
1354(99)00232-8

11 Use of agricultural and agroindustrial residues …
Rev. Ambient. Água vol. 13 n. 2, e2181 - Taubaté 2018
MARQUES, V. B.; NASCIMENTO, T. B.; RIBEIRO, R. F.; BROSEGHINI-FILHO, G. B.;
ROSSI, E. M.; GRACELI, J. B. et al. Chronic iron overload in rats increases vascular
reactivity by increasing oxidative stress and reducing nitric oxide bioavailability. Life
Sciences, v. 143, p. 89-97, 2015. http://dx.doi.org/10.1016/j.lfs.2015.10.034
NAUSHAD, M.; AHAMAD, T.; AL-MASWARI, B. M.; ALQADAMI, A. A.; ALSHEHRI,
S. M. Nickel ferrite bearing nitrogen-doped mesoporous carbon as efficient adsorbent for
the removal of highly toxic metal ion from aqueous medium. Chemical Engineering
Journal, v. l330, p.1351-1360, 2017. http://dx.doi.org/10.1016/j.cej.2017.08.079
NAUSHAD, M.; AHAMAD, T.; SHARMA, G.; AL-MUHTASEB, A. H.; ALBADARIN, A.
B.; ALAM, M. M. et al. Synthesis and characterization of a new starch/SnO2
nanocomposite for efficient adsorption of toxic Hg2+ metal ion. Chemical Engineering
Journal, v. 300, p. 306-316, 2016. http://dx.doi.org/10.1016/j.cej.2016.04.084
NAUSHAD, M.; ALOTHMAN, Z.; SHARMA, G.; INAMUDDIN, G. Kinetics, isotherm and
thermodynamic investigations for the adsorption of Co(II) ion onto crystal violet
modified amberlite IR-120 resin. Ionics, v. 21, n. 5, p.1453-1459, 2015.
http://doi.org/10.1007/s11581-014-1292-z
PEREIRA, V. F.; GURGEL, A. V. L.; GIL, F. L. Removal of Zn2+ from aqueous single metal
solutions and electroplating wastewater with wood sawdust and sugarcane bagasse
modified with EDTA dianhydride (EDTAD). Journal of Hazardous Materials, v. 176,
p. 856-863, 2010. http://doi.org/10.1016/j.jhazmat.2009.11.115
RAHMAN, S. M.; KIPPLER, M.; AHMED, S.; PALM, B.; ARIFEEN, S. E.; VAHTER, M.
Manganese exposure through drinking water during pregnancy and size at birth: A
prospective cohort study. Reproductive Toxicology, v. 53, p. 68-74. 2015.
https://doi.org/10.1016/j.reprotox.2015.03.008
RANGREEZ, T. A.; INAMUDDIN, A. A. K.; ASIRI, A. M.; ALHOGBI, B. G.; NAUSHAD,
M. Synthesis and Ion-Exchange Properties of Graphene Th(IV) Phosphate Composite
Cation Exchanger: Its Applications in the Selective Separation of Lead Metal Ions.
International Journal of Environmental Research and Public Health, v. 14, n. 7, p.
828, 2017. https://doi.org/10.3390/ijerph14070828
REIAD, N. A.; SALAM, O. E. A.; ABADIR, E. F.; HARRAZ, F. A. Adsorptive removal of
iron and manganese ions from aqueous solutions with microporous chitosan/polyethylene
glycol blend membrane. Journal of Environmental Sciences, v. 24, n. 8, p. 1425-1432,
2012. https://doi.org/10.1016/S1001-0742(11)60954-6
SALLEH, M. A. M.; MAHMOUD, D. K.; ABDUL KARIM, W. A. W.; IDRIS, A. Cationic
and anionic dye adsorption by agricultural solid wastes: A comprehensive review.
Desalination, v. 280, p. 1-13, 2011. http://doi.org/10.1016/j.desal.2011.07.019
SCHAFHAUSER, H. B.; GONÇALVES, R. T.; CONSOLIN, F. B. M.; ALMEIDA, C. V.;
PINEDA, A. G. E.; CONSOLIN-FILHO, N. Estudo da adsorção de chumbo II em lignina
modificada a partir do resíduo do milho. Revista Brasileira de Pesquisa em Alimentos,
v. 6, p. 16-25, 2015. http://dx.doi.org/10.14685/rebrapa.v6i1.186
SHARMA, G.; THAKUR, B.; NAUSHAD, M.; AL-MUHTASEB, A. H.; KUMAR, A.;
SILLANPAA, M.; MOLA, G. T. Fabrication and characterization of sodium dodecyl
sulphate@ironsilicophosphate nanocomposite: Ion exchange properties and selectivity
for binary metal ions. Materials Chemistry and Physics, v. 193, p. 129-139, 2017.
http://dx.doi.org/10.1016/j.matchemphys.2017.02.010

Rev. Ambient. Água vol. 13 n. 2, e2181 - Taubaté 2018
12 Nelson Consolin Filho et al.
SUROVKA, D.; PERTILE, E. Sorption of Iron, Manganese, and Copper from Aqueous
Solution Using Orange Peel: Optimization, Isothermic, Kinetic, and Thermodynamic
Studies. Polish Journal of Environmental Studies, v. 26, n. 3, p. 795-800, 2017.
https://doi.org/10.15244/pjoes/60499
TAVLIEVA, M. P.; GENIEVA, S. D.; GEORGIEVA, V. G.; VLAEV, L. T. Thermodynamics
and kinetics of the removal of manganese (II) ions from aqueous solutions by white rice
husk ash. Journal of Molecular Liquids, v. 211, p. 938-947, 2015.
http://doi.org/10.1016/j.molliq.2015.08.015

Ambiente & Água - An Interdisciplinary Journal of Applied Science
ISSN 1980-993X – doi:10.4136/1980-993X
www.ambi-agua.net
E-mail: [email protected]
This is an Open Access article distributed under the terms of the Creative Commons
Attribution License, which permits unrestricted use, distribution, and reproduction in any
medium, provided the original work is properly cited.
Determination of carbamazepine and diazepam by SPE-HPLC-DAD
in Belém River water, Curitiba-PR/Brazil
ARTICLES doi:10.4136/ambi-agua.2196
Received: 05 Oct. 2017; Accepted: 05 Jan. 2018
Beatriz Böger1*; Bianca do Amaral2; Priscila Lagner da Silveira Estevão2;
Ricardo Wagner1; Patricio Guillermo Peralta-Zamora2; Eliane Carneiro Gomes1
1Universidade Federal do Paraná (UFPR), Curitiba, PR, Brasil
Programa de Pós-Graduação em Ciências Farmacêuticas (PPGCF). E-mail: [email protected],
[email protected], [email protected] 2Universidade Federal do Paraná (UFPR), Curitiba, PR, Brasil
Programa de Pós-Graduação em Química (PPGQ). E-mail: [email protected],
[email protected], [email protected] *Corresponding author
ABSTRACT This work sought to determine the two psychotropic drugs most commonly released by
Psychosocial Care Centers (CAPS) into urban river waters (Belém sub-basin, Curitiba, PR,
Brazil). A simple analytical method using SPE followed by a HPLC–DAD was developed and
validated. Strata-X® cartridges were used to extract (carbamazepine) CZ and diazepam (DZ)
from water and SPE conditions were optimized by 23 factorial design. The validated method
was specific for target compounds; correlation coefficients were above 0.9998, recovery
between 85.8 and 98.4% and precision below 6.60% (RSD, n=3). This method was successfully
applied to analyze river samples and pollution hotspots were identified. The CZ and DZ
concentrations found ranged from 0.670 to 0.856 µg L-1 and from LOQ to 0.763 µg L-1,
respectively, and confirmed that drug consumption is directly related to river pollution in the
studied region.
Keywords: carbamazepine, diazepam, emerging pollutants.
Determinação de carbamazepina e diazepam por SPE-HPLC-DAD
nas águas do rio Belém em Curitiba-PR/ Brasil
RESUMO Este trabalho teve como objetivo determinar duas drogas psicotrópicas mais dispensadas
pelos Centros de Atenção Psicossocial (CAPS) nas águas de um rio urbano (sub-bacia do rio
Belém, Curitiba - PR, Brasil). Foi desenvolvido e validado um método analítico SPE seguido
de HPLC-DAD. Os cartuchos Strata-X® foram utilizados para extrair carbamezepina (CZ) e
diazepam (DZ) das águas e as condições de SPE foram otimizadas por um planejamento fatorial
23. O método validado foi específico para compostos alvo. Os coeficientes de correlação foram
superiores a 0,9998, a recuperação entre 85,8 e 98,4% e a precisão abaixo de 6,60% (RSD,
n = 3). Este método foi aplicado com sucesso para analisar amostras de rios e pontos críticos
de poluição foram reconhecidos. A CZ e DZ foram encontradas em concentrações variando de

Rev. Ambient. Água vol. 13 n. 2, e2196 - Taubaté 2018
2 Beatriz Böger et al.
0,670 a 0,856 μg L-1 e de LOQ a 0,763 μg L-1, respectivamente, confirmam que o consumo de
drogas está diretamente relacionado à poluição do rio na região estudada.
Palavras-chave: carbamazepina, diazepam, poluentes emergentes.
1. INTRODUCTION
About 450 billion people worldwide have some mental or behavioral disorder, and this
number is expected to grow significantly up until 2020 (Menken et al., 2000). Psychiatric drugs
are of particular concern because of their toxicity, persistence and the increased consumption
in the last decade (Stuart et al., 2012; Subedi and Kannan, 2015; FENAFAR, 2015). Diazepam
(DZ) is a psychotropic medication of the benzodiazepine class that are selective central nervous
system modifiers and can be classified as anxiolytic. They are the most commonly used in the
world (Sebastiaão and Pelá, 2004). About 1-3% of the Western population has already
consumed diazepam regularly for over a year and in Brazil about 10% of adults have been
prescribed these drugs (Huf et al., 2000; CREMESP, 2002). Carbamazepine (CZ) is a controlled
drug in Brazil and is considered a mood stabilizer (Rang et al., 2003). In 2008, carbamazepine,
with anticonvulsant action, was among the five active ingredients most consumed in Brazil
(Mota, 2011). Carbamazepine has been detected in the surface of drinking water in more than
29 countries (Ebert et al., 2014). Diazepam was found in 8 of 20 wastewater treatment plants at
relatively low concentrations (< 0.04 mg L-1) with a high frequency of detection in these
treatment plants (Cabeza, 2012).
Although the present knowledge in the occurrence and behavior of these compounds in
rivers is well documented in the world (Li, 2014; Pal et al., 2013; Patrolecco et al., 2013;
Camacho-Muñoz et al., 2009; Madureira et al., 2010), in Brazil it is still very limited
(Montagner and Jardim, 2011; Campanha et al., 2015; Almeida et al., 2013). Only eight
quantification studies of emerging pollutants of pharmaceutical origin were performed between
2000-2015 in Brazil. Among these studies, only three psychoactive drugs were investigated in
aqueous matrices. Also, the southern region has only one study on hospital sewage and none
on rivers (Böger et al., 2015).
Pharmaceuticals are released into the environment through excretions via feces and urine
in a conjugated or unmetabolized way, and through disposal of outdated medicines in household
sewage and effluents of wastewater treatment plants (WWTPs) (Subedi and Kannan, 2015;
Alygizakis et al., 2016). While the toxic effects related to the disposition of these compounds
are not fully known, recent studies demonstrate some interference in the metabolism and
behavior of aquatic organisms (Fent et al., 2006; Morley, 2009), crossing all biological
hierarchy, from cells and organs, and even ecosystems (Jorgensen and Halling-Sorensen, 2000).
A recent study showed that exposure of fish and benthic invertebrates to psychoactive drugs
altered their behavioral responses (Brodin et al., 2014; Rosi-Marshall et al., 2015).
Due to the matrix complexity and the low concentration of the target analytes, the direct
analysis of these drugs is not feasible. Also, sample pretreatment is necessary to eliminate the
interferences and to achieve desirable limits of detection and quantification. Solid phase
extraction (SPE) has been applied to trace analysis to obtain significant preconcentration
factors, with the use of smaller volumes of solvent (Madureira et al., 2010; Huntscha et al.,
2012; Amaral et al., 2014).
Recently, the emerging organic pollutants have been investigated worldwide; nevertheless,
there is no legislation that considers pharmaceuticals as micropollutants. The analytical
techniques for medicine quantification and identification are well-established in governmental
agencies such ANVISA in Brazil. Despite this, conventional methodologies are used for raw
material and commercial product quality (Anvisa, 2003). Hence, the development of rapid,

3 Determination of carbamazepine and diazepam …
Rev. Ambient. Água vol. 13 n. 2, e2196 - Taubaté 2018
cheap, sensitive and accurate methods for monitoring pharmaceuticals at trace level have
represented an analytical challenge in the last years. Further, the simultaneous determination of
compounds with different chemical nature, from various therapeutic classes (Gros et al., 2006;
Gomez et al., 2007) and also track pharmaceuticals in highly polluted aquatic environments,
decreased time, and reduced overall cost is still a challenge. Most of these new methodologies
are based on liquid chromatography-tandem mass spectrometry (LC–MS/MS) due to its high
sensitivity and ability to confirm the compound’s identity; however, the application of this
sophisticated and expensive technology is not yet available in all laboratories. Taking into
account the previously mentioned concerns, the purpose of this work was to develop an
analytical method based on a single and efficient preconcentration procedure based on solid-
phase extraction (SPE) followed by high-performance liquid chromatography with diode array
detection (HPLC–DAD) analysis, demonstrating that this methodology is very useful for
detecting levels of carbamazepine and diazepam in polluted water samples. These analytes were
chosen based on survey of the most prescribed drug by Psychosocial Care Center (CAPS) in
Curitiba, Paraná- BR performed in this work.
2. MATERIALS AND METHODS
2.1. Chemicals and materials
Carbamazepine (CZ, 5H-Dibenz[b,f]azepine-5-carboxamide) and Diazepam
(DZ, 7-Chloro-1-methyl-5-phenyl-3H-1,4-benzodiazepin-2(1H)-one) were purchased from
USP (Rockville, MD, USA).
All the other solvents used were HPLC grade and supplied by J. T. Baker (Philipsburg, NJ,
USA). Ultrapure water was obtained using Milli-Q system coupled with a UV lamp
(18.2 M cm, Bedford, MA, USA). 0.45-μm glass fiber filters were purchased from Millipore
(Macherey Nagel). Stock solutions for individual standards (1000 mg L-1) were prepared in
methanol and stored in the dark at –6°C. Stock solutions were stable, and no evidence of
degradation of the analytes was observed on the chromatograms during the six-month study
period. Working solutions were prepared daily by diluting the stock solution with a suitable
solvent. The pH of the solutions was measured by OHAUS Starter 2100 pH-meter.
2.2. Sample collection
The river studied was chosen according to the geographical location of the CAPS
evaluated. These two CAPS are located on the watershed of Belém. Therefore, the river selected
for the study was the sub-basin of Belém River (tributary of the Iguaçu River, which is one of
the basins used for water supply in other cities in Paraná), considered a contaminated hotspot.
Several samples were collected at three distinct areas of the Belém River: two considered highly
polluted since most waste generated in this region is not suitably treated and is directly
discharged into the Belém River (the mouth and about 7 km from the headspring of the river)
and the other with low levels of pollution as it was near the headspring. The samples were
fortified with 2.56 μg L-1 of DZ and 2.26 μg L-1 of CZ to monitor retention time (TR) of drug.
The water samples were collected during May, June, July and October. Two liters of river water
samples were collected into 2.5 L pre-rinsed amber glass bottles. Upon collection, all samples
were immediately transported at 4°C to the laboratory and vacuum-filtered through a 0.45-μm
glass fiber filter with a 47 mm diameter (Millipore). The pH of filtered samples was adjustedd
to 4.00. Each sample was divided into different volumetric flasks, then stored in darkness at
4°C and extracted within a maximum of 24 h after collection.

Rev. Ambient. Água vol. 13 n. 2, e2196 - Taubaté 2018
4 Beatriz Böger et al.
2.3. Solid-phase extraction
SPE was performed on a PrepSep 20-port vacuum manifold (Waters, Milford, MA, USA)
with Strata-X® cartridges (Phenomenex, 200 mg/ 3 mL). The SPE operational variables such
as conditioning and elution solvent, analytes concentration and sample volume, were optimized
by a two-level factorial design (23 with triplicate of center point) according to Table 1. The
assays were carried out in a randomized mode. The response evaluated was the recovery of
psychoactive drugs.
In the optimized SPE procedure, cartridges were conditioned with two aliquots of
acetonitrile (2.50 mL) and two aliquots of ultrapure water pH 4 (2.50 mL) before each run.
Sequentially, water samples at 4.00 pH were percolated through the cartridges at a constant
flow rate of 3 mL min-1. Afterward, elution was performed with 5.00 mL of acetonitrile. The
extracts were evaporated to dryness in a thermostatic bath at 30°C under a gentle nitrogen
stream. The residues were dissolved in 1.00 mL of water, and 15 μL was injected into the HPLC
system. The pH and reconstitution volume were evaluated separately.
Table 1. Factors and levels analyzed in two-level full factorial design.
Factor Level
-1 0 +1
Concentration 1.28 µg L-1 DZ
1.13 µg L-1 CZ
2.56 µg L-1 DZ
2.26 µg L-1 CZ
3.84 µg L-1 DZ
3.39 µg L-1 CZ
Sample volume 100 mL 200 mL 300 mL
Conditioning/elution solvent Acetonitrila (ACN) ACN:MetOH (1:1) Metanol (MetOH)
2.4. HPLC–DAD analysis
Chromatographic analyses were performed with the Agilent 1260 Infinity Quaternary LC
system (Agilent Technologies, Waldbronn, Germany) equipped with an autosampler,
quaternary gradient pump, and diode array detector (DAD) system. Separation was achieved in
a 100 mm × 2.1 mm, 5 µm particle size Waters XBridge BEH C18 column. The data were
collected with OpenLab EZChrom Elite software. The chromatographic conditions were
optimized based on previous information in literature (INMETRO, 2010; Madureira et al.,
2010). Hence, an isocratic elution mode was selected for simultaneous determination of
carbamazepine and diazepam with methanol and ultrapure water (60:40 v/v) as mobile phase at
a flow rate of 0.4 mL min−1. Separations were performed at a 30°C. The following wavelengths
were monitored: 254 nm (DZ) and 286 nm (CZ), which allowed a selective analysis with a
suitable absorption of the studied compounds. The optimized chromatographic condition had
8.0 minutes of total run time.
2.5. Method validation
The method validation for the determination of pharmaceuticals in river water was
performed with the following parameters: linearity, detection and quantification limits,
precision and accuracy (n=3 for all assays) according to guidelines described by the National
Agency of Health Surveillance (Agência Nacional de Vigilância Sanitária – ANVISA) (Anvisa,
2003). All procedures were performed with preconcentration step.
3. RESULTS AND DISCUSSION
3.1. Psychotropic drugs studied
This study aims to analyze the most commonly used psychotropic drugs in the
Psychosocial Network, the Psychosocial Care Center (CAPS) in Curitiba, Paraná, BR, assisted

5 Determination of carbamazepine and diazepam …
Rev. Ambient. Água vol. 13 n. 2, e2196 - Taubaté 2018
by Unified Health System (SUS), which consists of healthcare venuess for people suffering
from mental disorders and needs arising from the use of crack, alcohol, and other drugs.
A transverse quantitative analysis was performed to search for information in the Specific
Registration Books of controlled drugs in CAPS for the years 2011 to 2014. There were 10,897
drugs dispensed for emergency use in mental disorders. The Brazilian Common Denomination
(DCB), pharmaceutical forms and concentrations that are exempted from the following drug
classes was considered: antidepressants, anxiolytics, antiepileptics, antipsychotics,
anticholinergics, and hypnotic/sedative. Based on this survey, carbamazepine and diazepam
were among the most prescribed antipsychotics (Diazepam 5 mg pill (11.86%) and
Carbamazepine 200 mg (9.08%)). Hence, the both psychotropic drugs were selected for further
investigation.
3.2. Solid phase extraction
Pre-concentration methods are essential to environmental analysis since the target analytes
are at low concentrations (the trace levels – µg L−1) (Amaral et al., 2014). Initially, the selection
of pH included different values of 4.00, 6.50 and 8.00 (n = 3). Water acidified to pH 4.00
showed better recovery results to both analytes because CZ ensures the prevalence of the neutral
form of compounds in the solution (around pka) and DZ is undissociated; however the best
recoveries were obtained in acidic media compared with neutral and basic pH recoveries.
To determine the influence of conditioning and elution solvent, analytes concentration and
sample volume on the preconcentration system, a two-level full factorial design, 23 with 8 runs
was employed. Based on central point standard deviation (CZ: 0.38; DZ: 0.15), 3-way
interactions were statistically significant (95% of confidence level) for both analytes. Hence,
the factors can not be evaluated individually. As shown in Figure 1, this higher-order effect
means there are several conditions which provide proper psychoactive drug recovery.
The optimized SPE conditions were in the low level for all variables (5.00 mL of ACN
followed by 5.00 mL of ultrapure water pH 4.00 as conditioning solvents, 5.00 mL of ACN as
an elution solvent, 100 mL of sample volume and 1.13 µg L-1 to CZ and 1.28 µg L-1 to DZ) and
were employed in further experiments. Similar recoveries were estimated by Patrolecco et al.
(2013) employing Strata X cartridge (80 to 93% to CZ) and by Madureira et al. (2010) using
Oasis HLB cartridges (81 to 91% to CZ and 86 to 91% to DZ).
Reconstitution volume was also investigated. Recoveries of around 80% with RSD below
3.7% were obtained for CZ and DZ at 1.00 mL of ultrapure water. Meanwhile, volumes of
0.500 and 0.250 mL recovered less than 70% of both analytes. Moreover, an enrichment factor
of 100 times was achieved.
Figure 1. Graphical representation of SPE optimization by 23 factorial design. Recovery observed in
each assay appears in the boxes.

Rev. Ambient. Água vol. 13 n. 2, e2196 - Taubaté 2018
6 Beatriz Böger et al.
3.3. Method validation
Figure 2 shows the chromatograms obtained for the proposed method. Well-resolved peaks
were observed, for which the retention times were 1.47 minutes and 3.07 minutes for CZ and
DZ, respectively.
The linearity of the method was studied in ten different concentrations of analyte in
triplicate in the range between 10.0 e 1500 µg L-1. The proposed method showed good linear
range between 20 - 1500 µg L-1 to CZ and 40 - 1500 µg L-1 to DZ, with excellent coefficients
of determination (R > 0.999) for both analytes, as recommended by ANVISA (2003). Angular
coefficients were used to evaluate method sensitivity, which showed slightly more sensitivity
to carbamazepine (Figure 2C).
Selectivity was observed by the association of the TR and DAD spectra, standards in a pure
solvent and standards in matrix ensures that the signal measured is not influenced by matrix
interferences. This observation guarantees that the method is selective for the pharmaceuticals
and can be used for monitoring purposes in river water samples. The RSD values were obtained
as a result of a precision estimation of the tR between the standard in solvent solutions, and
spiked matrix were below 2.45% (n = 18). The difference in the baseline shift observed at the
beginning of chromatograms is entirely related to the absorption of humic substances
commonly present in river water samples, which due to its high conjugated system caused this
characteristic band (Moffat et al. 2004). However, in our study, this fact did not interfere with
the determination of the studied compounds.
The instrumental precision was estimated by repeatability and intermediate precision
assays and was expressed as percent relative standard deviation (%RSD) of replicate
measurements using the peak areas for calculation. Table 2 summarizes the precision results
from replicate measurements at three different concentration levels (50.0 μg L-1, 500 μg L-1,
and 1000 μg L-1 , n=3) for each studied psychoactive compound.
Repeatability of replicate measurements was satisfactory, with RSD values below 6.06%
and 3.64% for CZ and DZ, respectively. The intermediate precision showed RSD values below
3.87% for CZ and 6.61% for DZ (Table 2). The Instituto Nacional de Metrologia, Normalização
e Qualidade Industrial (INMETRO, 2010) determines a maximum RSD value of up to 20%.
ANVISA (2003) recommends that the coefficients of variation should not exceed 5% for the
determination of drugs in medicine and more complex matrices, such as serum, blood or
plasma, but accepts a value of up to 15%. Hence, the method’s precision was satisfactory within
the maximum value permitted by applicable Brazilian legislation.
Table 2. Repeatability, intermediate precision RSD (%) and recovery values (%) at three different
concentration levels.
Concentration levels (μg L-1)
50.0 (n=3) 500 (n=3) 1000 (n=3)
CZ DZ CZ DZ CZ DZ
Repeatability (%) 6.06 1.34 0.640 3.64 0.420 2.15
Intermediate precision (%) 3.87 6.61 0.820 0.240 1.56 0.210
Recovery±RSD (%) 98.3±4.46 98.4±5.32 89.7±2.25 92.7±10.7 85.8±3.86 89.7±9.07
Accuracy was established based on CZ and DZ recovery, which was performed by
extracting and analyzing triplicate ultrapure water samples spiked with analytes (50.0 μg L-1,
500 μg L-1 and 1000 μg L-1). The results of recovery experiments are reported in Table 2, which
shows that the method is accurate within the desired recovery range. Similar recoveries were
found in real samples (Patrolecco et al., 2013, Madureira et al., 2010)

7 Determination of carbamazepine and diazepam …
Rev. Ambient. Água vol. 13 n. 2, e2196 - Taubaté 2018
Figure 2. HPLC-DAD chromatograms
of a standard mixture of the
psychoactive at 10 to 1500 μg L-1
performed under the optimized
conditions: A) DZ and B) CZ. C)
Analytical curves for CZ at 286 nm
and DZ at 254 nm.
Limits of detection and quantification of the developed method were estimated by the
relation of the intercept standard deviation (s) and the value of the calibration curve slope (S),
according to Equations 1 and 2:
𝐿𝑂𝐷 =3,3𝑠
𝑆 (1)
𝐿𝑂𝑄 =10𝑠
𝑆 (2)
The LODs and LOQs were 0.0670 µg L-1 and 0.209 µg L-1 to CZ and 0.130 µg L-1 and
0.435 µg L-1 to DZ. These results were close to those described in the literature (Madureira et
al. 2010; Ebert et al. 2014).

Rev. Ambient. Água vol. 13 n. 2, e2196 - Taubaté 2018
8 Beatriz Böger et al.
The LOD and LOQ obtained in this work were lower than Madureira et al. (2010) have
found with the SPE method (LOD and LOQ to CZ of 3.8 and 15 µg L-1, respectively, and to
DZ 10.3 and 40 µg L-1, respectively). Ebert et al. (2014) related that the global mean
concentration in surface water to CZ is between 0.187 and 8.05 µg L-1. Based on that, the
proposed method would be able to detect CZ in concentrations lower than this minimum limit.
The evaluation of robustness was made by analyses of the influence of variations in column
temperature at 20°C, 25°C and 30°C, respectively, and in flow rates of 0.3, 0.4 and
0.5 mL min-1. This data allowed us to correlate each area of peak to the corresponding
chromatographic retention time. For robustness evaluation, small changes in flow rate (±10%)
and column temperature (±5°C) did not make significant changes to resolution or recovery.
3.4. Psychoactive pharmaceuticals in the Belém River water
To demonstrate the applicability of the developed method, three sampling locations in the
Belém River were selected according to the level of pollution in each area (low, medium and
high pollution). Water samples were collected in May, June, July and October 2015 (Table 3).
The mouth of the river is the most-polluted site. It is fully inserted in the city of Curitiba;
there are many irregular houses on its margins. Many of these houses are not connected to the
city’s sewage network, thus discarding their sewage into the river.
Table 3. The average concentration of residues found in different
locations in the river in each collection.
Locations Analytes Average concentration (μg L-1)
May June July October
Headspring CZ <LOQs <LOQs 0.371 nd*
DZ <LOQs nd* nd* nd*
Middle of river CZ <LOQs <LOQs <LOQs nd*
DZ nd* nd* nd* nd*
Mouth CZ nd* 0.856 <LOQs nd*
DZ nd* 0.763 nd* nd*
*nd: not detected.
Carbamazepine was found higher than LOQ in headspring (July-CZ = 0.371 µg L-1) and
the both at the Belém River mouth (June-CZ = 0.856 µg L-1, DZ = 0.763 µg L-1) in the second
and third collections, which are consistent with the results that similar work reported (Ebert et
al., 2014, Patrolecco et al., 2013). These collections were performed during a dry period
(winter), which increases the analytes concentration and lowers degradation rates. Further,
during the spring (October), the increase of rain volume and warm weather (INMET, 2015)
promotes the dilution of analytes and increases degradation rates. Therefore, CZ and DZ were
not detected at any of the collection points. The highest frequency of CZ detection is indicative
of inadequate sewage disposal along the river localized in the region that this drug is widely
distributed by CAPS, as early mentioned.
CZ were found in the Tiber River (Italy) at the concentration level of 0.063 µg L-1
(Patrolecco et al., 2013). Madureira et al. (2010) found CZ at 0.0327 µg L-1 and did not detect
DZ in the Douro River estuary (Portugal). Campanha et al. (2015) found CZ in 71% of analyzed
samples between 0.50 and 0.215 µg L-1 in the Monjolinho River, São Carlos, SP. According
Clara et al. (2004), CZ could be considered a qualified parameter for detecting wastewater in
aquatic environments due to its high persistence.
Carbamazepine and diazepam were found to be ubiquitous (present in 58.3% of samples
collected) and persistent in river water. Here again, a strong correlation was observed between
the amount of pharmaceuticals dispensed in the CAPS and their excretion as an unchanged drug

9 Determination of carbamazepine and diazepam …
Rev. Ambient. Água vol. 13 n. 2, e2196 - Taubaté 2018
and their concentration levels in the surface water (the amount of CZ that would go to the Belém
River would be 19.7 g – estimating that 10% is excreted as unchanged drug, and the amount of
DZ would be 0.194 g – calculating that 3% is excreted as unchanged drug) (Moffat et al., 2004).
CAPS provide a regionalized service, implying the delineation of specific geographical areas.
These two CAPS studied delimited the region on the sub-basin of the Belém River, where
houses not connected to the sewage system properly end up discarding their waste into rivers
or streams of this subbasin.
Despite diazepam being the most commonly dispensed medication in the community
between 2011-2014, carbamazepine was found at much higher concentrations in both the mouth
and headspring of the river than diazepam (a maximum concentration of 0.763 µg L-1
determined in the mouth of the river during dry weather conditions). This can be explained by
the fact that carbamazepine is excreted by the human body in approximately 10% unchanged
form, while diazepam is excreted approximately 3% as an unchanged compound. Therefore,
CZ environmental concentrations are much higher. Other similar observations about
carbamazepine are reported (Glassmeyer et al., 2009; Subedi and Kannan, 2015). To date,
diazepam has not been extensively reported.
Because of the importance of these substances to public health, according to the
ecotoxicological point of view (Alonso et al., 2010; Brodin et al., 2014; Petersen et al., 2014;
Rosi-Marshall et al., 2015), it is essential to ascertain their occurrence in surface water systems,
even though it is not contemplated in Brazilian environmental legislation. Further studies of
this are extremely necessary to support the establishment of legal parameters of drug residues
in aqueous matrices.
The proposed HPLC-DAD method showed specificity, accuracy and sensitivity, good
linearity for both analytes (R> 0.9998) and LOD and LOQ were found to be suitable for
environmental analysis with a preconcentration step (micrograms per liter or parts per billion).
This paper provided a useful and expressive guidance on HPLC-DAD that is in accordance with
validation requirements for pharmaceutical analysis in water samples. To our knowledge, this
is the first study reporting the method validation of the psychoactive drugs by
SPE-HPLC–DAD for river water, especially in developing countries such as Brazil.
4. ACKNOWLEDGMENTS
We gratefully acknowledge the Federal University of Paraná (UFPR) and the financial
support of Conselho Nacional de Desenvolvimento Científico e Tecnológico (CNPq), Fundação
Araucária and Coordenação de Aperfeiçoamento de Pessoal de Nível Superior (CAPES).
5. REFERENCES
AGÊNCIA NACIONAL DE VIGILÂNCIA SANITÁRIA (Brasil). Resolução n° 899 de 29
maio de 2003. Determina a publicação do Guia para Validação de Métodos Analíticos e
Bioanalíticos. Diário Oficial [da] União, Brasília, DF, 02 jun. 2003.
ALMEIDA, C. A. A.; BRENNER, C. G.; MINETTO, L.; MALLMANN, C. A.; MARTINS,
A. F. Determination of anti-anxiety and anti-epileptic drugs in hospital effluent and a
preliminary risk assessment. Chemosphere, v. 93, p.2349–2355, 2013.
https://doi.org/10.1016/j.chemosphere.2013.08.032
ALONSO, S. G.; CATALÁ, M.; MAROTO, R. R.; GIL, J. L. R. A.; MIGUEL, Á. G.;
VALCÁRCEL, Y. Pollution by psychoactive pharmaceuticals in the Rivers of Madrid
metropolitan area (Spain). Environment International, v. 36, p. 195–201, 2010.
http://dx.doi.org/10.1016/j.envint.2009.11.004

Rev. Ambient. Água vol. 13 n. 2, e2196 - Taubaté 2018
10 Beatriz Böger et al.
ALYGIZAKIS, A. N.; GAGO-FERRERO, P.; BOROVA, V.; PAVLIDOU, A.;
HATZIANESTIS, L. THOMAIDIS, S. N. Occurrence and spatial distribution of 158
pharmaceuticals, drugs of abuse and related metabolites in offshore seawater. Science of
Total Environment, v. 514, p. 1097-1105, 2016.
http://dx.doi.org/10.1016/j.scitotenv.2015.09.145
AMARAL, B.; DE ARAUJO, J. A.; ZAMORA, P. G. P.; NAGATA, N. Simultaneous
determination of atrazine and metabolites (dia and dea) in natural water by multivariate
electronic spectroscopy. Microchemical Journal, v. 117, p. 262-267, 2014.
http://dx.doi.org/10.1016/j.microc.2014.07.008
BÖGER, B.; TONIN, F. S.; ZAMORA, P. G. P; WAGNER, R.; GOMES, E. C. Micropoluentes
emergentes de origem farmacêutica em matrizes aquosas do Brasil: uma revisão
sistemática. Ciência e Natura, v. 37, p. 725-739, 2015.
http://dx.doi.org/10.5902/2179460X18174
BRODIN, T.; PIOVANO, S.; FICK, J.; KLAMINDER, J.; HEYNEN, M.; JONSSON, M.
Ecological effects of pharmaceuticals in aquatic systems—impacts through behavioural
alterations. Philosophical Transactions of Royal Society B Biological Sciences, v. 369,
p. 1656, 2014. http://dx.doi.org/10.1098/rstb.2013.0580
CABEZA, Y.; CANDELAA, L.; RONENB, D.; TEIJONA, G. Monitoring the occurrence of
emerging contaminants in treated wastewater and groundwater between 2008 and 2010.
The Baix Llobregat (Barcelona, Spain). Journal of Hazardous Materials, v. 239, p.32-
39, 2012. http://dx.doi.org/10.1016/j.jhazmat.2012.07.032
CAMACHO-MUNOZ, D.; MARTIN, J.; SANTOS, L. J.; APARICIO, I.; ALONSO, E. An
affordable method for the simultaneous determination of the most studied pharmaceutical
compounds as wastewater and surface water pollutants. Journal of Separation Science,
v. 32, p. 3064-3073, 2009.
CAMPANHA, M. C.; AWAN, A. T.; DE SOUSA, D. N.; GROSSELI, G. M.; MOZETO, A.
A.; FADINI, P.S. A 3-year study on occurrence of emerging contaminants in an urban
stream of São Paulo State of Southeast Brazil. Environmental Science and Pollution
Research, v. 22, p. 7936-47, 2015.
CLARA, M.; STRENN, B.; KREUZINGER, N. Carbamazepine as a possible anthropogenic
marker in the aquatic environment: investigations on the behaviour of Carbamazepine in
wastewater treatment and during groundwater infiltration. Water Research, v. 38, p.
947–954, 2004.
CONSELHO REGIONAL DE MEDICINA DO ESTADO DE SÃO PAULO - CREMESP.
Jornal do CREMESP, v. 183, n. 11, 2002.
EBERT, I.; HICKMANN, S.; KÜSTER. A. Environmental relevance of pharmaceuticals:
The global perspective. Risk Assessment of Pharmaceuticals. Geneva: UBA, 2014.
Available in: www.pharmaceuticals-in-the-environment.org. Accessed: 12 Jun. 2015.
FEDERAÇÃO NACIONAL DE FARMACEUTICOS - FENAFAR. O consumo de
medicamentos no Brasil. Available in: http://www.fenafar.org.br/fenafar/crf/item/7966-
o-consumo-de-medicamentos-no-brasil-a-tenue-linha-entre-o-remedio-e-o-veneno-por-
rilke-novato. Accessed: 23 Sept. 2015.

11 Determination of carbamazepine and diazepam …
Rev. Ambient. Água vol. 13 n. 2, e2196 - Taubaté 2018
FENT, K.; WENSTON, A. A; CAMINADA, D. Ecotoxicology of human pharmaceuticals.
Aquatic Toxicology, v. 76, p. 122-59, 2006.
http://dx.doi.org/10.1016/j.aquatox.2005.09.009
GLASSMMEYER, S. T.; HINCHEY, E. K.; BOEHME, S. E. et al. Disposal practices for
unwanted residential medications in the United States. Environment International, v.
35, n.3, p. 566-72, 2009. http://dx.doi.org/10.1016/j.envint.2008.10.007
GOMEZ, M. J.; AGUERA, A.; MEZCUA, M.; HURTADO, J.; MOCHOLI, F.;
FERNANDEZ- ALBA, R. A. Simultaneous analysis of neutral and acidic
pharmaceuticals as well as related compounds by gas chromatography-tandem mass
spectrometry in wastewater. Talanta, v. 73, p. 314–320, 2007.
http://dx.doi.org/10.1016/j.talanta.2007.03.053
GROS, M.; PETROVIC, M.; BARCELÓ, D. Development of a multi-residue analytical
methodology based on liquid chromatography-tandem mass spectrometry (LCMS/MS)
for screening and trace level determination of pharmaceuticals in surface and
wastewaters. Talanta, v. 70, p. 678–690, 2006.
http://dx.doi.org/10.1016/j.talanta.2006.05.024
HUF, G.; LOPES, C. S.; ROSENFELD, S. O uso prolongado de benzodiazepínicos em
mulheres de um centro de convivência para idosos. Cadernos de Saúde Pública, v. 16,
n. 2, p. 351-62, 2000. http://dx.doi.org/10.1590/S0102-311X2000000200006
HUNTSCHA, S.; SINGER, H. P.; MCARDELL, C. S.; FRANK, C. S.; HOLLENDER, J.
Multiresidue analysis of 88 polar micropolluants in ground, surface and wastewater using
online mixed-bed multilayer solid-phase extraction coupled to HPLC tandem mass
spectrometry. Journal of Chromatography A, v. 1268, p. 74-83, 2012.
http://dx.doi.org/10.1016/j.chroma.2012.10.032
INSTITUTO NACIONAL DE METEOROLOGIA - INMET. Número de dias com
precipitação maior ou igual a 1 mm (dias). 2015. Available in::
http://www.inmet.gov.br/portal/. Accessed: 02 Oct. 2015.
INSTITUTO NACIONAL DE METROLOGIA, NORMALIZAÇÃO E QUALIDADE
INDUSTRIAL - INMETRO. DOQ-CGCRE-008. Orientações sobre validação de
métodos analíticos, INMETRO. Rio de Janeiro, 2010. Available in:
http://www.inmetro.gov.br/Sidoq/Arquivos/Cgcre/DOQ/DOQ-Cgcre-8_04.pdf.
Accessed: 25 Mar. 2015.
JORGENSEN, S. E.; HALLING-SORENSEN, B. Drugs in the environment. Chemosphere,
v. 40, n.7, p.691-699, 2000. http://dx.doi.org/10.1016/S0045-6535(99)00438-5
LI, W.C. Occurrence, headsprings, and fate of pharmaceuticals in aquatic environment and soil.
Environmental Pollution, v. 187, p. 193–201, 2014.
http://dx.doi.org/10.1016/j.envpol.2014.01.015
MADUREIRA, T. V.; ROCHA. M.; CASS, Q. B.; TIRITAN, M. E. Development and
optimization of HPLC-DAD method for the determination of diverse pharmaceuticals in
estuarine surface waters. Journal of Chromatography Science, v. 48, n. 3, p. 176-182,
2010. http://dx.doi.org/10.1093/chromsci/48.3.176
MENKEN, M.; MUNSAT, T. L.; TOOLE, J. F. The global burden of disease study:
implications for neurology. Archives of Neurology, v. 57, n. 3, p. 418–420, 2000.
http://dx.doi.org/10.1001/archneur.57.3.418

Rev. Ambient. Água vol. 13 n. 2, e2196 - Taubaté 2018
12 Beatriz Böger et al.
MOFFAT, A. C.; OSSELTON, M. D.; WIDDOP, B.; WATT, S. J. Clarke’s Analysis of Drugs
and Poisons. London: Pharmaceutical Press, 2004.
MONTAGNER, C. C; JARDIM, F. W. Spatial and seasonal variations of pharmaceuticals and
endocrine disruptors in the Atibaia River, São Paulo State (Brazil). Journal of the
Brazilian Chemical Society, v. 22, n. 8, p. 1452-1462, 2011.
MORLEY, N. J. Environmental risk and toxicology of human and veterinary waste:
pharmaceutical exposure to aquatic host-parasite relationships. Environmental
Toxicology and Pharmacology, v. 27, p. 161-75, 2009.
http://dx.doi.org/10.1016/j.etap.2008.11.004
MOTA, D. M. Panorama dos dados do Sistema Nacional de Gerenciamento de Produtos
Controlados: um sistema para o monitoramento de medicamentos no Brasil. Boletim de
farmacoepidemiologia do SNGPC, v. 2, ano 1, 2011.
PAL, R.; MEGHARAJ, M.; KIRKBRIDE, K. P.; NAIDU, R. Illicit drugs and the
environment—a review. Science of Total Environment, v. 1, p. 463-464, 2013.
http://dx.doi.org/10.1016/j.scitotenv.2012.05.086
PATROLECCO, L.; ADEMOLLO, N.; GRENNI, P.; TOLOMEI, A.; CARACCIOLO, A.B.;
CAPRI, S. Simultaneous determination of human pharmaceuticals in water samples by
solid phase extraction and HPLC with UV-fluorescence detection. Microchemical
Journal, v. 107, p.165–171, 2013.
PETERSEN, K.; HEIAAS, H. H.; TOLLEFSEN, K. E. Combined effects of pharmaceuticals,
personal care products, biocides and organic contaminants on the growth of Skeletonema
pseudocostatum. Aquatic Toxicology, v. 150, p. 45–54, 2014.
http://dx.doi.org/10.1016/j.aquatox.2014.02.013
RANG, H. P. et al. Farmacologia. 5. ed. Rio de Janeiro: Elsevier, 2003.
ROSI-MARSHALL, E. J.; SNOW, D.; BARTELT-HUNT, S. L.; PASPALOF, A.; TANK, J.
L. A review of ecological effects and environmental fate of illicit drugs in aquatic
ecosystems. Journal of Hazardous Materials, v. 282, p. 18–25, 2015.
http://dx.doi.org/10.1016/j.jhazmat.2014.06.062
SEBASTIÃO, E. C. O.; PELÁ, I. R. Consumo de medicamentos psicotrópicos: análisis de
recetas médicas ambulatorias como base para estudios de problemas relacionados con
medicamentos. Seguimiento Farmacoterapico, v. 2, n. 4, p. 250-266, 2004.
STUART, M.; LAPOWORTH, D.; CRANE, E.; HART, A. Review of risk from potential
emerging contaminants in UK groundwater. Science of Total Environment, v. 416, p.
1-21, 2012. http://dx.doi.org/10.1016/j.scitotenv.2011.11.072
SUBEDI, B.; KANNAN, K. Ocurrence and fate of select psychoactive pharmaceuticals and
antihypertensives in two waste treatment plants in New York State, USA. Science of
Total Environment, v. 514, p. 273-280, 2015.
http://dx.doi.org/10.1016/j.scitotenv.2015.01.098

Ambiente & Água - An Interdisciplinary Journal of Applied Science
ISSN 1980-993X – doi:10.4136/1980-993X
www.ambi-agua.net
E-mail: [email protected]
This is an Open Access article distributed under the terms of the Creative Commons
Attribution License, which permits unrestricted use, distribution, and reproduction in any
medium, provided the original work is properly cited.
Determinação de hormônios estrogênicos em esgoto bruto e efluente de
uma estação descentralizada de tratamento por lodos ativados
ARTICLES doi:10.4136/ambi-agua.2059
Received: 05 Dec. 2016; Accepted: 19 Dec. 2017
Rossana Borges Teixeira*; Carolina Alves Marques; Natália Rodrigues de Carvalho;
Luiz Eduardo Thans Gomes; Flávio Teixeira da Silva; Teresa Cristina Brazil de Paiva
Escola de Engenharia de Lorena (EEL-USP), Lorena, SP, Brasil
Departamento de Biotecnologia. E-mail: [email protected], [email protected],
[email protected], [email protected], [email protected],
[email protected] *Autor correspondente
RESUMO Hormônios estrogênicos, provenientes dos esgotos, atingem os corpos hídricos e podem
causar perturbações aos organismos aquáticos. Os tratamentos secundários das estações de
tratamento de esgoto (ETE) possibilitam alguma remoção destes compostos, mesmo em ETEs
descentralizadas, apesar de ainda haver poucos estudos sobre elas. Em sistemas por lodos
ativados, a eficiência tem sido relacionada ao tempo de detenção hidráulica (TDH), à idade de
lodo, à desnitrificação biológica e à carga de alimentação. O objetivo deste trabalho foi
quantificar os hormônios estrona (E1), 17-β-estradiol (E2), estriol (E3) e 17-α-etinilestradiol
(EE2) no esgoto e no efluente de uma ETE descentralizada por lodos ativados, além de
caracterizar a ETE do Campus Universitário da EEL-USP quanto à matéria orgânica recebida,
ao tempo de detenção hidráulica e a remoção de nitrogênio. Cromatografia líquida com
detecção UV foi utilizada na determinação dos hormônios. Os resultados mostraram
concentrações dos hormônios superiores às encontradas na literatura, em ambos: esgoto (5,158
± 2,747; 7,434 ± 4,356; 5,200 ± 3,331 e 5,638 ± 4,312 μg L-1 de E1, E2, E3 e EE2) e efluente
(5,062 ± 3,366; 4,191 ± 3,527; 7,743 ± 3,951, 2,550± 2,162 de E1, E2, E3 e EE2). No esgoto,
as altas concentrações podem ser relacionadas à maior predominância de urina, visto os altos
níveis de nitrogênio detectados, à menor geração de esgoto e a amostragem em período seco
causando reduzida diluição dos hormônios. Remoção insuficiente dos hormônios devido a
menor TDH (2h05) e irregularidade na desnitrificação (-54 a 61%) pode ser o motivo das altas
concentrações de estrógenos no efluente. Ademais, a desconjugação dos hormônios pode ter
ocorrido durante o tratamento.
Palavras-chave: cromatografia líquida com detecção UV, esgoto de Campus universitário, estrógenos,
ETE batelada, remoção de hormônios estrogênicos.
Determination of estrogenic hormones in sewage and effluent of a
decentralized sewage treatment plant by activated sludge
ABSTRACT Estrogenic hormones from sewers reach water bodies and can disrupt aquatic organisms.
Secondary treatment of sewage treatment plants (STP) can remove some of those hormones,

Rev. Ambient. Água vol. 13 n. 2, e2059 - Taubaté 2018
2 Rossana Borges Teixeira et al.
even in decentralized STPs, although there are few studies regarding this. In activated sludge
systems, efficient removal has been attributed to hydraulic retention time (HRT), sludge age,
biological denitrification and organic load. This study sought to quantify the hormones estrone
(E1), 17β-estradiol (E2), estriol (E3) and 17α-ethynylestradiol (EE2) in the sewage and effluent
of a decentralized STP with activated sludge, and also to characterize this college campus STP
regarding received organic matter, hydraulic retention time and nitrogen removal. Hormone
levels were determined by liquid chromatography with UV detection. The results showed
hormone concentrations far superior to those found in the literature in both the sewage (5.158
± 2.747; 7.434 ± 4.356; 5.200 ± 3.331 e 5.638 ± 4.312 μg L-1 of E1, E2, E3 and EE2) and the
effluent (5.062 ± 3.366; 4.191 ± 3.527; 7.743 ± 3.951, 2.550 ± 2.162 of E1, E2, E3 and EE2).
In the sewage, the high concentration could be related to a large predominance of urine, given
the high level of nitrogen detected, or to low generation of sewage and to sample collection in
dry periods causing decreased dilution of hormones. Insufficient removal of estrogens due to
short HRT (2h05) and irregular denitrification (-54 to 61%) can be the reason for high
concentrations of estrogens found in the effluent. Furthermore, deconjugation of hormones may
have occurred during treatment.
Keywords: batch WWTP, estrogens, liquid chromatography with UV detection, removal of estrogenic
hormones, wastewater of College Campus.
1. INTRODUÇÃO
Os hormônios estrogênicos, inclusive os naturais, têm sido apontados como os
responsáveis por grande parte das perturbações endócrinas em organismos aquáticos
identificadas nos últimos anos. A relevância dos hormônios estrogênicos na perturbação
endócrina se deve: à alta afinidade dos estrógenos aos receptores presentes nos organismos de
outras espécies permitindo a ação, mesmo em baixíssimas concentrações (ng L-1); à ampla
excreção destes hormônios por seres humanos e por outros animais nas fezes e urina; e ao
posterior despejo dos esgotos, tratados ou não, nos ecossistemas aquáticos (Carballa et al.,
2004; Fonseca et al., 2013).
Diversos estudos realizados ao redor do mundo demonstraram que os esgotos municipais
têm apresentado concentrações dos hormônios estrogênicos na faixa de ng L-1 e detecção dos
hormônios pesquisados em quase todas as amostras. Já os hormônios artificiais têm sido
determinados menos frequentemente, visto que a sua presença depende da prescrição e
regulamentação para uso (Carballa et al., 2004; Janex-Habibi et al., 2009; Stanford e Weinberg,
2010; Fonseca et al., 2013; Ferreira, 2013).
Diferente dos esgotos domésticos, os efluentes de estações de tratamento de esgoto (ETE)
apresentam menor concentração e menor frequência de detecção dos hormônios estrogênicos,
inclusive os naturais. Estas reduções foram atribuídas, principalmente, à remoção destes
compostos pelos tratamentos secundários adotados nas ETEs. A remoção dos hormônios
engloba os processos de biotransformação conduzido pelos micro-organismos e a sorção dos
compostos ao lodo, assim como ocorre com os constituintes majoritários dos esgotos (Carballa
et al., 2004; Servos et al., 2005; Janex-Habibi et al., 2009; Stanford e Weinberg, 2010; Fonseca
et al., 2013).
Estima-se que o sistema de lodos ativados seja o tratamento biológico mais utilizado no
mundo e com isto, trabalhos sob a remoção de hormônios estrogênicos vêm sendo investigados
neste tipo de tratamento (D’Ascenzo et al., 2003). Diferentes eficiências de remoção têm sido
obtidas e os melhores resultados foram atribuídos a maior tempo de detenção hidráulica (TDH),
prolongadas idade de lodo, baixa carga de alimentação e melhor remoção biológica de
nutrientes, principalmente, o nitrogênio (Johnson et al., 2005; Ferreira, 2013).

3 Determinação de hormônios estrogênicos em esgoto bruto …
Rev. Ambient. Água vol. 13 n. 2, e2059 - Taubaté 2018
As ETEs descentralizadas, atendendo pequenas comunidades ou negócios, podem ser uma
alternativa para a redução da poluição hídrica, porém podem apresentar riscos à qualidade da
água se não forem efetivamente monitoradas. Nos Estados Unidos (USA), a participação das
ETEs descentralizadas no tratamento de esgotos foi estimada em 25% (Stanford e Weinberg,
2010). Apesar da relevância deste modelo de tratamento de esgotos, grande parte das
publicações a respeito da presença e remoção de hormônios estrogênicos foi realizada em ETEs
centralizadas. Uma exceção é o trabalho de Stanford e Weinberg (2010). Estes quantificaram e
avaliaram a remoção dos hormônios estrogênicos em tratamentos descentralizados comumente
utilizados nos USA: tanques sépticos, alagados aeróbios e anaeróbios e filtros de areia. Mesmo
nestes tratamentos de operação mais simplificada, foram obtidas remoções dos hormônios
superiores a 80%.
O objetivo deste trabalho foi quantificar os hormônios estrogênicos naturais, E1, E2 e E3,
e o hormônio artificial EE2, no esgoto e no efluente da ETE descentralizada com operação em
batelada que atende a Escola de Engenharia de Lorena (EEL-USP), além de caracterizar a ETE
quanto ao tempo de detenção hidráulica (TDH), carga orgânica de alimentação e desempenho
na remoção de nitrogênio, visto o impacto destes fatores na remoção dos hormônios
estrogênicos.
2. MATERIAL E MÉTODOS
2.1. Local de estudo
A ETE da EEL-USP utiliza lodos ativados em bateladas sequencias (SBR) para tratar todo
o esgoto gerado no Campus I, em média 85 m3 por dia. O esgoto é proveniente de laboratórios,
sanitários, vestiários, da limpeza de edifícios e da lavagem de utensílios do serviço de
alimentação. Não há moradias no Campus e nem há preparo dos alimentos servidos no
Restaurante Universitário.
A ETE em estudo foi, primeiramente, projetada para operar de forma contínua, porém o
aumento na geração de esgoto, consequência do aumento do número de alunos, fez com que o
regime de operação em bateladas fosse adotado. O modo SBR permitiu utilizar o decantador
secundário também como tanque de reação/aeração, aumentando a capacidade da ETE. A ETE
possui duas particularidades: (i) não possui tratamento preliminar como outras ETEs sanitárias
instaladas na região, que possuem ao menos caixa para a remoção de areia e possuem grades
para a remoção de sólidos grosseiros; (ii) não opera com os tanques de aeração (15 e 25 m3)
alternadamente, dado que possui um tanque pulmão (50 m3) para o recebimento do esgoto
enquanto o processo de depuração biológica ocorre. A ETE opera com tempo de detenção
hidráulica de 02h05 (intervalo de tempo medido entre a finalização do enchimento e início do
descarte) e ciclo total de aeração de 01h20 divididos em baterias de aeração intermitentes (50%
do tempo aerando a cada 5 minutos). Na operação regular da ETE não são controlados os
parâmetros oxigênio dissolvido (OD), idade do lodo e série de sólidos, porém, mesmo com
estas deficiências, a ETE apresenta a eficiência necessária para atendimento das legislações
aplicáveis.
2.2. Caracterização da ETE e do esgoto
Informações sobre o desempenho da ETE na remoção de matéria orgânica, nitrogênio e
fósforo e carga de alimentação foram obtidas pela realização de análises químicas utilizando os
procedimentos descritos em APHA et al. (1998) para a determinação de DBO, DQO, nitrogênio
total Kjeldahl (NTK) e fósforo total.
2.3. Amostragem
Foram realizadas sete campanhas de amostragem entre junho de 2014 e outubro de 2015
em dias de semana e em horário comercial (entre 08 e 18 horas). A cada campanha de
Rev. Ambient. Água vol. 13 n. 2, e2059 - Taubaté 2018
4 Rossana Borges Teixeira et al.
amostragem, foram coletados 3 litros de esgoto na entrada do tanque de aeração e 3 litros de
efluente na linha de descarte.
As coletas foram pontuais, visto a retenção anterior ao tratamento pelo tanque pulmão e a
operação do tratamento em ciclos (batelada) que equaliza os conteúdos.
2.4. Determinação dos hormônios
2.4.1. Reagentes e insumos
Foram utilizados cartuchos de extração em fase sólida (EFS) C18 (500 mg e 3 mL),
metanol e acetonitrila grau HPLC, água ultra-pura produzida em sistema de purificação
Milli-Q, estrona (E1, 99% pureza), 17-β-estradiol (E2, 98% pureza), 17-α-etinilestradiol (EE2,
98% pureza) e estriol (E3, 98% pureza) e filtros em fibra de vidro de 1,2 µm, 0,7 µm e
0,45 µm.
Foram preparadas soluções estoque, 1000 mg L-1, de cada um dos padrões pela pesagem
dos padrões e adição de acetonitrila em balões de 25,00 mL. Estas soluções foram armazenadas
sob refrigeração e ao abrigo da luz.
Soluções de trabalho, 10 mg L-1, contendo os 4 hormônios (E1, E2, E3 e EE2) foram
preparadas a partir das soluções estoque no dia de uso utilizando micropipetador, balão
volumétrico de 10,00 mL e acetonitrila.
2.4.2. Preparo das amostras
As amostras de esgoto (750 mL) e de efluente (1000 mL) foram filtradas a vácuo em filtros
de fibra de vidro de 1,2 µm e depois de 0,7 µm e armazenadas sob refrigeração por no máximo
12 horas. O pH foi corrigido para 3,0 com solução de HCl 0,1 M após atingir a temperatura
ambiente.
Os cartuchos C18 foram colocados no manifold para EFS e condicionados pela aplicação
de 7,00 mL de acetonitrila, 5,00 mL de metanol e 5,00 mL de água ultra-pura sob vácuo.
As amostras foram aplicadas nos cartuchos utilizando vácuo. Após a passagem de todo o
volume de amostras, parte das impurezas foram removidas com a adição de 10,00 mL de
solução 1:10 de metanol em água ultra-pura sem vácuo, os cartuchos foram secos por 10
minutos à vácuo e estocados sob refrigeração e ao abrigo da luz.
Utilizando o manifold de EFS, os cartuchos foram eluídos com 4,00 mL de acetonitrila e
o eluato foi recolhido em balões de 5,00 mL. A eluição foi realizada após os cartuchos terem
sido aclimatados a temperatura ambiente.
O eluato foi avolumado com acetonitrila para 5,00 mL em balão volumétrico e fracionado
em alíquotas de 0,850 mL com o uso de micropipetador em 5 balões de 1,00 mL. A cada um
dos balões foi adicionado uma quantidade predeterminada da solução 10 mg L-1 dos hormônios
e avolumado para 1,00 mL com acetonitrila. O método de adição de padrão ao eluato foi
necessário para minimizar o efeito matriz.
2.4.3. Análise Cromatográfica
As análises cromatográficas foram realizadas em Cromatógrafo Profissional IC
850 Metrohm com detector Profissional UV-VIS 887, utilizando coluna C18 Prontosil
120-5-C18-AQ-150/4.0 mm a 30°C e fase móvel isocrática 50% água ultra-pura e 50%
acetonitrila em fluxo de 1 ml min-1. O volume de injeção foi 90 µL e a detecção foi a 230 nm.
O uso de cromatografia líquida acoplada a detector UV na separação e quantificação dos
hormônios foi à alternativa adotada que possibilitou menores custos operacional e de
implantação e a realização deste trabalho. Para contornar o problema de menor detecção deste
tipo de equipamento, quando comparado a outros tipos de detectores, como os detectores por

5 Determinação de hormônios estrogênicos em esgoto bruto …
Rev. Ambient. Água vol. 13 n. 2, e2059 - Taubaté 2018
fluorescência ou por espectrometria de massa, foram utilizados volumes maiores de amostras
(750 mL de esgoto e 1000 mL de efluente).
Os métodos de preparo da amostra e cromatográfico foram validados previamente por
Teixeira (2016).
3. RESULTADOS E DISCUSSÃO
3.1. Caracterização do esgoto
Ao longo das sete coletas realizadas foi verificado que, em média, o esgoto da EEL/USP
se apresentou menos concentrado em matéria orgânica (DQO e DBO5) e fósforo total que a
média de 166 esgotos recebidos em ETEs municipais instaladas nos estados de Minas Gerais e
São Paulo consolidados por Oliveira e Von Sperling (2011). Por outro lado, a concentração de
nitrogênio total Kjeldahl (NTK) é superior ao relatado para esgotos sanitários. Os resultados
médios destes parâmetros podem ser verificados na Tabela 1.
Os resultados analíticos encontrados (menor concentração de DQO, DBO5 e fósforo e
elevada concentração de nitrogênio), podem ser consequência do perfil do campus (sem
moradia e preparo de refeições) e podem sugerir uma maior participação da urina neste esgoto
em relação aos esgotos municipais avaliados por Oliveira e Von Sperling (2011) e podem
interferir na quantidade dos hormônios estrogênicos visto que estes são descartados
principalmente na urina (D’Ascenzo et al., 2003).
Tabela 1. Comparativo entre o esgoto da EEL/USP e os
resultados médios para alguns parâmetros de
caracterização do esgoto recebidos em ETEs municipais.
Parâmetros Esgoto EEL/USP *Média de 166 ETEs
DBO5 (mg L-1) 123±5 339±135
DQO (mg L-1) 194±92 639±326
Fósforo (mg L-1) 3,1±1,9 3,9±3,0
NTK (mg L-1) 55±30 50±17
*Fonte: Oliveira e Von Sperling (2011).
3.2. Caracterização da ETE EEL/USP
A ETE apresentou bom desempenho na remoção de DQO, entre 65 e 95%, e desempenhos
irregulares para a remoção dos nutrientes: entre -54 e 61% de NTK e entre -18 e 99% de fósforo
total.
As eficiências médias de remoção de DQO e fósforo, obtidas nesse trabalho, estão em
faixas similares às relatadas (81 e 46%, respectivamente) por Oliveira e Von Sperling (2011),
quando avaliado o desempenho de 13 ETEs com tratamento por lodos ativados, em operação
no sudeste brasileiro. Ao passo que, quando avaliado a remoção de nitrogênio total Kjeldahl
(NTK), a média de remoção relatada por Oliveira e Von Sperling (2001) (entre 54 a 61%) é
superior ao do corrente trabalho. Esses autores, porém não detalham a operação das ETEs
avaliadas para que possam ser comparadas ao desempenho da ETE deste trabalho para a
remoção de NTK.
A remoção de nitrogênio pode ser melhorada, com impacto positivo na remoção de
hormônios, com melhor controle nas etapas sequencias (anóxico/aeróbio) e na idade de lodo
(Carballa et al., 2004). Porém, não há na ETE estudada controles que verifiquem o atendimento
a estas condições, medidores de potencial de oxi-redução (POR) e de oxigênio dissolvido (OD),
podendo ser a causa para o desempenho insatisfatório.

Rev. Ambient. Água vol. 13 n. 2, e2059 - Taubaté 2018
6 Rossana Borges Teixeira et al.
3.3. Presença dos hormônios estrogênicos livres no esgoto bruto
As concentrações médias e as frequências de determinação de cada um dos hormônios são
apresentadas na Tabela 2, onde se constata que neste estudo os hormônios E1, E2, E3 e EE2
foram determinados em concentrações superiores aos relatados na literatura consultada,
usualmente na faixa de ng L-1 (Carballa et al., 2004; Janex-Habibi et al., 2009; Fonseca et al.,
2013).
As concentrações de hormônios estrogênicos também foram superiores aos relatados por
Stanford e Weinberg (2010) em 5 diferentes ETEs descentralizadas dos EUA, na faixa de ng
L-1. O esgoto das ETEs avaliadas por estes autores atendiam também escolas, universidades e
escritórios, todos com ocupação em parte do dia.
Tabela 2. Concentrações médias em µg L-1, desvio padrão e
frequência de determinação dos hormônios em esgoto bruto.
E1 E2 E3 EE2
Média (µg L-1) 5,148 7,434 5,200 5,688
Desvio padrão 2,747 4,356 3,331 4,312
Frequência 100% 100% 75% 100%
As concentrações dos hormônios em esgoto determinadas por Ruchiraset e
Chinwetkitvanich (2014), em estudo realizado na Tailândia, também foram determinadas na
faixa de µg L-1, porém com uma menor frequência de detecção. Os picos de concentrações
foram associados a períodos climáticos secos, visto que as amostras sem detecção dos
hormônios foram coletadas em períodos chuvosos, o que mostraria o efeito do aumento da
precipitação pluviométrica como fator de diluição de esgotos sanitários e dos hormônios.
No Brasil, também foram encontradas maiores concentrações dos hormônios em regiões
de seca, o que pode ser exemplificado pelo trabalho de Pessoa et al. (2014), realizado no Ceará,
região seca, que encontrou concentrações máximas dos hormônios estrogênicos entre
0,776 µg L-1 de E2 a 3,180 µg L-1 de EE2. Já as concentrações encontradas de E1 e E2 por
Ferreira (2013) em esgoto do Rio de Janeiro estiveram na faixa de ng L-1. No corrente trabalho,
além das amostras terem sido coletadas em período climático de seca, também foram
provenientes de um campus universitário com reduzido consumo de água e geração de esgoto
(estimado em 47 L pessoa-1 dia-1). Estas considerações reforçam o impacto da diluição, por
chuva e outros consumos de água, na concentração destes compostos.
Concentrações ainda maiores foram relatadas por Kvanli et al. (2008) para os hormônios
em esgoto: até 36,1 µg L-1 de E1, até 40,3 µg L-1 de E2 e abaixo de 20,0 µg L-1 de E3 e de EE2.
Este estudo utilizou urina coletada de grupos de jovens para compor duas amostras de esgoto a
ser aplicado em duas diferentes estações de reciclagem de água em escala de laboratório,
similares às utilizadas em ônibus espaciais. Os autores acreditam que a utilização apenas de
urina, sem outras fontes de água para diluição e a faixa etária dos doadores foram os motivos
para as elevadas concentrações. Isto porque os estrogênios são descartados majoritariamente
pela urina.
Neste trabalho, o elevado teor de NTK nas amostras de esgoto em relação a outros esgotos
municipais, a baixa geração de esgoto per capita e a utilização diferenciada de água no Campus
podem indicar um peso maior da urina no esgoto gerado, de forma semelhante ao estudo de
Kvanli et al. (2008), e deve ser a causa principal da elevada concentração dos hormônios
estrogênicos determinada.

7 Determinação de hormônios estrogênicos em esgoto bruto …
Rev. Ambient. Água vol. 13 n. 2, e2059 - Taubaté 2018
3.4. Presença dos hormônios estrogênicos livres no efluente
Os hormônios estrogênicos foram detectados em concentrações tão elevadas no efluente
quanto as determinadas no esgoto e nas mesmas frequências de detecção, como pode ser
verificado na Tabela 3. A desconjugação às formas livres, a perda dos grupamentos sulfato ou
glicuronídeos com os quais os hormônios estão ligados a serem excretados durante o tratamento
biológico e a remoção insuficiente pelo tratamento são as possíveis causas destes altos valores.
O percurso da rede de esgoto, entre os sanitários e a entrada do tratamento biológico no
campus da EEL/USP, pode ter sido insuficiente para que os hormônios fossem desconjugados
às formas livres. Isso porqueos glucorohormônios excretados na urina são desconjugados às
formas livres dos hormônios ao entrar em contato com os micro-organismos do trato intestinal,
principalmente a E. coli, proveniente das fezes. Por outro lado, os sulfatohormônios, outra
forma dos hormônios excretados na urina, são mais persistentes. O que pode ser verificado pelo
trabalho de D’Ascenzo et al. (2003), no qual foram necessárias 60 horas para a redução dos
sulfatohormônios a 50% da concentração inicial quando em contato com o esgoto e 5 horas
para atingir a mesma redução dos glucorohormônios. Durante o tratamento biológico, os
sulfatohormônios sofreram desconjugação sendo reduzidos a 26% da concentração inicial e os
glucorohormônios foram reduzidos a 2%. Ambas as desconjugações, de glucorohormônios e
de sulfatohormônios, ocorrendo durante o tratamento podem ter produzido hormônios livres
encobrindo parte do que foi removido, visto que as formas conjugadas não foram quantificadas
neste trabalho. Fenômeno semelhante, aumento ou pequena redução dos hormônios livres, foi
identificado no trabalho de Kvanli et al. (2008), no qual os autores associaram a baixa remoção
dos hormônios ao curto tempo entre a coleta da urina para composição do esgoto e a aplicação
nos tratamentos estudados.
Tabela 3. Concentrações médias em µg L-1, desvios-padrão e
frequências de detecção por hormônio no efluente.
E1 E2 E3 EE2
Média 5,062 4,191 7,743 2,550
Desvio padrão 3,365 3,526 3,951 2,162
Frequência 100% 100% 75% 100%
Além da desconjugação durante a etapa biológica, a remoção dos hormônios pode ter sido
insuficiente, haja visto que as condições relacionadas à eficiente biodegradação destes
compostos em tratamento por lodos ativados (idade do lodo) não foram aferidas ou não foram
alcançadas (tempo de detenção hidráulica maior e remoção de nitrogênio) neste trabalho.
Apenas a baixa carga de alimentação foi constatada dentre os fatores que promoveriam a melhor
biodegradação (Johnson et al., 2005; Li et al., 2008; Pessoa et al., 2014).
No estudo de Servos et al. (2005) com 18 ETEs em operação no Canadá, duas destas,
operando com sistema de lodos ativados convencional apresentaram condições semelhantes
entre si de TDH (aproximadamente 7 horas) e remoção de E2 distintas (40 e 76%). A ETE de
melhor remoção de E2, apesar de não operar com elevada idade de lodo, obteve melhor remoção
parcial de nitrogênio (85% contra 45% da ETE que não obteve bom desempenho).
Uma das 17 ETEs utilizadas no estudo de Johnson et al. (2005), Eindhoven (Ei), possuía
sistema de tratamento de lodos ativados com TDH menor do que deste trabalho (1,3 horas).
Porém, apresentou remoção de E1 de 94%, o que pode ser atribuído à existência de zona anóxica
e à elevada idade de lodo (25 dias) condições necessária para a desnitrificação. Boas remoções,
com médias acima de 85% de E1 e de E2, também foram determinadas por Janex-Habibi et al.

Rev. Ambient. Água vol. 13 n. 2, e2059 - Taubaté 2018
8 Rossana Borges Teixeira et al.
(2009) em 9 ETEs por lodos ativados operando na Europa e Estados Unidos. Além do maior
TDH, entre 5 e 30 horas, estas possuíam etapas para remoção biológica de nitrogênio.
A baixa carga orgânica alimentada, similar ou inferior aos valores citados nos estudos de
Carballa et al. (2004) e Ferreira (2013), pode ter sido o fator determinante para a remoção
parcial dos hormônios, E2 e EE2, mesmo em condições adversas de TDH, de desnitrificação e
sem acompanhamento da idade de lodo. Fato que é corroborado pelo trabalho de Li et al. (2008)
que determinaram taxas de biodegradação dos hormônios E1, E2 e EE2 inversamente
proporcionais à concentração de glicose (usada como matéria orgânica) no meio reativo.
Em relação ao hormônio E1, além da desconjugação e da baixa capacidade do tratamento
biológico para a remoção dos hormônios estudados, a conversão por oxidação microbiana de
outros hormônios estrogênicos a E1 pode ser fundamento adicional para as altas concentrações
detectadas no efluente. Carballa et al. (2004) e Servos et al. (2005) também relataram menor
remoção do E1 em relação aos outros hormônios estrogênico ou até o surgimento destes em
meios nos quais não foram inoculados.
4. CONCLUSÕES
O esgoto gerado na EEL-USP e o efluente tratado na estação por lodos ativados em
bateladas sequenciais apresentaram altas concentrações dos hormônios estrogênios
(5,158 ± 2,747; 7,434 ± 4,356; 5,200 ± 3,331 e 5,638 ± 4,312 μg L-1 de E1, E2, E3 e EE2 no
esgoto bruto e 5,062 ± 3,366; 4,191 ± 3,527; 7,743 ± 3,951, 2,550± 2,162 de E1, E2, E3 e EE2
no efluente) e com frequência de detecção próxima a 100%. Ambos os parâmetros diferem da
maioria dos resultados publicados em trabalhos semelhantes que apresentaram concentrações
na faixa de ng L-1.
As características químicas do esgoto avaliado (elevada concentração de NTK e menores
concentrações de matéria orgânica, DBO5 e DQO, e de fósforo em comparação ao esgoto
doméstico) e as particularidades do Campus (sem preparo de refeições, sem moradias e com
geração per capita de esgoto reduzida, 47 L pessoa-1 dia-1) associadas à condição climática nos
períodos de coleta (clima seco) podem indicar uma maior participação da urina no esgoto e,
consequentemente, justificar as elevadas concentrações dos hormônios estrogênicos
determinadas neste trabalho, visto que os hormônios estrogênicos são excretados
principalmente pela urina.
As concentrações dos hormônios estrogênicos no efluente, após o tratamento biológico,
também foram superiores às encontradas na literatura pesquisada. Isto pode ter acontecido
devido às elevadas concentrações de entrada (no esgoto bruto), mas também podem estar
associadas à baixa eficiência de remoção dos hormônios. Em sistemas de lodos ativados, as
melhores eficiências de remoção dos hormônios estrogênicos têm sido relacionadas ao
prolongado TDH, elevada idade do lodo, baixa carga orgânica e caráter desnitrificante do
tratamento. Porém, apenas a baixa carga orgânica foi atingida neste trabalho, a remoção de
nitrogênio foi insatisfatória e inconstante e a idade do lodo não pode ser medida.
Ademais, os hormônios estrogênicos são excretados pelo corpo humano conjugados a
grupamentos sulfatos e glicuronídeos. Grande parte dos grupamentos glicuronídeos pode ser
removida pela ação das bactérias do trato intestinal presentes no esgoto demandando tempo de
contato e de reação, já os grupamentos sulfatos e o glicuronídeos restante podem ser removidos
pelos micro-organismos do lodo ativado durante o tratamento. Visto que a ETE estudada é
interna ao Campus, o esgoto é tratado próximo aos pontos de geração, assim o tempo de trânsito
pode não ter sido suficiente para a remoção dos grupamentos conjugados antes do tratamento.
Desta maneira, os hormônios conjugados não foram quantificados no esgoto bruto, mas
passaram a ser quantificados no efluente se a desconjugação ocorreu durante o tratamento por

9 Determinação de hormônios estrogênicos em esgoto bruto …
Rev. Ambient. Água vol. 13 n. 2, e2059 - Taubaté 2018
lodos ativados, mascarando a remoção dos hormônios livres, que foram os quantificados neste
trabalho.
Recomenda-se que novos estudos sejam realizados no qual se determine também as
concentrações dos hormônios estrogênicos conjugados para que possa ser aferido o impacto da
desconjugação durante o tratamento.
Ademais, a redução nas concentrações dos hormônios no efluente pode ser melhorada com
implantação de condições necessárias para a remoção biológica de nitrogênio, como a adoção
de acompanhamento da idade de lodo e o controle da aeração por ORP.
Deve ser ressaltado que a ETE em estudo, da mesma maneira que outras ETEs com
processo de tratamento convencionais, foi projetada e posteriormente adaptada para reduzir a
carga de poluentes orgânicos e não visava especificamente a remoção de contaminantes
emergentes presentes no esgoto sanitário, como os hormônios estrogênicos. Assim, qualquer
remoção que possa ocorrer desses compostos é eventual e não específica ao processo de
tratamento convencional. Os dados determinados nesse estudo mostram a necessidade de se
rever o modelo de tratamento de esgoto em uso no campus, com vistas de se estabelecer um
novo paradigma para lançamento de seus efluentes na bacia do Rio Paraíba do Sul.
6. REFERÊNCIAS
AMERICAN PUBLIC HEALTH ASSOCIATION – APHA; AMERICAN WATER WORKS
ASSOCIATION – AWWA; WATER ENVIRONMENT FEDERATION – WEF.
Standard methods for the examination of water and wastewater. 20th ed.
Washington, 1998.
CARBALLA, M.; OMIL, F.; LEMA, J.; LLOMPART, M.; GARCÍA-JARES, C.;
RODRÍGUEZ, I. et al. Behavior of pharmaceuticals, cosmetics and hormones in a sewage
treatment plant. Water Research, v. 38, p. 2918–2926, 2004.
https://doi.org/10.1016/j.watres.2004.03.029
D’ASCENZO, G.; DI CORCIA, A.; GENTILI, A.; MANCINI, R.; MASTROPASQUA, R.;
NAZZARI, M.; SAMPERI., R. Fate of natural estrogen conjugates in municipal sewage
transport and treatment facilities. The Science of the Total Environment, v. 302, p. 199–
209, 2003. https://doi.org/10.1016/S0048-9697(02)00342-X
FERREIRA, A. Endocrine disruptors in sludge wastewater treatment plants: environmental
complications. Acta Scientiarum – Technology, v. 35, n. 2, p. 307-316, 2013.
http://dx.doi.org/10.4025/actascitechnol.v35i2.10619
FONSECA, A.; CARDOSO, M.; ESTEVES, V. Determination of Estrogens in Raw and
Treated Wastewater by High-Performance Liquid Chromatography- Ultraviolet
Detection. Journal of Environmental e Analytical Toxicology. v. 4, n. 1, p. 1-5, 2013.
JANEX-HABIBI, M. L.; HUYARD, A.; ESPERANZA, M.; BRUCHET, A. Reduction of
endocrine disruptor emissions in the environment. Water Research, v. 43, p. 1565–1576,
2009. https://doi.org/10.1016/j.watres.2008.12.051
JOHNSON, A. C.; AERNI, H. R.; GERRITSEN, A.; GIBERT, M.; GIGER, W.; HYLLAND,
K. et al. Comparing steroid estrogen, and nonylphenol content across a range of European
sewage plants with different treatment and management practices. Water Research, v.
39, p.47–58, 2005. https://doi.org/10.1016/j.watres.2004.07.025

Rev. Ambient. Água vol. 13 n. 2, e2059 - Taubaté 2018
10 Rossana Borges Teixeira et al.
KVANLI, D. M.; MARISETTY, S.; ANDERSON, T. A.; JACKSON, W. A.; MORSE, A. N.
Monitoring Estrogen Compounds in Wastewater Recycling Systems. Water Air Soil
Pollution, v. 188, p. 31–40, 2008. https://doi.org/10.1007/s11270-007-9498-6
LI, F.; DESMIARTI, R.; YUASA, A.; HORIO, A. Behavior of natural estrogens in
semicontinuous activated sludge biodegradation reactors. Bioresource Technology, v.
99, p. 2964–2971, 2008. https://doi.org/10.1016/j.biortech.2007.06.016
OLIVEIRA, S.; VON SPERLING, M. Performance evaluation of different wastewater
treatment technologies operating in a developing country. Journal of Water, Sanitation
and Hygiene for Development, v. 01, n. 01, p. 37-56, 2011.
http://dx.doi.org/10.2166/washdev.2011.022
PESSOA, G. P.; SOUZA, N. C.; VIDAL, C. B.; ALVES, J. A. C.; FIRMINO, P. I. M.;
NASCIMENTO, R. F. et al. Occurrence and removal of estrogens in Brazilian wastewater
treatment plants. The Science of the total environment, v. 490, p. 288-295, 2014.
https://doi.org/10.1016/j.scitotenv.2014.05.008
RUCHIRASET, A.; CHINWETKITVANICH, S. Occurrence of estrogens in wastewater
treatment tlants and surface water in Bangkok area, Thailand. Advanced Materials
Research, v. 931-932, p. 721-726, 2014.
http://dx.doi.org/10.4028/www.scientific.net/AMR.931-932.721
SERVOS, M. R.; BENNIE, D. T.; BURNISON, B. K.; JURKOVIC, A.; McINNIS, R.;
NEHELI, T. et al. Distribution of estrogens, 17h-estradiol and estrone, in Canadian
municipal wastewater treatment plants. Science of the Total Environment, v. 336, p.
155–170, 2005. https://doi.org/10.1016/j.scitotenv.2004.05.025
STANFORD, B. D.; WEINBERG, H. S. Evaluation of OnSite Wastewater Treatment
Technology to Remove Estrogens, Nonylphenols, and Estrogenic Activity from
Wastewater. Environmental Science & Technology, v. 44, n. 8, p. 2994-3001, 2010.
http://dx.doi.org/10.1021/es903422b
TEIXEIRA, R. B. Estudo da presença e remoção de hormônios estrogênicos em estação de
tratamento de esgoto por lodos ativados. 2016. 85 p. Dissertação (Mestrado em
Ciências) - Escola de Engenharia de Lorena, Universidade de São Paulo, Lorena, 2016.

Ambiente & Água - An Interdisciplinary Journal of Applied Science
ISSN 1980-993X – doi:10.4136/1980-993X
www.ambi-agua.net
E-mail: [email protected]
This is an Open Access article distributed under the terms of the Creative Commons
Attribution License, which permits unrestricted use, distribution, and reproduction in any
medium, provided the original work is properly cited.
Combined use of O3/H2O2 and O3/Mn2+ in flotation of dairy
wastewater
ARTICLES doi:10.4136/ambi-agua.2078
Received: 27 Jan. 2017; Accepted: 21 Jan. 2018
Marta Cristina Silva Carvalho1; Alisson Carraro Borges1*; Magno dos Santos Pereira1;
Fernanda Fernandes Heleno1; Leda Rita D´Antonino Faroni1; Luiza Cintra Campos2
1Universidade Federal de Viçosa (UFV), Viçosa, MG, Brasil
Departamento de Engenharia Agrícola. E-mail: [email protected], [email protected],
[email protected], [email protected], [email protected] 2University College London (UCL), London, United Kingdom
Departament of Civil, Environmental and Geomatic Engineering. E-mail: [email protected] *Corresponding author
ABSTRACT This work investigated the degradation of organic matter present in synthetic dairy
wastewater by the combination of ozonation (ozone (O3)/hydrogen peroxide (H2O2)) and
catalytic ozonation (ozone (O3)/manganese (Mn2+)) associated with dispersed air flotation
process. The effect of independent factors such as O3 concentration, pH and H2O2 and Mn2+
concentration was evaluated. For the flotation/O3/H2O2 treatment, the significant variables
(p ≤ 0.05) were: O3 concentration (linear and quadratic effect), H2O2 concentration linear and
quadratic effect, pH values (linear and quadratic effect) and interaction O3 concentration versus
pH. For catalytic ozonation, it was observed that the significant variable was the linear effect
of O3 concentration. According to the desirability function, it was concluded that the optimal
condition for the treatment of flotation/O3/H2O2 can be obtained in acidic solution using O3
concentrations greater than 42.9 mg L-1 combined with higher concentrations of H2O2 to
1071.5 mg L-1. On other hand, at pH values higher than 9.0, the addition of O3 may be neglected
when using higher concentrations than 1071.5 mg L-1 of H2O2. For flotation/ozonation
catalyzed by Mn2+, it was observed that metal addition did not affect treatment, resulting in an
optimum condition: 53.8 mg L-1 of O3 and pH 3.6.
Keywords: advanced oxidation processes, catalytic ozonation, physico-chemical treatment.
Uso combinado de O3/H2O2 e O3/Mn2+ para flotação de águas
residuárias de laticínio
RESUMO Neste trabalho, estudou-se a degradação da matéria orgânica presente no efluente de
laticínio sintético por ozonização combinada (ozônio (O3)/peróxido de hidrogênio (H2O2)) e a
ozonização catalítica (ozônio (O3)/manganês (Mn2+)) associada com o processo de flotação por
ar disperso para obter o ponto ótimo de tratamento. Foi avaliado o efeito dos fatores
independentes concentração de O3, pH e concentração de H2O2 e Mn2+. Para o tratamento
flotação/O3/H2O2 os parâmetros significativos (p ≤ 0,05) do modelo foram: concentração de O3
(efeito linear e quadrático), concentração de H2O2 (efeito linear e quadrático), valores de pH

Rev. Ambient. Água vol. 13 n. 2, e2078 - Taubaté 2018
2 Marta Cristina Silva Carvalho et al.
(linear e quadrático) e interação concentração de O3 versus pH. Para a ozonização catalítica,
observou-se que houve diferença significativa no tratamento apenas para o efeito linear da
concentração de O3. De acordo com a função de desejabilidade, concluiu-se que a condição
ótima para o tratamento de flotação/O3/H2O2 pode ser obtida em meio ácido utilizando
concentrações de O3 superiores a 42,9 mg L-1 associada com concentrações de H2O2 mais
elevadas que 1071,5 mg L-1. No entanto, em valores de pH maiores do que 9,0, a utilização de
O3 pode ser negligenciada quando se usam concentrações mais elevadas do que 1071,5 mg L-1
de H2O2. Observou-se também que a flotação/ozonização catalisada pela adição do metal Mn2+
não afetou o tratamento, obtendo-se como condição ótima de 53,8 mg L-1 O3 e pH 3,6.
Palavras-chave: ozonização catalítica, processos oxidativos avançados, tratamento físico-químico.
1. INTRODUCTION
Brazil is a major milk-producer, ranking fourth in the world, with the production of 35
billion liters in 2013 (FAO, 2013). The generation of wastewater from dairy products and
derivatives is growing, so the management, recycling and treatment of these effluents have
become a growing concern in Brazil and worldwide (Leal et al., 2006).
In the dairy industry, according to Matos et al. (2011), a relationship of about 1 to 5 can be
observed between volumes of wastewater and milk processed, depending on the final product
and the technological level of the industry. The polluting organic load that these effluents
present is high, and in the case of inappropriate treatment or disposal, major environmental
impacts can be seen in the areas near this type of industry.
Because biological treatment is economically viable, it is one of the most-used options for
the removal of organic matter in dairy effluent. However, the so-called biological reactors may
present some practical limitations. Biodegradation depends on a stable and diverse microbial
population, the interaction between the various microorganisms present in the treatment system,
pH, and temperature, among other factors, which are not always easily controlled. Furthermore,
the long treatment time and space required for the implementation of the treatment plants may
hamper the application of biological processes. Another common problem of this treatment is
the oscillation of organic load in the effluents of dairy products, which may affect the balance
of the microbial community present in the reactor and compromise the efficiency of biological
processes (Villa et al., 2007).
Among physico-chemical treatments, the flotation used as primary treatment can be
highlighted, where the separation of particles present in the effluent occurs through their
adhesion to gas bubbles. The bubble-particle aggregate rises in the aqueous phase, thereby
allowing separation of the particle.
To complement the treatment of dairy effluent, advanced oxidation processes (AOPs) have
been a widely studied alternative because they are less selective, have an electrophilic property,
and the kinetics of the reaction can be controlled. These processes generate hydroxyl radicals
(•OH) that are capable of oxidizing a wide variety of organic compounds into carbon dioxide
(CO2), water (H2O), and inorganic ions (Oliveira and Leão, 2009). The hydroxyl radicals
originate from combinations between oxidants, such as ozone (O3), hydrogen peroxide (H2O2),
and ultraviolet (UV) irradiation, with catalysts, such as metal ions or semiconductors (Glaze et
al.1987 apud Melo et al., 2009).
Among the AOPs, ozone gas has been widely used in water and wastewater treatment. This
gas is able to react with a wide range of organic compounds, mainly due to its high oxidative
potential (E0 = 2.07 V), greater than KMnO4 and Cl2. Under certain conditions,ozone leads to
the formation of hydroxyl radicals (•OH), the oxidation potential of which is even higher

3 Combined use of O3/H2O2 and ...
Rev. Ambient. Água vol. 13 n. 2, e2078 - Taubaté 2018
(E0 = 2.80 V) and tends to be more effective in treating certain recalcitrant compounds
(Mahmoud and Freire, 2007).
The stability of the ozone depends on several factors, especially pH, because hydroxyl ions
initiate the ozone decomposition process (Von Gunten, 2003). In an acidic environment, ozone
will react with compounds that have specific functional groups, such as electrophilic,
nucleophilic, or dipole addition (direct reaction with O3). However, at high pH (basic medium),
ozone decomposes into radicals •OH, which react with organic compounds unselectively.
H2O2 combined with ozone gas is widely used as a good source of radicals •OH, as it is
easily found, highly adaptable to existing ozonation equipment, and has the lowest cost of AOP
systems based on the radical •OH.
Another way to increase the ozonation efficiency is with the use of catalysts. Several
studies have reported the use of several metal salts in ozonation of effluents. Hewes and
Davinson (1972) showed that the effluent ozonation in the presence of Fe2+, Mn2+, Ni2+, and
Co2+ resulted in an increase of total organic carbon removal efficiency compared to
conventional ozonation process (without addition of a catalyst).
This study aimed to determine the optimal conditions for the degradation of organic matter
present in synthetic dairy effluent, using flotation concomitantly with AOPs.
2. MATERIALS AND METHODS
Synthetic dairy wastewater (SDW) was prepared by adding 10.0 mL of Type A
supplemented whole milk to distilled water to make 1.0 L of solution with COD concentrations
close to 2000 mg L-1 (Brião and Tavares, 2007). After preparing the synthetic solution, the
alkalinity of the sample was measured, having an average value of 75.56 mg L-1 CaCO3.
The ozone gas was obtained using an ozone generator (Model O&G 10.0 MRI, Ozone &
Life, São José dos Campos, Brazil). Oxygen used as feedstock was obtained from a hub
installed on the ozone generator body. The concentration of ozone gas in the air that was
injected in the bottle washer during treatment was quantified as recommended by the
International Ozone Association, using the iodometric method by indirect titration (APHA et
al., 2012).
The ozonation was performed at a flow rate of 1.0 L min-1 in a bottle washer with a capacity
of 1.0 L. A porous diffuser was placed inside the bottle close to the bottom from which the gas
was introduced. Based on preliminary analysis, the ozonation period was set at 180 min.
The experimental design used was the central composite rotational design (CCRD),
because this method allows for easier, more economical, and faster analysis of several variables
(factors) with a variety of levels. The CCRD is an evolution of factorial experiments with 2
levels and n factors composed of three parts: Vertex points (complete or fractional factorial),
axial points (α = n1/2; allows tests of significance for quadratic or cubic curvature effects) and
central points (executed with replicas allowing the estimation of the pure error and a lack of fit
test of the model).
The resident concentration divided by the influent concentration or relative concentration
of COD, denoted by COD (C/C0), was used as the dependent variable, applied at the startup of
the batch, determined by the colorimetric method (APHA et al., 2012). The “C” represents the
COD of the samples measured at the end of the treatment and “C0” the COD of the samples at
the start. The C/C0 parameter was chosen for its capacity to represent treatment efficiency and
due to its mathematical advantages during statistical analysis. COD removal (%) = (1 - C/C0) x
100.
The independent variables were the concentration of ozone gas (O3), the concentration of
catalyst (i.e. H2O2 or Mn2+) and the initial pH of SDW.

Rev. Ambient. Água vol. 13 n. 2, e2078 - Taubaté 2018
4 Marta Cristina Silva Carvalho et al.
Tables 1 and 2 present the level values used in the CCRD for the ozonation experiments
with H2O2 and Mn2+, respectively.
Table 1. Values used in the CCRD to three factors, using H2O2 as an
aide to the ozonation.
Variables Units Levels
-α = -1,68 -1 0 +1 α = +1.68
O3 (X1) mg L-1 0.0 10.9 26.9 42.9 53.8
H2O2 (X2) mg L-1 0.0 272.1 673.5 1071.5 1343.6
pH (X3) - 3.6 5.0 7.0 9.0 10.4
Table 2. Values used in the CCRD to three factors, using Mn2+ as
catalyst in the ozonation.
Variables Units Levels
-α = -1,68 -1 0 +1 α = +1.68
O3 (X1) mg L-1 0.0 10.9 26.9 42.9 53.8
Mn2+ (X2) mg L-1 0.0 0.008 0.020 0.032 0.040
pH (X3) - 3.6 5.0 7.0 9.0 10.4
The variation ranges between the lower limit and the top of each independent variable were
assumed based on literature (Assalin et al., 2006; Mahmoud and Freire, 2007) and preliminary
tests.
The hydrogen peroxide solutions were prepared using H2O2 solution with 30% w/w,
[H2O2] = 9.007 mol L-1 and density of 1.1 g mL-1. The manganese source was the monohydrate
manganese sulphate (MnSO4.H2O).
Interference caused by H2O2 in COD analysis was eliminated by determining its
concentration in the sample by the iodometric method and subsequent determination of its COD
according to Equation 1 (Oliveira and Leão, 2009):
CODperoxide = – 4.06x10⁻⁵ [H2O2]2 + 0.4706 [H2O2] (1)
To calculate the main effects of the factor, their interactions on the response variable
(C/C0), as well as to obtain data relating to the analysis of variance (ANOVA), Statistica 10
(StatSoft, Inc., Tulsa, USA) and Minitab 17 (Minitab Inc., State College, PA, USA) software
were used.
3. RESULTS AND DISCUSSION
Tables 3 and 4 present, for H2O2 and Mn2+ respectively, the values of COD removal and
the C/C0 obtained for each trial suggested by the CCRD design.
It was noticed that among all the tests, the best results were in trial number 13 (Tables 3
and 4), where the ozone central points and the catalyst/auxiliary -α were used with -α pH of 3.6,
obtaining close values for the relative concentration of COD (C/C0) independent of the
catalyst/auxiliary used.

5 Combined use of O3/H2O2 and ...
Rev. Ambient. Água vol. 13 n. 2, e2078 - Taubaté 2018
Table 3. Array of values to the concentrations of ozone, H2O2 and
the pH of the samples in the delineation of the CCRD.
Trial O3 H2O2 pH COD Removal (%) (C/C0)
1 10.9 272.1 5.0 62.5 0.37
2 10.9 272.1 9.0 15.2 0.85
3 10.9 1071.5 5.0 65.3 0.35
4 10.9 1071.5 9.0 24.9 0.75
5 42.9 272.1 5.0 59.6 0.40
6 42.9 272.1 9.0 43.3 0.57
7 42.9 1071.5 5.0 62.7 0.37
8 42.9 1071.5 9.0 64.5 0.35
9 0.0 673.5 7.0 6.5 0.93
10 53.8 673.5 7.0 43.9 0.56
11 26.9 0.0 7.0 15.5 0.84
12 26.9 1343.6 7.0 50.5 0.49
13 26.9 673.5 3.6 74.4 0.26
14 26.9 673.5 10.4 23.7 0.76
15 26.9 673.5 7.0 12.4 0.88
16 26.9 673.5 7.0 17.1 0.83
17 26.9 673.5 7.0 12.1 0.88
18 26.9 673.5 7.0 14.6 0.85
19 26.9 673.5 7.0 7.6 0.92
20 26.9 673.5 7.0 13.3 0.87
Table 4. Array of values to the concentrations of ozone, Mn2+
and the pH of the samples in the delineation of the CCRD.
Trial O3 H2O2 pH COD Removal (%) (C/C0)
1 10.9 0.008 5.0 12.9 0.89
2 10.9 0.008 9.0 14.7 0.87
3 10.9 0.032 5.0 4.3 0.98
4 10.9 0.032 9.0 17.9 0.84
5 42.9 0.008 5.0 28.7 0.73
6 42.9 0.008 9.0 39.9 0.61
7 42.9 0.032 5.0 45.9 0.55
8 42.9 0.032 9.0 43.4 0.58
9 0.0 0.020 7.0 0.7 1.00
10 53.8 0.020 7.0 49.0 0.52
11 26.9 0.000 7.0 26.5 0.75
12 26.9 0.040 7.0 26.3 0.75
13 26.9 0.020 3.6 73.9 0.27
14 26.9 0.020 10.4 17.9 0.84
15 26.9 0.020 7.0 33.7 0.68
16 26.9 0.020 7.0 30.3 0.71
17 26.9 0.020 7.0 26.5 0.75
18 26.9 0.020 7.0 30.3 0.71
19 26.9 0.020 7.0 30.1 0.71
20 26.9 0.020 7.0 27.4 0.74

Rev. Ambient. Água vol. 13 n. 2, e2078 - Taubaté 2018
6 Marta Cristina Silva Carvalho et al.
3.1. COD degradation of the synthetic dairy wastewater by the flotation process/ozonation
combined with H2O2
Figure 1 shows the Pareto chart for the regression performed, which presents the statistical
significance of each term of the equation for α levels equal to 5 to 10%.
Figure 1. Pareto chart of the regression performed for COD
degradation in the synthetic dairy effluent, using the
flotation/ozonation combined with H2O2. “L” is the linear
coefficient part of the model and “S” is the square coefficient
part of the model.
As can be seen in Figure 1, just the linear model coefficients for the interaction of H2O2
with ozone and pH was not significant for an α of 5% or 10%, indicating that in the treatment
process the three factors had an significant effect and there was a significant interaction between
ozone and pH at the range of values tested. The removal of the least-significant term (peroxide-
ozone interaction) did not cause changes in the model-fitting. Thus, it was decided to withdraw
these two terms from the modeling (peroxide-ozone interaction and interaction peroxide - pH).
Table 5 shows the coefficients values used to evaluate the quality of the model fits to the
data, also considering the raw data and transformed data (Box-Cox transformation considering
λ = 0.5). The two regressions were significant at the 5% level.
Table 5. Model-fitting results.
Model/Statistic Model with natural response Model with transformed response
R2 (%) 92.14 92.58
R2 adjusted (%) 87.55 88.25
Fcalc/Fcrit (regression) 5.15 7.46
Fcalc/Fcrit (lack of fit) 2.94 3.41
S (standard error of regression) 0.0836 0.0533
Based on the values obtained (Table 5), it was decided to use the transformed response
model. This choice was based on slightly better adjustment values and the fact that the response
(C/C0)0.5 does not allow for obtaining negative values of the dependent variable, which is
physically more suited to the present study.

7 Combined use of O3/H2O2 and ...
Rev. Ambient. Água vol. 13 n. 2, e2078 - Taubaté 2018
Based on data presented in Table 5, the model for the COD removal from the dairy effluent
using flotation and combined ozonation O3/H2O2 was significant, with a 95% confidence level,
because for the regression the Fcalculated is greater than that of Fcricitcal. However, the lack of fit
was also significant (Fcalculated/Fcritical > 1), although ideally Fcalculated should be a smaller value
than the Fcricitcal, i.e. not significant. However, since the averages of the means were very close
and the pure error was very small (0.0003), the model was considered valid for predictive
purposes (Barros Neto et al., 2007). The mean square experimental error was very small; thus,
the significance tests for the lack of fit may be deemed irrelevant (Waszczynsky and Nelsen,
1996).
The regression coefficient (R2) indicates that 92.58% of the variation observed in the data
could be explained by the model (Table 5). According to Barros Neto et al. (2007), R2 measures
the proportion of the total variation of the response that is explained by the model. Thus, the
closer to 1 the R2 value is, the smaller the error and better the model will be. According to these
authors, models with R2 < 0.60 should be used only as trend indicators, never for predictive
purposes.
With the obtained results, it was possible to determine the regression coefficients and to
present the model with variables not coded. The empirical mathematical model, uncoded and
in 2nd order, was found to represent the root of the relative concentration of COD in terms of
ozone concentrations, H2O2, and solution pH with their respective statistical coefficients
(Equation 2).
(C/C0)0.5 = - 1.11900 + 0.01901 [O3] + 0.00040 [H2O2] + 0.45270 [pH] - 0.00017 [O3]
2 - 1.2x10-
5 [H2O2]2 - 0.02535 [pH]2 - 0.00188 [O3] [pH] (2)
Maintaining the pH in the fixed central point (pH 7) and varying the concentrations of
ozone and H2O2, the contour plot for the dependent variable (i.e. COD (C/C0)) is shown in
Figure 2 (A). Figure 2 (B) displays the contour plot, keeping the concentration of H2O2 fixed at
the midpoint (i.e. 673.5 mg L-1) and varying the ozone concentration and the pH of the effluent.
According to Figure 2 (A), in a neutral solution (pH 7) the relative concentration of COD
(C/C0) decreased with increasing concentrations of both ozone and H2O2. This is consistent
with the positive values of the regression coefficients obtained for the O3 and H2O2 (Equation
2).
A)
B)
Figure 2. Contour plot showing the effect of the concentrations of ozone and H2O2
on the relative concentration of COD (C/C0) with central point fixed at pH 7. (A).
Contour plot showing the effect of ozone concentration and pH on the relative
concentration of COD (C/C0), maintaining the fixed H2O2 concentration at the
midpoint (i.e. 673.5 mg L-1) (B).

Rev. Ambient. Água vol. 13 n. 2, e2078 - Taubaté 2018
8 Marta Cristina Silva Carvalho et al.
A similar result was observed in the work of Cortez et al. (2010), when the increase of
H2O2 concentration (200 - 400 mg L-1) - led by the use of combined ozonation (O3/H2O2) with
112 mg L-1 ozone, at pH 7 for 60 min to treat landfill leachate - increased the removal efficiency
of COD by 16%.
By further analyzing the contour plot in Figure 2 (A), it can be seen that using an ozone
concentration of 26.9 mg L-1 (midpoint) to treat the dairy synthetic effluent was more efficient
at lower pH values, independent of the added H2O2 concentration. A similar result was observed
by Torres-Sanchez et al. (2014) using the combination of ozone with Fenton (H2O2/Fe2+) in
acidic solution (pH 3) applied to synthetic dairy effluent. These authors observed a reduction
of up to 30% of COD in the effluent after 25 min of treatment.
On the other hand, the treatment using ozone (26.9 mg L-1) in a basic solution proved to
be advantageous only for the removal of COD at high concentrations of H2O2 and high pH
levels (pH > 9), presenting a quadratic behavior, which indicates a "valley bottom" for H2O2
values close to 500 mg L-1.
It can be seen from Figure 2 (B) that flotation/ozonation combined with H2O2 was favored
under acidic conditions (pH < 5), independent of the concentration of ozone applied. However,
the treatment was effective only at high concentrations of ozone and higher pH. In alkaline
solutions H2O2 becomes more unstable than in acidic solutions (Cavalcante, 2005).
Furthermore, H2O2 standard electrode potential ranges from 1.78 V to 0.87 V when pH changes
from 0 to 14, which makes the treatment of effluents with H2O2 most promising at low pH
values.
It is noteworthy that the only interaction with significant effect was ozone and pH
(Equation 2), presenting a coefficient of -0.002 (negative). Since ozone and pH concentrations
are positive, it appears that the ozonation process is acting indirectly at high pH values and high
concentrations of ozone (via hydroxyl radicals) (Balcioglu and Ötker, 2003).
During the ozonation macro- or microbubbles are formed, so the process of flotation can
also occur if the coagulation/flocculation characteristics of the wastewater favor the adhesion
of the bubbles to the particles/flocs, producing the so-called Ozoflotation process (Edzwald and
Harrhoff, 2012). During the ozoflotation process, part of the organic matter (i.e. suspended
matter) is removed by flotation by a physical treatment and the other part of the organic matter
(i.e. dissolved matter) is removed by the ozone oxidation in a chemical treatment.
For good coagulation, chemistry conditions, and higher flotation efficiencies, it is expected
that the flocs formed have little or no electrical charge, so electrostatic forces are low or near
zero (Edzwald, 2010). According to Quirk and Matusky (1971), casein is the major protein
found in milk (about 80%) and has an average isoelectric point at pH 4.6, so at this pH casein
is found at its point of lowest solubility due to the decrease of intermolecular repulsions.
Therefore, a possible explanation for the acidic solution to have produced the best results
in the removal of COD from the synthetic dairy effluent is that it is due to the natural
coagulation/flocculation of milk proteins in the dairy effluents in an acid medium that favored
the flotation process and enhanced the global treatment efficiency (Puget et al., 2004).
3.2. Degradation of COD in the synthetic dairy wastewater by the flotation
process/ozonation catalyzed by Mn2+
The attempt to fit a full quadratic regression model was not successful due to the lower R2
value of the model that was equal to 42.91% and significance was only observed for the linear
term of the ozone concentration. Thus, it was decided to withdraw most of the terms, concurrent
with the adoption of a changed response by Box-Cox transformation, considering λ = 0.5. In
Figure 3, the Pareto chart corresponding to the regression performed is shown. It is emphasized
that the terms related to variable pH were only considered significant at the 10% level.

9 Combined use of O3/H2O2 and ...
Rev. Ambient. Água vol. 13 n. 2, e2078 - Taubaté 2018
Figure 3. Pareto chart corresponding to the transformed
response (Box-Cox transformation considering λ = 0.5) for
the degradation of COD in synthetic dairy effluent using the
flotation/ozonation catalyzed by Mn2+.
Table 6 shows the results of the model fitting to the observed data.
Table 6. Model fitting results.
Model/Statistics Model Transform Response
R2 (%) 61.08
R2 adjusted (%) 53.78
Fcalc/Fcrit (regression) 2.88
Fcalc/Fcrit (lack of fit) 9.17
S (standard error of regression) 0.0728
For the regression model, the Fcalculated divided by the Fcritical, at 5% of probability, was
higher than 1, so the model was significant. Despite the lack of adjustment showing significance
(Fcalc/Fcrit > 1), the value obtained for the mean square of the pure error was very low (0.0002),
so the model can be considered valid for predictive purposes.
The coefficient of determination obtained (Table 6) showed that only 61.08% of the
observed data could be explained and the model could be used for predictive purposes. (Barros
Neto et al., 2007).
One clearly sees that this fitting model, even after transformation of the response variable,
was inferior to the experiment used for flotation/ozonation combined with H2O2. Another
indication of the low-response modeling was the Fcalc/Fcrit of the regression, equal to 2.88 (Table
6). According to Barros Neto et al. (2007), good model fits have Fcalc/Fcrit greater than or equal
to 4.
Even considering the low value of R2 obtained, it was possible to determine the regression
coefficients and present the model with variables not coded. The empirical mathematical model
was found to represent the root of the relative concentration of COD in terms of ozone
concentrations, H2O2, and solution pH with their respective statistical coefficients, as shown in
Equation 3.

Rev. Ambient. Água vol. 13 n. 2, e2078 - Taubaté 2018
10 Marta Cristina Silva Carvalho et al.
(C/C0)0.5 = 0.409 - 0.005 [O3] + 0.152 [pH] - 0.009 [pH]2 (3)
As seen in Figure 3 and Equation 3, even after the Box-Cox transformation, the
concentration of Mn2+ added to catalyze the treatment of flotation/ozonation was not significant
for the removal of COD. This contradict the work of Assalin et al. (2006), and Mahmoud and
Freire (2007) who found that the addition of Mn2+ in concentrations greater than 0.5 mg L-1 as
a catalyst for ozonation effluent was more efficient in removing total organic carbon (TOC)
compared to conventional ozonation processes.
Assalin et al. (2006) also compared the TOC degradation efficiency by conventional
ozonation process and catalyzed by Mn2+ at a concentration of 1.0 mg L-1 in an acidic solution
(pH 3). The catalytic ozonation enhanced the removal of the organic load increasing from 4%
to 63% efficiency in only seven minutes of ozonation. Also the addition of metals to the
ozonation process increases the formation of hydroxyl radicals according to the complexation
mechanism proposed by Pines and Reckhow (2002), acting as inhibitors of certain anions
(carbonates and bicarbonates) that are capable of interfering with the oxidizing ability of the
hydroxyl radicals.
One explanation for the insignificant effect of the catalyst during the ozonation process
may be the low concentration of Mn2+ used in this experiment (≤ 0.040 mg L-1). According to
Xiao et al. (2012), Mn2+ concentrations greater than 0.05 mg L-1 were effective in aiding ozone
degradation of compounds that are difficult to degrade. On the other hand, the same authors
found that concentrations greater than 0.1 mg L-1 showed no significant increase in efficiency.
Figure 4 shows the variation of the relative concentrations (C/C0) of COD with pH and
concentration of ozone gas.
Figure 4. Contour plot showing the effect of ozone
concentration and pH on the relative concentration of
COD (C/C0).
It is observed in Figure 4 that the increased ozone concentration positively influenced the
removal of organic matter of the SDW, indicating the action of the ozone as an oxidant
(chemical treatment) in the ozoflotation process.
Independent of the concentration of Mn2+ used in the experiment, it was observed that the
best efficiencies for degradation of COD in the wastewater were achieved under acidic
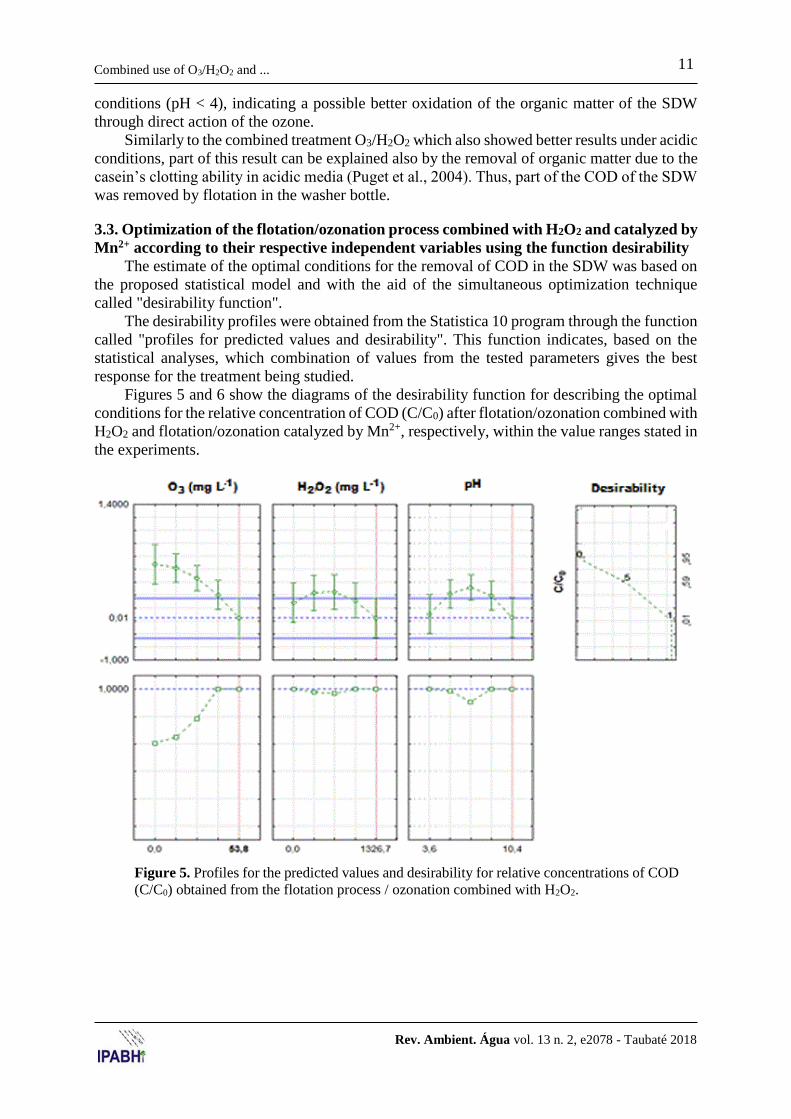
11 Combined use of O3/H2O2 and ...
Rev. Ambient. Água vol. 13 n. 2, e2078 - Taubaté 2018
conditions (pH < 4), indicating a possible better oxidation of the organic matter of the SDW
through direct action of the ozone.
Similarly to the combined treatment O3/H2O2 which also showed better results under acidic
conditions, part of this result can be explained also by the removal of organic matter due to the
casein’s clotting ability in acidic media (Puget et al., 2004). Thus, part of the COD of the SDW
was removed by flotation in the washer bottle.
3.3. Optimization of the flotation/ozonation process combined with H2O2 and catalyzed by
Mn2+ according to their respective independent variables using the function desirability
The estimate of the optimal conditions for the removal of COD in the SDW was based on
the proposed statistical model and with the aid of the simultaneous optimization technique
called "desirability function".
The desirability profiles were obtained from the Statistica 10 program through the function
called "profiles for predicted values and desirability". This function indicates, based on the
statistical analyses, which combination of values from the tested parameters gives the best
response for the treatment being studied.
Figures 5 and 6 show the diagrams of the desirability function for describing the optimal
conditions for the relative concentration of COD (C/C0) after flotation/ozonation combined with
H2O2 and flotation/ozonation catalyzed by Mn2+, respectively, within the value ranges stated in
the experiments.
Figure 5. Profiles for the predicted values and desirability for relative concentrations of COD
(C/C0) obtained from the flotation process / ozonation combined with H2O2.

Rev. Ambient. Água vol. 13 n. 2, e2078 - Taubaté 2018
12 Marta Cristina Silva Carvalho et al.
Figure 6. Profiles for desirability and predicted values for COD relative concentration (C/C0)
obtained from the flotation/ozonation process catalyzed by Mn2+.
Considering the confidence limit for the optimum value, the most desirable values for the
three factors of interest are shown in Figure 6. The profile located on the right shows the range
of the desirability response (0 < D < 1). The larger the “D” value, the more convenient the
system response is; i.e., the maximum value of D is the optimal condition of the system.
For the second group, the dashed blue line presents optimum values where trends are
revealed only by the factors (Figures 5 and 6). The vertical dotted lines present in the graphic
corresponding to the optimum values of the parameters studied.
The concentration of ozone (Figure 5) required to achieve the ideal desirability response
(D = 1.0) should be greater than 42.9 mg L-1 with H2O2 concentration exceeding
1071.5 mg L-1 for a high pH values of the synthetic dairy effluent (pH > 9.0).
For flotation/ozonation catalyzed by Mn2+, the desirability graph (Figure 6) suggests
optimum values using 53.8 mg L-1 O3 with any concentration of Mn2+ (0 to 0.04 mg L-1) at pH
3.6 to give better removal efficiency of COD (D = 0.6876).
Tables 7 and 8 were obtained making use of the desirability function, where possible
solutions are presented based on optimal points found for processes of flotation/ozonation
combined with H2O2 and catalyzed by Mn2+, respectively.
Table 7. Examples of independent variables values that resulted
in a great desirability for the process of flotation/ozonation
combined with H2O2.
Solution O3 - mg L-1 H2O2 - mg L-1 pH Desirability - D
1 6.4 1343.6 3.6 1.00
2 0.5 1326.4 3.8 0.99
3 53.8 1343.6 10.4 0.98

13 Combined use of O3/H2O2 and ...
Rev. Ambient. Água vol. 13 n. 2, e2078 - Taubaté 2018
Table 8. Example of independent variable
values that resulted in an ideal desirability for the
flotation process/ozonation catalyzed by Mn2+.
Solution O3 - mg L-1 pH Desirability - D
1 53.8 3.6 0.69
It can be seen in Table 7 that there was no need for the addition of ozone in strongly acidic
medium (Solutions 1 and 2). However, the treatment should consist of flotation combined with
high ozone concentration to achieve COD removal desirable in a basic medium (Solution 3).
In the process of flotation/ozonation catalyzed by Mn2+ (Table 8), manganese had no
significant effect on the removal of the COD of the effluent, confirming the results above.
Therefore, the desirability function presents a solution for obtaining a maximum desirability for
the case where the optimum point would be at high ozone concentrations and acidic conditions.
Thus, it is suggested that further experiments be conducted to evaluate the optimal conditions
of treatment to the operational and economic feasibility of the process.
4. CONCLUSIONS
For the process of flotation/ozonation combined with H2O2, the optimal treatment point
was found to be for high concentrations of O3 (more than 42.9 mg L-1) and H2O2 (greater than
1071.5 mg L-1) in acidic solutions. However, in basic solutions (pH > 5.0) the addition of ozone
gas can be neglected.
In the process of flotation/ozonation catalyzed by Mn2+, the addition of metal Mn2+ was
not efficient, so the maximum removal efficiency of COD was obtained using concentrations
of O3 equal to 53.8 mg L-1 in an acidic solution (pH 3.6), independent of the concentration of
Mn2+ used.
In general, the best COD removal efficiencies were obtained by the process of
flotation/ozonation combined with H2O2 compared to the process of flotation/ozonation
catalyzed by Mn2+ for the synthetic dairy effluent. An acidic environment was more efficient
for both processes (O3/H2O2 and O3/Mn2+), due to the organic load removal of the synthetic
effluent, by the precipitation of milk casein which was subsequently removed by flotation in
the bottle gas scrubber.
5. REFERENCES
AMERICAN PUBLIC HEALTH ASSOCIATION – APHA; AMERICAN WATER WORKS
ASSOCIATION – AWWA; WATER ENVIRONMENT FEDERATION – WEF.
Standard methods for the examination of water and wastewater. 22nd ed.
Washington, 2012. 1496p.
ASSALIN, M. R.; SILVA, P. L.; DURAN, N. Comparação da eficiência do processo de
ozonização e ozonização catalítica (Mn II e Cu II) na degradação de fenol. Química
Nova, v. 29, p. 24-27, 2006. http://dx.doi.org/10.1590/S0100-40422006000100006
BARROS NETO, B. de; SCARMINIO, I. S.; BRUNS, R. E. Como fazer experimentos:
pesquisa e desenvolvimento na ciência e na indústria. 3. ed. Campinas: UNICAMP, 2007.
480 p.
BRIÃO, V. B.; TAVARES, C. R. G. Effluent generation by the dairy industry: preventive
attitudes and opportunities. Brazilian Journal of Chemical Engineering, v. 24, n. 4, p.
487-497, 2007. http://dx.doi.org/10.1590/S0104-6632200700040000

Rev. Ambient. Água vol. 13 n. 2, e2078 - Taubaté 2018
14 Marta Cristina Silva Carvalho et al.
BALCIOGLU, I. A.; ÖTKER, M. Treatment of Pharmaceutical wastewater containing
antibiotics by O3 and O3/H2O2 processes. Chemosphere, v. 50, n. 1, p. 85-95, 2003.
https://doi.org/10.1016/S0045-6535(02)00534-9
CAVALCANTE, A. M. Técnicas oxidativas para a remoção de matéria orgânica de uma
corrente de soda exausta de refinaria de petróleo. 2005. 127f. Dissertação (Mestrado)
- Universidade Federal do Rio de Janeiro, 2005.
CORTEZ, S.; TEIXEIRA, P.; OLIVEIRA, R.; MOTA, M. Ozonation as polishing treatment of
mature landfill leachate. Journal of Hazardous Materials, v. 182, n. 1-3,p. 730-734,
2010. https://doi.org/10.1016/j.jhazmat.2010.06.095
EDZWALD, J. K. Dissolved air flotation and me. Water Research, v. 44, p. 2077-2100, 2010.
https://doi.org/10.1016/j.watres.2009.12.040
EDZWALD, J. K.; HARRHOFF, J. Dissolved air flotation for water clarification. New
York: Mac Graw Hill, 2012. p. 182.
FOOD AND AGRICULTURE ORGANIZATION - FAO. Faostat. Rome, 2013.
HEWES, C. G.; DAVISON, R. R. Renovation of wastewater by ozonation. Water AIChE
Symposium Series, v. 129, p. 71-80, 1972.
LEAL, M. C. M. R.; FREIRE, D. M. G.; CAMMAROTA, M. C.; SANT’ANNA Jr., G. L.
Effect of enzymatic hydrolysis on anaerobic treatment of dairy wastewater. Process
Biochemistry, v. 41, n. 5, p. 1173–1178, 2006.
https://doi.org/10.1016/j.procbio.2005.12.014
MAHMOUD, A.; FREIRE, R. S. Métodos emergentes para aumentar a eficiência do ozônio no
tratamento de águas contaminadas. Química Nova, v. 30, n. 1, p. 198-205, 2007.
https://doi.org/10.1590/S0100-40422007000100032
MATOS, A. T.; ABRAHAO, S. S.; PEREIRA, O. G. Desempenho agronômico de capim-napier
(Pennisetum purpureum) cultivado em sistemas alagados construídos. Engenharia na
Agricultura, v. 19, n. 5, 2011.http://www.locus.ufv.br/handle/123456789/15663
MELO, S. A. S.; TROVO, A. G.; BAUTITZ, I. R.; NOGUEIRA, R. F. P. Degradação de
fármacos residuais por processos oxidativos avançados. Química Nova, v. 32, n. 1, p.
188-197, 2009. http://dx.doi.org/10.1590/S0100-40422009000100034
OLIVEIRA, D. M. E.; LEÃO, M. M. D. Avaliação da biodegradabilidade de efluentes têxteis
do beneficiamento secundário de malhas de poliéster tratados com reagente de fenton.
Química Nova, v. 32, n. 9, p. 2282-2286, 2009. https://doi.org/10.1590/S0100-
40422009000900008
PINES, D. S.; RECKHOW, D. A. Effect of dissolved cobalt (II) on the ozonation of oxalic acid.
Environmental Science Technology, v. 36, n. 19, p. 4046-4051, 2002.
https://doi.org/10.1590/S0100-40422009000900008
PUGET, F. P.; MELO, M. V.; MASSARANI, G. Modelling of the dispersed air flotation
process applied to dairy wastewater treatment. Brazilian Journal of Chemical
Engineering, v. 21, n. 02, p. 229-237, 2004. http://dx.doi.org/10.1590/S0104-
66322004000200012
QUIRK, L.; MATUSKY, D. Packed tower trickling filtration for whey effluent. Washington
DC: US Printing Office, 1971. 179p.
15 Combined use of O3/H2O2 and ...
Rev. Ambient. Água vol. 13 n. 2, e2078 - Taubaté 2018
TORRES-SÁNCHEZ, A. L.; LÓPEZ-CERVERA, S. J.; LA ROSA, C.; VEGA, M. M.;
SANTOYO, M. M.; HERNANDEZ, J. M. P. Electrocoagulation process coupled with
advanced oxidation techniques to treatment of dairy industry wastewater. International
Journal of Electrochemical Science, v. 9, n. 7, p. 6103–6112, 2014.
VILLA, R. D.; SILVA, M. R. A.; NOGUEIRA, R. F. P. Potencial de aplicação do processo
foto-fenton/solar como pré-tratamento de efluente da indústria de laticínios. Química
Nova, v. 30, n. 8, p. 1799-1803, 2007. http://dx.doi.org/10.1590/S0100-
40422007000800002
VON GUNTEN, U. Ozonation of drinking water: Part I. Oxidation kinetics and product
formation. Water Research, v. 37, n. 7, p. 1443-1467, 2003. https://doi.org/10.1016/S0043-
1354(02)00457-8
XIAO, D.; LIU, G. B.; FENG, W.; XU, X.; YAO, W. Coupled spin and valley physics in
monolayers of MoS 2 and other group-VI dichalcogenides. Physical Review Letters, v.
108, n. 19, p. 196802, 2012. https://doi.org/10.1103/PhysRevLett.108.196802
WASZCZYNSKYJ, K.; NELSEN, T. Collaborative study on sensory and volatile compound
analysis of oils. Journal of the American Oil Chemists Society, v. 73, n. 2, p. 157-166,
1996.

Ambiente & Água - An Interdisciplinary Journal of Applied Science
ISSN 1980-993X – doi:10.4136/1980-993X
www.ambi-agua.net
E-mail: [email protected]
This is an Open Access article distributed under the terms of the Creative Commons
Attribution License, which permits unrestricted use, distribution, and reproduction in any
medium, provided the original work is properly cited.
Assessment of a subtropical riparian forest focusing on botanical,
meteorological, ecological characterization and chemical analysis of
rainwater
ARTICLES doi:10.4136/ambi-agua.2140
Received: 01 Jun. 2017; Accepted: 05 Jan. 2018
Vanessa Graeff; Ivi Galetto Mottin; Ledyane Rocha-Uriartt;
Daniela Montanari Migliavacca Osório*; Jairo Lizandro Schmitt
Universidade FEEVALE (FEEVALE), Novo Hamburgo, RS, Brasil
Programa de Pós-Graduação em Qualidade Ambiental (PPGQA)
E-mail: [email protected], [email protected], [email protected],
[email protected], [email protected] *Corresponding author
ABSTRACT Riparian forests are heterogeneous environments, in which epiphytes find ideal conditions
to develop. These plants absorb the necessary nutrients for survival from the atmosphere, and
their occurrence and distribution can be influenced by the quality and quantity of precipitation.
The objective of this research was to perform an integrated analysis of botanical, meteorological
and chemical precipitation parameters so as to compare them in fragments of the riparian forest
in the lower (São Leopoldo-SL) and upper (Caraá-CA) stretches of the Rio dos Sinos
Hydrographic Basin (RSHB), RS, Brazil. Rainwater was chemically analyzed, the community
structure of epiphytic ferns was surveyed and the ecological characterization was evaluated
through the Rapid Habitat Assessment Protocol (RHAP). The results showed that the chemical
composition of rainwater is influenced by the environment of each area. In the upper stretch
(CA), for instance, the main contribution is that of marine ions, while in the lower stretch (SL),
the most impacting aspects are urbanization and industrialization. Similarly, the results depict
a reduction of richness and a simplification of the community structure of epiphytic ferns and
their environmental quality according to the RHAP categories, towards the base level of the
RSHB. The integrated analysis, in which different methods were applied, proved to be an
efficient tool to evaluate environmental quality. This analysis considers that a greater number
of biotic and abiotic variables may be applied in different scenarios.
Keywords: ecological characterization, environmental analysis, epiphytic ferns, rainwater.
Análise integrada de mata ciliar subtropical focando parâmetros
botânicos, meteorológicos e químicos da precipitação
RESUMO Matas ciliares são ambientes heterogêneos, no qual, epífitos encontram condições ideais
para se desenvolverem. Essas plantas, retiram da atmosfera os nutrientes necessários à
sobrevivência, podendo ter sua ocorrência e distribuição influenciada pela qualidade e
quantidade das precipitações. O objetivo foi realizar uma análise integrada de parâmetros

Rev. Ambient. Água vol. 13 n. 2, e2140 - Taubaté 2018
2 Vanessa Graeff et al.
botânicos, meteorológicos e químicos da precipitação, a fim de compará-los em fragmentos de
mata ciliar, nos trechos inferior (São Leopoldo-SL) e superior (Caraá-CA) da Bacia
Hidrográfica do Rio dos Sinos (BHRS), RS Brasil. Para tal, foram realizadas análises químicas
da água de chuva, analisada a estrutura comunitária das samambaias epifíticas e, avaliada a
caracterização ecológica, através do Protocolo de Avaliação Rápida de Hábitats (PARH). Os
resultados demonstraram que a composição química da água de chuva é influenciada pelo
entorno de cada local estudado, sendo que do terço superior (CA), a maior contribuição é de
íons de origem marinha, enquanto que, no trecho inferior (SL), a mesma é oriunda da
urbanização e industrialização. Da mesma forma, ficou evidenciada a redução da riqueza e
simplificação da estrutura comunitária de samambaias epifíticas e de sua qualidade ambiental
de acordo com as categorias do PARH, em direção à foz da BHRS. A análise integrada
aplicando diferentes métodos foi uma ferramenta eficiente para avaliar a sua qualidade
ambiental, pois permite integrar um maior número de variáveis bióticas e abióticas, podendo
ser aplicada em diferentes cenários.
Palavras-chave: água de chuva, análise ambiental, caracterização ecológica, samambaias epifíticas.
1. INTRODUCTION
Riparian forests are formations found along waterways (Mueller, 1996), characterized by
high-environmental heterogeneity due to the physical and biological interactions in these
environments (Rodrigues and Nave, 2000). One of its main functions is to protect the lotic
environment and local biodiversity (Gregory et al., 1992). Despite being extremely important
and being protected by specific legislation (Brasil, 2012), these environments suffer from
fragmentation and edge effects, which end up increasing erosion; consequently, losing a
biologically active soil layer, suffering silting and flooding, and to an invaluable loss of
biodiversity (Joly et al., 2000).
Rainfall is one of the main processes for the removal of pollutants and chemical
compounds from the atmosphere. The natural process of wet deposition results from the
combination of chemical compounds and particles, which are removed by droplets or cloud
droplets incorporated during precipitation (Seinfeld and Pandis, 2006; Souza et al. 2006;
Herrera et al., 2009; Migliavacca et al., 2012). Therefore, rainwater reflects characteristics of
the content of soluble gases and the particles of the atmosphere itself (Xiao et al., 2013; Wu et
al., 2016).
Epiphytism is a harmonic interaction between two species, in which the epiphyte uses the
host plant only as a carrier, removing the nutrients that are necessary for survival (Benzing,
1990). Epiphytes are good indicators of the environmental quality and their monitoring allows
researchers to evaluate the effects of forest disturbance, since epiphytic richness has an inverse
relation to environmental degradation (Engwald et al., 2000; Barthlott et al., 2001; Rocha-
Uriartt et al., 2015). Ferns, which add to 29% of the species, constitute the second group of
vascular plants in terms of epiphytic diversity (Kress, 1986). Thus, they absorb humidity from
the air (Benzing, 1990), and may have their occurrence and distribution influenced by the
quality and quantity of precipitations.
The Rio dos Sinos Hydrographic Basin (RSHB) is located in the lower northeast of the
state of Rio Grande do Sul, southern Brazil. It covers an area of 3,820 km², in which 32
municipalities are distributed, with a population of approximately 1,343.558 inhabitants. Of
this total, 94% are residents of urban areas, while only 6% reside in rural areas (IBGE, 2015).
Its main watercourse is Rio dos Sinos, with its source in the municipality of Caraá, which has
rural surroundings and it is less impacted. Rio dos Sinos is divided into upper, middle and lower
stretches, transcending an urban-industrial matrix at its mouth, near the Jacuí delta

3 Assessment of a subtropical riparian forest …
Rev. Ambient. Água vol. 13 n. 2, e2140 - Taubaté 2018
(PROSINOS, 2014). Kieling-Rubio et al. (2015) and Rocha-Uriartt et al. (2016) surveyed the
environmental scenario of this basin, integrating botanical, meteorological and air genotoxicity
parameters, based on which they demonstrated the existence of a decreasing gradient of
environmental quality from the source to the mouth of Rio dos Sinos.
The objectives of the present study were: I) to evaluate the chemical composition of
rainwater in a fragment of riparian forest of the lower stretch of Rio dos Sinos – one of the most
important and impacted rivers of Rio Grande do Sul, Brazil; II) to determine the richness,
composition and community structure of the epiphytic ferns in the same area; III) to perform
ecological characterization in the same environment and IV) to compare the data obtained in I,
II and III with the results obtained in the upper stretch of the river.
2. MATERIALS AND METHODS
2.1. Study area
The present study was carried out in a riparian forest fragment, in the lower stretch of the
Rio dos Sinos, Rio Grande do Sul, Brazil. The Imperatriz Leopoldina Park (29°45’651’’ S
051°07’928’’ O, alt. 26 m), where the study area is located, is a Permanent Preservation Area
(PPA) of 174 hectares inserted in the municipality of São Leopoldo and is one of the last
remnant areas of urban vegetation. The vegetation in the area is altered by antropic action and
irregular deposits of residues and, it is frequently inundated during periods of flood of Rio dos
Sinos (São Leopoldo, 2016).
The lower stretch of the RSHB is considered a floodplain, with typical vegetation of plains.
It presents smooth slopes, typical of lowland rivers, with the formation of meanders and zones
of sedimentation. It is also the most anthropogenic stretch of the basin, with a great
concentration of population and industries, and with frequent occurrence of erosion processes,
deforestation, soil and water pollution (FEPAM, 2016).
The climate of the region is classified as Cfa, humid subtropical (C), with no dry season
(f), and with average annual temperature of the hottest month exceeding 22°C (a), according to
Köppen (Peel et al., 2007).
2.2. Rainwater
During the year (Sep/2013 to Aug/2014) rainwater was monitored in the study area and in
the region of the source of the Rio dos Sinos. A rainwater collector was installed externally to
the rainforest fragment of the Imperatriz Leopoldina Park, and the monthly precipitation data
were obtained from meteorological bulletins provided by the automatic meteorological station
- Cristo Rei Station (29°46’54.72” S; 51°09’11.93” O 33 m altitude). For comparison purposes,
in the municipality of Caraá, near the source of the Rio dos Sinos, a mobile weather station
(Davis Vantage PRO 2 VP USB NS) and another rainwater collector
(29°44’15.88’’ S; 50°21’34.52’’ O 375 m altitude) were installed.
Rainwater samples were collected every 15 days, according to the methodology proposed
by Migliavacca et al. (2005a). The collectors were always open, both in rainy and dry periods,
to sample the atmospheric components of wet (rainfall) and dry deposition (dispersed gases and
suspended particles) (Campos et al., 1998). The collectors consisted of a 21.5 cm diameter
polyethylene funnel, 2 m away from the ground and covered with nylon mesh to prevent the
entry of leaves and insects. The funnel was coupled to a 5 L collection vial and affixed to a
metal rod.
After collection, the samples were sent to the laboratory of the Analytical Center of Feevale
University for the chemical analyzes. In the unfiltered samples, pH was checked by using a
digital pHmeter (Digimed DM-20, precision ± 0.01) and conductivity was surveyed by using a
conductivity meter (Quimis Q795M2, precision ± 0.01), both previously calibrated. For
Rev. Ambient. Água vol. 13 n. 2, e2140 - Taubaté 2018
4 Vanessa Graeff et al.
alkalinity, the analysis was performed according to APHA (2012). Subsequently, two aliquots,
approximately 100 mL, were filtered through a cellulose ester membrane (0.22 μm pore and
47 mm diameter). In order to determinate major ions, the samples were preserved with
chloroform and for the determination of metals, preserved with Supra Pure HNO3 (MERCK)
up to pH <2. Subsequently, these samples were stored at 4ºC, up to a maximum of 30 days, for
chemical analysis.
The major ions were determined by ion chromatography (Dionex ICS 5000 with electrical
conductivity detector). The Dionex IonPac ™ AS9-HC and CS12A columns were used for
analyzing the anions (Cl-, NO3- and SO4
2-) and cations (Na+, Ca2+, Mg2+, K+ and NH4+),
respectively. The limits of detection were: 0.01 mg L-1 for Cl-; 0.05 mg L-1 for NO3-, SO4
2-,
Na+, NH4+, K+ and Ca2+ and Mg2+.
The analysis of metals (Al, Pb, Cd, Cu, Cr, Fe, Mn) was performed by using the Atomic
Flame Absorption Spectrometry method (SpectrAA 110, VARIAN). All of the calibration
solutions were prepared by dilutions in ultrapure water of Titrisol (Merck) standards of each
metal. Detection limits were 0.0005 μg L-1 for Al; 0.12 μg L-1 for Cd; 0.80 μg L-1 for
Pb; 0.10 μg L-1 for Cu; 0.11 μg L-1 for Cr; 5.7 μg L-1 for Fe; 0.15 μg L-1 for Ni and 5.8 μg L-1 to
Zn.
The data of the accumulated precipitation and chemical composition of rainwater were
submitted to the Shapiro-Wilk normality test. The pH, Na+ and Ca2+ and accumulated
precipitation met the normality assumption. The t-test was used for comparison purposes.
Further data did not meet normality, being compared by the Mann-Whitney test. These analyzes
were conducted using PAST software.
The Enrichment Factor (EF) can be used to estimate the main sources of chemical
components present in rainwater (Song and Gao, 2009). In the present study, two EF were used
to estimate anthropic, marine and terrestrial crust sources. The Enrichment Factor for marine
origin (EFm) (Equation 1) was used as the reference ion Na+ and the marine ratio (Xi/Na+)
according to Akkoyunlu and Tayan (2003). For the Earth's Crust Enrichment Factor (EFc)
(Equation 2) Al and the ratio (Xi/Al) were used as the reference ion, according to Taylor and
McLennan (1995). The EF were calculated according to the equations below, where X is the
concentration of the reference ion and Xi is the concentration of the ions of interest:
𝐸𝐹𝑚 =(𝑋
𝑁𝑎+⁄ )𝑠𝑎𝑚𝑝𝑙𝑒
(𝑋𝑁𝑎+⁄ )𝑚𝑎𝑟𝑖𝑛𝑒
(1)
𝐸𝐹𝑐 = (𝑋
𝐴𝑙⁄ )𝑠𝑎𝑚𝑝𝑙𝑒
(𝑋𝐴𝑙⁄ )𝑚𝑎𝑟𝑖𝑛𝑒
(2)
EF was interpreted using a scale according to Poissant et al. (1994) in which EF from 1 to
10 indicate marine or terrestrial crust contribution, consequently a low EF; EF> 10 to 500
moderate enrichment and over 500, extreme enrichments.
2.3. Floristic inventory and community structure
Throughout the riparian vegetation, a continuous transect of 800 meters, parallel to the
course of the river was traced. An arboreal individual was selected at every 20 m, totaling 40
sample units in the fragment. These were divided into five ecological zones based on height (1
base, 2 low shaft, 3 high shaft, 4 inner cup, and 5 external cup).
For the inventory of the epiphytic ferns, monthly visits were carried out for one year.
Representative and fertile specimens were collected and herborized according to Windisch
(1992). The classification of epiphytic ferns followed the system proposed by Schuettpelz et al.
(2016) and the validity of scientific names was verified in the List of Species of the Brazilian

5 Assessment of a subtropical riparian forest …
Rev. Ambient. Água vol. 13 n. 2, e2140 - Taubaté 2018
Flora (Prado and Sylvestre, 2016). Sample specimens were deposited in the Herbarium
Anchieta (PACA), from the Anchietano Institute of Research (UNISINOS).
For the community structure, coverage notes (1, 3, 5, 7 and 10) were given for each species
according to size and abundance in the area of occurrence (Kersten and Waechter 2011). The
epiphytic importance value (IVs) was obtained from the arithmetic mean of the sum of the
relative frequencies in the phorophytes, in the zones and the relative coverage.
The floristic composition and the community structure of the present study were compared
to the inventory performed by Becker et al. (2014), in a riparian forest, in the source of the Rio
dos Sinos, in the municipality of Caraá, upper stretch of the basin.
2.4. Rapid Habitat Assessment Protocol
The rapid habitat assessment protocol (RHAP) was applied in the study area. The protocol
was adapted from the Environmental Protection Agency (USEPA, 1987), Barbour et al. (1999)
and Callisto et al. (2002). Sixteen parameters were analyzed based on visual observations:
1. Type of occupation of the margins; 2. Erosion on the banks and silting of the river;
3. Anthropogenic alterations; 4. Vegetation cover on the river channel; 5. Water odor and
sediment; 6. Water and sediment oils; 7. Water transparency; 8. Type of background
(composition); 9. Type of bed (diversification); 10. Extension and frequency of rapids; 11. Type
of substrate; 12. Sedimentary deposits; 13. Changes in the river channel; 14. Water flow
characteristics; 15. Stability of the margins; 16. Extension of riparian forest. After applying the
protocol, the sum of points of each parameter was performed, which were converted into the
scale proposed by Callisto et al. (2002) in which the obtained values represent: from 0 to 40
points - impacted stretch; from 41 to 60 points - altered stretch; from 61 to 100 points - natural
stretch.
The rapid habitat assessment protocol (RHAP) of the present study was compared to the
study by Rocha-Uriartt et al. (2015), which was undertaken also along the riparian forest of Rio
dos Sinos.
3. RESULTS AND DISCUSSION
3.1. Rainwater
The accumulated precipitation was 1842.2 mm e 2548.2 mm in São Leopoldo and in Caraá,
respectively, and there was no significant difference during the evaluated period
(t=1.81, p>0.05) (Table 1). However, Rocha-Uriartt et al. (2015) showed that, when the
precipitation is monitored over a longer period, precipitation tends to be significantly higher in
the Rio dos Sinos source region than in the lower stretch of the basin.
The cumulative monthly precipitation was equivalent in the month of Sep/2014 in the two
areas (124.6 mm and 122.7 mm, respectively). The minimum precipitation in São Leopoldo
occurred in March 2014 (95.5 mm) and Caraá in October 2013 (94.0 mm). During February
2014, the highest precipitation was recorded in São Leopoldo (253.3 mm), and in Caraá this
occurred in June 2014 (420.4 mm) (Figure 1). Rocha-Uriartt et al. (2015) recorded, in Caraá,
twice the maximum value of accumulated monthly precipitation in relation to the lower stretch
(Caraá: 698.8 mm and Campo Bom: 370.3 mm).

5
1
1
1
1
Vanessa Graeff et al. 6
Rev. Ambient. Água vol. 13 n. 2, e2140 - Taubaté 2018
Table 1. Average ± standard deviation of physical-chemical parameters and precipitation enrichment factor in Caraá and São Leopoldo.
Legend: EF: Enrichment Factor;* marine EF; ** crust EF; p value: significance level of 5%.
Parameter Unit Caraá São Leopoldo p value
Min Average ± SD Max EF Min Average ± SD Max EF
t-test
Precipitation (mm) 94.00 2548.2 ± 97.36 420.40 -- 95.50 1842.2 ± 56.20 253.5 -- 1.81 0.08
pH 5.25 6.14 ± 0.48 6.77 -- 5.29 6.24 ± 0.51 7.13 -- -0.50 0.62
Na+ (µeq L-1) 2.83 43.76 ± 21.14 74.62 -- 5.49 22.60 ± 18.46 72.28 -- 2.45 0.02
Ca2+ (µg L-1) 2.99 49.78 ± 26.77 100.55 32* 2.49 38.57 ± 36.50 117.68 47* 0.84 0.40
Mann-Whitney
Conductivity (µS cm-1) 6.41 19.23 ± 17.15 71.35 -- 6.16 12.71 ± 7.52 33.15 -- 42.0 0.14
N-NH4+ (µeq L-1) 4.44 30.44 ± 25.63 75.50 -- 2.81 53.51 ± 66.90 166.96 -- 23.0 0.85
N-NO3- (µeq L-1) 0.69 11.80 ± 7.18 28.33 -- 0.80 7.10 ± 11.50 33.51 -- 34.0 0.06
Cl- (µeq L-1) 6.68 74.50 ± 49.34 177.09 2* 9.99 32.70 ± 28.15 91.93 2* 21.0 0.06
SO42- (µeq L-1) 6.26 45.84 ± 29.91 91.25 10* 3.63 20.58 ± 27.20 97.35 7* 24.0 0.03
K+ (µeq L-1) 2.14 38.16 ± 34.54 135.66 56* 1.26 11.01 ± 11.04 36.55 24* 21.0 <0.01
Mg2+ (µeq L-1) 44.90 60.18 ± 16.12 87.22 5* 2.05 9.03 ± 5.70 20.8 2* 0.0 <0.01
Pb (µg L-1) 0.24 0.64 ± 0.49 2.12 1** 0.27 0.75± 0.70 1.76 1** 21.0 0.71
Al (µg L-1) 2.04 12.30 ± 11.40 30.00 15** 1.12 12.76 ± 17.30 50.61 13** 50.0 0.75
Cd (µg L-1) 0.002 0.04 ± 0.05 0.11 3229** 0.11 0.28 ± 0.24 0.45 14838** 2.0 0.09
Cu (µg L-1) 0.05 1.13 ± 1.31 4.19 552** 0.10 1.64 ± 2.60 8.63 4899** 56.0 0.79
Cr Total (µg L-1) 0.02 0.04 ± 0.01 0.06 17** 0.02 0.50 ± 0.50 1.09 82** 1.50 <0.01
Fe (µg L-1) 0.02 12.95 ± 10.60 31.10 4** 3.63 24.54 ± 31.54 106.1 13** 57.0 0.60
Mn (µg L-1) 0.06 6.16 ± 8.70 32.19 142** 0.007 2.16± 2.55 7.67 144** 38.0 0.09

7 Assessment of a subtropical riparian forest …
Rev. Ambient. Água vol. 13 n. 2, e2140 - Taubaté 2018
Figure 1. Monthly accumulated precipitation in a 12-month period at São
Leopoldo and Caraá.
In the analysis of rainwater, the ions SO42-, Na+, K+ and Mg2+ showed significantly higher
average concentrations in Caraá than the concentrations recorded in São Leopoldo. Only Cr T
had a significantly higher concentration in São Leopoldo than in Caraá (Table 1). The values
of conductivity, pH and other ions and metals did not present significant differences between
the study sites.
Only in 18% of the events (4) the pH was lower than 5.6, which characterizes acid rain.
Thus, for the studied sites, a slightly alkaline pH can be considered when compared to the
rainfall reference value (Seinfeld and Pandis, 2006). The presence of alkaline compounds in
rainwater, such as NH3 and carbonates, aid in its neutralization process. Alkaline pH values
were also recorded in the Guaíba Hydrographic Basin (Migliavacca et al., 2005b) in 16% of
samples, and in the Metropolitan Region of Porto Alegre in 22% of samples (Migliavacca et
al., 2012), both located near the Rio dos Sinos basin.
The marine enrichment factor (EFm) for the analyzed elements followed the sequence
K+> Ca2+> SO42- > Mg2+> Cl- in Caará and Ca2+> K+> SO4
2- > Mg2+> Cl- in São Leopoldo
(Table1). The presence of sulfate (SO4 2-) in the atmosphere comes from natural sources such
as the oxidation of dimethyl sulphide (CH3SCH3) emitted by ocean waters (Oliveira Junior et
al., 2015). The EFm for this chemical compounds was low, reinforcing the indication of the
presence of marine ions in rainwater samples (Oliveira Junior et al., 2015), especially in Caraá,
where it was significantly larger. This occurs, therefore, in the source of Rio dos Sinos, which
is located approximately 32 km in a straight line from the Atlantic Ocean, confirming the
influence of rainwater in these ions. In addition, Na+ e Cl- (EFm=4 low), which are ions derived
from marine aerosols (Migliavacca et al., 2005a; 2005b) were also detected in high
concentrations in Caraá. In fact, Na+ was significantly higher at the site.
Incorporation of Mg2+ e K+ (low and moderate EFm, respectively) comes from soil dust,
by the dissolution of minerals, silicates or by arable soils that have traces of fertilizers. These
can then release particulate material into the atmosphere during precipitation (Sardinha et al.,
2013). These ions were significantly higher in Caraá, which is an essentially a rural
municipality, and could have been incorporated to the rain of the region (Table 1).
The enrichment factor for Ca2+ enrichment may be related to the dissolution of CaCO3
present in suspended soil dust, due to the intense vehicular traffic (Migliavacca et al., 2012),
mainly in São Leopoldo, where a moderate EFm (47) was verified. This result reinforces the
possible anthropic origin for this ion in rainwater samples. The Imperatriz Leopoldina Park is

Rev. Ambient. Água vol. 13 n. 2, e2140 - Taubaté 2018
8 Vanessa Graeff et al.
directly influenced by vehicular sources coming from the highway BR-116, Imperatriz
Leopoldina and Mauá avenues, and from the downtown area of the municipality, corroborating
with the high concentration of these metals in the rainwater (Blume et al., 2014; Costa et al.,
2016).
The concentrations of NO3- and NO2
- are derived from agricultural sources, from
phosphate fertilizers, in which the NH4+ ion can be converted to NH3 by chemical reactions in
the atmosphere and potentiate the process of rainwater neutralization (Migliavacca et al., 2012).
The presence of these ions comes from subsistence agriculture and monocultures of rice in the
upper and lower stretches of the RSHB, respectively. (Roy et al., 2016).
The crust Enrichment Factor (EFc) values (Table 1) ranged from 1 to 9034, with an EFc
of less than 10 for Pb and Fe (only in Caraá), indicating a low enrichment of rainwater samples
from the terrestrial crust. The presence of Pb in rainwater does not come from the Earth's crust
and its origin may be related to the enrichment of particles originating from anthropic sources,
such as coal combustion, founding and vehicular emissions (Migliavacca, et al., 2012, Wu et
al., 2016, Herrera et al., 2009). As to the other metals, Cr> Cu> Cd, a strong (Cr) to extreme
(Cu and Cd) enrichment is observed.
The Cu and Cd elements are derived from vehicular emissions because they are present in
practically all types of brake linings and are used for tire manufacturing (Manahan, 2005;
Alleman et al., 2010; Moreira, 2010; Loyola et al., 2012; Alves et al., 2015). The extreme EFc
values for both study areas, especially in the lower stretch of the RSHB, show that the
contribution of vehicular traffic dust is incorporated into precipitation, especially in São
Leopoldo. This is confirmed by the higher vehicular fleet in this municipality (74.412 vehicles)
than in Caraá (1.531 vehicles) (IBGE, 2017). Costa et al. (2016), who counted vehicles in an
area near Imperatriz Leopoldina Park in São Leopoldo, indicated that the circulation of vehicles
over an hour is from 1420 to 2349. In São Leopoldo, the significantly higher concentration of
total chromium (Cr T) is related to the great industrialization of the lower stretch of the RSHB,
derived from steel and metallurgical processes, and especially from leather tanning (Alves et
al., 2015) in the studied region.
3.2. Floristic Inventory and community structure
Seven species were inventoried. They belong to five genera and two families, being
Polypodiaceae with six species and Dryopteridaceae with only one species (Table 2). The
analysis of distribution of epiphytic ferns along the RSHB shows a simplification in the richness
and a change in the floristic composition of the area. Studies that applied the same methodology
demonstrate the same results. For instance, Becker et al. (2014) recorded 30 species near the
source of the Rio dos Sinos in Caraá, out of which only three were shared with the present
study. Barbosa et al. (2015), in a study carried out in an urban park in the lower stretch of the
basin, recorded only nine species of epiphytic ferns, four of which were shared with this study.
This fact may be associated to vegetation and environment characteristics, since epiphytes,
especially ferns, need a healthy environment to develop (Johansson, 1974) and Rocha-Uriartt
et al. (2015) showed that there is a decreasing gradient in vegetation degradation from the
source towards the mouth of the river in the RSHB.
The community structure of the present study did not present an equitable distribution,
since the three most important species of the community (Microgramma vaccinifolia, Pleopeltis
pleopeltifolia and M. squamulosa) contribute with more than 95% of IVs. The other species
(four) registered less than 5% of IVs, but their contribution in the wealth was more than 57%.
The opposite happens if we compare the community structure near the source of Rio dos Sinos,
analyzed by Becker et al. (2014). In that case, the epiphytic fern community presented a more
equitable distribution with about 76.66% more wealth.

9 Assessment of a subtropical riparian forest …
Rev. Ambient. Água vol. 13 n. 2, e2140 - Taubaté 2018
The morphological characteristics, such as succulent rhizome, presence of trichomes and
scales, are considered functional attributes (Rocha-Uriartt et al., 2016) and adaptive strategies
of the epiphytic ferns against water stress (Benzing, 1989). In this study, these characteristics
were also found in the inventoried specimens of Polypodiaceae, relating their occurrence to a
drier environment, such as the lower stretch of the RSHB.
Polypodiaceae is also the most diverse within the epiphytic environment (Dubuisson et al.,
2009), and is commonly found in urban and impacted environments (Sehnem, 1970; Becker et
al., 2015). In these environments, plants have adaptive strategies that favor their development.
For example, species of the genus Microgramma present a long-crawling rhizome that allows
the occupation of extensive areas in the forophytes (Waechter 1998; Kersten and Silva, 2001).
Specifically, M. vaccinifolia could have taken the highest IVs due to its aleopathic potential
(Peres et al. 2009) and this species is cyanogenic, what can be reducing the predation (Santos
et al., 2005) and increase its population. Microgramma squamulosa has a high sclerophylly
index (Rocha et al., 2013), stomatal density and higher thickness of hypoderm in more polluted
environments (Rocha et al., 2014), and these adaptations are important under water stress (Fahn
and Cutler, 1992). Pleopeltis pleopeltifolia, on the other hand, reduces its exposed leaf surface,
thus lessening the damage caused by the solar incidence and the lack of humidity in the
environment, a strategy known as poikilohydry (Benzing, 1990), in which it can live with only
25% of its water content over long periods (Moran, 2012). These adaptations are fundamental
for their survival in anthropic areas with less water availability.
Table 2. Phytosociological structure of species of epiphytic ferns inventoried in present study (São Leopoldo), in
descending order of Specific Importance Value (IVs).
Family Species nf nz FRf % FRz % NCr % IVs %
Polypodiaceae Microgramma vaccinifolia (Langsd. & Fisch.) Copel. 35 118 53.8 58.1 60.3 57.4
Polypodiaceae Pleopeltis pleopeltifolia (Raddi) Alston 20 61 30.8 30.0 26.0 29.0
Polypodiaceae Microgramma squamulosa (Kaulf.) de la Sota 6 19 9.2 9.4 12.6 10.4
Polypodiaceae Pecluma sicca (Lindm.) M.G.Price 1 2 1.5 1.0 0.2 0.9
Polypodiaceae Serpocaulon catharinae (Langsd. & Fisch.) A.R.Sm. 1 1 1.5 0.5 0.4 0.8
Polypodiaceae Pleopeltis hirsutissima (Raddi) de la Sota 1 1 1.5 0.5 0.4 0.8
Dryopteridaeae Rumhora adiantiformis (G.Forst.) Ching 1 1 1.5 0.5 0.1 0.7
Legend: Nf and nz: number of forophytes and species occurrence zones, respectively; FRf: relative frequency in the
forophytes; FRz: relative frequency in zones; NCr: relative coverage note; IVs: importance value.
3.3. Rapid Habitat Assessment Protocol (RHAP)
The result of the RHAP in the surveyed area totalled 33 points, thus classifying the stretch
as impacted. The parameter “1-Occupancy type” had a maximum score. Being a Permanent
Preservation Area (PPA), this riparian forest, although altered due to recreational trails, has
original vegetation and few signs of suppression. At the opposite extreme, parameters 4 and 11
(vegetal cover over the river and type of substrate) scored zero. The absence of vegetation cover
in the Rio dos Sinos gutter occurs due to the widening of the river, which also causes erosion
in its banks. This reflects the deposition of mud on the river bed, demonstrated by the analysis
of the RHAP.
The evaluation of the habitat quality is considered fundamental for the ecological integrity
analysis, and the final scores reflect the level of conservation of the area (Barbour et al., 1999;
Callisto et al., 2002). The result of the RHAP in the present study, obtained the same (impacted)
framework from another stretch. Rocha-Uriartt et al. (2015) also analyzed the lower stretch of
the RSHB. This location is at a distance of 12 km from the Imperatriz Leopoldina Park, showing
that both are under the same environmental pressures and have the same characteristics of
vegetation. A significant contribution to this result is caused by the population density and the
consequent urban impact, mainly regarding the type of occupation of the margins and the

Rev. Ambient. Água vol. 13 n. 2, e2140 - Taubaté 2018
10 Vanessa Graeff et al.
devastation of the riparian forests (Barrella et al., 2000; Rodrigues and Gandolfi, 2000), which
leads to the loss of environmental quality along the area.
Towards the mouth the river basin, the caracteristics of the vegetation follows the change
of landscape. This is valid from the headwaters of formative streams to the main river, with
heterogeneous environmental conditions towards the floodplain with more homogeneous
characteristics (Barrella et al., 2000). Throughout the RSHB, this change in landscape is
observed, evidenced by the RHAP score (Table 3), a significant reduction of epiphytic fern
richness, and the concentration of IVs in a few species. In addition, the influence of lower
altitude and significantly lower precipitation in the lower stretch of the RSHB (Rocha-Uriartt
et al., 2015), prove to be natural causes and characteristics that become more homogeneous
toward the mouth of the Rio dos Sinos.
Table 3. Score applied to RHAP parameters at Imperatriz Leopoldina Park compared to another study.
Comparative Studies
Rocha-Uriartt et al. (2015) Present Study
Assessed
Parameter
Upper Stretch
(Caraá)
Middle Stretch
(Taquara)
Lower Stretch
(Campo Bom)
Lower stretch
(São Leopoldo)
1 4 2 0 4
2 4 2 2 2
3 4 2 2 2
4 4 0 0 0
5 4 2 2 2
6 4 2 2 2
7 4 2 2 2
8 4 2 2 2
9 5 3 3 2
10 5 2 2 2
11 5 2 2 0
12 5 3 2 3
13 5 2 2 3
14 5 2 2 2
15 5 2 0 3
16 5 2 2 2
Score 72 32 27 33
Assessment Natural Stretch Impacted Stretch Impacted Stretch Impacted Stretch
Legend: Parameters 1 - 8: maximum score (4: natural situation), intermediate (2: slight alteration) and minimum
score: (0: severe alteration); Parameters 9 - 16: maximum score (4: natural situation), intermediate (3: slight
alteration, 2: median alteration) and minimum score (0: severe change).
4. FINAL CONSIDERATIONS
This study showed that the chemical composition of rainwater is influenced by the
environment of each area studied. In the upper stretch (Caraá), the greatest contribution is of
marine origin, while in the lower stretch (São Leopoldo) it is basically derived from
urbanization and industrialization.
In the riparian forest of Imperatriz Leopoldina Park, a reduction of the wealth and a
simplification of the community structure of epiphytic ferns is evidenced, compared to the
region of the source of the Rio dos Sinos. Likewise, the riparian forest of the area has lost its

11 Assessment of a subtropical riparian forest …
Rev. Ambient. Água vol. 13 n. 2, e2140 - Taubaté 2018
natural characteristics, and its environmental quality diminished according to the categories of
RHAP and receives rainwater with a predominantly non-natural chemical composition.
The analysis of the riparian forest of the park applying different methods was an efficient
tool to evaluate its environmental quality as it allowed the integration of a greater number of
biotic and abiotic variables. The proposed integrated analysis can be applied to other scenarios
as well.
5. REFERENCES
AKKOYUNLU, B. O.; TAYAN¸C. M. Analyses of wet and bulk deposition in four different
regions of Istanbul, Turkey. Atmospheric Environment, v. 37, p. 3571–3579, 2003.
https://doi.org/10.1016/S1352-2310(03)00349-2
ALLEMAN, L. Y.; LAMAISON, L.; PERDRIX, E.; ROBACHE, A.; GALLOO, J. C. PM10
metal concentrations and source identification using positive matrix factorization and
wind sectoring in a French industrial zone. Atmospheric Research, v. 96, p. 612-625,
2010. https://doi.org/10.1016/j.atmosres.2010.02.008
ALVES, D. D.; MIGLIAVACCA, D. M.; RODRIGUES, M. A. S.; ILLI, J. C.; BIANCHIN, L.;
BENVENUTI, T. Concentrations of PM2.5-10 and PM2.5 and metallic elements around
the Schmidt Stream area, in the Sinos River Basin, southern Brazil. Brazilian Journal of
Biology, v. 75, p. 43-52, 2015. http://dx.doi.org/10.1590/1519-6984.00113suppl
AMERICAN PUBLIC HEALTH ASSOCIATION - APHA, AMERICAN WATER WORKS
ASSOCIATION - AWWA, WATER ENVIRONMENTAL FEDERATION - WEF.
Standard Methods for the examination of water and wastewater. 22 th Ed.
Washington, D.C., 2012. P. 1360.
BARBOSA, M. D.; BECKER, D. F. P.; CUNHA, S.; DROSTE, A.; SCHMITT, J. L. Vascular
epiphytes of the Atlantic Forest in the Sinos River basin, state of Rio Grande do Sul,
Brazil: richness, floristic composition and community structure. Brazilian Journal of
Biology, v. 75, p. 25-35, 2015. http://dx.doi.org/10.1590/1519-6984.0913
BARBOUR, M. T.; GERRITSEN, J.; SNYDER, B. D.; STRIBLING, J. B. Rapid
bioassessment protocols for use in wadeable streams and rivers: periphyton, benthic
macroinvertebrates, and fish. 2. ed. Washington: Environmental Protection Agency,
1999. 344 p.
BARRELLA, W.; PETRERE Jr., M.; SMITH, W. S.; MONTAG, L. F. A. As relações entre as
Matas ciliares, os rios e os peixes. In: RODRIGUES, R. R.; LEITÃO-FILHO, H. F.
(Orgs.). Matas ciliares: Conservação e recuperação. São Paulo: EDUSP/FAPESP, 2000.
p. 187-208.
BARTHLOTT, W.; SCHMIT-NEUERBURG, V.; NIEDER, J.; ENGWALD, S. Diversity and
abundance of vascular epiphytes: a comparison of secondary vegetation and primary
montane rain forest in the Venezuelan Andes. Plant Ecology, v. 152, p. 145-156, 2001.
http://dx.doi.org/10.1023/A:1011483901452
BECKER, D. F. P.; ROCHA-URIARTT, L.; JUNGES, F.; GRAEFF, V.; SCHMITT, J. L.
Diagnóstico florístico e fitossociológico de samambaias e licófitas epifíticas em mata
ciliar do Rio dos Sinos, RS, Brasil. In: UNIVERSIDADE FEEVALE (Org.). Feira de
Iniciação Científica 2013: ciência, tecnologia e inovação: livro de destaques. 1. ed. Novo
Hamburgo, 2014. p. 21-31.

Rev. Ambient. Água vol. 13 n. 2, e2140 - Taubaté 2018
12 Vanessa Graeff et al.
BECKER, D. F. P.; PADOIN, T. O. H.; NASCIMENTO, C. A.; ROBALSKI, J. L.; LINDEN,
R.; SCHMITT, J. L. Riqueza e composição de epífitos vasculares em áreas urbanas da
Bacia Hidrográfica do Rio dos Sinos, RS, Brasil. Pesquisas, Botânica, v. 68, p. 227-238,
2015.
BENZING, D. H. Vascular epiphytes: general biology and related biota. Cambridge:
Cambridge University Press, 1990. http://dx.doi.org/10.1017/CBO9780511525438
BENZING, D. H. Vascular epiphytism in America. In: LIETH, H.; WERGER, M. J. A. (eds)
Tropical rain forest ecosystems: biogeographical and ecological studies. The
Netherlands: Elsevier, 1989. http://dx.doi.org/10.1016/B978-0-444-42755-7.50013-4
BRASIL. Lei nº 12.651, de 25 de maio de 2012. Diário Oficial [da] União, Brasília DF, 28
maio 2012.
BLUME, K. K.; COSTA, G. M.; CASSANEGO, M. B. B.; DROSTE, A. Genotoxicidade do ar
em área urbana na região metropolitana de Porto Alegre, RS, Brasil. Revista Brasileira
de Biociências, v. 12, p. 158–163, 2014.
CALLISTO, M.; FERREIRA, W.; MORENO, P.; GOULART, M. D. C.; PETRUCIO, M.
Aplicação de um protocolo de avaliação rápida da diversidade de hábitats em atividades
de ensino e pesquisa (MG-RJ). Acta Limnologica Brasiliensia, v. 34, p. 91-97, 2002.
CAMPOS, V. P.; COSTA, A. C. A.; TAVARES T. M. Comparação de dois tipos de
amostragem de chuva: deposição total e deposição apenas úmida em área costeira
tropical. Química Nova, v. 21, n. 4, p. 418-423, 1998.
COSTA, G. M.; PERY, C. T.; DROSTE, A. Active Versus Passive Biomonitoring of Air
Quality: Genetic Damage and Bioaccumulation of Trace Elements in Flower Buds of
Tradescantia pallida var. purpurea. Water Air Soil Pollution, p. 227-229, 2016.
http://dx.doi.org/10.1007/s11270-016-2923-y
DUBUISSON, J.; HENNEQUIN, S.; SCHNEIDER, H. Epiphytism in ferns: diversity and
history. Comptes rendus biologies, v. 332, p. 120-128, 2009.
https://doi.org/10.1016/j.crvi.2008.08.018
ENGWALD, S.; SCHMIT-NEUERBURG, V.; BARTHLOTT, W. Epiphytes in rain forests of
Venezuela - diversity and dynamics of a biocenosis. In: BRECKLE, S. W.;
SCHWEIZER, B.; ARNDT, U. (Eds.). Results of worldwide ecological studies.
Stuttgart Hohenheim: Verlag Günter Heimbach, 2000. p. 425-434.
FAHN, A.; CUTLER, D. F. Xerophytes. Encyclopedia of plant taxonomy. Berlin: Gebrüder
Borntraeger, 1992.
FUNDAÇÃO ESTADUAL DE PROTEÇÃO AMBIENTAL HENRIQUE LUIZ HOESSLER
- FEPAM. Qualidade Ambiental. Available in:
http://www.fepam.rs.gov.br/qualidade/qualidade_sinos/sinos.asp. Access: 17 January
2016.
GREGORY, S. V.; SWANSON, F. J.; McKEE, W. A.; CUMMINS, K. W. An ecosystem
perspective of riparian zones. BioScience, v. 41, n. 8, p. 540-551, 1992.
http://dx.doi.org/10.2307/1311607

13 Assessment of a subtropical riparian forest …
Rev. Ambient. Água vol. 13 n. 2, e2140 - Taubaté 2018
HERRERA, J.; RODRÍGUEZ, S.; BAÉZ, A. P. Chemical composition of bulk precipitation in
the metropolitan area of Costa Rica, Central America. Atmospheric Research, v. 94, p.
151-160, 2009. https://doi.org/10.1016/j.atmosres.2009.05.004
INSTITUTO BRASILEIRO DE GEOGRAFIA E ESTATÍSTICA - IBGE. Cidades. Available
in: https://cidades.ibge.gov.br/brasil/rs/. Access: 31 March 2015.
INSTITUTO BRASILEIRO DE GEOGRAFIA E ESTATÍSTICA - IBGE. Cidades.Available
in: https://cidades.ibge.gov.br/brasil/rs/. Access: 22 February 2017.
JOHANSSON, D. R. Ecology of vascular epiphytes in West African rainforest. Acta
Phytogeographica Suecica, v. 59, n. 5, p. 1-129, 1974.
JOLY, C. A.; SPIGOLON, J. R.; LIEBERG, S. A.; SALIS, S. M.; AIDAR, M. P. M.;
METZGER, J. P. W. et al. Projeto Jacaré-Pepira- O desenvolvimento de um modelo de
recomposição da mata ciliar com base na florística regional. In: RODRIGUES, R. R.;
LEITÃO-FILHO, H. F. (Orgs.). Matas Ciliares: conservação e recuperação. São Paulo:
EDUSP/FAPESP, 2000. p. 271-287.
KERSTEN, R. A.; SILVA, S. M. Composição florística e estrutura do componente epifítico
vascular em floresta da planície litorânea na Ilha do Mel, Paraná, Brasil. Revista
Brasileira de Botânica, v. 24, n. 2, p. 213-226, 2001. http://dx.doi.org/10.1590/S0100-
84042001000200012
KERSTEN, R. A.; WAECHTER, J. L. Métodos quantitativos no estudo de comunidades
epifíticas. In: FELFILI-FAGG, J. M.; EISENLOHR, P. V.; MELO, M. M. R. F.;
ANDRADE, L. A.; MEIRA-NETO, J. A. A. (Eds.). Fitossociologia no Brasil: métodos
e estudos de caso. Viçosa: Editora UFV, 2011. p. 231-254.
KIELING-RUBIO, M. A.; BENVENUTI, T.; COSTA, G. M.; RODRIGUES, M. A. S.;
SCHMITT, J. L.; DROSTE, A. Integrated environmental assessment of streams in the
Rio dos Sinos basin in the State of Rio Grande do Sul, Brazil. Brazilian Journal of
Biology, v. 75, n. 2, Suppl., p. 105-113, 2015. http://dx.doi.org/10.1590/1519-6984.1013
KRESS, W. J. The systematic distribution of Vascular Epiphytes: an update. Selbyana, v. 9, n.
1, p. 2-22, 1986. http://www.jstor.org/stable/41888782
LOYOLA, J.; ARBILLA, G.; QUITERIO, S. L.; ESCALEIRA, V.; MINHO, A. S. Trace metals
in the urban aerosols of Rio de Janeiro city. Journal of the Brazilian Chemical Society,
v. 23, p. 628-638, 2012. http://dx.doi.org/10.1590/S0103-50532012000400007
MANAHAN, S. E. Environmental chemistry. 8th Ed. Boca Raton: Lewis Publishers, 2005.
p. 783.
MIGLIAVACCA, D. M.; TEIXEIRA, E. C.; MACHADO, A. C. de M.; PIRES, M. R.
Composição Química da Precipitação Atmosférica no Sul do Brasil – Estudo Preliminar.
Química Nova, v. 28, n. 3, p. 371-379, 2005a.
MIGLIAVACCA, D. M.; TEIXEIRA, E. C; WIEGAND, F.; MACHADO, A.C.M; SANCHEZ,
J. Atmospheric precipitation and chemical composition of an urban site, Guaíba
hydrographic basin, Brazil. Atmospheric Environment, v. 39, p. 1829–1844, 2005b.
https://doi.org/10.1016/j.atmosenv.2004.12.005

Rev. Ambient. Água vol. 13 n. 2, e2140 - Taubaté 2018
14 Vanessa Graeff et al.
MIGLIAVACCA, D. M.; TEIXEIRA, E. C.; RODRIGUEZ, M. T. R. Composição química da
precipitação úmida da região metropolitana de Porto Alegre, Brasil, 2005-2007. Química
Nova, São Paulo, v. 35, n. 6, p. 1075-1083, 2012.
MORAN, R. C. A natural history of ferns. Portland: Timber Press, 2012. p. 302.
MOREIRA, T. C. L. Interação da vegetação arbórea e poluição atmosférica na cidade de
São Paulo. 2010. 79 p. Dissertação (Mestrado em Ciências) – Universidade de São Paulo,
Piracicaba, 2010. http://dx.doi.org/10.11606/D.11.2010.tde-17032010-134836
MUELLER, C. C. Gestão de matas ciliares. In: LOPES, I. V. (org.). Gestão Ambiental no
Brasil: experiência e sucesso. Rio de Janeiro: Editora Fundação Getúlio Vargas, 1996. p.
185-214.
OLIVEIRA JUNIOR, R. C.; KELLER, M. M.; RAMOS, J. F. F.; BELDINI, T. P.; CRILL, P.
M.; CAMARGO, P. B. et al. Chemical analysis of rainfall and throughfall in the Tapajós
National Forest, Belterra, Pará, Brazil. Revista Ambiente & Água, v. 10, n. 2, 2015.
http://dx.doi.org/10.4136/ambi-agua.1552
PEEL, M. C.; FINLAYSON, B. L.; McMAHON, T. A. Updated world map of the Koppen-
Geiger climate classification. Hydrology and Earth System Science, v. 11, p. 1633-
1644, 2007. http://doi:10.5194/hess-11-1633-2007
PERES, M. T. L. P.; SIMIONATTO, E.; HESS, S. C.; BONANI, V. F. L.; CANDIDO, A. C.
S.; CATELLI, C. et al. Estudos químicos e biológicos de Microgramma vacciniifolia
(Langsd. & Fisch.) Copel (Polypodiaceae). Quimica Nova, v. 32, n. 4, p. 897-901, 2009.
POISSANT, L.; SCHMITI, J.; BÉRON, P. Trace Inorganic Elements in Rainfall in the
Montreal Island. Atmospheric Environment, v. 28, n. 2, p. 339-346, 1994.
https://doi.org/10.1016/1352-2310(94)90109-0
PRADO, J.; SYLVESTRE, L. Lista de espécies da flora do Brasil: samambaias e licófitas.
2016.. Available in: http://floradobrasil.jbrj.gov.br/. Access: 08 March 2016.
PROSINOS. Caracterização Socioambiental da região da Bacia Hidrográfica do Rio dos
Sinos. 2014. Available in: http://www.portalprosinos.com.br/conteudo.php?id=bacia.
Access: 02 August 2014.
ROCHA L. D.; DROSTE, A.; GEHLEN, G.; SCHMITT, J. L. Leaf dimorphism of
Microgramma squamulosa (Polypodiaceae): a qualitative and quantitative analysis
focusing on adaptations to epiphytism. Revista de Biologia Tropical, v. 61, p. 291-299,
2013.
ROCHA, L. D.; COSTA, G. M.; GEHLEN, G.; DROSTE, A.; SCHMITT, J. L. Morphometric
differences of Microgramma squamulosa (Kaulf.) de la Sota (Polypodiaceae) leaves in
environments with distinct atmospheric air quality. Anais da Academia Brasileira de
Ciências, v. 86, p. 1137-1146, 2014. http://dx.doi.org/10.1590/0001-3765201420130094
ROCHA-URIARTT, L.; CASSANEGO, M. B. B.; BECKER, D. F. P.; DROSTE, A.;
SCHMITT, J. L. Diagnóstico ambiental de mata ciliar: uma análise integrada de
parâmetros botânicos, meteorológicos e da genotoxicidade do ar atmosférico. Revista
Brasileira de Ciências Ambientais, v. 35, p.102-115, 2015.

15 Assessment of a subtropical riparian forest …
Rev. Ambient. Água vol. 13 n. 2, e2140 - Taubaté 2018
ROCHA-URIARTT, L.; BECKER, D.; GRAEFF, V.; KOCH, N.; SCHMITT, J. Functional
patterns and species diversity of epiphytic vascular spore-producing plants in riparian
forests with different vegetation structure from southern Brazil. Plant Ecology and
Evolution, v. 149, p. 261-271, 2016. https://doi.org/10.5091/plecevo.2016.1234
RODRIGUES, R. R.; NAVE, A. G. Heterogeneidade florística das matas ciliares. In:
RODRIGUES, R. R.; LEITÃO-FILHO, H. F. (Orgs.). Matas Ciliares: conservação e
recuperação. São Paulo: EDUSP/FAPESP, 2000. p. 45-71.
RODRIGUES, R. R.; GANDOLFI, S. Conceitos, tendências e ações para a recuperação de
florestas ciliares. In: RODRIGUES, R. R.; LEITÃO FILHO, H. F. (Orgs.). Matas
Ciliares: conservação e recuperação. São Paulo: EDUSP/FAPESP, 2000. p.233-247.
ROY, A.; CHATTERJEE, A.; TIWARI, S.; CHIRANTAN, S.; DAS, S. K.; GHOSH, S. K. et
al. Precipitation chemistry over urban, rural and high altitude Himalayan stations in
eastern India. Atmospheric Research, v. 181, p. 44-53. 2016.
http://dx.doi.org/10.1016/j.atmosres.2016.06.005
SANTOS, M. G.; CARVALHO, C. E. M.; KELECOM, A.; RIBEIRO, M. L. R. C.; FREITAS,
C. V. C. D.; COSTA, L. M. D. et al. Cianogênese em esporófitos de pteridófitas avaliada
pelo teste do ácido pícrico. Acta Botanica Brasilica, v. 19, n. 4, p. 783-788, 2005.
SÃO LEOPOLDO. Prefeitura Municipal. Parque Imperatriz Leopoldina. Available in:
https://goo.gl/qLsNPN. Acess: 19 January 2016.
SARDINHA, D. S.; BONOTTO, D. M.; GODOY, L. H.; CONCEIÇÃO, F. T.; MORENO, M.
M. T. Influências geogênicas/antropogênicas na composição química das águas pluviais
de Dois Córregos, bacia do Rio Jaú (SP). Geociências, v. 32, p. 577-585, 2013.
SCHUETTPELZ, E. et al. A community-derived classification for extant lycophytes and ferns.
Journal of Systematics and Evolution, v. 54, p. 563–603, 2016.
http://dx.doi.org/10.1111/jse.12229
SEHNEM, A. Polipodiáceas. In: REITZ, R. Flora Ilustrada Catarinense. Itajaí: Herbário
Barbosa Rodrigues, 1970. p. 173.
SEINFELD, J. H.; PANDIS, S. N. Atmospheric chemistry and physics: from air pollution to
climate change. 2. ed. New York: John Wiley & Sons, 2006. p.1203.
SONG, F.; GAO, Y. Chemical characteristics of precipitation at metropolitan Newark in the
US East Coast. Atmospheric Environment, 43, p. 4903–4913, 2009.
https://doi.org/10.1016/j.atmosenv.2009.07.024
SOUZA, P. A.; De MELLO, Z. W.; MALDONADO, J.; EVANGELISTA, H. Composição
química da chuva e aporte atmosférico na Ilha Grande, RJ. Química Nova, v. 29, p. 471-
476, 2006.
TAYLOR, S. R.; MCLENNAN, S. M. The geochemical evolution of the continental crust.
Reviews in Geophysics, v. 33, p. 241-265, 1995. http://dx.doi.org/10.1029/95RG00262
UNITED STATES. Environmental Protection Agency - USEPA. Biological criteria for the
protection of aquatic life. Ohio: Columbus, 1987. p. 120.

Rev. Ambient. Água vol. 13 n. 2, e2140 - Taubaté 2018
16 Vanessa Graeff et al.
XIAO, H. W.; XIAO, H. Y.; LONG, A. M.; WANG, Y. L.; LIU, C. Q. Chemical composition
and source apportionment of rainwater at Guiyang, SW China. Journal of Atmospheric
Chemistry, v. 70, p. 269-281, 2013. http://dx.doi.org/10.1007/s10874-013-9268-3
WAECHTER, J. L. Epifitismo vascular em uma floresta de restinga do Brasil subtropical.
Revista Ciência e Natura, v. 20, p. 43-66, 1998.
WINDISCH, P. G. Pteridófitas da região Norte-Ocidental do Estado de São Paulo. 2. ed.
São José do Rio Preto: UNESP, 1992. 110 p.
WU, Y.; XU, Z.; LIU, W.; ZHAO, T.; ZHANG, X.; JIANG, H. et al. Chemical compositions
of precipitation at three non-urban sites of Hebei Province, North China: influence of
terrestrial sources on ionic composition. Atmospheric Research, v. 181, p. 115-123,
2016. http://dx.doi.org/10.1016/j.atmosres.2016.06.009
Ambiente & Água - An Interdisciplinary Journal of Applied Science
ISSN 1980-993X – doi:10.4136/1980-993X
www.ambi-agua.net
E-mail: [email protected]
This is an Open Access article distributed under the terms of the Creative Commons
Attribution License, which permits unrestricted use, distribution, and reproduction in any
medium, provided the original work is properly cited.
Urban solid waste challenges in the BRICS countries:
a systematic literature review
ARTICLES doi:10.4136/ambi-agua.2157
Received: 06 Jul. 2017; Accepted: 23 Jan. 2018
Andriani Tavares Tenório Gonçalves*; Flávia Tuane Ferreira Moraes;
Guilherme Lima Marques; Josiane Palma Lima; Renato da Silva Lima
Universidade Federal de Itajubá (UNIFEI), Itajubá, MG, Brasil
Instituto de Engenharia de Produção e Gestão (IEPG). E-mail: [email protected],
[email protected], [email protected], [email protected], [email protected] *Corresponding author
ABSTRACT Urban Solid Waste Management (USWM) is a worldwide challenge. The problems faced
are even greater due to the disproportional increase of Urban Solid Waste (USW) generation in
volume, especially in a context of increased urbanization, population growth and economic
globalization in the BRICS countries (Brazil, Russia, India, China and South Africa). In this
context, the objective of this work is to analyze the status of MSW management in the BRICS
countries, as well as to promote an exchange of experience and management strategies, pointing
out possible ways to improve USWM systems that have to be adapted to each local reality.
Focusing on this, a systematic literature revision was carried out through a bibliometric
analysis. Results showed that the management system of these BRICS countries does not
possess well-developed structures. The collection stage is quite often inefficient, the solid waste
being stored in inappropriate ways and also disposed of in irregular locations. The participation
of the informal sector is a trademark characteristic in USWM for BRICS countries, highlighting
the need to integrate and formalize these activities for USW collection. Due to the high organic
fraction, it is known that composting offers advantages as a way to promote a better use of
organic waste and also as a means of reducing the amount of waste sent to sanitary landfills.
Finally, with a better knowledge about solid waste generation and decentralization of the
offered services, the decision makers will be able to successfully provide this essential public
service.
Keywords: BRICS, systematic literature review, urban solid waste management (USWM).
Os desafios da gestão de resíduos sólidos urbanos nos países do
BRICS: uma revisão sistemática de literatura
RESUMO A Gestão de Resíduos Sólidos Urbanos (GRSU) é um desafio mundial. Com o rápido
processo de urbanização, crescimento populacional e econômico nos países pertencentes ao
BRICS (Brasil, Rússia, Índia, China e África do Sul) o desafio é ainda maior, decorrente do
aumento do volume de Resíduos Sólidos Urbanos (RSU) gerados por esses processos. Neste
contexto, o presente trabalho tem por objetivo analisar o status da gestão dos RSU nos países
do BRICS, bem como promover um intercâmbio de experiência e estratégias de gestão,

Rev. Ambient. Água vol. 13 n. 2, e2157 - Taubaté 2018
2 Andriani Tavares Tenório Gonçalves et al.
apontando possíveis caminhos para melhorar os sistemas de GRSU, cuja a implementação deve
ser adaptada à realidade de cada país. Para isso, foi realizada uma revisão sistemática de
literatura a partir de uma análise bibliométrica. Os resultados mostraram que os sistemas de
gestão de RSU nos países membros do BRICS não apresentam uma estrutura bem desenvolvida,
muitas vezes a coleta não é eficiente, os resíduos são armazenados de maneira imprópria e
destinados em áreas irregulares. A participação do setor informal é característica marcante na
GRSU dos países do BRICS, notando-se, portanto, a necessidade de integração do setor
informal ao sistema formal de coleta destes resíduos. Devido à alta fração orgânica, é notória
as vantagens da compostagem como forma de aproveitamento dos resíduos orgânicos e como
meio de reduzir a quantidade de resíduos enviados a aterros. O conhecimento da geração de
RSU e a descentralização dos serviços oferecidos de GRSU possibilitaria um maior êxito no
atendimento à população.
Palavras-chave: BRICS, gestão de resíduos sólidos urbanos (GRSU), revisão sistemática de literatura.
1. INTRODUCTION
Urban Solid Waste (USW) is made up of residuals and byproducts from domestic
activities, street sweeping, and household and public cleaning (Loureiro et al., 2013; Santiago
e Dias, 2012; Singh et al., 2014). The increased generation of USW is a growing concern in
cities worldwide (Patel et al., 2010), mainly due to the fact that specific municipal management
strategies have become more necessary.
Urban Solid Waste Management (USWM) is a multi-disciplinary activity which includes
the generation, separation, storage, collection, transportation, processing, recovery and disposal
of these materials (Rada et al., 2013). It involves the cooperation of many stakeholders who
make up the municipality, as well as the population and local authorities for the pertinent
activities (Chen, 2010). The main objective in USWM is to protect public health and the
environment through conservation of natural resources (Allesch and Brunner, 2014).
Thus, USWM has become an international challenge, especially in urban areas of
developing countries (Jin et al., 2006; Sharholy et al., 2008; Damghani et al., 2008). Rapid
urbanization has been seen in these nations, especially in the BRICS (Brazil, Russia, India,
China and South Africa), over the last three decades (Wang et al., 2016). This urbanization has
sparked a significant growth in waste material. The main reason for this magnitude of growth
in USW is related to the Gross Domestic Product (GDP), industrialization, population growth
(Linzner and Salhofer, 2014), along with urbanization and an overall increase in living
standards (Batool et al., 2008).
Generation rates for USW are influenced by economic development, industrialization
levels, public habits and local climate (Hoornweg and Bhada-Tata, 2012). From this
perspective, according to the Human Development Report (UNDP, 2015), Russia, Brazil, and
China have a very similar Human Development Index (HDI) (0.804, 0.754, and 0.738,
respectively), classifying these countries with an elevated score for human development.
Furthermore, the report classified South Africa and India as countries of medium human
development (0.666 and 0.624, respectively). Further, according to the Ministry of Foreign
Affairs (Brazil, 2014), these countries, taken together, account for 19.8% of world GDP and
41.6% of the total global population.
In analyzing BRICS legislation about USWM, it is possible to see that they are seeking
solutions to the problem of solid waste. In Brazil, the National Solid Waste Policy (Brazil,
2010) and, in India, the Municipal Solid Waste (Management and Handling - 2000) are
examples of laws that seek to create guidelines regarding the collection, separation, storage,
transport process and final disposal of MSW. Although the BRICS countries are regulating

3 Urban solid waste challenges in the BRICS …
Rev. Ambient. Água vol. 13 n. 2, e2157 - Taubaté 2018
USWM, the standards often do not fit the local reality. According to Tai et al. (2011), in China,
specific laws (Prevention of Environmental Pollution Caused by Solid Waste and
Administrative Measures for Urban Living Garbage) have not achieved expected effects, since
the goals were ambitious, making these laws impossible to be applied by the responsible
departments. Massod et al. (2014) argue that misapplication of laws is the main reason for the
poor USWM efficiency.
Based on the data above, studies directed to USWM in BRICS are important to aid
countries in the process of adapting to the rapid changes, which are ongoing in the national
territories. For this reason, it is necessary to guide decision-making about the best strategies to
adopt in each country, promoting an exchange of experiences and management policies. Thus,
the purpose of this article is to understand the management of USW in the BRICS countries,
through a systematic review of literature based on a bibliometric analysis.
This article is structured in the following manner: after this introduction, Section 2 presents
the methodology. Section 3 presents results and discussion. Recommendations are given in
Section 4, and conclusions are provided in Section 5, followed by the bibliographic references.
2. RESEARCH METHODOLOGY
The bibliometric methodology is used as a means of comparing and quantifying scientific
productions based on the process of data aggregation analysis such as year of publication,
countries, publication names, authors and citations, among other things (Sun and Grimes,
2016). Citation studies for scientific articles have important implications for greater
understanding of the knowledge accumulation process as well as for the research applications
in many different fields of knowledge (Walters, 2011). For these reasons, this methodology
presents itself as a significant method for mapping scientific processes and as a tool for selecting
the best articles to carry out SLR.
The Systematic Literature Review (SLR) is an instrument to map published studies on
specific topics so that the researcher can elaborate and synthesize knowledge about the subject
of study (Biolchini et al., 2007). The study is carried out according to a previously established
protocol which can be replicated by other professionals, who will be able to evaluate the chosen
patterns for the case; it differs from traditional reviews because it adopts a replicable process
which is scientific, transparent and aids in developing guidelines for searching, selecting,
critical analysis and synthesis of results (Cook et al., 1997).
For the means of this study, the SLR procedure from Brereton et al. (2007) and Biolchini
et al. (2007) was adopted. According to these authors, the development of an SLR is made up
of three phases: Planning, Execution and Results Analysis. In the first phase, the study protocol
must be developed, including the main objective, the methods to be used and the criteria to be
adopted in selecting the articles (Biolchini et al., 2007). The second phase of the process, the
execution, involves the search for information, material selection and evaluation. The research
method and criteria for inclusion and exclusion of publications should be rigidly adhered to, as
each one is defined in the research protocol (Biolchini et al., 2007). The third and final phase
consists of the analysis of all the information considered relevant for the study’s objective,
which should be collected and stored in a synthetic form. Although the SLR process seems
sequential, it involves iterations. Some activities may start during the protocol development and
only later will be defined, just when they are ready to be put into practice (Biolchini et al.,
2007).
2.1. Execution of Bibliometric Analysis and Systematic Literature Review
2.1.1. Planning
The database used in this research was the ISI Web of Knowledge (Web of Science), which
is an indexed database that allows users to export the metadata necessary for the bibliometric

Rev. Ambient. Água vol. 13 n. 2, e2157 - Taubaté 2018
4 Andriani Tavares Tenório Gonçalves et al.
analysis. The keywords used in the search were "Municipal Solid Waste Management" and
"Urban Solid Waste Management" from 2006 to 2016. In the Web of Science (WoS) platform,
the search resulted in a total sample, for both keywords, of 3214 publications of thematic and
environmental areas, mainly related to Environmental Science and Environmental Engineering.
For this first phase of the planning, a bibliometric analysis was performed using the
HistCite software with data from 3214 articles. From the publications imported into the
software, the results were evaluated under the following aspects: number of publications per
year (Figure 1), number of articles per journal (Table 1) and citation analysis.
Figure 1. Number of publications per year.
Table 1. Number of Publications, TGCS and JCR for each journal.
The number of publications in USWM has grown over the years (Figure 1) due to an
increase of waste generation and management expenses. According to projections from the
World Bank, the generation and expenses related to these materials have advanced significantly
Journals Number of Publications TGCS JCR
Waste Management 509 8954 3,829
Waste Management & Research 235 1862 1,338
Resources Conservation and Recycling 153 1880 3,280
Journal of Cleaner Production 91 1118 4,959
Journal of Environmental Management 67 1397 3,131
Environmental Engineering and Management
Journal 46 255 1,008
Renewable & Sustainable Energy Reviews 46 547 6,798
Journal of Hazardous Materials 42 1124 4,836

5 Urban solid waste challenges in the BRICS …
Rev. Ambient. Água vol. 13 n. 2, e2157 - Taubaté 2018
since 2010. In a timeframe of 15 years, it is forecast that USW will jump by 42% in 161
countries (3,532,255 tons/day in 2010 to 6,069,705 tons/day in 2025), while costs related to
USWM will expand by 45% ($205.4 billion in 2010 to $375 billion in 2025) (Hoornweg and
Bhada-Tata, 2012). Thus, with the increase of the generation and public expenses with USWM,
research is necessary to develop new strategies and policies.
The 3214 articles were published in 820 journals, the 10 most published journals are
presented in Table 1. The Total Global Citation Score (TGCS) of each journal, which represents
the total number of citations per journal on the WoS platform among the analyzed publications,
is presented and indicates their reachability. The Journal Citation Reports (JCR), also presented
in this research, indicates the average number of citations received by the periodical
publications of the journal of the previous two years.
The goal of this research is to evaluate how the USW management occurs in the BRICS
countries, following an SLR from the collection of 3214 articles searched on the WoS platform.
In this way, it is possible to verify the current status of USW generation and also to propose
better practices in order to leverage management efficiency. From this objective, some research
questions (RQ) were formulated so as to guide the analysis and identify the USW generation
gaps:
RQ1: What is the generation and composition of USW?
RQ2: How is the storage of waste carried out?
RQ3: How are the waste collection, transfer, and transportation performed?
RQ4: What are the main types of treatment and final disposal of USW?
RQ5: Is the USW management in the BRICS countries carried out in a decentralized or
centralized manner?
RQ6: What are the improvements actions related to USWM adopted by the BRICS
countries?
After developing the research questions (RQ) and the objective of the SLR, the research
protocol was established based on two pillars: (1) criteria, related to the composition and
construction of articles such as year of publication, country, language, title, abstract and
keywords; and (2) perspectives, which refers to the basis of a good USW generation, in other
words, generation, composition, storage, collection, transfer, transportation, treatment, and final
disposal.
2.1.2. Execution
Through the collection of 3214 articles searched on the WoS platform, the following search
filters were applied to perform the SLR: type of document, in which only articles were selected,
mainly because of the peer review processes that they go through in their full version;
consequently, the database returned a total of 2493 articles. Only English-language articles were
selected, decreasing the selection to a total of 2396 articles. The later selection criteria were
related to countries, where the BRICS countries were selected: China, India, Brazil, South
Africa and Russia. With these filters applied, the sample for the WoS platform was reduced to
558 publications. These articles were also submitted to the selection filter, which included the
application of the inclusion criteria by the process of reading the title, abstract and keywords.
Only articles in the context of urban solid waste management were selected, thus reducing the
sample to 46 articles submitted for review.
2.1.3. Result Analysis
Finally, the 46 articles selected, with USW generation in the BRICS countries presented,
were subjected to exhaustive reading and analysis aimed to answer the six research questions
Rev. Ambient. Água vol. 13 n. 2, e2157 - Taubaté 2018
6 Andriani Tavares Tenório Gonçalves et al.
generated in the planning stage of the SLR. Tables with summary information of the articles
were developed aiming to present data of how USW management, by country, is made. Also,
the general management view allows the exchange of experience and management strategies
among countries, seeking to identify the points to be improved. Along these lines, the review
sought to present the status of MSW management in the five BRICS countries by analysing the
pillar of the perspectives outlined in the planning stage.
3. RESULTS AND ANALYSIS OF THE SYSTEMATIC LITERATURE
REVIEW
Urban Solid Waste Management is made up of six basic services: Storage, Collection,
Transfer and Transportation; Processing/Treatment and, finally, Disposal of materials which
cannot be recovered economically for recycling or reuse. Furthermore, according to Patel et al.
(2010), to implement a correct USWM policy, the quantity and composition of the USW must
be known.
Thus, the results of the SLR are presented and analyzed first in terms of generation and
composition (Table 2), then, according to each one of the USWM activities (storage, collection,
transfer, transportation, treatment, and final disposal) for the BRICS countries (Table 3 and
Table 7).
3.1. Generation and Composition of USW
According to Abduli et al. (2013), it is essential to comprehend the quantity and type of
USW generated in order to plan and develop a suitable management policy for these materials
in a specific location. Moreover, the lack of knowledge, mainly about MSW quantity and its
characteristics, can make some stages not viable, such as treatment and the final disposal (Costa
et al., 2012). The concern with the MSW classification has been growing in the BRICS,
encouraged through regulations, such as The People's Republic of China’s regulation on
Prevention of Environmental Pollution Caused by Solid Waste and The Administrative
Measures for Urban Living Garbage, as well as The Brazilian National Policy on Solid Waste
(Brazil, 2011). It may be noticed that all these regulations establish administrative measures
and specific methods for MSW classification.
Regarding the generation of MSW, Campos (2012) states that this is driven by economic
and behavioral factors, besides the influence of population factors, which are related to
population growth and its concentration in urban areas. Table 2 presents a synthesis of the
generation and composition of USW in BRICS countries. It can be observed that there has been
an increase in waste production, specifically in China and India, in parallel with rapid
urbanization over the last three decades, according to Wang et al. (2016).
According to Sharholy et al. (2008), the per capita generation of MSW ranges from
0.2 to 0.5 kg/inhabitant/day, in India, and it has annual growth of 1 to 1.33%. Further, in some
cities, the generation may be even higher because of the high levels of urbanization standards.
Patel et al. (2010) also emphasize that both population and economic growth have influenced
significant changes in the quantity and characteristics of waste generated in the last 20 years in
the country, making the management waste a problem to be solved through formulation and
adoption of appropriate techniques for each type of waste generated.
Zhang et al. (2010) also point out that China has been facing challenges to manage its
waste due to the increase in per capita generation, which is around 1.134 kg/inhabitant/day. In
Brazil, as can be seen in Table 2, the generation is 1.062 kg/inhabitant/day and in Russia 0.63
kg/inhabitant/day. In the studied articles, there is no information for the per capita generation
in South Africa.

7 Urban solid waste challenges in the BRICS …
Rev. Ambient. Água vol. 13 n. 2, e2157 - Taubaté 2018
Table 2. Generation and composition of USW in BRICS.
Authors Countries (Cities under study) Generation and Composition
Couth and Trois (2010);
Snyman and Vorster
(2011)
South Africa (Cape Town and
Tshwane)
Generation: 870,000 tons of recyclable material.
Generation per capita: NI*
Composition: South Africa – 50% of USW is organic
(Liebenberg, 2007)
Projection: Estimation of diminishing fraction of organic
waste to 42.5% by 2022 in the city of Tshwane
Lino and Ismail (2013);
Toso and Alem (2014);
Leme et al. (2014);
Rutkowski and
Rutkowski (2015)
Brazil (Campinas, Sorocaba and
Betim)
Generation: 200 tons of USW per day in Betim
Generation per capita: 1,062 kg/inhabitant/day for Brazil
(ABRELPE, 2015)
Composition: Campinas – 46% organic material, 20%
paper, 15% plastic, 4% metal, 2% glass and 13% other
materials
Sorocaba – of recyclable material, 30.2% are cardboard,
25.5% paper, 4.3 tetra pack, 9% metal, 17.4% plastic and
12.3% glass
Projection: NI*
Hui et al. (2006); Song
et al. (2013); Jiang et al.
(2009); Zhen-Shan et al.
(2009); Minghua et al.
(2009); Liu and Wu
(2010); Liu et al. (2015);
Fei et al. (2016); Zhao et
al. (2008); Dorn et al.
(2012); Wang and Wang
(2013); Chen et al.
(2010); Dai et al. (2011);
Fu et al. (2015)
China (Chongqing, Macao,
Lhasa, Shigatse, Nedong
District, Bayi District in
Nyingchi, Beijing, Shanghai
(Pudong), Suzhou, Zhejiang,
Guangdong, Hebei, Henan and
Sichuan)
Generation: 1,805 million tons of solid waste for domestic
urban areas in 2013
Generation per capita: 1.134 kg/inhabitant/day for China
Composition: Macao – 45.65% organic material, 16.3 paper,
14.13% plastic, 5.43% glass, 3.25% metal, 2.17% cloth,
8.7% wood, and 4.35% other materials.
Projection: estimated generation of 4,942 tons/day in 2020
in Tibet region
Pattnaik and Reddy
(2010); Sharma et al.
(2010); Patel et al.
(2010); Chattopadhyay
et al. (2009); Kumar et
al. (2009); Sharholy et
al. (2008); Ravindra et
al. (2015); Chakrabarti
et al. (2009); Kumar and
Goel (2009)
India (Pune, Puducherry,
Hardwar, Madhya Pradesh,
Kolkata, Rajasthan, Uttar
Pradesh, Uttarakhand, Deli,
Haryana, Punjab, Himachal
Pradesh, Jammu, Kashmir,
Cashmere and Kharagpur)
Generation: 48 million tons, annual, of USW.
Generation per capita: 0.561 kg/inhabitant/day for India
Composition: 81.41% of USW are biodegradable and
18.59% are not
Projection: Increase to 250 million tons by 2047 (Sharholy
et al., 2007)
Starostina et al. (2014) Russia (Irkutsk) Generation: 500 million tons in 2011 of USW, for Irkutsk
(MNREIR, 2012)
Generation per capita: 230 kg/inhabitant for solid waste in
Irkutsk (MOI, 2008)
Composition: 30% organic material, 23.5% paper, 11.3%
glass, 15.8% plastic, 7% textile, 2.6% metal, 1.2% rubber,
1% leather, 1% wood and 6.6% others
Projeção: NI*
*Not included.
Thus, in the BRICS countries, despite the fact that they present an increase in waste
generation, are still less than the average of 2.2 kg/inhabitant/day for the OECD (Organisation
for Economic Co-operation and Development) (Hoornweg and Bhada-Tata, 2012), which is
made up of mainly developed countries. The quantity and composition of the waste reveals
consumption and disposal habits of the inhabitants which do not reflect measures implemented
to reduce waste generation.
Regarding composition, the largest part of USW generated in South Africa, Brazil, China,
India, and Russia is made up of organic material, reflecting consumption patterns of these
populations. This scenario can be expected, given that in studies by Singh et al. (2014) and

Rev. Ambient. Água vol. 13 n. 2, e2157 - Taubaté 2018
8 Andriani Tavares Tenório Gonçalves et al.
Sharholy et al. (2008), in countries considered underdeveloped or developing, there is a growing
rate of USW generation and the main contributor is organic material.
Table 3. Storage of USW in BRICS countries.
Authors Countries (Cities Under Study) Storage
Jiang et al. (2009);
Minghua et al. (2009); Tai
et al. (2011); Dai et al.
(2011)
China (Lhasa, Shigatse, Nedong
District, Bayi District in Nyingchi,
Beijing, Guangzhou, Shenzhen,
Hangzhou, Nanjing, Xiamen and
Guilin)
Types of Recipients: Containers,
dumpsters and closed locations
Location: Residential and
commercial streets, scheduled
collection points, transfer stations or
stored by USW collection
companies
Kumar and Goel (2009);
Pattnaik and Reddy (2010);
Kumar et al. (2009); Zia
and Devadas (2008);
Talyan et al. (2008);
Ravindra et al. (2015)
India (Kharagpur, Puducherry,
Metropolitan Cities, States Capitals,
Deli, States of Rajasthan, Uttar
Pradesh, Uttarakhand, Deli,
Hariyana, Punjab, Himachal
Pradesh, Jammu , Cashmere and
Chandigarh)
Types of recipients: Small trash
recipients at the source, community
containers and concrete deposits
(open and closed)
Location: Open areas and in streets,
without source separation
Starostina et al. (2014) Russia (Irkutsk) Type of Recipient: Common trash
cans (containers around 0.75m2)
Location: Residencies
3.2. Storage
Storage represents an essential procedure for suitable USWM. As one step before
collection, the way that solid waste is stored influences how it will be transported. It is
recommended that at the points of generation the waste be placed in waste containers selected
according to its characteristics; for example, the container must be mechanically and chemically
compatible with each waste (Barros, 2012).
Table 3 presents the storage characteristics in China, India and Russia. In the studied
articles, no information was found on the remaining BRICS countries.
In China, the use of waste containers, collection points and transfer stations all stand out
for temporary storage, in order to aid in transferring USW from small collection vehicles to
larger ones. Storage in domestic dumpsters or trash deposits is the method utilized in Russia.
In India, the storage is inadequate, generally in open areas and streets, without separation at the
source; in certain party of the country, community waste containers are used.
Jiang et al. (2009) and Zia and Devadas (2008) state in their studies on China and India,
respectively, that they observed problems in conserving the quality of the public waste
containers and the existence of clandestine disposal spots in the storage areas.
3.3. Collection, Transfer and Transportation
Collection and transfer of USW must be carried out with suitable frequency in order to
avoid excessive accumulation of materials, minimizing risks to the environment and public
health. Transportation must be done in adequate vehicles, chosen according to the quantity and
type of solid waste being transported, the topographical characteristics and the region’s
transportation network, as suggested by Rutkowski and Rutkowski (2015).
Analyzing the data presented in Table 4 regarding the way the collection, transfer and
transport of USW is carried out in BRICS countries, it can be seen that the collection system
adopted is door-to-door in South Africa, Brazil and India, and specific delivery points in Brazil,
China, India and Russia. Collection at specific delivery points depends on the population’s
participation and awareness, given that residents have to go to the locations where the

9 Urban solid waste challenges in the BRICS …
Rev. Ambient. Água vol. 13 n. 2, e2157 - Taubaté 2018
dumpsters or containers are placed for waste disposal. In many cases, this does not happen,
which creates clandestine deposits.
The collection services in these countries are carried out by public and private companies,
which contributes to differences in performance. According to Sharholy et al. (2008), the
collection service is more efficient when a third-party is hired for the activity. However,
Rajamanikam et al. (2014) detected problems in the city of Puducherry (India) in the execution
of services by Non-Governmental Organizations (NGOs) and third-party contractors, who
carried out the collection two times per week in order to economize transportation costs. Thus,
some regions have low collection frequencies, which lead to overflowing storage locations,
which cause uncontrolled burning of urban solid waste around the city.
Table 4. Collection, transfer and transportation of USW in the BRICS countries.
Authors Countries (Cities Under
Study) Collection, Transportation and Transfer
Snyman and Vorster
(2011); Couth and Trois
(2010).
South Africa (Cape Town,
Tshwane and Johannesburg)
Collection method: Door-to-door
Utilization of transfer stations: Yes (10 stations in
Tshwane).
Form of Transportation: NI*
Responsible: NI*
Frequency: NI*
Efficiency: NI*
Rutkowski and Rutkowski
(2015).
Brazil (25 Brazilian Cities) Collection method: Door-to-door and/or delivery point.
Utilization of transfer stations:
Form of Transportation: Choice made in relation to
topography.
Responsible: NI*
Frequency: NI*
Efficiency: Collection efficiency is 90% (ABRELPE,
2015).
Hui et al. (2006); Song et al.
(2013); Jiang et al. (2009);
Zhen-Shan et al. (2009);
Dai et al. (2011) ; Wang
and Wang (2013); Minghua
et al. (2009); Liu et al.
(2015); Wang et al. (2008);
Yang et al. (2015).
China (Chongqing, Macao,
Lhasa, Shigatse, Nedong
District, Bayi District in
Nyingchi, Beijing and
Shanghai)
Collection method: Delivery points
Utilization of transfer stations: Yes
Form of Transportation: Trucks (with and without
compaction)
Responsible: State owned and private companies.
Frequency: NI*
Efficiency: NI*
Narayana (2009); Pattnaik
and Reddy (2010); Sharma et
al. (2010); Chattopadhyay et
al. (2009); Kumar et al.
(2009); Sharholy et al.
(2008); Zia and Devadas
(2008); Talyan et al. (2008);
Pandey et al. (2012);
Rajamanikam et al. (2014);
Ravindra et al. (2015);
Chakrabarti et al. (2009);
Kumar and Goel (2009).
India (Puducherry, Hardwar,
Kolkata, Metropolitan Cities,
States Capitals, Kanpur, Delhi,
Bhagalpur and Kharagpur)
Form of Collection: Door-to-door and/or delivery points.
Utilization of Transfer Stations: Yes
Form of Transportation: Trucks (with and without
compaction)
Responsible: State owned and private companies. Street
sweepers and recyclable materials collectors.
Frequency: From Monday to Friday
Efficiency: The efficiency measurement in India is around
60 to 70%.
Starostina et al. (2014). Russia (Irkutsk) Form of Collection: Delivery points.
Utilization of Transfer Stations: NI*
Form of Transportation: NI*
Responsible: NI*
Frequency: Every day, every-other day or two times per
week, depending on necessity.
Efficiency: NI*
*Not included.

Rev. Ambient. Água vol. 13 n. 2, e2157 - Taubaté 2018
10 Andriani Tavares Tenório Gonçalves et al.
The participation of the informal sector, by means of street sweepers and recyclable material
gatherers is a trademark characteristic of the collection system used in Brazil, China and India.
In terms of optimizing USW transportation, most studied cities have transfer stations, which
help to reduce transportation costs. However, the number of stations is not sufficient, in many
cases, mainly in large-scale cities, where studies must be done to optimize routes and locations
for containers and dumpsters in order to improve the selective collection.
3.3.1. Selective Collection
The activity of selective collection feeds the cycle of reuse, recycling and composting. It
is through this process that recyclable materials are sorted from non-recyclable and organic
material. Organic material will be destined for composting. Table 5 presents the synthesis of
selective collection in BRICS.
Toso and Alem (2014) highlight the difference between Brazil and the other countries,
mainly in the way that USW is separated for recycling. Other countries sort them by type (paper,
cardboard, etc.), while in Brazil they are broken into sub-groups of recyclable materials (and,
obviously, non-recyclables).
In Brazil, the selective collection activity is done mainly through door-to-door and
Voluntary Delivery Points (VDP), carried out by public authorities and, in some cases,
partnership with the informal sector. The inclusion of the informal sector through associations
and cooperatives has been increasingly incentivized throughout the country, since the approval
of the National Solid Waste Policy (Brazil, 2010). However, according to Ferri et al. (2015), a
great challenge resides in the task of integration of the recyclable material gatherers and the
overall USWM system, often due to their lack of capacity to carry out this activity, which is
essential mainly to deal with the health and safety aspects of these workers in the operation of
associations and cooperatives.
In China and India, according to Sharholy et al. (2008), the task is predominantly done by
the informal sector; the role of the government in recovering these materials is small. The
presence of the informal sector in these countries does not occur in a planned fashion, but rather
as a result of economic conditions seen by the population. In China, for example, the informal
workers organization was always a challenge for the Chinese government, bringing social
problems (Wang et al., 2008 e Liu et al., 2015). Liu et al. (2015) also emphasize that one way
to solve this social issue would be to employ informal waste pickers in recycling companies.
Table 5. USW Treatment in BRICS countries.
Authors Countries (Cities under study) Treatment
Snyman and Vorster (2011); Couth
and Trois (2010).
South Africa (Cape Town, Tshwane
and Johannesburg)
Type of treatment: Composting for urban solid waste.
(Coetzee et al., 2007)
Rutkowski and Rutkowski (2015). Brazil (25 Brazilian Cities) Type of treatment: recycling and of reuse of urban solid
waste.
Song et al. (2013); Jiang et al.
(2009); Zhen-Shan et al. (2009);
Minghua et al. (2009); Liu et al. (2015); Tai et al. (2011); Dorn et al.
(2012); Chen et al. (2010); Dai et
al. (2011); Wang and Wang
(2013) ; Zhao et al. (2008).
China (Macao, Lhasa, Shigatse,
Nedong Lhoka District, Bayi District
in Nyingchi, Beijing, Shanghai, Guangzhou, Shenzhen, Hangzhou,
Nanjing, Xiamen and Guilin)
Type of treatment: incineration, compost and recycling.
Narayana (2009); Jha et al. (2008);
Chattopadhyay et al. (2009); Kumar et al. (2009); Zia and Devadas
(2008); Sharholy et al. (2008);
Rajamanikam et al. (2014); Chakrabarti et al. (2009); Kumar
and Goel (2009).
India (Delhi, Mumbai, Calcutta,
Chennai, Metropolitan Cities, State Capitals, Kanpur, Puducherry and
Kharagpur)
Type of treatment: 47% of USW generated were recovered
through active recycling and composting practices in the area of Raj Bhavan and Puducherry.
Starostina et al. (2014). Russia (Irkutsk) Type of Treatment: Only 3% of USW are recycled in the city.

11 Urban solid waste challenges in the BRICS …
Rev. Ambient. Água vol. 13 n. 2, e2157 - Taubaté 2018
3.4. Treatment
Inadequate management of USW in terms of treatment results in economic losses and
poses a threat to public health and natural resources (Abduli et al., 2013). Zhang et al. (2010)
affirm that any activity for USW treatment not only diminishes the total amount of waste
generated but also the costs of disposal. Even with these clear gains through treatment, all the
studied articles highlight treatment activities as hurdles to be overcome in BRICS countries.
Table 6 presents the types of treatments which already exist.
The articles about South Africa, China and India affirm the existence of composting.
However, some problems are identified, such as low quality and lack of market for the
composted product. Based on the fact that USW in BRICS countries have a large portion of
organic material, composting should be considered in these locations. Some authors, such as
Abduli et al. (2013), Zhang et al. (2010) and Sharholy et al. (2008), suggest that composting
needs to be improved, which is essential to the implementation of the separation of waste
material from the generating source so that recyclable materials can be routed to recycling
processes and organic material to composting.
Incineration, on the other hand, is a common practice in large cities in China. In small
cities, USW presents a low heat-generating power, as pointed out by Chen et al. (2010).
However, incineration has been increasing due to subsidies from the Chinese government and
private investments aimed at reducing the volume of USW and the generation of energy. In
India, Narayana (2009) affirms that this activity has not been so common due to high humidity
levels, low heat-generating content and reduced volumes, which will not meet the needs of
central incineration installations. In Brazil, treatment by incineration is in a secondary context
(Brazil, 2010). Incinerators within the country are used mainly to process waste considered as
needing special treatment, such as health-service waste.
Related to recycling, the informal sector has a strong participation in the BRICS countries.
Wang et al. (2008) point out that recyclable material gatherers sustain the entire recycling
system in developing countries. Therefore, there is a need to formally integrate these important
members of the system, considering that many times these workers suffer from government
negligence and need professional training and legalized work. Among these countries, Brazil
stands out as a reference in social inclusion for recyclable material gatherers through
cooperatives and associations (Ezeah et al., 2013).
Table 6. Selective Collection in BRICS countries.
Authors Countries (Cities under study) Selective Collection
Couth and Trois (2010) South Africa (Cape Town and Johannesburg)
Type of collection: NI* Separation: Dry and wet waste materials
Responsible: NI*
Lino and Ismail (2013); Toso and Alem (2014); Ferri et al.
(2015); Rutkowski and
Rutkowski (2015)
Brazil (Campinas, Sorocaba and others 25 Brazilian Cities)
Type of collection: Door-to-door and VDP Separation: Recyclable Wastes are collected and then sorted.
Responsible: Public authorities, private companies, associations
and cooperatives.
Hui et al. (2006); Liu et al. (2015); Fei et al. (2016); Xu et
al. (2015); Wang et al. (2008)
China (Chongqing, Beijing, Suzhou and Haidian (Beijing District))
Type of collection: NI* Separation: Separated in trash cans, streets and/or locations for
final disposal.
Responsible: Informal sector – by gatherers and informal
buyers of recyclable materials.
Zia and Devadas (2008);
Rajamanikam et al. (2014)
India (Kanpur, State of Rajasthan,
Uttar Pradesh, Uttarakhand, Delhi, Haryana, Punjab, Himachal
Pradesh, Jammu, Cashmere and
Puducherry)
Type of collection: Inhabitants sell them in recycling areas.
Separation: Dry and wet waste materials.
Responsible: Informal sector.
Starostina et al. (2014) Russia (Irkutsk) Type of collection: Paper and glass are commercialized on the
market.
Separation: NI* Responsible: NI*
*Not included.

Rev. Ambient. Água vol. 13 n. 2, e2157 - Taubaté 2018
12 Andriani Tavares Tenório Gonçalves et al.
3.5. Final Disposal
Final disposal of USW consists of the adoption of procedures which aim to release the
waste into the ground, minimizing environmental impacts by following operational norms to
avoid public health problems and promote population safety. In Brazil, final disposal is
restricted to USW which cannot be treated or recovered, classified as rejected (Brazil, 2010).
In this sense, the study showed the strong presence of landfills in the investigated countries
(Table 7), which many times are irregular, or do not present a collection system, nor leachate
or gas/drainage treatment system (with or without energy generation). Urban Solid Waste is
also disposed of in open-air environments without any concern for the environment, which can
cause public health problems.
Table 7. Final disposal in BRICS countries.
Authors Countries (Cities under study) Final Disposition
Snyman and Vorster (2011). South Africa (Tshwane) Type of final disposal:
Landfills
Lino and Ismail (2013); Toso and Alem
(2014); Leme et al. (2014); Rutkowski
and Rutkowski (2015).
Brazil (Campinas, Sorocaba,
Betim and others 25 Brazilian
Cities)
Type of final disposal: open
dump (open-air, without
treatment), controlled landfills
Song et al. (2013); Jiang et al. (2009);
Zhen-Shan et al. (2009); Minghua et al.
(2009); Liu et al. (2015); Tai et al.
(2011); Chen et al. (2010); Dai et al.
(2011); Wang and Wang (2013).
China (Macao, Lhasa, Shigatse,
Nedong Lhoka District, Bayi
Nyingtri District, Beijing,
Shanghai, Guangzhou,
Shenzhen, Hangzhou, Nanjing,
Xiamen and Guilin)
Type of final disposal:
Landfills and dumps
Narayana (2009); Jha et al. (2008);
Pattnaik and Reddy (2010);
Chattopadhyay et al. (2009); Kumar et
al. (2009); Zia and Devadas (2008);
Talyan et al. (2008); Hazra and Goel
(2009); Pandey et al. (2012); Ravindra
et al. (2015); Chakrabarti et al. (2009);
Kumar and Goel (2009); Sharma et al.
(2010).
India (Delhi, Mumbai, Calcutta,
Chennai, Puducherry, Kolkata,
Metropolitan Cities, States
Capitals , Kanpur, Bhagalpur,
State of Rajasthan, Uttar
Pradesh, Uttarakhand, Haryana,
Punjab, Himachal Pradesh,
Jammu, Cashmere, Chandigarh,
Kharagpur and Haridwar)
Type of final disposal:
uncontrolled landfills, dumps
and clandestine dumping sites
(highways and empty lots)
Starostina et al. (2014). Russia (Irkutsk) Type of disposal: 500,000 tons
of USW deposited, per year, in
the landfills.
In Brazil in 2014, dumps represented 28% of the final destination per municipality;
controlled landfills were 32% and sanitary landfills, 40% (ABRELPE, 2015). In India,
according to Narayana (2009), 90% of generated waste is deposited in open places. The
limitation of space for landfills, due to dramatic urban growth and scarcity of resources, has
hindered the construction of safe, controlled landfills in Indian cities (Chakrabarti et al., 2009).
It was observed that most of the BRICS countries do not have adequate waste management
systems. Wastes with high pollution potential, which should have special disposal treatment,
are erroneously sent to domestic waste landfills. According to studies by Snyman and Vorster
(2011), in South Africa, for example, 50% of domestic waste, 28% of green waste, 14% of civil
construction waste, and 8% of industrial waste are deposited in the Tshwane landfill.

13 Urban solid waste challenges in the BRICS …
Rev. Ambient. Água vol. 13 n. 2, e2157 - Taubaté 2018
4. FINDINGS
The BRICS countries face constraints in the USWM that can be solved, but this requires
the more active participation of the population, the government and the private sector, as
Narayana (2009) argues. In this way, it was possible to observe these points of improvement
and good practices in the five countries studied from the USWM status study. The positive
initiatives can be reproduced with modifications that respect characteristics, dimensions,
generation of waste, population and individualities of each country.
The centralization of the USWM services in public agencies, in the BRICS countries, was
observed in the articles studied. Thus, in order to ensure the participation of all sectors,
incentives are recommended for the decentralization of the management stages from the
definition of responsibilities between private initiative, public authority and population. Chen
et al. (2010) emphasize that an integrated approach to the services offered by the system is
necessary, considering the roles of these three stakeholders.
Focusing on the MSW generation stage, China shows that an absence of a volume limit of
MSW generated is a real gap during all the generation process (Zhang et al, 2010);
consequently, more investments are required for the final disposal of the waste. The authors
themselves suggest the implementation of a charge for waste generation. In this way it would
be possible to recover USWM costs and increase financial support for waste disposal facilities.
The analyzed articles pointed to some faults in the storage and collection of MSW in India,
where some municipalities have community containers with excessive waste, clandestine
disposal sites and poor conservation of the waste containers. The article by Rajamanikam et al.
(2014) concludes that the cause of high MSW stocking in community waste containers in India
is due to the low frequency of waste collection in the municipality of Puducherry. As a good
practice of collection and storage, the article by Starostina et al. (2014) states that in the city of
Irkutsk (Russia) the waste is stored in individual waste containers for each household; these
containers are emptied frequently (every day, every two days or twice a week). Consequently,
there is a decrease in USW accumulation and also in waste-burning, as reported by
Rajamanikam et al. (2014). In this way, it is suggested that collection frequency should be
designed to take into account the amount of waste generated and the waste containers’ storage
capacity, as in the Irkutsk city.
Regarding waste treatment, composting is the most viable treatment form, due to the great
proportion of organic material present in the overall breakdown of USW in BRICS countries,
as indicated by Zia and Devadas (2008), Kumar et al. (2009) and Narayana (2009). However,
to initiate this activity, the material must be separated at the generating source in order that the
recyclable material can be directed to recycling, and organic material to composting. An
example of good management practice is the Sao Paulo Project (Sao Paulo, 2014), which is
connected to the Sao Paulo city government and aims to orient and reduce the waste of tons of
organic waste. This organic waste is not reused but is sent without treatment to the city sanitary
landfills. Therefore, it is important to emphasize that the treatment choice will also be
influenced by political, social, economic and environmental factors, such as political interests,
financial resources availability and environmental awareness.
The main form of final disposal in BRICS countries is sanitary landfills, which are
frequently found to be in irregular and/or clandestine operation. Practices of reduction of
generation, separation at the source, recycling and composting are all important tools to
diminish the volume of USW destined for landfills, and, in turn, encourage only rejected
material to be sent to these deposits. This reduction in the waste volume sent to final disposal
is extremely important to increase the landfills lifespan and to reduce both new disposal areas
and investments.

Rev. Ambient. Água vol. 13 n. 2, e2157 - Taubaté 2018
14 Andriani Tavares Tenório Gonçalves et al.
Thus, in the case of future directions for USWM, benchmarking the use of the best
management practices in countries and municipalities is fundamental. Moreover, engagement
and discipline of the three sectors (population, public and private authorities) in the USWM are
meaningful characteristics to increase performance and efficiency in the stages of management.
5. CONCLUSIONS
The objective of this article was to analyze the status of urban solid waste management in
BRICS countries through a Systematic Literature Review. Essential points were taken into
account in the USWM, such as the generation rate, composition, storage form, collection,
besides the main ways of treatments and final disposal of MSW. This initial stage of research
and data collection sought to information and knowledge about the techniques, strategies and
methods used in these countries. From the results and discussions about the analysis of the 46
articles selected for this work, it was possible to make some recommendations, contributing in
this way to better waste management in these countries.
The BRICS countries present a lot of common characteristics, such as problems in their
management systems, the participation of the informal sector, considerable quantities of organic
material, the use of landfills and irregular areas for final disposal.
The main barriers to USWM faced by these countries are directly related to a lack of
financial resources, adequate local infrastructure, planning, quantity data, types of waste
generated and definition of responsibilities of the agents involved in the process. The
implementation of long-term planning measures that encourage the reduction of generation,
separation at source, recycling, composting and landfill volume reduction are some actions that
can be taken by these countries to improve the USWM system.
It is important to highlight the meaningful role of the informal sector in the collection and
separation stages of MSW in BRICS countries. However, it is evident that the informal sector
is not integrated into the formal management system and this integration is necessary to increase
the efficiency of USWM. Regarding the integration process, this can occur through professional
training, as well as through the legalization of the work of these waste pickers, which lead to
an increase in the amount of recyclable waste collected and, consequently, facilitate treatment
and final disposal stages. In this sense, economic, environmental and social gains are generated.
The decentralization of USWM services, along with definitions of clear roles and
responsibilities for the public and private sectors, in cooperation with the population, is noted
as a necessary measure for the creation of efficient USWM in BRICS countries. This
decentralization can favor the management system as it begins to consider the typical features
of each locality throughout management system planning. Inadequate MSW management, in
terms of treatment technologies, recycling, final disposal and management strategy, leads to
economic loss while posing a threat to public health and natural resources.
It is worth mentioning that there is no single model for USWM which would meet the
needs of all countries. Each solution must be based on location, taking into account not only
the physical characteristics of the system, but also the governmental and cultural factors.
Although, regardless of the location, for the management to guarantee a minimum level of
satisfaction there must be both administrative (public policies, legislation, financial and human
resources) and technical-operational (storage, collection, transportation, treatment and final
disposal) structures in place.
Furthermore, before any USWM implementation, municipalities must put themselves
through multiple assessments in terms of technology and possible methods to be used. Thus,
studies which identify local characteristics and necessities must be elaborated. The system must
be structured to attend the local reality through suitable regulations, contributing to sustainable

15 Urban solid waste challenges in the BRICS …
Rev. Ambient. Água vol. 13 n. 2, e2157 - Taubaté 2018
management of urban solid waste and seeking to work in conjunction with the public sector,
the private sector and society, all with well-defined roles and responsibilities.
6. ACKNOWLEDGEMENTS
The authors would like to thank CAPES, CNPq, and FAPEMIG for their financial support given
to many projects that helped develop this study.
7. REFERENCES
ABDULI, M. A.; TAVAKOLLI, H.; AZARI, A. Alternatives for solid waste management in
Isfahan, Iran a case study. Waste Management & Research, v. 31, n. 5, p. 532-537,
2013. https://doi.org/10.1177/0734242X13477718
ALLESCH, A.; BRUNNER, P. H. Assessment methods for solid waste management: A
literature review. Waste Management & Research, v. 32, n. 6, p. 461–473, 2014.
http://doi.org/10.1177/0734242X14535653
BATOOL, S. A.; CHAUDHRY, N.; MAJEED, K. Economic potential of recycling business in
Lahore, Pakistan. Waste Management, v. 28, p. 294–298, 2008.
https://doi.org/10.1016/j.wasman.2006.12.007
BARROS, R. M. Solid Waste Treaty: management, use, and sustainability. Rio de Janeiro:
Interciência, 2012. 374 p.
BIOLCHINI, J. C. A.; MIAN, P. G.; NATALI, A. C. C.; CONTE, T. U.; TRAVASSOS, G. H.
Scientific research ontology to support systematic review in software engineering.
Advanced Engineering Informatics, v. 21, p. 133-151, 2007.
BRAZIL. Lei Nº 12.305, de 2 de agosto de 2010. Institui a Política Nacional de Resíduos
Sólidos; altera a Lei no 9.605, de 12 de fevereiro de 1998; e dá outras providências. Diário
Oficial [da] União, Brasília, 3 ago. 2010.
BRAZIL. Ministry of Foreign Affairs. Economic Data and Trade Statistics. 2014. Available
in: http://brics.itamaraty.gov.br/pt_br/sobre-o-brics/dados-economicos. Access in:
November 02, 2016.
BRAZIL Ministry of Environment. National Policy of Solid Waste. 2011. Available in:
http://www.mma.gov.br/pol%C3%ADtica-de-res%C3%ADduos-s%C3%B3lidos.
Access in: March 02, 2017.
BRAZILIAN PUBLIC CLEANERS COMPANIES AND SPECIAL WASTE ASSOCIATION
- ABRELPE. Overview of Solid Waste in Brazil 2014. São Paulo, 2015. 118 p.
BRERETON, P.; KITCHENHAM, B. A.; BUDGEN, D.; TURNER, M.; KHALIL, M. Lessons
from applying the systematic literature review process within the software engineering
domain. The Journal of System and Software, v. 80, p. 571-583, 2007.
https://doi.org/10.1016/j.jss.2006.07.009
CAMPOS, H. K. T. Income and evolution of per capita generation of solid waste in Brazil.
Engenharia Sanitária e Ambiental, v. 17, n. 2, p. 171-180, 2012.
http://dx.doi.org/10.1590/S1413-41522012000200006
CHAKRABARTI, S.; MAJUMDER, A.; CHAKRABARTI, S. Public-community participation
in household waste management in India: An operational approach. Habitat
International, v. 33, p. 125-130, 2009. https://doi.org/10.1016/j.habitatint.2008.05.009

Rev. Ambient. Água vol. 13 n. 2, e2157 - Taubaté 2018
16 Andriani Tavares Tenório Gonçalves et al.
CHATTOPADHYAY, S.; DUTTA, A.; RAY, S. Municipal solid waste management in
Kolkata, India – A review. Waste Management, v. 29, p. 1449-1458, 2009.
https://doi.org/10.1016/j.wasman.2008.08.030
CHEN, C. A performance evaluation of MSW management practice in Taiwan. Resources,
Conservation and Recycling, v. 54, p. 1353–1361, 2010.
https://doi.org/10.1016/j.resconrec.2010.05.003
CHEN, X.; GENG, Y.; FUJITA, T. An overview of municipal solid waste management in
China. Waste Management, v. 30, p. 716-724, 2010.
https://doi.org/10.1016/j.wasman.2009.10.011
COETZEE, J. A.; HAIDER, M. S.; HALL, C. J.; KERAAN, S. Impacts on solid waste disposal
resulting from the implementation of integrated waste management policies and plans:
City of Cape Town, South Africa, 2007. In: INTERNATIONAL WASTE
MANAGEMENT AND LANDFILL SYMPOSIUM, 17., 2007, Santa Margherita di Pula,
Cagliari, Proceedings… Sardinia, out. 2007.
COOK, D. J.; MULROW, C. D.; HAYNES, R. B. Systematic Reviews: Synthesis of Best
Evidence for Clinical Decisions. Annals of Internal Medicine, v. 126, p. 376-380, 1997.
COSTA, L. E. B.; COSTA, S. K.; REGO, N. A. C.; SILVA JUNIOR, M. F. Gravimetric model
of household solid waste and socio-economic profile in the city of Salinas / MG. Revista
Ibero – Americana de Ciências Ambientais, v. 3, n. 2, p. 73-90, 2012.
https://doi.org/10.6008/ESS2179-6858.2012.002.0005
COUTH, R.; TROIS, C. Carbon emissions reduction strategies in Africa from improved waste
management: A review. Waste Management, v. 30, p. 2336-2346, 2010.
https://doi.org/10.1016/j.wasman.2010.04.013
DAI, C.; LI, Y. P.; HUANG, G. H. A two-stage support-vector-regression optimization model
for municipal solid waste management e a case study of Beijing, China. Journal of
Environmental Management, v. 92, p. 3023-3037, 2011.
https://doi.org/10.1016/j.jenvman.2011.06.038
DAMGHANI, A. M.; SAVARYPOUR, G.; ZAND, E.; DEIHIMFARD, R. Municipal solid
waste management in Tehran: current practices, opportunities and challenges. Waste
Management, v. 28, p. 929–934, 2008. https://doi.org/10.1016/j.wasman.2007.06.010
DORN, T.; NELLES, M.; FLAMME, S.; JINMING; C. Waste disposal technology transfer
matching requirement clusters for waste disposal facilities in China. Waste
Management, v. 32, p. 2177-2184, 2012. https://doi.org/10.1016/j.wasman.2012.05.038
EZEAH, C.; FAZAKERLEY, J. A; ROBERTS, C. L. Emerging trends in informal sector
recycling in developing and transitional countries. Waste Management, v. 33, p. 2509-
2519, 2013. https://doi.org/10.1016/j.wasman.2013.06.020
FEI, F.; QU, L.; WEN, Z.; XUE, Y.; ZHANG, H. How to integrate the informal recycling
system into municipal solid waste management in developing countries: Based on a
China’s case in Suzhou urban area. Resources, Conservation and Recycling, v. 110, p.
74-86, 2016. https://doi.org/10.1016/j.resconrec.2016.03.019
FERRI, G. L.; CHAVES, G. L. D.; RIBEIRO, G. M. Reverse logistics network for municipal
solid waste management: The inclusion of waste pickers as a Brazilian legal requirement.
Waste Management, v. 40, p. 173-191, 2015.
https://doi.org/10.1016/j.wasman.2015.02.036
17 Urban solid waste challenges in the BRICS …
Rev. Ambient. Água vol. 13 n. 2, e2157 - Taubaté 2018
FU, H.; LI, Z.; WANG, R. Estimating municipal solid waste generation by different activities
and various resident groups in five provinces of China. Waste Management, v. 41, p. 3-
11, 2015. https://doi.org/10.1016/j.wasman.2015.03.029
HAZRA, T.; GOEL, S. Solid waste management in Kolkata, India: Practices and challenges.
Waste Management, v. 29, p. 470-478, 2009.
https://doi.org/10.1016/j.wasman.2008.01.023
HOORNWEG, D.; BHADA-TATA, P. What a waste: a global review of solid waste
management. Washington, DC: World Bank, 2012.
HUI, Y.; LI’AO, W.; FENWEI, S.; GANG, H. Urban solid waste management in Chongqing:
Challenges and opportunities. Waste Management, v. 26, p. 1052-1062, 2006.
https://doi.org/10.1016/j.wasman.2005.09.005
IRKUTSK. Ministry of Natural Resources and Environment - MNREIR. About a situation
and protection of the environment in Irkutsk region: year 2011. Irkutsk, 2012.
IRKUTSK. Municipal Ordinance of Irkutsk - MOI. The adoption of the norms of an annual
municipal waste generation in the city of Irkutsk. Irkutsk, 2008.
JHA, A. K.; SHARMA, C.; SINGH, N.; RAMESH, R.; PURVAJA, R.; GUPTA, P. K.
Greenhouse gas emissions from municipal solid waste management in Indian mega-cities:
A case study of Chennai landfill sites. Chemosphere, v. 71, p. 750-758, 2008.
https://doi.org/10.1016/j.chemosphere.2007.10.024
JIANG, J.; LOU, Z.; NG, S.; LUOBU, C.; JI, D. The current municipal solid waste management
situation in Tibet. Waste Management, v. 29, p. 1186-1191, 2009.
https://doi.org/10.1016/j.wasman.2008.06.044
JIN, J.; WANG, Z.; RAN, S. Solid waste management in Macao: practices and challenges.
Waste Management, v 26, p. 1045–1051, 2006.
https://doi.org/10.1016/j.wasman.2005.08.006
KUMAR, K. N.; GOEL, S. Characterization of Municipal Solid Waste (MSW) and a proposed
management plan for Kharagpur, West Bengal, India. Resources, Conservation and
Recycling, v. 53, p. 166-174, 2009. https://doi.org/10.1016/j.resconrec.2008.11.004
KUMAR, S.; BHATTACHARYYA, J. K.; VAIDYA, A. N.; CHAKRABARTI, T.;
DEVOTTA, S.; AKOLKAR, A. B. Assessment of the status of municipal solid waste
management in metro cities, state capitals, class I cities, and class II towns in India: An
insight. Waste Management, v. 29, p. 883-895, 2009.
https://doi.org/10.1016/j.wasman.2008.04.011
LEME, M. M. V.; ROCHA, M. H.; LORA, E. E. S.; VENTURINI, O. J.; LOPES, B. M.;
FERREIRA, C. H. Techno-economic analysis and environmental impact assessment of
energy recovery from Municipal Solid Waste (MSW) in Brazil. Resources,
Conservation and Recycling, v. 87, p. 8-20, 2014.
https://doi.org/10.1016/j.resconrec.2014.03.003
LIEBENBERG, C. J. Public Private Partnership solutions to waste management in developing
countries in Africa, 2007. In: INTERNATIONAL WASTE MANAGEMENT AND
LANDFILL SYMPOSIUM, 17., 2007. Santa Margherita di Pula, Cagliari.
Proceedings… Sardinia, out. 2007.

Rev. Ambient. Água vol. 13 n. 2, e2157 - Taubaté 2018
18 Andriani Tavares Tenório Gonçalves et al.
LINO, F. A. M.; ISMAIL, K. A. R. Alternative treatments for the municipal solid waste and
domestic sewage in Campinas, Brazil. Resources, Conservation and Recycling, v. 81,
p. 24-30, 2013. https://doi.org/10.1016/j.resconrec.2013.09.007
LINZNER, R.; SALHOFER, S. Municipal solid waste recycling and the significance of
informal sector in urban China. Waste Management & Research, v. 32, n. 9, p. 896–
907, 2014. https://doi.org/10.1177/0734242X14543555
LIU, C.; WU, X. Factors influencing municipal solid waste generation in China: A multiple
statistical analysis study. Waste Management & Research, v. 29, p. 371-378, 2010.
http://doi.org/10.1177/0734242X10380114
LIU, T.; WU, Y.; TIAN, X.; GONG, Y. Urban household solid waste generation and collection
in Beijing, China. Resources, Conservation and Recycling, v. 104, p. 31-37, 2015.
https://doi.org/10.1016/j.resconrec.2015.09.004
LOUREIRO, S.; ROVERE, E.; MAHLER, C. Analysis of Potential for Reducing Emissions of
Greenhouse Gases in Municipal Solid Waste in Brazil, in the State and City of Rio de
Janeiro. Waste Management, v. 33, p. 1302-1312, 2013.
https://doi.org/10.1016/j.wasman.2013.01.024
MASSOD, M.; BARLOW, C. Y.; WILSON, D. C. An assessment of the current municipal
solid waste management system in Lahore, Pakistan. Waste Management & Research,
v. 32, n. 9, 2014. http://doi.org/10.1177/0734242X14545373
MINGHUA, Z.; XIUMIN, F.; ROVETTA, A.; QICHANG, H.; VICENTINI, F.; BINGKAI, L.
et al. Municipal solid waste management in Pudong New Area, China. Waste
Management, v. 29, p. 1227-1233, 2009. https://doi.org/10.1016/j.wasman.2008.07.016
NARAYANA, T. Municipal solid waste management in India: From waste disposal to recovery
of resources? Waste Management, v. 29, p. 1163-1166, 2009.
https://doi.org/10.1016/j.wasman.2008.06.038
PANDEY, P. C.; SHARMA, L. K.; NATHAWAT, M. S. Geospatial strategy for sustainable
management of municipal solid waste for growing urban environment. Environmental
Monitoring and Assessment, v. 184, p. 2419-2431, 2012.
https://doi.org/10.1007/s10661-011-2127-2
PATEL M. L.; JAIN, R.; SAXENA, A. Assessment of the Municipal Solid Waste & Status of
Implementation of Municipal Solid Waste (Management & Handling), Rules, 2000 in the
State of Madhya Pradesh, 2008 – A case study. Waste Management & Research, v. 29,
p. 558-562, 2010. https://doi.org/10.1177/0734242X10372662
PATTNAIK, S.; REDDY, M. V. Assessment of Municipal Solid Waste management in
Puducherry (Pondicherry), India. Resources, Conservation and Recycling, v. 54, p.
512–520, 2010. https://doi.org/10.1016/j.resconrec.2009.10.008
RADA, E. C.; RAGAZZI, M.; FREDIZZI, P. Web-GIS oriented system viability for municipal
solid waste selective collection optimization in developed and transient economies.
Waste Management, v. 33, p. 785-792, 2013.
https://doi.org/10.1016/j.wasman.2013.01.002

19 Urban solid waste challenges in the BRICS …
Rev. Ambient. Água vol. 13 n. 2, e2157 - Taubaté 2018
RAJAMANIKAM, R.; POYYAMOLI, G.; KUMAR, S. R. L. The role of non-governmental
organizations in residential solid waste management: A case study of Puducherry, a
coastal city of India. Waste Management & Research, v. 32, p. 867-881, 2014.
https://doi.org/10.1177/0734242X14544353
RAVINDRA, K.; KAUR, K.; MOR, S. System analysis of municipal solid waste management
in Chandigarh and minimization practices for cleaner emissions. Journal of Cleaner
Production, v. 89, p. 251-256, 2015. https://doi.org/10.1016/j.jclepro.2014.10.036
RUTKOWSKI, J. E.; RUTKOWSKI, E. W. Expanding worldwide urban solid waste recycling:
The Brazilian social technology in waste pickers inclusion. Waste Management &
Research, v. 33, p. 1084-1093, 2015. https://doi.org/10.1177/0734242X15607424
SANTIAGO, L. S.; DIAS, S. M. F. Sustainability indicators matrix for the management of solid
urban waste. Engenharia Sanitária Ambiental, v.17 n.2, p. 203-212, 2012.
SÃO PAULO (City). Composta São Paulo 2014. 2014. Available in:
https://compostasaopaulo.moradadafloresta.eco.br/resultados2014/#home/0. Aaccess in:
March 01, 2017.
SHARHOLY, M.; AHMAD, K.; MAHMOOD, G.; TRIVEDI, R. C. Municipal solid waste
management in Indian cities – A review. Waste Management, v. 28, p. 459-467, 2008.
https://doi.org/10.1016/j.wasman.2007.02.008
SHARHOLY, M.; AHMAD, K.; VAISHYA, R. C.; GUPTA, R. D. Municipal solid waste
characteristics and management in Allahabad, India. Waste Management, v. 27, p. 490-
496, 2007. https://doi.org/10.1016/j.wasman.2006.03.001
SHARMA, V.; SAINI, P.; GANGWAR, R. S.; JOSHI, B. D. Assessment of municipal solid
waste generation and its management in the holy city of Haridwar, Uttarakhand State,
India. Waste Management, v. 30, n. 4, p. 725-728, 2010.
https://doi.org/10.1016/j.wasman.2010.01.001
SINGH, J.; LAURENTI, R.; SINHA, R.; FROSTELL, B. Progress and challenges to the global
waste management system. Waste management & Research, v. 32, n. 9, p. 800-812,
2014. https://doi.org/10.1177/0734242X14537868
SNYMAN, J.; VORSTER, K. Sustainability of composting as an alternative waste management
option for developing countries: a case study of the City of Tshwane. Waste
Management & Research, v. 29, p. 1222-1231, 2011.
https://doi.org/10.1177/0734242X10385747
SONG, Q.; WANG, Z.; LI, J. Environmental performance of municipal solid waste strategies
based on LCA method: a case study of Macau. Journal of Cleaner Production, v. 57, p.
92-100, 2013. https://doi.org/10.1016/j.jclepro.2013.04.042
STAROSTINA, V.; DAMGAARD, A.; RECHBERGER, H.; CHRISTENSEN, T. H. Waste
management in the Irkutsk Region, Siberia, Russia: Environmental assessment of current
practice focusing on landfilling. Waste Management & Research, v. 32, p. 389-396,
2014. https://doi.org/10.1177/0734242X14526633
SUN, Y.; GRIMES, S. The emerging dynamic structure of national innovation studies: a
bibliometric analysis. Scientometrics, v. 106, p. 17-40, 2016.
http://doi.org/10.1007/s11192-015-1778-0

Rev. Ambient. Água vol. 13 n. 2, e2157 - Taubaté 2018
20 Andriani Tavares Tenório Gonçalves et al.
TAI, J.; ZHANG, W.; CHE, Y.; FENG, D. Municipal solid waste source-separated collection
in China: A comparative analysis. Waste Management, v. 31, p. 1673-1682, 2011.
https://doi.org/10.1016/j.wasman.2011.03.014
TALYAN, V.; DAHIYA, R. P.; SREEKRISHNAN; T. R. State of municipal solid waste
management in Delhi, the capital of India. Waste Management, v. 28, p. 1276-1287,
2008. https://doi.org/10.1016/j.wasman.2007.05.017
TOSO, E. A. V.; ALEM, D. Effective location models for sorting recyclables in public
management. European Journal of Operational Research, v. 234, p. 839-860, 2014.
https://doi.org/10.1016/j.ejor.2013.10.035
UNITED NATIONS. Development Program - UNDP. Human Development Report. 2015.
Available in: http://hdr.undp.org/sites/default/files/hdr15_overview_pt.pdf. Access in:
September 11, 2016.
XU, W.; ZHOU, C.; LAN, Y; JIN, J.; CAO, A. An incentive-based source separation model for
sustainable municipal solid waste management in China. Waste Management &
Research, v. 33, n. 5, p. 469-476, 2015. https://doi.org/10.1177/0734242X15574979
WANG, Y.; LI, L.; KUBOTA, J.; HAN, R.; ZHU, X.; LU, G. Does urbanization lead to more
carbon emission? Evidence from a panel of BRICS countries. Applied Energy, v. 168,
p. 375-380, 2016. https://doi.org/10.1016/j.apenergy.2016.01.105
WANG, J.; HAN, L.; LI, S. The collection system for residential recyclables in communities
in Haidian District, Beijing: A possible approach for China recycling. Waste
Management, v. 28, p. 1672-1680, 2008. https://doi.org/10.1016/j.wasman.2007.05.020
WANG, H.; WANG, C. Municipal solid waste management in Beijing: characteristics and
challenges. Waste Management & Research, v. 31, p. 67-72, 2013.
https://doi.org/10.1177/0734242X12468199
WALTERS, G. D. The Citation Life Cycle of Articles Published in 13 American Psychological
Association Journals: A 25-Year Longitudinal Analysis. Journal of the American
Society for Information Science and Technology, v. 62, n. 8, p. 1629-1636, 2011.
YANG, Z.; ZHOU, X.; XU, L. Eco-efficiency optimization for municipal solid waste
management. Journal of Cleaner Production, v. 104, p. 242-249, 2015.
https://doi.org/10.1016/j.jclepro.2014.09.091
ZHANG, D. Q.; TAN, S. K.; GERSBERG, R. M. Municipal solid waste management in China:
Status, problems and challenges. Journal of Environmental Management, v. 91, 2010,
p. 1623-1633, 2010. https://doi.org/10.1016/j.jenvman.2010.03.012
ZHAO, J.; HUANG, J.; SUN, W. On-line early fault detection and diagnosis of municipal solid
waste incinerators. Waste Management, v. 28, p. 2406-2414, 2008.
https://doi.org/10.1016/j.wasman.2007.11.014
ZHEN-SHAN, L.; LEI, Y.; XIAO-YAN, Q.; YU-MEI, S. Municipal solid waste management
in Beijing City. Waste Management, v. 29, p. 2596-2599, 2009.
https://doi.org/10.1016/j.wasman.2009.03.018
ZIA, H.; DEVADAS, V. Urban solid waste management in Kanpur: Opportunities and
perspectives. Habitat International, v. 32, p. 58-73, 2008.
https://doi.org/10.1016/j.habitatint.2007.08.001

Ambiente & Água - An Interdisciplinary Journal of Applied Science
ISSN 1980-993X – doi:10.4136/1980-993X
www.ambi-agua.net
E-mail: [email protected]
This is an Open Access article distributed under the terms of the Creative Commons
Attribution License, which permits unrestricted use, distribution, and reproduction in
any medium, provided the original work is properly cited.
Qualidade da água utilizada em quiosques de praia
ARTICLES doi:10.4136/ambi-agua.2003
Received: 13 Sep. 2016; Accepted: 06 Feb. 2018
Diésse Nascimento Norete; Quezia Botelho Correia;
Jackline Freitas Brilhante São José*
Universidade Federal do Espírito Santo (UFES), Vitória, ES, Brasil
Departamento de Educação Integrada em Saúde. E-mail: [email protected],
[email protected], [email protected] *Autor correspondente
RESUMO Objetivou avaliar as condições higiênicossanitárias relacionadas ao abastecimento e a
qualidade microbiológica da água utilizada por quiosques de praia. A coleta dos dados
ocorreu por meio de observação direta com aplicação de lista de verificação que continha
itens como procedência da água, realização de tratamento de desinfecção antes do uso em
alimentos, frequência de higienização da caixa da água, qualidade microbiológica da água,
existência de licença sanitária e registro da última visita da vigilância sanitária. Foram
coletadas amostras de água em dez quiosques de praia e para a coleta foram utilizados
recipientes esterilizados e identificados. Para contagem de bactérias heterotróficas foi
utilizada a técnica de plaqueamento em profundidade em ágar padrão para contagem, sendo
os resultados expressos em UFC/mL. Para coliformes foi utilizado o teste do número mais
provável (coliformes a 35°C e a 45°C) e o resultado obtido foi expresso em NMP/100 mL.
Foi observado por meio da aplicação da lista de verificação que 70% dos quiosques
utilizavam apenas água da rede de abastecimento público e um dos estabelecimentos
funcionava sem licença sanitária. Das amostras coletadas, 30% apresentaram contagem total
de bactérias acima de 500 UFC/mL. Não foi detectada a presença de coliformes e E. coli em
nenhuma das amostras analisadas. Apesar dos resultados observados terem sido satisfatórios,
deve-se reforçar a necessidade do acompanhamento da qualidade da água como estratégia de
prevenção de riscos aos consumidores.
Palavras-chave: água para consumo, análise de água, coliformes.
Quality of water used by beach kiosks
ABSTRACT This study evaluated the sanitary conditions and the microbiological quality of the water
used by beach kiosks. Data was collected through direct observation, using a checklist with
such items as water source, disinfection treatment before use, frequency of water container
sanitation, microbiological quality of water, existence of sanitary license and records of the
last inspection by health authorities. Water samples were collected in labeled, sterilized
containers from 10 beach kiosks. The plate technique in depth in standard agar was used for
counting heterotrophic bacteria and the results were expressed in CFU/mL. The most-
probable number test was used to evaluate coliforms (coliforms at 35°C and 45°C) and the

Rev. Ambient. Água vol. 13 n. 2, e2003 - Taubaté 2018
2 Diésse Nascimento Norete et al.
results were expressed in NMP/100 mL. It was observed that 70% of the kiosks used only
water from the public supply and one of the establishments operated without a sanitary
license. Of the samples collected, 30% had a total bacterial count above 500 CFU/mL. No
presence of coliforms and E. coli. was detected in the samples analyzed. While the results
were satisfactory, the study reinforced the need to monitor water quality as a strategy to
prevent risks to consumers.
Keywords: analysis of water, coliforms, drinking water.
1. INTRODUÇÃO
A água é fundamental para os seres humanos e sua importância para a saúde pública é
largamente reconhecida, com a garantia da potabilidade que é essencial para a população
(Scorsafava et al., 2013; Volkweis et al., 2015). Destaca-se que a água que será consumida
pelo homem não deve conter substâncias dissolvidas em quantidades que causam toxicidade e
nem veicular micro-organismos patogênicos causadores de doenças (Santos et al., 2013).
Deste modo, a água é própria para o consumo humano quando atende aos parâmetros
microbiológicos e físico-químicos das especificações de potabilidade estabelecidas pela
Portaria nº 2.914/2011 do Ministério da Saúde (MS) (Brasil, 2011). Caso não atenda a estes
requisitos, a água pode afetar ou depreciar equipamentos, instalações e, principalmente,
favorecer a possibilidade de contaminação e ocorrência de enfermidades aos consumidores
(Mouchrek e Carvalho, 2016).
O uso de água sem controle de qualidade pode comprometer a saúde pública de forma a
proporcionar riscos individuais ou coletivos, imediatos ou de longo prazo. O consumo de
água contaminada, não só para beber, mas também para uso diário, pode acarretar a
ocorrência de doenças de transmissão hídrica. Este contexto de negligência colabora para o
alto custo e a necessidade de serviços especializados para o tratamento destas doenças (Araújo
et al., 2013).
A contaminação da água por micro-organismos patogênicos pode ocorrer principalmente
por fezes de origem humana e animal. As enfermidades mais comuns causadas por estes
agentes etiológicos são a febre tifóide, febre paratifóide, cólera, disenteria bacilar, diarreias e
hepatites (Nkere et al., 2011). A pesquisa de micro-organismos patogênicos na água requer
procedimentos complexos e longos, sendo indispensável a utilização de indicadores de
contaminação de origem fecal para avaliar a qualidade microbiológica da água. Dentre os
principais destacam-se os coliformes totais (coliformes a 35°C), coliformes termotolerantes
(coliformes a 45°C) e Escherichia coli (WHO, 2011). Os coliformes a 35°C são bacilos gram
negativos, aeróbios ou anaeróbios facultativos, não formadores de esporos, oxidase-negativos,
e fermentam lactose com produção de ácido e gás. Neste grupo, a maioria pertence aos
gêneros Escherichia, Citrobacter, Klebsiella e Enterobacter. Já os coliformes a 45°C tem
como principal representante a Escherichia coli, de origem exclusivamente fecal (Souza,
2012).
No preparo de alimentos existem muitos procedimentos nos quais o uso da água está
envolvido como por exemplo, limpeza e sanitização de alimentos, higienização de mãos de
manipuladores, higienização de utensílios e superfícies que entram em contato com alimentos,
bem como na cocção dos alimentos (Silveira et al., 2011). Assim, torna-se crucial a
potabilidade da água para contribuir para melhor qualidade higiênicossanitária das
preparações elaboradas em estabelecimentos comerciais, como os quiosques de praia.
Deste modo, este trabalho teve como objetivo avaliar as condições higiênicossanitárias
relacionadas ao abastecimento de água e avaliar a qualidade microbiológica da água utilizada
por quiosques de praia.

3 Qualidade da água utilizada em quiosques …
Rev. Ambient. Água vol. 13 n. 2, e2003 - Taubaté 2018
2. MATERIAL E MÉTODOS
Foi realizado no período de novembro a dezembro de 2014 um estudo transversal,
observacional e analítico em quiosques de praia localizados em Vila Velha-ES. Inicialmente,
os responsáveis pelos estabelecimentos foram contatados por meio de carta convite para
apresentação dos objetivos da pesquisa e, em seguida foi solicitada a permissão para visita,
aplicação da lista de verificação e coleta das amostras de água.
Dos 30 quiosques existentes no local estudado, dez concordaram em participar da
pesquisa, representando 33,33% do número total de estabelecimentos.
2.1. Aplicação da Lista de Verificação
A coleta dos dados ocorreu por meio de observação direta durante as visitas realizadas
por pesquisadores treinados. Foi aplicada uma lista de verificação, baseada nos itens
relacionados ao abastecimento de água contidos na Resolução 216/2004 do Ministério da
Saúde (Anvisa, 2004). A lista de verificação foi composta por 10 itens que estavam
relacionados à procedência da água; à realização de tratamento de desinfecção antes do uso
em alimentos (para preparo ou higienização, por exemplo), e no caso de realização de
tratamento prévio quem era o responsável pelo procedimento; à frequência de higienização da
caixa da água: se realizava e com que frequência era efetuado o acompanhamento da
qualidade microbiológica da água; existência de licença sanitária; e registro da última visita
da vigilância sanitária. Em cada visita realizada os pesquisadores permaneceram
aproximadamente por uma hora, durante o funcionamento do estabelecimento, para
observação dos itens presentes na lista de verificação bem como checagem de registros
disponíveis.
2.2. Análise Microbiológica das Amostras de Água
Foram realizadas coletas de amostras de águas em 10 quiosques de praia, sendo incluídos
estabelecimentos que utilizavam ou não águas subterrâneas. Para coleta utilizou-se recipiente
esterilizado e devidamente identificado. Nos recipientes esterilizados para coleta de amostras
provenientes do abastecimento público foram adicionados substância neutralizante do cloro
residual da água. Após a coleta, os frascos foram transportados ao laboratório, em caixas
isotérmicas, para execução das análises microbiológicas. O processo de coleta foi precedido
por limpeza e descontaminação da superfície das torneiras, com a finalidade de evitar a coleta
de água com componentes que não pertencem à amostra. Foram coletadas amostras da água
das torneiras da cozinha do estabelecimento. Realizou-se higienização da torneira com aplicação de álcool a 70%. Foram realizadas
coletas de amostras de água em 10 quiosques (n=10) de praia, sendo incluídos
estabelecimentos que utilizavam ou não águas subterrâneas, totalizando 12 amostras de água
(m=12), pois dois quiosques eram abastecidos por duas fontes. Os quiosques foram
identificados com números de 1 a 10. Para as análises, utilizaram-se procedimentos de acordo com American Public Health
Association (APHA), descrita no Compendium of Methodos for the Microbiological
Examination of Foods (Downes e Ito, 2001). Foram realizados os seguintes testes: presuntivo para coliformes, confirmativo para
coliformes a 35°C, e confirmativo para coliformes a 45°C. Alíquotas foram colocadas em
séries de três tubos contendo caldo lauril sulfato triptose (LST), com tubo de Duharm
invertidos (teste presuntivo) e estes foram incubados a 35ºC por 24 – 48 h. Deste modo, a
partir dos tubos com leitura positiva (turvação e formação de gás), foram realizados os testes
confirmativos para coliformes 35°C em caldo Lactose Bile Verdes Brilhante (VB) a 2% a
35ºC por 24 – 48 h, e, coliformes 45°C em caldo Escherichia coli (EC) a 45ºC por 24 – 48 h.
Ao avaliar a combinação de números correspondentes aos tubos que apresentaram resultado

Rev. Ambient. Água vol. 13 n. 2, e2003 - Taubaté 2018
4 Diésse Nascimento Norete et al.
positivo, foi verificado o Número Mais Provável de acordo com a tabela de NMP, conforme
os procedimentos básicos de contagem. O valor obtido foi expresso em NMP/100 mL. Para a
contagem total de heterotróficos foi feita semeadura em profundidade em Agar Padrão para
Contagem (PCA), sendo os resultados expressos em UFC/mL. Os resultados obtidos foram analisados e comparados com os padrões previstos na
Portaria nº 2914 de 2011(Brasil, 2011). Para análise dos dados coletados a partir da lista de
verificação foi realizada estatística descritiva com uso de frequência e valores percentuais
com auxílio do software Microsoft Office Excel®, 2010.
3. RESULTADOS E DISCUSSÃO
Foi observada por meio da aplicação da lista de verificação que 70% dos quiosques
utilizavam apenas água da rede de abastecimento público (Tabela 1). Os demais utilizavam
água proveniente da rede de abastecimento público e/ou de poços subterrâneos. Mouchrek e
Carvalho (2016), em estudo com serviços de alimentação, também observaram predomínio do
abastecimento de água pelo serviço público.
A água de abastecimento público é um recurso hídrico que deve ser retirado da natureza e
oferecido à população em quantidade e qualidade adequadas. Esta água pode ser proveniente
de diferentes fontes como água de superfície (lagos, rios e açudes) e águas do lençol freático
que são subterrâneas (Liguori et al., 2010). A água subterrânea é um sistema alternativo de
abastecimento e representa 97% dos recursos hídricos disponíveis ao homem e atende mais da
metade da população mundial, principalmente em regiões de clima semiárido (Colvara et al.,
2009).
Tabela 1. Frequência do abastecimento de água
por serviço público e/ ou poço artesiano em dez
quiosques de praia, Vila Velha-ES.
Fonte de Abastecimento Frequência %
Público 7 70
Público + Poços artesianos 2 20
Poços artesianos 1 10
Quanto ao tratamento prévio à utilização da água, verificou-se que apenas 10% dos
quiosques realizavam tal procedimento. Ressalta-se que este estabelecimento era o mesmo
que utilizava água proveniente de poços artesianos. Assim, entende-se que a maioria os donos
dos estabelecimentos confiavam na qualidade da água que recebiam por meio do
abastecimento público. Aqueles que tomavam precauções com relação a tratamentos de água
realizavam procedimentos como a fervura ou a adição de hipoclorito de sódio antes do uso em
alimentos.
Quanto à frequência da limpeza da caixa d´água, foram consultados registros, sendo
observado que 70% dos quiosques realizavam a cada 6 meses e este procedimento era
realizado pelo próprio responsável pelo estabelecimento. Estes quiosques eram os mesmos
que utilizavam apenas água proveniente do abastecimento público. Os demais
estabelecimentos realizavam a cada dois meses, o que indica maior preocupação destes com o
controle de qualidade da água. Os resultados do presente estudo foram superiores ao
observado por Silveira et al. (2011) que verificaram que somente 18,8% das escolas avaliadas
tinham reservatório de água em condições adequadas com limpeza semestral. Segundo a
legislação vigente sobre boas práticas para serviços de alimentação (Anvisa, 2004), o
reservatório de água deve ser edificado e mantido em perfeito estado de higiene e conservação
de modo que a qualidade da água não seja afetada. O procedimento de higienização do

5 Qualidade da água utilizada em quiosques …
Rev. Ambient. Água vol. 13 n. 2, e2003 - Taubaté 2018
reservatório deve ser realizado em um intervalo máximo de seis meses e devem ser feitos
registros da operação. Quando este procedimento for realizado por empresa terceirizada é
necessária a apresentação de certificado de execução do serviço (Anvisa, 2004).
O controle de qualidade da água para uso na produção de alimentos é imprescindível para
reduzir riscos à saúde dos consumidores. Portanto, a água deve ser potável, e para manter a
qualidade é necessário que o reservatório esteja íntegro, limpo e tapado, bem como, deve ser
realizado periodicamente o acompanhamento da qualidade microbiológico da água (Portugal
et al., 2015).
Com relação às análises microbiológicas da água utilizada nos quiosques, 50% destes
realizavam coleta e encaminhavam amostras para análise pelo menos uma vez ao ano. Vale
destacar que este controle da qualidade microbiológica era realizado por quiosques que
recebiam água do abastecimento público. Entretanto, os laudos de potabilidade não estavam
disponíveis no local. No estudo de Silveira et al. (2011), somente 20,5% das escolas
apresentavam o laudo de potabilidade da água. Verificou-se que 10% (n=1) dos quiosques não
apresentavam alvará emitido pela Vigilância Sanitária. Quanto ao registro da última visita
realizada pela Vigilância Sanitária no estabelecimento, 80% dos quiosques haviam recebido a
fiscalização há mais de seis meses. Os resultados das análises microbiológicas estão apresentados na Tabela 2. Verifica-se
que todas as amostras de todos os quiosques (100%) atenderam ao padrão para coliformes
35°C e 45°C, estabelecido pela legislação vigente. O consumo de água precisa atender a
padrões de potabilidade recomendados pelos órgãos regulamentadores e trata-se de uma ação
de política pública para a prevenção de doenças e redução da mortalidade, por ser um solvente
universal e utilizado na produção de alimentos (Mouchrek e Carvalho, 2016), como em
quiosques de praia.
Castro (2013) observou que para as amostras analisadas em restaurantes, dois
estabelecimentos apresentaram água fora do padrão microbiológico exigido pela legislação
vigente. Mouchrek e Carvalho (2016), ao avaliar amostras de água de oito serviços de
alimentação (sendo quatro lanchonetes e quatro restaurantes), observaram que em 75% (n=6)
dos estabelecimentos visitados apresentavam água com qualidade microbiológica adequada.
A análise de bactérias heterotróficas não é um parâmetro exigido pela legislação
brasileira relacionada à potabilidade de água para consumo humano, mas permite avaliar a
qualidade da água utilizada tanto para cocção dos alimentos quanto para higienização de
mãos, de superfícies e dos alimentos. Em estudo realizado por Vasconcelos et al. (2015), com
água de bebedouros de três Campi da Universidade Federal do Ceará, foram analisadas
amostras de água de cinco bebedouros, e obteve-se 6 amostras de águas contaminadas que
correspondiam a 2 bebedouros, cujos números de bactérias heterotróficas encontradas
estavam acima do limite permitido, sendo este achado diferente do registrado no presente
estudo.
Segundo a Portaria 2914/2011 (Brasil, 2011), alterações bruscas ou acima do normal na
contagem de bactérias heterotróficas necessitam ser averiguadas para identificação de
irregularidade e providências devem ser tomadas para restaurar a integridade do sistema de
distribuição, sendo indicado que não se ultrapasse 500 UFC/mL. Das amostras analisadas,
50% (m=6) apresentaram contagem superior ao recomendado para bactérias heterotróficas,
sendo que metade (m=3) destas eram amostras provenientes de poços subterrâneos. Resultado
semelhante foi observado por Silveira et al. (2011) que verificaram que em três escolas a água
utilizada apresentou contagem superior a 500 UFC/mL.
Apesar do resultado observado no presente estudo, vale ressaltar que no Brasil entre 1999
e 2008 foram notificados 343 surtos relacionados ao consumo de água, sendo a origem deste
desconhecida (Brasil, 2008). O controle da qualidade da água para consumo humano é um
conjunto de ações exercidas de forma continuada, destinadas a averiguar se a água fornecida à

Rev. Ambient. Água vol. 13 n. 2, e2003 - Taubaté 2018
6 Diésse Nascimento Norete et al.
população é potável, de forma a assegurar a manutenção desta condição (Castro, 2013). A
água que é utilizada para o consumo direto ou no preparo dos alimentos deve ser controlada
independente das rotinas de manipulação dos alimentos (Anvisa, 2004). A água é
rotineiramente utilizada para a lavagem de frutas e hortaliças com objetivo de obter alimento
microbiologicamente seguro (Abreu et al., 2010). Sendo assim, é imprescindível que a água
utilizada seja de qualidade.
Destaca-se ainda que 30% (n= 3) dos quiosques utilizavam águas provenientes de poços
subterrâneos. Segundo Queiroz et al. (2002) populações que dependem de fontes alternativas,
como poços, estão expostas a maiores contaminações. Apesar disso, no presente estudo
nenhuma das amostras de poços foi considerada imprópria. Este resultado difere-se do
observado por Araújo et al. (2013) que constataram que 75% dos poços avaliados
apresentaram água imprópria para consumo devido à presença de coliformes a 35°C e
coliformes 45°C acima do preconizado.
Tabela 2. Determinação de coliformes a 35°C, a 45°C e contagem de bactérias heterotróficas de
amostras de águas coletadas em quiosques de praia, Vila Velha-ES.
Amostras de
água Quiosque Origem
Coliformes a 35°C
(NMP/100 mL)
Coliformes a 45°C
(NMP/100 mL)
Contagem de Bactérias
Heterotróficas (UFC/mL)
1 1 Rede de
Abastecimento < 1,0 < 1,0 1,0 x10²
2 1 Poço subterrâneo < 1,0 < 1,0 1,3 x10³
3 2 Rede de
Abastecimento < 1,0 < 1,0 2,0 x10²
4 3 Rede de
Abastecimento < 1,0 < 1,0 6,0 x10²
5 4 Rede de
Abastecimento < 1,0 < 1,0 2,0 x10²
6 4 Poço subterrâneo < 1,0 < 1,0 2,9 x10³
7 5 Rede de
Abastecimento < 1,0 < 1,0 5,0 x10²
8 6 Rede de
Abastecimento < 1,0 < 1,0 1,1 x10²
9 7 Rede de
Abastecimento < 1,0 < 1,0 2,1 x10²
10 8 Rede de
Abastecimento < 1,0 < 1,0 5,7 x10²
11 9 Poço subterrâneo < 1,0 < 1,0 2,3 x10³
12 10 Rede de
Abastecimento < 1,0 < 1,0 1,2 x10³
* Padrão microbiológico para água para consumo humano no sistema de distribuição (reservatórios e
rede) estabelecido pela Portaria 2914/2011: Escherichia coli- Ausência em 100 mL; Coliformes totais:
Ausência em 100 mL em 95% das amostras examinadas (Sistemas ou soluções alternativas coletivas
que abastecem a partir de 20.000 habitantes).
As águas extraídas por poços têm sido cada vez mais utilizadas para o consumo humano,
pois são de fácil obtenção e custo, principalmente para pessoas que não tem acesso à rede
pública de abastecimento. Porém, este tipo de abastecimento pode se tornar uma preocupação
devido ao fato de muitas vezes estarem próximas às residências, onde podem ser
contaminados por dejetos humanos e de animais (Volkweis et al., 2015). As principais causas
de contaminação da água de poços estão relacionadas à entrada de impurezas por meio do
procedimento de abertura superior do poço, contaminação na ocasião da retirada de água,
infiltração de águas de enxurradas de locais próximos ao poço, fossa negra ou poço
absorvente (Souza, 2012). Quiosques que utilizam água de poço sem o tratamento para
garantir a potabilidade põem em risco à qualidade dos alimentos servidos (Portugal et al.,
2015).
Destaca-se que a recusa dos demais quiosques quanto à participação da pesquisa e

7 Qualidade da água utilizada em quiosques …
Rev. Ambient. Água vol. 13 n. 2, e2003 - Taubaté 2018
autorização para as coletas possa estar relacionada à falhas no controle de qualidade de água
reconhecidas pelos próprios responsáveis pelo estabelecimento.
Ao final do desenvolvimento da pesquisa foram apresentados os resultados das análises
aos responsáveis pelos estabelecimentos e houve esclarecimento quanto à necessidade da
manutenção da qualidade da água utilizada para promoção da saúde pública.
4. CONCLUSÃO
Os resultados obtidos a partir da lista de verificação indicam que a maioria dos
estabelecimentos tem preocupação com a qualidade da água utilizada. A análise
microbiológica das amostras de água não revelou resultados preocupantes, mas não se deve
desconsiderar a necessidade do acompanhamento pelos órgãos competentes para verificação
ao atendimento a legislação vigente.
5. REFERÊNCIAS BIBLIOGRÁFICAS
ABREU, I. M. O.; JUNQUEIRA, A. M. R.; PEIXOTO, J. R.; OLIVEIRA, S. A. Qualidade
microbiológica e produtividade de alface sob adubação química e orgânica. Ciência e
Tecnologia de Alimentos, v. 30, supl. 1, p. 108-118, maio 2010.
http://dx.doi.org/10.1590/S0101-20612010000500018
AGÊNCIA NACIONAL DE VIGILÂNCIA SANITÁRIA – ANVISA (Brasil). Resolução -
RDC nº 216 de 15 de setembro de 2004. Dispõe sobre o Regulamento Técnico de Boas
Práticas para Serviços de Alimentação. Diário Oficial [da] União, Brasília, 16 set.
2004.
ARAÚJO, C. F.; HIPOLITO, J. R.; WAICHMAN, A. V. Avaliação da qualidade da água de
poço. Revista do Instituto Adolfo Lutz, v. 72, n. 1, p. 53-58, 2013.
BRASIL. Ministério da Saúde. Portaria nº. 2.914, de 12 de dezembro de 2011. Dispõe sobre
os procedimentos de controle e de vigilância da qualidade da água para consumo
humano e seu padrão de potabilidade. Diário Oficial [da] União, Brasília, 14 dez.
2011.
BRASIL. Ministério da Saúde. Secretaria de Vigilância em Saúde. Surtos de DTA
ocasionados por água. 2008. Disponível em:
http://portal.saude.gov.br/portal/arquivos/pdf/surtos_agua_10.pdf. Acesso 2016.
CASTRO, R. S. D. Boas práticas de fabricação (BPF) análise de tomate e água em
restaurantes comerciais da cidade de Botucatu-SP. 2013 Tese (Doutorado] -
Universidade Estadual Paulista Júlio de Mesquita Filho, Botucatu, 2013.
COLVARA, J. G.; LIMA, A. S.; SILVA, W. P. Avaliação da contaminação de água
subterrânea em poços artesianos no sul do Rio Grande do Sul. Brazilian Journal of
Food Technology, v. 2, p. 11-14, 2009.
DOWNES F. P.; ITO K. Compendium of methods for the microbiological examination of
foods. 4. ed. Washington D.C. APHA, 2001. p. 25-26.
LIGUORI, G.; CAVALLOTTI, I.; ARNESE, A. et al. Microbiological quality of drinking
water from dispensers in Italy. BMC Microbiology, v. 10, n. 19, p. 1-5, 2010.
https://doi.org/10.1186/1471-2180-10-19

Rev. Ambient. Água vol. 13 n. 2, e2003 - Taubaté 2018
8 Diésse Nascimento Norete et al.
MOUCHREK, A. N.; CARVALHO E. C. C. Qualidade da água em serviços de alimentação
de um bairro da zona rural de São Luís, Maranhão, Brasil. Revista Brasileira de
Pesquisa em Saúde, v.18, n.3, 130-136, 2016.
https://doi.org/10.21722/rbps.v18i3.15752
NKERE, C. K.; IBE, N. I.; IROEGBU, C. U. Bacteriological Quality of Foods and Water
Sold by Vendors and in Restaurants in Nsukka, Enugu State, Nigeria: A Comparative
Study of Three Microbiological Methods. Journal of Health, Population and
Nutrition, v. 29, n.6, p.560-566, 2011.
PORTUGAL, A. S. B.; IULIANELLO, J. M.; GOLTARA, M. C. A.; MEDEIROS, L. S.;
SILVA, E. M. M; SÃO JOSÉ, J. F. B. Condições Higiênicossanitárias em Quiosques de
Praia em Vila Velha-ES. DEMETRA: Alimentação, Nutrição & Saúde, v. 10, p. 845-
856, 2015. https://doi.org/10.12957/demetra.2015.16723
QUEIROZ, M. F.; CARDOSO, M. C. S.; SANTANA, E. M.; GOMES, A. B.; RIQUE, S. M.
N.; LOPES, C. M. A qualidade da água de consumo humano e as doenças diarréicas
agudas no Município do Cabo de Santo Agostinho, PE. Revista Brasileira
Epidemiologia, supl. esp., p. 456-462, 2002.
SANTOS, J. O.; SANTOS, R. M. S.; GOMES, M. A. D.; MIRANDA, R. C.; NÓBREGA, I.
G. M. A qualidade da água para o consumo humano: Uma discussão necessária.
Revista brasileira de Gestão Ambiental-RBGA, v. 7, n. 2, p. 19-26, 2013.
SOUZA, M. Qualidade da água utilizada em serviço de alimentação de hotéis. 2012. 83f.
Tese (Doutorado em Ciência Veterinária) – Universidade Federal Rural de Pernambuco,
Recife, 2012.
SCORSAFAVA, M. A.; SOUZA, A.; STOFER, M.; NUNES, C. A.; MILANEZ, T. V.
Qualidade físico-química da água de abastecimento da região do Vale do Ribeira-SP,
Brasil. Revista do Instituto Adolfo Lutz, v. 72, n. 1, p. 81-86, 2013.
SILVEIRA, J. T.; CAPALONGA, R.; OLIVEIRA, A. B. A.; CARDOSO, M. R. I. Avaliação
de parâmetros microbiológicos de potabilidade em amostras de água provenientes de
escolas públicas. Revista do Instituto Adolfo Lutz, v. 70, n. 3, p. 362 -367, 2011.
VASCONCELOS, T. S.; MELO, M. B.; FONTENELLE R. O. S. Qualidade microbiológica e
físico-química da água de bebedouros consumida por estudantes da Universidade
Federal do Ceará. Higiene Alimentar, v. 29, n. 64, p. 246-247, 2015.
VOLKWEIS, D. S. H.; LAZZARETTI, J.; BOITA, E. R. F.; BENETTI, F. Qualidade
microbiológica da água utilizada na produção de alimentos por agroindústrias familiares
do município de Constantina/RS. Revista Eletrônica em Gestão, Educação e
Tecnologia Ambiental, v. 19, n. 1, p. 18–26, 2015. http://dx.doi.org/105902/22361170
19182
WORLD HEALTH ORGANIZATION. Guidelines for Drinking Water Quality. 4th Ed.
Geneva, 2011.
Ambiente & Água - An Interdisciplinary Journal of Applied Science
ISSN 1980-993X – doi:10.4136/1980-993X
www.ambi-agua.net
E-mail: [email protected]
This is an Open Access article distributed under the terms of the Creative Commons
Attribution License, which permits unrestricted use, distribution, and reproduction in any
medium, provided the original work is properly cited.
Avaliação sazonal e espacial da qualidade das águas superficiais da
bacia hidrográfica do rio Longá, Piauí, Brasil
ARTICLES doi:10.4136/ambi-agua.2054
Received: 01 Dec. 2016; Accepted: 05 Jan. 2018
Waneska Maria Vasconcelos Medeiros1*; Carlos Ernando da Silva2;
Ruceline Paiva Melo Lins3
1Universidade Federal do Piauí (UFPI), Teresina, PI, Brasil
Programa de Pós-Graduação em Desenvolvimento e Meio Ambiente (PRODEMA)
E-mail: [email protected] 2Universidade Federal do Piauí (UFPI), Teresina, PI, Brasil
Departamento Recursos Hídricos, Geotecnia e Saneamento Ambiental (DRHGSA)
E-mail: [email protected] 3Universidade Federal do Piauí (UFPI), Parnaíba, PI, Brasil
Departamento de Ciências Biológicas. E-mail: [email protected] *Autor correspondente
RESUMO Este artigo teve como objetivo avaliar a qualidade das águas superficiais da bacia
hidrográfica do rio Longá no Estado do Piauí, Brasil. Sete pontos foram monitorados, com base
na proximidade de estações meteorológicas e acessibilidade, para obter melhores
caracterizações espaciais e de ocupação da bacia hidrográfica. As amostras de água foram
coletadas mensalmente (01/2015-12/2015). Foram medidas as variáveis: temperatura, pH,
turbidez, condutividade elétrica, sólidos totais, fósforo total, nitrato, oxigênio dissolvido,
demanda bioquímica de oxigênio (DBO) e Escherichia coli (E. coli). Os resultados foram
avaliados individualmente e comparados aos padrões brasileiros para águas doces de classe 2,
conforme Resolução nº 357/2005 do Conselho Nacional do Meio Ambiente (CONAMA). Os
dados foram avaliados utilizando-se análises multivariadas (agrupamento e análise de
componentes principais - ACP). As variáveis E. coli, pH, turbidez, nitrato, DBO e
condutividade elétrica variaram entre os dois períodos analisados (seco e chuvoso). As variáveis
DBO, E. coli estiveram em desacordo com os padrões do CONAMA nos pontos urbanos P2,
P3 e P5, devido à poluição difusa observada no período chuvoso. O agrupamento mostrou uma
tendência espacial, apresentando dois grupos distintos (rural e urbano). A ACP identificou
quatro componentes principais que explicaram uma variação de 58,64% nos dados. O
Componente 1 (CP1) refletiu uma contribuição de poluentes relacionados à poluição difusa de
áreas agrícolas e urbanas. O Componente 2 (CP2) foi fortemente associado à poluição,
especialmente por esgoto doméstico não tratado. As outras ACPs também refletiram pressões
de atividades antropogênicas nos corpos d’água.
Palavras-chave: bacias hidrográficas, monitoramento ambiental, qualidade da água.

Rev. Ambient. Água vol. 13 n. 2, e2054 - Taubaté 2018
2 Waneska Maria Vasconcelos Medeiros et al.
Seasonal and spatial evaluation of the surface water quality in the
Longá river watershed, Piauí, Brazil
ABSTRACT This article evaluates the quality of the surface waters in the Longá River watershed in the
State of Piauí, Brazil. Seven points were monitored, based on their proximity to meteorological
stations and accessibility, to obtain better spatial and land-use characterizations of the
watershed. Water samples were collected monthly (01/2015–12/2015). The variables
temperature, pH, turbidity, electrical conductivity, total solids, total phosphorus, nitrate,
dissolved oxygen, biochemical oxygen demand (BOD) and Escherichia coli (E. coli) were
measured. The results were evaluated individually and compared to Brazilian standards for
Class 2 fresh waters, according to the National Environment Council’s (CONAMA) Resolution
357/2005. The data were evaluated using multivariate analyses (clustering and principal
component analysis - PCA). E. coli, pH, turbidity, nitrate, BOD, and electrical conductivity
varied between the two periods analyzed (dry and rainy). The BOD and E. coli variants were
noncompliant with the CONAMA standards at urban points P2, P3, and P5, because of nonpoint
source pollution (NPS) during the rainy season. Clustering showed a spatial trend, presenting
two distinct groups (rural and urban). PCA identified four main components that explained a
58.64% change in the data. Component 1 (CP1) reflected a contribution of pollutants related to
NPS from agricultural and urban areas, in addition to environmental factors. CP2 was strongly
associated with pollution, especially by untreated sewage releases. The other CPs also reflect
pressures from anthropogenic activities on the water bodies.
Keywords: environmental monitoring, water quality, watershed.
1. INTRODUÇÃO
Nas últimas décadas, a qualidade da água dos rios, lagos e reservatórios têm passado por
alterações que comprometem diretamente a manutenção dos usos múltiplos dos recursos
hídricos, assegurados por força da lei (Arruda et al., 2015). Nos ecossistemas aquáticos, a
heterogeneidade da qualidade da água pode ser influenciada principalmente pela contribuição
natural da bacia hidrográfica (conhecidas como background, concentrações naturais afetadas
pelas características geológicas e pedológicas do local) e pela magnitude dos impactos
antrópicos como o consumo de água, lançamento de efluentes domésticos e industriais,
escoamento superficial de áreas urbanas e rurais. Do ponto de vista temporal, as oscilações de
qualidade da água podem refletir as formas de uso e ocupação do solo (Kalscheur et al., 2012;
Cunha et al., 2013).
Diversos estudos apontam a agricultura e outras atividades agropecuárias, como uma
atividade de alto potencial degradador, sendo responsáveis pela elevação da concentração de
nutrientes nas águas superficiais, como por exemplo, fósforo e nitrogênio, bem como o uso e o
manejo do solo em áreas agrícolas acarretam alterações na qualidade da água (Menezes et al.,
2016). Em áreas urbanas e industrializadas é comum a poluição orgânica associada ao uso e
ocupação do solo (Damasceno et al., 2015). Segundo Pompêo et al. (2011), a maioria dos rios
nas cidades brasileiras está substancialmente degradada. Sendo assim, as características físicas,
químicas e biológicas de um curso d’água refletem tanto a configuração geológica quanto os
insumos da bacia hidrográfica circundante (Voza et al., 2015). Dessa forma, o monitoramento
das variáveis de qualidade da água pode ser considerado como um dos pré-requisitos para o
sucesso de qualquer sistema de gestão das águas, já que o monitoramento possibilita a obtenção
de informações necessárias, a atualização dos bancos de dados, e o acompanhamento do

3 Avaliação sazonal e espacial da qualidade …
Rev. Ambient. Água vol. 13 n. 2, e2054 - Taubaté 2018
processo de uso dos corpos hídricos, que apresenta os efeitos sobre as características
qualitativas das águas, visando subsidiar as ações de controle ambiental (Carvalho et al., 2015).
No entanto, na região Nordeste do Brasil, são poucas as séries históricas de informações
quanto às vazões nos cursos de água e praticamente inexistentes aquelas relativas à qualidade
da água. No Estado do Piauí, particularmente, o maior problema enfrentado consiste exatamente
na insuficiência de dados de qualidade de água superficiais das bacias hidrográficas (Piauí,
2010). Entre as bacias hidrográficas do Estado do Piauí, a do rio Longá chama a atenção por
estar em uma região de grande importância social, econômica e ambiental. Localizada na região
norte do Estado, em uma área de transição dos biomas Caatinga e Cerrado, tem como principais
usos do solo o extrativismo vegetal (carnaúba e babaçu), a pecuária de subsistência e a
agricultura (Brasil, 2002; Sousa e Araújo, 2009; Piauí, 2010).
As questões que nortearam este estudo foram: como se encontra a qualidade da água da
bacia hidrográfica do rio Longá, considerando a sua variação sazonal e espacial? Esse corpo
hídrico está de acordo com os limites estabelecidos pela Resolução CONAMA 357/2005
(CONAMA, 2005)? Tendo em vista que os usos múltiplos da água e as atividades antrópicas
realizadas em uma bacia hidrográfica causam significativas alterações na qualidade dos
recursos hídricos e, a pouca informação sobre a qualidade das águas da bacia hidrográfica do
rio Longá, o presente estudo teve como objetivo avaliar a variação sazonal e espacial da
qualidade da água da bacia hidrográfica do rio Longá, Piauí.
2. MATERIAL E MÉTODOS
2.1. Caracterização da área de estudo
A bacia hidrográfica do rio Longá está situada na porção norte do Estado do Piauí. Ela
estende-se entre as coordenadas 3°03' e 5°16' de latitude sul e 41°04' e 42°43' de longitude, a
oeste de Greennwich, correspondendo 8,99% da área total do Estado piauiense. Esta bacia tem
como rio principal o rio Longá que nasce na localidade Lagoa do Mato, no município de Alto
Longá, a uma altitude de 150 m. Trata-se de um rio perene no médio e baixo curso e alimenta
inúmeras lagoas de pequeno porte. Possui uma área de drenagem de 22.623 km² abrangendo
um total de 26 sedes municipais piauienses, nas quais vive uma população de aproximadamente
480 mil habitantes (IBGE, 2010).
Segundo a classificação de Kӧeppen, o clima predominante da região é do tipo tropical
quente úmido (Aw'), com chuvas de verão/outono como resultado dos deslocamentos sazonais
da Convergência Intertropical (CIT), sob a forma de massa de ar convectiva. A estação chuvosa
dessa região estende-se de janeiro a maio, sendo o trimestre fevereiro/março/abril o mais
chuvoso e, agosto/setembro/outubro, o mais seco (Piauí, 2010).
A cobertura vegetal da bacia do rio Longá apresenta na porção leste da bacia uma área de
tensão ecológica, com espécies da caatinga arbustiva, correspondendo a 25% da cobertura
vegetal da região. Na região central encontra-se a vegetação do tipo cerrado que corresponde a
50% da vegetação do território da bacia do rio Longá. Na região sudoeste encontra-se uma
vegetação do tipo floresta decidual, onde se observa espécies vegetais como o babaçu e a
carnaúba, que são de grande importância econômica para a região e ainda, o buriti e o tucum
(Piauí, 2010).
As atividades econômicas mais desenvolvidas na bacia hidrográfica do rio Longá, estão
relacionadas às atividades de extrativismo vegetal, com a extração do pó da carnaúba e a
amêndoa do babaçu (para produção de óleo); a extração de madeiras com preponderância da
lenha para utilização em fornos industriais (padarias, cerâmicas, extração de óleos, sabão, entre
outras); a extração de madeira para obtenção de matéria-prima para construção de casas, cercas,
currais e outros usos. Também existe a criação de bovinos, suínos, caprinos e ovinos, que na
sua grande maioria são criados por pequenos e médios proprietários que utilizam esses animais

Rev. Ambient. Água vol. 13 n. 2, e2054 - Taubaté 2018
4 Waneska Maria Vasconcelos Medeiros et al.
como forma de subsistência e de comercialização da carne e do couro. Entre os municípios
produtores estão Batalha e Campo Maior. Aliada à pecuária encontram-se os projetos de
irrigação que configuram um importante instrumento econômico em alguns municípios ao
longo do curso do rio Longá, como é o caso do município Barras no cultivo de melancia e os
municípios Alto Longá e Buriti dos Lopes no cultivo do arroz (Sousa e Araújo, 2009).
2.2. Estratégias de amostragem e metodologias analíticas
Para as amostragens foram selecionados sete locais de coleta, sendo quatro ao longo do rio
principal Longá e os demais localizados em três afluentes: rio Maratoã, rio dos Matos e rio
Piracuruca. Os pontos foram escolhidos levando em consideração a presença de estações
meteorológicas e a acessibilidade e; também visando obter uma melhor representatividade
espacial e de ocupação da bacia. Os locais foram denominados P1, P2, P3, P4, P5, P6 e P7,
sendo P1 mais próximo à nascente e P7 próximo ao exutório da bacia (Tabela 1). Os locais
escolhidos para o monitoramento P2, P3 e P5, estão localizados em centros urbanos dos
municípios de Barras, Esperantina e Piracuruca, respectivamente. Já P1, P4, P6 e P7 estão
localizados na zona rural dos municípios de Barras, Batalha, São José do Divino e Buriti dos
Lopes, respectivamente. A localização da bacia do rio Longá, os pontos de coleta de água e as
estações meteorológicas consultadas são ilustradas na Figura 1.
As campanhas de amostragem foram realizadas com a periodicidade mensal de janeiro a
dezembro de 2015. Alíquotas de água foram coletadas na subsuperfície no ponto central da
seção transversal do rio, à profundidade de 20 cm, aproximadamente. As variáveis de qualidade
de água investigadas foram: temperatura, oxigênio dissolvido (OD), turbidez, potencial
hidrogeniônico (pH), condutividade elétrica, sólidos totais, demanda bioquímica de oxigênio
(DBO), nitrato, fósforo total e Escherichia coli (E. coli).
Tabela 1. Posição geográfica dos pontos de coleta.
Pontos Rio Município Latitude Longitude Localização
P1 Longá Barras 04°24'34.92'' S 42°10'53.04" W rural
P2 Maratoã Barras 04°14'16.08'' S 42°18'19.08'' W urbana
P3 Longá Esperantina 03°54'10.30'' S 42°13'44.60" W urbana
P4 Matos Batalha 04°02'42.52" S 41°53'45.13" W rural
P5 Piracuruca Piracuruca 03°56'13.38" S 41°43'01.63" W urbana
P6 Longá São José do Divino 03°43'26.04'' S 41°58'27.12'' W rural
P7 Longá Buriti dos Lopes 03°19'09.85" S 41°53'45.40" W rural
A temperatura e a concentração do oxigênio dissolvido foram medidas in situ utilizando-
se um medidor portátil Oxímetro AT 160 Microprocessado da Alfakite. Para a determinação
das demais variáveis foram coletadas amostras de água e armazenadas em frascos de vidro e
polietileno. Para a análise bacteriológica utilizou-se sacos esterilizados. As amostras foram
conservadas por meio de refrigeração (em caixas de isopor com gelo) e transportadas para o
Laboratório de Saneamento Ambiental da Universidade Federal do Piauí. As análises dos
parâmetros de qualidade da água foram realizadas segundo metodologias descritas no APHA
et al. (2005) (Tabela 2).
Para avaliar a variação da qualidade da água nos períodos seco e chuvoso buscou-se
analisar o regime de sazonalidade da região. A série pluviométrica com os dados de precipitação
diária da bacia hidrográfica do rio Longá, no período de janeiro a dezembro de 2015, foi obtida
na Agência Nacional de Águas (ANA) através do sistema Hidroweb (ANA, 2015) e no Instituto
Nacional de Meteorologia (INMET, 2015). Os dados foram coletados das estações Fazenda
Alegria (34930000) e Pedrinhas (34936000) localizadas no município de Barras, Piracuruca
(34976000) localizada no município de Piracuruca, Tinguis (34980000) localizada no

5 Avaliação sazonal e espacial da qualidade …
Rev. Ambient. Água vol. 13 n. 2, e2054 - Taubaté 2018
município de São José do Divino, Piripiri (OMM: 82480) localizada no município de Piripiri e
Esperantina (OMM: 82298) localizada no município de Esperantina.
Figura 1. Mapa de localização da bacia hidrográfica do rio Longá, locais de amostragem da água e
estações meteorológicas.
Tabela 2. Metodologia da determinação das variáveis de qualidade
da água.
Parâmetros Método
Temperatura da água Filamento de mercúrio
Condutividade elétrica
Turbidez
Condutimétrico
Turbidimétrico
Sólidos totais Gravimétrico
pH Eletrométrico
Fosfato Espectrofotométrico
Nitrato Espectrofotométrico
Demanda Bioquímica de Oxigênio Winkler/incubação
Oxigênio dissolvido Eletrométrico
Escherichia coli Enzimático substrato definido
Para averiguar a conformidade do enquadramento dos rios da bacia hidrográfica do rio
Longá, os resultados das análises foram confrontados com os parâmetros estabelecidos pela
Resolução CONAMA nº 357/2005 (CONAMA, 2005). Após a comparação dos dados foram
analisadas as diferenças espaciais e temporais das variáveis.
2.3. Análise estatística
Para obter o perfil das variáveis de qualidade da água foi utilizada a estatística descritiva
(média, mediana, mínimo e máximo) e para testar as diferenças entre pontos e períodos sazonais
foi utilizado o teste não-paramétrico Kruskal-Wallis, com nível de significância de 5%. Para
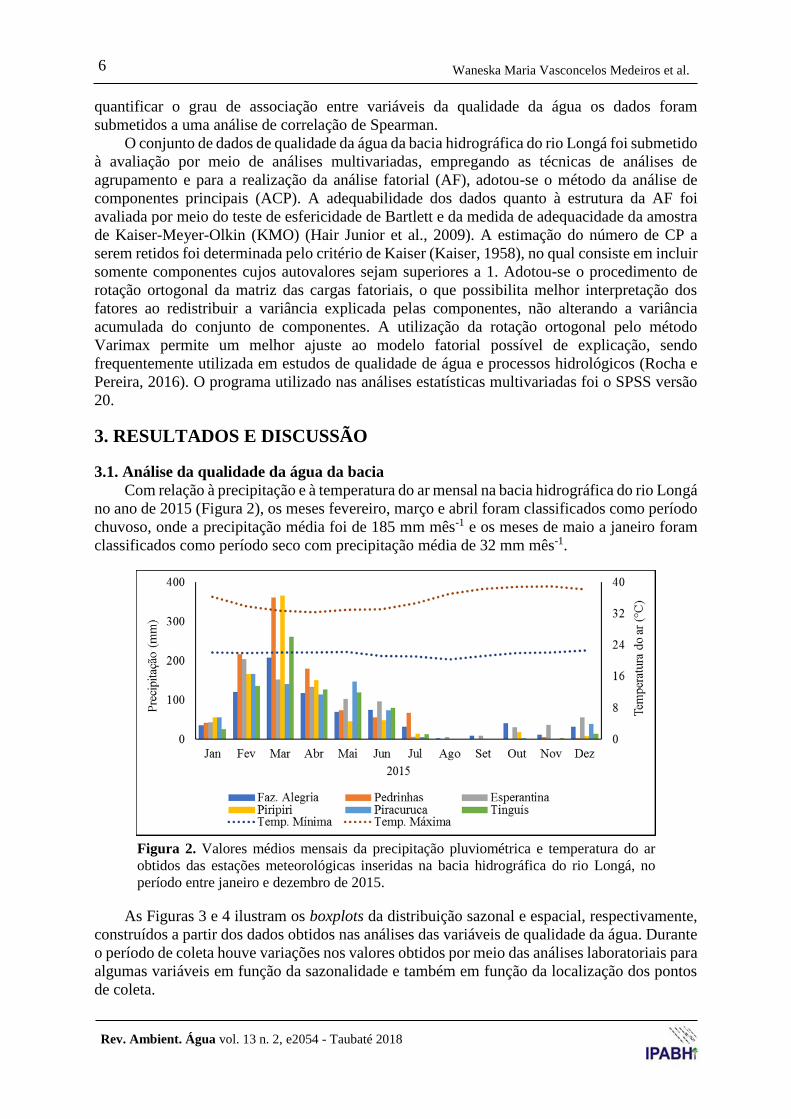
Rev. Ambient. Água vol. 13 n. 2, e2054 - Taubaté 2018
6 Waneska Maria Vasconcelos Medeiros et al.
quantificar o grau de associação entre variáveis da qualidade da água os dados foram
submetidos a uma análise de correlação de Spearman.
O conjunto de dados de qualidade da água da bacia hidrográfica do rio Longá foi submetido
à avaliação por meio de análises multivariadas, empregando as técnicas de análises de
agrupamento e para a realização da análise fatorial (AF), adotou-se o método da análise de
componentes principais (ACP). A adequabilidade dos dados quanto à estrutura da AF foi
avaliada por meio do teste de esfericidade de Bartlett e da medida de adequacidade da amostra
de Kaiser-Meyer-Olkin (KMO) (Hair Junior et al., 2009). A estimação do número de CP a
serem retidos foi determinada pelo critério de Kaiser (Kaiser, 1958), no qual consiste em incluir
somente componentes cujos autovalores sejam superiores a 1. Adotou-se o procedimento de
rotação ortogonal da matriz das cargas fatoriais, o que possibilita melhor interpretação dos
fatores ao redistribuir a variância explicada pelas componentes, não alterando a variância
acumulada do conjunto de componentes. A utilização da rotação ortogonal pelo método
Varimax permite um melhor ajuste ao modelo fatorial possível de explicação, sendo
frequentemente utilizada em estudos de qualidade de água e processos hidrológicos (Rocha e
Pereira, 2016). O programa utilizado nas análises estatísticas multivariadas foi o SPSS versão
20.
3. RESULTADOS E DISCUSSÃO
3.1. Análise da qualidade da água da bacia
Com relação à precipitação e à temperatura do ar mensal na bacia hidrográfica do rio Longá
no ano de 2015 (Figura 2), os meses fevereiro, março e abril foram classificados como período
chuvoso, onde a precipitação média foi de 185 mm mês-1 e os meses de maio a janeiro foram
classificados como período seco com precipitação média de 32 mm mês-1.
Figura 2. Valores médios mensais da precipitação pluviométrica e temperatura do ar
obtidos das estações meteorológicas inseridas na bacia hidrográfica do rio Longá, no
período entre janeiro e dezembro de 2015.
As Figuras 3 e 4 ilustram os boxplots da distribuição sazonal e espacial, respectivamente,
construídos a partir dos dados obtidos nas análises das variáveis de qualidade da água. Durante
o período de coleta houve variações nos valores obtidos por meio das análises laboratoriais para
algumas variáveis em função da sazonalidade e também em função da localização dos pontos
de coleta.

7 Avaliação sazonal e espacial da qualidade …
Rev. Ambient. Água vol. 13 n. 2, e2054 - Taubaté 2018
Figura 3. Variação sazonal das variáveis DBO (A), E. coli (B), turbidez (C),
pH (D), condutividade (E), nitrato (F), temperatura (G), sólidos totais (H), OD
(I) e fósforo total (J), durante o período seco e chuvoso (2015). Limites
estabelecidos pela Res. CONAMA 357/2005.

Rev. Ambient. Água vol. 13 n. 2, e2054 - Taubaté 2018
8 Waneska Maria Vasconcelos Medeiros et al.
Figura 4. Variação espacial das variáveis DBO (A), E. coli (B), turbidez (C),
pH (D), condutividade (E), nitrato (F), temperatura (G), sólidos totais (H), OD
(I) e fósforo total (J), no período de janeiro a dezembro de 2015. Limites
estabelecidos pela Res. CONAMA 357/2005.

9 Avaliação sazonal e espacial da qualidade …
Rev. Ambient. Água vol. 13 n. 2, e2054 - Taubaté 2018
A Figura 3A apresenta a variação da concentração da matéria orgânica em termos de DBO
nos períodos seco e chuvoso. Para o período seco, a mediana foi de 1,66 mg L-1 com
concentrações variando de 0,85 mg L-1 a 2,21 mg L-1 e o período chuvoso apresentou mediana
de 2,88 mg L-1, com valores mínimo de 1,8 mg L-1 e máximo de 7,72 mg L-1. Observa-se que
no período chuvoso apresentou valores mais elevados na concentração da matéria orgânica e
também maior dispersão dos dados quando comparados com o período seco. O teste Kruskal-
Wallis inferiu que houve diferença estatística significativa entre os dois períodos (H= 2,941 e
p=0,086). Em 10% das amostras analisadas para essa variável houve valores acima do
recomendado pela Resolução CONAMA nº 357/05 de 5 mg L-1. Melhores resultados em função
da concentração da matéria orgânica foram encontrados em P6 e P7, onde apresentaram
medianas de 1,00 e 0,78 mg L-1, respectivamente, com 75% das amostras abaixo de
1,41 mg L-1. Os pontos P3 e P5 foram os que apresentaram os piores resultados com valores
máximos de 7,6 mg L-1 e 5,67 mg L-1 de concentração da matéria orgânica, expressa em DBO
(Figura 4A). O aumento da DBO ocorreu logo após os primeiros registros de precipitação,
incidindo na diminuição dos seus valores após as primeiras chuvas, fato observado em P2, P3
e P5, que estão localizados nos centros urbanos das cidades de Barras, Esperantina e Piracuruca,
respectivamente. Esse comportamento é atribuído à poluição difusa, característica de cidades
onde não há sistema de saneamento, fato ocorrido na maioria das cidades do Estado do Piauí.
Nos pontos P4, P6 e P7, localizados na zona rural dos municípios de Batalha, São José do
Divino e Buriti dos Lopes, respectivamente, apresentaram valores elevados para DBO, acima
do limite permissível, apenas no mês de fevereiro. Observou-se que neste mês houve registro
de precipitação pluvial nas 72 horas que antecederam a coleta em todos os pontos monitorados.
Os dados apresentados para a DBO indicam que a qualidade da água da bacia do rio Longá
deteriorou no período chuvoso. A DBO apresentou uma correlação significativa positiva com
a variável temperatura (ρ=0,23) (Tabela 3).
Tabela 3. Matriz de correlação das variáveis de qualidade da água da bacia hidrográfica do rio
Longá.
Tem
per
atu
ra
pH
Con
du
tivid
ad
e
Tu
rbid
ez
Sóli
dos
tota
is
OD
DB
O
Nit
rato
Fósf
oro
tota
l
E.
coli
Temperatura 1,00
pH 0,23 1,00
Condutividade -0,34 -0,04 1,00
Turbidez -0,03 -0,05 -0,45 1,00
Sólidos totais 0,09 0,31 0,03 0,16 1,00
OD 0,13 -0,02 0,07 0,06 0,00 1,00
DBO 0,23 -0,14 0,00 0,10 -0,21 0,12 1,00
Nitrato -0,10 0,12 0,05 0,26 0,07 -0,03 0,04 1,00
Fósforo total -0,10 -0,10 -0,08 0,29 -0,07 -0,08 0,14 0,20 1,00
E. coli 0,22 -0,02 -0,15 -0,14 -0,28 0,10 0,10 0,08 0,09 1,00
Nota: Os valores em negrito são estatisticamente significativos para p < 0,05.
Para a contagem de células de Escherichia coli (Figura 3B), entre as campanhas realizadas
os valores mais altos foram observados no período chuvoso, com máxima de 1.380 NMP
100 mL-1. Células de E. coli foram registradas em 98,8% das amostras analisadas, mas somente

Rev. Ambient. Água vol. 13 n. 2, e2054 - Taubaté 2018
10 Waneska Maria Vasconcelos Medeiros et al.
em P2, P3 e P5 apresentaram amostras com valores maiores do que o limite de 1000 NMP
100 mL-1, recomendado pela legislação para rios Classe 2, que estão representados pelos
outliers na Figura 4B. Os resultados da determinação de E. coli exibiu um comportamento
semelhante às concentrações de DBO, apresentando valores elevados de contagem de E. coli
nos pontos localizados em área urbana e coincidindo com período chuvoso. Em P2, o valor de
E. coli ultrapassou o limite permissível no mês de março, enquanto que em P3 ultrapassou nos
meses de março e julho e em P5 nos meses de março e setembro. Esses resultados sugerem
contribuições distintas de E. coli. Os valores elevados nos meses de março (em P5) e julho (em
P3) não estão relacionados com a precipitação pluviométrica. Acredita-se que tal fato se deve
às fontes pontuais de lançamento de esgotos sanitários. Conforme a análise de variância, a
variável E. coli apresentou diferenças estatísticas significativas entre os dois períodos estudados
(H=10,442 e p=0,001) e também apresentou diferenças estatísticas significativas entre os
pontos monitorados (H= 21,064 e p=0,002). Resultado semelhante foi encontrado por Souza e
Gastaldini (2014) ao estudar a qualidade da água da bacia hidrográfica do rio Vacaraí-Mirim
no Rio Grande do Sul e por Menezes et al. (2016) estudando a relação entre o uso e ocupação
do solo com a qualidade da água na bacia hidrográfica do Ribeirão Vermelho em Minas Gerais,
onde obtiveram maiores valores da variável E. coli nas estações de coleta com influência da
urbanização. Na análise de correlação de Spearmam (Tabela 3) a variável E. coli, apresentou
correlação significativa positiva com a temperatura (ρ=0,22) e correlação negativa com a
variável sólidos totais (ρ=-0,28).
A turbidez (Figura 3C) apresentou mediana de 7,9 e 75 UNT no período seco e chuvoso,
respectivamente. Em relação ao intervalo interquartil o período chuvoso apresentou maior
variação (103,5 UNT) em relação ao período seco (57,7 UNT). Os pontos P1 e P7 foram os que
apresentaram os maiores valores para turbidez, com 83% e 42% das amostras com valores
acima do limite permitido de 100 UNT, conforme Resolução CONAMA nº 357/2005 (Figura
4C). Houve diferença estatística significativa entre os períodos seco e chuvoso (H=4,887 e
p=0,027) e diferença extremamente significativa entre os pontos analisados (H=61,559 e
p< 0,0001). Foi possível observar em campo que P1 e P7 possuem características semelhantes
quanto à geologia, como também apresentaram áreas desprovidas de vegetação nativa,
explicando a semelhança no comportamento da turbidez durante o período monitorado. Os
valores elevados de turbidez nesses pontos indicam processo de erosão, cuja origem está
relacionada ao manejo inadequado do solo pela atividade agropecuária, aliada à ausência de
vegetação nas margens dos cursos d’água. Haddad e Magalhães (2010) apontaram diferenças
espaciais em relação à concentração da turbidez, mostrando como áreas críticas aquelas
desprovidas de vegetação ripária, e que contribuem para valores elevados de turbidez. A
variável turbidez correlacionou-se negativamente com a variável condutividade elétrica
(ρ=-0,45) e positivamente com fósforo total (ρ=0,29) e nitrato (ρ=0,26).
O pH (Figura 3D) apresentou mediana de 7,0 e 6,9 no período seco e chuvoso,
respectivamente, com máxima de 7,2 no período seco e mínimo de 6,8 no período chuvoso.
Damasceno et al. (2015) no estudo sobre a avaliação sazonal da qualidade da água no rio
Amazonas, no Amapá, também observou que no período chuvoso apresentou águas mais ácidas
quando comparado ao período seco, podendo estar associada ao aumento do teor de ácidos
orgânicos. O pH em todos os pontos monitorados apresentou valores dentro do intervalo de 6 a
9, conforme descrito na legislação ambiental para rios de Classe 2 (Figura 4D). Valores
semelhantes foram observados por Passig et al. (2015) ao estudar a qualidade da água da bacia
hidrográfica do rio Mourão no Paraná. A análise estatística apresentou diferença significativa
entre os períodos avaliados (H= 5,184 e p=0,023), mas não apresentou diferença entre os pontos
monitorados. A análise de correlação (Tabela 3) apontou uma correlação significativa positiva
do pH com sólidos totais (ρ=0,31) e temperatura (ρ=0,23).

11 Avaliação sazonal e espacial da qualidade …
Rev. Ambient. Água vol. 13 n. 2, e2054 - Taubaté 2018
A condutividade elétrica (Figura 3E) apresentou mediana 132,2 µS cm-1 e 80,4 µS cm-1 no
período seco e chuvoso, respectivamente. Em relação ao intervalo interquartil, o período seco
apresentou variação um pouco maior (73 µS cm-1) que o período chuvoso (40,6 µS cm-1), mas
o teste de Kruskall-Wallis afirma que não houve diferença estatística significativa para essa
variável em relação aos dois períodos avaliados (H=3,249 e p=0,071). Já entre os pontos a
análise de variância apresentou uma diferença estatística significativa (H=51,096 e p<0,0001).
Observou-se valores elevados da condutividade elétrica em P4, P5, P6 e P7 (Figura 4E),
apresentando as seguintes medianas, respectivamente: 194,8 µS cm-1, 147,6 µS cm-1, 111,5 µS
cm-1 e 99,7 µS cm-1. Os valores elevados para a condutividade elétrica são provavelmente
devido às contribuições distintas. As áreas urbanas onde há lançamento de efluentes domésticos
sem tratamento, contribuem para o aumento da condutividade elétrica, tal qual a situação
observada em P5, que está localizado na cidade de Piracuruca. Resultado semelhante foi
observado por Girardi et al. (2016) ao estudar a qualidade da água da bacia hidrográfica do rio
Cubatão do Sul em Santa Catarina e por Mateus et al. (2015) estudando a qualidade da água do
rio Uberaba em Minas Gerais. Os valores elevados para condutividade elétrica em P7 situado
em área rural com grande atividade de rizicultura, pode ser atribuído devido ao transporte de
compostos iônicos utilizados na agricultura, tais como potássio, fósforo e nitrogênio.
Viswanathan et al. (2015) estudando a sazonalidade da qualidade da água do rio Thur na Suíça,
encontraram os maiores valores de condutividade elétrica no período seco, dando o motivo o
solo rico em solutos acumulado e capturado durante as precipitações recorrentes do período
chuvoso. Os valores elevados de condutividade elétrica em P4 e P6, localizados em áreas rurais,
também podem estar relacionados com as características naturais da bacia hidrográfica do rio
Longá. O intemperismo das rochas pode contribuir para tal fenômeno. Esteves (2011) descreve
que em regiões tropicais, os valores de condutividade nos ambientes aquáticos estão mais
relacionados com as características geoquímicas e com as condições climáticas da região onde
se localizam. A condutividade elétrica (Tabela 3) correlacionou-se negativamente com as
variáveis turbidez (ρ=-0,45) e temperatura (ρ=-0,34).
A concentração do íon nitrato apresentou um aumento em seu limite superior, de
0,191 mg L-1 para 0,273 mg L-1 e medianas de 0,72 mg L-1 para 0,93 mg L-1, o primeiro e
terceiro quartil, no período chuvoso (Figura 3F). Apesar do período chuvoso apresentar valores
mais elevados, não houve diferença estatística significativa entre os dois períodos analisados
(H= 3,571e p=0,059) e nem entre os pontos monitorados (H= 8,170 e p=0,226). Em todas as
amostras recolhidas os resultados foram inferiores a 10 mg L-1, valor definido na Resolução
CONAMA 357/2005 para rios de classe 2, estando a bacia hidrográfica do rio Longá em
conformidade com a dita legislação (Figura 4F).
A Figura 3G ilustra a variação da temperatura da água nos pontos de amostragem durante
os períodos seco e chuvoso, os valores mínimo e máximo, mediana e quartis inferior e superior
das amostras. A análise de variância indicou que não houve diferença estatística significativa
(H=0,378 e p=0,539) entre os períodos, oscilando no período seco com máxima de 32,4°C e no
período chuvoso na faixa de 32,2°C (Figura 4G).
Os sólidos totais (Figura 3H) apresentaram medianas de 275,6 mg L-1 e 228,0 mg L-1 nos
períodos seco e chuvoso, respectivamente. Portanto, não houve diferença estatística
significativa entre os períodos (H=0,659 e p=0,417) e nem entre os pontos monitorados
(H=11,653 e p=0,070). As maiores produções de sedimentos foram observadas nas estações de
coleta com características rurais que são P1, P4 e P7, apresentando os maiores valores de
medianas, 310 mg L-1, 340 mg L-1 e 240 mg L-1, respectivamente (Figura 4H). Acredita-se que
seja devido às práticas agrícolas caracterizadas pelo plantio próximo ao leito do rio, bem como,
criação de animais com desmatamento da vegetação nativa, práticas que aumentam o risco de
erosão e a perda de solo. Já o ponto P3 foi o que apresentou o maior valor observado para essa
variável, apresentando concentração máxima de 860 mg L-1 no mês de janeiro. Essa estação de

Rev. Ambient. Água vol. 13 n. 2, e2054 - Taubaté 2018
12 Waneska Maria Vasconcelos Medeiros et al.
coleta está localizada na zona urbana no município de Esperantina. Característica semelhante
foi observado por Menezes et al. (2016) estudando a relação entre os padrões de uso e ocupação
do solo e a qualidade da água na bacia hidrográfica do Ribeirão Vermelho em Minas Gerais,
onde observaram que os maiores valores de sólidos na água (sólidos totais e turbidez) são em
seções com forte ocupação agrícola e urbana. Observou-se que 14,3% das amostras coletadas
apresentaram valores acima do limite permitido estabelecida pela Resolução CONAMA nº
357/2005 de 500 mg L-1, sendo P1 e P3 os que apresentaram maior frequência em desacordo,
25% cada e apenas P2 não apresentou amostras fora dos padrões estabelecidos.
Para o oxigênio dissolvido (Figura 3I) foi observado que os períodos seco e chuvoso
apresentaram medianas de 7,9 mg L-1 e 8,0 mg L-1, respectivamente. Não houve diferenças
estatísticas significativas entre os períodos (H=0,059 e p=0,808) e entre os pontos (H=8,435 e
p=0,208) para essa variável. A mediana, em todos os pontos monitorados, esteve acima do
limite exigido pela legislação ambiental (CONAMA, 2005) para rios classe 2 (5 mg L-1),
embora 7,1% das amostras apresentaram valores inferiores. Os menores valores de OD foram
observadoss em áreas urbanas (P2, P3 e P5), que apresentaram 4,7 mg L-1, 4,3 mg L-1 e
3,8 mg L-1, respectivamente (Figura 4I).
Com relação aos resultados observados em períodos distintos, o fósforo total (Figura 3J),
expressou medianas 0,027 mg L-1 e 0,022 mg L-1 nos períodos seco e chuvoso, respectivamente.
Apesar do intervalo interquartil no período chuvoso apresentar maior variação (0,48 mg L-1)
em relação ao período seco (0,39 mg L-1), essa variável não apresentou diferença estatística
significativa entre os dois períodos (H=0,904 e p=0,342), mas apresentou diferença
significativa entre os pontos monitorados (H=13,111 e p=0,041). Considerando que a maior
concentração de fósforo coincidiu com o período chuvoso (fonte difusa), possivelmente sua
origem pode ser da lixiviação do solo pelas águas das chuvas. Apenas P1 apresentou mediana
acima do limite exigido pela Resolução CONAMA nº 357/2005 de 0,030 mg L-1. Os maiores
valores não outliers foram observados em P1 e P7, que apresentaram 0,077 mg L-1 e
0,070 mg L-1, respectivamente (Figura 4J).
3.2. Análises estatísticas multivariadas
Com o intuito de avaliar a tendência espacial, foi realizada a análise multivariada de
agrupamento com os dados de qualidade de água. O procedimento de agrupamento gerou dois
grupos distintos, com características semelhantes quanto ao uso e ocupação do solo (Figura
5A). O Grupo 1 correspondente à área rural e caracterizado pelas seções contendo os pontos
P1, P4, P6 e P7 e o Grupo 2 correspondente às áreas urbanas e caracterizado pelas seções
contendo os pontos P2, P3 e P5. Em relação às variáveis, o procedimento de agrupamento
gerou quatro grupos distintos com características semelhantes em relação aos tipos de
contaminação (Figura 5B). O Grupo 1 correspondente à E. coli, indicativo de contaminação por
meio de despejos de efluentes domésticos in natura; o Grupo 2 correspondente aos sólidos
totais; o Grupo 3 correspondente à condutividade elétrica e turbidez, indicativo de poluição
difusa por material oriundo de áreas agrícolas e urbanas e o Grupo 4 correspondente às variáveis
nitrato, fósforo total, DBO, pH, OD e temperatura.
No teste de esfericidade de Bartlett (p < 0,005) foi possível descartar a hipótese nula,
verificando a existência de correlações significativas entre as variáveis. Para o índice de
adequação da amostra (KMO) o resultado encontrado foi de 0,507, o que permite a aplicação
da análise fatorial.

13 Avaliação sazonal e espacial da qualidade …
Rev. Ambient. Água vol. 13 n. 2, e2054 - Taubaté 2018
Figura 5. Dendrograma do agrupamento das
seções monitoradas (A) e das variáveis analisadas
(B).
A ACP realizada para as dez variáveis revelou a existência de quatro componentes
principais (CP), sendo que a variância acumulada foi de 58,64% para os dados de qualidade da
água. A Tabela 4 apresenta a matriz rotacionada de pesos fatoriais que indica a contribuição
que cada variável possui na componente principal.

Rev. Ambient. Água vol. 13 n. 2, e2054 - Taubaté 2018
14 Waneska Maria Vasconcelos Medeiros et al.
Tabela 4. Cargas fatoriais com rotação das variáveis para os CP
encontrados.
Parâmetros Componente Principal
1 2 3 4
Condutividade -0,80 0,01 0,02 0,21
Turbidez 0,60 0,00 -0,21 0,47
DBO 0,00 0,81 0,06 0,05
E. coli 0,02 0,50 -0,04 -0,16
Temperatura 0,36 0,15 0,55 -0,18
pH -0,08 -0,27 0,49 0,10
Fósforo total 0,08 0,05 -0,38 0,08
OD -0,02 0,10 0,20 0,05
Sólidos totais 0,06 -0,25 0,28 0,38
Nitrato -0,07 -0,02 -0,03 0,30
Autovalor 1,74 1,53 1,48 1,12
% Variância explicada 17,37 15,28 14,83 11,16
% Variância acumulada 17,37 32,65 47,48 58,64
Nota: Método de rotação de variáveis VARIMAX com
normalização de Kaiser.
A CP1 explicou 17,37% da variância total dos dados e teve como variável mais expressiva
a condutividade elétrica cujo autovalor foi de -0,800 (Tabela 4). A variável turbidez também
desta componente apresentou resultado expressivo de 0,600 e foi a que apresentou maior
número de correlações (Tabela 4). A CP1 demonstra uma relação inversa entre as variáveis
condutividade e turbidez. Situações como essas já foram registradas em outros estudos, como
o de Arruda et al. (2015) pesquisando sobre a qualidade da água do reservatório Foz do Areia
– Paraná e, Maimuna e Victor (2012), em rios da Nigéria. Segundos os autores, essa relação
inversa ocorreu tanto no período seco como no período chuvoso. Sendo a condutividade a
medida indireta de íons dissolvidos na água e a turbidez podendo estar associada à ocorrência
de poluentes não iônicos, como matéria orgânica. Além do indicativo de poluição difusa por
material oriundo de áreas agrícolas e urbanas da bacia hidrográfica do rio Longá, acredita-se
que houve contribuição de fatores ambientais, pois como já mencionado, a composição
geológica da região de estudo pode ter influenciado nos valores elevados para a variável
turbidez.
A CP2 correspondeu a 15,28% da variação total dos dados para a qualidade da água,
formada pelas variáveis DBO e E. coli. Dentre todas as componentes, a DBO foi a que
apresentou resultado mais expressivo, com valor de 0,810. Esse resultado reforça a importância
dessa variável, que é uma das mais utilizadas para indicação de qualidade da água (Rocha e
Pereira, 2016). A associação dessas variáveis indica que as águas da bacia hidrográfica do rio
Longá sofrem contaminação por meio de despejos de efluentes domésticos in natura.
Considera-se justificada tal condição, pois não existe tratamento de esgoto nos municípios
inseridos na bacia hidrográfica do rio Longá.
As demais CPs são formadas por variáveis menos expressivas, abaixo de 0,500 (exceto
temperatura) e de modo geral, são resultados da pressão que as atividades antropogênicas
exercem sobre os corpos hídricos. A CP3 explicou uma variação de 14,83% e as variáveis que
a compõem são temperatura, pH e fósforo total, sendo o último apresentando uma correlação
negativa. Acredita-se que a relação inversa entre os valores de pH e fósforo total seja devido à
precipitação dos íons fosfatos presentes na água provocada pela elevação do pH. Esta

15 Avaliação sazonal e espacial da qualidade …
Rev. Ambient. Água vol. 13 n. 2, e2054 - Taubaté 2018
componente está relacionada com fontes de poluição antrópicas causadas pelo uso de
fertilizantes nas atividades agrícolas. A CP4 apresentou uma correlação positiva com sólidos
totais e nitrato, correspondendo a uma variação de 11,16% nos dados (Tabela 4). As variáveis
significativas na quarta componente podem ser indicativos de fonte de poluição agrícola
oriunda do escoamento superficial de insumos como fertilizantes utilizados nos projetos de
irrigação. A correlação entre sólidos totais e nitrato também foi observada por Voza et al. (2015)
estudando a qualidade da água do rio Danúbio, Sérvia.
4. CONCLUSÕES
Os corpos hídricos da bacia hidrográfica do rio Longá apresentaram qualidade satisfatória
segundo os padrões estabelecidos pela legislação ambiental para rios de classe 2, sendo
observadas uma variabilidade sazonal e espacial. A não conformidade das variáveis DBO e E.
coli referentes aos limites estabelecidos pela Resolução CONAMA nº 357/2005 foi devido
principalmente à poluição difusa observada no período chuvoso. A análise estatística
multivariada indicou o agrupamento das variáveis conforme o uso e ocupação do solo. A análise
de componentes principais identificou as variáveis condutividade elétrica, E. coli, DBO e
turbidez como sendo as mais significativas na variabilidade da qualidade da água do rio Longá.
5. REFERÊNCIAS
AGÊNCIA NACIONAL DAS ÁGUAS – ANA (Brasil). Sistema de monitoramento
hidrológico. 2015. Disponível em: http://mapas-
hidro.ana.gov.br/Usuario/DadoPesquisar.aspx. Acesso em: 03 mar. 2016.
AMERICAN PUBLIC HEALTH ASSOCIATION – APHA; AMERICAN WATER WORKS
ASSOCIATION – AWWA; WATER ENVIRONMENT FEDERATION – WEF.
Standard Methods for the Examination of Water and Wastewater. 21th Edition.
Washington D. C., 2005.
ARRUDA, N. M. B.; RIZZI, N. E.; MIRANDA, T. L. G. Análise multivariada na avaliação da
qualidade de água do reservatório de Foz do Areia, estado do Paraná. Revista Brasileira
de Ciências Ambientais, n. 37, p. 26-37, 2015.
BRASIL. Ministério do Meio Ambiente - MMA. Zoneamento Ecológico-Econômico do
baixo rio Parnaíba: subsídios técnicos, relatório final. Brasília, 2002. 92p.
CARVALHO, K. Q.; LIMA, S. B.; PASSIG, F. H.; GUSMÃO, L. K.; SOUZA, D. C.;
KREUTZ, C. et al. Influence of urban area on the water quality of the Campo river basin,
Paraná state, Brazil. Brazilian Journal of Biology, v. 75, n. 4, p. 96-106, 2015.
http://dx.doi.org/10.1590/1519-6984.00413suppl
CONSELHO NACIONAL DE MEIO AMBIENTE – CONAMA. Resolução nº 357, de 17 de
março de 2005: dispõe sobre a classificação dos corpos de água e diretrizes ambientais
para o seu enquadramento, bem como estabelece as condições e padrões de lançamento
de efluentes, e dá outras providências. Diário oficial [da] União, Brasília, n. 53, 18 mar.
2005, p. 58-63.
CUNHA, D. G. F.; CALIJURI, M. C; LAMPARELLI, M. C.; MENEGON JR, N. Resolução
CONAMA 357/2005: análise espacial e temporal de não conformidades em rios e
reservatórios do estado de São Paulo de acordo com seus enquadramentos (2005-2009).
Engenharia Sanitária e Ambiental, v. 18, n. 2, p. 159-168, 2013.

Rev. Ambient. Água vol. 13 n. 2, e2054 - Taubaté 2018
16 Waneska Maria Vasconcelos Medeiros et al.
DAMASCENO, M. C. S.; RIBEIRO, H. M. C; TAKIYAMA, L. R.; PAULA, M. T. Avaliação
sazonal da qualidade das águas superficiais do rio Amazonas na orla da cidade de Macapá,
Amapá, Brasil. Revista Ambiente & Água, v. 10, n. 3, p. 598-613. 2015.
http://dx.doi.org/10.4136/ambi-agua.1606
ESTEVES, F. A. Fundamentos de Limnologia. 3. ed. Rio de Janeiro: Interciência, 2011. 826p.
GIRARDI, R.; PINHEIRO, A.; TORRES, E.; KAUFMANN, V.; GARBOSSA, L. H. P.
Evolution of physicochemical species concentration in stream based on heavy rainfall
event data obtained for high-frequency monitoring. Brasilian Journal of Water
Resources, 2016. http://dx.doi.org/10.1590/2318-0331.011616055
HADDAD, E. A.; MAGALHÃES JR., A. P. Influência antrópica na qualidade da água da bacia
hidrográfica do rio São Miguel, carste do alto São Francisco, Minas Gerais. Geosul, v.
25, n. 49, p. 79-102. 2010. http://dx.doi.org/10.5007/2177-5230.2010v25n49p79
HAIR JUNIOR, J. F.; BLAC, W. C.; BABIN, B. J.; ANDERSON, R. E.; TATHAM, R. L.
Análise multivariada de dados. 6. ed. Porto Alegre: Bookman, 2009. 688p.
INSTITUTO BRASILEIRO DE GEOGRAFIA E ESTATÍSTICA - IBGE. Censo demográfico
2010. Brasília, 2010.
INSTITUTO NACIONAL DE METEOROLOGIA – INMET. Banco de dados
meteorológicos para ensino e pesquisa – BDMEP. 2015. Disponível em:
http://www.inmet.gov.br/portal/index.php?r=bdmep/bdmep. Acesso em: 03 mar. 2016.
KAISER, H. F. The varimax criterion for analytic rotation in fator analysis. Psichometrika, v.
23, p. 187-200, 1958. https://doi.org/10.1007/BF02289233
KALSCHEUR, K. N.; PENSKAR, R. R.; DALEY, A. D.; PECHAUER, S. M.; KELLY, J. J.;
PETERSON, C. G. et al. Effects of anthropogenic inputs on the organic quality of
urbanized streams. Water Research, v. 46, p. 2515-2524, 2012.
https://doi.org/10.1016/j.watres.2012.01.043
MAIMUNA, W.; VICTOR, O. O. Prediction of some water quality indices in river Yobe -
Nigeria, through annual projections. Frontiers in Science, v. 2, n. 4, p. 58-61, 2012.
http://doi.org/10.5923/j.fs.20120204.02
MATEUS, M. V.; GONÇALVES, J. C. S. I.; LOPES JR., G. B.; OKURA, M. H. Análise de
incerteza e modelagem de qualidade da água do rio Uberaba, Minas Gerais. Revista
Brasileira de Ciências Ambientais, n. 37, p. 1-15. 2015.
http://dx.doi.org/10.5327/Z2176-947820159914
MENEZES, J. P. C.; BITTENCOURT, R. P.; FARIAS, M. S.; BELLO, I. P.; FIA, R.;
OLIVEIRA, L. F. C. Relação entre padrões de uso e ocupação do solo e qualidade da
água em uma bacia hidrográfica urbana. Engenharia Sanitária e Ambiental, v. 21, n. 3,
p. 519-534, 2016. http://dx.doi.org/10.1590/S1413-41522016145405
PASSIG, F. H.; LIMA, S. B.; CARVALHO, K. Q.; HALMEMAN, M. C. R.; SOUZA, P. C.;
GUSMÃO, L. K. Monitoring of urban and rural basins: water quality of Mourão basin.
Brazilian Journal of Biology, v. 75, n. 4, p. 158-164, 2015.
http://dx.doi.org/10.1590/1519-6984.01213suppl
PIAUÍ. Secretaria de Meio Ambiente e Recursos Hídricos - SEMAR. Plano Estadual de
Recursos Hídricos do Piauí - Relatório Síntese. Terezina, 2010. 179 p.

17 Avaliação sazonal e espacial da qualidade …
Rev. Ambient. Água vol. 13 n. 2, e2054 - Taubaté 2018
POMPÊO, C. A.; RIGOTTI, J. A.; FREITAS FILHO, M. D. Urban stream condition
Assessment. In: INTERNATIONAL CONFERENCE ON URBAN DRAINAGE, 12.,
10-15 set. 2011, Porto Alegre. Anais... Disponível em:
https://web.sbe.hw.ac.uk/staffprofiles/bdgsa/temp/12th%20ICUD/PDF/PAP005432.pdf.
Acesso em: 03 mar. 2016.
ROCHA, C. H. B.; PEREIRA, A. M. Análise multivariada para seleção de parâmetros de
monitoramento em manancial de Juiz de Fora, Minas Gerais. Revista Ambiente & Água,
v. 11, n. 1, p. 176-187, 2016. http://dx.doi.org/10.4136/ambi-agua.1590
SOUSA, A. R. P.; ARAÚJO, J. L. L. O rio Longá e o povoamento do norte do Piauí. História
Revista, v. 14, n. 2, p. 1-16, 2009.
SOUZA, M. M.; GASTALDINI, M. C. C. Avaliação da qualidade da água em bacias
hidrográficas com diferentes impactos antrópicos. Engenharia Sanitária e Ambiental,
v. 19, n. 3, p. 263-274, 2014. http://dx.doi.org/10.1590/S1413-41522014019000001097
VISWANATHAN, V. C.; MOLSON, J.; SCHIRMER, M. Does river restoration affect diurnal
and seasonal changes to surface water quality? A study along the Thur River, Switzerland.
Science of the Total Environment, n. 532, p. 91-102, 2015.
https://doi.org/10.1016/j.scitotenv.2015.05.121
VOZA, D.; VUKOVIC, M.; TAKIC, L.; NICOLIC, D.; MLADENOVIC-RANISAVLJEVIC,
I. Application of multivariate statistical techniqhes in the water quality assessment of
Danube river, Serbia. Archives of Environmental Protection, v. 41, n. 4, p. 96-103,
2015. https://doi.org/10.1515/aep-2015-0044

Ambiente & Água - An Interdisciplinary Journal of Applied Science
ISSN 1980-993X – doi:10.4136/1980-993X
www.ambi-agua.net
E-mail: [email protected]
This is an Open Access article distributed under the terms of the Creative Commons
Attribution License, which permits unrestricted use, distribution, and reproduction in any
medium, provided the original work is properly cited.
Avaliação sazonal da qualidade das águas superficiais e subterrâneas
na área de influência do Lixão de Salinópolis, PA
ARTICLES doi:10.4136/ambi-agua.2072
Received: 23 Dec. 2016; Accepted: 06 Feb. 2018
Régia Simony Braz Da Silva1*; Adriano Marlisom Leão de Sousa2;
Silvana do Socorro Veloso Sodré2; Maria Isabel Vitorino3
1Instituto Federal de Educação, Ciência e Tecnologia do Maranhão (IFMA), Porto Franco, MA, Brasil
Departamento de Ensino e Extensão (DEE). E-mail: [email protected] 2Universidade Federal Rural da Amazônia (UFRA), Belém, PA, Brasil
Instituto Socioambiental e dos Recursos Hídricos (ISARH). E-mail: [email protected],
[email protected] 3Universidade Federal do Pará (UFPA), Belém, PA, Brasil
Instituto de Geociências (IG). E-mail: [email protected] *Autor correspondente
RESUMO O objetivo deste trabalho foi avaliar a sazonalidade da qualidade da água superficial e
subterrânea nas proximidades do lixão de Salinópolis, situado na Vila de Cuiarana, por meio da
caracterização da precipitação da região e da sua influência na composição físico-química e
microbiológica das águas locais. Para isso, foram observados os dados dos acumulados mensais
da precipitação local, medição da velocidade de infiltração no solo e medição da vazão dos rios
Cachoeira e Teixeira. Foram selecionados os parâmetros físico-químicos e bacteriológicos: pH,
oxigênio dissolvido (OD), temperatura da água, sólidos totais dissolvidos (TDS), turbidez,
condutividade elétrica (CE), salinidade, amônia, nitrato, coliformes totais e Escherichia coli; e
os metais: alumínio, cádmio, chumbo, cobre, cromo, ferro, manganês, mercúrio, níquel e zinco.
Tanto as águas superficiais quanto as subterrâneas se apresentaram inadequadas para uso e
consumo humano. Parâmetros como OD, ferro, alumínio, chumbo, mercúrio, coliformes totais
e E. coli estão em desconformidade com as legislações vigentes. O período chuvoso influenciou
negativamente a qualidade em águas superficiais. Em águas subterrâneas, parâmetros como
amônia, nitrato, ferro, mercúrio e chumbo estiveram em maiores concentrações no período
menos chuvoso; enquanto, CE, E. coli, coliformes totais e alumínio aumentaram suas
concentrações no período chuvoso.
Palavras-chave: Cuiarana, precipitação, qualidade da água.
Seasonal evaluation of surface and groundwater quality in the area
of influence of the Lixão de Salinópolis, PA
ABSTRACT This work evaluated the seasonality of surface and groundwater quality in the vicinity of
the Salinópolis dump, located in the Cuiarana village, by characterizing precipitation in the
region and its influence on the physicochemical and microbiological composition of local
waters. To accomplish this, data regarding monthly local precipitation were reviewed, and

Rev. Ambient. Água vol. 13 n. 2, e2072 - Taubaté 2018
2 Régia Simony Braz Da Silva et al.
measurements were taken of the rate of soil infiltration and the rate of flow of the Cachoeira
and Teixeira Rivers. The physico-chemical and bacteriological parameters selected were pH,
dissolved oxygen (OD), water temperature, total dissolved solids (TDS), turbidity, electrical
conductivity (EC), salinity, ammonia, nitrate, total coliforms and Escherichia coli; and the
metals aluminum, cadmium, lead, copper, chromium, iron, manganese, mercury, nickel and
zinc. Both surface and groundwater were inadequate for human consumption and use.
Parameters such as OD, iron, aluminum, lead, mercury, total coliforms and E. coli are not in
compliance with current legislation in both surface and underground waters. The rainy season
had a negative impact on surface water quality. In groundwater, parameters such as ammonia,
nitrate, iron, mercury and lead were higher in the less rainy period, whereas EC, E. coli, total
coliforms and aluminum increased their concentrations in the rainy period.
Keywords: Cuiarana, rainfall, water quality.
1. INTRODUÇÃO
A precipitação é um elemento climático importante na indução do comportamento e das
características de outras variáveis meteorológicas, como temperatura do ar, umidade relativa e
ventos (Nobre et al., 2009). Além disso, é fundamental na manutenção do equilíbrio hídrico em
uma região e influi na composição físico-química e microbiológica dos corpos hídricos, por
meio de processos complexos de interação superfície-atmosfera (Machado e Pacheco, 2010).
Entretanto, a qualidade da água não depende apenas de condições naturais. A ação
antrópica interfere qualitativa e quantitativamente à medida que afeta as características
químicas, físicas e biológicas dos sistemas hídricos (Pinto et al., 2009). A urbanização
engendrada de forma acelerada e sem o devido planejamento aumentou a pressão antrópica
sobre os recursos hídricos, sobretudo no que se refere àqueles usados para o abastecimento
urbano. Isso gerou numerosos impactos sobre esse recurso natural, principalmente por meio do
lançamento de esgotos e de resíduos urbanos e industriais nas águas (Tucci, 2008).
A constante e crescente produção de resíduos sólidos e sua posterior destinação
inadequada, sobretudo nos centros urbanos, como ocorre nos lixões, geram inúmeros impactos
ambientais e sociais, dentre os quais, destacam-se: a contaminação do solo, das águas
superficiais e do lençol freático, a transmissão de doenças às pessoas pelo contato direto com
os resíduos ou animais vetores, ou pelo uso de recursos contaminados indiretamente pelos
poluentes provenientes dos lixões (Oliveira e Pasqual, 2004; Pereira et al., 2013).
A contaminação de águas superficiais e subterrâneas por compostos orgânicos e
inorgânicos provenientes do chorume de lixões e aterros mal planejados é verificada
comumente por meio de elevadas concentrações de metais pesados, compostos nitrogenados
e/ou coliformes (Medeiros et al., 2008; Galarpe e Parilla, 2012; Pereira et al., 2013).
Desse modo, o presente trabalho tem por objetivo avaliar a qualidade das águas superficiais
e subterrâneas nas proximidades do lixão de Salinópolis, situado na Vila de Cuiarana, e
investigar a influência da precipitação sazonal na composição físico-química e microbiológica
das águas locais.
2. MATERIAL E MÉTODOS
2.1. Área de estudo
O município de Salinópolis (Figura 1) pertence à mesorregião nordeste paraense e à
microrregião Salgado. Possui as seguintes coordenadas geográficas: 0º63'13.4" S e
47º34'61.3" W, distante 227 km de Belém, com elevação de 19 metros acima do nível do mar.
Segundo dados do IBGE (2010), tem uma população estimada em 37.421 habitantes, com área

3 Avaliação sazonal da qualidade das águas superficiais …
Rev. Ambient. Água vol. 13 n. 2, e2072 - Taubaté 2018
territorial de 237,738 km2. O lixão de Salinópolis está localizado na Vila de Cuiarana, situada
a cerca de 7 km do centro urbano do município, no ramal conhecido como São Sebastião.
O município apresenta precipitação anual que varia entre 1.800 e 2.300 mm, sendo que
cerca de 90% da precipitação se distribui nos seis primeiros meses do ano (Figueroa e Nobre,
1990; Moraes et al., 2005). Segundo a classificação de Köppen, o clima predominante na região
é Aw, com temperatura média anual de 27,7ºC, com oscilações que variam entre 25º e 31ºC.
(Mengawaco, 1995; Rodrigues et al., 2013).
Figura 1. Mapa de localização da área de estudo na Vila de Cuiarana. Nascentes: N1, N2
e N3; Rios Perenes: RP1 e RP2; Rios intermitentes: RI1 e RI2; Poços: P1, P2, P3 e P4.
2.2. Variáveis hidrológicas
Os dados de precipitação (mm) mensal foram estimados por sensoriamento CPC
MORPHing technique (CMORPH) no ponto de grade referente à coordenada do lixão de
Salinópolis. Os dados disponíveis no banco de dados do CMORPH correspondem ao período
de 1998 a 2015. Para caracterização climática da precipitação foram somados os acumulados
mensais do CMORPH desde 1998. Estudos como o de Sodré e Rodrigues (2013) comprovam
a acurácia dos dados do CMORPH quando comparados a dados coletados por estações
meteorológicas do Instituto Nacional de Meteorologia (INMET) em diversas regiões
brasileiras.
A análise da precipitação local para o período de estudo foi realizada por meio do cálculo
da anomalia mensal, o que possibilita caracterizar a precipitação local durante o período de
estudo.
Os dados da velocidade de infiltração (cm h-1) foram obtidos nos meses de março (período
chuvoso) e outubro (período menos chuvoso) de 2015, em duas áreas residenciais. A área
residencial a montante do lixão fica localizada no sítio Teixeira. Já a área habitada a jusante
fica às margens do ramal de São Sebastião, na estrada que dá acesso ao lixão. Os pontos de
coleta de dados foram escolhidos próximos aos poços P1 e P2 (sítio Teixeira) e P3 e P4 (ramal
de São Sebastião), o que fornece informações adicionais para a avaliação da qualidade da água
nos poços. O método utilizado para obter a velocidade de infiltração no solo foi o infiltrômetro
de anéis concêntricos, descrito detalhadamente por Brandão et al. (2006).
A vazão (m3 s-1) dos rios foi determinada no mês de março de 2015, época que corresponde
ao período chuvoso na região. A vazão (m3 s-1) foi calculada em dois locais, à jusante do lixão
o local escolhido foi o riacho Cachoeira, em um trecho próximo ao ramal São Sebastião. Já na

Rev. Ambient. Água vol. 13 n. 2, e2072 - Taubaté 2018
4 Régia Simony Braz Da Silva et al.
área a montante foi selecionada um trecho do rio Teixeira, nas proximidades da área residencial
do sítio Teixeira.
Os dados de vazão foram calculados por meio do método convencional com medição direta
e uso de molinete hidrométrico, conforme Carvalho (2008) e Santos (2014). Em virtude da
pequena largura e profundidade dos riachos estudados, a medição foi feita com o uso do método
de medição a vau, com a escolha de seis seções de diferentes profundidades para cada rio. A
vazão total foi obtida pela soma das vazões parciais.
Para compreender a dinâmica da água precipitada no solo e, consequentemente, a
influência dessa dinâmica na dispersão dos compostos químicos autóctones e alóctones, foi
calculado o armazenamento de água no solo por meio do método do balanço hídrico de
Thornthwaite e Mather (1955), descrito por Costa (1994). Para efeito de cálculo, foi considerada
a capacidade de armazenamento de água no solo (CAD) de 100 mm, conforme orientado por
Pereira et al. (2007), quando não é realizado cálculo da CAD com dados de campo.
2.3. Variáveis de qualidade das águas
Foram selecionados 11 pontos amostrais (Figura 1), sendo seis localizados a montante do
lixão (N1, N2, RP1, RI1, P1 e P2) e cinco a jusante (N3, RP2, RI2, P3 e P4). Ao todo, foram
selecionadas 3 nascentes (N1, N2 e N3), 2 rios perenes (RP1 e RP2), 2 rios intermitentes (RI1
e RI2) e 4 poços (P1, P2, P3 e P4).
A nascente 1 (N1) é o ponto mais a montante do lixão e o ponto com menor influência
antrópica direta. Enquanto a nascente 3 (N3) é a mais próxima da área do lixão, e está localizada
em área residencial. Os pontos amostrais se localizam próximos a áreas habitadas por pequenos
agrupamentos familiares e foram selecionados com base na acessibilidade para obtenção das
amostras e uso pela população local.
As nascentes foram selecionadas em virtude da importância dessas para a avaliação da
qualidade de água, uma vez que alterações, mesmo que pequenas, em seus fluxos e composições
podem comprometer a qualidade do ambiente e da água (Oliveira et al., 2013). Os poços P1 e
P2 se localizam no Sítio Teixeira e P3 e P4 no ramal de São Sebastião. Os poços são rasos com
profundidades entre 3,6 m e 8,15 m, sem revestimento, com exceção de P3 que possui
revestimento de tijolos.
Foram realizadas seis campanhas de amostragem de água superficial e subterrânea (poço),
entre os meses de novembro de 2014 e outubro de 2015. Ou seja; foram feitas três coletas
durante o período menos chuvoso (novembro/2014, julho/2015 e outubro/2015) e três coletas
durante o período chuvoso (fevereiro/2015, março/2015 e maio/2015).
Para avaliação da qualidade da água foram selecionados nove parâmetros físico-químicos:
pH, oxigênio dissolvido (OD), temperatura da água, turbidez, sólidos totais dissolvidos (TDS),
condutividade elétrica (CE), amônia (NH3) e nitrato (NO3-); dois parâmetros bacteriológicos:
coliformes totais e Escherichia coli; e alguns metais: alumínio (Al), cádmio (Cd), chumbo (Pb),
cobre (Cu), cromo (Cr), ferro (Fe), manganês (Mn), mercúrio (Hg), níquel (Ni) e zinco (Zn).
Os parâmetros temperatura da água, pH, condutividade elétrica, salinidade e sólidos totais
dissolvidos foram aferidos em campo, conforme as orientações de uso determinado pelo
fabricante de cada aparelho, e seguindo rigorosamente a metodologia proposta pelo Guia
Nacional de Coleta e Preservação de Amostras (Brandão et al., 2011). O oxigênio dissolvido
também foi medido em campo, pelo Método de Winkler (Golterman et al., 1978). Já as
medições da turbidez, amônia, nitrato e a bacteriologia foram realizados no Laboratório de
Hidroquímica da Universidade Federal do Pará.
A análise das concentrações dos metais (Hg, Al, Cd, Pb, Cr, Cu, Zn, Fe, Ni e Mn) foram
realizadas pelo Instituto Evandro Chagas, obedecendo ao método Standard (American Public
Health Association - APHA, 2012), por meio de Espectrometria de Emissão Ótica com Plasma

5 Avaliação sazonal da qualidade das águas superficiais …
Rev. Ambient. Água vol. 13 n. 2, e2072 - Taubaté 2018
Induzido (ICP OES). O controle das condições operacionais do ICP OES foi realizado com o
software ICPExpert Vista.
As amostras para bacteriologia foram coletadas em frascos de vidro estéreis, devidamente
preparados em laboratório e acondicionadas em caixas térmicas. Posteriormente, foram levadas
ao Laboratório de Hidroquímica da UFPA, em um prazo inferior a 24 horas. Em virtude da alta
densidade de colônias bacterianas desenvolvidas nos meios de cultura, foram necessárias
diluições em algumas amostras. Para obtenção da diluição ideal para contagem de todas as
amostras foram testadas placas preparadas sem diluição (T1), com diluição 50/100 ml (T2) e
10/100 ml (T3). A diluição T3 apresentou maior viabilidade para contagem das colônias em
todas as amostras e, portanto, foi a diluição utilizada para todas as campanhas seguintes. A
filtragem, a inoculação das placas, o cultivo das culturas de colônias bacterianas e a posterior
contagem foram realizados segundo a metodologia proposta pela CETESB (2007), para a
técnica da membrana filtrante.
Os valores de concentração dos parâmetros físico-químicos, bacteriológicos e da análise
de metais foram comparados com os valores máximos permitidos pela legislação do
CONAMA, Resolução n.º 357/2005 para águas classe 2. Enquanto as concentrações
encontradas nos poços foram comparadas aos valores expressos pela Portaria n.º 2.914/2011,
do Ministério da Saúde, que estabelece parâmetros de potabilidade da água para consumo
humano. A variabilidade sazonal nos resultados dos parâmetros ambientais analisados (águas
superficiais e subterrâneas) foi levada em consideração na discussão dos resultados e
comparada graficamente.
3. RESULTADOS E DISCUSSÃO
O período chuvoso em Cuiarana abrange os meses de janeiro a maio. O período chuvoso
concentrou em 2014 o acumulado correspondente a 2.213,5 mm, enquanto o período menos
chuvoso obteve o total de 200,8 mm. Em 2015, os acumulados foram de 1.613,6 mm e
432,9 mm, correspondentes ao período chuvoso e ao menos chuvoso, respectivamente. O maior
acumulado mensal de precipitação foi de 631 mm, em fevereiro de 2014 (Figura 2).
A redução do volume total precipitado em 2015 se deve, sobretudo, à ocorrência do
fenômeno El Niño, iniciado efetivamente no segundo trimestre de 2015 (National Oceanic and
Atmospheric Administration - NOAA, 2016). O ano de 2014 em Cuiarana foi caracterizado por
anomalias positivas no primeiro semestre, ou seja, volumes de chuva acima da normal
climatológica, e um segundo semestre com anomalias negativas, isto é, volume de chuva abaixo
da média climatológica. O ano de 2015 apesar de um volume mais modesto de chuvas no
primeiro semestre quando comparado com 2014 obteve, predominantemente, anomalias
positivas quando comparada à normal climatológica (Figura 2).
O balanço hídrico do solo de Cuiarana dos anos de 2014 e 2015 demonstrou que o período
de reposição hídrica na região ocorre em janeiro, devido ao aumento da ocorrência das chuvas
nesse período. A redução de chuvas e o aumento nas temperaturas do ar no segundo semestre
provocam a perda de água do solo por evapotranspiração, o que acarreta deficiência hídrica no
solo entre os meses de junho e dezembro. Com relação aos anos estudados, o ano de 2014
demonstrou maior déficit hídrico no solo. Pois, conforme demonstra a Figura 2, o segundo
semestre de 2014 apresentou um volume de chuvas bem abaixo da média climatológica da
região.
A velocidade de infiltração no ramal de São Sebastião, área próxima ao lixão, foi de
18 cm h-1 em março; e de 60 cm h-1, em outubro. Já no sítio Teixeira foi de 57 cm h-1 em
outubro; e 160 cm h-1, em março. Segundo Bernardo et al. (2006) solos com velocidade de
infiltração acima de 3 cm h-1 são classificados como solos com velocidade de infiltração muito
alta. Desse modo, os solos das áreas estudadas se enquadram nessa categoria. A alta taxa de
infiltração no mês de outubro se deve ao déficit hídrico do solo nesse período.

Rev. Ambient. Água vol. 13 n. 2, e2072 - Taubaté 2018
6 Régia Simony Braz Da Silva et al.
Figura 2. Dados de acumulados mensais de precipitação em Cuiarana do período 2014 -2015 e Anomalia
de precipitação mensal no período de 2014 a 2015, obtidos pelo CMORPH.
No mês de março, no sítio Teixeira, a infiltração foi muito maior que nos demais ensaios,
em decorrência, possivelmente, de algum evento local, pois se trata de uma área próxima a
pequenas lavouras e influenciada diretamente por atividades antrópicas (agricultura de
subsistência, principalmente). Ademais, a área do sítio Teixeira tem uma cota mais elevada que
a área do ramal de São Sebastião (Figura 1), o que favorece, nesta última localidade, o acúmulo
de água da chuva em seus declives, o que mantém por mais tempo a saturação do solo local.
Segundo Franco et al. (2015), quanto maior a declividade de um terreno, menor a taxa de
infiltração.
Enquanto os valores de infiltração foram muito elevados, as vazões nos dois rios estudados
foram baixas, como a própria observação in loco previa, uma vez que muitos rios da bacia têm
comportamento intermitente. No rio Teixeira, a vazão no trecho medido foi de 0,17 m3 s-1; e de
0,16 m3 s-1 no rio Cachoeira. A alta taxa de infiltração contribui para que os contaminantes
advindos do lixão cheguem à água subterrânea, ao passo que a baixa vazão dos rios dificulta a
dispersão desses contaminantes para áreas mais distantes da fonte poluente.
3.1. Águas Superficiais
Os parâmetros OD, pH e E. coli apresentaram valores em desacordo com o estabelecido
pela Resolução 357/2005 do CONAMA para águas superficiais (Tabela 1). O OD obteve
valores abaixo de 5 mg/L em quase todas as amostras e campanhas, com exceção de RI2 em
março, RI1, RP2 e RI2 em maio e RI2 em agosto.
O pH em todas as campanhas esteve abaixo de 6 (3,95 a 5,87). Entretanto, segundo alguns
estudos, como o de Gunkel et al. (2000) por exemplo, os rios amazônicos tendem a ter águas
levemente ácidas, sem que isso indique, contudo, desequilíbrio no ecossistema local. A E. coli
esteve acima de 1000 UFC 100 mL-1 somente na amostra RP2 em maio.

7 Avaliação sazonal da qualidade das águas superficiais …
Rev. Ambient. Água vol. 13 n. 2, e2072 - Taubaté 2018
Tabela 1. Resultados em rios e nascentes dos parâmetros pH, Oxigênio
dissolvido (OD) e Escherichia coli e VMP (Valor Máximo Permitido)
pela Resolução CONAMA 357/05 para águas superficiais classe 2.
Parâmetro Mês N1 RP1 N2 RI1* N3 RP2 RI2* VMP
pH
nov 5,04 4,94 5,02
4,85 4,74
6 a 9
fev 5,13 4,12 5,52 4,63 3,95
mar 4,93 4,85 4,03 4,8 4,37 4,79 5,3
mai 5,65 4,39 4,4 5,29 5,34 5,12 5,14
ago 5,55 5,7 5,2 5,87 5,35 5,35 5,6
out 4,78 4,87 4,54 4,76 4,97 4,78
OD (mg/L)
nov 2,21 2,6 1,25
4,42 3,08
> 5
fev 1,44 1,63 1,54 0,96 3,65
mar 2,16 2,45 1,23 3,04 1,67 2,16 5,39
mai 3,14 4,61 3,63 5,39 2,16 5,88 5,49
ago 0 1,47 2,94 3,53 0,49 3,14 5,39
out 1,76 1,37 0,78 1,47 2,16 1,18
E. coli (UFC 100 mL-1)
nov 11 11 20
0 0
1.000
fev 54 6 2 6 0
mar 340 170 0 80 250 140 110
mai 200 350 30 330 210 1520 510
ago 0 0 0 30 10 10 70
out 10 260 0 0 10 0
*Os rios intermitentes (RI1 e RI2) apresentaram água somente a partir de
março de 2015.
Quanto à sazonalidade o OD obteve as maiores concentrações no período chuvoso, em
virtude do aumento na cota dos rios e nascentes, o que eleva a turbulência e favorece a aeração
da água. Tanto os coliformes fecais quanto a E. coli alcançaram maiores concentrações em
águas superficiais no período de chuvas, resultado da lixiviação de matéria orgânica e
sedimentos para os corpos hídricos nesse período. Já o pH não demonstrou comportamento
sazonal, embora o período menos chuvoso tenha obtido valores levemente superiores.
A Figura 3 ilustra a variabilidade sazonal de alguns parâmetros que, embora não tenham
apresentado concentrações acima do Valor Máximo Permitido (VMP) pela Resolução 357/2005
do CONAMA, demostraram variabilidade sazonal importante para a avaliação da qualidade de
água.
A turbidez, TDS e condutividade elétrica obtiveram maiores valores no período chuvoso,
tanto em rios quanto nas nascentes. A mata ciliar desmatada, o uso e ocupação do solo nas
proximidades dos rios e nascentes favorecem o carreamento de sedimentos e sais por meio das
chuvas para os corpos hídricos (Silva et al., 2008), fatores que contribuem para justificar esses
resultados. Os pontos a jusante do lixão N3, RP2 e RI2 apresentaram valores superiores quando
comparados com os demais pontos, o que pressupõe influência do lixão nesses pontos.
Nos pontos amostrados nos rios, a amônia (NH3) obteve valores superiores no período
chuvoso, com destaque para RI2, com exceção de RP1 que obteve a maior concentração em
novembro, período menos chuvoso. As nascentes estudadas, entretanto, apresentaram maiores
concentrações no período menos chuvoso, exceto N3 que anomalamente obteve pico em março.
O fato de que os pontos com maiores concentrações de amônia no período chuvoso estarem na
área do lixão (RI2 e N3) corrobora com a hipótese de carreamento de compostos orgânicos do
lixão para as águas superficiais. Já o nitrato (NO3-) apresentou maiores concentrações no
período menos chuvoso em rios e nascentes, tanto pontos a montante quanto a jusante tiveram
resultados similares. Concentrações mais elevadas de compostos nitrogenados em águas
superficiais próximas a áreas de depósito de lixo também foram encontrados em trabalhos como
o de Ashraf et al. (2013).

Rev. Ambient. Água vol. 13 n. 2, e2072 - Taubaté 2018
8 Régia Simony Braz Da Silva et al.
Figura 3. Variação sazonal dos parâmetros: Turbidez, Sólidos Totais Dissolvidos (TDS),
Condutividade Elétrica (CE), Amônia (NH3) e Nitrato (NO3-) nas nascentes e rios estudados.

9 Avaliação sazonal da qualidade das águas superficiais …
Rev. Ambient. Água vol. 13 n. 2, e2072 - Taubaté 2018
As amostras de água superficial não apresentaram salinidade, com exceção do ponto RI2,
que apresentou salinidade 0,1%. O ponto RI2 corresponde a um rio intermitente e só apresentou
cota a partir de março, assim o início das chuvas favoreceu o escoamento superficial do solo do
lixão em direção ao ramal de São Sebastião. Além da salinidade, os sólidos totais dissolvidos
(95 mg L-1) e a condutividade elétrica (202 µS cm-1) alcançaram os maiores valores no mês de
março. Com o aumento da cota e vazão de RI2 durante o período chuvoso a salinidade, TDS e
CE apresentaram valores menores, o que demonstra o efeito de diluição das chuvas.
De modo geral, o período chuvoso influenciou na deterioração da qualidade das águas
superficiais, sobretudo nos pontos à jusante do lixão. Fatores como, cobertura vegetal incipiente
às margens dos corpos hídricos, localização do lixão em cota mais elevada que os pontos de
coleta e alta taxa pluviométrica favorecem para a contaminação das águas por escoamento
superficial e lixiviação de poluentes do lixão para os rios e nascentes.
3.2. Águas subterrâneas
De modo semelhante às águas superficiais, os poços apresentaram pH abaixo do
estabelecido pela legislação vigente (Tabela 2). Conforme a Portaria nᵒ2.914/2011 do
Ministério da Saúde (MS) os parâmetros de turbidez, coliformes totais e Escherichia coli
estiveram acima do VMP em muitos pontos e campanhas, o que caracteriza a água como
imprópria para consumo humano.
Tabela 2. Resultados em poços dos parâmetros pH, Oxigênio dissolvido (OD) e
Escherichia coli e VMP (Valor Máximo Permitido) pela Portaria nᵒ2.914/2011 do
Ministério da Saúde (MS).
Parâmetro Mês P1 P2 P3 P4 VMP
pH
nov 5,24 4,51 5,3 4,97
6 a 9,5
fev 5,25 4,79 4,53 5
mar 4,34 4,56 5,51 5,24
mai 4,35 5,1 5,6 5
ago 5,05 4,96 5,27 5,2
out 4,36 4,13 5,77 5,43
OD (mg/L)
nov 4,71 1,06 3,94 3,46
fev 5,48 1,73 1,44 2,98
mar 2,94 1,37 4,41 2,25
mai 3,43 1,47 1,08 2,84
ago 0,98 0,39 1,57 2,45
out 1,96 1,27 0,59 2,75
E. coli (UFC 100 mL-1)
nov 0 0 0 0
Ausente
fev 20 14 0 18
mar 930 20 300 1610
mai 30 0 40 270
ago 0 0 40 30
out 520 0 0 5000
De todas as amostras o OD só esteve acima de 5mg L-1 em P1 em fevereiro. Os menores
valores de OD foram referentes ao período menos chuvoso, o que pode ser explicado pela
diminuição do volume de água nos poços. Segundo a portaria do MS a água para consumo não
pode apresentar coliformes totais e E. coli, desse modo, somente amostra de P2 em outubro
esteve em conformidade com relação a esses parâmetros. O período chuvoso apresentou maior

Rev. Ambient. Água vol. 13 n. 2, e2072 - Taubaté 2018
10 Régia Simony Braz Da Silva et al.
densidade de colônias, resultado possivelmente do maior carreamento de poluentes no período
de chuvas para os poços por infiltração, ou mesmo escoamento superficial.
A Figura 4 ilustra a concentração e variabilidade sazonal de alguns parâmetros. O TDS e
a CE apresentaram maiores valores durante o período de chuvas, o que revela a influência direta
das chuvas na composição físico-química da água dos poços. Os poços P3 e P4, ambos na área
do lixão, obtiveram valores superiores de turbidez, TDS, CE, NH3 e NO3- quando comparados
aos poços P1 e P2, o que revela a influência negativa do lixão na qualidade da água subterrânea
da região.
Figura 4. Variação sazonal dos parâmetros: Turbidez, Sólidos Totais Dissolvidos (TDS),
Condutividade Elétrica (CE), Amônia (NH3) e Nitrato (NO3-) nos poços estudados.
Embora a Portaria 2.914/11 do MS não determine um valor máximo para a condutividade,
a CETESB (2009) classifica como ambientes impactados àqueles com valores superiores a
100 µS cm-1. Desse modo, os poços P3 e P4 podem ser classificados como impactados. Além
da alta condutividade os poços P3 e P4 foram os únicos que apresentaram salinidade.
A turbidez, a amônia e o nitrato obtiveram maiores concentrações no período menos
chuvoso, sobretudo nos poços P3 e P4, o que demonstra o efeito da diminuição da água nos
11 Avaliação sazonal da qualidade das águas superficiais …
Rev. Ambient. Água vol. 13 n. 2, e2072 - Taubaté 2018
poços nesse período e consequente diminuição da diluição dos compostos químicos presentes
na água. Esses resultados demonstram lixiviação de matéria orgânica para os poços, sobretudo
nos localizados na área à jusante do lixão.
O fato de as fossas serem escavadas bem próximas aos poços e não terem qualquer
revestimento, com certeza, contribui para a degradação da qualidade de água nos poços;
parâmetros como coliformes totais, E. coli, amônia e nitrato sofrem influência direta nesse caso.
A matéria orgânica e microrganismos presentes em fossas, quando não construídas
adequadamente, podem contaminar a água dos poços próximos. Desse modo, embora os
resultados demonstrem influência do lixão, por serem mais significativos nos poços P3 e P4,
não deve ser desconsiderada a contribuição das fossas locais.
3.3. Metais pesados
Em águas superficiais os metais Al, Cd, Cu, Fe, Hg e Pb apresentaram valores acima do
VMP pela Resolução 357/05 do CONAMA (Tabela 3), tanto em rios e nascentes a montante
quanto a jusante do lixão. Os metais Mn, Ni e Zn além de não apresentaram concentrações
acima do VMP também não apresentaram sazonalidade evidente em suas concentrações. A
variabilidade na concentração destes parece estar mais relacionada a eventos pontuais e a ação
antrópica local, o que não exclui a influência do lixão.
O cromo esteve em maiores concentrações no período chuvoso, embora não tenha
excedido o VMP em nenhuma amostra e não demonstre diferença significativa em amostras a
montante e a jusante do lixão. O cádmio, entretanto, apresentou uma única amostra (N1 em
agosto) acima do VMP (0,001 mg L-1). As maiores concentrações de Cd foram registradas no
início e no fim do período chuvoso. O cobre também só apresentou uma amostra (N3 em agosto)
acima do VMP (0,009 mg L-1). Com exceção de N3 os demais pontos apresentaram pico da
concentração de Cu no início do período chuvoso. De maneira geral, o Cd e o Cu obtiveram
concentração semelhante tanto em pontos a montante quanto a jusante do lixão.
O alumínio e o ferro foram os metais que apresentaram maiores concentrações em todos
os pontos amostrados. As nascentes obtiveram maiores concentrações de Al que nos rios, e o
período chuvoso foi o que apresentou as maiores concentrações. Já o Fe obteve maiores
concentrações no período menos chuvoso, o que denota o efeito de diluição das chuvas com
relação a esse metal.
Segundo Marmontel e Rodrigues (2015), a preservação das matas ciliares em torno de rios
e, sobretudo, em nascentes, favorece a boa qualidade da água nesses ambientes. Por exemplo:
as altas concentrações de ferro e alumínio em nascentes e rios podem estar associadas ao fato
de esses corpos hídricos não possuírem mata ciliar preservada, o que facilita o carreamento dos
metais do solo para a água. Segundo Emmett et al. (1994), a vegetação de mata ciliar em uma
bacia hidrográfica reduz a concentração de alumínio total em 21% e de ferro em 54%.
Quanto à concentração de Hg todas as amostras superficiais estavam acima do VMP pela
Resolução do CONAMA, com as maiores concentrações encontradas no período chuvoso e
sem grande variabilidade entre os pontos a montante e a jusante do lixão. A alta concentração
de Hg nas águas superficiais representa um risco à saúde humana, uma vez que este é um metal
bioacumulativo, podendo contaminar peixes e/ou animais aquáticos, os quais podem ser
consumidos pelos moradores da região (Anjos et al., 2016).
O chumbo, entretanto, obteve maiores concentrações tanto em rios como em nascentes a
montante do lixão, com picos no período de chuvas. A maior concentração de chumbo a
montante do lixão pode ter ocorrido devido à dispersão das partículas de Pb através do ar, como
resultado da incineração de materiais compostos de chumbo no lixão. Segundo a World Health
Organization (1989), essa é principal forma de dispersão do metal, o qual pode permanecer em
suspensão durante dias no ar, podendo ser carreado pela chuva e contaminar água e solo.

Rev. Ambient. Água vol. 13 n. 2, e2072 - Taubaté 2018
12 Régia Simony Braz Da Silva et al.
Tabela 3. Concentração de metais (mg L-1) em rios e nascentes durante as seis campanhas amostrais e
VMP (Valor Máximo Permitido) pela Resolução CONAMA 357/05 para águas superficiais classe 2.
Pontos Al Cd Cr Cu Fe Hg Mn Ni Pb Zn
No
v
N1 0,051 < LD <LD 0,002 1,192 0,016 < LD <LD 0,012
RP1 0,072 < LD 0,000 0,002 3,466 0,020 < LD <LD 0,002
N2 0,101 < LD <LD 0,001 2,877 0,009 < LD <LD 0,031
N3 0,115 < LD <LD <LD 0,826 0,019 < LD <LD 0,002
RP2 < LD < LD <LD 0,001 <LD <LD < LD <LD <LD
Fev
N1 0,470 0,001 0,003 0,005 0,870 0,002 0,022 0,007 0,018 0,013
RP1 0,102 0,000 0,004 0,007 2,954 0,002 0,045 0,006 0,001 0,013
N2 0,088 0,000 0,003 0,003 1,160 0,001 0,010 0,003 0,013 0,014
N3 0,101 0,000 0,003 0,005 0,816 0,001 0,062 0,006 0,004 0,015
RP2 0,074 0,001 0,002 0,001 0,596 0,001 0,012 0,003 <LD 0,071
Ma
r
N1 0,087 < LD 0,002 < LD 0,111 0,001 0,013 < LD < LD 0,001
RP1 0,072 < LD 0,001 < LD 0,274 0,001 0,014 0,002 < LD 0,003
N2 0,267 < LD 0,002 < LD 0,229 0,002 0,007 < LD < LD 0,001
RI1 0,094 < LD 0,000 < LD 0,163 0,001 0,008 < LD < LD 0,006
N3 0,109 < LD 0,002 < LD 0,096 0,001 0,027 0,001 < LD 0,005
RP2 0,129 < LD 0,001 < LD 0,434 0,001 0,012 0,001 < LD 0,001
RI2 0,051 < LD 0,000 < LD 0,313 0,001 0,008 < LD < LD < LD
Ma
i
N1 0,243 0,001 < LD 0,002 0,842 0,001 0,006 0,001 0,021 0,006
RP1 0,099 0,000 < LD 0,001 0,645 0,000 0,012 0,001 0,038 0,012
N2 0,175 0,000 < LD 0,002 0,185 0,000 0,034 < LD 0,041 0,002
RI1 0,088 0,000 < LD < LD 0,272 0,000 0,008 0,003 0,030 0,015
N3 0,161 0,001 < LD 0,001 0,919 0,001 0,029 0,004 0,009 0,005
RP2 0,131 0,001 < LD 0,000 0,665 0,000 0,017 < LD 0,016 0,013
RI2 0,129 0,000 < LD 0,003 0,635 0,001 0,014 0,005 0,015 0,008
Ag
o
N1 0,084 0,003 < LD 0,003 3,403 0,001 0,008 0,009 < LD 0,002
RP1 0,106 0,001 < LD 0,002 4,347 0,000 0,022 0,001 < LD 0,006
N2 0,110 0,001 < LD < LD 2,152 0,000 0,004 < LD 0,015 < LD
RI1 0,052 0,000 < LD 0,000 1,206 0,000 0,017 0,000 0,003 < LD
N3 0,066 0,001 < LD 0,010 1,700 0,000 0,027 < LD < LD 0,014
RP2 0,115 0,001 < LD 0,001 1,888 0,000 0,013 < LD < LD < LD
RI2 0,045 0,001 < LD 0,002 1,882 0,000 0,013 < LD < LD < LD
Ou
t
N1 0,069 0,000 0,001 <LD 0,435 0,001 0,015 <LD 0,008 0,002
RP1 0,060 <LD <LD <LD 2,854 0,001 0,017 <LD <LD <LD
N2 0,092 <LD <LD <LD 1,273 0,001 0,012 <LD <LD 0,001
RI1 0,072 <LD <LD <LD 2,777 0,001 0,051 0,003 <LD <LD
N3 0,045 <LD <LD <LD 0,277 0,001 0,033 0,001 <LD <LD
RP2 0,077 <LD <LD <LD 0,813 0,001 0,015 <LD <LD 0,001
VMP 0,1
mg L-1
0,001
mg L-1
0,05
mg L-1
0,009
mg L-1
0,3
mg L-1
0,0002
mg L-1
0,1
mg L-1
0,025
mg L-1
0,01
mg L-1
0,18
mg L-1
*<LD: Abaixo do Limite de Detecção. As concentrações acima do VMP estão em negrito.

13 Avaliação sazonal da qualidade das águas superficiais …
Rev. Ambient. Água vol. 13 n. 2, e2072 - Taubaté 2018
Nos poços estudados, os metais Al, Fe, Hg e Pb estiveram acima do VMP estabelecido
pela Portaria 2.914/11 do Ministério da Saúde (Tabela 4). Os metais Cd e Cu não demonstraram
diferenças significativas entre os poços a montante do lixão (P1 e P2) e os poços a jusante do
lixão (P3 e P4), e obtiveram as maiores concentrações no início do período de chuvas e no início
do período menos chuvoso.
Tabela 4. Concentração de metais (mg L-1) em poços durante as seis campanhas amostrais e VMP (Valor
Máximo Permitido) pela Portaria 2.914/11 do MS para as águas de consumo humano.
Poços Al Cd Cr Cu Fe Hg Mn Ni Pb Zn
No
v
P1 0,013 < LD <LD 0,002 0,161 0,006 < LD <LD <LD
P2 0,089 < LD <LD 0,004 0,545 0,009 < LD <LD 0,013
P3 0,517 < LD 0,000 0,002 0,326 0,007 < LD <LD 0,006
P4 0,083 < LD <LD 0,000 0,863 0,014 < LD <LD 0,017
Fev
P1 0,109 0,000 0,003 0,002 0,153 0,001 0,042 0,007 0,005 0,015
P2 0,274 0,001 0,004 0,003 0,353 0,001 0,010 < LD <LD 0,013
P3 0,082 0,001 0,002 0,002 0,253 0,001 0,010 0,006 0,002 0,042
P4 0,143 0,001 0,003 0,005 0,360 0,001 0,087 0,000 <LD 0,020
Ma
r
P1 0,182 < LD 0,000 < LD 0,014 0,001 0,014 0,002 < LD 0,003
P2 0,104 < LD 0,003 < LD 0,134 0,001 0,008 < LD 0,004 0,002
P3 0,580 < LD 0,001 < LD 0,037 0,001 0,032 0,000 < LD 0,027
P4 0,078 < LD < LD < LD 0,179 0,001 0,015 < LD < LD 0,005
Ma
i
P1 0,067 0,000 0,000 0,001 0,022 0,001 0,009 < LD 0,007 0,005
P2 0,051 0,000 < LD < LD 0,113 0,000 0,053 < LD 0,008 0,010
P3 0,262 < LD 0,001 0,004 1,123 0,000 0,037 0,007 0,014 0,023
P4 0,130 < LD 0,001 0,002 0,302 0,001 0,014 < LD 0,028 0,006
Ag
o
P1 0,036 0,002 < LD 0,001 0,079 0,000 0,012 0,000 0,130 0,003
P2 0,044 0,002 < LD 0,005 0,626 0,000 0,005 < LD 0,132 0,002
P3 0,347 0,000 0,002 0,005 3,091 0,000 0,030 0,004 0,001 0,021
P4 0,099 < LD 0,001 0,004 0,315 0,000 0,012 0,003 < LD 0,005
Ou
t
P1 0,042 <LD <LD <LD 0,068 0,003 0,025 0,004 <LD <LD
P2 0,084 <LD <LD <LD 0,628 0,001 0,008 <LD <LD <LD
P3 0,145 <LD 0,000 <LD 3,659 0,002 0,073 0,002 <LD 0,008
P4 0,151 <LD <LD <LD 0,494 0,001 0,055 0,006 <LD 0,005
VMP 0,2
mg L-1
0,005
mg L-1
0,05
mg L-1
2
mg L-1
0,3
mg L-1
0,001
mg L-1
0,1
mg L-1
0,07
mg L-1
0,01
mg L-1
5
mg L-1
*<LD: Abaixo do Limite de Detecção. As concentrações acima do VMP estão em negrito.
De modo semelhante às águas superficiais, os poços apresentaram maiores concentrações
dos metais Al e Fe, quando comparado aos demais metais. O poço P3 foi o que apresentou os
maiores valores de Al na água, com maiores concentrações no período de chuvas. O Fe
apresentou maiores concentrações no período menos chuvoso, momento em que o nível da água
dos poços estava bem baixo, e o poço P3 também foi o que apresentou maiores concentrações
de Fe. Resultados que reforçam a afirmativa de influência do lixão na qualidade da água
subterrânea na região.
Com relação ao Hg, somente os poços P1 e P3 obtiveram valores acima do VMP pela
Portaria, com concentrações levemente superiores no período menos chuvoso. Tanto em águas

Rev. Ambient. Água vol. 13 n. 2, e2072 - Taubaté 2018
14 Régia Simony Braz Da Silva et al.
superficiais quanto subterrâneas o Hg não apresentou diferença entre pontos a montante ou a
jusante do lixão, o que sugere que a contaminação venha a ter por origem outra atividade
antropogênica, como descarte de lixo eletrônico de modo inadequado (Kemerich et al., 2013),
pois não existe coleta de lixo nas comunidades estudadas. Já o Pb obteve maiores concentrações
no período menos chuvoso nos poços P1 e P2, ambos a montante do lixão. A alta concentração
de Pb a montante do lixão corrobora com a hipótese de dispersão de Pb pelo ar através da
incineração de materiais ricos desse metal no lixão.
4. CONCLUSÃO
A avaliação da água superficial demonstrou que os rios e nascentes estudados estão
impactados, o fato de os pontos N3, RP2 e RI2 apresentarem mais parâmetros em
desconformidade com a Resolução 357/05 do CONAMA comprova a hipótese de influência do
lixão, embora outros fatores não possam ser desconsiderados.
De modo semelhante, foi constatado que a água nos poços avaliados se encontra imprópria
para consumo, resultado das concentrações de coliformes totais, E. coli, Al, Cd, Fe, Hg e Pb
acima do VMP estabelecido pela Portaria 2.914/11 do MS. Os poços P3 e P4 apresentaram
maior deterioração da qualidade da água quando comparados aos poços P1 e P2, o que reforça
o pressuposto de influência de derivados do lixão na composição da água local.
O estudo da sazonalidade da concentração dos parâmetros em águas superficiais e
subterrâneas revelou que a maioria dos parâmetros e dos metais apresenta variabilidade sazonal.
O período de chuvas se caracterizou pela maior degradação da qualidade da água em águas
superficiais, em virtude do carreamento de matéria orgânica, sedimentos, sais e microrganismos
para os corpos hídricos. Quanto às águas subterrâneas, o período menos chuvoso contribuiu
para o aumento das concentrações de sedimentos e de alguns metais na água dos poços, como
Cu, Fe, Hg e Pb. Entretanto, as concentrações de coliformes totais, E. coli, Al, Fe, Cr e Zn
estiveram mais elevadas durante o período de chuvas.
A avaliação da água e sua sazonalidade em Cuiarana é ponto de partida para a tomada de
decisões que visem à melhoria da água na região, uma vez que a água analisada é consumida
pela população local. Além disso, a influência da topografia (lixão em cota mais elevada que
os corpos hídricos), a alta velocidade de infiltração de água no solo e o regime pluviométrico
na área conduzem o escoamento superficial do lixão em direção às águas superficiais e
subterrâneas, o que torna a área extremamente vulnerável à contaminação da água pelos
derivados do lixão. Desse modo, se não houver a adoção de medidas que mitiguem essa
situação, as chances de uma deterioração gradativa da qualidade da água consumida pela
população é evidente.
5. AGRADECIMENTOS
Ao CNPq/Edital Universal – n.º 14/2012 e à FAPESPA/Universal 2014, pelo apoio
financeiro, indispensável para a realização desta pesquisa. Ao Instituto Evandro Chagas que
com grande solicitude realizou as análises de metais pesados na água.
6. REFERÊNCIAS
ANJOS, M. R.; MACHADO, N. G.; SILVA, M. E. P.; BASTOS, W. R.; MIRANDA, M. R.;
CARVALHO, D. P. et al. Bioaccumulation of methylmercury in fish tissue from the
Roosevelt River, Southwestern Amazon basin. Revista Ambiente & Água, v. 11. n. 3,
p. 508-518, 2016. http://dx.doi.org/10.4136/ambi-agua.1830

15 Avaliação sazonal da qualidade das águas superficiais …
Rev. Ambient. Água vol. 13 n. 2, e2072 - Taubaté 2018
ASHRAF, M. A.; YUSOFF, I.; YUSOF, M.; ALIAS, Y. Study of contaminant transport at an
open-tipping waste disposal site. Environmental Science and Pollution Research, v.
20, p. 4689–4710, 2013. https://doi.org/10.1007/s11356-012-1423-x
AMERICAN PUBLIC HEALTH ASSOCIATION (APHA). Standard Methods For The
Examination of Water and Wastewater. 22. ed. Washington, 2012.
BERNARDO, S.; SOARES, A. A.; MANTOVANI, E. C. Manual de irrigação. 8. ed. Viçosa:
UFV, 2006. 625p.
BRANDÃO, C. J. et al. (Org.). Guia nacional de coleta e preservação de amostras: água,
sedimento, comunidades aquáticas e efluentes líquidos. São Paulo: CETESB; Brasília:
ANA, CETESB, 2011.
BRANDÃO, V. S.; CECÍLIO, R. A.; PRUSKI, F. F.; SILVA, D. D. Infiltração da água no
solo. 3. ed. Viçosa: UFV, 2006. 120 p.
CARVALHO, T. M. Técnicas de medição de vazão por meios convencionais e não
convencionais. Revista Brasileira de Geografia Física, v. 1, n. 1, p. 73-85, 2008.
COMPANHIA DE TECNOLOGIA DE SANEAMENTO AMBIENTAL (CETESB).
Coliformes totais - Determinação pela técnica de membrana filtrante: método de
ensaio. São Paulo, 2007.
COMPANHIA DE TECNOLOGIA DE SANEAMENTO AMBIENTAL (CETESB).
Qualidade das águas interiores no estado de São Paulo, Série Relatórios: Significado
ambiental e sanitário das variáveis de qualidade das águas e dos sedimentos e
metodologias analíticas e de amostragem (Apêndice A). São Paulo, 2009.
COSTA, M. H. Balanço Hídrico segundo Thornthwaite e Mather, 1955. Viçosa:
Universidade Federal de Viçosa, 1994. 22 p. (Caderno didático, v. 19).
EMMETT, B. A.; HUDSON, J. A.; COWAR, D. P. A.; REYNOLDS, B. The impact of a
riparian wetland on stream water quality in a recently afforested upland catchment.
Journal of Hydrology, v. 162, n. 3–4, p. 337–353, 1994. https://doi.org/10.1016/0022-
1694(94)90235-6
FIGUEROA, S.N.; NOBRE, C. Precipitations distribution over Central and Western Tropical
South America. Climanálise-Boletim de Monitoramento e Análise Climática, v. 5, n.
6, p. 36-48, 1990.
FRANCO, G. B.; SILVA, D. D.; MARQUES, E. A. G.; CHAGAS, C. S.; GOMES, R. L.
Análise da vulnerabilidade à contaminação do aquífero freático e da taxa de infiltração
do solo da bacia do rio Almada e área costeira adjacente – BA. Revista Brasileira de
Geografia Física. v. 08, n. 03, p. 705-720, 2015.
GALARPE, V. R. K.; PARILLA, R. B. Influence of Seasonal Variation on the
Biophysicochemical Properties of Leachate and Groundwater in Cebu City Sanitary
Landfill, Philippines. International Journal of Chemical and Environmental
Engineering, v. 3, n. 3, 2012.
GOLTERMAN, H. L.; CLYMO, R. S.; OHNSTAD, M. A. M. Methods for physical and
chemical analysis of fresh waters. 2. ed. Oxford: Blacwell Scientific Publications, 1978.
215p.

Rev. Ambient. Água vol. 13 n. 2, e2072 - Taubaté 2018
16 Régia Simony Braz Da Silva et al.
GUNKEL, G.; LANGE, U.; WALDE, D.; ROSA, J. W. C. Environmental Impact of an Amazon
Reservoir, Curuá-Una /Pará: Limnological Aspects. German-Brazilian In: WORKSHOP
ON NEOTROPICAL ECOSYSTEMS - ACHIEVEMENTS AND PROSPECTS OF
COOPERATIVE RESEARCH, 2000, Hamburg. Programa and abstracts... Hamburg:
University, 2000. p. 511-516.
INSTITUTO BRASILEIRO DE GEOGRAFIA E ESTATÍSTICA (IBGE). Censo
demográfico: 2010. Pará: Salinópolis. Disponível em:
http://www.cidades.ibge.gov.br/xtras/perfil.php?lang=&codmun=1506203. Acesso em:
05 out. 2014.
KEMERIRICH, P. D. C.; MENDES, S. A.; VORPAGEL, T. H.; PIOVESAN, M. Impactos
ambientais decorrentes da disposição inadequada de lixo eletrônico no solo. Engenharia
Ambiental, v. 10, n. 2, p. 208 - 219, 2013.
MACHADO, A. L. S.; PACHECO, J. B. Serviços ecossistêmicos e o ciclo hidrológico da Bacia
Hidrográfica Amazônica - the biotic pump. Revista GEONORTE, v. 1, n. 1, Ano 1, p.
71-89, 2010.
MARMONTEL, C. V. F.; RODRIGUES, V. A. Parâmetros Indicativos para Qualidade da Água
em Nascentes com Diferentes Coberturas de Terra e Conservação da Vegetação Ciliar.
Floresta e Ambiente, v. 22, n. 2, 2015.
MEDEIROS, G. A.; REIS, F. A. G. V.; SIMONETTI, F. D.; BATISTA, G.; MONTEIRO, T.;
CAMARGO, V. et al. Diagnóstico da qualidade da água e do solo no lixão de Engenheiro
Coelho, no estado de São Paulo. Engenharia Ambiental, v. 5, n. 2, p. 169-186, 2008.
MENGAWACO, A. Caracterização climática da cidade de Salinópolis/PA. 1995. 37f.
Trabalho de conclusão de curso (graduação em meteorologia) - Centro de Geociências,
Departamento de Meteorologia, Universidade Federal do Pará, Belém, 1995.
MORAES, B. C.; COSTA, J. M. N.; COSTA, A. C. L.; COSTA, M. H. Variação espacial e
temporal da precipitação no estado do Pará. Acta Amazônica, v. 35, n. 2, p. 207 – 214,
2005. http://www.locus.ufv.br/handle/123456789/8140
NATIONAL OCEANIC AND ATMOSPHERIC ADMINISTRATION (NOAA). Índices.
2016. Disponível em: http://www.cpc.ncep.noaa.gov/data/indices/soi. Acesso em: 03 fev.
2016.
NOBRE, A. C.; OBREGÓN, O.; MARENGO, J. A.; FU, R.; POVEDA, G. Características do
Clima Amazônico: Aspectos Principais. [S.l.: s.n.], 2009. p. 149-162. (Amazonia and
Global Change, Geophysical Monograph Series 186).
OLIVEIRA, M. C. P.; OLIVEIRA, B. T. A.; DIAS, J. S.; MOURA, M. N.; SILVA, B. M.;
SILVA, S. V. B. et al. Avaliação macroscópica da qualidade das nascentes do Campus da
Universidade Federal de Juiz de Fora. Revista de Geografia, v. 3, n. 1, p. 1-7, 2013.
OLIVEIRA, S.; PASQUAL, A. Avaliação de Parâmetros Indicadores de Poluição por Efluente
Líquido de um Aterro Sanitário. Engenharia Sanitária Ambiental, v. 9, n. 3. p. 240-
249, 2004.
PEREIRA, A. R.; ANGELOCCI, L. R.; SENTELHAS, P. C. Meteorologia Agrícola.
Piracicaba: Universidade de São Paulo. Escola Superior de Agricultura “Luiz de
Queiroz”, 2007.

17 Avaliação sazonal da qualidade das águas superficiais …
Rev. Ambient. Água vol. 13 n. 2, e2072 - Taubaté 2018
PEREIRA, A. R.; SANTOS, A. A.; SILVA, W. T. P.; FROZZI, J. C.; PEIXOTO, K. L. G.
Avaliação da qualidade da água superficial na área de influência de um lixão. Revista
Ambiente e Água, v.8, n. 3, p 239-246, 2013. http://dx.doi.org/10.4136/ambi-agua.1160
PINTO, A. G. N.; HORBE, A. M. C.; SILVA, M. S. R.; MIRANDA, S. A. F.; PASCOALOTO,
D.; SANTOS, H. M. C. Efeitos da ação antrópica sobre a hidrogeoquímica do rio Negro
na orla de Manaus/AM. Acta Amazonica, v. 39, n. 3, p. 627 – 638, 2009.
RODRIGUES, J. C.; SOUZA, P. J. O. P.; LIMA, R. T. Estimativa de temperaturas basais e
exigência térmica em mangueiras no nordeste do estado do Pará. Revista Brasileira de
Fruticultura, v. 35, n. 1, p. 143-150, 2013.
SANTOS, J. T. S. Aplicação do Modelo Hidrológico SWAT para a Sub-bacia do Rio
Arapepó (Salinópolis/PA). 2014. 83 f. Dissertação (Mestrado em Ciências Florestais) –
Universidade Federal Rural da Amazônia, Belém, 2014.
SILVA, A. E. P.; ANGELIS, C. F.; MACHADO, L. A. T.; WAICHAMAN, A. V. Influência
da precipitação na qualidade da água do Rio Purus. Acta Amazonica, v. 38, n. 4, p. 733
– 742, 2008.
SODRÉ, G. R. C.; RODRGUES, L. L. M. Comparação Entre Estimativa da Precipitação
Observada Pela Técnica CMORPH e Estações Meteorológicas do INMET em Diferentes
Regiões do Brasil. Revista Brasileira de Geografia Física, v. 06, n. 02, p. 301 – 307,
2013.
TUCCI, C. E. M. Águas urbanas. Estudos Avançados, v. 22, n. 63, 2008.
WORLD HEALTH ORGANIZATION (WHO). International Programme on Chemical
Safety. Geneva, 198