issn: 1997- 4507 vol 8(ii) july, 2013
TRANSCRIPT

Copyright © 2013. NJMT
1
NUML Journal of Management & Technology
Vol: 7, No: 2. July, 2012 ISSN 1997-4507
NUML Journal of Management & Technology
ISSN: 1997- 4507
Volume: 8 - Numbers: 2 - July, 2013
A Research Journal Published by
Faculty of Management Sciences
National University of Modern Languages
Islamabad-Pakistan www.numl.edu.pk
This Issue includes:
Copyright © 2013 NJMT
w w w . n u m l . e d u . p k
1. Does Funds‘ Turnover Effect Closed-Ended Mutual Funds‘ Performance? Evidence
from Pakistani Mutual Funds Industry
Ehtisham Ali, Faid Gul, Rashid Mehmood Khan, Ayesha Kausar
2. The Impact of Job Satisfaction on Employee Performance in Pharmaceutical
Industry of Pakistan
M. Ali Ishaque, Faid Gul, Dr. Naveed Akhtar, Maryam Iqbal, Rashid. Mehmood Khan
3. Working Capital Management and Firm Performance of Construction and Material
Sector in Pakistan Faiza Asghar, Dr. Hafiz M. Ishaq, Humaira Naz
4. To Investigate the Impact of Big Five Personality Traits on Customer Advocacy
Behavior
Maimoona Sadiq, Dr. Hafiz M. Ishaq, Faiz Ahmed
5. Moderational effect of age on time pressure and human judgment-decision making
relationship
S. Abdul Hameed, Dr. Naveed Akhtar, Prof. Safdar Ali Butt

Copyright © 2013. NJMT
2
NUML Journal of Management & Technology
Vol: 7, No: 2. July, 2012 ISSN 1997-4507
NUML Journal of Management & Technology
Patron-in-Chief
Major General Masood Hassan ®
Rector NUML
Patron
Brig. Azam Jamal,
Director General, NUML
Chief Editor
Dr. Naveed Akhtar Faculty of Management Sciences
Professor Dr. Bahaudin Mujtaba,
Huizinga, NOVA , Florida, USA
Prof.Dr.Gurbuz Gokcen. School of
Economics and Administrative
Sciences, Marmara University
Prof. Dr. Yan Li. Department of
Organization & HRM. Beijing
Institute of Technology, Heijing, P.R.
China
Prof. Dr. Songsheng Chen. School of
Management and Economics, Beijing
Institute of Technology, Haidian
District, Beijing, P.R. China
Professor Dr. Canan CETIN, Marmara
University Faculty of Economy and
Administrative Sciences, Instanbul,
Turkey
Dr. Amir
SZABIST
Professor Dr. Ayse Kucuk Yilmaz,
Anadolu University Turkey
Dr. M.Zahid Iqbal
COMSATAS, Islamabad.
Professor Dr. Lisa Anderson,
University of Liverpool, UK.
Dr. Waheed Akhtar
COMSATS, Lahore
Dr. Sermin Senturan
Bulent Ecevit University Zonguldak,
Turkey
Dr. Aurangzeb Zulfiqar Khan
COMSATS, Islamabad
Dr. Mehmet Sisman, Marmara
University, Istanbul
Dr. Sajid Bashir
MAJU
Prof. Dr. Erkan TASKIRAN
Duzce University, Trukey
Dr. Tasweer Hussain Shah,
Department of management, C of E &
ME, NUST, Pakistan
Working Group Members:
Sajid Rahman Khattak Nisbat Ali
w w w . n u m l . e d u . p k

Copyright © 2013. NJMT
3
NUML Journal of Management & Technology
Vol: 7, No: 2. July, 2012 ISSN 1997-4507
Table of Contents
1. Does Funds‘ Turnover Effect Closed-Ended Mutual Funds‘ Performance?
Evidence from Pakistani Mutual Funds Industry
Ehtisham Ali, Faid Gul, Rashid Mehmood Khan, Ayesha Kausar
2. The Impact of Job Satisfaction on Employee Performance in Pharmaceutical
Industry of Pakistan
M. Ali Ishaque, Faid Gul, Dr. Naveed Akhtar, Maryam Iqbal, Rashid Mehmood Khan
3. Working Capital Management and Firm Performance of Construction and
Material Sector in Pakistan Faiza Asghar, Dr. Hafiz Muhammad Ishaq, Humaira Naz
4. To Investigate the Impact of Big Five Personality Traits on Customer Advocacy
Behavior
Maimoona Sadiq, Dr. Hafiz Muhammad Ishaq, Faiz Ahmed
5. Moderational effect of age on time pressure and human judgment-decision
making relationship
Sardar Abdul Hameed, Dr. Naveed Akhtar, Prof. Safdar Ali Butt
Volume: 8 - Numbers: 2 - July, 2013

Copyright © 2013. NJMT
4
NUML Journal of Management & Technology
Vol: 7, No: 2. July, 2012 ISSN 1997-4507
Does Funds’ Turnover Effect Close-Ended Mutual Funds’
Performance? Evidence from Pakistani Mutual Fund Industry
Ehtisham Ali* (Corresponding Author)
Email: [email protected]
Faid Gul*
Email: [email protected]
Rashid Mehmood Khan*
Email: [email protected]
Ayesha Kausar*
*National University of Modern Languages, Islamabad
Abstract
This study is undertaken to evaluate the impact of funds’ turnover on their
performance. For this purpose the close-ended mutual funds, listed in Mutual
Funds Association of Pakistan, are selected. The semi-annual data are used for
the time period from 2008 to 2012 which are extracted from the close-ended
funds’ financial reports. Simple linear regression, using SPSS, is applied to
analyze the impact of funds’ turnover on their performance. The study finds
significant positive relationship between funds’ turnover and their performance.
Key Words: Mutual fund, turnover, performance, Pakistan
Introduction
In 1962 mutual funds were introduced in Pakistan by the public offering of National
Investment Trust. Presently NIT is being operated as the only open-ended mutual fund
in public sector of Pakistan. After NIT another fund, Investment Corporation of Pakistan
was formed in 1966 and floated 26 close-ended mutual funds. In 2000, Government
decided to reconstruct the corporations, and in 2002, it started the privatizations of ICP.
From the 26 mutual funds, 25 mutual funds were divided in two lots. ABAMCO limited
acquired the first lot containing 12 funds out of which 9 were merged in close ended
funds with the title name as ABAMCO Capital fund. Remaining three funds were
merged into another fund with the title of ABAMCO Stock Market Fund. On the other

Copyright © 2013. NJMT
5
NUML Journal of Management & Technology
Vol: 7, No: 2. July, 2012 ISSN 1997-4507
hand, the second lot was acquired by PICIC Assets Management Company Ltd.
containing 13 ICP Funds. These funds were merged into a single close-ended fund with
the title of PICIC Investment Fund. After than PICIC acquired another Fund (ICP
SEMF) which was declared as a new close ended fund named PICIC Growth fund in the
extraordinary general meeting of certificate holders on 16th
June 2004. It was authorized
by SECP on 20th
July 2004.
Presently there are 130 open-ended and 14 close-ended mutual funds operating in
private sector (MUFAP, March 2013) and SECP is the regulatory body of all types of
mutual funds in Pakistan. In Pakistan, mutual funds are increasing in numbers as they
provide the diversification opportunity to investors. Small investors don‘t have sufficient
skills and resources to keep an eye on the management of their investment so they prefer
indirect investment. Mutual funds give the opportunity to small investors to invest in a
professionally managed investment entity and also to take advantage of the
diversification as well as potential for higher returns.
In Pakistani financial markets different categories of mutual funds are available e.g.
Islamic funds, income funds, equity funds, balanced funds, asset allocation funds, fund
of funds, index tracker funds and money market funds. This provides an opportunity to
small investors to select from a variety of alternatives to better match their requirements.
The current study is about the impact of funds‘ turnover on their performance.
Currently, there are two divergent views about turnover and performance. One view is
that financial markets are overall efficient and higher turnover increases the transaction
cost of the fund without giving sufficient benefit and therefore the performance of the
fund decreases as the turnover increases. While the second view is that market are not
highly efficient and based on knowledge and experience funds‘ managers can identify
occasions when to buy or sell. This active management of the fund brings higher returns
even after paying higher transaction cost. The current study is about these two divergent
views of funds turnover and performance. This will be helpful for fund managers as well
as for investor to make appropriate decisions regarding funds‘ management and
investment.

Copyright © 2013. NJMT
6
NUML Journal of Management & Technology
Vol: 7, No: 2. July, 2012 ISSN 1997-4507
Literature Review
Many researchers analyze the impact of turnover on performance of funds e.g. Carhart
(1997) finds negative relationship between mutual funds turnover and return in US
mutual fund market. By taking the Swedish mutual funds which are invested in Swedish
Securities and by taking the data for the period 1993-1997 Dahlquist et al (2000)
perform a study to examine fund management fee, turnover ratio, past performance and
fund size have relation with performance. Their study opines that the funds which have
higher turnover ratio perform well as compare to those funds which have low turnover
ratio. Whereas, Friend et al. (1970) document the slight positive relationship between
risk adjusted fund returns and turnover. Brennan, Chordia & Subramanian (1998) find
significant negative relationship between trading volume and fund return. By taking the
data from the period 1963 to 1991, Datar, Naik & Radcliffe (1998) employ turnover
ratio and document that the stock returns have negative relationship with turnover ratio
even after controlling size and book to market risk premium. They also state that the
turnover ratio is ideal substitute for liquidity as its data are easy to obtain and it has
strong theoretical background and support. They find no evidence of other factors like
seasonal effect by taking the data from the period 1986 to 1993 Claessens, Dasgupta &
Glen (1995) investigate the returns by using many variables which include price to book
value, earning to price, exchange rate, market returns, turnover and size. They document
that turnover and size have descriptive power in stock returns in different countries.
Ippolito (1989) also examines the overall efficiency of mutual fund industry by taking
143 US mutual funds and by using data over the period 1965 to 1984. Using Jensen
measure for performance evaluation and to investigate the impact of expenses and
turnover on performance, he finds that the management fee and turnover are not related
to performance of fund. Rakowski (2002) using daily data, documents that the returns
are strongly influenced by turnover.
By taking 69 Malaysian equity funds which includes 25 Islamic and 44 conventional
funds, Pui See and Jusoh (2012) conduct their study to examine the characteristics that
effect mutual fund performance on the data of five years. They examine the effect of
Copyright © 2013. NJMT
7
NUML Journal of Management & Technology
Vol: 7, No: 2. July, 2012 ISSN 1997-4507
expense ratio, fund age, turnover ratio, fund size and risk. They find that turnover ratio
and expense ratio have significant relationship with fund performance.
Wermers (2000) investigates the American registered Funds which are invested in
American securities. By using the data for the period 1975-1994, he investigates the
relationship between turnover and fund size with returns and document that the funds
having high turnover ratio are earning more and have more risk-adjusted returns as
compare to funds which have low turnover ratio. Elton, Gruber, Das, and Hlavka
(1993) in their study find that risk adjusted returns have negative correlation with
turnover and expense ratio when there is difference between the performances of small
capitalization. Khorana (1996) in his study documents that before changing in
management the portfolio turnover of a fund must be relatively high which reflects
herding behavior.
Abbasi, Kalantari & Abbasi (2012) conduct their study to examine the relationship of
turnover with performance. They use Multiple and Combined ANOVA and find
significant positive relationship between turnover ratio and performance. Whereas,
Droms & Walker (1996) in their study, find that expense ratio and turnover are
negatively correlated with fund performance.
Dellva & Olson (1998) in their study find significant positive relationship between
turnover fund performances at 1 percent significance level.
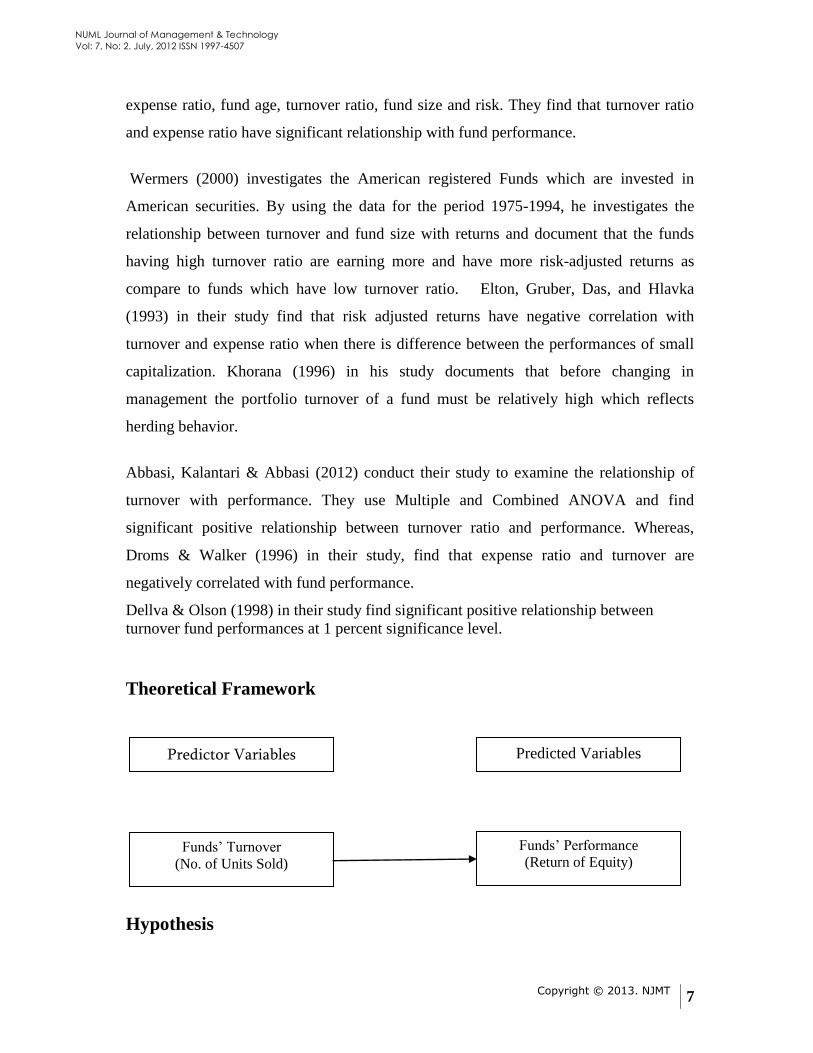
Theoretical Framework
Hypothesis
Predictor Variables Predicted Variables
Funds‘ Turnover
(No. of Units Sold)
Funds‘ Performance
(Return of Equity)

Copyright © 2013. NJMT
8
NUML Journal of Management & Technology
Vol: 7, No: 2. July, 2012 ISSN 1997-4507
H1: Fund‘s Turnover has significant impact on Fund‘s Performance.
Methodology
Population and Sample Size
The population of the study consists of all close-ended mutual funds listed in MUFAP.
Total 13 close-ended mutual funds are listed in MUFAP. 12 close-ended funds, from a
total of 13, have been selected which are having their data publicly available.
Independent Variable
In this study ―turnover‖ is the independent variable. It is the total trading of a fund on
semi-annual basis. It can be sales or purchases and can also be calculated through other
ways like by dividing the sum of sales and purchases with the average of opening and
closing units and by taking the number of shares being traded or volume of amount
being traded. In this study we have taken total units sold in a particular period as
turnover. The log value of the total share traded is used as an independent variable in
this study.
Dependent Variable
Performance can be measured through many ways like by examining the changes in
share prices, Return on Assets (ROA) and Return on Equity (ROE). In this study we
have taken ROE as the dependent variable. It is calculated by dividing Net Income with
Shareholders Equity. Though it is an accounting measure of performance but it is widely
used and supported by historical literature in the field of finance. In a country like
Pakistan, where stock exchanges are very volatile, accounting based measures of
performance are preferred over market produced data.
ROE = Net Income
Shareholder Equity
Data Collection

Copyright © 2013. NJMT
9
NUML Journal of Management & Technology
Vol: 7, No: 2. July, 2012 ISSN 1997-4507
Five years semi-annual data are used in this study for the period January 2008 to
December 2012. The data are extracted from the companies‘ online databases and
financial reports.
Data Analysis
To test the underlying hypothesis, ordinary linear regression is used. SPSS is used to run
the regression and other statistical tests.
Discussion of empirical results
Before running the regression the data were checked for normality and autocorrelation.
Based on the values of Skewness and Kurtosis the data were found normal. Similarly,
based on the Durbin-Watson value no autocorrelation was found, therefore, the data are
suitable for regression and other statistical tests. These tests are not reported here but are
available to interested readers on demand.
The table 1 shows the value of R, R square and Adjusted R square. The value of R is
0.465 while the values of R square and Adjusted R Square are 0.216 and 0.210,
respectively. So the coefficient of determination shows that 21.0% of the variation in a
fund‘s performance is explained by the fund‘s turnover. Although this may not be high
value of coefficient of determination but keeping in view a single explanatory variable,
turnover, it is a reasonable value. To further support this, the F-value and its significance
in table 2 show that the overall model is fit for this test and also statistically significant.
Table 1
Model Summary
Model R R Square
Adjusted R
Square
Std. Error of the
Estimate
1 .465 .216 .210 .26741
a. Predictors: (Constant), Turnover
b. Dependent Variable: ROE
Copyright © 2013. NJMT
10
NUML Journal of Management & Technology
Vol: 7, No: 2. July, 2012 ISSN 1997-4507
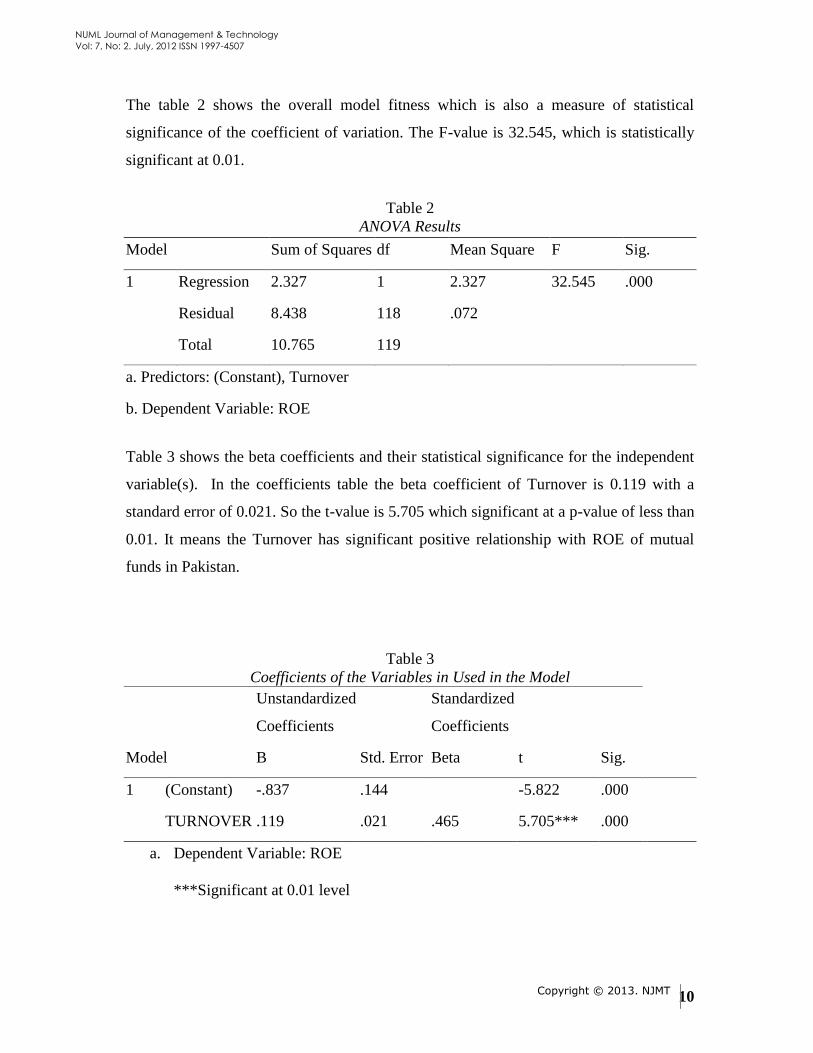
The table 2 shows the overall model fitness which is also a measure of statistical
significance of the coefficient of variation. The F-value is 32.545, which is statistically
significant at 0.01.
Table 2
ANOVA Results
Model Sum of Squares df Mean Square F Sig.
1 Regression 2.327 1 2.327 32.545 .000
Residual 8.438 118 .072
Total 10.765 119
a. Predictors: (Constant), Turnover
b. Dependent Variable: ROE
Table 3 shows the beta coefficients and their statistical significance for the independent
variable(s). In the coefficients table the beta coefficient of Turnover is 0.119 with a
standard error of 0.021. So the t-value is 5.705 which significant at a p-value of less than
0.01. It means the Turnover has significant positive relationship with ROE of mutual
funds in Pakistan.
Table 3
Coefficients of the Variables in Used in the Model
Model
Unstandardized
Coefficients
Standardized
Coefficients
t Sig. B Std. Error Beta
1 (Constant) -.837 .144 -5.822 .000
TURNOVER .119 .021 .465 5.705*** .000
a. Dependent Variable: ROE
***Significant at 0.01 level

Copyright © 2013. NJMT
11
NUML Journal of Management & Technology
Vol: 7, No: 2. July, 2012 ISSN 1997-4507
Conclusion
The study was undertaken to examine the impact of mutual fund‘s turnover on its
performance and finds significant positive relationship between them. The positive
relationship means that funds having high turnover perform better as compare to those
having low turnover in Pakistan. The results are also supported by the different
researchers who also find significant positive relationship between funds turnover and
fund‘s performance e.g. Wermers (2000), Dalquist et al. (2000) and Rakowski (2002).
The findings of this study can be associated with relatively lower market efficiency in
Pakistani. So those fund‘s managers who are actively manage their funds‘ portfolio are
better than passive fund managers. Although, those managers who turnover the funds‘
portfolio more frequently bear more transaction costs but the benefits they generate for
the funds are even greater so it offset the additional costs and also give benefits to the
investors.
References
Abbasi, M., Kalantari, E., & Abbasi, H. (2012). Impact of Corporate Governance
Mechanism on Firm Value: Evidence From The Food Industry in Iran. Journal
of Basic and Applied Scientific Research, 2(5), 4712-4721.
Brennan, M. J., Chordia, T., & Subrahmanyam, A. (1998). Alternative factor
specifications, security characteristics, and the cross-section of expected stock
returns. Journal of Financial Economics, 49(3), 345-373
Carhart, M. M. (1997). On Persistence in Mutual Fund Performance. Journal of
Finance, 52(1), 57-82.
Claessens, S., Dasgupta, S., & Glen, J. D. (1995). The cross-section of stock returns:
Evidence from the emerging markets (No. 1505). World Bank Publications.
Dahlquist, M., Engstrom, S., & Soderlind, P. (2000). Performance and characteristics of
Swedish mutual funds. Journal of Financial and quantitative Analysis, 409-423.
Copyright © 2013. NJMT
12
NUML Journal of Management & Technology
Vol: 7, No: 2. July, 2012 ISSN 1997-4507
Datar, V. T., Y Naik, N., & Radcliffe, R. (1998). Liquidity and stock returns: An
alternative test. Journal of Financial Markets, 1(2), 203-219.
Dellva, W. L., & Olson, G. T. (1998). The relationship between mutual fund fees and
expenses and their effects on performance. Financial Review, 33(1), 85-104.
Droms, W. G., & Walker, D. A. (1996). Mutual fund investment performance. The
Quarterly Review of Economics and Finance, 36(3), 347-363.
Elton, E. J., Gruber, M. J., Das, S., & Hlavka, M. (1993). Efficiency with costly
information: A reinterpretation of evidence from managed portfolios. Review of
Financial studies, 6(1), 1-22.
Friend, I., Blume, M., & Crockett, J. (1970). Mutual funds and other institutional
investors: a new perspective (p. 72). McGraw-Hill.
Ippolito, R. A. (1989). Efficiency with costly information: A study of mutual fund
performance, 1965–1984. The Quarterly Journal of Economics, 104(1), 1-23.
Khorana, A. (1996). Top management turnover an empirical investigation of mutual
fund managers. Journal of financial economics, 40(3), 403-427.
Rakowski, D. (2010). Fund flow volatility and performance. Journal of financial and
quantitative analysis, 45(1), 223.
See, P. Y. and Jusoh, R. (2012). Fund characteristics and fund performance: Evidence
of Malaysian mutual funds. International journal of economics and management
sciences, 1. (9), 31-33
Wermers, R. (2000). Mutual fund performance: An empirical decomposition into
stock‐ picking talent, style, transactions costs, and expenses. The Journal of
Finance, 55(4), 1655-1703.

Copyright © 2013. NJMT
13
NUML Journal of Management & Technology
Vol: 7, No: 2. July, 2012 ISSN 1997-4507
The Impact of Job Satisfaction on Employee Performance in
Pharmaceutical Industry of Pakistan
Muhammad Ali Ishaque*, Faid Gul*(Corresponding Authors)
Dr. Naveed Akhtar Baloch*, Maryam Iqbal*, Rashid Mehmood Khan*
*National University of Modern Languages, Islamabad
Abstract-In the present turbulent environment of pharmaceuticals in Pakistan, employee
performance and job satisfaction has gain great importance. This study is descriptive in
nature and consists of a sample of 120 employees (middle level managers). Job
satisfaction (dependent variable) and employee performance (independent variable) are
measured on five point Likert scale. Employee’s performance is operationalized as
working condition, relationship with supervisor and job uncertainty. Regression
analysis OLS is used to test the hypotheses and concluded that job uncertainty is a main
area of concern for employees of pharmaceutical industry. It is also mentioned that
improve workings conditions determines the higher level of job satisfaction and greater
job performance.
Keywords: Job satisfaction, employee performance, working condition, job uncertainty,
pharmaceutical
Introduction
Job satisfaction shows that how much an individual is associated with his or her job in
the organization. Human resource is an important asset and key source for
organizational development. But if employees are not satisfied then they might be a
cause of big loss for organization so that managing human resource is a big dilemma for
organizations (Ellickson &Logsdon, 2002). Management always tries to satisfy their
workforce. Higher satisfaction level of employees‘ satisfaction leads to higher return to
the organization. There are different factors which affect satisfaction level of employees.
Some of the important factors related to satisfaction level of an employee are working
conditions, supervisory relationship and job security (Nguyen, Taylor& Bradley, 2003).
A lot of research work has been done on this specific phenomenon but there is still a gap
to find out facets of job satisfaction i.e. working condition, relationship with supervisor,
Copyright © 2013. NJMT
14
NUML Journal of Management & Technology
Vol: 7, No: 2. July, 2012 ISSN 1997-4507
and job uncertainty and its impact on employee performance. So, the purpose of this
research is to fill the research gap and to answer the question regarding the impact of job
satisfaction on employee performance. This study aims to find out the impact of the
above stated factors on satisfaction level of employees.
Literature Review
Job Satisfaction
Khan,Nawaz, Aleem& Hamed (2012) conducted research on the reasons of employee
satisfaction in the organization. Their study shows that job satisfaction and
dissatisfaction not only depend on the nature of the job but satisfaction is highly
correlated with the expectations that what the job supply to an employee. According to
Al-Hussami (2008) the nature of the job is not responsible for the satisfaction and
dissatisfaction of an individual. But the individual‘s expectations associated with the job
highly depend. Further, Mulinge & Mullier (1998) describe that intrinsic and extrinsic
reward, social benefits to employees and on merit promotion in job will increase the job
satisfaction. Fisher, Locke& Henne (1992) define that the term job satisfaction is
multifarious experience in nature which highly depend on different factors i.e. relax
working conditions, handsome salary, good relationship with supervisors etc.
Spector (1997) described that the people of an organizations are satisfied when they like
their work and know their roles and responsibilities in the organization. Furthermore, it
is added that job satisfaction is an affective or expressive reaction towards a variety of
features of an employee‘s work. Okpara (2004) described that a person is highly
satisfied in an organization when the pay, promotion and relationship with supervisor
are positive. Out of these facets pay is an important factor which highly satisfies
employees. Additionally, Sokoya (2000) also conducted the research on employee
performance in the public sector organizations and concluded that income is a major
factor which satisfies employees.
Job Uncertainty
Kabir &Pervin (2011) conducted research on the causes which affect job satisfaction of
pharmaceutical sector. Primary as well the secondary data were used; open ended
interviews were designed to collect data. The variables included to study employee

Copyright © 2013. NJMT
15
NUML Journal of Management & Technology
Vol: 7, No: 2. July, 2012 ISSN 1997-4507
satisfaction are supervision, salary and job security. Out of these variables job security
highly affect the satisfaction level of the employees. Jain, Jabin, Mishra &Gupta (2007)
conduct the research on job satisfaction as connected to the organizational environment
and work-related anxiety. Results show that organizational climate has high impact on
employee satisfaction.
Employee dissatisfaction highly depends on the insecurity of job amongst the
employees. Guest (2004) stated that individuals working in an organization become
reluctant toward their work when they feel insecurity of their jobs. Low job security, low
wages and lack of promotion are the leading factors of employee dissatisfaction in the
organization. Abegglen (1958) found through the study of Japanese workers that lifetime
employment and seniority system, job security leads to high satisfaction in the
organization. Further, Bolt (1983), Mooney (1984), and Rosow & Zager (1985) also
concluded that job performance is highly dependent on job security.
Iverson (1996) conducted a study on 20 pharmaceutical companies in Japan and the
results show that job security is the leading factor which motivates the employees
toward work. MorrisLydka, & O'Creevy (1993) concluded that job performance and
organizational commitment is negatively correlated with job insecurity. Judgeet al.
(1998) study the factors which are responsible for job satisfaction in organization.
Results show that organizational social behavior, motivation and job involvement are
positively correlated and increases the employee performance. On the other hand, job
insecurity, absenteeism and work stress leads to dissatisfaction in organizations.
Working Conditions
Khan, Mariyym, Pasha & Hasnain (2011) conduct research on the impact of
organization culture on job satisfaction of employees using a sample size of 150
employees. Variables included in the study are organizational culture (communication
between supervisors and employee, rules and policies, supervisors support, reward and
benefits) and job satisfaction (pay, supervisor, co-workers, and promotion). Results of
the study show that factors of organization culture and working conditions have positive
impact on the satisfaction level of employees.

Copyright © 2013. NJMT
16
NUML Journal of Management & Technology
Vol: 7, No: 2. July, 2012 ISSN 1997-4507
Crannyet al.(1992) describe a number of factors which are responsible for employee
satisfaction including; salary, promotion and relax working condition which includes
proper time table for each employees, holidays and bonuses. The results show that these
factors have positive and significant relationship with employee‘s satisfaction.
Ali &Akhtar (1999) explore the factors which increase the employee performance in
organizations and their results show that healthy organizational climate in favor of
employees positively affect the performance of the employees and increase the level of
employees satisfaction.
Relationship with Supervisor
Aydin & Ceylan (2009) conduct a study on employees‘ satisfaction in terms of
organizational culture and spiritual leadership. The factors which they focused are
organizational culture and spiritual leadership. They take a sample of 578 employees
from the metal industry. Results show that employee satisfaction is positively associated
with organizational culture and spiritual leadership. Mulky (2011) explored the factors
which affect the performance of salespersons of pharmaceutical companies in India.
Survey results show that the relationship of supervisors with salesperson is positively
associated with job satisfaction and increases their performance.
Supervisor‘s support to employees is very important but it should be immediate support
in favor of employees which has positive impact on their performance (Griffin,
Patterson & West, 2001). In today‘s dynamic environment the gain and loss of an
organization highly depend on efficient leadership. Effective leadership includes
increasing employee‘s performance to higher standard, raising employee‘s vision to
higher sight and building their personalities (Drucker, 1985).
According to Chakrabarty, Oubre, & Brown (2008) supervisor should apply such
techniques through which the employees can easily understand the working
requirements and how the job should be done. Politis (2001) has examined the roles
played by leadership in the process of knowledge acquisition and a survey was carried
out on 227 persons who have been engaged in knowledge acquisition activities to
examine the relationship between leadership styles and knowledge acquisition attributes.
The results showed that leadership styles that involve human interaction and encourage
Copyright © 2013. NJMT
17
NUML Journal of Management & Technology
Vol: 7, No: 2. July, 2012 ISSN 1997-4507
participative decision-making are positively related to the skills of knowledge
acquisition.
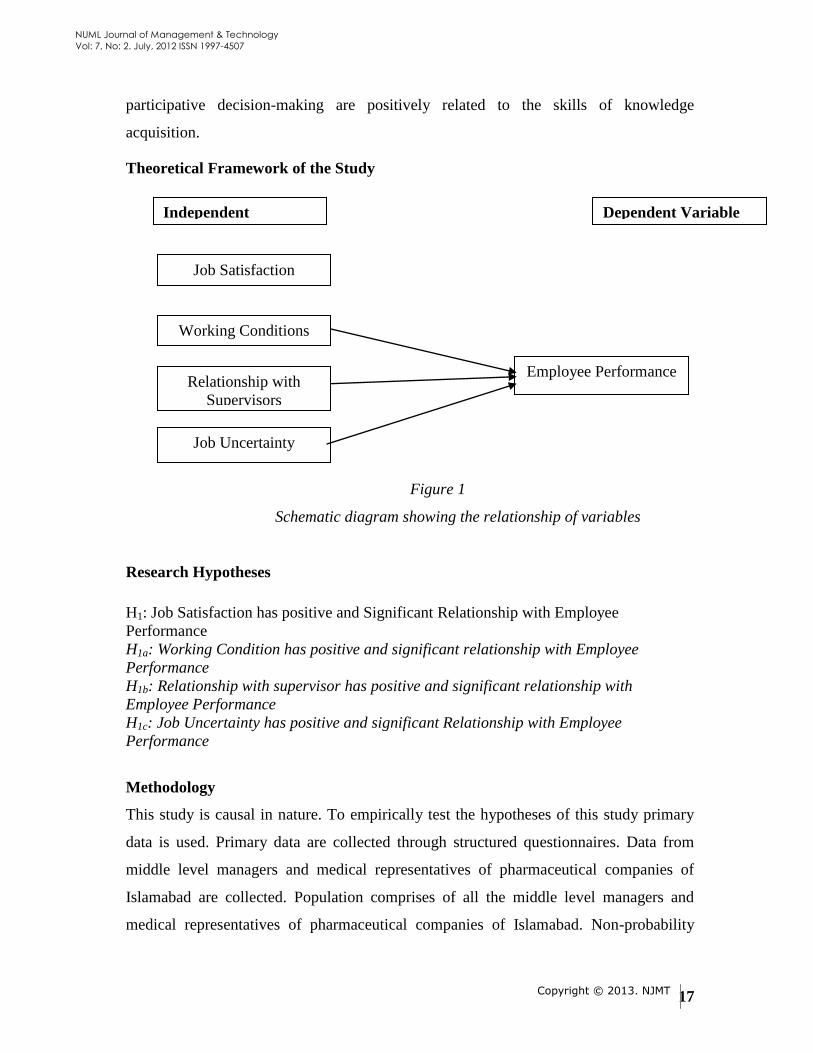
Theoretical Framework of the Study
Figure 1
Schematic diagram showing the relationship of variables
Research Hypotheses
H1: Job Satisfaction has positive and Significant Relationship with Employee
Performance
H1a: Working Condition has positive and significant relationship with Employee
Performance
H1b: Relationship with supervisor has positive and significant relationship with
Employee Performance
H1c: Job Uncertainty has positive and significant Relationship with Employee
Performance
Methodology
This study is causal in nature. To empirically test the hypotheses of this study primary
data is used. Primary data are collected through structured questionnaires. Data from
middle level managers and medical representatives of pharmaceutical companies of
Islamabad are collected. Population comprises of all the middle level managers and
medical representatives of pharmaceutical companies of Islamabad. Non-probability
Employee Performance
Job Satisfaction
Working Conditions
Relationship with
Supervisors
Job Uncertainty
Independent
Variables
Dependent Variable
Copyright © 2013. NJMT
18
NUML Journal of Management & Technology
Vol: 7, No: 2. July, 2012 ISSN 1997-4507
based convenience sampling technique is used in this study. Based on the number of
pharmaceutical companies in Islamabad, a sample of 120people is selected for data
collection. There are around 12 medium and large scale pharmaceutical companies in
Islamabad therefore the selected sample is reasonable for the study. A previously
validated research instrument from Kabir &Parvin (2011) was used for data collection.
To empirically test the hypotheses descriptive statistics, Ordinary Least Square
Regression (OLS), and other statistical models are applied using SPSS.
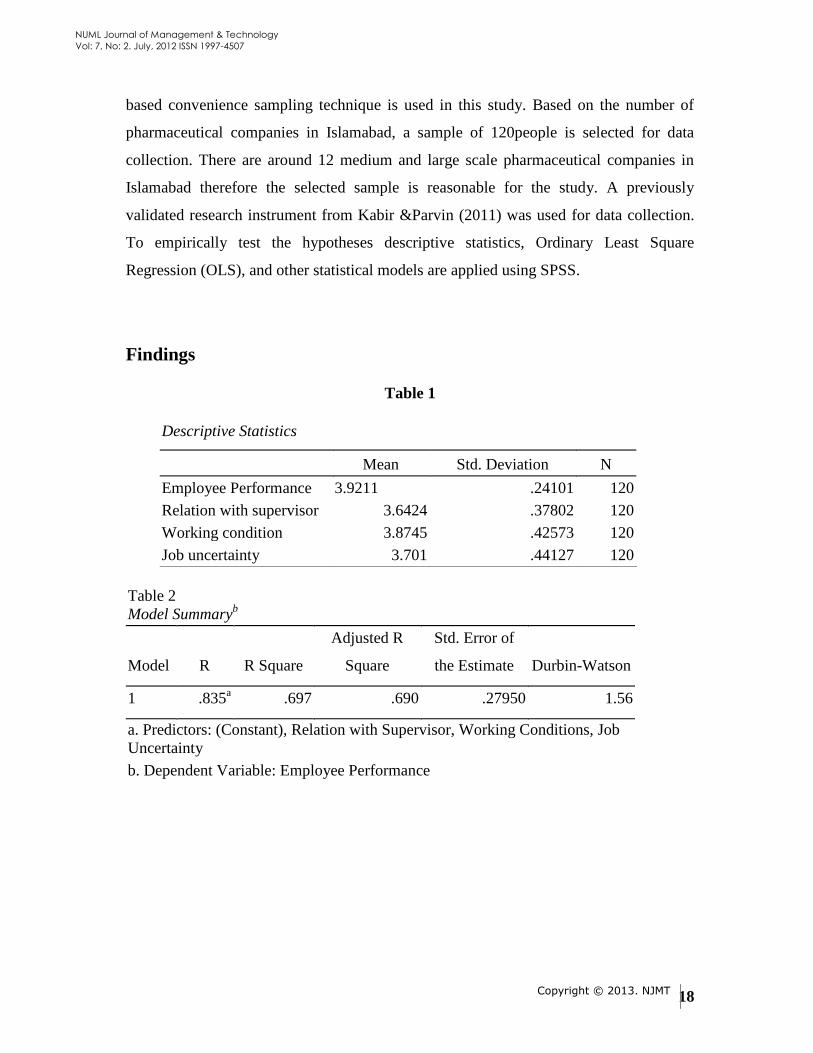
Findings
Table 1
Descriptive Statistics
Mean Std. Deviation N
Employee Performance 3.9211 .24101 120
Relation with supervisor 3.6424 .37802 120
Working condition 3.8745 .42573 120
Job uncertainty 3.701 .44127 120
Table 2
Model Summaryb
Model R R Square
Adjusted R
Square
Std. Error of
the Estimate Durbin-Watson
1 .835a .697 .690 .27950 1.56
a. Predictors: (Constant), Relation with Supervisor, Working Conditions, Job
Uncertainty
b. Dependent Variable: Employee Performance

Copyright © 2013. NJMT
19
NUML Journal of Management & Technology
Vol: 7, No: 2. July, 2012 ISSN 1997-4507
Table 3
ANOVAbResults
Model
Sum of
Squares df Mean Square F Sig.
1 Regression 20.882 4 6.961 89.100 .000a
Residual 9.062 116 .078
Total 29.944 119
a. Predictors: (Constant), Relation with Supervisor, Working
Conditions, Job Uncertainty
b. Dependent Variable: Employee Performance
Table 4
Regression Coefficientsa
Model
Un-standardized
Coefficients
Standardized
Coefficients
t Sig. B Std. Error Beta
1 (Constant) .284 .258 1.098 .274
Working conditions .233 .052 .232 4.501 .000
Job uncertainty -.073 .058 -.071 -1.268 .208
Relation with supervisor .754 .054 .799 14.052 .000
a. Dependent Variable: Employee performance
The R value is 0.835 which represents the simple correlation and therefore indicate the
degree of correlation. The R2 value indicates variability of dependent variable explained
by independent variables. R2
value is 0.698 which specify that employee satisfaction
significantly contributes toward employee performance. The model applied is
significantly good enough in predicting the outcome variable as F = 89.10 and F Sig. <
0.01. By looking at the Bcolumn under the un-standardized coefficients column the
regression equation is presented as:

Copyright © 2013. NJMT
20
NUML Journal of Management & Technology
Vol: 7, No: 2. July, 2012 ISSN 1997-4507
EP = 0.284 + 0.233(WC) – 0.73(JU) + 0.754(RWS) + εi
Where EP is employee performance, WC is working conditions, JU is job uncertainty,
RWS is relation with supervisor and εi is the error term.
The regression coefficients of independent variables along with their t-values and p-
values are presented in coefficient table. Relation with supervisor and working condition
both positively effecting employees performance. For both the t-values are statistically
significant at p<0.01. On the other hand, job uncertainty negatively effects employee
performance but its value is statistically insignificant. The results of this study validate
the findings of previous researchers in this area. Like the findings of Cranny et al.
(1992), Ali & Akhtar (1999) and Khan et al. (2012) this study also confirms that working
conditions significantly affect employees‘ performance. Similarly, this study validates
the findings of Politis (2001), Aydin & Ceylan (2009), Mulky (2011) and Griffin et al.
(2011) that good relation with supervisor significantly improves employee‘s
performance. But result for job uncertainty, although negatively related to employee
performance, is statistically insignificant. Therefore this study is unable to validate the
previous studies like Morris Lydka, & O'Creevy (1993), Judge et al. (1998), Gest (2004)
and Kabir &Pervin (2011). This may possibly be associated with relatively more job
opportunities available in Islamabad. Job uncertainty may not a major issue for
employees where job opportunities are more.
Conclusion
Based on the findings of this it is concluded that better working conditions and good
supervisor relation with employees can significantly improve employees‘ performance
in the pharmaceutical industry of Pakistan. Although the sample is only limited to the
employees of pharmaceutical companies of Islamabad but the findings can be
generalized to other cities of Pakistan. Job uncertainty though negatively affecting
employee‘s performance but its value is not statistically significant. This study is limited
in nature and therefore more in depth investigation is required. Future studies can focus
on larger sample size as well as other factors like work-family life balance, relation with
fellow workers, flexible working hours etc. can be incorporated.
References
Abegglen, J. C. (1958). The Japanese Factory. New York: The Free Press.

Copyright © 2013. NJMT
21
NUML Journal of Management & Technology
Vol: 7, No: 2. July, 2012 ISSN 1997-4507
Al-Hussami, M. (2008). A study of nurses' job satisfaction: the relationship to
organizational commitment, perceived organizational support, transactional
leadership, transformational leadership, and level of education. European
Journal of Scientific Research, 22(2), 286-295.
Ali, N. & Akhtar, Z. (1999). Job satisfaction as related to organisational climate among
bank officers. Paper presented in 4th international & 35th IAAP conference at
Anand (Gujarat), May 27-29.
Aydin, B., & Ceylan, A. (2009). The effect of spiritual leadership on organizational
learning capacity. African Journal of Business Management, 3(5), 184-190.
Bolt, J. F. (1983). JOB SECURITY-ITS TIME HAS COME. Harvard Business Review,
61(6), 115-123.
Chakrabarty, S., Oubre, D. T., & Brown, G. (2008). The impact of supervisory adaptive
selling and supervisory feedback on salesperson performance. Industrial
Marketing Management, 37(4), 447-454.
Cranny, C. J., Smith, P. C., & Stone, E. F. (1992). Job satisfaction: Howpeople feel
about their jobs and how it affects their performance. New York: Lexington.
Drucker, P. F. (1985). The effective executive. Franklin Webster Co.
Ellickson, M. C., & Logsdon, K. (2002). Determinants of job satisfaction of municipal
government employees. Public Personnel Management, 31(3), 343-358.
Fisher, C.D., Locke, E.A., & Henne, D.L. (1992). The new look in job satisfaction
theory and research. In C.J. Cranny, P.C. Smith, & E.F. Stone (Eds.). Job
Satisfaction: Advances in Research and Applications (pp. 165-194). New York:
The Free Press.
Griffin, M. A., Patterson, M. G., & West, M. A. (2001). Job satisfaction and teamwork:
the role of supervisor support. Journal of Organizational Behavior, 22(5), 537-
550.
Guest, D. E. (2004). The psychology of the employment relationship: an analysis based
on the psychological contract. Applied psychology, 53(4), 541-555.
Iverson, R. D. (1996). Employee acceptance of organizational change: the role of
organizational commitment. International Journal of Human Resource
Management, 7(1), 122-149.
Jain, K. K., Jabin, F., Mishra, V., & Gupta, N. (2007). Job satisfaction as related to
organizational climate and occupational stress: A case study of Indian Oil.
International Review of Business Research Papers,3(5), 193-208.
Judge, T. A., Locke, E. A., Durham, C. C., & Kluger, A. N. (1998). Dispositional effects
on job and life satisfaction: the role of core evaluations. Journal of applied
psychology, 83(1), 17.
Kabir, M. N., & Parvin, M. M. (2011). Factors affecting employee job satisfaction of
pharmaceutical sector.Australian Journal of Business and Management
Research, 1(9), 113-123.
Khan, A. H., Nawaz, M. M., Aleem, M. & Hamed, W. (2012). Impact of job satisfaction
on employee performance: An empirical study of autonomous Medical
Institutions of Pakistan. African Journal of Business Management, 6 (7), 2697-
2705.
Copyright © 2013. NJMT
22
NUML Journal of Management & Technology
Vol: 7, No: 2. July, 2012 ISSN 1997-4507
Khan, V., Mariyum, A., Pasha, N.& Hasnain, A. (2011). Impact of organization culture
on the job satisfaction of the employees (banking sector of Pakistan). European
Journal of Economics, Finance and Administrative Sciences,(35), 8-14.
Mooney, M. (1984). Let‘s use job security as a productivity builder. Personnel
Administrator, 29(1), 38-44.
Morris, T., Lydka, H., & O'Creevy, M. F. (1993). Can commitment be managed? A
longitudinal analysis of employee commitment and human resource policies.
Human Resource Management Journal, 3(3), 21 42.
Mulinge, M., & Mueller, C. W. (1998). Employee job satisfaction in developing
countries: the case of Kenya. World Development, 26(12), 2181-2199.
Mulky, A. G. (2011). An exploration of salesperson job satisfaction in India using P-E
fitConstructs, WORKING PAPER NO: 343 IIM B
Nguyen, A., Taylor, J., & Bradley, S. (2003). Relative pay and job satisfaction: some
new evidence. Munich Personal RePEc Archive. Online at http://mpra.ub.uni-
muenchen.de/1382/
Okpara, J. O. (2004). The Impact of Salary Differential on Managerial Job Satisfaction:
A Study of the Gender-Gap and its Implications for Management Education and
Practice in a Developing Economy. Journal of Business in Developing Nations,
8, 65-91.
Politis, J. D. (2001). The relationship of various leadership styles to knowledge
management. Leadership & Organization Development Journal, 22(8), 354-364.
Rosow, J. M., & Zager, R. (1985). The case for employment security. Across the Board,
22(1), 34-41.
Sokoya, S. K. (2000). Personal predictors of job satisfaction for the public sector
manager: Implications for management practice and development in a
developing economy. Journal of business in developing nations, 4(1).
Spector, P. (1997). Industrial and Organizational Psychology. Research and Practice,
5th ed., John Wiley & Sons, New York, NY.

Copyright © 2013. NJMT
23
NUML Journal of Management & Technology
Vol: 7, No: 2. July, 2012 ISSN 1997-4507
Working Capital Management and Firm Performance of Construction
and Material Sector in Pakistan
Faiza Asghar
MS Scholar, Faculty of Management Sciences
International Islamic University, Islamabad, Pakistan
Dr. Hafiz Muhammad Ishaq
Assistant professor, Department of Business Administration
Federal Urdu University of Arts, Science and Technology, Islamabad, Pakistan
Humaira Naz
MS Scholar, Faculty of Management Sciences
International Islamic University, Islamabad, Pakistan
Abstract
The purpose of this study is to investigate the relationship of profitability on
working capital management. Working capital management efficiency measured with
cash conversion cycle and its components. The present study evaluates the efficiency of
the working capital management of construction and material sector of Pakistan for the
period 2008-2012. Panel data analysis has been used and data has been taken from
financial statements of construction and material companies. Hypothesis were tested
using multiple regression analysis and was found that profitability has negative
significant relationship with profitability, positive significant relationship with day’s
average inventory but insignificant relationship with day’s average payable and cash
conversion cycle. Working capital management impacts directly on firm’s profitability
and managers can achieve their major objective of maximizing shareholders wealth by
reducing cash conversion cycle, inventory and receivable period and by delaying the
payments payable to different parties.
Keywords: working capital management, performance, cash conversion cycle
1. Introduction
Working capital is the money which is always available for the business to
maintain its operations. It is the capital available to purchase inventory, pay employees
and finance other short term capital expenditures. This makes managing working capital
an important business skill. Working capital describes as capital invested in current
assets and converted into cash within short time period and is again invested this cash.
So, it is constantly receiving or circulating and also recognized as floating capital or
circulating capital.

Copyright © 2013. NJMT
24
NUML Journal of Management & Technology
Vol: 7, No: 2. July, 2012 ISSN 1997-4507
Working capital management is important element in determining firm
performance. For running firm‘s operations sufficient working capital amount is very
essential and efficiency in this area helps to operate fixed assets profitably. It promise
the firm‘s long term success and to obtain the goal maximization of the shareholders
funds. Improper management of cash on due dates may result in loss of cash discount
and loss of reputation due to non-payment of debt. Ogundipe and Idowu (2012)
investigated that an inappropriate working capital management of accounts receivables,
inventories and accounts payables will bring difficulties to continue a firm‘s operation
that affects market value of the firm. Mohamad and saad (2010) examined that the
managing working capital leads to development in market value of firms and
effectiveness, this feature leads to operational and strategic thinking of company in order
to work efficiently and effectively. Supplier‘s credit policy and credit time period to
customers both have an impact on profitability of the company.
There are different approaches of working capital management. These are
aggressive approach, conservative approach and matching approach. . In aggressive
approach current assets need are financed through short term funds and current liabilities
are kept in a greater portion as compared to long term debts. There is low cost, high risk
and high profit. In conservative approach current assets should be used to finance
through long term funds and greater portion of long term debts is used instead of current
liabilities. There is high cost, low risk and low profit. Matching approach describe that
permanent working capital should be invested through long term finances and temporary
working capital need should be invested through short term finance. The use of short
term sources should be restricted to only emergency situation or when there is
unexpected outflow of funds. There is low cost, high risk and high profit.
The approach of working capital financing is implemented by a company is very
important and it has an impact on its profitability and liquidity. If the firms will follow
aggressive working capital policy then they have negative returns. Aggressive financing
policy gives company profitability because short-term funds are less expensive to
purchase so funding costs can be lower but aggressive financing policy not often yields
high profitability and also creates the greatest risk of illiquidity. Nazir and Afza (2005)

Copyright © 2013. NJMT
25
NUML Journal of Management & Technology
Vol: 7, No: 2. July, 2012 ISSN 1997-4507
study shows the negative relationship between the working capital investment
aggressiveness and financing policies and measures of profitability of firms.
Current assets increase have a negative impact on the profitability of firms while
low level of current assets may bring difficulties in maintaining firm‘s operations and
lower level of liquidity. According to Barine, (2012) working capital decisions describe
financial decision making of risk and return. Higher working capital reduces illiquidity
risk and increases profitability of firms. For creation of firm value an optimal working
capital management is consider to contribute positively. Optimal level of working
capital can be describe as the one in which an equilibrium is maintained between
efficiency and risk and involve attaining the optimum level of different components of
working capital for example account receivables, inventory and payables.
Working capital management depends on two decision issues for the firm and they are:
The optimal level of investment in current assets.
The appropriate mix of long term and short term financing and use this
investment in current assets.
These decisions are control by the tradeoff between profitability and risk. Firm
manager should manage the tradeoff between liquidity and profitability maximization
accurately to obtain optimal working capital management (Jail, 2010). If net working
capital of company is smaller than its liquidity risk is higher. If conversion of current
assets in to cash brings any disruption it may result failure in the payment of current
outstanding liabilities (Fletcher, 2007).
By reducing the cash conversion cycle, inventory period and days account
receivables, managers can increase the firm‘s profitability but they cannot raise
profitability by rising the day‘s payable period (Deloof, 2003; and Napompech, 2012).
Managers can increase share holders value and ROA if they reduce their inventory size,
cash conversion cycle and payable period and increasing in supplier time period and
liquidity will bring overall firms‘ performances (Azam and Haider, 2011). Managing
working capital correctly is important for companies that use intensively fixed capital
same as those that use intensively working capital. (Ching et al., 2011).

Copyright © 2013. NJMT
26
NUML Journal of Management & Technology
Vol: 7, No: 2. July, 2012 ISSN 1997-4507
In this paper the problem will be analyze ―does the change in working capital
effects firms‘ performance in Pakistan‖? And identify the important variable that effect
on working capital management.
To examine the problem the researcher develops the following objectives:
Determine the relationship between working capital management and
profitability of the firm.
Determine the impact of accounts receivables days, inventories days, accounts
payable days and cash conversion cycle on firm performance and
To determine working capital needs of firms.
Working capital management determines the optimum investment level in
current assets such as cash, inventories, receivables, and other investment in short term.
Major focus in working capital management will be given to the firm's investment
optimization. This research is mainly based on the impact of the working capital
management on the firm‘s performance in Pakistan. In this paper for comprehensive
measure of working capital management cash conversion cycle is used. The
performance measures with Return on assets (ROA) and defined as profit before interest
and tax divided by total assets (Padachi, 2006; Lingesiya and Nalini, 2011, Sen and
Oruc, 2010; Azam and Haider, 2011), Current ratio, size, sales growth, debt ratio used as
control variables.
Specific research studies especially on the working capital management impact
and firm performance in Pakistan are rare. Our study will throw light on the working
capital management by measuring firm performance in Pakistan will contribute to the
literature. This study will allow many large companies in changing environment of
Pakistan to determine their own working capital management and help to set tradeoff
between liquidity and performance to adopt optimum working capital policy in order to
increase profitability. The findings of this study will provide an insight on the company
working capital management policy for concerned managers. They would know that in
order to increase the performance level at how much level they can increase their
liquidity and the optimal level of inventory level and receivables.
The remainder of this paper will organize as follows: In second section a review
of literature on the topic of the working capital management and firm‘s performance and
Copyright © 2013. NJMT
27
NUML Journal of Management & Technology
Vol: 7, No: 2. July, 2012 ISSN 1997-4507
past empirical studies will be discuss. The third section will describe data collection,
methodology and analysis procedures. The fourth section will gives details regarding the
results of the research. Finally the fifth section includes findings and conclusion.
2. Literature Review
Working capital management is an essential part of corporate finance. Working
capital management includes working capital components, receivables, inventory,
payables and for day to day operations using the cash efficiently. Firms may maximize
their value by an optimal level of working capital.
Debtors‘ collection period, cash conversion cycle, capital structure and size have
significantly negative relationship with the cash position while creditor‘s payment
period and profitability have positive relationship with the cash position. So, not only
does firms improves their profitability by reducing the cash conversion cycle but it has
also the tendency to improve the cash position of firms. (Yeboah and Agyei, 2012)
Managers by reducing the number of day‘s accounts receivable and inventories
can increase corporate profitability and less profitable firms to pay their bills wait longer
(Deloof, 2003; García-Teruel and Martínez-Solano, 2007). Lower gross operating profit
is related to an increase in the accounts payables number days. Low profitable firms take
benefit of credit period given by suppliers and wait longer to pay bills. Managers for
their companies generate profits by handling the cash conversion cycle properly and by
keeping each component to an optimum level for example account receivables,
inventories and accounts payables (Lazaridis and Tryfonidis, 2006). Working capital
management and profitability of firm has strong relationship. High investment in
receivables and inventories will lead to lower profitability and current asset to total asset
will lead to higher profitability. Increase in the cash conversion cycle will reduce the
profitability of firms (Lingesiya and Nalini, 2011).
Working capital management associates with inflation, growth opportunity, size
and economic growth. Their results show that to maintain optimal working capital
management the managers should consider and firm specific (internal) macroeconomic
(external) factor to (Taufiq et al., 2010). Firms can increase profitability by reducing

Copyright © 2013. NJMT
28
NUML Journal of Management & Technology
Vol: 7, No: 2. July, 2012 ISSN 1997-4507
accounts cash conversion cycle and receivable period. Leverage has a negative
significant relationship with firm value and as a control variable with profitability. This
indicates that due to increase in the level of leverage value and profitability of the firm
will decline (VURAL et al., 2012).
Alipour (2011) selected Tehran stock exchange and found that cash conversion
cycle is the important measuring tool to calculate the working capital management
efficiency. Working capital management and profitability of companies has significant
effect on the profitability of the companies. By decreasing inventory and accounts
receivables managers can generate value for the shareholders. Gill et al., (2010)
measured profitability through gross operating profit and found significant relationship
statistically between the profitability and cash conversion cycle and It shows that by
keeping accounts receivables at an optimal level and handling properly the cash
conversion cycle managers can create profits for their companies. The relationship
between firm‘s profitability and accounts receivables is negative this indicates that to
reduce the cash gap in the cash conversion cycle, low profitable firms will decrease their
accounts receivables.
Bagchi and bhaskar (2012) found that working capital management variables and
profitability of firms has negative relationship and as profitability of firm decreases Cash
conversion cycle increases, for the shareholders managers can create a positive effect by
decreasing the Cash conversion cycle to a lowest level. Debt and profitability has also
negative relationship. Mathuva (2010) also investigated that firms by operating
effectivly and efficiently their resources are able to achieve and keep competetive
advantage of the organization through reducing the cash conversion cycle to a minimum
level. Sen and Oruc (2010) determined the efficiency level of firms traded in ISE
(Istanbul Stock Exchange) and the relationship between return on total assets and
working capital management. They found the relationship between cash conversion
cycle, current ratio, net working capital level, days accounts receivable, days inventory
has significant negative with return on total assets.
Garcı´a-Teruel et al., (2007) investigate that working capital management has
important role in medium and small sized firms. Medium and small sized profitability of
firms and the day‘s account receivable and days of inventory has negative significant
Copyright © 2013. NJMT
29
NUML Journal of Management & Technology
Vol: 7, No: 2. July, 2012 ISSN 1997-4507
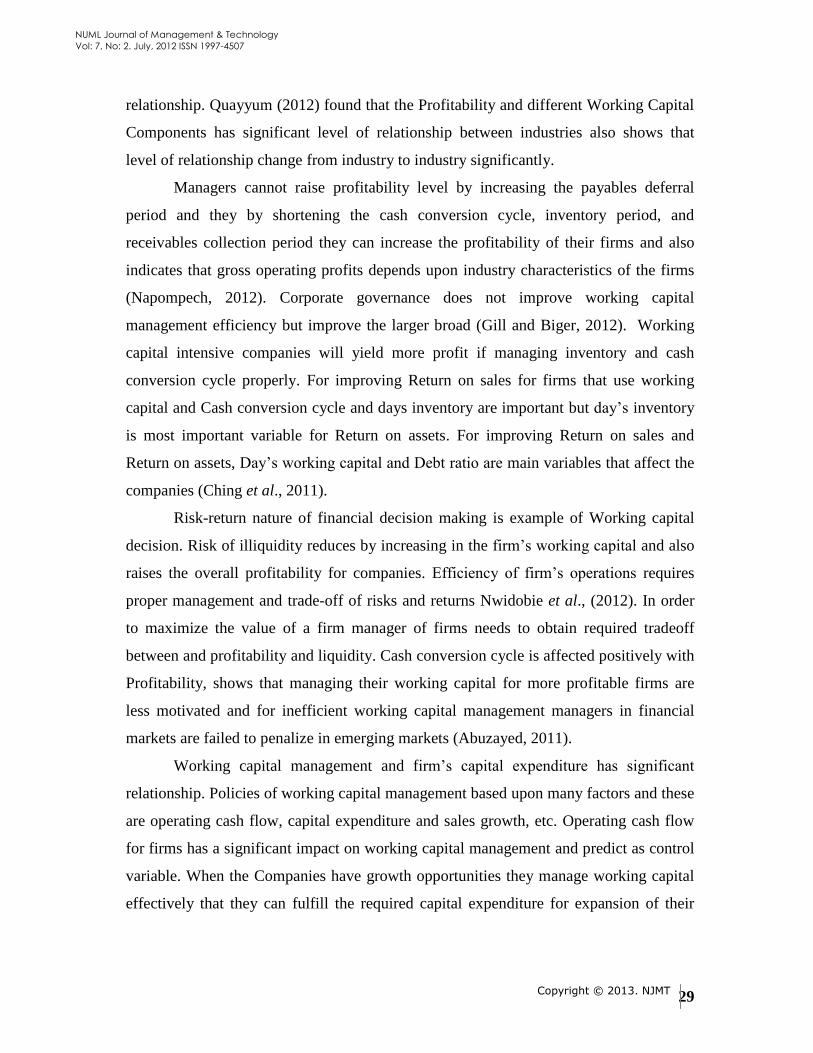
relationship. Quayyum (2012) found that the Profitability and different Working Capital
Components has significant level of relationship between industries also shows that
level of relationship change from industry to industry significantly.
Managers cannot raise profitability level by increasing the payables deferral
period and they by shortening the cash conversion cycle, inventory period, and
receivables collection period they can increase the profitability of their firms and also
indicates that gross operating profits depends upon industry characteristics of the firms
(Napompech, 2012). Corporate governance does not improve working capital
management efficiency but improve the larger broad (Gill and Biger, 2012). Working
capital intensive companies will yield more profit if managing inventory and cash
conversion cycle properly. For improving Return on sales for firms that use working
capital and Cash conversion cycle and days inventory are important but day‘s inventory
is most important variable for Return on assets. For improving Return on sales and
Return on assets, Day‘s working capital and Debt ratio are main variables that affect the
companies (Ching et al., 2011).
Risk-return nature of financial decision making is example of Working capital
decision. Risk of illiquidity reduces by increasing in the firm‘s working capital and also
raises the overall profitability for companies. Efficiency of firm‘s operations requires
proper management and trade-off of risks and returns Nwidobie et al., (2012). In order
to maximize the value of a firm manager of firms needs to obtain required tradeoff
between and profitability and liquidity. Cash conversion cycle is affected positively with
Profitability, shows that managing their working capital for more profitable firms are
less motivated and for inefficient working capital management managers in financial
markets are failed to penalize in emerging markets (Abuzayed, 2011).
Working capital management and firm‘s capital expenditure has significant
relationship. Policies of working capital management based upon many factors and these
are operating cash flow, capital expenditure and sales growth, etc. Operating cash flow
for firms has a significant impact on working capital management and predict as control
variable. When the Companies have growth opportunities they manage working capital
effectively that they can fulfill the required capital expenditure for expansion of their

Copyright © 2013. NJMT
30
NUML Journal of Management & Technology
Vol: 7, No: 2. July, 2012 ISSN 1997-4507
business (Appuhami, 2008). Managing working capital properly is very essential
regardless of the type of company whether fixed capital intensive or working capital.
3. Research Methodology
The secondary data required to perform the research was collected from the
official sites of the listed firms on Karachi Stock Exchange. Additionally, some of the
required data was gathered from the State Bank, rest of the data is collected from annual
reports and SBP analysis reports. Yearly data included on sales, cost of goods sold, total
assets, average receivable, Days average Inventory, Days average payable, cash
conversion cycle, and leverage ratio. There are 35 listed constructions and material firms
at Karachi Stock Exchange and those firms are not included whose observations were
missing for few years or data was not available. The data used for research purpose
consisted of 5 years annual data of the variables. Data of all the variables belonged to
period starting from fiscal year 2008 to fiscal year 2012. There are total 125
observations.
3.1 Dependent Variable
Return on Assets (ROA) used as dependent variable and can defined as profit
before interest and tax divided by total assets. (Padachi, 2006; Lingesiya and Nalini,
2011; Sen and Oruc, 2010; and Azam and Haider, 2011) have used this variable in their
study.
3.2 Independent Variables
Cash conversion cycle used for measuring working capital management. It
shows that the companies first have credit transactions, companies buy and sell goods in
credit and then they recover receivable account which is called cash conversion cycle.
Cash conversion cycle=Days average receivables + Days average Inventory- Days
Average payment
Days average receivables =360/ (Sales/ Account Receivables)
Receivable collection period is important for operational and financial
performance of firms and determines the difficulties in collecting sales made on credit.
The average collection period is the average number of days a company needs to
accumulate its accounts receivables, i.e. the number of days on average required to
transfer into cash.

Copyright © 2013. NJMT
31
NUML Journal of Management & Technology
Vol: 7, No: 2. July, 2012 ISSN 1997-4507
Days average Inventory=360/ (COGS/ Inventory)
Days average inventory measure is the procedure of converting raw materials into cash
and is the component of cash conversion cycle.
Days Average payment period= 360/ (COGS/ Accounts payable)
Accounts payable are actually liabilities to avoid default risk and within a given period
of time must be paid off.
3.3 Control Variables
Control variables are used and includes following variables: Current ratio, size,
sales growth and leverage. Current ratio defined as current assets divided by current
liabilities. Current ratio gives a sense of efficiency of a company's operating cycle or its
ability to converts its goods into cash and shows company ability to pay its short term
debt by using current assets, (Padachi, 2006; Lingesiya and Nalini , 2011; Rehman and
Nasr, 2007; and Azam and Haider, 2011).
The logarithm of sales or the LOS is used to know how the firms have grown in
the recent years. The companies are more profitable which have more sales so the
company size is used as proxy for size. (Deloof , 2003; Padachi , 2006 ; Alipour, 2011;
and Rehman and Nasr, 2007). Sales growth is used to measure investment growth
opportunity and is calculated by (This year‘s sales-previous year‘s sales)/previous year‘s
sales (Deloof , 2003; and Abuzayed, 2011).
Leverage ratio can be defined as financial risk of company and determine that
how much of the company's assets are financed by debt. Firms leverage is calculated by
dividing long term total debts by the total assets. If the firm has more debt the more
would be the interest factor which would in turn affect the profitability. (Deloof , 2003 ;
Padachi , 2006; Rehman and Nasr, 2007).
All above variables have relationships that affect working capital management.
3.4 Hypothesis
To find the relationship between working capital management and firm
performance following hypotheses are generated and to support these hypotheses
statistical data calculated.
Copyright © 2013. NJMT
32
NUML Journal of Management & Technology
Vol: 7, No: 2. July, 2012 ISSN 1997-4507
H 1: There is significant relationship between day‘s average receivable and profitability.
H 2: There is significant relationship between day‘s average inventory and profitability.
H 3: There is significant relationship between day‘s average payable and profitability.
H 4: There is significant relationship between cash conversion cycle and profitability.
3.5 Model Specification
To find the relationship between working capital management and firm
performance in Pakistan four regression models developed using empirical framework
first used by Deloof (2003) and later work of Padachi (2006).
ROAit = βo + β1 (DARit) +β2 (CRit) + β3 (LOSit) +β4(SGsit) +β5(LEVit) + €it
ROAit = βo + β1 (DAIit) +β2 (CRit) + β3 (LOSit) +β4(SGsit) +β5(LEVit) + €it
ROAit = βo + β1 (DAPit) +β2 (CRit) + β3 (LOSit) +β4(SGsit) +β5(LEVit) + €it
ROAit = βo + β1 (CCCit) +β2 (CRit) + β3 (LOSit) +β4(SGsit) +β5(LEVit) + €it
4. Data Analysis
To analyze the data various analysis techniques were used
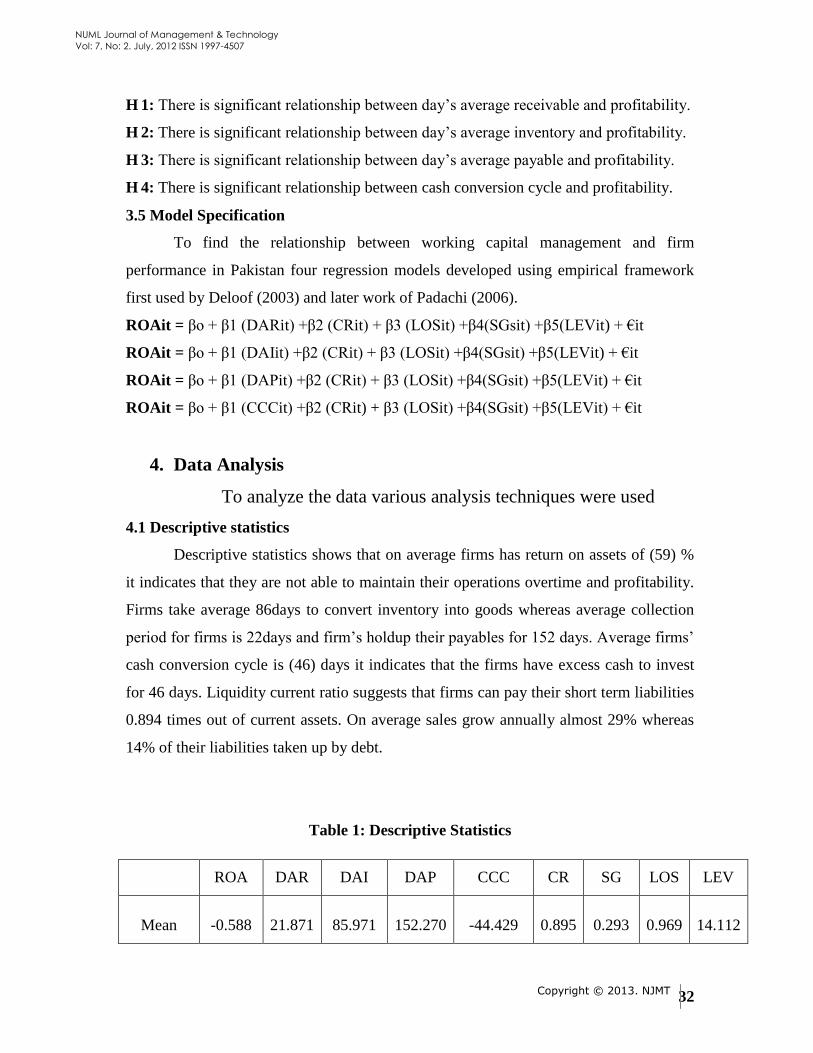
4.1 Descriptive statistics
Descriptive statistics shows that on average firms has return on assets of (59) %
it indicates that they are not able to maintain their operations overtime and profitability.
Firms take average 86days to convert inventory into goods whereas average collection
period for firms is 22days and firm‘s holdup their payables for 152 days. Average firms‘
cash conversion cycle is (46) days it indicates that the firms have excess cash to invest
for 46 days. Liquidity current ratio suggests that firms can pay their short term liabilities
0.894 times out of current assets. On average sales grow annually almost 29% whereas
14% of their liabilities taken up by debt.
Table 1: Descriptive Statistics
ROA DAR DAI DAP CCC CR SG LOS LEV
Mean -0.588 21.871 85.971 152.270 -44.429 0.895 0.293 0.969 14.112

Copyright © 2013. NJMT
33
NUML Journal of Management & Technology
Vol: 7, No: 2. July, 2012 ISSN 1997-4507
4.2 Correlation Analysis
Correlation analysis is used in the model to get the relationship between working
management and firm‘s performance. Correlation analysis results show that Return on
assets is negatively related with Days average relievable and days average payables. It
shows that if day‘s average receivables and day‘s average payable decreases than these
have a positive impact on the profitability. Day‘s average inventory and cash conversion
cycle positively correlated with return on assets. Current ratio is positive which indicates
the relationship between profitability and liquidity and companies with more liquidity
are more profitable. Leverage ratio is negatively correlated which shows that if debt
decrease profitability increases while sales growth and company size is positively
correlated with ROA.
Table 2: Correlation Analysis
4.3 Multiple Linear Regressions
To investigate the relationship between working capital management and firm
performance Regression analysis is used.
Median 0.867 3.203 13.632 31.242 30.550 0.081 0.094 0.125 0.264
Maximum -0.320 8.309 34.956 75.308 -21.323 0.729 0.119 0.668 14.881
Minimum -23.640 0.109 2.179 21.125 -2704.387 0.026 -1.000 0.020 0.000
Std. Dev. 9.694 35.810 152.406 349.301 341.560 0.901 1.054 1.403 2.957
ROA DAR DAI DAP CCC CR SG LEV LOS
ROA 1
DAR -0.240 1
DAI 0.002 0.108 1
DAP -0.101 0.001 0.291 1
CCC 0.080 0.153 0.160 -0.893 1
CR 0.264 0.028 -0.015 0.272 -0.282 1
SG 0.020 -0.048 -0.073 -0.115 0.080 -0.049 1
LEV -0.222 -0.001 0.312 0.023 0.116 -0.234 -0.099 1
LOS 0.241 -0.188 -0.490 -0.697 0.474 -0.049 0.079 -0.367 1

Copyright © 2013. NJMT
34
NUML Journal of Management & Technology
Vol: 7, No: 2. July, 2012 ISSN 1997-4507
Model 1
Table 3 represents the regression results of first model. According to first
regression model hypothesis 1 is accepted at 5% significant level and indicates that there
is significant relationship between day‘s average receivable period (DAR) and
profitability. Coefficient of DAR is negative at which calculated t-statistic is more than
critical value. So it shows that there is a negative significant relationship between
receivable period and profitability. Firms earlier in collecting their receivables earn high
profits as compared to firms recovering receivables late. Adjusted R square of 15%
shows that after adjusting for degrees of freedom model is capable to explain 15% of
profitability.
Table 3: Coefficient Model (A)
Variable Coefficient Std. Error t-Statistic Prob.
C -9.340 4.943 -1.890 0.061
DAR -0.058 0.023 -2.524 0.013
CR 2.748 0.929 2.958 0.004
SG -0.017 0.769 -0.022 0.982
LEV -0.676 0.644 -1.049 0.296
LOS 0.582 0.302 1.931 0.056
Summary Model (A) R-Squared Adjusted R-Square S.E of Regression F-Statistics
0.183 0.149 8.944 5.339
Model 2
Table 4 shows the second regression model which is run by using the day‘s
average inventory as an independent variable. The results show the positive significant
relationship between day‘s average inventory and profitability whereas t statistic is equal
to critical value.
Hypothesis 2 is accepted but relationship is positive it indicates that firms with
high day‘s average inventory maintain too much inventory and cash is tied up in goods
that cannot be sold this is not good for the company and to move out this inventory
quickly, management have to decrease prices, selling its product at a loss. The adjusted
R2 has a value of 13% and F-statistic has a value equal to 4.751 that reflects the
significance of the model or significance of R square.
Copyright © 2013. NJMT
35
NUML Journal of Management & Technology
Vol: 7, No: 2. July, 2012 ISSN 1997-4507
Table 4: Coefficient Model (B)
Variable Coefficient Std. Error t-Statistic Prob.
Constant -17.603 5.352 -3.289 0.001
DAI 0.012 0.006 1.960 0.050
CR 2.765 0.939 2.945 0.004
SG 0.103 0.777 0.133 0.895
LEV -0.747 0.657 -1.138 0.257
LOS 1.006 0.329 3.057 0.003
Summary Model (B)
R-
Squared
Adjusted R-
Square
S.E of
Regression
F-
Statistics
0.166 0.131 9.035 4.751
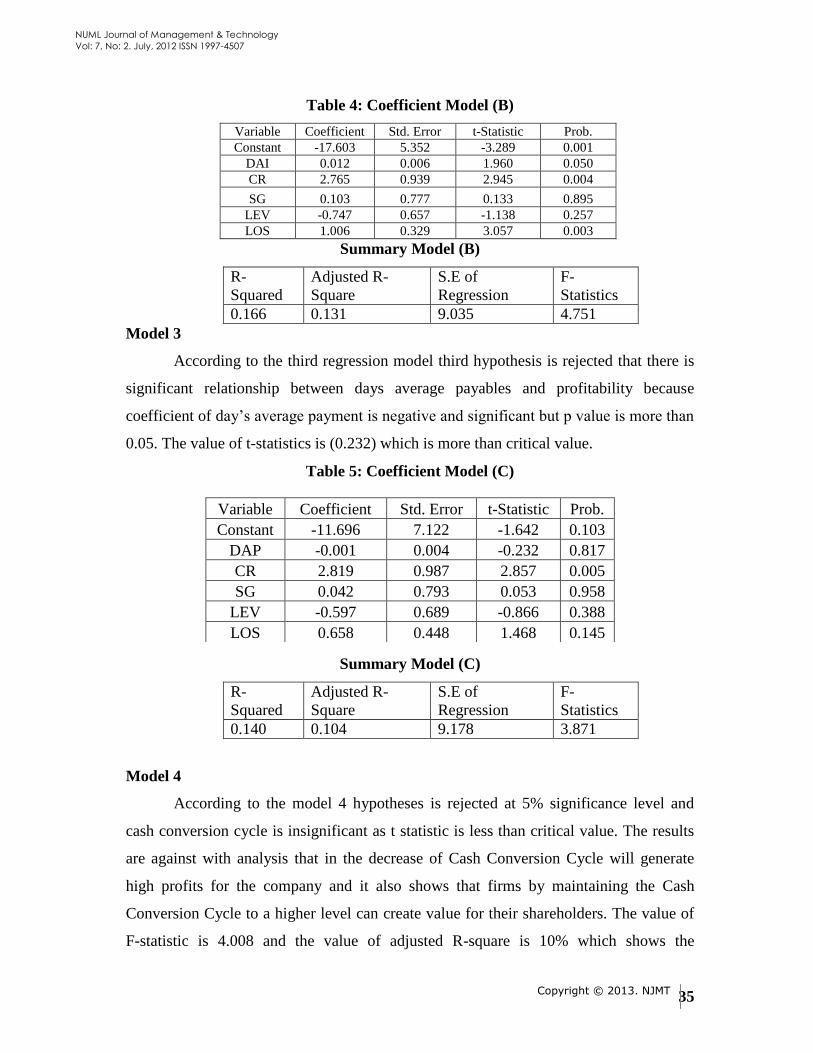
Model 3
According to the third regression model third hypothesis is rejected that there is
significant relationship between days average payables and profitability because
coefficient of day‘s average payment is negative and significant but p value is more than
0.05. The value of t-statistics is (0.232) which is more than critical value.
Table 5: Coefficient Model (C)
Summary Model (C)
R-
Squared
Adjusted R-
Square
S.E of
Regression
F-
Statistics
0.140 0.104 9.178 3.871
Model 4
According to the model 4 hypotheses is rejected at 5% significance level and
cash conversion cycle is insignificant as t statistic is less than critical value. The results
are against with analysis that in the decrease of Cash Conversion Cycle will generate
high profits for the company and it also shows that firms by maintaining the Cash
Conversion Cycle to a higher level can create value for their shareholders. The value of
F-statistic is 4.008 and the value of adjusted R-square is 10% which shows the
Variable Coefficient Std. Error t-Statistic Prob.
Constant -11.696 7.122 -1.642 0.103
DAP -0.001 0.004 -0.232 0.817
CR 2.819 0.987 2.857 0.005
SG 0.042 0.793 0.053 0.958
LEV -0.597 0.689 -0.866 0.388
LOS 0.658 0.448 1.468 0.145

Copyright © 2013. NJMT
36
NUML Journal of Management & Technology
Vol: 7, No: 2. July, 2012 ISSN 1997-4507
significance of the model. It means companies couldn‘t maintain their cash conversion
cycle profitable and couldn‘t use their large part of investments in working capital this is
the reason that cash conversion cycle is insignificant.
Table 6: Coefficient Model (D)
Variable Coefficient Std. Error t-Statistic Prob.
C -10.559 5.664 -1.864 0.065
CCC 0.002 0.003 0.801 0.424
CR 2.929 0.974 3.006 0.003
SG 0.019 0.789 0.024 0.981
LEV -0.717 0.690 -1.039 0.301
LOS 0.577 0.360 1.602 0.112
Summary Model (D)
R-
Squared
Adjusted R-
Square
S.E of
Regression
F-
Statistics
0.144 0.108 9.155 4.008
5. Conclusion and findings
The different analyses identified important management practices and it helps
managers to improve the financial performance of the companies and to recognize the
areas of their operation. The result gives information to managers about financial
management practices used in the firms. This study has shown that profitability has
negative significant relationship with profitability, positive significant relationship with
day‘s average inventory but insignificant relationship with day‘s average payable and
cash conversion cycle. (Deloof, 2003; Alipour, 2011; Rehman and Nasr, 2007) found
negative significant relationship with cash conversion cycle but I found insignificant
relationship between cash conversion cycle and profitability. This is due to the reason
that this sector has average negative returns this shows firms are more fixed capital
intensive and doesn‘t maintain their working capital requirements properly, firms needs
to manage their working capital efficiently.
Working capital needs of an organization change with time and firms should
maintain a good management of its assets and liabilities. This research concludes that
there is need for further empirical studies to be undertaken on construction and material
sector of working capital practices by increasing the size of sample so that the study can
help to disclose the hidden factors that explain the better performance of some business

Copyright © 2013. NJMT
37
NUML Journal of Management & Technology
Vol: 7, No: 2. July, 2012 ISSN 1997-4507
and how these practices could be increase to the other industries. This would also help
out policy makers and to identify the requirements and problems faced by construction
and material sector in Pakistan. This analysis has been controlled by the sample size and
the nature of the data, which could have affected the results.
In order to reduce the cash conversion cycle a firms either decrease days average
Inventory, days average receivable or increase days average Payable to increase the
amount of cash on hand to use this to pay current liabilities or able to use this cash for
expenses, dividend payments and growth. These results can be strengthened if the firms
manage their working capital in more efficient ways. By manage accurately accounts
receivables, cash, inventories and account payables the firms will increase and improve
performance. Due to changing world of economy, advancement of technology and
increased global competition, this sector must struggle to increase their profits to bring
their cash conversion cycle at optimum level to increase profitability.
Bibliography
Abuzayed, B. (2011). Working capital management and firms‘ performance in emerging
markets: the case of Jordan. International Journal of Managerial finance , 8 (2),
155-179.
Alipour, M. (2011). Working Capital Management and Corporate Profitability: Evidence
from Iran. World Applied Sciences Journal , 12 (7), 1093-1099.
Appuhami, B. R. (2008). The Impact of Firms‘ Capital Expenditure on Working Capital
Management: An Empirical Study across Industries in Thailand. International
Management Review , 4 (1).
Bagchi, B., & bhaskar, b. (2012). Relationship between Working Capital Management
and Profitability: A Study of Selected FMCG Companies in India. Business and
Economics Journal , 60 (1).
Ching, H. Y., Novazzi, A., & Gerab, F. (2011). Relationship between working capital
and profitabilty in Brazilian listed companies. Journal of Global Business and
Economics , 3 (1), 74-86.
Deloof, M. (2003). Does Working Capital Management affect profitability of balgian
firms. Journal of Business Finance & Accounting , 30 (3-4), 573-588.
Copyright © 2013. NJMT
38
NUML Journal of Management & Technology
Vol: 7, No: 2. July, 2012 ISSN 1997-4507
Garcı´a-Teruel, P. J., & Martı´nez-Solano, P. (2007). Effects of working capital
management on SME profitability. International Journal of Managerial finance ,
3 (2), 164-177.
Gill, A. S., & Biger, N. (2012). The impact of corporate governance on working capital
management efficiency of American manufacturing firms. Managerial Finance ,
116-132.
Gill, A., Biger, N., & Mathur, N. (2010). The Relationship Between Working Capital
Management And Profitability: Evidence From The United States. Business and
Economics Journal , 10 (1).
Lazaridis, I., & Tryfonidis, D. (2006). ―The relationship between working capital
management and profitability of listed companies in the Athens Stock
Exchange‖. Journal of Financial Management and Analysis , 19 (1), 26-35.
Lingesiya, & Nalini. (2011). Working capital Management and firm's performance: An
anallysis of Siri lankan Manufacturing companies. Faculty of Commerce and
Management Studies , 1-14.
Mathuva, D. M. (2010). The Influence of Working Capital Management on Corporate
Profitabilty. Research Journal of Business Management , 4 (1), 1-11.
Napompech, K. (2012). Effects of Working Capital Management on the Profitability of
Thai Listed Firms. International Journal of Trade, Economics and Finance , 3 (3),
227-232.
Nazir, M. S., & Afza, T. (2009). Impact of Aggressive Working Capital Management
Policy on Firms‘ Profitability. The IUP Journal of Applied Finance , 15 (8), 19-
30.
Nwidobie, M., & Barine. (2012). Working capital management efficiency and corporate
profitability: Evidences from quoted firms in Nigeria. Journal of Applied
Finance & Banking, , 2 (2), 215-237.
Quayyum, S. T. (2012). Relationship between Working Capital Management and
Profitability in Context of Manufacturing Industries in Bangladesh. International
Journal of Business and Management , 7 (1), 58-69.

Copyright © 2013. NJMT
39
NUML Journal of Management & Technology
Vol: 7, No: 2. July, 2012 ISSN 1997-4507
SEN, M., & ORUC, E. (2010). Relationship between Efficiency Level of Working
Capital Management and Return on Total Assets in Ise. International Journal of
Business and Management , 4 (10), 109-114.
Taufiq, H., Zariyawati, M. A., Annuar, M. N., & Sazali, A. (2010). Determinants of
Working Capital Management : Evidence from Malaysia. International
Conference on Financial Theory and Engineering , 190-194.
VURAL, G., SÖKMEN, A. G., & ÇETENAK, E. H. (2012). Affects of Working Capital
Management on Firm‘s Performance: Evidence from Turkey. International
Journal of Economics and Financial Issues , 2 (4), 488-495.
Wolfe, J. (2003). The Tobin q as a company performance indicator. Developments in
Business Simulation and Experiential Learning , 30, 155-159.
Yeboah, B., & Agyei, S. K. (2012). Working Capital Management and Cash Holdings of
Banks in Ghana. European Journal of Business and Management , 4 (13), 120-
130.

Copyright © 2013. NJMT
40
NUML Journal of Management & Technology
Vol: 7, No: 2. July, 2012 ISSN 1997-4507
To Investigate the Impact of Big Five Personality Traits on Customer
Advocacy Behavior 1Maimoona Sadiq; 2 Dr. Hafiz Muhammad Ishaq; 3 Faiz Ahmed
1 MS Scholar Faculty of Management Sciences, IIUI, Pakistan, 2 Assistant Professor,
Federal Urdu University of Arts, Science and Technology, Islamabad, Pakistan, 3
Lecturer Federal Urdu University of Arts, Science and Technology, Islamabad, Pakistan
Correspondence Author: [email protected] Cell#03219506525
Abstract
Purpose – The purpose of this study is to investigate the impact of Big-5 personality
traits on customer advocacy behavior.
Design/methodology/approach – A model was developed to assess the impact of the
personality traits including conscientiousness, extraversion, agreeableness, openness to
experience and neuroticism on customer advocacy behavior. The model was tested on
142 customers of a telecommunication company. Survey research method was used in
this research and questionnaire was the tool used for collecting data.
Findings – The findings suggest that customers who have stronger levels of openness to
experience are indeed more willing to contribute as advocates. The customers with
higher levels of conscientiousness, extraversion, agreeableness and neuroticism do not
have positive and negative effect on customer advocacy behavior.
Research limitations/implications – The model was tested for the customers of only
one telecommunication organization so the results cannot be generalized over the
customers of other telecommunication organizations. Furthermore, the data is collected
from only telecommunication industry‘s customers so the results/findings of this
research cannot be applied to other industrial sectors.
Practical implications – The study considers the customers potential that how they can
be further engaged to serve as advocates and thus improve the firm‘s marketing
performance.
Originality/value – Much of the previous work has been based on analyzing different
factors that affect the customer advocacy behavior, this study advances on analyzing the
role of customer‘s personality traits on customer‘s advocacy behavior.
Keywords – Conscientiousness, Extraversion, Agreeableness, Openness to experience,
Neuroticism, Customer advocacy behavior.
Copyright © 2013. NJMT
41
NUML Journal of Management & Technology
Vol: 7, No: 2. July, 2012 ISSN 1997-4507
Introduction
In various disciplines the concept of advocacy has been used widely, which
means ‗to recommend‘ or ‗to be in favor of‘, while in legislation this term of advocacy
is used as ‗the person who speaks on behalf of the other person‘ (OED 1998).While in
terms of marketing the term advocacy means a person truly representing the interests of
the customers (Urban, 2005).
Uma (2005) said that the researcher Urban (2005) said that to be the advocate of
customers is a new foundation laid on the firm‘s belief of providing absolute and
unprejudiced information related to the interests of the customer, keeping in mind the
products which suits the customers (keeping fair struggle with their competition), design
of the product, and creating affiliation which results into an allegiance in their
relationship. On the contrary, ‗advocate for your customer and they‘ll advocate for you‘.
Immense literature is available on the advocacy behavior of customers still there
is lack of understanding about the personality traits and their relationship with advocacy
behavior of customers. The aim of this paper is the manipulation of the personality traits
upon the customer advocacy behavior. In particular this paper targets the sundry
personality traits of the varied people which affect the customer advocacy behavior.
One of the indispensable questions that arise in the studies of personality is that
the individual differences are portrayed by which personality traits. Hierarchical models
have been employed by many researchers in the last few decades in order to mount the
answer for this question. One of the models among these is the Big Fire (Digman, 1990;
Goldberg, 1981; McCrea and Costa, 1999), which consists of openness to experience,
conscientiousness, extra version, agreeableness and neuroticism, which can educate and
foresee various individual differences over an array of settings, including intellectual
and substantial fitness, job contentment, and work performance (e.g Barrich and Mount,
1991; Judge, Heller, and Mount, 2002) as well as customer advocacy behavior.
Extensively accredited model of character portrayal is Big Five Model (John, Noumann,
Soto, 2008).
Personality traits not only fluctuate among persons but these differences also
demonstrate longitudinal divergence that is they revolutionize with the change in time
(Small, Hertzog, Hultsch, and Dixon, 2003).
Copyright © 2013. NJMT
42
NUML Journal of Management & Technology
Vol: 7, No: 2. July, 2012 ISSN 1997-4507
One of the crucial elements of personality associated with psychosomatic
progression is willingness (openness) intellect (Colin G. De Young, Racheal G.
Grazioplene a, Jordan B. Peterson, 2010).
Extraverted is referred to as socialization (Furr, 2009). Extraversion (associated
with optimistic concern and activation) and Neuroticism (is associated to pessimistic
sentimental concentration) are well thought-out to be instinctively determined (Mac
Donald, 1995; Pothbart and Derryberry, 1981; Yik and Russell, 2001).
Agreeableness and conscientiousness is associated with the effortful command, a
super-ordinate dogmatic structure (Jensen Campbell et. al, 2002). One of the significant
concepts in this scaffold is that each sphere represents units of character. For example
the Big Five dimensions (i.e neuroticism, extraversion, openness, agreeableness, and
conscientiousness).
One of the emerging view points in the realm of marketing is that customers
should be taken as valued property (Blattbug and Dieghton, 1996; Bolton et. al, 2004;
Peppers and Rogers, 2004).
Supplementary expansion in modern customer relationship management
literature by keeping the view that the firm can enhance customers worth‘s duration by
developing and increasing interaction with their customers.
This study tends to search out the business customers‘ eagerness to acquire a part
as advocates in marketing. The scheme of customer advocacy gained extreme gratitude
but still there is palpable interval of research scrutinizing the advocacy behavior of
customers. In an endeavor to swathe this gap, the researcher will study the advocacy
position of customers in competition with the personality traits of customers. Study
objective is to inspect the relationship between the personality traits of customer and
their eagerness to serve as advocates. This study commences with the establishment of
hypothesized model using Big Five personality traits to cram the relation with the
advocacy behavior of customers. The described model was tested on the customers of
telecommunication company i.e. Ufone in the H-8 sector of Islamabad because many
universities are situated in this sector as well as the HEC head office is also located in
this sector. Survey research method was used as a tool for data collection. After this,

Copyright © 2013. NJMT
43
NUML Journal of Management & Technology
Vol: 7, No: 2. July, 2012 ISSN 1997-4507
findings are discussed. Furthermore the paper is concluded by offering managerial
implications and major limitations of this research are discussed.
Literature Review
The meaning of the word ‗advocacy‘ is not the technique of a company which it
uses for speaking to its customers rather it‘s a harmony among the company and the
customers of the company that if the company is concerned about the pleasure of its
customers than it will be reflected back in the form of customers conviction, more
procurement and increment in the fidelity of the customers. It‘s a kind of conformity
among the company and its customers for the reciprocated remuneration. Company
realizes the demands and necessities of its customers and in return the customers start to
speak for buying the products of the company and in assembling the design of the
product in an approved manner. One of the vital benefit is that customer starts telling
others about the company and its products. Advocacy is a new technique for augmenting
the relationship between customers and the company (Urban, 2005).
The initiative of the customer advocacy has gained a lot of acknowledgment but
still remarkable research is required. For this purpose the personality traits of customers
has been studied in connection with the advocacy behavior of the customers in this
research.
In this study, it is intended to investigate the relationship between the personality
traits of the customers and their inclination towards serving as promoters. This research
is proposed to consider the advocacy of customer as an individual‘s proclivity to curve
up his/her know-how about some of the products or service (Chelminski, & Coutler,
2011).
Studies of the past suggest that the communal conduct is often influenced by
helping others or with the will to have an increment on wellbeing of the communal
society (Batson, 1991; Simon, 1993). The interties of the individuals towards the welfare
of a society provide the foundation for an individual‘s scruples which shows the
compassionate sentiment with the needs of others (Aronfreed, 1968, 1970). In the
actions regarding market, research shows that many people hold them accountable to
assist others (Chelminski, & Coulter, 2011).

Copyright © 2013. NJMT
44
NUML Journal of Management & Technology
Vol: 7, No: 2. July, 2012 ISSN 1997-4507
This research is aimed at exploring the aptitude of individuals to share any
information and knowledge about product/service (Chelminski and Coulter, 2011) in
association with the personality traits. The idea that insists on helping others and moving
forward to the social wellbeing is the fundamental motion of social behavior, which can
also be observed from previous literature (Batson, 1991; Simon, 1993). This enthusiasm
is entrenched in one‘s conscience showing one‘s approach towards ethical tasks
(Aronfreed, 1968, 1970). Some of the customers hold them responsible for assisting
others (Chelminski, & Coulter, 2011). For example the centre of attention for many of
the researchers before is on the leaders with rational liberality, who are always willing to
share their familiarity with others (Childers, 1986).
The proposal of customer advocacy is intimately linked with different qualities
of individuals, same as the concept of opinion leadership, competent assisting behavior,
and market mavnism (Chelminski, & Coulter, 2011) and there is the idea to produce
optimistic marketing place know-how by providing functional knowledge to customers
(Chelminski, & Coulter, 2011).
Here customer advocacy deals differently as it impairs the customer to
counteract any pessimism in market place, such as providing lower than normal
products, and services that has obnoxious status because of the lower intensity of
performance (Chelminski, & Coulter, 2011).
A question which usually comes across the personality research is that how many
elementary and changeable features of personality are needed for the description of the
character of an individual (Linden, Nijenhuis and Bakker, 2010). In order to embark
upon this question, the researchers used different top down models (Linden, Nijenhuis
and Bakker, 2010). One such structures or sculpt is Big Five (Digman, 1990; Goldberg,
1981; McCrae and Costa, 1999), which encompasses Openness to experience,
Conscientiousness, Extraversion, Agreeableness and Neuroticism.
These dimensions and features of personality can elucidate variety of personality
traits over different grades and settings, psychological and substantial stability, job
contentment, performance and customer advocacy (Barrick and Mount, 1991; Judge,
Heller and Mount, 2002).

Copyright © 2013. NJMT
45
NUML Journal of Management & Technology
Vol: 7, No: 2. July, 2012 ISSN 1997-4507
Big Five model of personality traits comprising of Neuroticism, Extraversion,
Openness, Agreeableness and Conscientiousness has came forward as highly adequate
and pragmatic model summarizing major character diversities (John, Noumann, & Soto,
2008).
It is alleged that very few studies have examined the impact of personality traits
on the advocacy behavior of customers. In this study the main focus will be the
examination of different dimensions of personality and the impact of each of them on
the advocacy behavior of customers.
Agreeableness and Conscientiousness are linked to the exerted control
(Campbell et. al, 2002). Agreeableness refers to an individual‘s sympathy towards other
individual‘s sentiments and requirements (Serbet, Miller, Pryor, Reidy, and Zeichner,
2010). So keeping customer advocacy as dependent variable and that of the personality
trait as independent variable, in this study the first proposed hypothesis is as follows:
H 1: Agreeableness has a positive effect on customer advocacy behavior.
Extraversion (related to optimistic affect and activation) and Neuroticism
(associated to pessimistic affective strength) are considered to be instinctively resoluted
(Mac Donald, 1995; Rothbart, and Derryberry, 1981; Yik, and Russell, 2001).
Since the literature suggests that ‗extraversion‘ is related to positive effect and
activation, thus on the basis of this second hypothesis has been established that
extraversion people show more readiness to serve as advocates to customers.
H 2: Extraverted people are more ready to serve as customer advocates.
Up to some degrees, conscientiousness approximates kinds of optimistic and
pessimistic sentiments (McCrea and Costa, 1991, Watson, 2000). It is a measure of an
individual‘s capability for being thankful for, allowing for penalty before taking some
activity, unswerving on times of dullness and aggravation also including unsocial and
violent behavior (Miller and Lynam, 2001). By reviewing literature it is identified that
people with higher levels of conscientiousness operate more positively rather than
negatively. So the third hypothesis is:
Copyright © 2013. NJMT
46
NUML Journal of Management & Technology
Vol: 7, No: 2. July, 2012 ISSN 1997-4507
H 3: Conscientiousness has appositive effect on customer advocacy behavior.
Customer advocacy is well thought out to be extra role behavior. Customer
advocacy is broadening the way for customers out of the perspective of marketing (Leo,
Berett, and Dreman). ‗Extra-role behavior is defined as distinctive behavior of frontline
employees which is beyond their formal role‘(Beltencourt, & Brown, 1997). For further
the investigating the concept of customer advocacy, extra role behavior is mandatory.
Assisting out of the way is an element of this universal construct (King, George,
& Hebl, 2005). While investigating the personality traits, researchers noted that at least
four out of the five personality traits are in connection with sentimental filter of
individuals, identified in terms of balance between positive and negative sentimental
status (Diener, Suh, Lucas, & Smith, 1999).
Extraversion and neuroticism are the results of optimistic and pessimistic
experiences (Clark, & Watson, 1999). Studies suggest that Neuroticism tends more
towards the pessimistic rather than optimistic behavior. So it is argued that individuals
with higher levels of neuroticism influence the advocacy behavior of customers
negatively. So the fourth hypothesis comes out to be.
H4: Neuroticism has a negative effect on the customer advocacy behavior.
Openness and conscientiousness also to some degrees approximates types of
positive and negative sentimental (Mc Crea, & Costa, 2000). Basic dimension that is
closely associated with the mental process is readiness/ openness/ intellect (De Young,
Graziplene, & Peterson, 2010). Readiness to discover is instinctive but has minor
application on balance between pessimistic and optimistic sentimental (Mc Crea, &
Costa, 1991). It is observed that the individuals with higher levels of openness have a
positive manipulation on advocacy behavior of customers. The fifth hypothesis thus
comes out to be.
H5: Openness to experience has a positive effect on customer advocacy behavior.
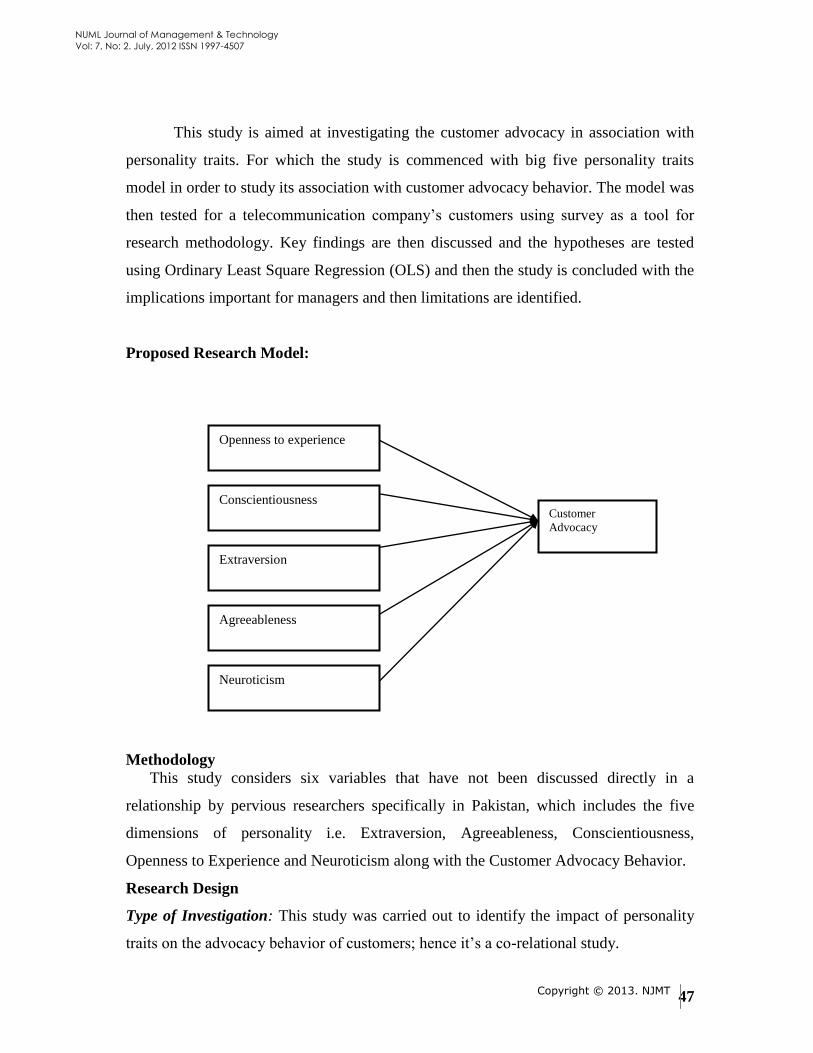
Copyright © 2013. NJMT
47
NUML Journal of Management & Technology
Vol: 7, No: 2. July, 2012 ISSN 1997-4507
This study is aimed at investigating the customer advocacy in association with
personality traits. For which the study is commenced with big five personality traits
model in order to study its association with customer advocacy behavior. The model was
then tested for a telecommunication company‘s customers using survey as a tool for
research methodology. Key findings are then discussed and the hypotheses are tested
using Ordinary Least Square Regression (OLS) and then the study is concluded with the
implications important for managers and then limitations are identified.
Proposed Research Model:
Methodology
This study considers six variables that have not been discussed directly in a
relationship by pervious researchers specifically in Pakistan, which includes the five
dimensions of personality i.e. Extraversion, Agreeableness, Conscientiousness,
Openness to Experience and Neuroticism along with the Customer Advocacy Behavior.
Research Design
Type of Investigation: This study was carried out to identify the impact of personality
traits on the advocacy behavior of customers; hence it‘s a co-relational study.
Customer
Advocacy
Conscientiousness
Openness to experience
Extraversion
Agreeableness
Neuroticism
Copyright © 2013. NJMT
48
NUML Journal of Management & Technology
Vol: 7, No: 2. July, 2012 ISSN 1997-4507
Study Setting: As it‘s a co-relational study so it was conducted in a non-contrived
setting invariably and done in organizations called as field study.
Unit of Analysis: Individual customers were mostly focused for the collection of data
regarding this study; hence the units of analysis are customers. Data was gathered from
each customer and each customer‘s response was treated as individual data source.
Time Horizon: Data was gathered just once, over a period of days in order to answer the
research questions. Such study is called as cross-sectional studies.
Population and sample
The population of this study is comprised of 304 customers of Pakistan from
telecommunication sector. Unit of analysis of this study were customers from all levels
of telecommunication industry.
Sampling
Asper Krejcie and Morgan (1970) Formula for Sample Determination was used for
determining the sample. Five hypotheses were developed and were tested with a sample
of 142 customers from one Telecommunication Company of Pakistan. Customers from
all the levels of the telecommunication sector were included in the study.
Sampling procedure
Non probability convenient sampling techniques were used and data was collected by
conducting a cross sectional survey.
Sampling techniques
Sampling technique used for this research was convenience sampling in which
questionnaire was used as a research instrument. 128 questionnaires were completely
filled and returned and 14were lost during the process or wrongly filled out of 142
questionnaires. In the sample of 128 customers 56 were males and 72 were females.
Response rate was 90.14% as 142questionnaires were distributed and 128 were received
during the study. Total 51 items were added in the questionnaire first question was
related to demographic variable including gender. Next questions 1-7 were related to
customer advocacy behavior, questions 1, 6, 11, 16, 21, 26, 31, and 36 were related to
extraversion, questions 2, 7, 12, 17, 22, 27, 32, 37, and 42 were about agreeableness,
questions 3, 8, 13, 13, 23, 28, 33, 38, and 43 were related to conscientiousness, questions

Copyright © 2013. NJMT
49
NUML Journal of Management & Technology
Vol: 7, No: 2. July, 2012 ISSN 1997-4507
4, 9, 14, 19, 24, 29, 34, and 39 were related to neuroticism, and questions 5, 10, 15, 20,
25, 30 35, 40, 41, and 44 inquired about the customer‘s tendency to openness.
Characteristics of sample
Demographic variables have effect on customer advocacy behavior, extraversion,
agreeableness, conscientiousness, neuroticism, and openness to experience. For this
reason as control variable in testing the hypothesis, gender was used.
Measures / Scales
For the measurement of data Likert‘s five point scale was used ranging from 1 as
strongly disagree, 2 as disagree, 3 as neutral, 4 as agree till 5 as strongly agree.
Customer Advocacy Behavior: 7-item scale has been taken from Liu, D., Harris, J., and
Payne, A. ―I take the initiative to act as a 'promoter' of this service provider?‖ The
response rate ranged from 1 (strongly disagree) to 5 (strongly agree).
Extraversion: 8-item scale has been adapted from John and Srivastava, (1999). ―I see
myself as someone who is talkative?‖ The respondents were asked to rate each statement
on a scale from 1 (strongly disagree) to 5 (strongly agree).
Agreeableness: 9-item scale has been adapted from John and Srivastava, (1999). ―I see
myself as someone who has a forgiving nature?‖ The respondents were asked to rate
each statement on a scale from 1 (strongly disagree) to 5 (strongly agree).
Conscientiousness: 9-item scale has been adapted from John and Srivastava, (1999). ―I
see myself as someone who works hard until the task is finished?‖ The respondents were
asked to rate each statement on a scale from 1 (strongly disagree) to 5 (strongly agree).
Neuroticism: 8-item scale has been adapted from John and Srivastava, (1999). ―I see
myself as someone who is emotionally stable, not easily upset?‖ The respondents were
asked to rate each statement on a scale from 1 (strongly disagree) to 5 (strongly agree).
Openness to experience: 10-item scale has been adapted from John and Srivastava,
(1999). ―I see myself as someone who is original, comes up with new ideas?‖ The
respondents were asked to rate each statement on a scale from 1 (strongly disagree) to 5
(strongly agree).
Data Analysis Procedure
Sample of 128 responses were taken and introduced into SPSS software. It‘s computer
operator statistical software. Following domains were analyzed in this software:

Copyright © 2013. NJMT
50
NUML Journal of Management & Technology
Vol: 7, No: 2. July, 2012 ISSN 1997-4507
Reliability
Means
Standard deviation
Correlation
Regression
Results
Table 1 reports means, standard deviations, and Pearson correlations among
studied variables. A Pearson correlation coefficient was computed to assess the
relationship between the customer advocacy behavior and the big five personality traits.
It was found that there was a positive correlation between the trait ―extraversion‖ and
customer advocacy behavior (r = 0.185, n = 128, p = 0.036). Increase in the tendency
towards extraverted personality was correlated with increase in the advocacy behavior of
customers. A scatter plot summarizes the results (Table 1). It was also found that there
was a positive correlation between the trait ―openness to experience‖ and customer
advocacy behavior (r = 0.280, n = 128, p = 0.001). Increase in the tendency of ―openness
to experience‖ was correlated with increase in the advocacy behavior of customers. The
results also show that there are no correlations between the variables ―agreeableness and
customer advocacy behavior‖, ―conscientiousness and customer advocacy behavior‖,
and ―neuroticism and customer advocacy behavior‖.
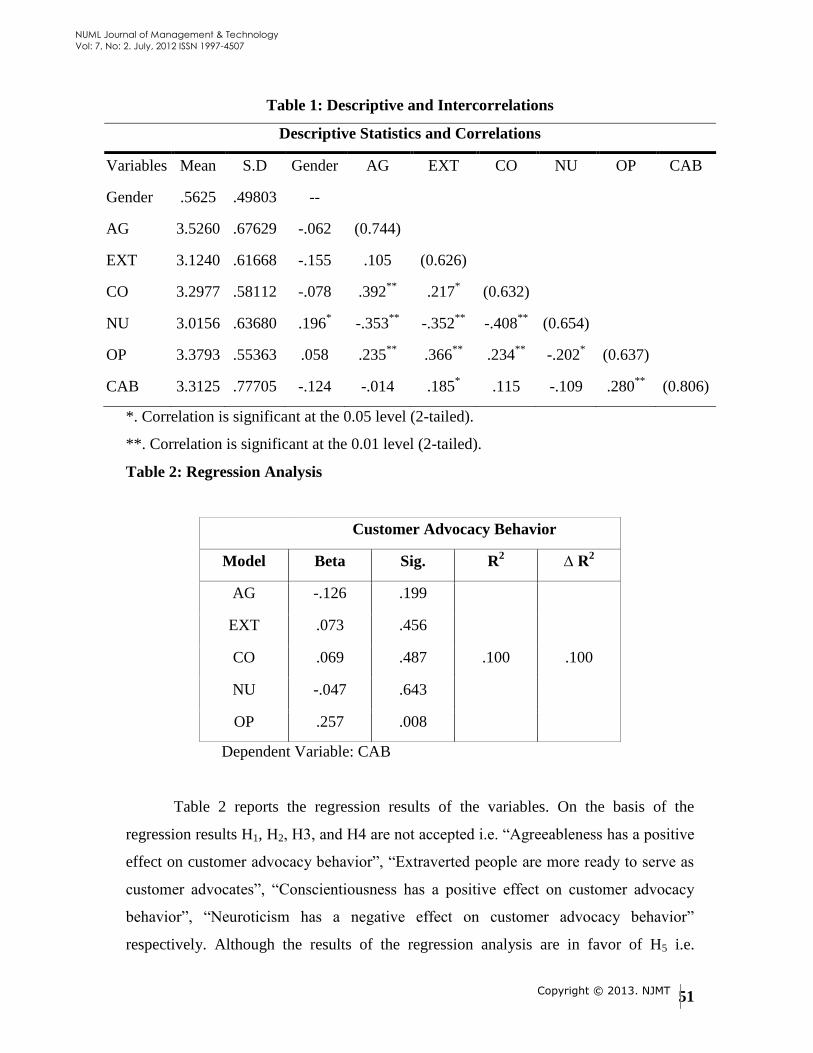
Copyright © 2013. NJMT
51
NUML Journal of Management & Technology
Vol: 7, No: 2. July, 2012 ISSN 1997-4507
Table 1: Descriptive and Intercorrelations
Descriptive Statistics and Correlations
Variables Mean S.D Gender AG EXT CO NU OP CAB
Gender .5625 .49803 --
AG 3.5260 .67629 -.062 (0.744)
EXT 3.1240 .61668 -.155 .105 (0.626)
CO 3.2977 .58112 -.078 .392**
.217* (0.632)
NU 3.0156 .63680 .196* -.353
** -.352
** -.408
** (0.654)
OP 3.3793 .55363 .058 .235**
.366**
.234**
-.202* (0.637)
CAB 3.3125 .77705 -.124 -.014 .185* .115 -.109 .280
** (0.806)
*. Correlation is significant at the 0.05 level (2-tailed).
**. Correlation is significant at the 0.01 level (2-tailed).
Table 2: Regression Analysis
Customer Advocacy Behavior
Model Beta Sig. R2 ∆ R
2
AG -.126 .199
.100 .100
EXT .073 .456
CO .069 .487
NU -.047 .643
OP .257 .008
Dependent Variable: CAB
Table 2 reports the regression results of the variables. On the basis of the
regression results H1, H2, H3, and H4 are not accepted i.e. ―Agreeableness has a positive
effect on customer advocacy behavior‖, ―Extraverted people are more ready to serve as
customer advocates‖, ―Conscientiousness has a positive effect on customer advocacy
behavior‖, ―Neuroticism has a negative effect on customer advocacy behavior‖
respectively. Although the results of the regression analysis are in favor of H5 i.e.
Copyright © 2013. NJMT
52
NUML Journal of Management & Technology
Vol: 7, No: 2. July, 2012 ISSN 1997-4507
―Openness to experience has a positive effect on customer advocacy behavior‖, thus H5
is not rejected.
Discussion
Not long ago it was widely believed that variance in psychological traits was
solely environmentally determined or socially constructed. Times have changed, and as
Rutter (2002) has argued ―any dispassionate reading of the evidence leads to the
inescapable conclusion that genetic factors play a substantial role in the origins of
individual differences with respect to all psychological traits, both normal and abnormal
(p. 2).‖ All individuals are not same; every individual is blessed with some innate
abilities which make them different from one another. These abilities are the basis of
individual differences and personality traits thus making one individual‘s personality
different from others.
One of the noteworthy personality traits is ability to take up new things known as
openness. Openness to some extent estimates types of positive and negative emotions
(McCrae & Costa, 1991; Watson, 2000). Basic dimension of personality related to
psychological processes are readiness/openness/intellect (DeYoung, Grazioplene, &
Peterson, 2010). Readiness to explore is an innate capability but has lesser application
on balance between positive and negative emotions (McCrae & Costa, 1991). The
advocacy behavior of customer is considered as extra role behavior, their agreeableness
which is somewhat related to the positive word of mouth may be referred to as
socialization. Researches supports current research hypothesis that people who tend to
be more open to experience are more ready to share their experience with others rather
than the ones who tends to be less open to experience. The statistical results show that
coefficients of openness has positive sign which means the frequency of advocacy
behavior of customer increases by 0.257 units whenever there is one unit increase in the
openness to experience of the customer. Their significant relation can be confirmed
through the significance value i.e. 0.008 (p<0.01) and also by t-value i.e. 2.708 (t-
value>2).
A Researcher points out that individuals with higher level of openness have a
positive influence on customer advocacy behavior. Openness to experience is an
intellectual ability of maintaining customer relationships. Studies have reported a

Copyright © 2013. NJMT
53
NUML Journal of Management & Technology
Vol: 7, No: 2. July, 2012 ISSN 1997-4507
positive relationship between Openness to experience and customer advocacy behavior
as openness allows going out of the way (Ackerman & Heggestad, 1997; Gignac,
Stough, & Loukomitis, 2004). So our results as well as theory supports our hypothesis
that the more open to the experience an individual will be the more will be the chances
to serve as customer advocates.
The only demographic variable ―gender‖ was not working as a control variable.
The proposed hypothesis as H1, H2, H3 H4 about personality traits; agreeableness,
extraversion, conscientiousness and neuroticism yield insignificant results. Main reason
behind the hypothesis rejection is that customers in Pakistani context are not interested
in building association with products. In realistic customer scenarios, customers rarely
show excitability, sociability, talkativeness, assertiveness and high amounts of emotional
expressiveness rather emotional instability toward a particular brand. Most of the time
customer‘s conscience while using a particular product is need oriented instead of goal
oriented in order to build trustworthy communication strategies.
The genetic variance of neuroticism and extraversion has been shown to mediate
the occurrence of undesirable life events (Saudino, Pederson, Lichtenstein, McClearn, &
Plomin, 1997) which may, in turn, contribute to prolonged negative behavior in
individuals.
Customer advocacy behavior involves an interaction between a person's
(customer‘s) underlying personality traits and situational variables. The situation that a
customer finds himself or herself in plays a major role in how the person reacts. Under
the given conditions of current research customer advocacy behavior proved to be
invalid because customer fail to show/exhibit required expressions. Personality is a
complex as a whole and each individual show these complex personality traits on
varying degrees. Likewise customer advocacy behavior is a result of such complex
personality associations.
Conclusion
Impact of personality on customer advocacy behavior is an exploratory research.
Research aims to explore and explain customer advocacy behavior in the context of big
five personality traits. Statistically and methodologically, the use of the Big Five
taxonomy is useful. There have been hundreds of existing studies utilizing the Big Five,

Copyright © 2013. NJMT
54
NUML Journal of Management & Technology
Vol: 7, No: 2. July, 2012 ISSN 1997-4507
the current study may be among the first to utilize accepted personality traits in customer
advocacy behaviors. Five personality traits were taken as variables out of which only
two i.e. openness and extraversion are positively correlated with customer advocacy of
behavior. Regression analysis reveals some degree of association between Openness to
experience in personality and that of the advocacy behavior of customers. Personality
traits are individual differences; therefore we cannot fix one particular behavioral
extreme as criteria of customer advocacy behavior as well as personality. In flexible
situation customer advocacy behavior is measured on varying degrees between two
polar extremes of personality traits in order to achieve signification of results. It is now
time to identify specific individuals (personality types) and specific interventions
(change and personality programs) aimed at those (customers) considered ―at risk‖ for
not attending to their behaviors.
Limitations, Implications and Recommendations for Future Studies
This study has a number of limitations. First limitation is that there were more
women than men in our sample. Second, in this study only Big five traits were considers
as the predictors of customer‘s advocacy behavior, other factors including
environmental factors, cultural factors etc. were not included. This study was a cross
sectional study which makes the results of this study non-generalizable over the
longitudinal study.
The most noteworthy limitation would be the sample size and use of a relatively
young and homogeneous sample of convenience. Generalization of current findings
should be cautiously made to other demographic. The current study is also limited by the
sole use of self-reported personality. Also the study was conducted only in the
telecommunication sector due to which it cannot be generalized over the other sectors.
Much of the previous work has been based on analyzing different factors that
affect the customer advocacy behavior, this study advances on analyzing the impact of
customer‘s personality traits on customer‘s advocacy behavior and considers the
customers potential that how they can be further engaged to serve as advocates and thus
improve the firm‘s marketing performance.
Copyright © 2013. NJMT
55
NUML Journal of Management & Technology
Vol: 7, No: 2. July, 2012 ISSN 1997-4507
Additional research should be encouraged into more diverse sectors as this study
only covers the customers of telecommunication sector. An important direction for
future research is also to examine these associations in age groups across the lifespan.
Future work must also validate the scales used in the research on more diverse and large
sample size.
References
Aronfreed, J. (1968). Conduct and conscience, Academic press, New York, NY.
Aronfreed, J. (1970). The socialization of altruistic and sympathetic behavior:
some theoretical and experimental analyses, in Macaulay, J. and Berkowitz, L. (Eds),
Altruism and Helping Behavior, Academic Press, New York, NY.
Barrick, M. R., & Mount, M. K. (1993). Autonomy as a moderator of the
relationships between the Big Five personality dimensions and job performance. Journal
of Applied Psychology, 78, 111–118.
Batson, C.D. (1991). The Altruism question: Toward a social psychological
answer, Lawrence Erlbaum Associates, Hillside, NJ.
Bettencourt, L.A., Brown, Stephen W. (1997). Contact employees: relationship
among workplace fairness, job satisfaction and prosocial service behaviours. Journal of
Retailing, 73(1), 39-61.
Chelminski, K., & Coulter, R. A. (2011). An examination of consumer
advocacy and complaining behavior in the context of service failure. Journal
ofServicesMarketing, 25(5),361–370.
Childers, T. (1986). Assessment of the psychometric properties of an opinion
leadership scale, Journal of Marketing Research, 23(4), 184-188.
Clark, L. A., &Watson, D. (1999). Temperament: A new paradigm for trait
psychology. In L. A. Pervin & O. P. John (Eds.), Handbook of personality: Theory and
research (pp. 399–423). New York: Guilford Press.
Costa, P. T., Jr., McCrae, R. R., & Dye, D. A. (1991). Facet scales for
agreeableness and conscientiousness: A revision of the NEO Personality Inventory.
Personality and Individual Differences, 12, 887–898.

Copyright © 2013. NJMT
56
NUML Journal of Management & Technology
Vol: 7, No: 2. July, 2012 ISSN 1997-4507
DeYoung, C. .G., Grazioplene, R. .G., & Peterson, J. B. (2010).From madness to
genius: The Openness/Intellect trait domain as a paradoxical
simplex.JournalofResearchinPersonality,46, 63–78.
Diener, E. D., Suh, E. M., Lucas, R. E., & Smith, H. L. (1999). Subjective well-
being: Three decades of progress. Psychological Bulletin, 125, 276–302.
Digman, J. M. (1997). Higher-order factors of the Big Five. Journal of
Personality and Social Psychology, 73, 1246–1256.
Goldberg, L. R. (1992). The development of markers for the Big-Five factor
structure. Psychological Assessment, 4, 26–42.
Jensen, C.L.A.,&Graziano,W. G.(2001).Agreeableness as a moderator of
interpersonal conflict.JournalofPersonality,69, 323–362.
Jensen, C.L. A.,Rosselli,M.,Workman,K.A.,Santisi,M.,Rios,
J.,&Bojan,D. (2002). Agreeableness, conscientiousness, and effortful control
processes.JournalofResearchinPersonality,36, 476–489.
John, O. P., Naumann, L. P., & Soto, C. J. (2008). Paradigm shift to the
integrative Big-Five trait taxonomy: History, measurement, and conceptual issues. In O.
P. John, R. W. Robins, & L. A. Pervin (Eds.), Handbook of personality: Theory and
research, (pp. 114–158). New York, NY: Guilford Press.
John, O. P., & Srivastava, S. (1999). The big five trait taxonomy: History,
measurement, and theoretical perspectives. In L. A. Pervin & O. P. John (Eds.),
Handbook of personality: Theory and research 2nd
ed., pp. 102–138. New York:
Guilford.
Judge, T. A., Heller, D., & Mount, M. K. (2002). Five-Factor Model of
personality and job satisfaction: A meta-analysis. Journal of Applied Psychology, 87,
530–541.
King, E.B., George, J.M., & Hebl, M.R. (2005). Linking personality to helping
behaviours at work: An interactional perspective. Journal of Personality, 73(3), 585-
607.
Linden, D. V. D., Nijenhuis, J. T., & Bakker, A. B. (2010). Journal of Research
in Personality, 44, 315
MacDonald,K.B.(1995).Evolution, the Five-Factor Model and levels of

Copyright © 2013. NJMT
57
NUML Journal of Management & Technology
Vol: 7, No: 2. July, 2012 ISSN 1997-4507
personality.JournalofPersonality,63, 525–567.
McCrae, R. R., & Costa, L. (1991). Adding and liebe und arbeit: The full five-
factor model and well-being. Personality and Social Psychology Bulletin, 17, 227–232.
McCrae, R. R., Yamagata, S., Jang, K. L., Riemann, R., Ando, J., Ono, Y., et al.
(2008). Substance and artifact in the higher-order factors of the Big Five. Journal of
Personality and Social Psychology, 95, 442–455.
Miller, J. D., & Lynam, D. (2001). Structural models of personality and their
relation to antisocial behavior: A meta-analytic review. Crimonology, 39, 765–792.
Mount, M. K., Barrick,M. R., Scullen,S. M., &Rounds,J. (2005).Higher-
order dimensions of the Big Five personality traits and the big six vocational interest
types. PersonnelPsychology,58, 447–478.
Oxford English Dictionary. (1989). Oxford: Clarendon Press.
Rauthmann, J.F.,Seubert, C. T.,Sachse, P., &Furtner, M. R. (2012). Eyes
as windows to the soul: Gazing behavior is related to personality.
JournalofResearchinPersonality,46, 147–156.
Rothbart,M. K.,&Derryberry,D.(1981).Development of individual
differences in temperament.In M. E.Lamb&A.L.Brown (Eds.).Advances in
developmental psychology,(Vol. 1,pp. 37–86).Hillsdale,NJ:Erlbaum.
Seibert, L.A.,Miller, J.D.,Pryor,L.R., Reidy,D.E., &Zeichner A.
(2010).Personality and laboratory-based aggression: Comparing the predictive power
of the Five-Factor Model, BIS/BAS, and impulsivity across context.
JournalofResearchinPersonality,44, 13–21.
Small,B.J.,Hertzog,C.,Hultsch,D.F.,&Dixon,R.A.(2003).Stability and
change in adult personality over 6 years: Findings from the victoria longitudinal
study.TheJournals ofGerontologySeriesB:PsychologicalSciencesandSocial
Sciences,58, 166–176.
Urban, G.L., (2005). Customer advocacy: A new era in marketing?. Journal
of Public Policy and Marketing, 24 (1), 155-159.
Watson, D. (2000). Mood and temperament. New York, NY: Guilford Press.
Yik,M.S.M.,&Russell,J.A.(2001).Predicting the Big Two of affect from the
Big Five of personality.JournalofResearchinPersonality,35, 247–277.
Copyright © 2013. NJMT
58
NUML Journal of Management & Technology
Vol: 7, No: 2. July, 2012 ISSN 1997-4507
Moderational Effect of Age on Time Pressure and Human Judgment-
Decision Making Relationship
Sardar Abdul Hameed PhD Scholar NUML Islamabad
Dr. Naveed Akhtar, NUML University Islamabad
Prof. Safdar Ali Butt, MAJU University Islamabad
ABSTRACT
Decision making is foreseeable in daily life, and ethical decision making is especially
important to the harmony of the every society. There is no doubt in this that in stress or
under pressure decisions are some time going to wrong direction rather than solving a
problem another problem is created. In working environment where time pressure
exists, it is difficult to take decision and make judgment about others. The study aims to
identify Age play moderating role between human judgment, time pressure and decision
making. Private and public sector were selected for this research and sample was
considered 140 employees from different organizations out of them 128 were considered
for analysis. For data analysis SPSS 17 used, which is supported by a technique of
Multistage Sampling, Questionnaire heaving several questions regarding Human
Judgment ,Time pressure, Decision making and age was used as data collection.
Result exposed so as to, age use as moderator between human judgment and decision
making relationship and not play use as moderator between time pressure and decision
making. This research is a valuable adding up in follow a line of investigation that will
assist authorities of private as well as public association to enlarge the level of decision
making and human judgment.
Key words: Human Judgment, Time Pressure, Decision making and Age.
INTRODUCTION
Decision making is foreseeable in daily life, and ethical decision making is especially
important to the harmony of the every society. To take a decision is never easy in life even
on daily bases, especially when it effects on large scale such as ours and on society. Some
researchers such as, Orasanu and Connolly (1993) explain 'The Responsibility Related
Procedure‘ to take any sort of matters in our hands to deal with any matter. Narayan and
Corcoran-Perry (1997) explains that the decision making is basic key to resolve any issue as
per required. But it cannot be accurate all the time as making mistakes is a part of human
nature. Which causes many reasons such as lack of knowledge or have no experience to
solve such matter or issue before? That‘s why some time when we attempt to move forward
Copyright © 2013. NJMT
59
NUML Journal of Management & Technology
Vol: 7, No: 2. July, 2012 ISSN 1997-4507
witch such problems we lose because of the fear holds our decisions much stronger than we
thought off.
Today the moderate study explains us the concepts behind human ideology and thought‘s in
different situations. Such as a normal human take a decision which will be totally different from
a frightened person at that time. Even male and females decisions are quite opposite to each
other‘s in same situations.
Human age is a common factor in taking decisions starting with the most ethical decisions
being made by the older persons and changes the concept of the ethics of other person
decision (Ruegger & King, 1992). Some of the presented studies looking at decision making
in older adults are questionable: some state that decision making abilities decline with age,
while others disagree with this statement (Deakin, Aitken, Robbins, & Sahakian, 2004).
Nevertheless, 'The Self Absorbed Perusal‘, on part of a researcher has repeatedly extracted that
there had been no or zero effect of our age related impact. It is observed that the impact of time
pressure is always great and tremendous on the gross out put efficiency of work.
Statement of Problem
Researcher extracted, there are many factors, which effects decision making like human
judgment and time pressure are out of these factors. Considering the other factors like age
gender etc to finalize moderational influence of age on ―Time Pressure And Human Judgment
On Decision Making ― capability as well as their respective association within human judgment
and time stress.
Research Objective
The Definite Purpose of such research recognizes the moderational effect of age and identifies
association among ―Time Pressure, Human Judgment and Decision Making‖.
Classification of Targets achieved will be as under:

Copyright © 2013. NJMT
60
NUML Journal of Management & Technology
Vol: 7, No: 2. July, 2012 ISSN 1997-4507
Scrutinize moderational-effect of age on Time Pressure and Human Judgement on
Decision Making relationship.
Research Significance
The Researcher based psychological rehearsal foretells that is time pressure. It is a calculated
fact that in our country, few researchers are at work in this area, and yet confused that how much
time pressure effect will be absolutely and depressingly associated through human judgment and
decision making, so the research I have chooses that would be helpful for further research and
traveling around of innovative thoughts in this ground.
Delimitation
The study will be delimited to Public and private education Sector in Islamabad.
REVIEW OF LITERATURE
The Researchers analysis and the extracted results of the hypothesis ,we may review our
findings, regarding ―Time Pressure, Human Judgment And Decision Making ―, and their co-
relational link with age, the author would ponder discussion on: The Variables calculated since
1961 to 2003, Edwards (1961) initially systemize the base, in which , reviewed 'decision based
behavioral assumption through representing different psychological and economic theories of
risk free alternative, risk-full alternatives in playoffs. Let‘s have a brief discussion about human
decisions and analyze the reasons behind it. Why such decisions taken by such person and what
were the conditions. Before moving further we have to believe today wealth, age, experience,
relations and body conditions all effects directly on any person‘s decisions. Whereas, Becker and
McClintock (1967) talk about the decision assumption, different attitudes in societal sciences.
The Utilities ideology plays an intervening position toward connection decision Making
(Theories) along through attitude of Collaborated Social Relational Sciences. Wright, P. (1974)
discussed about the stressed decision maker, time pressures, While, Janis & Mann (1977) talked
about decision making in which he analyzed the interrelational link between the conflict, choice,

Copyright © 2013. NJMT
61
NUML Journal of Management & Technology
Vol: 7, No: 2. July, 2012 ISSN 1997-4507
and commitment. Thus, Beach and Mitchell (1978) discussed about the contingency Decision
Strategies Selection Model. Einhorn and Hogarth (1981) attempted in resolving the judgment
based impediment with functional arguments. These may involve the decisions made thus, in
capacity of sense and intellect. Pitz & Sachs (1984) uttered the statement that the human based
judgment is correlated to decision making having link with mind set ' human information
processing'. Payne et al (1992) strained use of various decision approaches in the creation of
predilection. Pennington and Hastie (1993) the study tells about the intellect based decision
making and the cognitive approach of human mind working phenomenon. Stevenson (1993)
talked regarding relationship of decision making with lasting cost. Diederich, A. (1997)
accessible lively stochastic models for decision making with time restraint and in (2003)
Decision making have a direct or deductive impact on crisis based mind power. Kocher, Strauß
and Sutter (2006) offered the decision making of Individual or group, blended through basis with
effect. It is personally selected. While we observe previous research, we come, conclude, mostly,
the study, carried out, thus, was Qualitative to come across the relationship among, time
pressure, human judgment and decision making.
Time Pressure
Stress/pressure can be defined as the situation where people being faced and observantly real
and in cognitive approach as threatening (Atkinson, Atkinson, Smith, Bem, & Nolen-Hoeksema,
1996) or as being the substantial, with mental boundaries creature, once compelled, or feel
endangered (Baltas & Baltas, 1996). Altuntas (2003) defines, pressure like disturbance conveys
the result of the physical, along with mental stress, having emotional burden of working
boundaries. On the other hand time is a critical source in human judgment and decision making‖.
Exclusive of adequate time, many actions unspecified to emphasize excellent judgment and
alternative cannot be implement. Many an observatory research analysis have treated time-
pressure as a job attribute related in type to supplementary temperament as like the numerical
substitute or number of characteristics (Payne et al., 1993) other hand Maule and Edland (1997)

Copyright © 2013. NJMT
62
NUML Journal of Management & Technology
Vol: 7, No: 2. July, 2012 ISSN 1997-4507
discuss it so as to belongings of time-pressure might as well differ with the means of
acclimatized use through folks. In addition, time-pressured changes individuals and their
knowledge handing out precedence with confident category or categories of knowledge being
prejudiced more profoundly (Wright, 1974)
Human Judgment
Vocabulary declares so as to opinion is ―the psychological or logical procedure of form
estimation or assessment by discriminating with match up to,‖ as well as the capability for
adjudicator is ―the authority or skill to make your intelligence up on the starting point of
confirmation.‖
Gigerenzer (1991, 1996) critically examined, human capacity is attracted to good judgment,
which, in accumulation about: values, and promulgation. Gigerenzer (1996) and Cosmides &
Tooby (1996) has extracted, which represents the common Rules for Survival. Einhorn &
Hogarth (1981) tried to resolve judgmental unfairness with well-designed point of view that
entail choice must be rational and intellectual. At the same time, the research psychologists read
immense arrangements, regarding inaccuracy and unfairness.
Age
On the topic on age, manifold studies of the naturalists come within reach of the adulthood
personnel once retired, to such an extent, that the youth work on. It is an appealing aspect, in
analyzing the three categorical study samples, jointly. As per capacity of the male and female,
the analysis's are not dead sure, the distinctive capabilities applied on part of the three, vide, the
youth, the adults and the retired make sense in their physical endeavor. Many Researchers
believes that in attendance are distinctions, (Gardner, Scherer, & Tester, 1989; Dror, Katona, &
Mungur, 1998) and many of them are disagreeing with this (Chen & Sun, 2003; Moshman,
1993). The naturalists scrutinize the working with the working skills through reverence to their
age.

Copyright © 2013. NJMT
63
NUML Journal of Management & Technology
Vol: 7, No: 2. July, 2012 ISSN 1997-4507
Decision Making
Decision making is very important in all situations of life, either these situations are in
crises or in happiness, but a good decision is always play a major role in all situations.
The human being prepared with incomplete knowledge managing capacity tries to sense
of balance the aspiration to truthfully decide alternatives which eventually exploit
his/her settlement and the similarly imperative want to decrease the cognitive damage of
the given decision task (Ban Zor and Braznitz 1981). Whereas Kuzgun (1992)
represented that the decision making aspects inclined toward overcome the recurrent
difficulty, while we hold more than one decision, as existing.
Researchers have normally deliberately risky decision making in any situations allow
the unlimited time to decision maker to implement that decision .Although all decisions
are made under time constraint some have less time and some have more. This is same
like that a driver, upon considering a yellow light, must decide whether to stop the
vehicle or speed up through the intersection sooner than the red light come into view.
Literature suggested that any human being is when involved in work based decision
making, is engrossed physically through a chain process of skills as shown below:

Copyright © 2013. NJMT
64
NUML Journal of Management & Technology
Vol: 7, No: 2. July, 2012 ISSN 1997-4507
The Decision, taken thus, is based on understanding about the problems faced, with its
respective evaluation criteria.
Hypothesis
The hypothesis based test is observed as:
Ho: Decision Making have significant effect with Time Pressure and Human Judgment
H1: Age play moderational role between human judgment and decision making.
H2: Age play moderational role between decision making and time pressure.
H3: Age does not play moderational role between decision making, human judgment
and time pressure.
METHODOLOGY
Population
Public and private education Sector of Islamabad was chosen as studied population.
Sample and Response Rate
Selected four private and public organizations at Islamabad, Pakistan are:
Quaid-e-Azam University,

Copyright © 2013. NJMT
65
NUML Journal of Management & Technology
Vol: 7, No: 2. July, 2012 ISSN 1997-4507
Mohammad Ali Jinnah University (MAJU),
Ripha international University and
Islamic International University.
The Sample based calculations were used while selecting 140 specific age limit resource
persons, out of which, 128 respondents analyzed to eliminate biasness error.
Instrument
A Question tagged thus: Decision Making, Time Pressure and Human Judgment were
adopted by Rizwan Saleem ―Effect of Time Pressure and Human Judgment on Decision
Making‖ in using it for data collection, meant for our Studies, through specific a
questionnaire. The First Sample collects data information about demographics like
gender discrimination, age, sex, qualification, and work on part of the few at the
management level, out of these we only consider 'age‘ for our analysis.
Part1. Based on Decision Making having 10 queries for measuring DM.
Part2. Based on Time Pressure having 10 queries for measuring TP.
Part3. Based on Human Judgment having 7 queries for measuring HJ.
(These three categories were analysed and observed, in our second
consideration)
Instrument Description
Survey – to find the moderational effect of age on Time pressure human
judgement - decision making relationship.
Interrogate – All level Management, students
Time Pressure & Human Judgement – the Independent Variables
Decision Making – the Dependent Variable.

Copyright © 2013. NJMT
66
NUML Journal of Management & Technology
Vol: 7, No: 2. July, 2012 ISSN 1997-4507
Time Pressure
DV
Decision Making
Human Judgment
IV
Age – the Moderator
Case – Private and Public Organizations.
Conceptual Model
Age
Econometric Model
1. DM= β0 + β1HJ+ β2 TP + e
2. DM = β0 + β1HJ + β2TP + β3AGE + β4HJxAGE + β5TPxAGE + e
Where
DM= Decision making
HJ= Human Judgment
TP= Time pressure
Age = Age
Analysis of Data
Statistical tools were used:
Means and Standard Deviations was premeditated, as the aggregate named and
implied give us the exact feelings intended for the required mediocre respond as:

Copyright © 2013. NJMT
67
NUML Journal of Management & Technology
Vol: 7, No: 2. July, 2012 ISSN 1997-4507
Regression Analysis find out the result of independent variables on the
dependant one.
FINDINGS
Results of first equation
DM= β0 + β1HJ+ β2 TP + e
Correlation
Correlations
DECISION
MAKING
TIME
PRESSURE
HUMAN
JUDGMENT
Pearson Correlation DECISION MAKING 1.000 .601 .557
TIME PRESSURE .601 1.000 .628
HUMAN JUDGMENT .557 .628 1.000
Sig. (1-tailed) DECISION MAKING . .000 .000
TIME PRESSURE .000 . .000
HUMAN JUDGMENT .000 .000 .
N DECISION MAKING 128 128 128
TIME PRESSURE 128 128 128
HUMAN JUDGMENT 128 128 128
As can be seen in table Time Pressure, Human Judgment and Decision Making are
significantly correlated.
Descriptive Statistics
128 individuals shortlisted for Decision Making, Time pressure and Human Judgment
are 3.7883, 4.5498, and 4.3694 respectively.
Descriptive Statistics
Mean Std. Deviation N
DECISION MAKING 3.7883 .55849 128
TIME PRESSURE 4.5498 .71863 128
HUMAN JUDGMENT 4.3694 .68653 128
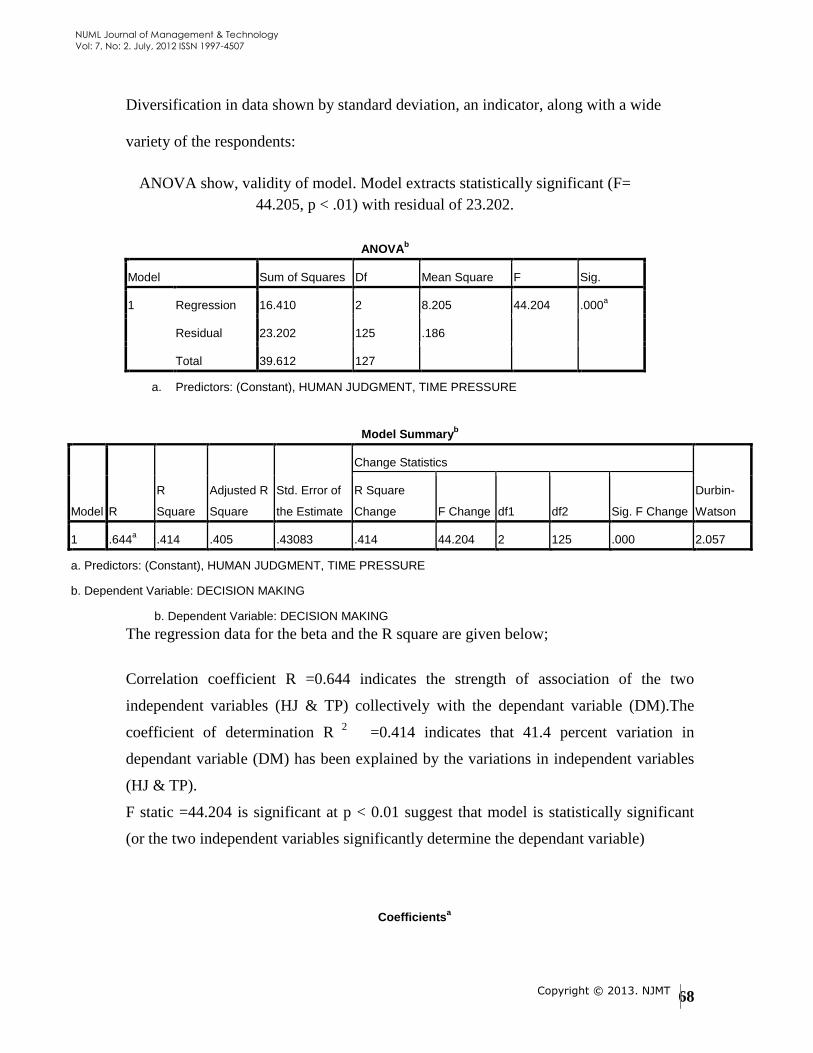
Copyright © 2013. NJMT
68
NUML Journal of Management & Technology
Vol: 7, No: 2. July, 2012 ISSN 1997-4507
Diversification in data shown by standard deviation, an indicator, along with a wide
variety of the respondents:
ANOVA show, validity of model. Model extracts statistically significant (F=
44.205, p < .01) with residual of 23.202.
ANOVAb
Model Sum of Squares Df Mean Square F Sig.
1 Regression 16.410 2 8.205 44.204 .000a
Residual 23.202 125 .186
Total 39.612 127
a. Predictors: (Constant), HUMAN JUDGMENT, TIME PRESSURE
b. Dependent Variable: DECISION MAKING
The regression data for the beta and the R square are given below;
Correlation coefficient R =0.644 indicates the strength of association of the two
independent variables (HJ & TP) collectively with the dependant variable (DM).The
coefficient of determination R 2
=0.414 indicates that 41.4 percent variation in
dependant variable (DM) has been explained by the variations in independent variables
(HJ & TP).
F static =44.204 is significant at p < 0.01 suggest that model is statistically significant
(or the two independent variables significantly determine the dependant variable)
Coefficientsa
Model Summaryb
Model R
R
Square
Adjusted R
Square
Std. Error of
the Estimate
Change Statistics
Durbin-
Watson
R Square
Change F Change df1 df2 Sig. F Change
1 .644a .414 .405 .43083 .414 44.204 2 125 .000 2.057
a. Predictors: (Constant), HUMAN JUDGMENT, TIME PRESSURE
b. Dependent Variable: DECISION MAKING

Copyright © 2013. NJMT
69
NUML Journal of Management & Technology
Vol: 7, No: 2. July, 2012 ISSN 1997-4507
Model
Unstandardized Coefficients
Standardized
Coefficients
T Sig. B Std. Error Beta
1 (Constant) 1.268 .272 4.669 .000
TIME PRESSURE .322 .068 .414 4.703 .000
HUMAN JUDGMENT .242 .072 .297 3.378 .001
a. Dependent Variable: DECISION MAKING
Results shows both the coefficients of independent variables are individually
statistically significant; coefficient carrying with independent variable TP and HJ
are statistically significant at p<0.01 which shows that one unit change in
independent variable TP brings a 0.414 units change in dependant variable DM
and same like that one unit change in independent variable HJ brings a 0.297
units change in dependant variable DM and according to result we accept our
supposition Decision Making have significant effect with Time Pressure and Human
Judgment
Results of second equation
DM = β0 + β1HJ + β2TP + β3AGE + β4HJxAGE + β5TPxAGE + e
Correlations
DECISION
MAKING
TIME
PRESSURE
HUMAN
JUDGMENT AGE HJAGE TPAGE
Pearson
Correlation
DECISION MAKING 1.000 .601 .557 .151 .320 .347
TIME PRESSURE .601 1.000 .628 .188 .389 .549
HUMAN JUDGMENT .557 .628 1.000 .148 .529 .352
AGE .151 .188 .148 1.000 .907 .915
HJAGE .320 .389 .529 .907 1.000 .918
TPAGE .347 .549 .352 .915 .918 1.000

Copyright © 2013. NJMT
70
NUML Journal of Management & Technology
Vol: 7, No: 2. July, 2012 ISSN 1997-4507
Sig. (1-
tailed)
DECISION MAKING . .000 .000 .044 .000 .000
TIME PRESSURE .000 . .000 .017 .000 .000
HUMAN JUDGMENT .000 .000 . .048 .000 .000
AGE .044 .017 .048 . .000 .000
HJAGE .000 .000 .000 .000 . .000
TPAGE .000 .000 .000 .000 .000 .
N DECISION MAKING 128 128 128 128 128 128
TIME PRESSURE 128 128 128 128 128 128
HUMAN JUDGMENT 128 128 128 128 128 128
AGE 128 128 128 128 128 128
HJAGE 128 128 128 128 128 128
TPAGE 128 128 128 128 128 128
As can be seen in table Time Pressure, Human Judgment Age and Decision Making are
significantly correlated.
Descriptive Statistics
Mean Std. Deviation N
DECISION MAKING 3.7883 .55849 128
TIME PRESSURE 4.5498 .71863 128
HUMAN JUDGMENT 4.3694 .68653 128
AGE 1.8125 .54339 128
HJAGE 7.9743 2.72657 128
TPAGE 8.31937 2.869770 128
Dependant Variable in Decision Making were 128 in number, 3.7883 was the
aggregate, is meant, for two independent variables Time pressure and Human Judgment
are 4.5498 and 4.3694 respectively, and mean for moderator (Age) and interaction terms
between moderator and independent variables are 1.81125,7.9743 and 8.319
respectively.
Standard Deviations are shown, which clearly indicates about 'diversity', a clear
indicative that we possess a wide variety of opinions amongst the Respondents.

Copyright © 2013. NJMT
71
NUML Journal of Management & Technology
Vol: 7, No: 2. July, 2012 ISSN 1997-4507
ANOVAb
Model Sum of Squares Df Mean Square F Sig.
1 Regression 17.755 5 3.551 19.820 .000a
Residual 21.858 122 .179
Total 39.612 127
a. Predictors: (Constant), TPAGE, HUMAN JUDGMENT, TIME PRESSURE, AGE, HJAGE
b. Dependent Variable: DECISION MAKING
Validity of model shown by ANOVA. Model found statistically significant (F= 19.820,
p < .01) with residual of 21.858.
Model Synopsisb
Mode
l R
R
Square
Adjusted R
Square
Std. Error of
the Estimate
Change Statistics
Durbin-
Watson
R Square
Change
F
Change df1 df2
Sig. F
Change
1 .669a .448 .426 .42327 .448 19.820 5 122 .000 1.985
a. Predictors: (Constant), TPAGE, HUMAN JUDGMENT, TIME
PRESSURE, AGE, HJAGE
b. Dependent Variable: DECISION MAKING
The Correlation Coefficient R =0.669 indicates about The Strength of Association
Between The Two Independent Variables (HJ & TP) as a whole, with The Dependant
Variable (DM).The Coefficient of Determination R 2
=0.448 Indicates, About 45
Percent Variation in The Dependant Variable (DM) has been elaborated Through The
Variations in The Independent Variables (HJ & TP).
F Static = 19.820 is significant at p < 0.01, Which Suggests, The Model is Statistically
Significant (or The Two Independent Variables Significantly Determine The Dependant
variable)
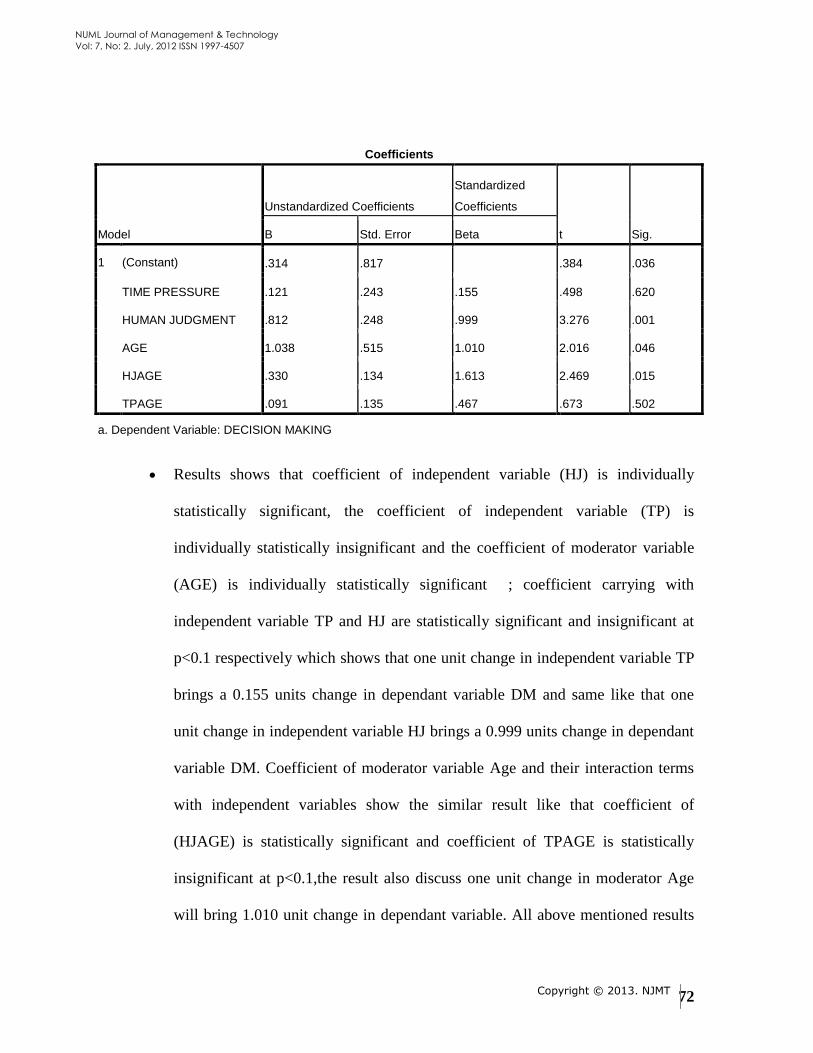
Copyright © 2013. NJMT
72
NUML Journal of Management & Technology
Vol: 7, No: 2. July, 2012 ISSN 1997-4507
Coefficients
Model
Unstandardized Coefficients
Standardized
Coefficients
t Sig. B Std. Error Beta
1 (Constant) .314 .817 .384 .036
TIME PRESSURE .121 .243 .155 .498 .620
HUMAN JUDGMENT .812 .248 .999 3.276 .001
AGE 1.038 .515 1.010 2.016 .046
HJAGE .330 .134 1.613 2.469 .015
TPAGE .091 .135 .467 .673 .502
a. Dependent Variable: DECISION MAKING
Results shows that coefficient of independent variable (HJ) is individually
statistically significant, the coefficient of independent variable (TP) is
individually statistically insignificant and the coefficient of moderator variable
(AGE) is individually statistically significant ; coefficient carrying with
independent variable TP and HJ are statistically significant and insignificant at
p<0.1 respectively which shows that one unit change in independent variable TP
brings a 0.155 units change in dependant variable DM and same like that one
unit change in independent variable HJ brings a 0.999 units change in dependant
variable DM. Coefficient of moderator variable Age and their interaction terms
with independent variables show the similar result like that coefficient of
(HJAGE) is statistically significant and coefficient of TPAGE is statistically
insignificant at p<0.1,the result also discuss one unit change in moderator Age
will bring 1.010 unit change in dependant variable. All above mentioned results

Copyright © 2013. NJMT
73
NUML Journal of Management & Technology
Vol: 7, No: 2. July, 2012 ISSN 1997-4507
shows that age plays modrational role with human judgment but age haven‘t any
concern with time pressure .We accept our hypothesis Age play moderational role
between human judgment and decision making.
RESULTS AND DISCUSSION
As earlier discussed in many research only age has not any strong effect on
decision making but we never neglect this element that age didn‘t play any role
in human judgment .As age increases human judgment would also be higher.
Time pressure and human judgment may or may not cause or effect on
Decision making without any other passive factor like age, sex, education etc.
but It also depends on situation that in which situation you are going to take a
decision. As per employees are concerned in this study most of them are
satisfied with their working environment ant many of them are willing to work
in time pressure and take better decision in stress because in education sector
most of time they face many unforeseen situations which they handled
according to their judgment which they attain with passage of time.
Recommendations
So That, we may perceive about The improvement of 'job Satisfaction and The Morale
Level improvement of The Employees, The Education Sector Should Must immediately
better The Surrounding Environment for Learning Tendencies, And The Infrastructural
Framework, so as to Try Reduce or Eliminate The Specific Stress Caused by Time
Dilations, at work.
Adroit and Skilful workforce should be concentric on Their Job and Should Take
improvised Decision in Time Pressure Proposition.
Copyright © 2013. NJMT
74
NUML Journal of Management & Technology
Vol: 7, No: 2. July, 2012 ISSN 1997-4507
Human Judgment is not always based on 'Age'. It Might be possible An Aged
Person‘s Judgment may go Wrong, as does the age factor, So do Consider All
Possible Factors while making 'A Predialected Judgment about a person and
taking decision.
Company should give preference to those employees who are senior in age and
deserve it.
Limitations of Study
Although intentionally collection of data is in good faith but there are chances of some
flaws in study. Researcher faces many hurdles which are part of research process. While
collecting data many hurdles were faced by researchers, which are as follows.
1. Lack of time and resources: It was not feasible conduct study at large scale due
to Lack of time and other resources.
2. No of response rate: Out of all respondents only 128 respondents have chosen,
who meets the full requirements‘ of study which is very small number.
3. Respondents Unwillingness: Due to poor knowledge respondents‘ were
unwilling to fill the questionnaire and felt its only time wasting exercise.
4. Sector of research: Study is delimited in specific sector that‘s why area of
research is very small.
BIBLIOGRAPHY
Edwards W. 1961. Behavioral decision theory. Annu. Rev. Psychol. 12:473.98.
Becker GM, McClintock CG. 1967. Value: behavioral decision theory. Annu. Rev.
Psychol. 18:239.86
Einhorn HJ, Hogarth RM. 1981. Behavioral decision theory: processes of judgment and
choice. Annu. Rev. Psychol. 32:53.88
Pitz GF, Sachs NJ. 1984. Judgment and decision: theory and application. Annu. Rev.
Psychol. 35:139.63

Copyright © 2013. NJMT
75
NUML Journal of Management & Technology
Vol: 7, No: 2. July, 2012 ISSN 1997-4507
Beach, L.R. and Mitchell, T.R. (1978) ‗A contingency model for the selection of
decision strategies‘, Academy of Management Journal, 3:439-49.
Stevenson MK. 1993. Decision making with long-term consequences: temporal
discounting for single and multiple outcomes in the future.
Pennington N, Hastie R. 1993. Reasoning in explanation-based decision making.
Cognition 49:123.63
Diederich, A. (1997). Dynamic stochastic models for decision making with time
constraints. Journal of Mathematical Psychology, 41, 260-274.
Diederich, A. (2003). Decision making under conflict: Decision time as a measure of
conflict strength. Psychonomic Bulletin & Review, 10, 167-176.
Kocher, M.G., Strauß, S., Sutter,M., 2006. Individual or team decision making—causes
and consequences of self-selection. Games and Economic Behavior, in press.
Wright, P. (1974). The harassed decision maker: Time pressures, distractions, and the
use of evidence. Journal of Applied Psychology, 59, 555-561.
Janis, I. L., & Mann. L. (1977). Decisionmaking: A psychological analysis of conflict,
choice, and commitment. New York: Free Press.
Atkinson, R. L., Atkinson, R. C., Smith, E. E., Bem, D. J., & Nolen-Hoeksema, S.
(1996). Introduction to psychology. (Translator: Yavuz Alagon). Ankara:
Arkadasク Publishing.
Baltas, A., & Baltas, Z. (1996). Stress and coping styles. I˙stanbul: Remzi Publishing.
Altuntasク , E. (2003). Stress management. I˙stanbul: Alfa Publishing.
Ordonez, L., Benson, L. III (1997), "Decisions under time pressure: how time constraint
affects risky decision making", Organizational Behavior and Human Decision
Processes, Vol. 71 No.2, pp.137-140.

Copyright © 2013. NJMT
76
NUML Journal of Management & Technology
Vol: 7, No: 2. July, 2012 ISSN 1997-4507
Gigerenzer G. 1991. How to make cognitive illusions disappear: beyond .heuristics and
biases.. Eur. Rev. Soc. Psychol. 2: 83.115
Gigerenzer G. 1996. Rationality: why social context matters. In Interactive Minds:Life-
span Perspectives on the Social Foundation of Cognition, ed. P Baltes, UM
Staudinger, pp. 319.46. Cambridge: Cambridge Univ. Press
Cosmides L, Tooby J. 1996. Are humans good intuitive statisticians after all?
Rethinking some conclusions from the literature on judgment under uncertainty.
Cognition 58:1.73
Einhorn HJ, Hogarth RM. 1981. Behavioral decision theory: processes of judgment and
choice. Annu. Rev. Psychol. 32:53.88
B. A. Mellers, A. Schwartz and A. D. J. Cooke, Judgment and decision making. Annual
Review of Psychology 49 (1998), pp. 447–477
Kuzgun, Y. (1992). Decision Strategies Scale: Development and standardization. VII.
National Psychology Congress Scientific Studies. Turkish Psychologists
Association, Ankara (161-170).
Ruegger, D., & King, E. W. (1992). A study of the effect of age and gender upon student
business ethics. Journal of Business Ethics, 11, 179-186.
Ben Zur. H., Breznitz, J.S., 1981. The effect of time pressure on risky choice behavior.
Acta Psychologica 47, 89-104.
Diederich, A. MDFT Account of Decision Making under Time Pressure. Psychonomic
Bulletin and Review, Vol. 10, No. 1, 2003, pp. 157–166
Kocher, M., Sutter, M. (2006), Time is money - Time pressure, incentives, and the
quality of decision making. published in: Journal of Economic Behavior and
Organization 61: 375-392

Copyright © 2013. NJMT
77
NUML Journal of Management & Technology
Vol: 7, No: 2. July, 2012 ISSN 1997-4507
Deakin, J., Aitken, M., Robbins, T., & Sahakian, B. (2004). Risk taking during decision-
making in normal volunteers changes with age. Journal of the International
Neuropsychological Society, 10(04), 590-598.
Narayan SM & Corcoran-Perry S (1997). Line of reasoning as a representation of
nurses‘ clinical decision making. Research in Nursing & Health, 20, 353-364.
Orasanu J & Connolly T (1993). The reinvention of decision making. In G Klein, J
Orasanu, R Calderwood & CE Zsambok (Eds.), Decision making in action:
Models and methods (pp. 3-20). Norwood, NJ: Ablex.
Chen Y & Sun Y (2003). Age differences in financial decision-making: Using simple
heuristics. Educational Gerontology, 29, 627-635.
Gardner W, Scherer D & Tester M (1989). Asserting scientific authority: Cognitive
development and adolescent legal rights. American Psychologist, 44, 895-902.