issn 2094-6198 major non-food and industrial crops ... non-food and...volume 11 no. 4 quezon city,...
TRANSCRIPT

Volume 11 No. 4 Quezon City, Philippines
Major Non-Food and Industrial Crops Quarterly Bulletin
ISSN 2094-6198
October-December 2017
Republic of the Philippines
Philippine Statistics Authority Solid•Responsive•World-Class

Republic of the Philippines
Philippine Statistics Authority Solid•Responsive•World-Class
Major Non-Food and Industrial Crops
Quarterly Bulletin
October-December 2017

REPUBLIC OF THE PHILIPPINES
HIS EXCELLENCY
PRESIDENT RODRIGO R. DUTERTE
PHILIPPINE STATISTICS AUTHORITY
LISA GRACE S. BERSALES, Ph.D. Undersecretary
National Statistician and Civil Registrar General
JOSIE B. PEREZ
Assistant Secretary Deputy National Statistician
Census and Technical Coordination Office
ROMEO S. RECIDE Assistant Secretary
Deputy National Statistician Sectoral Statistics Office
Major Non-Food and Industrial Crops Quarterly Bulletin is a publication of the Philippine Statistics Authority. The PSA reserves exclusive right to reproduce this publication in whatever form. Should any portion of this publication be included in a report/article, the title of the publication and the PSA should be cited as the source of data. The PSA will not be responsible for any information derived from the processing of data contained in this publication.
ii

FOREWORD The Major Non-Food and Industrial Crops Quarterly Bulletin provides updates on production of major non-food and industrial crops, namely, abaca, coconut, coffee, rubber, sugarcane, and tobacco. These crops are highlighted in the report on the Performance of Agriculture which the Philippine Statistics Authority (PSA) releases quarterly. The 4th quarter 2017 issue of the Bulletin presents the final estimates of production for July-September 2017 and the preliminary estimates for October-December 2017. Also, it contains the preliminary estimates of area planted for permanent crops, area harvested for temporary crops, and the number of bearing trees for the period July-December 2017. The data contained herein are generally the results of the quarterly Crops Production Survey (CrPS) of the PSA, but the data on canes milled are sourced entirely from the Sugar Regulatory Administration (SRA). While the production data for coconut are largely from the CrPS, these include the integrated results of the CrPS and the Quarterly Coconut Production Survey (QCPS) of the Philippine Coconut Authority (PCA) for a limited number of provinces.
LISA GRACE S. BERSALES, Ph. D.
National Statistician
Quezon City, Philippines February 2018
iii

TABLE OF CONTENTS
Administrative Page ii
Foreword iii
Table of Contents iv
Technical Notes vi
Abaca 2
Coconut 4
Coffee 6
Rubber 8
Sugarcane 10
Tobacco 12
List of Tables
TABLE 1 Volume of Production for Selected Non-Food and Industrial Crops, Philippines, July-September: 2016-2017 and October-December: 2016-2017P
16
TABLE 2 Volume of Production for Abaca, by Region, July-September: 2016-2017 and October-December: 2016-2017P
17
TABLE 3 Volume of Production for Coconut, by Region, July-September: 2016-2017 and October-December: 2016-2017P
18
TABLE 4 Volume of Production for Coffee, by Region, July-September: 2016-2017 and October-December: 2016-2017P
19
TABLE 5 Volume of Production for Rubber, by Region, July-September: 2016-2017 and October-December: 2016-2017P
20
TABLE 6 Volume of Production for Sugarcane, by Region, July-September: 2016-2017 and October-December: 2016-2017P
21
TABLE 7 Volume of Production for Tobacco, by Region, July-September: 2016-2017 and October-December: 2016-2017P
22
TABLE 8 Area Planted/Harvested and Number of Bearing Trees for Selected Non-Food and Industrial Crops, Philippines, July-December: 2016-2017P
23
Note: P – preliminary estimate
iv
List of Figures
FIGURE 1 Abaca Production, by Region, October-December: 2016-2017P 1
FIGURE 2 Distribution of Abaca Production, by Region, October-December: 2016-2017P
2
FIGURE 3 Coconut Production, by Region, October-December: 2016-2017P 3
FIGURE 4 Distribution of Coconut Production, by Region, October-December: 2016-2017P
4
FIGURE 5 Coffee Production, by Region, October-December: 2016-2017P 5
FIGURE 6 Distribution of Coffee Production, by Region, October-December: 2016-2017P
6
FIGURE 7 Distribution of Coffee Production, by Variety, Philippines, October-December: 2016-2017P
6
FIGURE 8 Rubber Production, by Region, October-December: 2016-2017P 7
FIGURE 9 Distribution of Rubber Production, by Region, October-December: 2016-2017P
8
FIGURE 10 Sugarcane Production, by Region, October-December: 2016-2017P
9
FIGURE 11 Distribution of Sugarcane Production, by Region, October-December: 2016-2017P
10
FIGURE 12 Tobacco Production, by Region, October-December: 2016-2017P 11
FIGURE 13 Distribution of Tobacco Production, by Region, October-December: 2016-2017P
12
FIGURE 14 Distribution of Tobacco Production, by Variety, Philippines, October-December: 2016-2017P
12
v

TECHNICAL NOTES
Production refers to the quantity produced and actually harvested for a particular crop during the reference period. For other crops, area planted refers to the actual physical area planted while area harvested refers to the actual area from which harvests are realized. Bearing trees/hills is the number of trees/hills where harvesting has been made in the past but may or may not have borne fruits or productive during the reference period due to cyclical production pattern of the crop. Estimates of production, area planted/harvested, and number of bearing trees/hills are generated from the quarterly Crops Production Survey (CrPS) of which there are four survey rounds in a year, that is, February, May, August and November.
vi

FIGURE 1 Abaca Production, by Region, October-December: 2017P
1

Abaca
• Production of abaca for October-December 2017 went down by
4.1 percent from its production level of 17.62 thousand metric tons
during the same period last year to its current level of 16.90 thousand
metric tons (Table 2). This was attributed to the following factors:
o less harvest as newly planted suckers are not yet harvestable in Bicol
Region (Catanduanes); and
o less harvest and stripping activities due to frequent rains in Western
Visayas (Aklan) and Caraga (Surigao Sur).
• The top abaca producer for this quarter was Bicol Region with a share
of 37.8 percent to the country’s total abaca production. Eastern Visayas
followed next with 18.0 percent, while Davao Region and Caraga had
respective contributions of 12.8 and 10.8 percent (Figure 2).
Bicol Region 37.8%
Eastern Visayas 18.0%
Davao Region 12.8%
Caraga 10.8%
Other Regions 20.6%
FIGURE 2 Distribution of Abaca Production, by Region, October-December: 2017P
2

FIGURE 3 Coconut Production, by Region, October-December: 2017P
3

Coconut
• Production of coconut for this quarter was estimated at 3.9 million metric
tons, which is 3.8 percent higher than last year’s 3.75 million metric tons
(Table 3).
• The increase in production was attributed to harvesting of more nuts due
to:
o recovery from the effects of dry spell in 2016 and increased salt
fertilizer application from PCA in Davao Region (Davao Sur);
o adequate rains during fruit development in SOCCSKSARGEN
(Sarangani, Sultan Kudarat, and South Cotabato); and
o increased number of bearing trees in Zamboanga Peninsula
(Zamboanga del Norte).
• Davao Region was the top coconut-producing region for the quarter with
contribution of 13.1 percent. This was followed by Northern Mindanao,
Zamboanga Peninsula, and CALABARZON with contributions of 12.3
percent, 10.7 percent, and 9.7 percent, respectively (Figure 4).
Davao Region13.1%
Northern Mindanao
12.3%
Zamboanga Peninsula
10.7%
CALABARZON9.7%
Other Regions54.2%
FIGURE 4 Distribution of Coconut Production, by Region, October-December: 2017P
4

FIGURE 5 Coffee Production, by Region, October-December: 2017P
5

Coffee
• Production of dried coffee berries for this period decreased by 8.7 percent from 32.17 thousand metric tons for the same period last year to 29.36 thousand metric tons (Table 4). This decline was caused by the harvest of less berries due to: o cutting of old and less productive arabica coffee trees in
SOCCSKSARGEN (Sultan Kudarat) and Zamboanga Peninsula (Zamboanga del Norte), and robusta coffee trees in Davao Region (Davao City and Compostela Valley);
o strong winds and heavy rains during flowering and fruit development stage of robusta coffee trees in SOCCSKSARGEN (Sultan Kudarat), Caraga (Surigao Sur) and Davao Region (Davao City and Compostela Valley); and
o adverse effects of fruit borers on robusta coffee trees in SOCCSKSARGEN (Sultan Kudarat).
• The top coffee producing region was SOCCSKSARGEN at 10.5 thousand metric tons, contributing 35.9 percent to the national total production. The other major producing regions were ARMM, Davao Region, and Western Visayas which contributed 21.5 percent, 16.4 percent, and 11.8 percent, respectively (Figure 6).
• Of the total coffee production, Robusta coffee was the top-produced variety at 71.6 percent, followed by Arabica, 23.3 percent; Excelsa, 4.2 percent; and Liberica, 1.0 percent (Figure 7).
SOCCSKSARGEN35.9%
ARMM21.5%Davao Region
16.4%
Western Visayas11.8%
Other Regions14.4%
Robusta71.5%
Arabica23.3%
Excelsa4.2%
Liberica1.0%
FIGURE 6 Distribution of Coffee Production, by Region,
October-December: 2017P
FIGURE 7 Distribution of Coffee Production, by Variety, Philippines,
October-December: 2017P
6
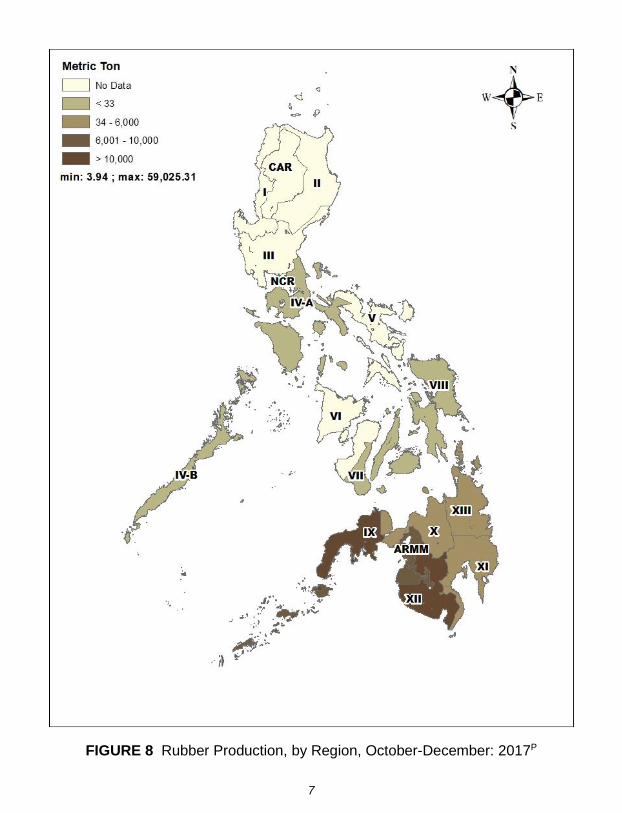
FIGURE 8 Rubber Production, by Region, October-December: 2017P
7

Rubber
• For the period October-December 2017, the production of rubber grew by 8.9 percent, from 126.94 thousand metric tons in same quarter of 2016 to 138.24 thousand metric tons this year (Table 5). The growth in production resulted from: o increase in number of tappable trees and more tapping activities due
to high price and adequate rainfall in SOCCSKSARGEN (North Cotabato);
o more tapping activities due to less rainfall compared last year in Caraga (Agusan Sur); and
o increase in tapping activities due to more productive trees in Davao Region (Davao Sur, Davao City, Compostela Valley).
• The top-producing region during the period is Zamboanga Peninsula, with its production of 59.03 thousand metric tons accounting for 42.7 percent of the total rubber production of the country. SOCCSKSARGEN came in close with 41.8 percent contribution while ARMM had 6.7 percent share to the national production (Figure 9).
Zamboanga Peninsula
42.7%
SOCCSKSARGEN41.8%
ARMM6.7%
Other Regions8.8%
FIGURE 9 Distribution of Rubber Production, by Region, October-December: 2017P
8

FIGURE 10 Sugarcane Production, by Region, October-December: 2017P
9

Sugarcane
• Production of sugarcane (all uses) for October-December 2017
increased by 14.4 percent from its production level of 6.29 million metric
tons during the same period last year to its current level of 7.19 million
metric tons (Table 6).
• Production of sugarcane for centrifugal sugar, which is about 99.2
percent of the total sugarcane production, drove the growth of total
sugarcane production by 15.2 percent. The increase resulted from the
following:
o timely occurrence of rainfall during fertilizer application which favored
better cane growth in Western Visayas (Negros Occidental); and
o increased area planted encouraged by high price last year in Northern Mindanao (Bukidnon).
• Western Visayas produced 79.4 percent of the national sugarcane
production during this period. Northern Mindanao contributed 8.5
percent (Figure 11).
Western Visayas79.3%
Northern Mindanao8.5% Other Regions
12.2%
FIGURE 11 Distribution of Sugarcane Production, by Region, October-December: 2017P
10

FIGURE 12 Tobacco Production, by Region, October-December: 2017P
11

Tobacco
• Total production of tobacco for October-December 2017 slightly decreased by 0.7 percent from 964.95 metric tons during the same quarter last year to 957.73 metric tons in the current year (Table 7). This is attributed to the decrease of area harvested due to: o slowdown of operation of the Universal Leaf Corporation on tobacco
others in SOCCSKSARGEN (South Cotabato); and o lesser demand for native variety in SOCCSKSARGEN (Sarangani)
and shifting to rubber in Zamboanga Peninsula (Zamboanga Sur) brought about by the declining demand from traders.
• At 98.5 percent of the total production, Northern Mindanao produced the bulk of the national tobacco production for this quarter (Figure 13).
• Of the total production, virginia variety contributed 86.1 percent; native
variety, 13.5 percent; and other varieties, 0.4 percent. (Figure 14).
Northern Mindanao98.5%
SOCCSKSARGEN0.6%
Other Regions0.9%
Virginia 86.1%
Native 13.5%
Others 0.4%
FIGURE 14 Distribution of Tobacco Production, by Variety, Philippines,
October-December: 2017P
FIGURE 13 Distribution of Tobacco Production, by Region,
October-December: 2017P
12

STATISTICAL TABLES

Jul-Sept Oct-Dec
2016 2017 2016 2017P 2017/2016 2017P/2016
Abaca 18,411 17,960 17,621 16,902 (2.4) (4.1)
Coconut 3,687,926 3,838,496 3,754,182 3,897,435 4.1 3.8
Mature 3,599,155 3,741,925 3,662,431 3,802,179 4.0 3.8
Young 88,770 96,572 91,751 95,256 8.8 3.8
Coffee 6,366 5,763 32,170.63 29,362.20 (9.5) (8.7)
Arabica 1,856 1,561 8,379 6,840 (15.9) (18.4)
Excelsa 422 396 1,371 1,230 (6.3) (10.3)
Liberica 50 51 288 283 1.5 (1.7)
Robusta 4,037 3,755 22,132 21,009 (7.0) (5.1)
Rubber 91,815 105,692 126,939 138,239 15.1 8.9
Sugarcane (cane) for: 479,004 783,364 6,290,688 7,194,432 63.5 14.4
Centrifugal sugar 347,642 644,512 6,197,321 7,138,152 85.4 15.2
Ethanol 108,283 116,737 52,848 12,965 7.8 (75.5)
Panocha/Muscovado 22,928 21,968 40,136 42,767 (4.2) 6.6
Chewing 82 76 244 247 (7.5) 1.3
Basi/Vinegar 68 71 139 302 4.8 116.8
Tobacco 1,129 1,144 965 958 1.4 (0.7)
Native 564 580 130 129 2.8 (0.7)
Virginia 533 549 795 825 2.9 3.8
Others 31 15 40 4 (50.1) (91.1)
P Preliminary
- no data
Percent Change
TABLE 1 Volume of Production for Selected Non-Food and Industrial Crops, Philippines,
July-September: 2016-2017 and October-December: 2016-2017P
(in metric tons)
Selected Crops
Production
July-September October-December
14

Jul-Sept Oct-Dec
2016 2017 2016 2017P 2017/2016 2017P/2016
PHILIPPINES 18,411 17,960 17,621 16,902 (2.4) (4.1)
National Capital Region - - - - - -
CAR - - - - - -
Ilocos Region - - - - - -
Cagayan Valley - - - - - -
Central Luzon 24 20 5 6 (15.4) 12.6
CALABARZON 1 1 3 2 (7.7) (33.0)
MIMAROPA 24 32 26 30 30.7 14.9
Bicol Region 7,044 6,442 7,334 6,387 (8.5) (12.9)
Western Visayas 789 874 832 770 10.7 (7.5)
Central Visayas 100 119 77 79 18.8 2.7
Eastern Visayas 3,311 3,268 2,855 3,050 (1.3) 6.9
Zamboanga Peninsula 126 130 186 194 3.3 4.1
Northern Mindanao 754 759 879 877 0.7 (0.3)
Davao Region 2,370 2,503 2,066 2,162 5.6 4.7
SOCCSKSARGEN 210 217 359 377 3.5 5.1
Caraga 2,576 2,523 1,865 1,821 (2.0) (2.3)
ARMM 1,083 1,072 1,135 1,147 (1.0) 1.1
P Preliminary
- no data
TABLE 2 Volume of Production for Abaca, by Region, July-September: 2016-2017 and
October-December: 2016-2017P
October-December
Percent Change
Region
Production
July-September
(in metric tons)
15

Jul-Sept Oct-Dec
2016 2017 2016 2017P 2017/2016 2017P/2016
PHILIPPINES 3,687,926 3,838,496 3,754,182 3,897,435 4.1 3.8
National Capital Region - - - - - -
CAR 196 183 236 237 (6.5) 0.5
Ilocos Region 10,019 11,496 12,788 14,275 14.7 11.6
Cagayan Valley 20,207 18,841 19,395 21,654 (6.8) 11.7
Central Luzon 35,904 36,974 25,165 34,985 3.0 39.0
CALABARZON 523,688 575,664 383,026 376,318 9.9 (1.8)
MIMAROPA 128,979 129,880 374,868 375,803 0.7 0.2
Bicol Region 318,347 309,901 313,813 322,003 (2.7) 2.6
Western Visayas 105,999 112,902 120,193 126,864 6.5 5.6
Central Visayas 99,193 108,728 117,755 126,718 9.6 7.6
Eastern Visayas 344,863 351,307 276,912 280,686 1.9 1.4
Zamboanga Peninsula 355,394 412,250 387,145 415,453 16.0 7.3
Northern Mindanao 493,664 498,712 472,840 480,993 1.0 1.7
Davao Region 472,238 458,290 454,879 512,325 (3.0) 12.6
SOCCSKSARGEN 214,369 256,646 209,818 233,135 19.7 11.1
Caraga 191,749 196,524 210,936 203,407 2.5 (3.6)
ARMM 373,117 360,198 374,415 372,578 (3.5) (0.5)
P Preliminary
- no data
TABLE 3 Volume of Production for Coconut, by Region, July-September: 2016-2017 and
October-December: 2016-2017P
Region
Production
July-September
Percent Change
October-December
(in metric tons)
16

Jul-Sept Oct-Dec
2016 2017 2016 2017P 2017/2016 2017P/2016
PHILIPPINES 6,366 5,763 32,171 29,362 (9.5) (8.7)
National Capital Region - - - - - -
CAR - - 211 204 - (3.5)
Ilocos Region 0.04 0.05 21 16 10.0 (24.5)
Cagayan Valley - - - - - -
Central Luzon - - 53 36 - (31.9)
CALABARZON - - 199 206 - 3.3
MIMAROPA - - 77 77 - 0.4
Bicol Region 20 18 148 138 (12.3) (7.3)
Western Visayas 1 1 3,332 3,468 (3.4) 4.1
Central Visayas 4 0.80 58 68 (81.0) 17.7
Eastern Visayas 1 2 37 35 45.4 (3.4)
Zamboanga Peninsula 144 81 355 227 (44.1) (35.9)
Northern Mindanao 579 607 2,477 2,512 5.0 1.4
Davao Region 2,211 2,067 5,082 4,817 (6.5) (5.2)
SOCCSKSARGEN 1,925 1,536 12,916 10,540 (20.2) (18.4)
Caraga 777 739 810 696 (4.9) (14.0)
ARMM 703 711 6,393 6,320 1.1 (1.1)
P Preliminary
- no data
TABLE 4 Volume of Production for Coffee, by Region, July-September: 2016-2017 and
October-December: 2016-2017P
Region
Production
July-September
Percent Change
October-December
(in metric tons)
17

Jul-Sept Oct-Dec
2016 2017 2016 2017P 2017/2016 2017P/2016
PHILIPPINES 91,815 105,692 126,939 138,239 15.1 8.9
National Capital Region - - - - - -
CAR - - - - - -
Ilocos Region - - - - - -
Cagayan Valley - - - - - -
Central Luzon - - - - - -
CALABARZON 10 4 9 9 (61.8) (2.0)
MIMAROPA 33 35 32 32 4.6 2.2
Bicol Region - - - - - -
Western Visayas - - - - - -
Central Visayas 11 8 5 4 (25.1) (23.0)
Eastern Visayas - 6 - 6 - -
Zamboanga Peninsula 39,054 38,096 63,951 59,025 (2.5) (7.7)
Northern Mindanao 3,017 3,166 5,391 5,496 4.9 1.9
Davao Region 4,111 4,271 2,826 2,983 3.9 5.5
SOCCSKSARGEN 26,911 39,212 41,276 57,733 45.7 39.9
Caraga 3,403 3,850 3,366 3,626 13.1 7.7
ARMM 15,265 17,045 10,084 9,325 11.7 (7.5)
P Preliminary
- no data
TABLE 5 Volume of Production for Rubber, by Region, July-September: 2016-2017 and
October-December: 2016-2017P
Region
Production
July-September October-December
Percent Change
(in metric tons)
18

Jul-Sept Oct-Dec
2016 2017 2016 2017P 2017/2016 2017P/2016
PHILIPPINES 479,004 783,364 6,290,688 7,194,432 63.5 14.4
National Capital Region - - - - - -
CAR 32 9 52 213 (70.9) 308.6
Ilocos Region - - 1,063 1,110 - 4.4
Cagayan Valley 108,583 117,071 53,008 13,118 7.8 (75.3)
Central Luzon 5 4 228,291 255,972 (20.0) 12.1
CALABARZON - - 58,967 16 - (100.0)
MIMAROPA - - - - - -
Bicol Region 14,144 13,013 11,636 12,334 (8.0) 6.0
Western Visayas 327,744 426,228 5,359,970 5,711,022 30.0 6.5
Central Visayas 20,784 50,339 210,207 325,946 142.2 55.1
Eastern Visayas 11 11 47,302 59,095 1.1 24.9
Zamboanga Peninsula 42 39 29 27 (5.4) (8.9)
Northern Mindanao - 169,069 280,820 609,098 - 116.9
Davao Region 35 32 20 54,629 (10.0) 270,475.7
SOCCSKSARGEN 7,617 7,544 28,377 119,790 (1.0) 322.1
Caraga 0.09 0.07 0.10 0.11 (14.2) 10.0
ARMM 6 6 10,946 32,062 (8.8) 192.9
P Preliminary
- no data
TABLE 6 Volume of Production for Sugarcane, by Region, July-September: 2016-2017 and
October-December: 2016-2017P
Region
Production
July-September October-December
Percent Change
(in metric tons)
19

Jul-Sept Oct-Dec
2016 2017 2016 2017P 2017/2016 2017P/2016
PHILIPPINES 1,129 1,144 965 958 1.4 (0.7)
National Capital Region - - - - - -
CAR - - - - - -
Ilocos Region - - - - - -
Cagayan Valley - - - - - -
Central Luzon - - - - - -
CALABARZON - - - - - -
MIMAROPA - - - - - -
Bicol Region - - - - - -
Western Visayas - - - - - -
Central Visayas - - - - - -
Eastern Visayas 2.4 2.3 0.53 0.49 (5.0) (7.5)
Zamboanga Peninsula 3 3 3 2 (5.7) (41.3)
Northern Mindanao 1,083 1,115 910 943 2.9 3.6
Davao Region 5 5 4 3 (2.2) (7.1)
SOCCSKSARGEN 34 19 44 6 (44.6) (85.8)
Caraga 0.36 0.35 0.40 0.25 (2.0) (37.5)
ARMM - - 4 3 - (28.6)
P Preliminary
- no data
TABLE 7 Volume of Production for Tobacco, by Region, July-September: 2016-2017 and
October-December: 2016-2017P
July-SeptemberRegion
Production Percent Change
October-December
(in metric tons)
20

TABLE 8 Area Planted/Harvested and Number of Bearing Trees for Selected Non-Food and Industrial Crops, Philippines, July-December: 2016-2017P
Selected Crops
July-December
2016 2017P Percent Change
2017P/2016
Area (in hectares)
Abaca 132,998 131,715 (1.0)
Coconut 3,562,593 3,609,156 1.3
Coffee 114,201 112,459 (1.5)
Arabica 18,188 18,047 (0.8)
Excelsa 7,899 7,719 (2.3)
Liberica 1,268 1,268 (0.0)
Robusta 86,846 85,425 (1.6)
Rubber 217,192 224,790 3.5
Sugarcane (cane) for: 126,928 138,626 9.2
Centrifugal sugar 121,007 132,759 9.7
Ethanol 4,655 4,551 (2.2)
Panocha/Muscovado 1,213 1,253 3.2
Chewing 33 32 (1.0)
Basi/Vinegar 20 31 58.6
Tobacco 1,737 3,240 86.6
Native 837 1,591 90.2
Virginia 867 1,630 88.0
Others 33 19 (42.4)
Number of Bearing Trees
Coconut 337,905,064 341,271,769 1.0
Coffee 77,345,686 76,028,284 (1.7)
Arabica 12,766,887 12,579,444 (1.5)
Excelsa 4,691,639 4,603,138 (1.9)
Liberica 840,813 839,444 (0.2)
Robusta 59,046,347 58,006,259 (1.8)
*Rubber 56,557,236 56,915,293 0.6
P Preliminary
* Tappable trees
21

/Philippine Statistics Authority /PSAgovph

Republic of the Philippines PHILIPPINE STATISTICS AUTHORITY
16th Floor, ETON Cyberpod Centris 3 EDSA, Quezon City
www.psa.gov.ph