issue 1 clinical research and more - shimadzu · shimadzu's mass spectrometers (axima qit and...
TRANSCRIPT

Shimadzu
ISSUE 1
Clinical Research and more...
05
ISSN 2188-0486SJ17_0051

It is our sincere pleasure that Shimadzu’s collaborative partnerships have
accelerated recently. This started with the establishment of our third Innovation
Center, located in Europe, to promote collaborative research and development
projects with leading academic and research institutes. This center joins Shimadzu
Innovation Centers in Maryland, USA, and Beijing, China, where they serve as
drivers of joint research and new product developments. We plan to establish a
fourth one in Singapore in the near future.
In addition to the new Innovation Center, in July 2017, Shimadzu hosted its
inaugural Global Innovation Summit. This Summit provided a platform for Key
Opinion Leaders and Emerging Thought Leaders to join Shimadzu executives and
scientists in discussions about the use of analytical technologies in the fields of
human health, food safety and environmental conservation. The event provided a
forum for thoughtful and engaging communications about current and future
research projects, while strengthening the bonds between Shimadzu and
participants.
We believe collaboration works best when it advances new technologies that
bring true solutions to the world. We are eager to see what results these recent
developments bring.
Shimadzu Journal has highlighted various collaborative research projects in
specific application fields since its launch in October 2013. This issue focuses on
Clinical Research. For an insight from a customer, we interviewed Professor Daniel
W. Chan from the Johns Hopkins University School of Medicine. His research is
focused on the development and application of proteomic and immunologic
techniques in the diagnosis, management, and understanding of cancer. Also,
Professor Joy Hirsch from the Yale School of Medicine shared with us the
state-of-the-art brain research being conducted using Shimadzu’s functional
near-infrared spectroscopy (fNIRS) system.
Thank you for being a partner of Shimadzu. We hope this journal will be of great
help to all of you. We welcome your feedback at any time.
Yours Sincerely,
Shuzo Maruyama
General Manager, Analytical & Measurement Instruments Division
Dear Reader,Director’s note

Featuring Clinical Research
CONTENTS
Insight from Customer
Professor Daniel W. Chan from the Johns Hopkins University School of Medicine 04We interviewed Professor Daniel W. Chan from the Johns Hopkins University School of Medicine. His research is focused on the development and application of proteomic and immunologic techniques in the diagnosis, management, and understanding of cancer. The relationship with Shimadzu started in 2009 when the Johns Hopkins Center for Biomarker Discovery and Translation began utilizing Shimadzu's mass spectrometers (AXIMA QIT and Resonance), primarily for discovery and analysis of cancer-related glycoforms.
Glycan Analysis
Analysis of Glycan Structures Using Chemical Labeling and MALDI MSn Mass Spectrometry 06Glycans play important roles in the function of glycoproteins in the human body. In this study, an AXIMA ResonanceTM was used to generate MALDI-IT-TOF MSn spectra for the analysis of glycan sequences without multistep separation or enzymatic treatment. Combining the carbohydrate oxidation reaction and MSn analysis allowed monitoring the oxidization reaction for sialylation and linkages of oligosaccharides.
Neuroscience
The Grand Challenge to Understand the Brain: Neuroimaging by Near-infrared Spectroscopy 09After describing the overview of the recent study of the brain and neurosciences, the development of brain imaging technologies has been mentioned to have contributed extensively to a major branch of neuroscience focused on the correlation of functional brain activity with cognition and behavior. Because the interactive social behavior involving dynamic communications between two individuals is a fundamental aspect of human socialization, the acquisition of real-time NIRS signals of two individuals is a solution for this purpose.
Bioanalysis
Application of LC-MS/MS Analysis for Time-lapse Metabolomics in CHO Cell Culture 18Metabolic analysis of Chinese hamster ovary (CHO) cell culture plays an important role for efficient production in the biopharmaceutical industry. In this study, amino acids concerned with these pathways were analyzed by LC-MS/MS (LCMS-8050, SHIMADZU) for time-lapse metabolic analysis of CHO-K1 cell batch culture. Results showed real-time changes of various metabolites during CHO culture, which may provide extensive and speedy investigational analysis for genomic and metabolic modifications in biopharmaceutical or medical progresses.
New Products
Nexis GC-2030 (High-End Gas Chromatograph), SPM-8100FM (High Resolution Scanning Probe Microscope), LC/MS/MS Method Package for D/L Amino Acids, Semi-Micro Analytical Balances AP-W Series (Advanced Performance UniBloc Balances) 27
Topics
Shimadzu Global Innovation Summit 2017 - IMAGINE, INNOVATE & INSPIRE - 23Shimadzu Corporation held its first Global Innovation Summit in Kyoto, Japan, July 4th & 5th, 2017. The event brought together over 100 scientists from 16 countries in the fields of analytical chemistry and medical diagnostics including 11 Key Opinion Leaders (KOL) who spoke about their application of Shimadzu products to research pressing issues in the areas of human health, food safety and environmental conservation.
Topics
Collaboration Between Shimadzu, The Systems Biology Institute, and Osaka University Starting the Provision of an Open Platform Multi-omics Data Analysis Pack
25
On June 6, Shimadzu Corporation starts to provide, at no cost, the Shimadzu Multi-omics Data Analysis Pack. Intended for metabolic engineering, this gadget pack automatically visualizes large-volume of data sets from proteomics*1, metabolomics*2, and flux analysis*3, obtained using Shimadzu gas chromatograph mass spectrometers and liquid chromatograph mass spectrometers, on metabolic maps and perform a variety of data analyses. Multi-omics is a cutting-edge research area in the field of life sciences. It involves the integrated analysis of changes in genes, proteins, metabolites and other substances, towards a holistic elucidation of biological activities at cellular level. Multi-omics is expected to be useful in a variety of fields such as drug discovery, diagnostics, and biofuel research.
Topics
Shimadzu Corporation and Phytronix Technologies sign an agreement to offer the first Triple Ion Source (LDTD-MS/MS, ESI-MS/MS and APCI-MS/MS).
26
Kyoto, Japan and Québec, Canada – June 5, 2017. Shimadzu, one of the world's fastest growing mass spectrometry companies, and Phytronix, world leader in high throughput analysis in mass spectrometry, announced that they had signed an agreement to offer the industry’s first Triple Ion Source. Ideal for both screening and confirmation work, this new high-speed platform will significantly improve productivity in high-throughput laboratories performing toxicology, drug discovery and food safety applications. This Triple Ion Source incorporates the Phytronix LDTD (Laser Diode Thermal Desorption Ion Source), and is designed in perfect synchronization with the speed of the Shimadzu LCMS-8060 triple quadrupole mass spectrometer. Together, the companies presented information about this new design at ASMS in Indianapolis.
Posters from ASMS 2017 15These articles were selected by Shimadzu. Relating to clinical research, they derive from posters presented at ASMS 2017, held June 4-8 in Indianapolis, IN. They feature Shimadzu's state-of-the-art mass spectrometry lineup and include cutting-edge technologies.

Insight from Customer
4
Professor Chan, thank you very much for spending some time for this interview. At first, could you outline the research and let us know what discovery and achievement have been made so far?
Professor Daniel W. Chan fromthe Johns Hopkins University School of Medicine
We interviewed Professor Daniel W. Chan from the Johns Hopkins University School of Medicine. His research is focused on the development and application of proteomic and immunologic techniques in the diagnosis, management, and understanding of cancer. The relationship with Shimadzu started in 2009 when the Johns Hopkins Center for Biomarker Discovery and Translation began utilizing Shimadzu mass spectrometers (AXIMA QIT and Resonance), primarily for discovery and analysis of cancer related glycoforms.
Professor Chan has edited and written five books on immunoassay, immunoassay automation, diagnostic endocrinology, and tumor markers. He has published about 300 articles including the tumor markers chapters in the Tietz Textbook of Clinical Chemistry and in Tumor Markers: Physiology, Pathobiology, Technology, and Clinical Applications, which he also co-edited. Prof. Chan was one of the founders of the USHUPO (Human Proteomics Organization) society. Currently, Prof. Chan is the Editor-in-Chief of Clinical Proteomics. His research was recently recognized and awarded the inaugural "Translational Proteomics Award" for outstanding achievement in proteomics at HUPO.
The focus of my research is cancer proteomics. In 2000, I founded the Center for Biomarker Discovery and Translation. The focus of the Center is to discover and translate proteomics cancer biomarkers using mass spectrometry, protein microarrays and immunoassays. Our team developed the test OVA1 which is based on 5 proteomic biomarkers for ovarian cancer. In 2009, this test became the 1st FDA cleared proteomic in vitro diagnostic multivariate index assay (IVDMIA).
I am the principal investigator (PI) of the Biomarker Reference Laboratory (BRL) for the National Cancer Institute (NCI) Early Detection Research Network (EDRN) and the NCI Clinical Proteomic Tumor Analysis Consortium (CPTAC). We were instrumental in the development of public-private partnerships leading to the clinical study, publication and FDA approval in 2012 of two new prostate cancer tests - proPSA (phi) and PCA3.
Our efforts extend beyond discovery to include the translation of cancer biomarkers. We have constructed a roadmap for the development of cancer diagnostics and with close collaboration between researchers, industry (including Shimadzu), clinicians, and regulatory agencies.
Could you tell us why you chose Shimadzu as your partner when you established this new lab?
Shimadzu has provided our labs with exceptional tools for both our discovery efforts as well as new clinical assay development. We are most impressed with the reliability of Shimadzu instrumentation. These state-of-the art instruments are our laboratory workhorses.
How are our instruments helping you?
Glycans play important roles in the function of glycoproteins in human body. Currently, the detail structure analysis is challenging due to the time-consuming and labor-intensive glycan analysis procedure, which usually includes multi-step sequential treatments, HPLC or electrophoreses purification, and mass spectrometry analysis. We have found the Shimadzu AXIMA-ResonanceTMALDI-QIT-TOF- MSn to be a very powerful platform for the analysis of the glycan sequences without multistep separation or enzymatic treatment. This helps us monitor the oxidization of glycans and better understand their roles as disease biomarkers.
Why are you interested in this research? What is the goal?
Currently there are many unmet needs, including clinical (benefits to patients, impact on clinical outcomes, etc.) and scientific knowledge for the biology of diseases. There are also unmet technical needs, including analytical performance, automation, and operational issues for clinical laboratory, such as reliability, higher throughput, faster results.
As we address these unmet needs, we have a positive impact on human health. Better disease biomarkers enable earlier detection, which translates into saved lives. Our ultimate goals are early detection (screening) of aggressive cancer, prognosis with clinical outcomes, and development of predictive biomarkers for targeted or immune therapy which are more effective and less toxic (i.e. precision medicine and “companion diagnostics”).
Dr. Daniel Chan in the Johns Hopkins Hospital Clinical Chemistry Laboratory

Insight from Customer
5
1. Füzéry AK, Levin J, Chan MM and Chan DW. Translation of proteomic biomarkers into FDA approved cancer diagnostics: issues and challenges. Clin Proteomics 2013, 10:13.
2. Sartori DA and Chan DW. Biomarkers in prostate cancer: what's new? Curr Opin Oncol 2014, 26(3): 259-64.
3. Li, D and Chan DW. Proteomic cancer biomarkers from discovery to approval: it's worth the effort. Expert Rev Proteomics 2014, 11(2):135-6.
4. Serum fucosylated prostate-specific antigen (PSA) improves the differentiation of aggressive from non-aggressive prostate cancers. Li QK, Chen L, Ao MH, Chiu JH, Zhang Z, Zhang H, Chan DW. Theranostics. 2015 Jan 1;5(3):267-76.
5. Comprehensive analysis of protein glycosylation by solid-phase extraction of N-linked glycans and glycosite-containing peptides. Sun S, Shah P, Eshghi ST, Yang W, Trikannad N, Yang S, Chen L, Aiyetan P, Höti N, Zhang Z, Chan DW, Zhang H. Nat Biotechnol. 2016 Jan;34(1):84-8.
Here are his recent publications:
What are Shimadzu’s strengths compared to other vendors (not limited to the instruments)?
In addition to the aforementioned performance characteristics, we have found Shimadzu to provide excellent technical and service support. The local support provided by Shimadzu Scientific Instruments individuals like Alan Brasel, Ricky Ciner, Thomas Russell, Chris Gilles, Brian Feild and Scott Kuzdzal have kept our labs operating at peak efficiency.
Also, while Shimadzu has always provided innovative solutions, we have recently seen a new focus on innovation within Shimadzu. I was a keynote speaker at the Shimadzu Solution Center Grand Opening in February, 2014, in Columbia, MD. I am excited to see the new Innovation Center that is also being developed at SSI. With a great influx of talented engineers like Hikaru Shibata and Tairo Ogura at SSI, we see a bright future for Shimadzu and new, innovative platforms.
Finally, could you share any requests that you have with respect to analytical and measuring instrument vendors?
It was significant to know what you think of us and our collaboration. We will strive to meet your request more than ever. Thank you very much.
Our clinical laboratory relies on automated platforms that operate with high throughput. Shimadzu mass spectrometers have come a long way in terms of ease of use. But these analytical instruments must become even simpler- push-button analyzers with increased multiplexing and assay-specific software.
I recently visited Shimadzu Corporation in Kyoto, Japan, and I was very impressed with your new CLAM-2000 clinical lab automation module. This is exactly the type of liquid handling/sample preparation integration that clinical laboratories need. We hope to play a role as a voice of North American clinical key opinion leaders in the development of these new platforms, as well as continue our fruitful clinical research collaborations.
Also, the Shimadzu LCMS-8040 and LCMS-8050 triple quadrupole mass spectrometers in our labs have proven to be extremely reliable instruments for new clinical diagnostic assay development. Shimadzu has engineered mass spectrometers with ultra-fast acquisition and polarity switching speeds, yet exquisite sensitivity at these ultra-fast speeds. This uncompromised solution enables greater assay throughput and drastically reduced assay development times.
Prof. Daniel Chan, Drs Hui Zhang and Yuan Tian in front of
their Shimadzu AXIMA Resonance (2009)
Dr. Stefani Thomas, Research Associate at the Johns Hopkins School of Medicine
in front of the Shimadzu LCMS-8040 triple quadrupole mass spectrometer (2015)

6
Glycan Analysis
Analysis of Glycan Structures Using Chemical Labeling andMALDI MSn Mass Spectrometry
Yan Li 1, Scott A. Kuzdzal 2, Daniel W. Chan 3, Hui Zheng 3
Glycans play important roles in the function of glycoproteins in human body. Currently, the detail structure analysis is challenging due to the
time-consuming and labor-intensive glycan analysis procedure, which usually includes multi-step sequential treatments, HPLC or electrophoreses
purification, and mass spectrometry analysis.
Background:
In this study, an AXIMA-Resonance™ was used to generate MALDI-IT-TOF- MSn spectra for the analysis of the glycan sequences without
multistep separation or enzymatic treatment. We used MSn mass spectrometry to monitor the oxidization of glycans.
Methods:
The MSn data showed that mild oxidation condition specifically oxidized sialic acid. Combining the carbohydrate oxidation reaction and MSn
analysis, we were able to monitoring the oxidization reaction for sialylation and linkages of oligosaccharides.
Results:
Abstract
1. Methods and Results
a. b.
Fig. 1 Schematic diagram of glycan oxidation
Peroxidate oxidizes and cleaves vicinal diols to carbonyl compounds
m/z = (M+H+)
Glycoproteins
Glycopeptides
Proteolysis
Glycan Releasing
Add matrix
Separation
Ionization
FragmentationPeptides + Glycans
Peptides Glycans
m/z = (M+H+)-2H m/z = (M+H+) m/z = (M+H+)-CH2OH-H
Adjusting peroxidate concentration allows for selectively oxidation
of sialic acid groups at the end of carbohydrate chains
Fig. 2 Schematic diagram of mass spectrometry for highly specific analysis of glycans and glycoproteins
Analyzer
Detector
Ion trap
Sample plate
1 Biophysics of Chinese Academy of Sciences, Beijing, China 2 Shimadzu Scientific Instruments, Columbia, MD, USA3 Johns Hopkins University School of Medicine, Baltimore, MD, USA

7
Glycan Analysis
Fig. 3 The MS spectra has shown the reaction products under different oxidation conditions
Fig. 4 Identify glycan structures of 1337 and 1339 using MSn
Table 1 The m/z of four oligosaccharides, G1-G4, and their oxidized products.
The MS spectra showed the reaction product under different oxidation conditions.
Monitoring the Oxidation Reaction Conditions Using MSn Detection
Four oligosaccharides
One monosaccharide oxidized
Two monosaccharides oxidized
Three monosaccharides oxidized
Four monosaccharides oxidized
(M+H+)
933.318
931.302
929.286
N/A
N/A
1339.476
N/A
N/A
N/A
N/A
1663.582
1661.566
1659.550
N/A
N/A
2273.773
2241.731
2239.715
2211.705
2209.689
G1 G2 G3 G4
100
0
80
60
40
20
100
80
60
40
20
100
80
60
40
20
100
0
80
60
40
20
100
80
60
40
20
100
80
60
40
20
100
0
80
60
40
20
100
80
60
40
20
100
80
60
40
20
100
0
80
60
40
20
100
80
60
40
20
100
80
60
40
20
925 927 933 935 937 939 941 943 m/z
1655 1657 1659 1661 1663 1665 1667 1669m/z
2200 2220 2240 2260 2280 2300m/z
1335 1337 1339 1341 1343 1345 1347 m/z
933.24
931.23
933.26
929.26
933.29
1339.37
1339.40
1337.43
1663.54
1663.49
1663.551661.54
1659.53
2273.51
2273.74
931.28 1339.44
2273.73
2255.71
2255.67
2211.72
2211.64
2225.73
2225.66
2241.69
2241.76
Reaction conditions:
Four oligosaccharidesbefore oxidation
Oxidation with10 mM NaIO4, 4ºC,60 min in the dark
Mild condition:1 mM NaIO4 ,on the ice,15 min in the dark
MS2_1337
MS2_1339
Enlargement offragment peaks
Notes: The fragment ion peak 507 indicated one monosaccharide has been oxidized at man-man-man structure. However, It can’t identified which mannose has been oxidized based on current stage.
MS3_1339_1136

Glycan Analysis
8
• The mild oxidation condition was able to specifically oxidize sialic acid group at the end of carbohydrate chain. Thus, the sialylated glycans can
be determined.
• The MSn analysis was able to detect glycan composition and sequencing information without labeling and glycosidase treatment.
• The MSn data was able to indicate the oxidized sites and linkages of glycan s.
Summary
1. Zhang H, Li XJ, Martin DB, Aebersold R. Nat Biotechnol. 2003, 21(6), 660-666.
2. Tian Y, Zhou Y, Elliott S, Aebersold R, Zhang H. Nat Protoc. 2007, 2(2), 334-339.
3. Van Lenten L. and Ashwell. J. G. Biol. Chem. 1971, 246, 1889–1894
References
Fig. 5 The list of identified structures of glycans and their oxidized products using MSn detection of oxidized glycans
929
1659 1661 1663 2269 2271 2273
931 933 1337 1339
Indicate one of oxidized carbohydrate

Neuroscience
9
The Grand Challenge to Understand the Brain: Neuroimaging by functional near-infrared spectroscopy
Of all the challenges in the life sciences, understanding the brain is at the top of the list. The brain is the most complex organ of the body with over 100,000,000,000 (billion) neurons along with other cells that make more than 100,000,000,000,000 (trillion) connections. These connections are modulated by a multiplicity of neural chemical factors that span spatial scales starting with molecules, and progressing to cells, circuits, systems, and finally leading to behavior including cognitive processes, emotions, perceptions, memories, and goal directed actions. The worldwide prevalence of brain disorders at all stages of human development, from birth to end-of-life, constitutes significant medical, political, economic, legal, and quality of life issues. Nonetheless, the brain, in health and disease, remains a scientific frontier.
The urgency of this widespread and unmet medical need alongside recent advances in neuroscience, however, has inspired the hopeful vision that a comprehensive understanding of the brain is a realistic goal. This vision has recently been focused into an action plan in the United States referred to as the BRAIN (Brain Research through Advancing Innovative Neurotechnologies) initiative. The initiative was launched on April 2, 2013 by U.S. President Barack Obama who announced a Grand Challenge to “accelerate the development and application of new technologies that will enable researchers to produce dynamic pictures of the brain that show how individual brain cells and complex neural circuits interact at the speed of thought” (The White House, 2013). Subsequently, the National Institutes of Health (NIH) formulated a 10-year plan to achieve the primary objective of accelerating the development of technology for acquiring fundamental insights about how the nervous system functions in health and disease. A starting point for the BRAIN initiative is focused on the neural circuits in the brain including characterization of the component cells, synaptic connections, and dynamic ensembles of activity associated with behavior. This overarching objective spans multiple scales of investigation ranging from the molecular and cellular processes that govern short-range neural circuits to long-range processes that govern complex behaviors observed by neuroimaging of humans.
A primary objective targeted for this initiative encompasses both the improvement of existing technologies and the development of entirely new technologies that interrogate and model relationships between brain mechanisms and behaviors. Existing technologies for brain mapping, predominantly using magnetic resonance imaging (MRI) and electromagnetic techniques such as magnetoencephalography (MEG) and electroencephalography (EEG), are foundational for the investigation of the human brain under normal and pathological conditions. These technologies have contributed extensively to a major branch of neuroscience focused on the correlation of functional brain activity with cognition and behavior. In particular, the explosive growth in brain imaging technologies has led to an operational understanding of specialized neural processes associated with complex cognitive behaviors such as human language, memory, decision-making, vision and auditory processes, emotions, learning and social interactions.
In general, the neural and physiological components that underlie these systems are 1) localized to specific brain regions and short-range neural circuits that receive and transmit information, and 2) are interconnected by long-range pathways between the participating brain regions. Thus, two principles of brain organization emerge. The first is the principle of segregation where specific regions of brain are dedicated to specific tasks and processing, and the second is the principle of integration where co-active regions in the brain are interconnected under specific task demands. For example, in the case of the human language system, a region located in the left superior temporal gyrus, often referred to as Wernicke’s area, is specialized for receptive functions of language (understanding and interpreting spoken words). Additionally, a region located in the left inferior frontal gyrus, often referred to as Broca’s Area, is specialized for productive language functions (production of speech). These two complexes of specialized brain regions are interconnected by well-known pathways, including the arcuate fasciculus and the arcuate uncinate, that transmit
Imaging the human brain in action
Primarily due to the constraints of studying brain processes using magnetic resonance imaging (MRI) technologies, mainstream neuroimaging has been limited to studies of single individuals. Natural interpersonal interaction between two individuals is not possible in a scanner environment. However, communication in real time involves verbal and non-verbal exchanges including eye-to-eye contact, dynamic facial expressions, and responsive gestures. These implicit communication cues do not occur in a scanning environment including only one individual, although interactive social behavior involving dynamic communications between two individuals is a fundamental aspect of human socialization. Largely due to these technological limitations, little is known about the underlying neural circuits that regulate and modulate natural interpersonal interactions and communication. Consequently, the neurophysiological mechanisms of psychiatric conditions with potentially profound deficits related to social interactions (e.g., autism spectrum disorders, schizophrenia, anxiety, and depression) remain undefined. The development of new technologies for brain imaging during communication between two individuals in ecologically valid conditions presents a particularly impactful opportunity to address the needs of large clinical populations for which the information gleaned through traditional neuroimaging is insufficient (Schilbach et al., 2013).
Technological advances
Joy Hirsch, PhD, Professor of Neurobiology and Psychiatry, Yale School of Medicine
information relevant to the processes of understanding language and producing speech. Other brain areas that are widely recognized as essential for memory and emotion become functionally connected to the language system during specific tasks. The dynamic relationships among these interacting areas during language–related operations have been extensively studied using contemporary neuroimaging techniques.

Neuroscience
10
An emerging neuroimaging technology, functional near-infrared spectroscopy (fNIRS), uses optodes secured in a cap worn on the head and is suitable for simultaneous use on multiple subjects in natural situations without intolerance to head movement. Like MRI, NIRS enables the observation of working neural systems in individual subjects without toxicity due to ionization. This technology takes advantage of the physiological principle that active neural tissue recruits oxygenated blood in greater proportions than non-active neural tissue. The paramagnetic effects of deoxyhemoglobin (deOxyHb) are reduced within the local micro vasculature during this recruitment process. The signal amplification in MRI referred to as the blood oxygen level-dependent (BOLD) signal (Ogawa et al., 1990) is due to the reduced proportion of deOxyHb and the resultant decrease in paramagnetic effects. The BOLD signal is also detected by NIRS using spectral absorption (Jöbsis, 1977) which differentiates oxyhemoglobin, OxyHb, and deOxyHb signals. Pulsed lasers (using the Shimadzu NIRS systems) emit 3 wavelengths of light and detectors measure the changes in oxygenated hemoglobin (OxyHb) and deoxygenated hemoglobin (deOxyHb) concentrations. For each channel, the absorption of near-infrared light at 780, 805, and 830nm is measured and converted to corresponding concentration changes for deOxyHb, total Hb (HbT), and OxyHb (Matcher & Cooper, 1994) respectively according to the modified Beer-Lambert Law (Fig. 1).
Shimadzu Corporation (Kyoto, Japan) is a leading manufacturer of fNIRS systems. Figure 2 shows a Shimadzu LABNIRS configuration specialized for hyperscanning in which signals are acquired
A foundational new role for near-infrared spectroscopy (NIRS)
Fig. 1 Absorption spectra for deoxyhemoglobin and oxyhemoglobin. The functions
illustrate a maximum absorption difference between OxyHb and deOxyHb at
780nm and 830nm. Oxygen concentrations in cerebral blood affect the
wavelengths of light that are reflected. The modified Beer-Lambert Law is
used to convert direct measurements of light attenuation at three
wavelengths that correspond to concentration changes in deOxyHb (780nm),
total hemoglobin (805nm), and OxyHb (830nm).
Fig. 2 fNIRS system (LABNIRS, Shimadzu Corp.) in the Brain Function Laboratory
at the Yale School of Medicine. Participants using the LABNIRS system
are shown with SMI (ETG-2) eye-tracking glasses.
Fig. 3 Illustrated anti-correlation of OxyHb (red) and deOxyHb (blue) signals during a finger thumb-tapping task for a single run, single subject, single channel without
smoothing using the Shimadzu LABNIRS system (white arrow).
simultaneously for two individuals who are engaged in an interactive task. This particular system enables the acquisition of real-time NIRS signals and eye-tracking acquisitions using SMI glasses with scene and pupil cameras synchronized to the neural signals. In this example, each cap includes 42 channels divided into two hemispheres for each subject. Cap configurations are flexible and can be modified according to experimental aims. Acquisition rates for NIRS signals range from 10 to 33 ms with spatial resolution of approximately 3 cm. This temporal resolution is well-suited for measures of connectivity between active brain regions within and across brains, but compared to fMRI, relatively compromised with respect to spatial resolution.
Both fMRI and fNIRS signals reflect changes in brain blood flow and blood oxygenation, which are coupled to underlying neuronal activity. The latter has been well established as recently demonstrated by Eggebrecht and colleagues (Eggebrecht et al., 2012) during visual stimulation in healthy volunteers. The high positive correlation between fMRI BOLD with deOxyHb and OxyHb is now well-established (Sato et al., 2013; Scholkmann et al., 2014).
“Raw” fNIRS signals obtained during a finger thumb tapping task for a single subject, single run and single optode illustrate the acquisition of both OxyHb and deOxyHb signals in response to a task-related time series (Figure 3). Note the anti-correlation between the OxyHb and deOxyHb signals, consistent with theoretical expectations. Due to the known correspondence with neural (rather than cardiovascular) events, the deOxyHb signal is expected to be most closely related to fMRI BOLD signal (Franceschini et al., 2006).
Neuroscience
11
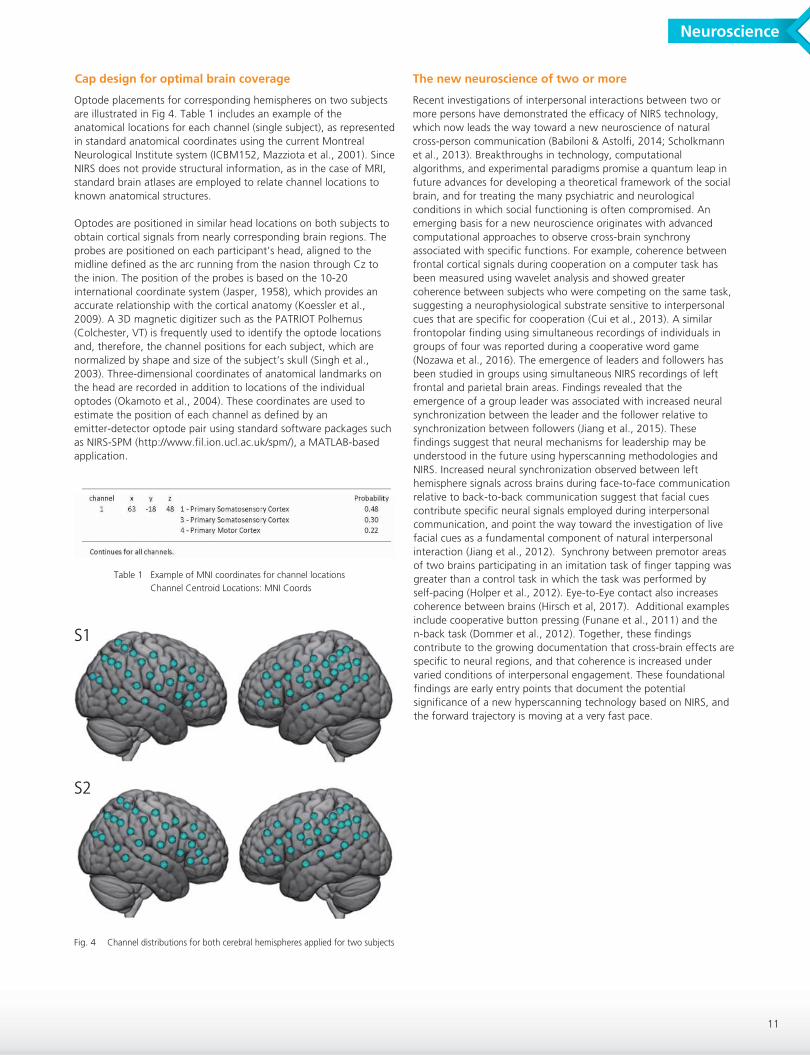
Optode placements for corresponding hemispheres on two subjects are illustrated in Fig 4. Table 1 includes an example of the anatomical locations for each channel (single subject), as represented in standard anatomical coordinates using the current Montreal Neurological Institute system (ICBM152, Mazziota et al., 2001). Since NIRS does not provide structural information, as in the case of MRI, standard brain atlases are employed to relate channel locations to known anatomical structures.
Optodes are positioned in similar head locations on both subjects to obtain cortical signals from nearly corresponding brain regions. The probes are positioned on each participant’s head, aligned to the midline defined as the arc running from the nasion through Cz to the inion. The position of the probes is based on the 10-20 international coordinate system (Jasper, 1958), which provides an accurate relationship with the cortical anatomy (Koessler et al., 2009). A 3D magnetic digitizer such as the PATRIOT Polhemus (Colchester, VT) is frequently used to identify the optode locations and, therefore, the channel positions for each subject, which are normalized by shape and size of the subject’s skull (Singh et al., 2003). Three-dimensional coordinates of anatomical landmarks on the head are recorded in addition to locations of the individual optodes (Okamoto et al., 2004). These coordinates are used to estimate the position of each channel as defined by an emitter-detector optode pair using standard software packages such as NIRS-SPM (http://www.fil.ion.ucl.ac.uk/spm/), a MATLAB-based application.
Cap design for optimal brain coverage
Recent investigations of interpersonal interactions between two or more persons have demonstrated the efficacy of NIRS technology, which now leads the way toward a new neuroscience of natural cross-person communication (Babiloni & Astolfi, 2014; Scholkmann et al., 2013). Breakthroughs in technology, computational algorithms, and experimental paradigms promise a quantum leap in future advances for developing a theoretical framework of the social brain, and for treating the many psychiatric and neurological conditions in which social functioning is often compromised. An emerging basis for a new neuroscience originates with advanced computational approaches to observe cross-brain synchrony associated with specific functions. For example, coherence between frontal cortical signals during cooperation on a computer task has been measured using wavelet analysis and showed greater coherence between subjects who were competing on the same task, suggesting a neurophysiological substrate sensitive to interpersonal cues that are specific for cooperation (Cui et al., 2013). A similar frontopolar finding using simultaneous recordings of individuals in groups of four was reported during a cooperative word game (Nozawa et al., 2016). The emergence of leaders and followers has been studied in groups using simultaneous NIRS recordings of left frontal and parietal brain areas. Findings revealed that the emergence of a group leader was associated with increased neural synchronization between the leader and the follower relative to synchronization between followers (Jiang et al., 2015). These findings suggest that neural mechanisms for leadership may be understood in the future using hyperscanning methodologies and NIRS. Increased neural synchronization observed between left hemisphere signals across brains during face-to-face communication relative to back-to-back communication suggest that facial cues contribute specific neural signals employed during interpersonal communication, and point the way toward the investigation of live facial cues as a fundamental component of natural interpersonal interaction (Jiang et al., 2012). Synchrony between premotor areas of two brains participating in an imitation task of finger tapping was greater than a control task in which the task was performed by self-pacing (Holper et al., 2012). Eye-to-Eye contact also increases coherence between brains (Hirsch et al, 2017). Additional examples include cooperative button pressing (Funane et al., 2011) and the n-back task (Dommer et al., 2012). Together, these findings contribute to the growing documentation that cross-brain effects are specific to neural regions, and that coherence is increased under varied conditions of interpersonal engagement. These foundational findings are early entry points that document the potential significance of a new hyperscanning technology based on NIRS, and the forward trajectory is moving at a very fast pace.
The new neuroscience of two or more
Fig. 4 Channel distributions for both cerebral hemispheres applied for two subjects
Table 1 Example of MNI coordinates for channel locations
Channel Centroid Locations: MNI Coords
S1
S2

Neuroscience
12
In our early studies of simultaneous cross-brain interactions during face-to-face communication between pairs of healthy adults, dyads alternated between talking and listening about pictures of objects in 15 second epochs. These epochs were structured and determined the turns between speaking and listening. Neural activity from signals acquired under monologue/dialogue and face-to-face/occluded conditions was compared for pairs of subjects. Run times of three minutes were partitioned into twelve 15 second epochs. The hypothesis was that regions of brain associated with talking and listening would increase within-brain and cross-brain synchrony during dialogue compared to monologue. For each epoch a single picture of an object was presented on a monitor and was viewed by each subject. Tasks were run under face-to-face conditions and occluded-face conditions (in which subjects had no view of their partner). Structured Monologue Task: In the first instance, subject 1 identifies the picture object and provides a spoken narrative that relates to the object. Subject 2 listens, but does not respond. The next epoch is cued by the presentation of a new picture. Subject 2 names the object and provides a spoken narrative about it while subject 1 listens. This exchange of talking and listening continues for 3 min and is illustrated in Fig. 5.Structured Dialogue Task: The structured dialogue task is identical to the structured monologue task except that the speaker includes a response to the narrative of the previous speaker. The expectation is that the dialogue condition will reveal upregulation of language systems during the face-to-face condition due to variations in the intensity of the dynamic interactions.
Analyses aimed at understanding conventional task-related, single-brain functional connectivity effects confirm the neural salience of dialogue in face-to-face interaction. A measure of functional connectivity between remote regions of brain shows that synchrony during a dialogue compared to monologue is increased. In particular, a psychophysiological interaction, PPI (Friston et al., 1997) analysis where fusiform Gyrus, a face-sensitive region of brain (Kanwisher et al., 1997) is selected as a seed confirms that dialogue during face-to-face gaze increases the strength of neural covariations between Wernicke and Broca’s Area (Fig 7). Findings confirm expectations of the canonical language system with increased connectivity between Broca’s and Wernicke’s Areas during face-to-face dialogue.
What happens when two brains talk to each other?
Functional connectivity within-brain during dialogue > monologue: Using General Linear Model and Psychophysiological Interaction (PPI) analysis techniques.
The internal (within-brain) functional connectivity findings predict that these regions will also resonate across brains during face-to-face conditions. Cross-brain coherence (Fig 8A) for dialogue (red) and monologue (blue) conditions is plotted against wavelet kernels from the decomposed signals acquired at each channel. All possible pairs of brain regions across the two brains were considered in an unbiased manner. Significant differences between brain-to-brain coherence were found between the dialogue and monologue conditions only for the Broca-Wernicke pair of regions for kernel ranges centered around 6.34 secs (x–axis). Cross-brain coherence between putative functions of language production (Broca’s Area) and language reception (Wernicke’s Area) is consistent with these findings and with expectations based on current understanding of these areas (Fig 8B) (Jiang et al., 2012).
Coherence Across Brains during dialogue>monologue: Cross-brain coherence (using wavelet comparisons) to investigate brain-to-brain interactions.
Fig. 6 fNIRS signals for single channels: 12, dorsolateral prefrontal cortex (DLPFC,
top row) and 18, Frontopolar cortex (bottom row) show anti-correlated
signals from homologous locations of two interacting subjects, S1 and S2,
during speaking and listening. The graphs show average signals for OxyHb
(middle column) and deOxyHb (right column) and demonstrate the
expected anti-correlation between subjects in the pairs corresponding to
the alternating roles of the subject (listening versus talking) and the
anti-correlation between OxyHb and deOxyHb signals.
Fig. 5 Monologue and dialogue paradigms
Fig. 7 Within-brain functional connectivity (PPI) during dialogue > monologue
and mutual face-to-face gaze. The seed is fusiform (green) and connected
regions (p ≤ 0.05) are Broca’ s Area (-55, 20, 16) and Wernicke’ s Area
(-48, -36, 40) deOxyHb signals. (Hirsch, J., Noah, A., Zhang, X., Yahil, S.,
Lapborisuth, P., & Biriotti, M. (2014, October). Neural specialization for
interpersonal communication within dorsolateral prefrontal cortex: A NIRS
investigation. Presentation at the Annual Meeting of the Society for
Neuroscience, Chicago, Illinois, USA.)
Fig. 6 Illustrates the anti-correlation between signals originating from regions sensitive to talking and listening for both subjects, S1 and S2. The deOxyHb and OxyHb signals are anti-correlated within each channel for each subject as expected for fNIRS signals (See absorption spectra and example above).

Neuroscience
13
Functional NIRS is a rapidly growing neuroimaging technology that has doubled the number of publications every 3.5 years over the past 20 years (Boas et al., 2014), and the current trajectory is exponential. The major development areas include instrumentation, analysis methods, and optimization of experimental procedures for applications in mainstream areas of conventional neuroscience including neuro-development, perception and cognition, motor control, and psychiatric and neurological disorders and treatments. Recent applications for neurofeedback (Lapborisuth, et al, 2017) and adult cognitive neuroscience of conflict (Noah, et al, 2017) illustrate these new directories.However, the primary advantages of fNIRS are related to signal acquisitions in natural environments not constrained by the limitations of a high magnetic field and uncomfortable imaging conditions that restrict head motion and communication. These advantages position fNIRS as a potential leading technology for a new frontier in neuroscience that aims to understand the neural correlates of social behavior and cross-brain interpersonal interactions (Pinti et al., 2015; Noah et al., 2015; Hirsch et al, 2017). Most of the pieces are in place for the realization of this major advance. The key development priorities toward this specific end goal include: 1) computational algorithms focused on signal components that represent the neural contributions of the signal separate from systemic and other non-neural components (Kirilina et al., 2012; Zhang et al., 2016); 2) full head coverage of optodes to acquire the dynamic activity of underlying long-range neural circuits; and 3) multimodal systems that synchronize combined acquisitions of EEG, fNIRS, and eye-tracking measurements (for example) for a comprehensive report of long-range brain mechanisms. The co-occurrence of the BRAIN initiative and the emergence of fNIRS as a mainstream neurotechnology catalyzes the impactful potential to probe untapped neural systems specialized for interpersonal interactions between two or more individuals.
Where do we go from here? These studies, illustrate potential future directions to investigate the dynamic relationships between interacting human brains using fNIRS and hyperscanning techniques. Additionally, the language hyperscanning studies document that well-known functional neural anatomy such as the components of the language system are observable using fNIRS, and that the additional features of cross-brain coherence and synchrony between two individuals can be investigated as novel probes to characterize uncharted questions that underlie the neural events of social interaction. These studies also confirm the advantages of technology that populates the surface of the head with full head coverage (Zhang, et al, 2016: Zhang, et al, 2017; Dravida, et al, 2017). Since neural systems depend upon signal cooperation between multiple areas (the integration principle) the most successful NIRS technology will depend upon sampling brain function over the entire brain. Potential benefits include a landmark breakthrough in methodology and technology leading to principles of neural organization engaged during interpersonal and reciprocal interactions. Future studies may apply these new techniques to further understand the neural underpinnings of disorders of communication as well as how the neural underpinnings of social disability in developmental disorders deviate from typical development.
Fig. 8 Coherence analysis of cross-brain synchronization. A. Coherence is plotted for the deOxyHb fNIRS signals for Wernicke’ s and Broca’ s Areas (WA and BA)
during monologue (blue line) and dialogue (red line) conditions, indicating a significantly higher synchrony during dialogue than monologue (p < 0.005), and was
observed only for the face-to-face condition. Findings were bilaterally significant across pairs of subjects and unbiased with respect to regions of interest. B. These
coherence findings are specific to Broca’ s and Wernicke’ s areas (group data). (Hirsch, J., Noah, A., Zhang, X., Yahil, S., Lapborisuth, P., & Biriotti, M. (2014,
October). Neural specialization for interpersonal communication within dorsolateral prefrontal cortex: A NIRS investigation. Presentation at the Annual Meeting of
the Society for Neuroscience, Chicago, Illinois, USA.)

Neuroscience
14
Babiloni, F., & Astolfi, L. (2014). Social neuroscience and hyperscanning techniques: past, present and future. Neuroscience & Biobehavioral Reviews, 44, 76-93.Boas, D. A., Elwell, C. E., Ferrari, M., & Taga, G. (2014). Twenty years of functional near-infrared spectroscopy: Introduction for the special issue. Neuroimage, 85, 1-5.Cui, X., Bryant, D. M., & Reiss, A. L. (2012). NIRS-based hyperscanning reveals increased interpersonal coherence in superior frontal cortex during cooperation. Neuroimage, 59(3), 2430-2437.
Dravida, S., Noah, J. A., Zhang, X., & Hirsch, J. (2017). Comparison of oxyhemoglobin and deoxyhemoglobin signal reliability with and without global mean removal for digit manipulation motor tasks. Neurophotonics, 5(1), 011006. doi: doi:10.1117/1.NPh.5.1.011006Eggebrecht, A. T., White, B. R., Ferradal, S. L., Chen, C., Zhan, Y., Snyder, A. Z., ... & Culver, J. P. (2012). A quantitative spatial comparison of high-density diffuse optical tomography and fMRI cortical mapping. Neuroimage, 61(4), 1120-1128.Franceschini, M. A., Joseph, D. K., Huppert, T. J., Diamond, S. G., & Boas, D. A. (2006). Diffuse optical imaging of the whole head. Journal of Biomedical Optics, 11(5), 054007-054007.Friston, K. J., Buechel, C., Fink, G. R., Morris, J., Rolls, E., & Dolan, R. J. (1997). Psychophysiological and modulatory interactions in neuroimaging. Neuroimage, 6(3), 218-229.
Hirsch, J., Zhang, X., Noah, J. A., & Ono, Y. (2017). Frontal temporal and parietal systems synchronize within and across brains during live eye-to-eye contact. Neuroimage, 157, 314–330. doi: 10.1016/j.neuroimage.2017.06.018Holper, L., Scholkmann, F., & Wolf, M. (2012). Between-brain connectivity during imitation measured by fNIRS. Neuroimage, 63(1), 212-222.Jasper, H. H. (1958). The ten twenty electrode system of the international federation. Electroencephalography and Clinical Neurophysiology, 10, 371-375.Jiang, J., Dai, B., Peng, D., Zhu, C., Liu, L., & Lu, C. (2012). Neural synchronization during face-to-face communication. The Journal of Neuroscience, 32(45), 16064-16069.Jiang, J., Chen, C., Dai, B., Shi, G., Ding, G., Liu, L., & Lu, C. (2015). Leader emergence through interpersonal neural synchronization. Proceedings of the National Academy of Sciences, 112(14), 4274-4279.Jöbsis, F. F. (1977). Noninvasive, infrared monitoring of cerebral and myocardial oxygen sufficiency and circulatory parameters. Science, 198(4323), 1264-1267.Kanwisher, N., McDermott, J., & Chun, M. M. (1997). The fusiform face area: a module in human extrastriate cortex specialized for face perception. The Journal of Neuroscience, 17(11), 4302-4311.Kawasaki, M., Yamada, Y., Ushiku, Y., Miyauchi, E., & Yamaguchi, Y. (2013). Inter-brain synchronization during coordination of speech rhythm in human-to-human social interaction. Scientific reports, 3, 1692.Kirilina, E., Jelzow, A., Heine, A., Niessing, M., Wabnitz, H., Brühl, R., ... & Tachtsidis, I. (2012). The physiological origin of task-evoked systemic artefacts in functional near infrared spectroscopy. Neuroimage, 61(1), 70-81.Koessler, L., Maillard, L., Benhadid, A., Vignal, J. P., Felblinger, J., Vespignani, H., & Braun, M. (2009). Automated cortical projection of EEG sensors: Anatomical correlation via the international 10–10 system. Neuroimage, 46(1), 64-72.Lapborisuth, P., Zhang, X., Noah, A., & Hirsch, J. (2017). Neurofeedback-based functional near-infrared spectroscopy upregulates motor cortex activity in imagined motor tasks. Neurophotonics, 4(2), 021107. doi: 10.1117/1.NPh.4.2.021107
References
Matcher, S. J., & Cooper, C. E. (1994). Absolute quantification of deoxyhaemoglobin concentration in tissue near infrared spectroscopy. Physics in Medicine and Biology, 39(8), 1295.Mazziotta, J., Toga, A., Evans, A., Fox, P., Lancaster, J., Zilles, K., ... & Holmes, C. (2001). A probabilistic atlas and reference system for the human brain: International Consortium for Brain Mapping (ICBM). Philosophical Transactions of the Royal Society of London B: Biological Sciences, 356(1412), 1293-1322.Noah, J. A., Ono, Y., Nomoto, Y., Shimada, S., Tachibana, A., Zhang, X., ... & Hirsch, J. (2015). fMRI validation of fNIRS measurements during a naturalistic task. Journal of Visualized Experiments: JoVE, (100).Noah, J. A., Dravida, S., Zhang, X., Yahil, S., & Hirsch, J. (2017). Neural correlates of conflict between gestures and words: A domain-specific role for a temporal-parietal complex. PLoS One, 12(3), e0173525. doi: 10.1371/journal.pone.0173525Nozawa, T., Sasaki, Y., Sakaki, K., Yokoyama, R., & Kawashima, R. (2016). Interpersonal frontopolar neural synchronization in group communication: An exploration toward fNIRS hyperscanning of natural interactions. NeuroImage, 133, 484-497.Ogawa, S., Lee, T. M., Kay, A. R., & Tank, D. W. (1990). Brain magnetic resonance imaging with contrast dependent on blood oxygenation. Proceedings of the National Academy of Sciences, 87(24), 9868-9872.Okamoto, M., Dan, H., Sakamoto, K., Takeo, K., Shimizu, K., Kohno, S., ... & Dan, I. (2004). Three-dimensional probabilistic anatomical cranio-cerebral correlation via the international 10–20 system oriented for transcranial functional brain mapping. Neuroimage, 21(1), 99-111.Pinti, P., Aichelburg, C., Lind, F., Power, S., Swingler, E., Merla, A., ... & Tachtsidis, I. (2015). Using Fiberless, Wearable fNIRS to Monitor Brain Activity in Real-world Cognitive Tasks. Journal of Visualized Experiments: JoVE, (106).Sato, H., Yahata, N., Funane, T., Takizawa, R., Katura, T., Atsumori, H., ... & Fukuda, M. (2013). A NIRS–fMRI investigation of prefrontal cortex activity during a working memory task. Neuroimage, 83, 158-173.Schilbach, L., Timmermans, B., Reddy, V., Costall, A., Bente, G., Schlicht, T., & Vogeley, K. (2013). Toward a second-person neuroscience. Behavioral and Brain Sciences, 36(04), 393-414.Scholkmann, F., Holper, L., Wolf, U., & Wolf, M. (2013). A new methodical approach in neuroscience: Assessing inter-personal brain coupling using functional near-infrared imaging (fNIRI) hyperscanning. Frontiers in Human Neuroscience, 7(813), 10-3389.Scholkmann, F., Kleiser, S., Metz, A. J., Zimmermann, R., Pavia, J. M., Wolf, U., & Wolf, M. (2014). A review on continuous wave functional near-infrared spectroscopy and imaging instrumentation and methodology. Neuroimage, 85, 6-27.Singh, M., Kim, S., & Kim, T. S. (2003). Correlation between BOLD‐fMRI and EEG signal changes in response to visual stimulus frequency in humans. Magnetic Resonance in Medicine, 49(1), 108-114.The White House, Office of the Press Secretary. (2013). Remarks by the President on the BRAIN Initiative and American Innovation [Press release]. Retrieved from https://www.whitehouse.gov/the-press-office/2013/04/02/remarks-president-brain-initiative-and-american-innovationZhang, X., Noah, J. A., & Hirsch, J. (2016). Separation of the global and local components in functional near-infrared spectroscopy signals using principal component spatial filtering. Neurophotonics, 3(1), 015004-015004.Zhang, X., Noah, J. A., Dravida, S., & Hirsch, J. (2017). Signal processing of functional NIRS data acquired during overt speaking. Neurophotonics, 4(4), 041409. doi: doi:10.1117/1.NPh.4.4.041409

15
Selection 1 Clinical research
LC-MS/MS quantitative method development of Herceptin based on selective hydrolysis (nSMOL) technology and Skyline softwareHerceptin is approved for the treatment of early-stage breast cancer that is Human Epidermal growth factor Receptor 2-positive (HER2+) and has spread into the lymph nodes, or is HER2-positive and has not spread into the lymph nodes. With the wide use of Herceptin in clinic, the requirement is increasing for precision and accuracy in quantitative analysis of Herceptin in human plasma. With the development of high performance liquid phase, mass spectrometry and separation technology in biological samples, LC-MS/MS technology has been used for protein quantity study. Relative to conventional analytical technology ELISA, LC-MS/MS quantitative method improved the precision and accuracy of protein analysis. For the close combination of protein quantitative technology and drug development, Shimadzu combined LC-MS/MS analysis platform and proteomics software "Skyline". And we also developed nSMOL pretreatment technology for selective enzymolysis of Fab zone in monoclonal antibody. Thus, LC-MS/MS combining with Skyline software and nSMOL technology can provide useful tool for the accurate quantity of monoclonal antibody drugs.
Selection 2 Clinical research
Highly sensitive quantitative analysis of Budesonide from plasma using LC/MS/MSBudesonide is a glucocorticoid used in the management of asthma, treatment of various skin disorders, and allergic rhinitis. Budesonide is provided as a mixture of two epimers (22R and 22S). Interestingly, the 22R form is two times more active than the 22S epimer. The two forms do not interconvert.
Inflammation is an important component in the pathogenesis of asthma. Corticosteroids like budesonide have been shown to have a wide range of inhibitory activities against multiple cell types (e.g., mast cells, eosinophils, neutrophils, macrophages, and lymphocytes) and mediators (e.g., histamine, eicosanoids, leukotrienes, and cytokines) involved in allergic and non-allergic-mediated inflammation. These anti-inflammatory actions of budesonide contribute to their efficacy in the aforementioned diseases. Budesonide undergoes significant first-pass elimination and its bioavailability is 10 %, which demands its low-level quantitation in plasma for bioanalysis. Budesonide is formulated as an extended release tablet and inhalers.
Here, an LC/MS/MS method has been developed for highly sensitive quantitation of budesonide from plasma using LCMS-8060, a triple quadrupole mass spectrometer from Shimadzu Corporation, Japan.
Selection 3 Clinical research
Highly sensitive simultaneous quantitative analysis of estrone and equilin from plasma using LC/MS/MS
Equilin is an estrogenic steroid produced by horses. It has a total of four double bonds in the A- and B-ring. High concentration of equilin is found in the urine of pregnant mares. Equilin is one of the estrogens present in the mixture of estrogens isolated from horse urine and marketed as Premarin. Premarin became the most commonly used form of estrogen for hormone replacement therapy in the United States of America. Estrone is the major estrogen in Premarin (about 50%) and equilin is present as about 25% of the total. Estrone is a major estrogen that is normally found in women. Equilin is not normally present in women, so there has been interest in the effects of equilin on the human body.Here, an LC/MS/MS method has been developed for highly sensitive simultaneous quantitation of estrone and equilin (structure shown in Figure 1) from charcoal stripped plasma using LCMS-8060, a triple quadrupole mass spectrometer from Shimadzu Corporation, Japan.
Selection 4 Clinical research
MRM-based validation assay for serum proteomic alterations in meningioma patientsMeningiomas are tumors that arise from the outer layering of the brain namely the dura, arachnoid and pia mater. These tumors account for nearly 30% of all primary brain tumors and are majorly treated via surgical resection. WHO classifies meningiomas into three types namely the benign (MGI), atypical (MGII) and anaplastic (MGIII). Recently there are reports of aggravated recurrence rates and diagnostic ambiguity within the grades and certain molecular signatures have been ascribed to such manifestation.However apart from the conventional modalities of treatment there are no molecular markers that can be used for diagnosis and prognosis of these tumors. In this study we attempt to validate differentially expressed proteins in meningioma patients and assess its utility in context to meningioma pathobiology.
These articles were selected by Shimadzu. Relating to clinical research, they derive from posters presented at ASMS 2017, held June 4-8 in Indianapolis, IN. They feature Shimadzu's state-of-the-art mass spectrometry lineup and include cutting-edge technologies.
Posters from Recent Conferences

Selection 5 Clinical research
High-sensitivity and simultaneous analysis of Psychoactive drugs using LC-MS/MS with full-automat-ed pretreatment systemLC-MS/MS has become a preferred method for the routine analysis for forensic toxicology. LC-MS/MS allows for the simultaneous analysis of multiple compounds in a single run, thus enabling a fast and high throughput analysis. In recent years that it seems the number of incident and accident is increasing caused by dosed with psychotropic drugs and the number of drug testing with LC-MS/MS is also increasing to investigate the cause of death. However, manual sample preparation often involves several complicated manual steps which can introduce error into the results. In this study, we investigated the processing capability to analyze serum, whole blood and urine spiked sixty psychotropic drugs by LC-MS/MS with automated sample preparation unit.
Selection 6 Clinical research
Strategies for Multiple-Target Screening using LC-MS/MS with Merged Spectrum Database for Forensic Toxicology
In Forensic Toxicology, LC/MS/MS has become a preferred method for the routine quantitative and qualitative analysis of drugs of abuse. LC/MS/MS allows for the simultaneous analysis of multiple compounds in a single run, thus enabling a fast and high throughput analysis. In this study, we developed Multiple-Target Screening (MTS) method for forensic toxicology to reduce false positive and negative using MS/MS spectral library database. MTS method consists of multiple reaction monitoring (MRM) and product ion scans at three collision energies to confirm the compound identification based on mass spectral library searching. The mass spectral library was created using certified reference materials from over 1,200 compounds for forensic toxicology.
Selection 8 Clinical research
Determination of Unbound Urinary Amino Acids Incorporated with Creatinine Normalization by LC-MS/MS Method with CLAM-2000 Online Sample Pre-treatment
Free or unbound amino acids are important metabolites in human blood and urine [1]. The profile of unbound amino acids in urine are the reference indication of metabolic imbalances and amino acid transport disorders as well as dietary protein adequacy and assimilation. Creatinine produced by muscle metabolism is excreted in the urine, which can be used to normalize the metabolite levels to compensate the large variation due to different intakes of water and fluid food [2-4]. The aim of this study is to develop a reliable LC-MS/MS method for quantitation of 22 free amino acids and creatinine in urine samples. A derivatization-free LC-MS/MS amino acid method [5] with stable isotope labelled IS was employed. An on-line sample pre-treatment module CLAM-2000 coupled with LC-MS/MS makes the analysis fully-automated, which enables from adding internal standards, sample and solvent mixing, shaking for protein-crash and filtration to transferring the final sample solution to LC-MS/MS for analysis.
Selection 9 Clinical research
A Novel Platform of On-line Sample Pre-treatment and LC/MS/MS Analysis for Screening and Quantitation of Illicit Drugs in Urine
In recent years, LC/MS/MS methods are adopted in analyses of illicit and prescription drugs in toxicological samples such as urine and serum. Sample pre-treatment is always a critical step in the whole analysis procedure and on-line sample pre-treatment is desired not only for improving analysis throughput, but also minimizing human errors. The CLAM-2000 module is designed for on-line sample pre-treatment in high throughput LC/MS/MS analysis of drugs and metabolites in biological samples such as plasma/serum and urine. Many sample preparation process can be performed automatically such as dispensing solvents, sample-reagent mixing by vortexing, sample filtering by vacuum filtration, and sample derivatisation with heating. Internal standard and reagent for derivatization or other purposes can be added to a sample before or after protein crash. We describe development of an automated sample pre-treatment using a Shimadzu CLAM-2000 module coupled with Shimadzu LCMS-8040 TQ system. It involves IS addition, protein precipitation, filtration and transferring the final solution to LC/MS/MS for analysis. This new platform was applied and evaluated for quantitation of 18 illicit drugs with 14 isotope-labelled internal standards (IS).
Selection 7 Clinical research
Analytical method development for widely targeted perfluoroalkyl acids (PFAAs) and their precursors in plasma using multi-gradient eluent system by LC-MS/MS
As perfluoroalkyl acids (PFAAs) had been widely used because of their excellent surfactant. While the product and usage of perfluorooctane sulfonic acid (PFOS), its salts and perfluorooctane sulfonyl fluoride (PFOS-F) were restricted by the Stockholm Convention in 2009, many kinds of precursors which cause PFAAs by decomposition keep being used because they are not restricted.LC-MS/MS analysis methods for PFAAs have been developed, where a high selectivity analysis is available, but it was very difficult to implement the simultaneous analysis of PFAAs and their precursors since the wideness of their chemical property in terms of hydrophilic / hydrophobic.This time, we developed the analytical method for widely targeted PFAAs and their precursors in plasma using multi-gradient eluent system by LC-MS/MS.

Selection 10 Clinical research
Quantitative Analysis of β-Lactam Antibiotics in Human Plasma by High Sensitivity LC/MS/MS MethodThe β-lactam type antibiotics are used in the treatment of various bacterial infections in human over decades. One of the consequences of continuous uses of antibiotics is the progressive development of drug resistance of bacteria in human [1]. Therapeutic Drug Monitoring (TDM) aims at obtaining pharmacokinetic pattern of an antibiotic in patient to develop personalized medicine treatment. Conventional TDM methods such as immunoassays are well-established. However, one of the drawbacks of immunoassays is lack of specificity due to cross-reactivity with metabolites, which may give false positives [2,3]. Recently, LC/MS/MS has been used for fast and direct measurement of β-lactam antibiotics such as amoxicillin [4] and piperacillin, etc. [5,6] in human plasma. In this application news, a fast LC/MS/MS method with a simple sample pre-treatment procedure for quantitative analysis of five β-lactam antibiotics, meropenem (MER), tazobactam (TAZ), piperacillin (PIP), cefepime (CEF) and ceftazidime (CFT) is described. A small injection volume of sample of this MRM-based method is required only, which minimizes the contamination of sample matrix, as such, reducing the cleaning and maintenance time of the interface of LC/MS/MS in clinical research work
Selection 11 Clinical research
Solid Phase Extraction and SFC-MS/MS Method for Analysis of Aflatoxins M1, M2, B1, B2, G1 and G2 in Milk Powders
Aflatoxins B1, B2, G1 and G2 are secondary metabolites that are produced by Aspergillus fungi. If aflatoxins B1 and B2 are present in feeds consumed by lactating animals, they can be converted to hydroxylated metabolite aflatoxins M1 and M2 in the animals respectively, which are found eventually in the milk [1]. Aflatoxins B1, B2, G1, G2 are carcinogenic and aflatoxin M1 is potentially carcinogenic. The levels of these aflatoxins in dairy products like milk powders are strictly regulated around the world. For example, European Union regulation limits aflatoxin M1 in milk below 0.050 µg/kg [2]. Many LC/MS/MS methods were reported for analysis of aflatoxins B1, B2, G1, G2 and M1, but few including aflatoxin M2 [4]. In addition, sample preparation method is varied for different matrixes and is often a critical factor to the analysis sensitivity and accuracy. The aim of this study is to develop a novel method - supercritical fluid chromatography SFC-MS/MS for high sensitivity analysis of aflatoxins B1, B2, G1, G2, M1 and M2 in milk powders. The supercritical fluid (SF) CO2 mobile phase has advantages of cost-effective and environmental friendly as compared to organic solvents. A special sample preparation procedure was explored, which involved extraction with adding Q-Sep extract salt and purification with Supel™ Tox Alfazea SPE cartridge. Conventional SPE uses the concept of binding target compounds to the stationary phase first and eluted out by organic eluent subsequently. However, Supel™ Tox Alfazea SPE cartridge acts as a filter where the sample matrix is trapped while the target aflatoxins are eluted out.
Selection 12 Clinical research
A High Sensitivity LC/MS/MS Method for Quantitative Analysis of Eight Antifungal Drugs in Human SerumTriazoles and echinocandins are commonly used for the treatment of invasive fungal infections via systemic antifungal chemotherapy. However, these drugs exhibit substantial pharmacokinetic variability in patients such as bioavailability and drug-drug interactions [1,2]. Clinicians often find it challenging to select proper drug doses and evaluate the potential toxicity effects. Therapeutic drug monitoring (TDM) of antifungals is essential to maximise the efficacy and minimise drug overdose risk in patients, hence individualising the treatment [3]. In this study, we aim at developing a fast and reliable LC/MS/MS method with high sensitivity and simple sample pre-treatment. The method is established for simultaneous determination of two classes of antimycotic compounds, five triazoles and three echinocandins in human serum. The method performance is evaluated with spiked serum samples thoroughly before further implementation and validation with clinical samples.
Selection 13 Clinical research
Quantitative clinical toxicological screening comparing Library ID from production scan MS/MS to MRM spectrum-mode ID.
Forensic toxicological sample measurement is commonly performed in a targeted analysis on selected panels of compounds. When using triple quadrupole platforms for analysis, typically two MRMs are used for compound measurement with a quantifier ion transition and reference ion transition. To help reduce false positive and false negative reporting two alternative approaches have been considered; MRM triggered product ion spectrum and MRM Spectrum mode. MRM Spectrum mode acquires a high number of fragment ion transitions for each target compound generating a fragmentation spectra that could be used in routine library searching and compound verification using reference library match scores. In this work, we compare different approaches in target quantitation and identification applied to clinical and forensic toxicology.
Selection 14 Clinical research
Toxicological screening for over 1,000 compounds in an MRM based acquisition for Library ID in whole blood samples
A library of product ion spectra for 1,222 compounds has been developed for clinical and forensic toxicology screening to help reduce false positive and false negative reporting. The library enables multi-targeted methods to be developed for routine screening, library identification and quantitation. The scope of the library considers two approaches; a MRM triggered full scan product ion spectra and MRM Spectrum mode. MRM Spectrum mode acquires a high number of fragment ion transitions for each target compound generating a fragmentation spectra which can be used in routine library searching and compound verification using reference library match scores. In this work, MRM Spectrum mode has been applied to analysis of patient samples to quantify and identify targets in whole blood samples extracted using a QuEChERS method.
Bioanalysis
Application of LC-MS/MS analysis for time-lapsemetabolomics in CHO cell culture
Han-Hsiu Hsu 1, Tomohisa Hasunuma 2, Michihiro Araki 2, Takanobu Yoshida 2, Yoshimi Hori 2, Masahiro Murata 2, Akihiko Kondo* 2
1 IGENOMIX JAPAN K.K., L Ningyocho 4F, 2-7-10 Nihonbashi Ningyocho, Chuo-ku, Tokyo, 103-0013, Japan2 Department of Chemical Science and Engineering, Graduate School of Engineering, Kobe University, 1-1 Rokkodaicho, Nada-ku, Kobe 657-8501, Japan
Abstract
1. Introduction
Regulating the rate of protein production in Chinese hamster ovary (CHO) cells is an important consideration in reducing the cost of biopharmaceutical industry. Methodologies such as microarrays and proteomics, which have been extensively reviewed (Griffin et al., 2007), offer the prospect of examining the molecular phenotypes underlying productivity in CHO and their application in bioprocess research. Moreover, liquid chromatography-mass spectrometry (LC-MS)-based intracellular metabolic analysis plays an important role for CHO cell metabolic characterization for antibody production (Chong et al., 2012) and host cell protein production (Yuk IH et al., 2015). Analytical methods for central metabolism pathways (CMPs) such as glycolysis and TCA cycle were reported (Judith Wahrheit et al., 2014). In this study, we further analyzed intracellular amino acid and metabolites concerned with CMPs by LCMS-8050 (SHIMADZU) in CHO-K1 cell batch culture. Time-lapse correlativity calculation was used to observe the changes of metabolite pool size from day 0 to 5. All data were visualized by Pathpod, a pathway mapping system developed by Araki et al. We suggest that our result provide a useful option for animal cell metabolic analysis.
3. Results
Cell proliferationCHO-K1 cell proliferation was recorded by morphology and cell count (Fig. 1). Cells were seeded by 2×10⁶ cells/flask and stand 24 h for adhesion (Fig. 1 A). 100% confluence was observed at day2 (Fig. 1 B). Result of cell number showed that CHO cells proliferation increased at day 0, 1, and 2, while decreased at day 3, 4, and 5 (Fig. 1 C).
Changes of intracellular metabolitesThe relative amount of intracellular amino acid and metabolites concerned with CMPs was observed by time-lapse LC-MS/MS analysis (Fig. 2). In this study, the results of following metabolites in Table 2 were extracted. Amino acids, including alanine, arginine, asparagine, aspartic acid, citrulline, glycine, histamine, histidine, leucine, lysine, phenylalanine, proline, serine, threonine, tryptophan, tyrosine, cysteine, and glutamic acid were observed and compared with metabolites concerned with TCA cycle, glycolysis, amino acid metabolism, and lactate metabolism such as adenylo-succinate, arginino-succinic acid, 3-phosphoglyceric acid, citric acid, fumaric acid, lactic acid, malic acid, succinic acid, fructose 6-phosphate, glucose
2. Experimental
Cell culture and samplingCHO-K1 cells were cultivated in 75T Cell Culture Flask (BD Falcon) by Ham’s F-12 Nutrient Mixture medium (Gibco) with 10% fetal bovine serum (Biosera), 100U penicillin, and 100 µg/ml streptomycin (penicillin-streptomycin mixture, Nacalai). 2×10⁶ freeze stocked (Cellbanker) cells were seeded for pre-culture, and medium was changed at 24 h, followed by continuous cultivation at 37°C. Cell samples were collected after pre-culture (24 h), and each 24-hour after medium change (day 1 to day 5).
LC-MS/MS AnalysisIntracellular metabolites were analyzed by LCMS-8050 (SHIMADZU), by reported methodology (William et al, 2012) with slight modifica-tions. Briefly, 2×10⁶ CHO-K1 cells at day 0, 1, 2, 3, 4, and 5 of cultivation were obtained and quenched with five volumes of ice-cold 150 mM NaCl, and centrifuged at 1,300 g for 3 min at -5°C. Supernatant was discarded and the cell pellet was suspended in 200 µl
Metabolic analysis of Chinese hamster ovary (CHO) cell culture plays an important role for the efficient production of biopharmaceutical industry. Understanding CHO cellular metabolism including gene expression and coordination among various metabolic pathways and protein productions is vital for the production of biopharmaceuticals. Recently, analytical methods for metabolic pathways such as glycolysis and TCA cycle have been reported. This study further analyzed amino acids concerned with these pathways by LC-MS/MS, LCMS-8050 (SHIMADZU), for time-lapse metabolic analysis of CHO-K1 cell batch culture. Temporal correlativity of each metabolite was calculated and visualize by pathway mapping system, Pathpod, developed by Araki et al. Our results showed real-time changes of various metabolites during CHO culture, which may provide extensively and speedy investigational analysis for genomic and metabolic modifications in biopharmaceutical or medical progresses.
of ice-cold methanol and 100 µl of chloroform, followed by vortex. 450 µl of cold methanol/3.8 mM tricine (9:1, v/v) mixture and 250 µl of chloroform were added sequentially. Well mixed solution was centrifuged at 18,000 g for 20 min at 0°C, followed by transferring 300 µl of the methanol-aqueous layer into a new 1.5 ml tube. Sample extract was evaporated by drying by vacuum centrifugation for 8 h and diluted with 100 µl of 20% methanol-water solution (v/v). 3 µl of sample extract was injected into UHPLC-MS/MS system for analysis, with conditions listed in Tables 1 and 2 (n×3). Whole acquisition method lasted for 35 minutes.
Data processing and metabolic mappingFrom the results of LC-MS/MS analysis, data of metabolites concerned with amino acid metabolism were extracted and calculated as ratio amounts to day 0, visualized by bar chart. Correlativity of each metabolite in earlier period (day 0 to 2, phase I) and later period (day 3 to 5, phase II) was calculated by time-lapse Pearson's correlation coefficient, and visualized by PathPod pathway mapping system (http://bp.scitec.kobe-u.ac.jp/pathpod/).
18

19
Bioanalysis
1-phosphate, glucose 6-phosphate, glycerol 3-phosphate, and sedoheptulose 7-phosphate (Fig. 2). All data is shown in relative amount compared to each metabolite amount at day 0. These results indicated that amino acids, including arginine, citrulline, cysteine, histamine, and lysine, showed over twice amount compared to day 0 during cultivation.
Time-lapse correlation and Pathpod mappingAccording to cultivation results (Fig. 1 C), two proliferation phases were observed, including phase I (day 0 to 2, growth phase) and phase II (day 3 to 5, non-growth phase). Correlativity of time-lapse patterns in each phase of each metabolite in Fig. 2 were calculated and shown by Pathpod mapping (Fig. 3). Our results indicated that most metabolites in CMPs showed positive correlations (red), while most amino acids showed negative correlations (blue) between each proliferation phases, except asparagine, aspartate, and glutamine.
A B C
0
5
10
15
20
25
day0 day1 day2 day3 day4 day5
Cell number
106
Fig. 1 CHO-K1 cell cultivationCHO-K1 cell appearances were observed at day 0 (A) and day 2 (100% confluence, B). Cells were counted every 24-hour (n×3), with cell number showed by the vertical axis (×106) (C). Scale= 200 µm
Table 1 UHPLC and LC-MS/MS conditions
Fig. 2 LC-MS/MS results at day 0, 1, 2, 3, 4, and 5LC-MS/MS results were shown in average relative value compares to pre-culture (day 0), as the results of each metabolite at day 0 were set to 1 (n×3). Data of day 0, 1, 2, 3, 4, and 5 were shown by each colors listed in the box, respectively.
0
1
2
3
4
5
6
7
day0 day1 day2
day3 day4 day5
ColumnMobile phase AMobile phase BFlow rateTime program
Column temp.
UPLC conditions (Nexera X2 system)
Discovery HS F5-3 (2.1 mm I.D. × 150 mmL, 3 µm), Sigma-Aldrich0.1% Formic acid in water0.1% Formic acid in Acetonitrile0.25 mL/minB conc. 0% (0-2.0 min) - 25% (5.0 min) - 35% (11.0 min) - 95% (15.0 min) - 95% (20.0 min) - 0% (20.1min) - 0% (35.0 min)40°C
IonizationIon source temp.GasesMRM TransitionsPause time
MS conditions (LCMS-8050)
ESIDesolvation line: 250°C Heater block: 400°C Interface : 300°CNebulization: 3.0 L/min Drying : 10.0 L/min Heating : 10.0 L/minSee Table 23 msec

20
Bioanalysis
Table 2 MRM Transitions for MS
Conpound name m/z Qualifier ion Scan time (min) Conpound name m/z Qualifier ion Scan time (min) 4-Hydroxyproline 132.10>86.05 132.10>68.05 3.239 2-Aminobutyric acid 104.10>58.05 104.10>41.05 4.763Alanine 89.90>44.10 3.403 2-Ketoglutaric acid 144.90>101.10 144.90>57.05 5.750Arginine 175.10>70.10 175.10>60.10 5.000 4-Aminobutyric acid 104.10>87.05 104.10>45.10 5.000Asparagine 133.10>87.15 133.10>28.05 3.199 Aconitic acid 172.90>85.05 172.90>129.10 5.000Aspartic acid 134.00>74.05 134.00>88.10 3.197 Adenylsuccinic acid 464.10>252.10 464.10>162.00 5.000Citrulline 176.10>70.05 176.10>159.05 3.463 Argininosuccinic acid 291.00>70.10 291.00>116.05 5.861Cystathionine 223.00>88.05 223.00>134.00 3.230 Cholic acid 407.20>343.15 407.20>345.25 5.000Cysteine 122.00>76.05 122.00>59.00 3.349 Citric acid 191.20>111.10 191.20>87.05 5.000Cystine 241.00>151.95 241.00>73.90 3.156 Fumaric acid 115.00>71.10 115.00>26.95 5.000Cytosine 112.00>95.10 5.000 Isocitric acid 191.20>111.10 191.20>73.00 5.000Dimethylglycine 104.10>58.05 104.10>44.05 3.405 Lactic acid 89.30>89.05 4.977Glutamic acid 147.90>84.10 147.90>56.10 3.404 Malic acid 133.10>114.95 133.10>71.15 4.628Glutamine 147.10>84.15 147.10>130.10 5.000 Nicotinic acid 124.05>80.05 124.05>78.05 5.000Glycine 75.90>30.15 3.171 Ophthalmic acid 290.10>58.10 290.10>161.10 5.000Histidine 155.90>110.10 155.90>56.10 4.949 Orotic acid 155.00>111.10 155.00>42.10 4.469Homocysteine 136.00>90.10 136.00>56.10 5.000 Pantothenic acid 220.10>90.15 220.10>72.05 5.000Homocystine 269.00>136.05 269.00>88.00 5.000 Pyruvic acid 86.90>87.05 86.90>42.95 4.803Isoleucine 132.10>86.20 132.10>69.15 5.000 Succinic acid 117.30>73.00 117.30>99.05 5.000Leucine 132.10>86.05 132.10>30.05 5.000 Taurocholic acid 514.20>107.10 514.20>124.05 5.000Lysine 147.10>84.10 5.000 Uric acid 167.10>123.95 167.10>96.20 5.000Methionine 149.90>56.10 149.90>104.10 5.000Ornitine 133.10>70.10 133.10>116.05 4.840Phenylalanine 166.10>120.10 166.10>103.10 5.000 Conpound name m/z Qualifier ion Scan time (min) Proline 116.10>70.15 116.10>28.05 4.707 Allantoin 157.00>97.10 157.00>42.05 3.254Serine 105.90>60.10 3.209 Hypoxanthine 137.00>55.05 137.00>110.00 5.000Symmetric dimethylarginine 203.10>70.15 203.10>71.10 5.000Threonine 120.10>74.15 120.10>56.05 3.237Tryptophan 205.10>188.15 205.10>146.10 5.000 Conpound name m/z Qualifier ion Scan time (min) Tyrosine 182.10>136.10 182.10>91.10 5.000 Acetylcholine 147.10>87.05 147.10>88.05 5.000Valine 118.10>72.15 118.10>55.05 5.000 Choline 104.10>60.05 104.10>45.10 5.000
Conpound name m/z Qualifier ion Scan time (min) Conpound name m/z Qualifier ion Scan time (min) Carnitine 162.10>103.05 162.10>60.10 5.000 5-Glutamylcysteine 251.10>84.10 251.10>122.10 5.000Dopa 198.10>152.10 5.000 Carnosine 227.10>110.05 227.10>156.05 5.000Kynurenine 209.10>192.05 209.10>94.10 5.000 Glutathione 308.00>179.10 5.000S-Adenosylhomocysteine 385.10>134.00 385.10>136.05 5.000 Oxidized glutathione 611.10>306.00 611.10>143.05 5.000S-Adenosylmethionine 399.10>250.05 399.10>136.10 5.000Serotonin 177.10>160.10 177.10>77.05 5.000
Conpound name m/z Qualifier ion Scan time (min) Creatinine 114.10>44.05 5.000
Conpound name m/z Qualifier ion Scan time (min) Adenosine 3',5'-cyclic monophosphate 330.00>136.05 330.00>119.10 5.000Adenosine monophosphate 348.00>136.05 348.00>97.10 5.000 Conpound name m/z Qualifier ion Scan time (min) Citicoline 489.10>184.10 489.10>264.05 3.421 Dopamine 154.10>91.05 154.10>137.05 5.000Creatine 132.10>44.05 132.10>90.05 5.000 Epinephrine 184.10>166.10 184.10>77.00 5.000Cytidine 3',5'-cyclic monophosphate 306.00>112.10 5.000 Norepinephrine 170.10>152.15 170.10>107.10 5.000Cytidine monophosphate 324.00>112.05 324.00>95.00 4.531Guanosine 3',5'-cyclic monophosphate 346.00>152.05 346.00>135.05 5.000Guanosine monophosphate 364.00>152.05 364.00>135.00 4.912 Conpound name m/z Qualifier ion Scan time (min) Thymidine monophosphate 322.90>81.10 322.90>207.10 5.000 Niacinamide 123.10>80.05 123.10>53.10 5.000
Conpound name m/z Qualifier ion Scan time (min) Conpound name m/z Qualifier ion Scan time (min) Adenosine 268.10>136.05 268.10>119.00 5.000 Adenine 136.00>119.05 136.00>65.00 5.000Cytidine 244.10>112.05 244.10>95.00 5.000 Guanine 150.00>133.00 150.00>66.10 5.000Guanosine 284.00>152.00 284.00>135.00 5.000 Thymine 127.10>54.05 127.10>110.05 5.000Inosine 269.10>137.05 269.10>118.95 5.000 Xanthine 151.00>108.00 151.00>42.00 5.000Thymidine 243.10>127.10 5.000Uracil 113.00>70.00 5.000Uridine 245.00>113.05 5.000 Conpound name m/z Qualifier ion Scan time (min)
Cysteamine 78.10>61.05 5.000
Conpound name m/z Qualifier ion Scan time (min) Histamine 112.10>95.05 112.10>41.05 5.000
Conpound name m/z Qualifier ion Scan time (min) FAD 786.15>136.10 786.15>348.10 5.000FMN 455.00>97.00 455.00>78.90 5.000NAD 663.10>541.05 663.10>540.10 5.000
Conpound name m/z Qualifier ion Scan time (min) Acetylcarnitine 204.10>85.05 204.10>60.10 5.000
Lipid
Vitamine
Base
Amino acid derivative
Amine derivative
Coenzyme
Amino acid
Nucleotide
Organic acid
Nucleoside
Aminothiol
Purines
Choline
Peptide
Lactam
Catecholamine

21
Bioanalysis
Fig. 3 PathPod pathway mapping systemPearson's product-moment correlation coefficient (R) results of tendencies in LC-MS/MS results of day 0, 1, 2 (growth phase) and day 3, 4, 5 (non-growth phase) were inputted to Pathpod mapping system. Correlativity values of each metabolite were flagged by large red nodes (R > 0.8), red nodes (0.8 > R > 0.2), green nodes (0.2 > R > -0.2), blue nodes (-0.2 > R > -0.8), and large blue nodes (-0.8 > R).

22
Bioanalysis
Discussion and conclusion
We have developed a metabolic methodology by using LCMS-8050 (SHIMADZU) and Pathpod pathway mapping system, to analyze the changes and temporal pattern correlativity of comparative intracellular metabolite amounts. Our results indicated that most amino acids showed negative correlations in the comparison of intracellular metabolic temporal patterns between growth phase and non-growth phase, except asparagine, aspartate, and glutamine. Based on the carbohydrate analysis in CMPs including glycolysis and TCA cycle reported by other studies, amino acid metabolism additionally provides information for animal cell cultivation and biopharmaceutical industry.
References
Griffin TJ, Seth G, Xie HW, Bandhakavi S, Hu WS. Advancing mammalian cell culture engineering using genome-scale technologies. Trends in Biotechnology.2007 Sep;25(9):401-8.
Chong WP, Thng SH, Hiu AP, Lee DY, Chan EC, Ho YS. 2012. LC-MS-based metabolic characterization of high monoclonal antibody-producing Chinese hamster ovary cells. Biotechnology and Bioengineering.2012 Dec;109(12):3103-11
Yuk IH, Nishihara J, Walker D Jr, Huang E, Gunawan F, Subramanian J, Pynn AF, Yu XC, Zhu-Shimoni J, Vanderlaan M, Krawitz DC.More similar than different: Host cell protein production using three null CHO cell lines.Biotechnology and Bioengineering. 2015 Oct;112(10):2068-83
Wahrheit J, ,Niklas J, Heinzle E. Metabolic controlatthecytosol–mito-chondriainterfaceindifferent growthphasesofCHOcells. Metabolic Engineering.2014 May;23:9-21

Shimadzu Global Innovation Summit 2017- IMAGINE, INNOVATE & INSPIRE –
Shimadzu Corporation held its first Global Innovation Summit in Kyoto, Japan, July 4th & 5th, 2017. The event brought together over 100 scientists from 16 countries in the fields of analytical chemistry and medical diagnostics including 11 Key Opinion Leaders (KOL) who spoke about their application of Shimadzu products to research pressing issues in the areas of human health, food safety and environmental conservation.
Topics
23
Advancements in global health have benefited tremendously from innovations in scientific methodologies and instrumentations. For more than a century, Shimadzu has contributed to these innovations through the development of state-of-the-art analytical instruments and technologies that are being used around the global.
As a company whose corporate philosophy is "Contributing to Society through Science and Technology", Shimadzu realizes that to fulfill its mandate, it is essential to listen to its users, which is why its inaugural Global Innovation Summit took place at the company headquarters in Kyoto.
"We have many good scientists and engineers. However, it is not easy to develop solutions, so we decided to collaborate with more researchers," said Shuzo Maruyama, General Manager of the Analytical and Measuring Instruments Division at Shimadzu Corpora-tion.
The number and diversity of laboratories in which Shimadzu instrumentation can be found has grown significantly as the company has expanded its range of equipment to include mass spectrometry, imaging, and chromatography, to name a few, for the study of omics science, the safety and quality of food, production of biofuels, and many other scientific fields.
The summit invited 11 KOL from leading universities and national institutes throughout the world and included (in alphabetical order):
- Professor Yi Chen (Chinese Academy of Sciences, China) - Professor Eiichiro Fukusaki (Osaka University, Japan) - Dr. Hisataka Kobayashi (National Cancer
Institute/National Institute of Health, U.S.) - Professor Hian Kee Lee (National University of Singapore, Singapore) - Professor Erich Leitner (Graz University of Technology, Austria) - Associate Professor Michelle McIntosh (Monash University, Australia) - Associate Professor Alex J. Rai (Columbia University College of Physicians and Surgeons, U.S.) - Professor Kevin A. Schug (University of Texas at Arlington, U.S.) - Associate Professor Sanjeeva Srivastava (Indian Institute of Technolo-gy, Mumbai, India) - Professor Sen Takeda (University of Yamanashi, Japan)- Dr. Chunhua Zhang (Matsumoto Institute of Life Science, Japan)
Many of the KOL work closely with Shimadzu Innovation Centers and Application Development & Support Center located across the world including, China, Germany, Singapore and the United States. These institutes were founded in response to numerous collaborations and are staffed by Shimadzu scientists and equipped with Shimadzu instrumentations. This has enabled Shimadzu to stay in touch on a daily basis with its partner scientists to push projects forward faster.
Dr. Leitner explains that it is initiatives like these that make his relationship with Shimadzu unique."I have been in the business for over three decades and personal contacts are really important to me. It makes a difference if you know the person. Shimadzu is starting to communicate much more. They try to speed up things in recent years."
The KOL talks at the two-day summit focused on biomarkers for cancer and other diseases, imaging modalities for precision surgery, and advanced methods to evaluated food and water quality, among other important state-of-the-art innovations.
However, the summit’s aim was not only to solve scientific problems but was also to bring together Team Shimadzu executives and independent scientists from different research interests to encourage new approaches towards their respective scientific problems.
"Shimadzu should be commended for creating a forum to bring together experts in all different fields. I have benefitted tremendously. I know there are at least three KOL and a couple of authors that I will continue conversation with," said Dr. Rai, who spoke about his research on the study of exosomes from the body to treat prostate cancer.
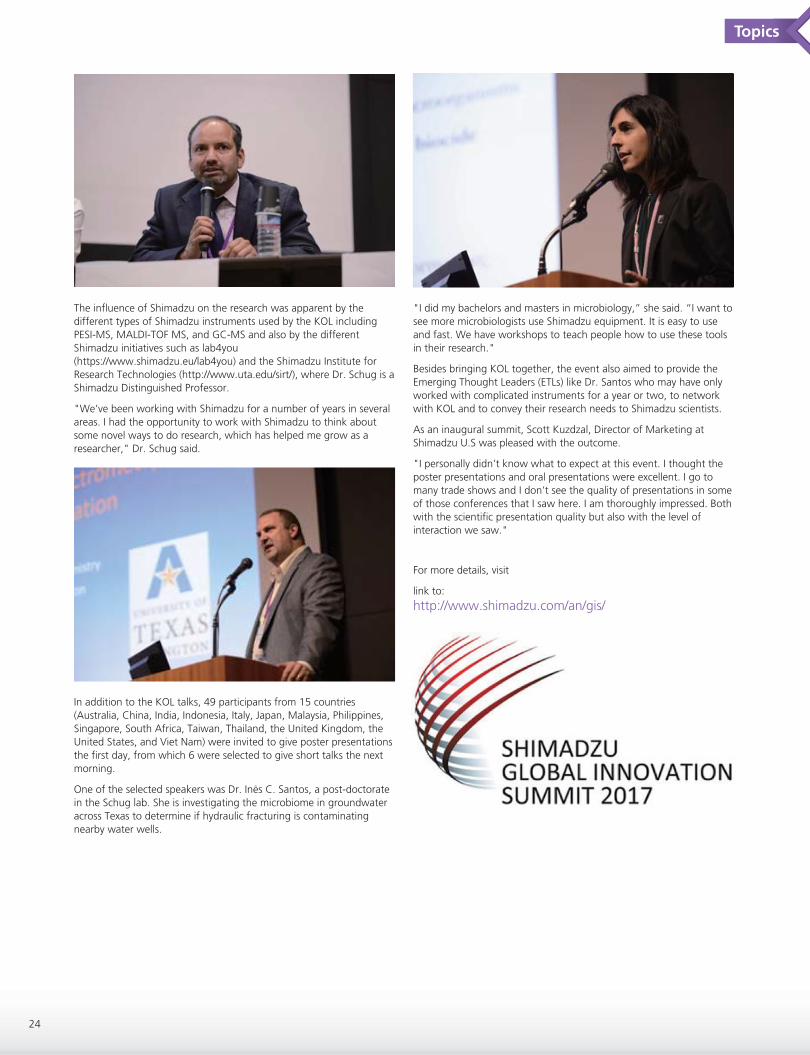
The influence of Shimadzu on the research was apparent by the different types of Shimadzu instruments used by the KOL including PESI-MS, MALDI-TOF MS, and GC-MS and also by the different Shimadzu initiatives such as lab4you (https://www.shimadzu.eu/lab4you) and the Shimadzu Institute for Research Technologies (http://www.uta.edu/sirt/), where Dr. Schug is a Shimadzu Distinguished Professor.
"We’ve been working with Shimadzu for a number of years in several areas. I had the opportunity to work with Shimadzu to think about some novel ways to do research, which has helped me grow as a researcher," Dr. Schug said.
In addition to the KOL talks, 49 participants from 15 countries (Australia, China, India, Indonesia, Italy, Japan, Malaysia, Philippines, Singapore, South Africa, Taiwan, Thailand, the United Kingdom, the United States, and Viet Nam) were invited to give poster presentations the first day, from which 6 were selected to give short talks the next morning.
One of the selected speakers was Dr. Ines C. Santos, a post-doctorate in the Schug lab. She is investigating the microbiome in groundwater across Texas to determine if hydraulic fracturing is contaminating nearby water wells.
Topics
24
"I did my bachelors and masters in microbiology,” she said. “I want to see more microbiologists use Shimadzu equipment. It is easy to use and fast. We have workshops to teach people how to use these tools in their research."
Besides bringing KOL together, the event also aimed to provide the Emerging Thought Leaders (ETLs) like Dr. Santos who may have only worked with complicated instruments for a year or two, to network with KOL and to convey their research needs to Shimadzu scientists.
As an inaugural summit, Scott Kuzdzal, Director of Marketing at Shimadzu U.S was pleased with the outcome.
"I personally didn’t know what to expect at this event. I thought the poster presentations and oral presentations were excellent. I go to many trade shows and I don’t see the quality of presentations in some of those conferences that I saw here. I am thoroughly impressed. Both with the scientific presentation quality but also with the level of interaction we saw."
For more details, visit
link to:
http://www.shimadzu.com/an/gis/

Topics
25
On June 6, Shimadzu Corporation starts to provide, at no cost, the
Shimadzu Multi-omics Data Analysis Pack. Intended for metabolic
engineering, this gadget pack automatically visualizes large-volume of
data sets from proteomics*1, metabolomics*2, and flux analysis*3,
obtained using Shimadzu gas chromatograph mass spectrometers and
liquid chromatograph mass spectrometers, on metabolic maps and
perform a variety of data analyses. Multi-omics is a cutting-edge
research area in the field of life sciences. It involves the integrated
analysis of changes in genes, proteins, metabolites and other
substances, towards a holistic elucidation of biological activities at
cellular level. Multi-omics is expected to be useful in a variety of fields
such as drug discovery, diagnostics, and biofuel research.
Mass spectrometers, a specialty of Shimadzu, are indispensable for
multi-omics research. In recent years, with the emergence of ultra-fast
mass spectrometers, the amount of data that can be obtained has
grown enormously. As a result, the data analysis process has become
a research bottleneck. Creating charts from quantitative trend data on
each metabolites and proteins and rendering the results visible on a
metabolic map, takes over ten hours even for experienced analysts.
Using this pack, the work can be reduced to a few minutes. The pack
frees researchers from tedious manual data analysis and visualization,
allowing them to focus on the discovery of new ideas and generation
of novel hypotheses.
Collaboration Between Shimadzu, The Systems Biology Institute,and Osaka University Starting the Provision ofan Open Platform Multi-omics Data Analysis Pack
Overview of This Pack
Research for creating substances with advanced functions utilizing microorganisms and cells, rather than chemical synthesis, has expanded in recent years in a variety of fields, including biofuels, pharmaceuticals, and food products for example. Advancement in gene editing techniques is further creating new avenues of research. In this direction of research, the effect of incorporating genes into microorganisms and cells is measured as changes in the concentrations of metabolites and metabolic enzymes. This pack significantly increases the efficiency of data analysis for these measurements.
This pack is available on the, Garuda Platform, an open, communi-ty-driven, connectivity and automation platform to connect, discover and navigate through various analytics tools, services and database (called gadgets on Garuda). The community version of the platform is available on the Garuda Alliance, and has been in operation since 2010, led by the Systems Biology Institute (SBI), a non-profit private research institution based in Tokyo. It provides an open platform to enable researchers to create a user defined workflow (called Garuda recipes), from data acquisition to data analysis, powered by an ever-increasing suite of inter-operable gadgets. Currently, the community version of the platform is in beta with more than 50 tools (gadgets) available freely, developed by the world's leading research agencies, along with customized gadgets available in commercial versions for specific businesses and organizations.
The Shimadzu multi-omics data analysis pack presents a collection of multiple gadgets that can be interfaced with existing gadgets on the
community version, creating a seamless user experience for complex data analysis and visualization workflows. This pack can be downloaded free of charge from a dedicated site on Garuda Alliance website (link available in later section). In the words of Dr. Hiroaki Kitano, President of SBI, "Connecting mass spectrometers directly with a variety of data analysis software programs developed by the world's top research agencies in the life science field is groundbreaking. This offers the possibility of stimulating a new research cycle."
This pack is one of the outcomes of collaborative research being pursued by Shimadzu with SBI and Osaka University, utilizing the Osaka University and Shimadzu Analytical Innovation Research Laboratory, an open innovation laboratory established by Shimadzu at Osaka University in December 2014. Fumio Matsuda, an associate professor with the Osaka University Graduate School of Information Science and Technology, developed an optimal workflow for research by combining multiple gadgets with this pack. In his words, "This pack simplified the visualization of metabolic measurement data, a conventionally tedious and time-consuming process. This improves the datability*4 of extracting useful information and knowledge from big data sets obtained from mass spectrometers. Increasing the productivity of research sites enables researchers to focus on interpreting the analysis results, leading to new valuables discoveries and creations."
In the words of Shuzo Maruyama, General Manager of the Analytical & Measuring Instruments Division at Shimadzu, "Development of life science research is progressing at rapid pace. We are no longer in an era when a single company can assess cutting edge needs and provide the solutions. We will work continuously with global research agencies in order to keep providing solutions to respond to potential user needs."
Future Plan
The latest results were announced at the annual conference of the American Society for Mass Spectrometry (Indianapolis, USA, June 4 to 8, 2017). This pack can be downloaded free of charge from http://www.garuda-alliance.org/gadgetpack/shimadzu starting on June 6. Utilizing feedback from users, a more sophisticated commercial edition is scheduled for release within the year.
The Garuda platform has deep integration with Garuda's proprietary artificial intelligence (AI) function, and provides interface to connect with other AI platforms. AI-based data analysis will also be possible in future extensions of this pack. Commercialization of a pack incorporating AI-based data analysis is scheduled during 2018.
*1: Research to comprehensively assess the structure and functions of proteins
*2: Research to comprehensively assess the metabolites produced by cellular activity
*3: A method of accurately tracking the amount of a single metabolite based on the difference between two values: the amount produced and the amount consumed
*4: This word was coined by combining "data" and "ability". It refers to the activity of extracting useful information and knowledge from ultra large amounts of data and utilizing it. It is a core concept in the data sciences.

Topics
26
Kyoto, Japan and Québec, Canada – June 5, 2017. Shimadzu, one of the world's fastest growing mass spectrometry companies, and Phytronix,
world leader in high throughput analysis in mass spectrometry, announced that they had signed an agreement to offer the industry’s first Triple
Ion Source. Ideal for both screening and confirmation work, this new high-speed platform will significantly improve productivity in high-through-
put laboratories performing toxicology, drug discovery and food safety applications. This Triple Ion Source incorporates the Phytronix LDTD (Laser
Diode Thermal Desorption Ion Source), and is designed in perfect synchronization with the speed of the Shimadzu LCMS-8060 triple quadrupole
mass spectrometer. Together, the companies presented information about this new design at ASMS in Indianapolis.
“This unique approach consisting of three modes of ionisation allows clients to rapidly switch between Liquid Chromatograph and LDTD
technologies without moving or disconnecting any component of the mass spectrometer. With a simple click, the scientist can select the best
way to develop, produce, screen and confirm their analysis. The speed of LDTD coupled to the speed of Shimadzu's LCMS-8060 mass
spectrometer offers the best of both worlds”, said Jean Lacoursière, President of Phytronix Technologies.
“Researchers have asked for LDTD technology to be fully integrated into our platform in order to achieve sample analysis in less than four
seconds, and we did it. The Ultra High Throughput LDTD ion source highlights the speed of Shimadzu’s LCMS-8060. With the world’s fastest
detection speed, the LCMS-8060 gives scientists the ability to work with a two-second sample-to-sample runtime without compromise,” said
Shuzo Maruyama, General Manager, Analytical & Measuring Instruments Division, Shimadzu Corporation.
Shimadzu Corporation and Phytronix Technologiessign an agreement to offer the first Triple Ion Source(LDTD-MS/MS, ESI-MS/MS and APCI-MS/MS).

New Productssuctsstsstsctsctsctctucucucuuucuuuducuuuew ProdueNe duduodroPrw Pw duododrodProProPrw Pw weweweweweNeNeNNNeNNNNeeeNeNNNNNNN
LC/MS/MS Method Package for D/L Amino Acids
The LC/MS/MS Method Package for D/L Amino Acids is possible to analyze chiral amino acids with high sensitivity in just 10 minutes using a chiral column without derivatization.
Features- Simultaneous Analysis of Chiral Amino Acids in 10 Minutes- Quantitatively Determine All D/L-Amino Acids Using Two Types of
Columns
Click here>>
In Just Ten Minutes, Chiral Amino Acids Can Be Analyzed Simultaneously
Semi-Micro Analytical Balances AP-W Series(Advanced Performance UniBloc Balances)
The AP-W Series, new lineup for the high-sensitivity semi-micro analytical balances feature a minimum reading of 0.01 mg.
Features- Achieves High-Speed Measurements- Safe, Integrated Data Management and a Variety of Functions to
Support HPLC Analysis- Easy-to-Operate User Interface
Faster Response and Higher Stability
Click here>>
Nexis GC-2030(High-End Gas Chromatograph)
The Nexis GC-2030 has been designed based on the concept of superior usability and expandability for accommodating a wide variety of applications. The new user interface features a full-color LCD touch panel that provides intuitive and easy-to-understand operability.Features- Innovative User Interface and Excellent Usability- World's Highest Sensitivity and Reproducibility- Exceptional Analysis Productivity- New LabSolutions Provides Full Control of Nexis GC-2030 Systems and
Offers High Usability
Click here>>
The Next Industry Standard
SPM-8100FM(High-Resolution Scanning Probe Microscope)
The SPM-8100FM scanning probe microscope features five times faster data acquisition, four times wider scan in both X and Y-axis directions, and ultra-high resolution performance that is as high in both air and liquids as in a vacuum.
Features- Offers Both Ultra-High Resolution and High-Speed Wide-Range
Observation- Expanded Software Functionality Improves Operability
See the Nano World Come to Life
Click here>>
27
)
Click her
Next Industry Standard

www.shimadzu.com/an/
For Research Use Only. Not for use in diagnostic procedures.The content of this publication shall not be reproduced, altered or sold for any commercial purpose without the written approval of Shimadzu. The information contained herein is provided to you "as is" without warranty of any kind including without limitation warranties as to its accuracy or completeness. Shimadzu does not assume any responsibility or liability for any damage, whether direct or indirect, relating to the use of this publication. This publication is based upon the information available to Shimadzu on or before the date of publication, and subject to change without notice.
© Shimadzu Corporation, 2017
Shimadzu welcomes your idea and input!
Questionnaire
Printed in Japan, October, 2017