issue brief four: the distribution and evolution of the ......safety net programs. like the safety...
TRANSCRIPT

[Type here]
THE ECONOMIC SECURITY OF AMERICAN HOUSEHOLDS
Issue Brief Four: The Distribution and Evolution of the Social Safety
Net and Social Insurance Benefits: 1990 to 2014
U.S. Department of the Treasury Office of Economic Policy
January 2017
Theodore Figinski was the principal drafter of this report. Inquiries should be directed to the Office of Economic Policy at (202) 622-2200

1
The Economic Security of American Households Issue Brief Four
The Great Recession was the worst economic crisis to strike the United States since the Great Depression. Between December 2007 and October 2009, the unemployment rate doubled – increasing from 5 percent to 10 percent. As individuals lost their jobs and their primary source of income, many households became reliant on the benefits provided by the social safety net – such as Temporary Assistance for Needy Families – and social insurance programs – such as unemployment insurance – in order to make ends meet. These programs, aim to help protect individuals and households from both individual economic risks and broader negative macroeconomic shocks. Collectively, other social insurance programs – such as Social Security and Medicare – provide support to households during periods of life when they tend to be vulnerable. Over the past 25 years, there have been significant changes in the provision and distribution of benefits from safety net and social insurance programs. Some of these changes have been designed to reduce the work disincentives inherent in many programs, while other changes have expanded eligibility for benefits to individuals higher in the income distribution. The past 25 years have also seen important changes in demographics and labor force participation patterns. Together, these changes have important implications for which individuals and households are eligible to receive benefits, the distribution of benefits by income, how much households receive in benefits, and the labor force participation of eligible individuals. This brief is one in a series of issues briefs by the Department of the Treasury’s Office of Economic Policy on the economic security of American households. It examines the distribution of benefits from the social safety net and social insurance programs by household type and income, and how the distribution has changed since 1990. Key Findings
• Among non-elderly households, the poorest households, households with children under the age of 18, and households with a disabled individual receive the largest average benefits from the social safety net and social insurance programs.
• Between 1990 and 2014, benefits received by non-elderly non-disabled households have increasingly been delivered in the form of non-cash benefits, such as food assistance and health insurance. Meanwhile, elderly and disabled households have experienced relatively little change in the amount of benefits coming from non-cash sources, primarily due to their receipt of Social Security benefits.

2
The Economic Security of American Households Issue Brief Four
• Among non-elderly non-disabled households, the second, third, and fourth deciles of the pre-tax-and-transfer income distribution have experienced the largest increases in the average value of the benefits we examine since 1990. The increase is most pronounced among households with children under the age of 18 and is largely a result of the expansion of the Earned Income Tax Credit.
• For elderly households, the average amount of benefits from the social safety net and social insurance programs does not vary much with pre-tax-and-transfer income. The even distribution of benefits is primarily the result of the way Social Security and Medicare are structured.
The Social Safety Net and Social Insurance Programs The social safety net is largely defined as those programs that help protect individuals and households from negative economic shocks. As a result, eligibility for the social safety net programs is generally restricted to those whose incomes fall below certain threshold amounts and whose assets do not exceed certain amounts. There are many programs that aim to protect individuals against negative economic shocks. In this brief, we focus on the following programs: Supplemental Nutrition Assistance Program (SNAP), formerly known as the Food Stamps Program; Temporary Assistance for Needy Families (TANF), sometimes referred to as “cash welfare” which replaced Aid to Families with Dependent Children (AFDC); Medicaid; and Supplemental Security Income (SSI). In addition, we include the Earned Income Tax Credit (EITC), which provides a wage subsidy to low-income households, and has become an increasingly important resource for low-income households.1 We focus on these programs because, in fiscal year 2015, Medicaid, SNAP, SSI, and the EITC were the four largest (in terms of expenditures) federal programs for low-income individuals (Spar and Falk 2016). Cash welfare also represents a significant expenditure for the federal government and is an important resource for needy families. Moreover, cash welfare is colloquially synonymous with the social safety net and has experienced significant changes over the past 25 years. In defining the social safety net to include SNAP, cash welfare, Medicaid, SSI, and the EITC, we have excluded from our analysis other programs and tax expenditures that provide significant benefits to low income individuals and protect against negative economic circumstances. In particular, programs such as housing assistance, the Child Tax Credit and the Additional Child Tax Credit, the Women with Infant Children (WIC) program, the National School Lunch Program, and the Premium Tax Credit for health insurance all provide assistance to households to
1 Bitler, Hoynes, and Kuka (2016) find that the EITC acts like a safety net program because it mitigates the effects of income shocks for married couples with children and other groups with moderate earnings. For the majority of EITC recipients, single parents with children, however, the EITC does not provide significant protection against negative income shocks (Bitler, Hoynes, and Kuka 2016).

3
The Economic Security of American Households Issue Brief Four
alleviate negative economic shocks. In choosing to exclude these programs from our analysis, we are potentially underestimating the value of benefits received by low and middle income households. However, by focusing on benefits received from SNAP, cash welfare, Medicaid, SSI, and the EITC, we are focusing our attention on the most prominent and the most expensive safety net programs. Like the safety net, social insurance provides individuals with protection against economic risks, but the benefits are linked to certain triggers. Social insurance is provided to all individuals regardless of their income or wealth, although the benefit amounts may be tied to previous work experience, income, or wealth. Social Security (retirement, survivor, and disability) and Medicare are the most well-known social insurance programs. Both of these programs provide benefits to individuals who have either attained a certain age (historically, age 65) or have become disabled. As both old age and disability are associated with a reduced ability to work, these programs provide individuals with income and health benefits that they can no longer derive from the market. Social insurance is also provided through unemployment insurance (UI), with the trigger for the receipt of benefits being job loss. The Distribution of the Social Safety Net and Social Insurance by Household Type Our analysis examines how the distribution of benefits from the social safety net and social insurance programs varies by household type and income, and how that distribution has evolved since 1990, a period of considerable economic, demographic, and public policy change. Because there are important differences in who is eligible to receive benefits from the social safety net and social insurance programs, for this analysis, households are divided into five separate categories:
• Non-elderly non-disabled households with children: households headed by an
individual under the age of 65 with at least one child under the age of 18 residing in the household, without any individual age 62 or older in the household, and none of the individuals in the household under age 62 reports that a disability or health problem limits their ability to work (in 2014, 26 percent of households);
• Non-elderly disabled households with children: households headed by an individual under the age of 65 with at least one child under the age of 18 residing in the household, without any individual age 62 or older in the household, and at least one of the individuals in the household under age 62 reports that a disability or health problem limits their ability to work (in 2014, 3 percent of households);
• Non-elderly disabled households without children: households headed by an individual under the age of 65 without any children under the age of 18 in the household, without

4
The Economic Security of American Households Issue Brief Four
any individual age 62 or older in the household, and at least one of the individuals in the household under age 62 reports that a disability or health problem limits their ability to work (in 2014, 6 percent of households);
• Non-elderly non-disabled households without children: households headed by an
individual under the age of 65 without any children under the age of 18 residing in the household, without any individual age 62 or older in the household, and none of the individuals in the household under age 62 reports that a disability or health problem limits their ability to work (in 2014, 31 percent of households); and
• Elderly households: those households headed by an individual age 65 or older (in 2014,
24 percent of households).2
In order to determine the amount of benefits each type of household receives from the various programs and the pre-tax-and-transfer income of households, we use the Census Bureau’s Current Population Survey Annual Social and Economic Supplement (ASEC). The ASEC is administered in March of each year and asks respondents about their income and benefit receipt during the previous calendar year.3 In addition, the ASEC data also include estimates of respondents’ tax liability and the receipt of tax credits, such as the EITC.4 The latest publicly available ASEC data when this analysis was begun are from the 2015 ASEC, and represent data for 2014. In our analysis, we focus on benefits received from cash welfare (TANF/AFDC), the EITC, Medicare, Medicaid, Social Security (without differentiating between retirement, survivor, and disability), SNAP, SSI, and UI.5 To get a better understanding of the distribution of benefits
2 Note that the percentage of total households does not sum to 100 percent because we exclude those households with or without a child under the age of 18 residing in the household and with an individual ages 62 to 64 residing in the household due to data limitations in separating Social Security Disability Insurance from Social Security retirement and survivor income. In 2014, these households accounted for approximately 9 percent of all households and 12 percent of all non-elderly households. While the ASEC began asking individuals reporting Social Security income the reason why they were receiving Social Security benefits in 2001, because we begin our analysis in 1990, we chose not to use these questions to help us distinguish between those receiving Social Security retirement and survivor benefits from those receiving Social Security Disability Insurance. 3 For convenience, we use the Center for Economic and Policy Research edited versions of the ASEC. We merge these files with the disability information from the Census version of the ASEC. 4 When multiple tax filing units are present in the household, we sum the tax information across all the filing units in the household. 5 As discussed above, there are many other programs and tax expenditures that provide significant benefits to low income individuals that are excluded from our analysis of the social safety net. These include housing assistance, the Child Tax Credit and the Additional Child Tax Credit, and the Premium Tax Credit for health insurance. We exclude these benefits from our analysis and instead we focus on the most prominent and the most expensive safety net benefits – benefits received from SNAP, cash welfare, Medicaid, SSI, and the EITC. The ASEC contains

5
The Economic Security of American Households Issue Brief Four
provided by the social safety net and social insurance programs, we categorized households into income categories based on their pre-tax-and-transfer income (hereafter, simply “income”).6 In most cases, we examine the distribution of benefits by income decile. We calculate the income deciles for each year by sorting households by their income and then assigning those in the lowest tenth of the distribution to decile 1, those in the next tenth to decile 2, and so on. We do this calculation separately for elderly and non-elderly households because elderly households are at a very different point in their lifecycles where they are less likely to be working (and thus less likely to have labor income) and more likely to have assets they can draw on to supplement their incomes. We do not separate the sub-categories of non-elderly households (households with children, disabled households, and households without children) when calculating income deciles for non-elderly households. Non-Disabled Households with Children Non-elderly households in the bottom half of the income distribution, regardless of the presence of children in the household, tend to receive the largest average transfers from the social safety net and social insurance programs. Moreover, many of the social safety net programs provide larger benefits to those households with children than to those households without children. Programs such as cash welfare were originally created to provide benefits to widows with children. The stacked bars in Figure 1 represent the average benefit amount received from each of the social safety net and social insurance programs in each decile of the income distribution in 2014 for all non-disabled households with children in the decile regardless of whether they received benefits. The dots show the fraction of households in each decile receiving benefits. Figure 1 shows that the bottom decile received the largest average total benefit (an average of approximately $14,180) from the social safety net and social insurance programs, as they have since 1990. On average, approximately 51 percent of the benefit received by the lowest decile came from Medicaid, with SNAP benefits and Social Security income making up the next two largest sources. The second decile, however, received nearly as much as the lowest decile (an average of approximately $14,110) from the social safety net and social insurance programs. The source of the benefits received by the second decile was somewhat different than the
information on participation in Medicare and Medicaid, but no information on the dollar value of the benefits received from these programs. To determine the value of these programs to households enrolled in these plans, we rely on the average cost per enrollee from the Centers for Medicare and Medicaid Statistical Supplement 2013 Edition. 6 We define household pre-tax-and-transfer income as the sum of earned income; child support and alimony; non-Social Security, non-veterans’ disability and survivor income; workers compensation; veterans’ benefits; payments from defined benefit plans; regular payments from IRA, KEOGH, or 401(k) accounts; dividend payments; and “other income.”

6
The Economic Security of American Households Issue Brief Four
source for the lowest decile. While the benefits from Medicaid account for, on average, the largest share of benefits (approximately 50 percent), the EITC accounted for almost a quarter of the benefits received by the second decile (see Figure 1).
The dots show that in each of the bottom four deciles at least 88 percent of households received benefits from at least one of the social safety net and social insurance programs. However, those in the bottom decile are slightly less likely than their counterparts in the second, third, and fourth deciles to receive any benefits, primarily because non-earning households are ineligible for the EITC. Figure 2 plots the growth in the real value of average benefits for non-disabled households with children for each income decile relative to 1990. For non-disabled households with children, the bottom decile has seen a decline in the real average value of total benefits received, whereas the second, third, and fourth deciles of the income distribution have experienced
In 2014, nearly all non-disabled households with children in the bottom four deciles of the income distribution received some form of benefits, mainly from Medicaid, the EITC and SNAP.

7
The Economic Security of American Households Issue Brief Four
substantial growth in the real value of average benefits received since 1990 (see Figure 2). Households in the bottom decile experienced a decline in real average benefits of approximately $970 between 1990 and 2014, while households in the second and third deciles experienced an increase in real average benefits of approximately $7,500 and $8,300. Households in the fourth decile experienced slightly lower growth in real average total benefits compared with the second and third deciles, receiving on average approximately $6,200 more in benefits in 2014 than in 1990 (see Figure 2).
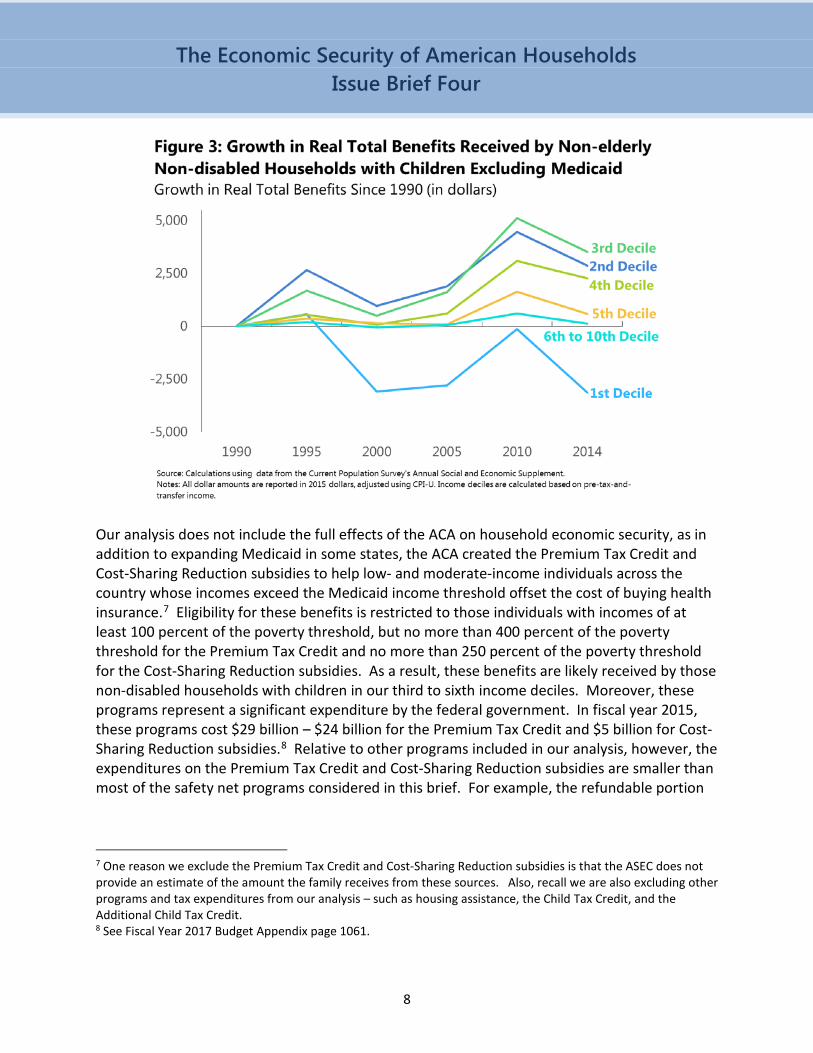
An important policy change that affected the growth of benefits was the enactment of the Affordable Care Act (ACA) and the subsequent expansion of Medicaid in many states. These expansions likely made more households in the second and third deciles eligible for Medicaid health insurance coverage. However, the associated increase in Medicaid benefits for these households was somewhat offset by a drop in other benefits related to the recovery from the Great Recession and the end of temporary recession-related expansions to SNAP and UI. Figure 3 shows growth in real average benefits other than Medicaid for these households. Together, the figures suggest that the ACA Medicaid expansion, as well as the real growth in the monetary value of benefits from public health insurance, was responsible for the continued increase in the average value of benefits between 2010 and 2014 depicted in Figure 2. The expansion of Medicaid represents a fundamental change in the provision of safety net benefits and constitutes an increasingly large source of transfers for households in the bottom of the income distribution.
8
The Economic Security of American Households Issue Brief Four
Our analysis does not include the full effects of the ACA on household economic security, as in addition to expanding Medicaid in some states, the ACA created the Premium Tax Credit and Cost-Sharing Reduction subsidies to help low- and moderate-income individuals across the country whose incomes exceed the Medicaid income threshold offset the cost of buying health insurance.7 Eligibility for these benefits is restricted to those individuals with incomes of at least 100 percent of the poverty threshold, but no more than 400 percent of the poverty threshold for the Premium Tax Credit and no more than 250 percent of the poverty threshold for the Cost-Sharing Reduction subsidies. As a result, these benefits are likely received by those non-disabled households with children in our third to sixth income deciles. Moreover, these programs represent a significant expenditure by the federal government. In fiscal year 2015, these programs cost $29 billion – $24 billion for the Premium Tax Credit and $5 billion for Cost-Sharing Reduction subsidies.8 Relative to other programs included in our analysis, however, the expenditures on the Premium Tax Credit and Cost-Sharing Reduction subsidies are smaller than most of the safety net programs considered in this brief. For example, the refundable portion
7 One reason we exclude the Premium Tax Credit and Cost-Sharing Reduction subsidies is that the ASEC does not provide an estimate of the amount the family receives from these sources. Also, recall we are also excluding other programs and tax expenditures from our analysis – such as housing assistance, the Child Tax Credit, and the Additional Child Tax Credit. 8 See Fiscal Year 2017 Budget Appendix page 1061.
9
The Economic Security of American Households Issue Brief Four
of the EITC alone cost about $60 billion in fiscal year 2015.9 Nevertheless, by excluding these programs from our analysis, we likely understate the effect of the ACA on middle income individuals and households. For the period since 1990 as a whole, the growth in real average total benefits experienced by the second, third, and fourth deciles relative to the first is also likely a result of welfare reform and the expansion of the EITC in 1996. As a result of these policy changes, the receipt of benefits from the social safety net has become increasingly tied to the ability to find work. For example, the EITC incentivizes labor force participation by giving a refundable tax credit to low-income workers in proportion to their earned income; households without earnings do not benefit from the EITC. The tying of the social safety net to employment can also be seen in the sharp drop in benefits in the lowest income decile following welfare reform in the mid-1990s.
In addition to benefits being tied increasingly to employment, benefits for households with children have been increasingly delivered in the form of non-cash benefits. As seen in Figure 4, in 1990, for non-disabled households with children, approximately 47 percent of average benefits came from in-kind (non-cash) sources, such as SNAP and Medicaid. By 2014, the percentage of in-kind benefits had increased to approximately 69 percent. By structuring benefits as in-kind transfers, a program can channel goods that have been deemed socially desirable, such as food and health care, to households and restrict expenditures perceived by society as less desirable. However, the provision of in-kind benefits may make households that would have chosen a different pattern of consumption worse off if given cash. While there is some evidence that household consumption responds similarly to one dollar of food (non-cash) benefits as they would to one dollar of cash benefits, there exists some minimum level of cash households need.10
9 See Fiscal Year 2017 Budget Appendix page 1056. In 2014, the total cost of the EITC was approximately $67 billion. See https://www.eitc.irs.gov/EITC-Central/eitcstats/2014stats. 10 Hoynes and Schanzenbach (2009) examine the impact of food stamps on food consumption and expenditures. Their findings suggest that households respond similarly to a one dollar increase in cash income as they would to one dollar in food stamps.
The safety net has increasingly delivered benefits in the form of non-cash benefits, and these benefits have been increasingly tied to the ability to find work.

10
The Economic Security of American Households Issue Brief Four
Disabled Households While many of the social safety net programs were originally established to provide benefits to widows with children, others were developed to provide benefits to disabled individuals and households regardless of whether they have children. Programs such as Social Security Disability Insurance and SSI help households replace income that can no longer be derived from the market due to a disability. In addition, because disability may be associated with increased medical care costs, policymakers have extended Medicare and Medicaid to disabled individuals as well. Because the presence of children affects the eligibility for certain benefits, we divide disabled households into two separate categories – those households with children and those households without children. Similar to non-disabled households with children, nearly all disabled households with children in the bottom four deciles received benefits from the social safety net and social insurance programs in 2014 (see Figure 5). However, compared with non-disabled households with children, disabled households with children higher into the income distribution are much more likely to receive benefits than non-disabled households with children. For example, in 2014, approximately 67 percent of disabled households with children in the sixth decile were receiving benefits; whereas only 40 percent of non-disabled households with children in the sixth decile were receiving benefits (see Figures 1 and 5). Moreover, disabled households with children receive larger average benefits from the social safety net and

11
The Economic Security of American Households Issue Brief Four
social insurance programs than non-disabled households with children. For instance, disabled households with children in the bottom decile received an average of approximately $28,220 in benefits from the social safety net and social insurance programs, compared to the $14,180 received by non-disabled households with children in the bottom decile. A similar pattern holds across the income distribution. One reason for the difference in receipt and size of the average benefit amount is that disabled households with children are more likely to be receiving benefits from Social Security, Medicare, and SSI.
For disabled households without children, the distribution of average benefits looks very similar to that of disabled households with children. In 2014, disabled households without children in the bottom decile of the income distribution received approximately $18,550 in cash and in-kind transfers on average. Similar to disabled households with children, benefits for disabled households without children stretch higher into the income distribution (Figures 4 and 5). Relative to disabled households with children, however, disabled households without children receive lower benefits, potentially as a consequence of smaller household sizes.

12
The Economic Security of American Households Issue Brief Four
Disabled households, however, are particularly likely to have incomes that place them in the bottom decile of the income distribution. Figure 7 presents the fraction of non-elderly households in each category (non-disabled households with children, disabled households with children, disabled households without children, and non-disabled households without children) in each decile of the overall income distribution in 2014. Approximately 36 percent of disabled households without children were in the bottom decile of the non-elderly income distribution in 2014, and approximately 61 percent of the disabled households without children were in the bottom third of the overall non-elderly income distribution. For disabled households with children, approximately 20 percent were in the bottom decile of the non-elderly income distribution in 2014, and approximately 47 percent were in the bottom third of the income distribution. In sharp contrast, non-disabled households with children and non-disabled households without children are distributed relatively evenly across the income groups (with shares around 10 percent in each decile).
While disabled households in the bottom decile receive larger benefit amounts than non-disabled households with children, disabled households are much more likely to be in the bottom decile of the income distribution.

13
The Economic Security of American Households Issue Brief Four
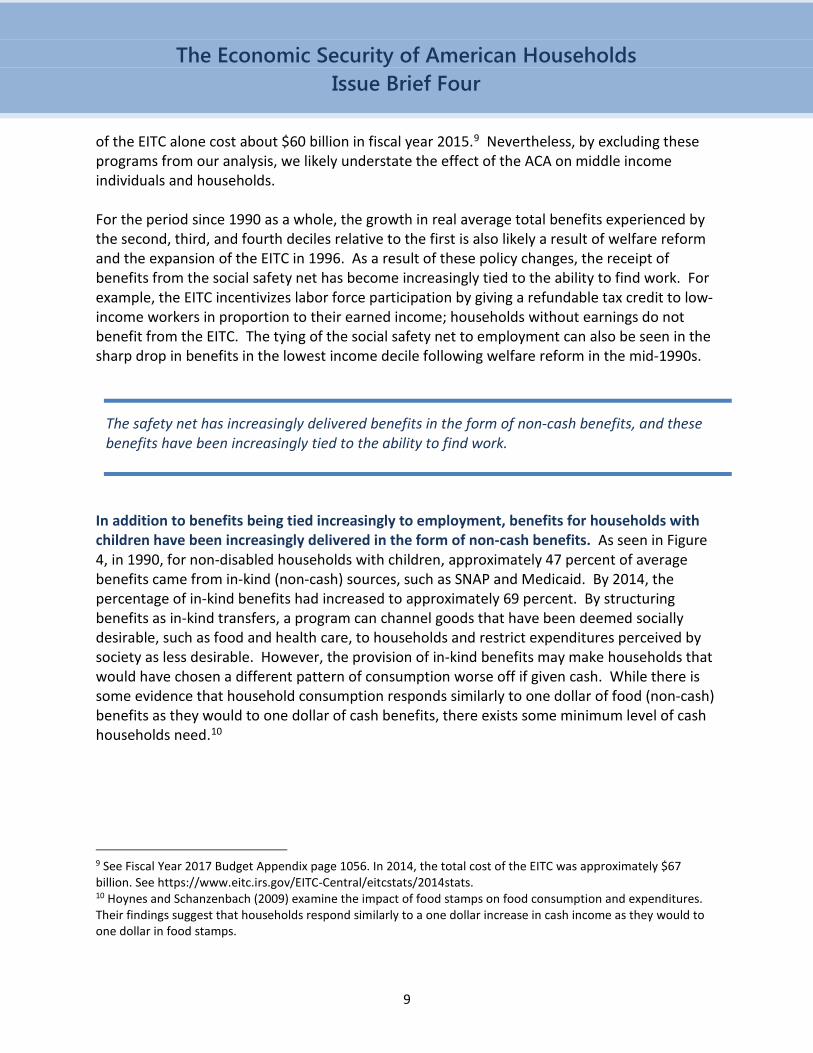
Non-Disabled Households without Children While the social safety net and social insurance programs have historically provided benefits to households with children and disabled households, non-disabled households without children have traditionally received few benefits. In 2014, non-disabled households with children, disabled households with children, and disabled households without children in the bottom decile received between approximately one-and-a-half and five times as much in average benefits than non-disabled households without children with similar incomes. Non-disabled households without children in the bottom decile in 2014 received an average of approximately $4,950 in benefits (see Figure 8); while non-disabled households with children in the bottom decile received an average of approximately $14,180 (see Figure 1), disabled households with children in the bottom decile received and average of approximately $28,220 (see Figure 5), and disabled households without children in the bottom decile received an average of approximately $18,550 (see Figure 6). Across the income distribution, non-disabled households without children receive far less from the social safety net and social insurance programs than any other group (see Figure 9). As a result, in the event of a negative income shock, there is little social safety net to prevent these households from falling into poverty.
14
The Economic Security of American Households Issue Brief Four

15
The Economic Security of American Households Issue Brief Four
Moreover, non-disabled households without children are less likely to be receiving any benefits, as shown by the dots in Figure 8. In 2014, approximately 51 percent of non-disabled households without children in the bottom decile of the income distribution received some benefit from the social safety net and social insurance programs (see Figure 8), while approximately 88 percent of non-disabled households with children in the bottom decile (see Figure 1), approximately 97 percent of disabled households with children (see Figure 5), and approximately 96 percent of disabled households without children received at least some benefit (see Figure 6). While the fraction receiving any benefits falls more rapidly for the disabled households without children than for households with children, the fraction receiving any benefits falls most rapidly for non-disabled households without children. Approximately 17 percent of non-disabled households without children in the fourth decile receive any benefit from the social safety net and social insurance programs, compared to 98 percent for disabled households with children, 94 percent for non-disabled households with children, and 61 percent for disabled households without children. At the fifth decile, approximately 14 percent of non-disabled households without children receive any benefits, compared to approximately 60 percent for both non-disabled households with children and disabled households without children and approximately 80 percent for disabled households with children. One reason that non-disabled households without children are less likely to receive benefits as income increases is that fewer of the social safety net and social insurance programs are available to households in this group. For example, the EITC provides material benefits to households with children in the bottom third of the income distribution, while the EITC provides very little benefit to non-disabled households without children. Moreover, non-disabled households without children have less access to cash welfare and SNAP.
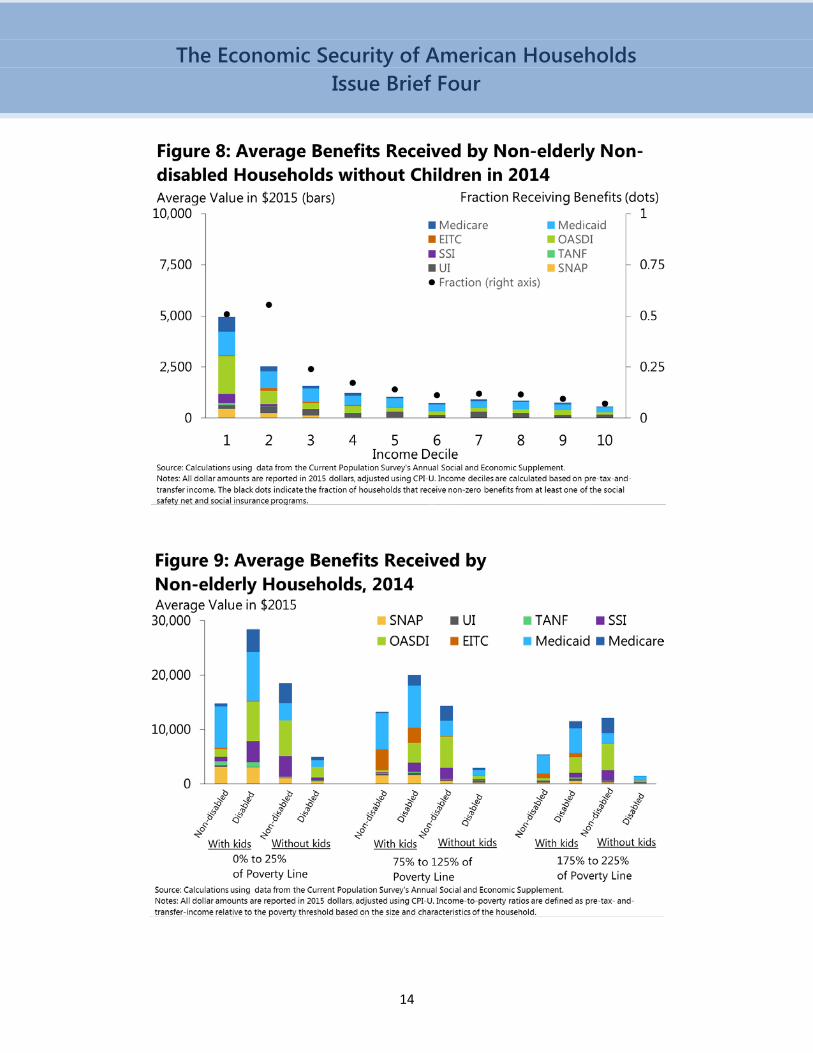
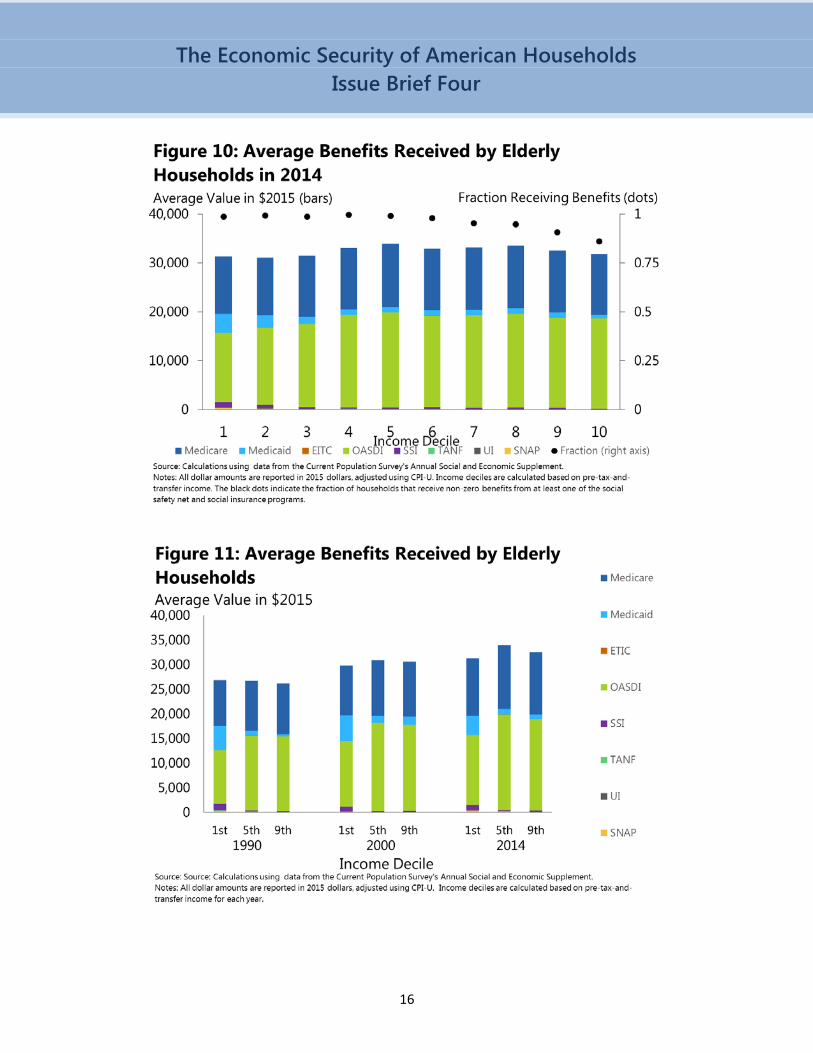
Elderly Households Unlike non-elderly households, elderly households across the income distribution receive a significant benefit from the social safety net and social insurance programs, particularly from Social Security and Medicare. As a result of Social Security and Medicare, almost all elderly households (96 percent in 2014) receive benefits from at least one of the social safety net or social insurance programs that we have included in our analysis, and the distribution of average benefits is relatively equal for elderly households across the income distribution (see Figure 10). Over time, benefits have gradually increased in real terms throughout the income distribution (see Figure 11).
16
The Economic Security of American Households Issue Brief Four

17
The Economic Security of American Households Issue Brief Four
As indicated by the dots in Figure 10, in 2014, in every income decile, at least 80 percent of elderly households were receiving some benefit from the social safety net and social insurance programs. The share is close to 100 percent in the lower half of the income distribution (the first five deciles) but falls off a bit beginning with the sixth decile 6. One reason why the percentage of elderly household receiving at least some benefit shows this decline is that these households are more likely to still be working (indeed, their labor earnings may be why they have incomes higher than other households). As a result, they may choose to claim Social Security benefits later than those elderly households who have stopped working. Medicaid also provides an important source of benefits for elderly households, particularly those in the lowest income decile. Outside of Medicare, Medicaid, and Social Security, elderly households receive relatively little benefit from the social safety net.11 In 2014, across the income distribution, elderly households received, on average, less than $1,500 from the social safety net and social insurance programs other than Medicare, Medicaid, and Social Security. SNAP and SSI accounted for the largest sources of these benefits. The Effectiveness of the Social Safety Net and Social Insurance over Time The official poverty measure is the best-known measure of poverty in the United States, but it may not accurately capture the effects of the social safety net and social insurance on alleviating poverty. The official poverty measure only accounts for benefits that are provided as pre-tax cash transfers. As a result, transfers such as Social Security payments, UI, and cash welfare (TANF/AFDC) are included as income, while the EITC, Medicaid, and SNAP, increasingly important resources for low-income households, are excluded. To correct for many of the deficiencies associated with the official poverty measure, the Census Bureau has developed the Supplemental Poverty Measure (SPM). The SPM includes cash, non-cash, and post-tax transfers in accounting for the resources available to households.12 In addition, the SPM accounts for child care costs, out-of-pocket medical expenses, work-related expenses (e.g., commuting costs), and federal tax obligations. While the addition of non-cash and post-tax transfers tends to decrease the percentage of individuals living in poverty, accounting for child care costs, out-of-pocket medical expenses, work-related expenses, and
11 By examining annual income flows, our analysis does not consider the life-cycle nature and insurance value of government benefits to older households. Such an analysis, however, is beyond the scope of this brief. 12 Specifically, the SPM differs from the official poverty measure because (1) the poverty thresholds are based on the mean expenditures on food, clothing, shelter, and utilities of two-child consumers in the 30th to 36th percentile range, (2) geographic adjustments are made for differences in housing costs, and (3) resources are measured as the sum of cash income minus federal tax obligations plus non-cash income that can be used for food, clothing, shelter, and/or utilities minus work expenses, out-of-pocket medical expenses, and child support.

18
The Economic Security of American Households Issue Brief Four
federal tax obligations reduce resources available to households and tend to increase the percentage living in poverty. Correcting for these deficiencies yields a measure that suggests that poverty in the United States has shown a very different path over time than what is suggested by the official poverty measure. Based on the Census estimates of the SPM that go back to 2009, academic research extends the SPM back further one can see that poverty in the United States has fallen materially – from a rate of 19.1 percent in 1967 to 15.2 percent in 2014. Furthermore, if the SPM poverty thresholds were “anchored” to a specific year and adjusted for inflation similar to the official poverty thresholds, poverty would have fallen by an even larger amount (Wimer et. al. 2013). By contrast, the official poverty measure shows little change in the incidence of poverty over the same time period.13 The academic research has also calculated the influence of tax policy and a broad range of government transfer programs on poverty as calculated under the SPM. This information allows us to see how important these policies are for alleviating poverty in this country. All else equal (i.e., assuming other behaviors would not change if the policies did not exist), the data suggest that poverty would be substantially higher. Excluding those benefits that are provided either in-kind or as post-tax-and-transfers, such as the EITC and SNAP, the SPM would have been approximately 5 percentage points (or 28 percent) higher in 2012 (see Figure 12). Excluding all benefits from government transfer and tax programs, the SPM would have been approximately twice as large as it was in 2012 (see Figure 12). In other words, the comparison suggests that poverty would be twice as high as it actually is in the absence of these programs.
13 See Fox et. al. (2014) for more detail.

19
The Economic Security of American Households Issue Brief Four
In addition to examining how the social safety net and social insurance programs have reduced poverty over time, academic research has considered how the ability of the social safety net and social insurance programs to mitigate macroeconomic shocks has changed over time. To empirically examine how responsive the social safety net and social insurance programs are to macroeconomic shocks and how the responsiveness may have changed over time, this research examines how a change in the state unemployment rate affected the share of households with after-tax-and-transfer-income below certain multiples of the official poverty threshold during the recessions of the 1980s and the Great Recessions (see Bitler and Hoynes 2010; Bitler and Hoynes 2015; Bitler and Hoynes 2016). Understanding how negative economic shocks affect the share of the population living below not only the official poverty threshold, but lower (e.g., 50 percent of the poverty threshold) or higher (e.g., 150 percent of the poverty threshold) income thresholds provides insight into how these shock affect various parts of the income distribution. By comparing the after-tax-and-transfer income of households to the poverty threshold, the research accounts for resources that households receive not only through the market, but also through government assistance. The recessions of the 1980s and the Great Recession are two periods of severe economic declines and slow economic recoveries. More importantly, a key difference between these two periods is the changes made to cash welfare during the 1990s. This research suggests that the safety net and social insurance programs may be providing less protection against income and economic shocks than they had in the past (Bitler and Hoynes 2010; Bitler and Hoynes 2015; Bitler and Hoynes 2016). Figure 13 plots the effects of a one

20
The Economic Security of American Households Issue Brief Four
percentage point increase in the unemployment rate on the share of households with incomes below certain multiples of the official poverty threshold during the recession of the 1980s and the Great Recession. During the recessions of the 1980s, when the unemployment rate increased, the lowest and highest income groups experienced the smallest increases in the percentage of individuals living below those thresholds (Bitler and Hoynes 2015). In effect, while the increases in the unemployment rate increased the number of people living at lower income levels, the social safety net prevented individuals from falling into the lowest income categories. The experience during the Great Recession, however, was very different. A one percentage point increase in the unemployment rate resulted in the largest increases in the lowest income categories (see Figure 13) (Bitler and Hoynes 2015). In effect, the safety net was unable to prevent households from falling into the lowest income categories. While the comparison between the two episodes should be interpreted with some caution given that every recession is unique in its dynamics and distributional effects, the results are consistent with the view that the shift of the safety net toward benefits tied to work may have blunted the ability of these programs to prevent households from falling in to the lowest income categories in the face of economic shocks. The implication is that policymakers had to use more discretionary policy to protect vulnerable households in these recent episodes, as they did with the expansion of SNAP and UI in 2009 in response to the Great Recession.
21
The Economic Security of American Households Issue Brief Four
Conclusion The social safety net and social insurance programs are designed to protect individuals and households from macroeconomic shocks and individual economic risks. Elderly households and disabled households without children primarily receive benefits from Social Security and Medicare. While there have been some important changes to these programs, the distribution of benefits among these population subgroups has not changed dramatically in recent decades. Non-disabled households without children have traditionally received fewer benefits from the social safety net and social insurance than other household types and this continues to be the case. For households with children, the receipt of benefits has become increasingly tied to work, most notably through the expansions of the EITC in the 1990s and changes made to the cash welfare program. As a result, since 1990, households just above the very bottom of the income distribution – in the second, third, and fourth deciles – have seen the largest growth in the average total benefits. While tying the receipt of benefits to employment reduces the disincentive effects of these programs on willingness to work, it may also reduce the ability of the safety net to respond to adverse macroeconomic conditions. In particular, during periods of elevated unemployment, the safety net may be less effective in preventing individuals from falling into poverty. This limitation should be considered when designing the discretionary policy response to future macroeconomic shocks, as well as in proposals to have programs expand more automatically in economic downturns. Overall, though, the social safety and social insurance programs continue to provide critical support to vulnerable American households. According to the most comprehensive measures of poverty currently available, poverty in the United States would be significantly higher in their absence. Moreover, these programs have contributed to a material reduction in the incidence of poverty since the late 1960s.

22
The Economic Security of American Households Issue Brief Four
References Bitler, Marianne, and Hilary Hoynes, 2010. “The State of the Social Safety Net in the Post-
Welfare Reform Era.” Brookings Papers on Economic Activity, Fall 2010, pp. 71-127. Bitler, Marianne, and Hilary Hoynes, 2015. “Heterogeneity in the Impact of Economic Cycles
and the Great Recession: Effects within and across the Income Distribution” American Economic Review: Papers & Proceedings 2015 105(5): 154-160.
Bitler, Marianne, and Hilary Hoynes, 2016. “The More Things Change, the More They Stay the
Same? The Safety Net and Poverty in the Great Recession?” Journal of Labor Economics 34(1, pt.2): S403-S444.
Bitler, Marianne, Hilary Hoynes, and Elira Kuka, 2016. “Do In-Work Tax Credits Serve as a Safety
Net?” Journal of Human Resources 51 (3). Fox, Liana, Christopher Wimer, Irwin Garfinkel, Neeraj Kaushal, and Jane Waldfogel, 2014.
“Waging War on Poverty: Historical Trends in Poverty Using the Supplemental Poverty Measure.” NBER Working Paper No. 19789.
Hoynes, Hilary W. and Diane Whitmore Schanzenbach, 2009. “Consumption Responses to In-
Kind Transfers: Evidence from the Introduction of the Food Stamp Program.” American Economic Journal: Applied Economics, 1(4): 109-39.
Spar, Karen, and Gene Falk, 2016. “Federal Benefits and Services for People with Low Income:
Overview of Spending Trends, FY2008-FY2015.” Congressional Research Service Report R44574.
Wimer, Christopher, Fox, Liana, Irv Garfinkel, Neeraj Kaushal, and Jane Waldfogel, 2013.
“Trends in Poverty with an Anchored Supplemental Poverty Measure.” Working Paper. Columbia Population Research Center.