issue may 2017 ingeniousnews - pal system: … issue 2 may 2017 comparison of the manual and...
TRANSCRIPT

IngeniousNewsIssue 2May 2017
www.palsystem.com
Comparison of the manual and automated generation of cali-bration standards
page 3
PAL SPME Arrow - The better SPMELower cost per sample
page 12
Automated mini-column solid- phase extraction cleanup for high-throughput analysis of chemical contaminants in foods by low-pressure gas chromatography—tandem mass spectrometry
page 14
Imprint
IngeniousNews 02/2017
Date of print: 05.2017
CTC Analytics AGIndustriestrasse 20CH-4222 ZwingenSwitzerland T +41 61 765 81 00Contact: [email protected]
Legal Statements
CTC Analytics AG reserves the right to make improvements and/or changes to the product(s) described in this document at any time without prior notice.
CTC Analytics AG makes no warranty of any kind pertaining to this product, including but not limited to implied warranties of merchantability and suitability for a particular purpose.
Under no circumstances shall CTC Analytics AG be held liable for any coincidental damage or damages arising as a conse-quence of or from the use of this document.
© 2017 CTC Analytics AG. All rights reserved. Neither this publication nor any part hereof may be copied, photocopied, reproduced, translated, distributed or reduced to electronic medium or machine readable form without the prior written permission from CTC Analytics AG, except as permitted under copyright laws.
CTC Analytics AG acknowledges all trade names and trademarks used as the property of their respective owners.
PAL is a registered trademark of CTC Analytics AG | Switzerland

3IngeniousNews 02/2017
Comparison of the manual and automated generation of calibration standards
Introduction
This application note compares the manual and automated generation of calibration standards in terms of their statistical figures of merit.
Calibrations
• are performed regularly in many laboratories and are time consuming
• are used to quantify an analyte or substance• generate a mathematical model to describe the signal
amplitude as a function of the concentration of the analyte using standard solutions of different known concentrations
• are a validation step• have a limited validity (time, device, measurement
parameters, working range, etc.)
Linear correlation
Search for the best fitting type curve (y=mx+b) using the least
squares method.Assumption: Errors of y-values greater than x-values.The sum of the squares of the vertical deviations between the measuring points is minimized.
Definitions
Accuracy: Difference between intended and actual volume
Precision: Reproducibility of repeated processes (here volume of liquid addition)
Coefficient of correlation r: compares the variation of data points of the regression curve to the total variation of the process.
Coeffiecient of determination r2: the closer r2 is to 1, the higher is the probability of a linear correlation.
Residual variation Sy: measures the proportion to which a mathematical model accounts for the variation of a given data set.
Standard deviation of the process Sx0 (=Sy/m): a measure for the performance of the analytical process - since the standard deviation of the residues Sy is also a measure of the precision and the slope m represents a measure of sensitivity, Sx0 can be directly compared.
Coefficient of variation for the process Vx0: a relative measure for the precision - since it is formed from the standard deviation of the method Sx0 and the mean value Mw, it is also referred to as a relative standard deviation of the procedure.
Q(x2/y2)
P(x1/y1)
∆y = y2 - y1
∆x = x2 - x1
y2
y1
x1 x2x
y
Thomas Funke, Chemical and Veterinary Analytical Institute Münsterland-Emscher-Lippe (CVUA-MEL), Münster, Germany

4 IngeniousNews 02/2017
Nominal volume [mL]
Class A Class AS Class B
max. error [%] time to drain [s] max. error [%] time to drain [s] max. error [%] time to drain [s]
0,5 ± 1 10–20 ± 1 4–8 ± 2 4–20
1 ± 0,7 10–20 ± 0,7 5–9 ± 1,5 5–20
10 ± 0,2 15–40 ± 0,2 8–12 ± 0,4 8–40
50 ± 0,1 30–60 ± 0,1 13–18 ± 0,2 13–60
100 ± 0,08 40–60 ± 0,08 25–30 ± 0,16 25–60
Accuracy of some volumetric pipetts
Accuracy of positive displacement syringes
Accuracy ±1 % of nominal volume (depending on syringe volume/parameters)
Volume range available for the PAL RTC is 0.5 – 10’000 µL
Weighed amount of analyte, reference compound, >>>> defined volume
Stock solution: e.g. 10,00 mg/25 mL Hexane c= 400 mg/L
Dilution 1 (1:10) 1 ml stock solution in 10.0 mL c= 40 mg/L
Dilution 3 (1:10) 1 ml Dil. 2 in 10.0 mL c = 0.4 mg/L
Dilution 2 (1:10) 1 ml Dil. 1 in 10.0 mL c = 4.0 mg/L
Cal. Std. 10.5 mL D3/25 mLc = 0.008 µg/mL
each plus 0.5 mL ISTD - solution c = 0.10 µg/mL
Cal. Std. 21.0 mL D3/25 mLc = 0.016 µg/mL
Cal. Std. 32.0 mL D3/25 mLc = 0.032 µg/mL
Cal. Std. 45.0 mL D3/25 mLc = 0.080 µg/mL
Cal. Std. 58.0 mL D3/25 mLc = 0.120 µg/mL
Standard manual procedure to generate calibration solutions using volumetric pipettes

5IngeniousNews 02/2017
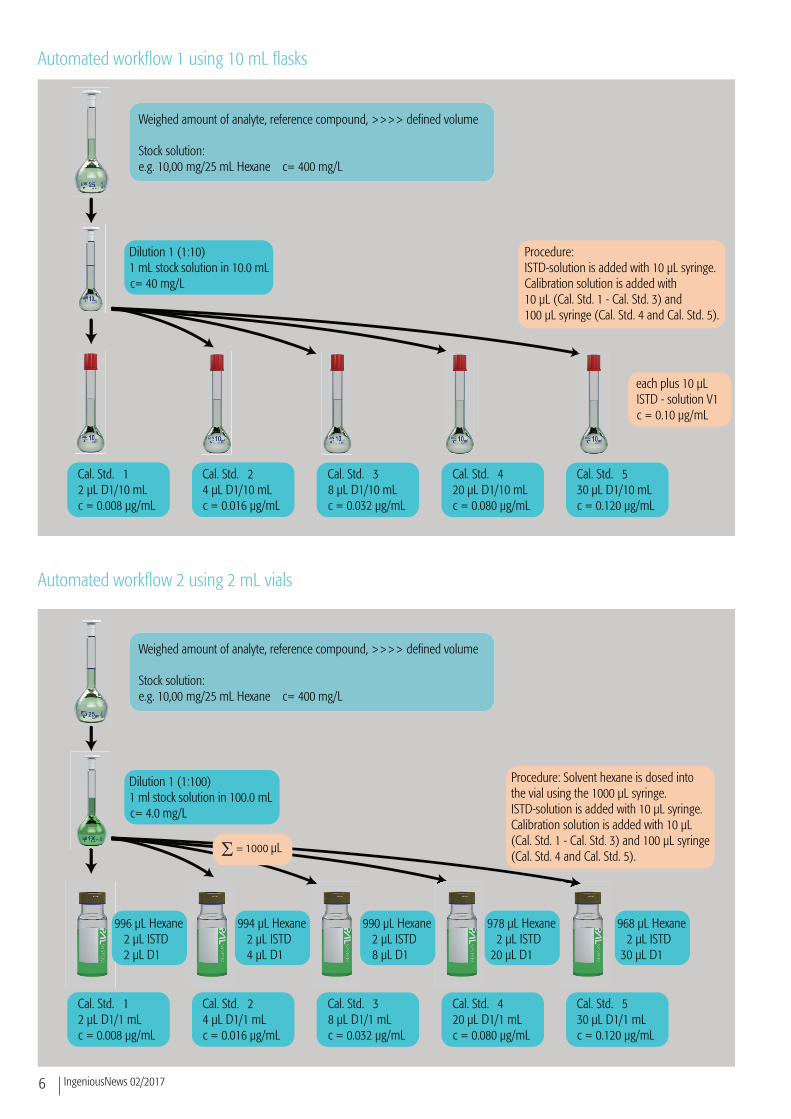
Automated workflows on the PAL RTC
For the automated workflows on the PAL RTC the follwing tools ( http://www.palsystem.com/index.php?id=284 ) and modules ( http://www.palsystem.com/index.php?id=194 ) were used:
• Park Station• D7/57 Syringe Tool for 10 µL syringe• D7/57 Syringe Tool for 100 µL syringe• D8/57 Syringe Tool for 1000 µL syringe• 2 Trayholders• Standard VT15 and VT54 Racks• Custom Racks for 10 mL volumetric flasks• 10 mL volumetric flasks from LABC, Hennef, Germany ( http://www.labc.de/ )• 2 Large Wash Stations• Vortex Mixer Module
The automated workflows 1 and 2 were realized with the PAL Sample Control software ( http://www.palsystem.com/index.php?id=243 ). PAL Sample Control allows to operate both standalone workstations as well as online systems (LC, LC-MS, GC, GC-MS).
Automatic weighing is possible with the Chronos software and a software plug-in from Axel Semrau GmbH. A separate application note is available ( http://www.palsystem.com/index.php?id=280 ).
6 IngeniousNews 02/2017
Weighed amount of analyte, reference compound, >>>> defined volume
Stock solution: e.g. 10,00 mg/25 mL Hexane c= 400 mg/L
Dilution 1 (1:10) 1 mL stock solution in 10.0 mL c= 40 mg/L
Cal. Std. 12 µL D1/10 mLc = 0.008 µg/mL
each plus 10 µL ISTD - solution V1 c = 0.10 µg/mL
Cal. Std. 24 µL D1/10 mLc = 0.016 µg/mL
Cal. Std. 38 µL D1/10 mLc = 0.032 µg/mL
Cal. Std. 420 µL D1/10 mLc = 0.080 µg/mL
Cal. Std. 530 µL D1/10 mLc = 0.120 µg/mL
Procedure:ISTD-solution is added with 10 µL syringe.Calibration solution is added with10 µL (Cal. Std. 1 - Cal. Std. 3) and100 µL syringe (Cal. Std. 4 and Cal. Std. 5).
Weighed amount of analyte, reference compound, >>>> defined volume
Stock solution: e.g. 10,00 mg/25 mL Hexane c= 400 mg/L
Dilution 1 (1:100) 1 ml stock solution in 100.0 mL c= 4.0 mg/L
Cal. Std. 12 µL D1/1 mLc = 0.008 µg/mL
Cal. Std. 24 µL D1/1 mLc = 0.016 µg/mL
Cal. Std. 38 µL D1/1 mLc = 0.032 µg/mL
Cal. Std. 420 µL D1/1 mLc = 0.080 µg/mL
Cal. Std. 530 µL D1/1 mLc = 0.120 µg/mL
996 µL Hexane 2 µL ISTD 2 µL D1
994 µL Hexane 2 µL ISTD 4 µL D1
990 µL Hexane 2 µL ISTD 8 µL D1
978 µL Hexane 2 µL ISTD 20 µL D1
968 µL Hexane 2 µL ISTD 30 µL D1
Procedure: Solvent hexane is dosed intothe vial using the 1000 µL syringe. ISTD-solution is added with 10 µL syringe.Calibration solution is added with 10 µL(Cal. Std. 1 - Cal. Std. 3) and 100 µL syringe(Cal. Std. 4 and Cal. Std. 5).
Automated workflow 1 using 10 mL flasks
Automated workflow 2 using 2 mL vials

7IngeniousNews 02/2017
C:\Xcalibur\...\data09 09/20/16 20:16:21 KAl 1 A BG 111 10 ml
RT: 17.09 - 21.70
17.5 18.0 18.5 19.0 19.5 20.0Time (min)
50
100
50
100
50
100
Rel
ativ
e A
bund
ance
50
100
50
100
RT: 18.67MA: 94178SN: 215RMS
18.81 19.0118.18 18.5718.0017.8217.71RT: 18.67MA: 220317SN: 529RMS
18.85 19.08 19.1817.82 18.16 18.5017.70RT: 18.65MA: 484142SN: 509RMS
18.77 19.00 19.1518.5517.78 18.2418.06RT: 18.68MA: 1511372SN: 3062RMS
18.83 18.98 19.1418.3617.72 17.98 18.21RT: 18.68MA: 2385462SN: 6463RMS
18.97 19.0718.4917.9917.78 18.13
RT: 17.45 - 21.08
18.0 18.2 18.4 18.6 18.8 19.0 19.2Time (min)
10
20
30
40
50
60
70
80
90
100
10
20
30
40
50
60
70
80
90
100
Rel
ativ
e A
bund
ance
RT: 18.67AA: 97207SN: 455
RT: 18.56AA: 1034652SN: 2749
Benzophenone:m/z = 182 SIM Mode
ISTD1- Benzophenone-d10:m/z=192 SIM Mode
Chromatogram benzophenone:m/z = 182 SIM Mode Cal. Std. 1: c=0,0082 µg/mL
Cal. Std. 2: c=0,0165 µg/mL
Cal. Std. 3: c=0,0329 µg/mL
Cal. Std. 4: c=0,0823µg/mL
Cal. Std. 5: c=0,1317 µg/mL
Example of GC/MS data of different concentrations of benzophenone
Component Name Curve Index Weigh�ng Index Origin Index Equa�on
Benzophenone Linear Equal Ignore Y = -0.0194009+14.3998*X R^2 = 0.9998
Specified CalculatedFilename Sample Type Sample Name Integ. Type Area ISTD Area Area Ra�o Amount Amount
data09 Std Bracket Sample KAl 1 A BG 111 10 ml Method Se�ngs 100056 974033 0,103 0,0082 0,0085
data10 Std Bracket Sample KAl 2 A BG 111 10 ml Method Se�ngs 228383 1027645 0,222 0,0165 0,0168
data11 Std Bracket Sample KAl 3 A BG 111 10 ml Method Se�ngs 489830 1117880 0,438 0,0329 0,0318
data12 Std Bracket Sample KAl 4 A BG 111 10 ml Method Se�ngs 1522545 1290800 1,180 0,0823 0,0833
data13 Std Bracket Sample KAl 5 A BG 111 10 ml Method Se�ngs 2433599 1299926 1,872 0,1317 0,1314

8 IngeniousNews 02/2017
Comparison of statistical performance figures for Benzophenone calibration curves
BenzophenoneY = -0.0571911+13.7614*X R^2 = 0.9920 W: Equal
0.00 0.02 0.04 0.06 0.08 0.10 0.12 0.14mg/kg
0.0
0.2
0.4
0.6
0.8
1.0
1.2
1.4
1.6
1.8
Are
a R
atio
Manual process:
y= 13,761*X-0,00571Residual variation (Sy) = 0,0722Area Ratio Standard deviation of the process (Sx0) = 0,0053 µg/mLCoefficient of variation for the process(Vx0) = 9,71 %r = 0,9962
BenzophenoneY = -0.0194009+14.3998*X R^2 = 0.9998 W: Equal
0.00 0.02 0.04 0.06 0.08 0.10 0.12 0.14mg/kg
0.0
0.2
0.4
0.6
0.8
1.0
1.2
1.4
1.6
1.8
2.0
Are
a R
atio
Automatic workflow with 10 mL vol. flask:
y= 14,3998*X-0,0194Residual variation (Sy) = 0,0133Area Ratio Standard deviation of the process (Sx0) = 0,0009 µg/mLCoefficient of variation for the process(Vx0) = 1,70 %r = 0,9999
BenzophenoneY = -0.0178524+7.26178*X R^2 = 0.9997 W: Equal
0.00 0.02 0.04 0.06 0.08 0.10 0.12mg/kg
0.0
0.1
0.2
0.3
0.4
0.5
0.6
0.7
0.8
0.9
Are
a R
atio
Automatic workflow with 2 mL vial :
y= 7,261*X-0,0178 (*2= 14,54)Residual variation (Sy) = 0,0083Area Ratio Standard deviation of the process (Sx0) = 0,0011 µg/mLCoefficient of variation for the process(Vx0) = 2,18 %r = 0,9998

9IngeniousNews 02/2017
Comparison of statistical performance figures for Phenanthrene calibration curves
PhenanthreneY = -0.325637+53.973*X R^2 = 0.9954 W: Equal
0.00 0.02 0.04 0.06 0.08 0.10 0.12 0.14 0.16mg/kg
0
1
2
3
4
5
6
7
8
Are
a R
atio
Manual process:
y= 53,973*X-0,3256Residual variation (Sy) = 0,2465Area Ratio Standard deviation of the process (Sx0) = 0,0046 µg/mLCoefficient of variation for the process(Vx0) = 7,45 %r = 0,9977
PhenanthreneY = -0.262474+55.1781*X R^2 = 0.9991 W: Equal
0.00 0.02 0.04 0.06 0.08 0.10 0.12 0.14 0.16mg/kg
0
1
2
3
4
5
6
7
8
Are
a R
atio
Automatic workflow with 10 mL vol. flask:
y= 55,178*X-0,2625Residual variation (Sy) = 0,1105Area Ratio Standard deviation of the process (Sx0) = 0,0020 µg/mLCoefficient of variation for the process(Vx0) = 3,26 %r = 0,9996
PhenanthreneY = -0.141292+26.4378*X R^2 = 0.9984 W: Equal
0.00 0.02 0.04 0.06 0.08 0.10 0.12 0.14mg/kg
0.0
0.5
1.0
1.5
2.0
2.5
3.0
3.5
Are
a R
atio
Automatic workflow with 2 mL vial:
y= 26,438*X-0,1413 (*2= 52,72)Residual variation (Sy) = 0,0650Area Ratio Standard deviation of the process (Sx0) = 0,0025 µg/mLCoefficient of variation for the process(Vx0) = 4,13 %r = 0,9993

10 IngeniousNews 02/2017
Comparison of statistical performance figures for 2-methylnaphthalene calibration curves
2-methylnaphthaleneY = -0.0924745+60.4884*X R^2 = 0.9998 W: Equal
0.00 0.02 0.04 0.06 0.08 0.10 0.12 0.14 0.16mg/kg
0
1
2
3
4
5
6
7
8
9
Are
a R
atio
Manual process:
y= 60,488*X - 0,0092Residual variation (Sy) = 0,0824Area Ratio Process standard deviation(Sx0) = 0,0014 µg/mLCoefficient of variation for the process(Vx0) = 2,26 %r = 0,9998
2-methylnaphthaleneY = -0.00895945+60.8755*X R^2 = 0.9992 W: Equal
0.00 0.02 0.04 0.06 0.08 0.10 0.12 0.14 0.16mg/kg
0
1
2
3
4
5
6
7
8
9
Are
a R
atio
Automatic workflow with 10 mL vol. flask:
y= 60,875*X-0,00895Residual variation (Sy) = 0,1027Area Ratio Process standard deviation(Sx0) = 0,0017 µg/mLCoefficient of variation for the process(Vx0) = 2,79 %r = 0,9997
2-methylnaphthaleneY = -0.0997355+30.1846*X R^2 = 0.9990 W: Equal
0.00 0.02 0.04 0.06 0.08 0.10 0.12 0.14mg/kg
0.0
0.5
1.0
1.5
2.0
2.5
3.0
3.5
4.0
Are
a R
atio
Automatic workflow with 2 mL vial:
y= 30,185*X-0,00997 (*2= 60,328)Residual variation (Sy) = 0,0732Area Ratio Process standard deviation(Sx0) = 0,0024 µg/mLCoefficient of variation for the process(Vx0) = 4,14 %r = 0,9993

11IngeniousNews 02/2017
Precision (6-fold determination of the analytes)
Conclusions
• The statistical specifications for the manual and automatic (PAL RTC) generation of calibrations models are comparable, with the automated process being more reproducible.
• The automatic generation is fully traceable.• The automatic handling frees up the operators for more valuable tasks.• Calibration curves can be generated automatically while a sequence is running. Instable calibration samples can always be
prepared freshly from stable stock solutions.• The demonstrated small volume workflow allows for the use of certified standard solutions. At the same time it reduces the
consumption of solvents.
Benzophenone Phenanthrene 2- methylnaphthalene
Results RTC workflow 1 RTC workflow 2 Manual RTC workflow 1 RTC workflow 2 Manual RTC workflow 1 RTC workflow 2 Manual
10 mL 1 mL 10 mL 1 mL 10 mL 1 mL1 0,0088 0,0094 0,0088 0,0114 0,0080 0,0118 0,0089 0,0084 0,00902 0,0085 0,0094 0,0085 0,0113 0,0079 0,0116 0,0090 0,0084 0,00893 0,0085 0,0096 0,0084 0,0115 0,0079 0,0115 0,0086 0,0082 0,00884 0,0084 0,0095 0,0087 0,0114 0,0079 0,0115 0,0088 0,0082 0,00895 0,0086 0,0095 0,0086 0,0115 0,0079 0,0114 0,0088 0,0083 0,00886 0,0089 0,0094 0,0089 0,0114 0,0079 0,0116 0,0088 0,0084 0,0090
significance level 5 % 5 % 5 % 5 % 5 % 5 % 5 % 5 % 5 %
mean value 0,0086 0,0095 0,0087 0,0114 0,0079 0,0116 0,0088 0,0084 0,0089
median 0,0086 0.0095 0.0087 0,0114 0,0079 0,0116 0,0088 0.0084 0.0089
range (R) 0,0005 0.0002 0.0005 0,0002 0,0001 0,0004 0,0004 0.0003 0.0002
standard deviation (s) 0,0002 0.0001 0.0002 0,0001 0.0001 0,0001 0,0001 0.0001 0.0001
coefficient of varaition (VK) 2,25% 0,86% 2,16% 0,66% 0,52% 1,18% 1,51% 1.13 % 1,04%
repeatability 0,0002 0,0002 0.0005 0,0002 0,0001 0,0004 0,0004 0.0004 0.0003
confidence range (VBx) 0,0001 0.0001 0.0002 0,0001 0,0001 0,0001 0,0001 0.0002 0.0001

12 IngeniousNews 02/2017
More samples in less time for less moneyCost/sample is at least 45% lower for SPME Arrow
Labor and running cost (consumables, solvents) plus instrument up time determine the cost structure for a certain analysis workflow.
Now you can save time and money by switching to SPME Arrow, the better SPME.
SPME Fiber:
• Typical lifetime of a SPME fiber <150 injections List price 486 USD / 3pcs (US*)
1.10 $/sample for for SPME fibers
SPME Arrow:
• Typical lifetime of an PAL SPME Arrow fiber > 500 injections List price 880 USD / 3pcs
0.60 $/sample for SPME Arrow
Not considered in the calculation above is the increased downtime/lost productive time because of required septa and fiber changes when working with SPME fibers!
Septum lifetime SPME fiber: ~50 injections
Septum lifetime SPME Arrow: ~200 injectionsno septum particles in the liner
*Source. http://www.sigmaaldrich.com/ on 07Nov2016
septum
linerResidues onliner wall
SPME Arrow SPME Fiber
Puncturing an injector septum
Figure 2: Puncturing a septum in an injector
PAL SPME Arrow SPME
Figure 1: Robustness of SPME Arrow compared to SPME Fiber

13IngeniousNews 02/2017
Your bill for 500 samples:
PAL SPME Arrow costs less/sample and lets you use your instrument more effectively.
Requirements:
PAL RTC or RSI, firmware 2.3 or higher
See the PAL SPME Arrow brochure for more information.
� 2 x higher sample throughput.
� Up to 10 x more sensitivity - wider linear range.
� PAL SPME Arrows last at least 2 x longer.
� Injector septa last at least 2 x longer.
� Resulting in lower running costs.
= 2 x productivity �

14 IngeniousNews 02/2017
1 3
DOI 10.1007/s10337-016-3116-yChromatographia
ORIGINAL
Automated Mini‑Column Solid‑Phase Extraction Cleanup for High‑Throughput Analysis of Chemical Contaminants in Foods by Low‑Pressure Gas Chromatography—Tandem Mass Spectrometry
Steven J. Lehotay1 · Lijun Han1,2 · Yelena Sapozhnikova1
Received: 8 April 2016 / Accepted: 24 May 2016 © The Author(s) 2016. This article is published with open access at Springerlink.com
course of 5 days. In all, 325 analyses for 54 pesticides and 43 environmental contaminants (3 analyzed together) were conducted using the 10 min LPGC-MS/MS method with-out changing the liner or retuning the instrument. Merely, 1 mg equivalent sample injected achieved <5 ng g−1 lim-its of quantification. With the use of internal standards, method validation results showed that 91 of the 94 analytes including pairs achieved satisfactory results (70–120 % recovery and RSD ≤ 25 %) in the 10 tested food matrices(n = 160). Matrix effects were typically less than ±20 %,mainly due to the use of analyte protectants, and minimal human review of software data processing was needed due to summation function integration of analyte peaks. This study demonstrated that the automated mini-SPE + LPGC-MS/MS method yielded accurate results in rugged, high-throughput operations with minimal labor and data review.
Keywords High-throughput automation · Solid-phase extraction cleanup · Pesticide residue analysis · QuEChERS sample preparation · Fast GC-MS/MS · Analyte protectants · Environmental contaminants · Foods
Introduction
Trade of food products continues to increase globally [1], which is leading to greater food safety concerns [2, 3], and recent legislation [4] places greater emphasis on a higher rate of monitoring by private as well as regulatory laboratories to test for pesticide residues and other contaminants in the commodities. However, the cost of monitoring adds to the price of the food to the consumer, and delays in the analy-sis of perishable items reduces shelf life and sales of the product. Yet, more pesticides are being registered monthly for different crops worldwide [5], while human health and
Abstract This study demonstrated the application of an automated high-throughput mini-cartridge solid-phase extraction (mini-SPE) cleanup for the rapid low-pressure gas chromatography—tandem mass spectrometry (LPGC-MS/MS) analysis of pesticides and environmental contami-nants in QuEChERS extracts of foods. Cleanup efficiencies and breakthrough volumes using different mini-SPE sorb-ents were compared using avocado, salmon, pork loin, and kale as representative matrices. Optimum extract load vol-ume was 300 µL for the 45 mg mini-cartridges containing 20/12/12/1 (w/w/w/w) anh. MgSO4/PSA (primary second-ary amine)/C18/CarbonX sorbents used in the final method. In method validation to demonstrate high-throughput capa-bilities and performance results, 230 spiked extracts of 10 different foods (apple, kiwi, carrot, kale, orange, black olive, wheat grain, dried basil, pork, and salmon) under-went automated mini-SPE cleanup and analysis over the
Mention of brand or firm name does not constitute an endorsement by the US Department of Agriculture above others of a similar nature not mentioned. USDA is an equal opportunity provider and employer.
Published in the topical collection 5th Latin American Pesticide Residue Workshop with guest editor Steven J. Lehotay.
Electronic supplementary material The online version of this article (doi:10.1007/s10337-016-3116-y) contains supplementary material, which is available to authorized users.
* Steven J. [email protected]
1 US Department of Agriculture, Agricultural Research Service, Eastern Regional Research Center, 600 East Mermaid Lane, Wyndmoor, PA 19038, USA
2 College of Science, China Agricultural University, Beijing 100193, China
Copyright information ©The Author(s) 2016
Open AccessThis article is distributed under the terms of the Creative Commons Attribution 4.0 International License (http://creativecommons.org/licenses/by/4.0/), which permits unrestricted use, distribution, and reproduction in any medium, provided you give appropriate credit to the original author(s) and the source, provide a link to the Creative Commons license, and indicate if changes were made.

15IngeniousNews 02/2017
1 3
DOI 10.1007/s10337-016-3116-yChromatographia
ORIGINAL
Automated Mini‑Column Solid‑Phase Extraction Cleanup for High‑Throughput Analysis of Chemical Contaminants in Foods by Low‑Pressure Gas Chromatography—Tandem Mass Spectrometry
Steven J. Lehotay1 · Lijun Han1,2 · Yelena Sapozhnikova1
Received: 8 April 2016 / Accepted: 24 May 2016 © The Author(s) 2016. This article is published with open access at Springerlink.com
course of 5 days. In all, 325 analyses for 54 pesticides and 43 environmental contaminants (3 analyzed together) were conducted using the 10 min LPGC-MS/MS method with-out changing the liner or retuning the instrument. Merely, 1 mg equivalent sample injected achieved <5 ng g−1 lim-its of quantification. With the use of internal standards, method validation results showed that 91 of the 94 analytes including pairs achieved satisfactory results (70–120 % recovery and RSD ≤ 25 %) in the 10 tested food matrices(n = 160). Matrix effects were typically less than ±20 %,mainly due to the use of analyte protectants, and minimal human review of software data processing was needed due to summation function integration of analyte peaks. This study demonstrated that the automated mini-SPE + LPGC-MS/MS method yielded accurate results in rugged, high-throughput operations with minimal labor and data review.
Keywords High-throughput automation · Solid-phase extraction cleanup · Pesticide residue analysis · QuEChERS sample preparation · Fast GC-MS/MS · Analyte protectants · Environmental contaminants · Foods
Introduction
Trade of food products continues to increase globally [1], which is leading to greater food safety concerns [2, 3], and recent legislation [4] places greater emphasis on a higher rate of monitoring by private as well as regulatory laboratories to test for pesticide residues and other contaminants in the commodities. However, the cost of monitoring adds to the price of the food to the consumer, and delays in the analy-sis of perishable items reduces shelf life and sales of the product. Yet, more pesticides are being registered monthly for different crops worldwide [5], while human health and
Abstract This study demonstrated the application of an automated high-throughput mini-cartridge solid-phase extraction (mini-SPE) cleanup for the rapid low-pressure gas chromatography—tandem mass spectrometry (LPGC-MS/MS) analysis of pesticides and environmental contami-nants in QuEChERS extracts of foods. Cleanup efficiencies and breakthrough volumes using different mini-SPE sorb-ents were compared using avocado, salmon, pork loin, and kale as representative matrices. Optimum extract load vol-ume was 300 µL for the 45 mg mini-cartridges containing 20/12/12/1 (w/w/w/w) anh. MgSO4/PSA (primary second-ary amine)/C18/CarbonX sorbents used in the final method. In method validation to demonstrate high-throughput capa-bilities and performance results, 230 spiked extracts of 10 different foods (apple, kiwi, carrot, kale, orange, black olive, wheat grain, dried basil, pork, and salmon) under-went automated mini-SPE cleanup and analysis over the
Mention of brand or firm name does not constitute an endorsement by the US Department of Agriculture above others of a similar nature not mentioned. USDA is an equal opportunity provider and employer.
Published in the topical collection 5th Latin American Pesticide Residue Workshop with guest editor Steven J. Lehotay.
Electronic supplementary material The online version of this article (doi:10.1007/s10337-016-3116-y) contains supplementary material, which is available to authorized users.
* Steven J. [email protected]
1 US Department of Agriculture, Agricultural Research Service, Eastern Regional Research Center, 600 East Mermaid Lane, Wyndmoor, PA 19038, USA
2 College of Science, China Agricultural University, Beijing 100193, China
Copyright information ©The Author(s) 2016
Open AccessThis article is distributed under the terms of the Creative Commons Attribution 4.0 International License (http://creativecommons.org/licenses/by/4.0/), which permits unrestricted use, distribution, and reproduction in any medium, provided you give appropriate credit to the original author(s) and the source, provide a link to the Creative Commons license, and indicate if changes were made.
S. J. Lehotay et al.
1 3
ecotoxicological risk assessment studies lead to frequent modifications of maximum residue limits (MRLs) [6], which places great demands on labs and methods to achieve high quality results, including analyte identification [7] of an ever expanding scope of ultra-trace contaminants in diverse, com-plicated food matrices. High economic, legal, and health risks are at stake, and the goal of the routine monitoring lab is to provide accurate results in the most efficient (cost-effec-tive, high-throughput, automated) process possible.
Streamlined sample preparation with approaches such as QuEChERS (quick, easy, cheap, effective, rugged, and safe) [8, 9], and expanding scope of analytes to include environmental and emerging contaminants as well as pes-ticides [10], provides value in both higher sample through-put and savings by performing fewer methods for the same samples. Automation of sample cleanup conducted in parallel with the analytical step typically decreases labor, improves precision, and yields higher sample throughput. As a result, a number of different robotic instruments and approaches are available for automated sample preparation in food analysis applications [11].
Morris and Schriner [12] described an automated mini-cartridge solid-phase extraction (mini-SPE) cleanup approach called “instrument top sample preparation” (ITSP). They developed and demonstrated automated mini-SPE of QuEChERS extracts for liquid chromatography–tandem mass spectrometry (LC–MS/MS) analysis of 263 pesticide analytes in avocado, citrus and buttercup squash [12]. Cartridge-based SPE (c-SPE) usually provides better cleanup than dispersive-SPE (d-SPE) that is often incor-porated in QuEChERS sample preparation [9]. In manual batch applications, d-SPE is usually cheaper, easier, and faster than traditional c-SPE, especially filter-vial d-SPE which conveniently cleans and filters extracts in autosam-pler vials [13]. However, online SPE techniques that per-form cleanup at the same time as the analytical step have the added potential to reduce analyte degradation possible in batch operations when many hours can pass before final extracts are analyzed in long sequences.
Ultrahigh-performance (UHP) LC–MS/MS usually takes about 10–15 min for analysis of hundreds of analytes [14, 15], but conventional gas chromatography (GC)–MS/(MS) commonly entails 25–50 min per sample [16]. How-ever, low-pressure (LP) GC-MS(/MS) only takes 10 min per analysis of the same number of analytes with an accept-ably small loss of separation efficiency, while providing increased sample capacity, sensitivity, and ruggedness [17]. In high-throughput analyses involving both LC- and GC-amenable analytes, the sample throughput is limited by the slower method, and LPGC-MS/MS is fast enough to keep pace with UHPLC-MS/MS [18].
The aim of this study was to evaluate, optimize, and val-idate automated mini-SPE cleanup of QuEChERS extracts,
and demonstrate the feasibility of the robotic sample prepa-ration coupled with fast LPGC-MS/MS using analyte pro-tectants and summation function integration to provide high-throughput monitoring of pesticides and other resi-dues in foods with minimal human involvement. A state-of-the-art GC-MS/MS was used to reduce the amount of equivalent sample injected and extend maintenance-free operation of the instrument while still meeting <10 ng g−1 quantification limit requirements.
Experimental
Chemicals and Materials
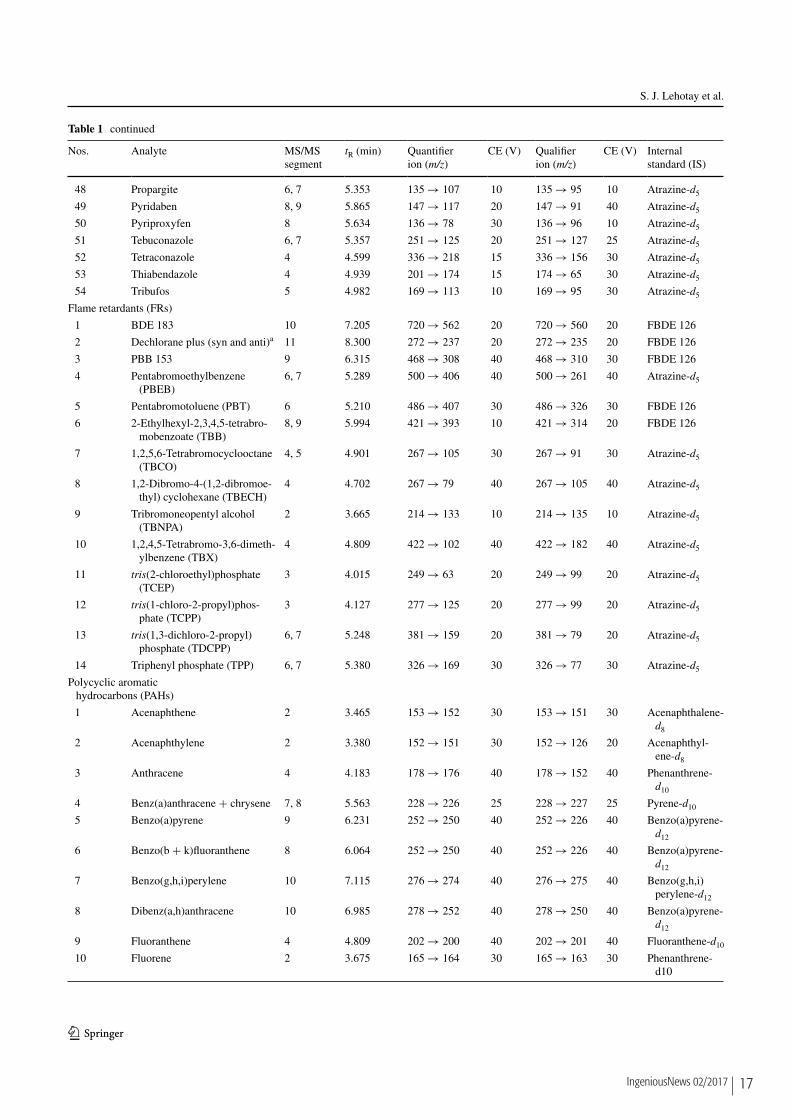
HPLC-grade acetonitrile (MeCN) was purchased from Fisher Scientific (Pittsburgh, PA; USA) and deionized water of 18.2 MΩ-cm came from a Barnstead/Thermolyne (Dubuque, IA; USA) E-Pure Model D4641. Ammonium formate (HCO2NH4) was purchased from Sigma-Aldrich (Saint Louis, MO; USA). Pesticide standards were obtained from the Environmental Protection Agency’s National Pesticide Repository (Fort Meade, MD; USA), ChemSer-vice (West Chester, PA; USA), or Dr. Ehrenstorfer GmbH (Augsburg; Germany). Standards of 14 flame retardants (FRs), 14 polychlorinated biphenyls (PCBs), and 15 poly-cyclic aromatic hydrocarbons (PAHs) were purchased from Sigma-Aldrich, AccuStandard (New Haven, CT; USA), and Santa Cruz Biotechnology (Santa Cruz, CA; USA). Table 1 lists all the analytes in the different categories (pesticides, FRs, PCBs, and PAHs).
A working standard of the 97 pesticides and environmen-tal contaminants was prepared at 5 ng µL−1 (0.5 ng µL−1 for PCBs) in MeCN solution. This mixed standard served as the highest level spiking solution (100 ng mL−1 in extracts), and it was also used to prepare the 2.5, 1.25, and 0.5 ng µL−1 standard solutions for lower spiking levels (50, 25, and 10 ng mL−1, respectively).
For use as internal standards (IS), atrazine-d5 and fen-thion-d6 were from C/D/N Isotopes (Pointe-Claire, Quebec; Canada). 13C12-PCB 153 and a PAH mixture of acenaph-thylene-d8, benzo[a]pyrene-d12, benzo[g,h,i]perylene-d12, fluoranthene-d10, naphthalene-d8, phenanthrene-d10, and pyrene-d10 were purchased from Cambridge Isotope Laboratories (Andover, MA; USA). Another IS, 5′-fluoro-3,3′,4,4′,5-pentabromodiphenyl ether (FBDE 126), was obtained from AccuStandard. The IS mixture solu-tion was prepared in MeCN solution at 5 ng µL−1 except 0.5 ng µL−1 for 13C12 PCB 153.
Analyte protectants (APs) [19] containing 25 mg mL−1 ethylglycerol, 2.5 mg mL−1 each of gulonolactone and d-sorbitol, and 1.25 mg mL−1 shikimic acid (all fromSigma-Aldrich) was prepared in 3/2 (v/v) MeCN/water

16 IngeniousNews 02/2017
Automated Mini-Column Solid-Phase Extraction Cleanup for High-Throughput Analysis of…
1 3
Table 1 Parameters in LPGC-MS/MS analysis of the 94 analytes including three pairs (CE collision energy)
Nos. Analyte MS/MS segment
tR (min) Quantifier ion (m/z)
CE (V) Qualifier ion (m/z)
CE (V) Internal standard (IS)
Pesticides
1 Acephate 2 3.275 136 → 42 10 136 → 94 10 Atrazine-d5
2 Aldrin 4 4.600 263 → 193 40 263 → 228 20 Atrazine-d5
3 Atrazine 3 3.999 215 → 200 10 215 → 138 10 Atrazine-d5
4 Bifenthrin 7, 8 5.479 181 → 165 30 181 → 166 15 Atrazine-d5
5 Carbofuran 3 3.985 164 → 103 25 164 → 149 5 Atrazine-d5
6 Carbophenothion 6 5.259 342 → 157 5 157 → 75 40 Atrazine-d5
7 Chlorothalonil 3 4.220 266 → 133 40 266 → 168 25 Atrazine-d5
8 Chlorpyrifos 4 4.581 199 → 171 20 314 → 258 20 Atrazine-d5
9 Coumaphos 8, 9 5.890 362 → 109 15 362 → 81 40 Atrazine-d5
10 Cyfluthrina 8 5.857 163 → 127 5 163 → 91 15 Atrazine-d5
11 Cypermethrina 9 6.043 181 → 152 20 163 → 91 15 Atrazine-d5
12 Cyprodinil 4 4.712 224 → 208 25 224 → 197 25 Atrazine-d5
13 o,p′-DDE 4 4.867 246 → 176 35 318 → 248 25 Atrazine-d5
14 p,p′-DDE 5 5.004 246 → 176 35 318 → 248 25 Atrazine-d5
15 Deltamethrina 8, 9 6.435 181 → 152 25 181 → 127 25 Atrazine-d5
16 Diazinon 3 4.111 179 → 137 20 304 → 179 15 Atrazine-d5
17 Dicrotophos 2 3.828 127 → 109 10 127 → 95 15 Atrazine-d5
18 Dimethoate 3 3.978 93 → 63 5 125 → 93 15 Atrazine-d5
19 Diphenylamine 2 3.736 169 → 168 10 169 → 140 40 Atrazine-d5
20 Endosulfan I 4 4.956 241 → 206 15 241 → 170 30 Atrazine-d5
21 Endosulfan II 5, 6 5.165 241 → 206 15 241 → 170 30 Atrazine-d5
22 Endosulfan sulfate 6, 7 5.323 387 → 253 15 387 → 206 30 Atrazine-d5
23 Esfenvaleratea 9 6.259 167 → 125 5 167 → 89 35 Atrazine-d5
24 Ethalfluralin 2, 3 3.771 276 → 202 15 276 → 105 25 Atrazine-d5
25 Ethoprop 2 3.749 242 → 158 5 242 → 127 10 Atrazine-d5
26 Fenpropathrin 7, 8 5.493 181 → 152 20 181 → 77 40 Atrazine-d5
27 Fipronil 4 4.751 367 → 213 35 367 → 255 20 Atrazine-d5
28 Flutriafol 4, 5 4.954 219 → 123 20 219 → 95 40 Atrazine-d5
29 Heptachlor 4 4.430 272 → 237 20 272 → 117 35 Atrazine-d5
30 Heptachlor epoxide 4 4.775 353 → 263 15 353 → 253 25 Atrazine-d5
31 Heptenophos 2 3.611 124 → 89 10 124 → 63 35 Atrazine-d5
32 Hexachlorobenzene (HCB) 3 3.981 284 → 214 35 284 → 249 20 Atrazine-d5
33 Imazalil 5 4.986 215 → 173 10 215 → 145 30 Atrazine-d5
34 Kresoxim-methyl 5 5.019 116 → 89 20 206 → 131 20 Atrazine-d5
35 Lindane (γ-BHC or γ-HCH) 3 4.092 219 → 183 5 183 → 147 15 Atrazine-d5
36 Methamidophos 1 2.855 141 → 95 5 95 → 79 10 Atrazine-d5
37 Methoxychlor 7, 8 5.507 227 → 169 30 227 → 141 30 Atrazine-d5
38 Mirex 8 5.728 272 → 237 15 272 → 143 40 Atrazine-d5
39 Myclobutanil 5 5.016 179 → 125 15 179 → 90 35 Atrazine-d5
40 cis-Nonachlor 6 5.208 409 → 300 25 409 → 145 15 Atrazine-d5
41 trans-Nonachlor 5 4.962 409 → 300 25 409 → 145 15 Atrazine-d5
42 Omethoate 2 3.666 110 → 79 15 156 → 110 5 Atrazine-d5
43 Penconazole 4 4.742 159 → 89 35 248 → 157 25 Atrazine-d5
44 Pentachlorothioanisole 3 3.996 280 → 237 20 280 → 265 10 Atrazine-d5
45 Permethrin (cis + trans)a 8, 9 5.835 183 → 168 15 183 → 153 15 Atrazine-d5
46 o-Phenylphenol 2 3.485 170 → 115 35 170 → 141 20 Atrazine-d5
47 Piperonyl butoxide 6, 7 5.357 176 → 103 25 176 → 131 10 Atrazine-d5
17IngeniousNews 02/2017
Automated Mini-Column Solid-Phase Extraction Cleanup for High-Throughput Analysis of…
1 3
Table 1 Parameters in LPGC-MS/MS analysis of the 94 analytes including three pairs (CE collision energy)
Nos. Analyte MS/MS segment
tR (min) Quantifier ion (m/z)
CE (V) Qualifier ion (m/z)
CE (V) Internal standard (IS)
Pesticides
1 Acephate 2 3.275 136 → 42 10 136 → 94 10 Atrazine-d5
2 Aldrin 4 4.600 263 → 193 40 263 → 228 20 Atrazine-d5
3 Atrazine 3 3.999 215 → 200 10 215 → 138 10 Atrazine-d5
4 Bifenthrin 7, 8 5.479 181 → 165 30 181 → 166 15 Atrazine-d5
5 Carbofuran 3 3.985 164 → 103 25 164 → 149 5 Atrazine-d5
6 Carbophenothion 6 5.259 342 → 157 5 157 → 75 40 Atrazine-d5
7 Chlorothalonil 3 4.220 266 → 133 40 266 → 168 25 Atrazine-d5
8 Chlorpyrifos 4 4.581 199 → 171 20 314 → 258 20 Atrazine-d5
9 Coumaphos 8, 9 5.890 362 → 109 15 362 → 81 40 Atrazine-d5
10 Cyfluthrina 8 5.857 163 → 127 5 163 → 91 15 Atrazine-d5
11 Cypermethrina 9 6.043 181 → 152 20 163 → 91 15 Atrazine-d5
12 Cyprodinil 4 4.712 224 → 208 25 224 → 197 25 Atrazine-d5
13 o,p′-DDE 4 4.867 246 → 176 35 318 → 248 25 Atrazine-d5
14 p,p′-DDE 5 5.004 246 → 176 35 318 → 248 25 Atrazine-d5
15 Deltamethrina 8, 9 6.435 181 → 152 25 181 → 127 25 Atrazine-d5
16 Diazinon 3 4.111 179 → 137 20 304 → 179 15 Atrazine-d5
17 Dicrotophos 2 3.828 127 → 109 10 127 → 95 15 Atrazine-d5
18 Dimethoate 3 3.978 93 → 63 5 125 → 93 15 Atrazine-d5
19 Diphenylamine 2 3.736 169 → 168 10 169 → 140 40 Atrazine-d5
20 Endosulfan I 4 4.956 241 → 206 15 241 → 170 30 Atrazine-d5
21 Endosulfan II 5, 6 5.165 241 → 206 15 241 → 170 30 Atrazine-d5
22 Endosulfan sulfate 6, 7 5.323 387 → 253 15 387 → 206 30 Atrazine-d5
23 Esfenvaleratea 9 6.259 167 → 125 5 167 → 89 35 Atrazine-d5
24 Ethalfluralin 2, 3 3.771 276 → 202 15 276 → 105 25 Atrazine-d5
25 Ethoprop 2 3.749 242 → 158 5 242 → 127 10 Atrazine-d5
26 Fenpropathrin 7, 8 5.493 181 → 152 20 181 → 77 40 Atrazine-d5
27 Fipronil 4 4.751 367 → 213 35 367 → 255 20 Atrazine-d5
28 Flutriafol 4, 5 4.954 219 → 123 20 219 → 95 40 Atrazine-d5
29 Heptachlor 4 4.430 272 → 237 20 272 → 117 35 Atrazine-d5
30 Heptachlor epoxide 4 4.775 353 → 263 15 353 → 253 25 Atrazine-d5
31 Heptenophos 2 3.611 124 → 89 10 124 → 63 35 Atrazine-d5
32 Hexachlorobenzene (HCB) 3 3.981 284 → 214 35 284 → 249 20 Atrazine-d5
33 Imazalil 5 4.986 215 → 173 10 215 → 145 30 Atrazine-d5
34 Kresoxim-methyl 5 5.019 116 → 89 20 206 → 131 20 Atrazine-d5
35 Lindane (γ-BHC or γ-HCH) 3 4.092 219 → 183 5 183 → 147 15 Atrazine-d5
36 Methamidophos 1 2.855 141 → 95 5 95 → 79 10 Atrazine-d5
37 Methoxychlor 7, 8 5.507 227 → 169 30 227 → 141 30 Atrazine-d5
38 Mirex 8 5.728 272 → 237 15 272 → 143 40 Atrazine-d5
39 Myclobutanil 5 5.016 179 → 125 15 179 → 90 35 Atrazine-d5
40 cis-Nonachlor 6 5.208 409 → 300 25 409 → 145 15 Atrazine-d5
41 trans-Nonachlor 5 4.962 409 → 300 25 409 → 145 15 Atrazine-d5
42 Omethoate 2 3.666 110 → 79 15 156 → 110 5 Atrazine-d5
43 Penconazole 4 4.742 159 → 89 35 248 → 157 25 Atrazine-d5
44 Pentachlorothioanisole 3 3.996 280 → 237 20 280 → 265 10 Atrazine-d5
45 Permethrin (cis + trans)a 8, 9 5.835 183 → 168 15 183 → 153 15 Atrazine-d5
46 o-Phenylphenol 2 3.485 170 → 115 35 170 → 141 20 Atrazine-d5
47 Piperonyl butoxide 6, 7 5.357 176 → 103 25 176 → 131 10 Atrazine-d5
S. J. Lehotay et al.
1 3
Table 1 continued
Nos. Analyte MS/MS segment
tR (min) Quantifier ion (m/z)
CE (V) Qualifier ion (m/z)
CE (V) Internal standard (IS)
48 Propargite 6, 7 5.353 135 → 107 10 135 → 95 10 Atrazine-d5
49 Pyridaben 8, 9 5.865 147 → 117 20 147 → 91 40 Atrazine-d5
50 Pyriproxyfen 8 5.634 136 → 78 30 136 → 96 10 Atrazine-d5
51 Tebuconazole 6, 7 5.357 251 → 125 20 251 → 127 25 Atrazine-d5
52 Tetraconazole 4 4.599 336 → 218 15 336 → 156 30 Atrazine-d5
53 Thiabendazole 4 4.939 201 → 174 15 174 → 65 30 Atrazine-d5
54 Tribufos 5 4.982 169 → 113 10 169 → 95 30 Atrazine-d5
Flame retardants (FRs)
1 BDE 183 10 7.205 720 → 562 20 720 → 560 20 FBDE 126
2 Dechlorane plus (syn and anti)a 11 8.300 272 → 237 20 272 → 235 20 FBDE 126
3 PBB 153 9 6.315 468 → 308 40 468 → 310 30 FBDE 126
4 Pentabromoethylbenzene (PBEB)
6, 7 5.289 500 → 406 40 500 → 261 40 Atrazine-d5
5 Pentabromotoluene (PBT) 6 5.210 486 → 407 30 486 → 326 30 FBDE 126
6 2-Ethylhexyl-2,3,4,5-tetrabro-mobenzoate (TBB)
8, 9 5.994 421 → 393 10 421 → 314 20 FBDE 126
7 1,2,5,6-Tetrabromocyclooctane (TBCO)
4, 5 4.901 267 → 105 30 267 → 91 30 Atrazine-d5
8 1,2-Dibromo-4-(1,2-dibromoe-thyl) cyclohexane (TBECH)
4 4.702 267 → 79 40 267 → 105 40 Atrazine-d5
9 Tribromoneopentyl alcohol (TBNPA)
2 3.665 214 → 133 10 214 → 135 10 Atrazine-d5
10 1,2,4,5-Tetrabromo-3,6-dimeth-ylbenzene (TBX)
4 4.809 422 → 102 40 422 → 182 40 Atrazine-d5
11 tris(2-chloroethyl)phosphate (TCEP)
3 4.015 249 → 63 20 249 → 99 20 Atrazine-d5
12 tris(1-chloro-2-propyl)phos-phate (TCPP)
3 4.127 277 → 125 20 277 → 99 20 Atrazine-d5
13 tris(1,3-dichloro-2-propyl)phosphate (TDCPP)
6, 7 5.248 381 → 159 20 381 → 79 20 Atrazine-d5
14 Triphenyl phosphate (TPP) 6, 7 5.380 326 → 169 30 326 → 77 30 Atrazine-d5
Polycyclic aromatic hydrocarbons (PAHs)
1 Acenaphthene 2 3.465 153 → 152 30 153 → 151 30 Acenaphthalene-d8
2 Acenaphthylene 2 3.380 152 → 151 30 152 → 126 20 Acenaphthyl-ene-d8
3 Anthracene 4 4.183 178 → 176 40 178 → 152 40 Phenanthrene-d10
4 Benz(a)anthracene + chrysene 7, 8 5.563 228 → 226 25 228 → 227 25 Pyrene-d10
5 Benzo(a)pyrene 9 6.231 252 → 250 40 252 → 226 40 Benzo(a)pyrene-d12
6 Benzo(b + k)fluoranthene 8 6.064 252 → 250 40 252 → 226 40 Benzo(a)pyrene-d12
7 Benzo(g,h,i)perylene 10 7.115 276 → 274 40 276 → 275 40 Benzo(g,h,i)perylene-d12
8 Dibenz(a,h)anthracene 10 6.985 278 → 252 40 278 → 250 40 Benzo(a)pyrene-d12
9 Fluoranthene 4 4.809 202 → 200 40 202 → 201 40 Fluoranthene-d10
10 Fluorene 2 3.675 165 → 164 30 165 → 163 30 Phenanthrene-d10

18 IngeniousNews 02/2017
Automated Mini-Column Solid-Phase Extraction Cleanup for High-Throughput Analysis of…
1 3
Table 1 continued
Nos. Analyte MS/MS segment
tR (min) Quantifier ion (m/z)
CE (V) Qualifier ion (m/z)
CE (V) Internal standard (IS)
11 Indeno(1,2,3-c,d)pyrene 10 6.926 276 → 274 30 276 → 275 30 Benzo(g,h,i)perylene-d12
12 Naphthalene 1 2.775 128 → 102 20 128 → 127 20 Naphthalene-d8
13 Phenanthrene 3 4.160 178 → 176 40 178 → 152 40 Phenanthrene-d10
14 Pyrene 5 4.943 202 → 200 40 202 → 201 40 Pyrene-d10
Polychlorinated biphenyls (PCBs)
1 PCB 77 6 5.049 292 → 222 40 292 → 220 25 13C12-PCB 153
2 PCB 81 5 5.010 292 → 222 40 292 → 220 25 13C12-PCB 153
3 PCB 105 7 5.251 326 → 256 30 326 → 254 30 13C12-PCB 153
4 PCB 114 6 5.193 326 → 256 30 326 → 254 30 13C12-PCB 153
5 PCB 118 + 123 5 5.144 326 → 254 30 326 → 256 30 13C12-PCB 153
6 PCB 126 7 5.366 326 → 256 40 326 → 254 40 13C12-PCB 153
7 PCB 156 + 157 7 5.538 360 → 288 40 360 → 290 40 13C12-PCB 153
8 PCB 167 8 5.421 360 → 290 40 360 → 288 40 13C12-PCB 153
9 PCB 169 8 5.650 360 → 288 40 360 → 290 40 13C12-PCB 153
10 PCB 170 7, 8 5.695 394 → 324 40 394 → 322 40 13C12-PCB 153
11 PCB 180 8 5.575 394 → 324 40 394 → 322 40 13C12-PCB 153
12 PCB 189 9 5.786 394 → 324 40 394 → 322 40 13C12-PCB 153
Internal standards (IS) and quality control (QC) standard
1 13C12-PCB 153 (IS) 6 5.185 372 → 302 40
2 Acenaphthalene-d8 (IS) 2 3.339 160 → 158 30
3 Atrazine-d5 (IS) 3 3.956 205 → 105 15
4 Benzo(a)pyrene-d12 (IS) 8, 9 6.261 264 → 260 40
5 Benzo(g,h,i)perylene-d12 (IS) 10 7.122 288 → 284 40
6 FBDE 126 (IS) 9 6.223 582 → 315 40
7 Fenthion-d6 (IS) 4 4.500 284 → 115 20
8 Fluoranthene-d10 (IS) 4 4.89 212 → 208 40
9 Naphthalene-d8 (IS) 1 2.744 136 → 80 40
10 Phenanthrene-d10 (IS) 3 4.11 188 → 160 20
11 Pyrene-d10 (IS) 5 4.89 212 → 210 40
12 p-Terphenyl-d14 (QC) 5 4.985 244 → 212 40
All ion transitions used wide resolution setting and 4 ms dwell times. Segment start times were: 1 = 2.35 min; 2 = 3.1; 3 = 3.9; 4 = 4.35;5 = 4.9; 6 = 5.15; 7 = 5.35; 8 = 5.5; 9 = 6; 10 = 6.75; and 11 = 8; end 9 mina Multiple peaks
containing 1.1 % formic acid to enhance pesticide stabil-ity of final extract [20]. As a post-cleanup quality control (QC) standard, p-terphenyl-d14 (from AccuStandard) was included in the APs mixture at 0.88 ng µL−1.
Eleven different food matrices including Gala apple, kiwi, kale, carrot, navel orange, canned black olives, wheat grain, dried basil, pork loin, salmon, and avocado were pur-chased from local grocery stores. The samples were com-minuted with dry ice using a Robot Coupe (Ridgeway, MS;
USA) RSI 2Y1 chopper and stored in glass jars at −20 °Cuntil analysis.
Sample Extraction
Comminuted samples of apple, kiwi, carrot, kale, orange, black olive, pork loin, salmon, and avocado (15 g) were individually weighed in 50 mL polypropylene tubes along with 7.5 g HCO2NH4, which was extracted for 10 min with

19IngeniousNews 02/2017
Automated Mini-Column Solid-Phase Extraction Cleanup for High-Throughput Analysis of…
1 3
Table 1 continued
Nos. Analyte MS/MS segment
tR (min) Quantifier ion (m/z)
CE (V) Qualifier ion (m/z)
CE (V) Internal standard (IS)
11 Indeno(1,2,3-c,d)pyrene 10 6.926 276 → 274 30 276 → 275 30 Benzo(g,h,i)perylene-d12
12 Naphthalene 1 2.775 128 → 102 20 128 → 127 20 Naphthalene-d8
13 Phenanthrene 3 4.160 178 → 176 40 178 → 152 40 Phenanthrene-d10
14 Pyrene 5 4.943 202 → 200 40 202 → 201 40 Pyrene-d10
Polychlorinated biphenyls (PCBs)
1 PCB 77 6 5.049 292 → 222 40 292 → 220 25 13C12-PCB 153
2 PCB 81 5 5.010 292 → 222 40 292 → 220 25 13C12-PCB 153
3 PCB 105 7 5.251 326 → 256 30 326 → 254 30 13C12-PCB 153
4 PCB 114 6 5.193 326 → 256 30 326 → 254 30 13C12-PCB 153
5 PCB 118 + 123 5 5.144 326 → 254 30 326 → 256 30 13C12-PCB 153
6 PCB 126 7 5.366 326 → 256 40 326 → 254 40 13C12-PCB 153
7 PCB 156 + 157 7 5.538 360 → 288 40 360 → 290 40 13C12-PCB 153
8 PCB 167 8 5.421 360 → 290 40 360 → 288 40 13C12-PCB 153
9 PCB 169 8 5.650 360 → 288 40 360 → 290 40 13C12-PCB 153
10 PCB 170 7, 8 5.695 394 → 324 40 394 → 322 40 13C12-PCB 153
11 PCB 180 8 5.575 394 → 324 40 394 → 322 40 13C12-PCB 153
12 PCB 189 9 5.786 394 → 324 40 394 → 322 40 13C12-PCB 153
Internal standards (IS) and quality control (QC) standard
1 13C12-PCB 153 (IS) 6 5.185 372 → 302 40
2 Acenaphthalene-d8 (IS) 2 3.339 160 → 158 30
3 Atrazine-d5 (IS) 3 3.956 205 → 105 15
4 Benzo(a)pyrene-d12 (IS) 8, 9 6.261 264 → 260 40
5 Benzo(g,h,i)perylene-d12 (IS) 10 7.122 288 → 284 40
6 FBDE 126 (IS) 9 6.223 582 → 315 40
7 Fenthion-d6 (IS) 4 4.500 284 → 115 20
8 Fluoranthene-d10 (IS) 4 4.89 212 → 208 40
9 Naphthalene-d8 (IS) 1 2.744 136 → 80 40
10 Phenanthrene-d10 (IS) 3 4.11 188 → 160 20
11 Pyrene-d10 (IS) 5 4.89 212 → 210 40
12 p-Terphenyl-d14 (QC) 5 4.985 244 → 212 40
All ion transitions used wide resolution setting and 4 ms dwell times. Segment start times were: 1 = 2.35 min; 2 = 3.1; 3 = 3.9; 4 = 4.35;5 = 4.9; 6 = 5.15; 7 = 5.35; 8 = 5.5; 9 = 6; 10 = 6.75; and 11 = 8; end 9 mina Multiple peaks
containing 1.1 % formic acid to enhance pesticide stabil-ity of final extract [20]. As a post-cleanup quality control (QC) standard, p-terphenyl-d14 (from AccuStandard) was included in the APs mixture at 0.88 ng µL−1.
Eleven different food matrices including Gala apple, kiwi, kale, carrot, navel orange, canned black olives, wheat grain, dried basil, pork loin, salmon, and avocado were pur-chased from local grocery stores. The samples were com-minuted with dry ice using a Robot Coupe (Ridgeway, MS;
USA) RSI 2Y1 chopper and stored in glass jars at −20 °Cuntil analysis.
Sample Extraction
Comminuted samples of apple, kiwi, carrot, kale, orange, black olive, pork loin, salmon, and avocado (15 g) were individually weighed in 50 mL polypropylene tubes along with 7.5 g HCO2NH4, which was extracted for 10 min with
S. J. Lehotay et al.
1 3
15 mL MeCN using a Glas-Col (Terre Haute, IN; USA) platform pulse mixer at 80 % setting with maximum pulsa-tion. For wheat grain and dried basil, 5 g sample + 15 mL water + 7.5 g HCO2NH4 was added to the tubes with 15 mL MeCN and extraction time was 60 min using the platform shaker (capacity of 50 tubes at a time). For rea-gent blanks, 15 mL water represented the sample. Then, centrifugation at 4150 rpm (3711 rcf) at room temperature for 3 min was conducted using a Thermo Fisher (Waltham, MA; USA) Sorvall Legend RT centrifuge (capacity of twenty 50 mL tubes at a time). Extracts of individual matrices were combined and spiked (or not) with the ana-lytes and IS to evaluate the automated mini-SPE cleanup step. The initial extracts (spiked or not) were transferred to 1.8 mL standard ambler glass autosampler (AS) vials, which were closed with split septa caps.
Automated Mini‑SPE Cleanup
As previously described [12], two different types of SPE mini-cartridges were purchased for evaluation from ITSP solutions (Hartwell, GA; USA): (1) 45 mg anh. MgSO4/pri-mary secondary amine (PSA)/C18/CarbonX (in the ratio of 20/12/12/1, w/w/w/w, respectively); and (2) 30 mg C18/Z-Sep/CarbonX (20.7/8.3/1, w/w/w, respectively). The mini-cartridges, as shown in the Table of Contents graphic and Supplemental information, were 3.5 cm long with a 0.8 cm diameter.
Automated mini-SPE was conducted using a Gerstel (Linthicum, MD; USA) robotic MultiPurpose Sampler (MPS) liquid handling system [also known as a PAL3-RTC from CTC Analytics (Zwingen, Switzerland)]. PAL Sample Control (CTC Analytics) software was used to program and operate the device. The steps in the final automated mini-SPE cleanup method using the 45 mg 4-sorbent mixture
(#1 above) are shown in Table 2. For matrix-matched cali-bration standards, Step 9 to add 25 µL MeCN was not done (Step 10 to add the APs + QC solution was still done), and instead, 25 µL of the appropriate calibration standard solu-tions were added manually to the matrix blank extracts.
Procedurally, the AS vials containing the initial extracts were placed into a 54 position tray (Tray1), and the corre-sponding collection AS vials with glass micro-inserts (300 µL) and split septa caps were placed into a second 54 posi-tion tray (Tray2). An ITSP vial guide cover for the mini-cartridges was placed atop the vials in Tray2. A third tray (Tray3) contained 96 mini-cartridges placed above a solvent waste drain (if pre-conditioning with solvent is desired). The same tray holder contained all 3 trays, and our system was fitted with two tray holders for a potential capacity of 108 samples for sequential unattended automated cleanup.
The robotic liquid handler was fitted with 3 interchange-able glass syringes (gastight with 57 mm long, 22 gage, straight tip needles) in different slots: 10, 1, and 0.1 mL. As shown in Table 2, only the 1 and 0.1 mL syringes were used in the experiments, and if we had chosen to install the device onto the LPGC-MS/MS instrument as designed as an option by the manufacturers, we would have chosen to replace the 10 mL syringe with a 5–10 µL syringe for direct injection of final extracts after cleanup. Instead, we chose to use the device in stand-alone fashion at this time (greater flexibility in independent operations for both LC and GC analyses).
The collection vials were pre-weighed to the nearest mg prior to and after conducting mini-SPE, and weight differences were recorded to assess consistency of the liquid transfers and final extract volumes. After weighing and preparation of calibration standards, the vials were recapped with non-slit septa, vortexed ≈1 s to mix, and placed on the autosampler tray for LPGC-MS/MS analysis.
Table 2 Steps and time for the 8 min automated mini-SPE method
The cleanup itself only took ≈3 min, and syringe wash and exchange steps took ≈5 min
Step Description Time (s)
1 Wash the 1 mL syringe with MeCN (2 pumps of 0.5 mL each) 30
2 Load 300 µL extract from AS vial in Tray1 into 1 mL syringe 10
3 Place mini-cartridge above collection AS vial (with glass insert) in Tray2 10
4 Elute extract through mini-cartridge at 2 µL s−1 150
5 Discard mini-cartridge into waste receptacle 5
6 Wash the 1 mL syringe with 1/1/1 MeCN/MeOH/water (2 pumps of 0.5 mL each) 30
7 Wash the 1 mL syringe with MeCN (4 pumps of 0.5 mL each) 45
8 Switch to 100 µL syringe and wash with MeCN (2 pumps of 50 µL each) 50
9 Add 25 µL MeCN to collection AS vial (with glass insert) in Tray2 10
10 Add 25 µL AP + QC sol’n to collection AS vial (with glass insert) in Tray2 10
11 Wash the 100 µL syringe with 1/1/1 MeCN/MeOH/water (5 pumps of 50 µL each) 50
12 Wash the 100 µL syringe with MeCN (3 pumps of 50 µL each) 40
13 Switch to 1 mL syringe and move to home position 40
20 IngeniousNews 02/2017
Automated Mini-Column Solid-Phase Extraction Cleanup for High-Throughput Analysis of…
1 3
Equivalent sample concentrations of final extracts dehy-drated by anh. MgSO4 in mini-SPE were 1 g mL−1 for fruits and vegetables, and 0.33 g mL−1 for wheat grain and dried basil.
Fast LPGC‑MS/MS Analysis
Table 1 lists the 97 targeted analytes (three analyzed together) plus 12 internal and quality control standards and their conditions in LPGC-MS/MS analysis. An Agilent (Little Falls, DE; USA) 7890A/7010 gas chromatograph/triple quadrupole mass spectrometer was employed using electron ionization (EI) at −70 eV and 100 µA filament current. The separation was achieved on a 15 m × 0.53 mm i.d. × 1 µm film thickness Phenomenex (Torrance, CA; USA) ZB-5MSi analytical column connected using an Agilent Ultimate union to a 5 m × 0.18 mm, i.e., uncoated restrictor/guard column from Restek (Belle-fonte, PA, USA). The calculated virtual column length was 5.5 m × 0.18 mm, i.e., and constant flow rate of He (99.999 %) carrier gas was 2 mL min−1. Details about the theory and practice of LPGC-MS/MS have been reported previously [17].
The GC oven temperature program was 70 °C for 1.5 min, ramped at 80–180 °C min−1, then 40–250 °C min−1, followed by 70–320 °C min−1, held for 4.4 min (10.025 min total). Cool down and re-equili-bration time was 3 min. The transfer line temperature was 280 °C, ion source was 320 °C, and quadrupoles were kept at 150 °C. Collision gas flow rate was 1.5 mL min−1 N2 and quench gas was 2.25 mL min−1 He. The Agilent multimode inlet conditions were the same as reported previously [10, 18], except injection volume was reduced to 1.0 µL plugged between 1.5 μL air above and below in the syringe. An Agilent Ultra-inert 2 mm dimpled splitless liner was placed in the inlet and Agilent Mass Hunter version B07 software was used for instrument control and data processing.
When using APs, extensive post-injection washing of the syringe with aqueous solution is very important to avoid sticking of the plunger if the sugar derivatives pre-cipitate onto surfaces. In this study, the wash steps of the 10 µL syringe entailed 10 × 5 µL of 1/1/1 (v/v/v) MeCN/MeOH/water followed by 10 × 5 µL of MeCN after every injection. The pre-injection wash steps called for another 5 µL of the aqueous wash solution and 2 × 5 µL of MeCN, each contained in 100 mL wash bottles.
Method Optimization and Validation Experiments
To evaluate the consistency and performance of the auto-mated mini-SPE application, and to assess cleanup effi-ciency and analyte retention vs. elution volumes for the two different cartridges, the 97 analytes were spiked into
extracts of four different matrices (kale, avocado, pork, and salmon). Spiking level was 100 ng mL−1 (10 ng mL−1 for PCBs), and five different volumes (200, 300, 400, 500, and 600 µL) of extracts in triplicate were loaded into the cartridges at 2 µL s−1. Proportional amounts of AP + QC mix were added to the final extracts depending on elution volumes, and the cleanup efficiency was compared in full scan LPGC-MS and UV–Vis measurements. A Synergy HT Multi-detection microplate reader from Bio-Tek (Winooski, VT; USA) was used for optical density measurements. Rel-ative recoveries of the analytes vs. extract load/elution vol-umes were measured using LPGC-MS/MS.
The final mini-SPE cleanup method was validated by spiking QuEChERS extracts of 10 sample matrices (Gala apple, kiwi, kale, carrot, navel orange, canned black olive, wheat grain, dried basil, pork loin, and salmon) at 10, 25, 50, and 100 ng mL−1 (ten times lower for PCBs) with n = 4 at each level and matrix. A pair of chemists prepared and analyzed 47 samples (65 injections) of two matrices per day (LPGC-MS/MS sequences took ≈14 h). The recov-eries and RSDs were determined from peak areas generated from summation function integration normalized (or not, for comparison purposes) to the corresponding IS listed in Table 1 for each analyte. Matrix-matched (MM) and rea-gent-only (RO) calibration standards (7 levels each: 0, 5, 10, 25, 50, 100, and 150 ng mL−1; tenfold lower for PCBs) were prepared by adding 25 µL calibration standards to final matrix blank extracts (MM) or 220 µL MeCN + 25 µL AP + QC solution (RO). The calibration solutions in MeCN each contained 0.88 ng µL−1 IS and 0, 0.044, 0.088, 0.22, 0.44, 0.88, and 1.32 ng µL−1 concentrations of the analytes (tenfold lower for PCBs and 13C12-PCB 153 as the IS) to yield the seven levels listed above. Matrix effects (MEs) were calculated as the % difference in least-linear squared calibration slopes of the MM vs. RO calibration standards.
Results and Discussion
LPGC‑MS/MS Analysis
In previous LPGC-MS/MS studies in our group, we used a 7000A MS/MS instrument [10, 21], which was upgraded to a 7000B [13, 18], and now to a 7010 system. In regulatory monitoring of pesticide residues in foods, the need of anal-ysis calls for LOQ <10 ng g−1 [22]. The injection of the least amount of sample equivalent to meet the desired LOQ improves the ruggedness of the method and reduces instru-ment maintenance demands. Originally with the 7000A instrument, 10 mg sample equivalent (1 mg µL−1 QuECh-ERS extracts in MeCN) was injected [10, 21], which was reduced to 2.5 mg when using the 7000B [18]. In this

21IngeniousNews 02/2017
Automated Mini-Column Solid-Phase Extraction Cleanup for High-Throughput Analysis of…
1 3
Equivalent sample concentrations of final extracts dehy-drated by anh. MgSO4 in mini-SPE were 1 g mL−1 for fruits and vegetables, and 0.33 g mL−1 for wheat grain and dried basil.
Fast LPGC‑MS/MS Analysis
Table 1 lists the 97 targeted analytes (three analyzed together) plus 12 internal and quality control standards and their conditions in LPGC-MS/MS analysis. An Agilent (Little Falls, DE; USA) 7890A/7010 gas chromatograph/triple quadrupole mass spectrometer was employed using electron ionization (EI) at −70 eV and 100 µA filament current. The separation was achieved on a 15 m × 0.53 mm i.d. × 1 µm film thickness Phenomenex (Torrance, CA; USA) ZB-5MSi analytical column connected using an Agilent Ultimate union to a 5 m × 0.18 mm, i.e., uncoated restrictor/guard column from Restek (Belle-fonte, PA, USA). The calculated virtual column length was 5.5 m × 0.18 mm, i.e., and constant flow rate of He (99.999 %) carrier gas was 2 mL min−1. Details about the theory and practice of LPGC-MS/MS have been reported previously [17].
The GC oven temperature program was 70 °C for 1.5 min, ramped at 80–180 °C min−1, then 40–250 °C min−1, followed by 70–320 °C min−1, held for 4.4 min (10.025 min total). Cool down and re-equili-bration time was 3 min. The transfer line temperature was 280 °C, ion source was 320 °C, and quadrupoles were kept at 150 °C. Collision gas flow rate was 1.5 mL min−1 N2 and quench gas was 2.25 mL min−1 He. The Agilent multimode inlet conditions were the same as reported previously [10, 18], except injection volume was reduced to 1.0 µL plugged between 1.5 μL air above and below in the syringe. An Agilent Ultra-inert 2 mm dimpled splitless liner was placed in the inlet and Agilent Mass Hunter version B07 software was used for instrument control and data processing.
When using APs, extensive post-injection washing of the syringe with aqueous solution is very important to avoid sticking of the plunger if the sugar derivatives pre-cipitate onto surfaces. In this study, the wash steps of the 10 µL syringe entailed 10 × 5 µL of 1/1/1 (v/v/v) MeCN/MeOH/water followed by 10 × 5 µL of MeCN after every injection. The pre-injection wash steps called for another 5 µL of the aqueous wash solution and 2 × 5 µL of MeCN, each contained in 100 mL wash bottles.
Method Optimization and Validation Experiments
To evaluate the consistency and performance of the auto-mated mini-SPE application, and to assess cleanup effi-ciency and analyte retention vs. elution volumes for the two different cartridges, the 97 analytes were spiked into
extracts of four different matrices (kale, avocado, pork, and salmon). Spiking level was 100 ng mL−1 (10 ng mL−1 for PCBs), and five different volumes (200, 300, 400, 500, and 600 µL) of extracts in triplicate were loaded into the cartridges at 2 µL s−1. Proportional amounts of AP + QC mix were added to the final extracts depending on elution volumes, and the cleanup efficiency was compared in full scan LPGC-MS and UV–Vis measurements. A Synergy HT Multi-detection microplate reader from Bio-Tek (Winooski, VT; USA) was used for optical density measurements. Rel-ative recoveries of the analytes vs. extract load/elution vol-umes were measured using LPGC-MS/MS.
The final mini-SPE cleanup method was validated by spiking QuEChERS extracts of 10 sample matrices (Gala apple, kiwi, kale, carrot, navel orange, canned black olive, wheat grain, dried basil, pork loin, and salmon) at 10, 25, 50, and 100 ng mL−1 (ten times lower for PCBs) with n = 4 at each level and matrix. A pair of chemists prepared and analyzed 47 samples (65 injections) of two matrices per day (LPGC-MS/MS sequences took ≈14 h). The recov-eries and RSDs were determined from peak areas generated from summation function integration normalized (or not, for comparison purposes) to the corresponding IS listed in Table 1 for each analyte. Matrix-matched (MM) and rea-gent-only (RO) calibration standards (7 levels each: 0, 5, 10, 25, 50, 100, and 150 ng mL−1; tenfold lower for PCBs) were prepared by adding 25 µL calibration standards to final matrix blank extracts (MM) or 220 µL MeCN + 25 µL AP + QC solution (RO). The calibration solutions in MeCN each contained 0.88 ng µL−1 IS and 0, 0.044, 0.088, 0.22, 0.44, 0.88, and 1.32 ng µL−1 concentrations of the analytes (tenfold lower for PCBs and 13C12-PCB 153 as the IS) to yield the seven levels listed above. Matrix effects (MEs) were calculated as the % difference in least-linear squared calibration slopes of the MM vs. RO calibration standards.
Results and Discussion
LPGC‑MS/MS Analysis
In previous LPGC-MS/MS studies in our group, we used a 7000A MS/MS instrument [10, 21], which was upgraded to a 7000B [13, 18], and now to a 7010 system. In regulatory monitoring of pesticide residues in foods, the need of anal-ysis calls for LOQ <10 ng g−1 [22]. The injection of the least amount of sample equivalent to meet the desired LOQ improves the ruggedness of the method and reduces instru-ment maintenance demands. Originally with the 7000A instrument, 10 mg sample equivalent (1 mg µL−1 QuECh-ERS extracts in MeCN) was injected [10, 21], which was reduced to 2.5 mg when using the 7000B [18]. In this
S. J. Lehotay et al.
1 3
study, the 7010 upgrade enabled injection of 1 mg (1 µL) sample equivalent to still achieve <5 ng g−1 LOQs for all analytes in the fruit and vegetable matrices. Cold inlet con-ditions using programmable temperature vaporization were used in each method thus far, but in the near future, we plan to investigate hot split mode injections to further speed the analysis, possibly improve performance, and reduce the amount of matrix components being introduced into the instrument [23].
We started to estimate LOQs from the final method in this study, but recognized quickly that the calculations were inaccurate due to ultra-trace carry over or artifacts that infiltrated the background for nearly all analytes in MeCN, reagent, and matrix blanks. The carry over averaged 0.4 % of the previous injection, and likely originated from the injection syringe needle contaminating the 100 mL wash bottles on the autosampler, not from the mini-SPE proce-dure which prepared 14 blank extracts prior to the reagent blank in its sequence.
Peak integration was conducted using the summation function in the Agilent MassHunter software, which simply drew a baseline at the lowest point between analyst-defined start and stop times to cover the tR and peak width for each analyte. The integration start and stop times were set by ensuring that they fully covered the analyte peaks for all 325 injections over the course of all five sequences in the validation study. The peak area was always positive using this software’s summation integration function, which led to positive responses even when only noise was present. However, inspection of the MRM chromatograms and ion ratios clearly indicated that the background peaks in rea-gent and solvent blanks originated from the analytes in most cases, not simply electronic or chemical noise. The equivalent background concentrations of analytes in RO blanks averaged 0.5 ng mL−1 for the pesticides, FRs, and PAHs, and 0.05 ng mL−1 for PCBs, which did not affect the results of the study, but also did not permit an accurate estimation of LOQs. The likely source of carryover can be eliminated using a newer type of flowing solvent wash station that rinses the analytes coating the needle to waste rather than allowing them to contaminate the fixed volume wash solutions. LOQs can be better estimated after this issue is resolved, but the 1 µL injection clearly met ana-lytical purposes in this application. We can conclude that the LPGC-MS/MS method yielded LOQs <0.5 ng g−1 (<0.05 ng g−1 for PCBs) for all but a few analytes, such as fenpropathrin, endosulfans, and BDE 183 which gave LOQs ≈1 ng g−1.
Automated Mini‑SPE
Morris and Schriner [12] reported that mini-SPE cartridges containing 20 mg anh. MgSO4, 12 mg PSA and C18 each,
and 1 mg CarbonX (45 mg total) provided satisfactory cleanup and recoveries for a wide range of pesticides and matrices in GC-MS/MS analysis. For LC-MS/MS, they chose to use cartridges containing 20.7 mg C18, 8.3 mg Z-Sep, and 1 mg CarbonX (30 mg total), which providedacceptable cleanup and pesticide recoveries for monitor-ing purposes [12]. In their method, they pre-conditionedthe mini-cartridge with 150 µL MeCN, added 150 µLQuEChERS extract, then eluted with another 150 µL elu-tion solvent.
In d-SPE of QuEChERS extracts, no pre-conditioning or extra solvent elution steps are done, and the MeCN extract itself serves as the elution solvent. Ideally, the sor-bents only adsorb co-extracted matrix components and not analytes. We decided to streamline and speed the method of Morris and Schriner [12] by eliminating the MeCN pre-conditioning and solvent elution steps for the same mini-cartridges they developed, which are commercially available. They conducted very thorough studies to set the sorbent combinations, and we had previously found similar sorbent mixtures work well for cleanup and analysis pesti-cides and environmental contaminants in seafood matrices using filter-vial d-SPE [13]. We have since extended the fil-ter-vial d-SPE method to other animal tissues (cattle, pork, and chicken muscle), but found that only filtering of initial extracts was needed for analysis of the 99 LC-amenable pesticides in our recent approach [18].
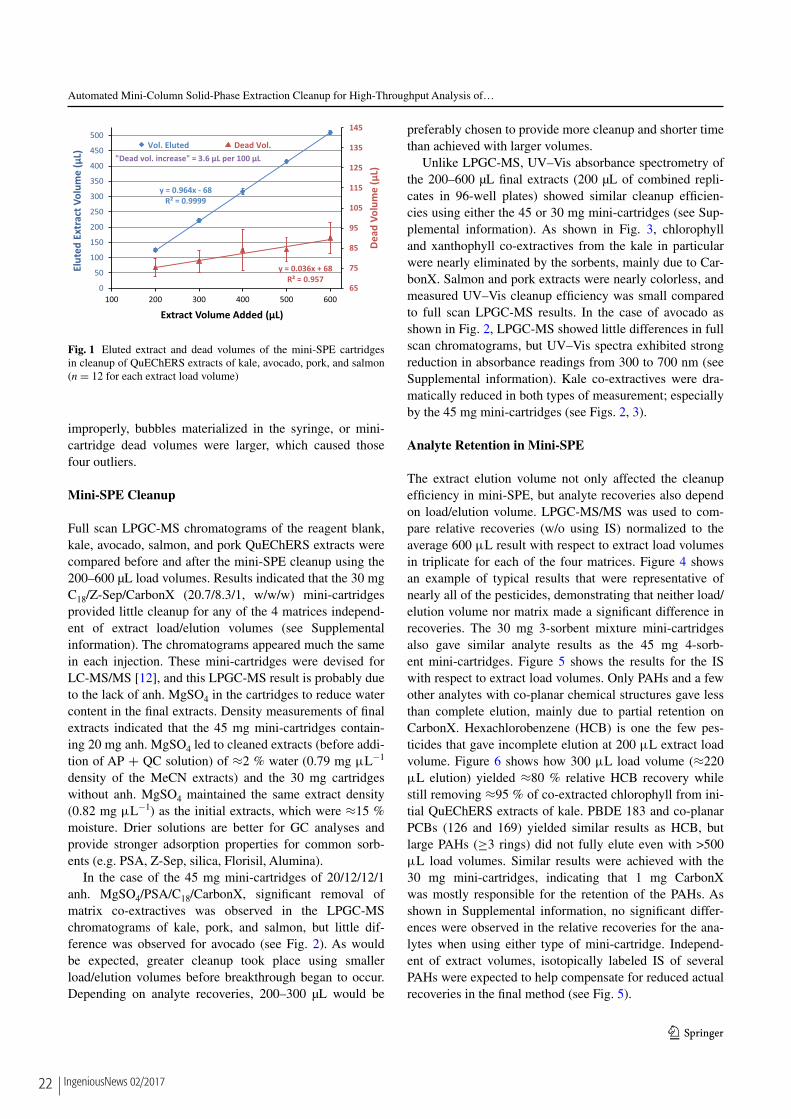
In this evaluation, we focused on 97 representative GC-amenable analytes and compared the two different mini-cartridges for their analysis in QuEChERS extracts of kale, salmon, pork, and avocado, and using extract load volumes of 200, 300, 400, 500, and 600 µL. To deter-mine elution and dead volumes of the mini-cartridges, weights of the collection vials were compared before and after cleanup. Figure 1 shows the results in which meas-ured dead volume (based on measured solution densi-ties) was found to increase slightly as more extract was loaded into the mini-cartridges at 2 µL s−1. The reason for this observance was very likely because more intersti-tial spaces in the sorbent beds were being filled as more solution was passed through the cartridges. In any case, the dead volumes were much the same for both types of mini-cartridges, and averaged 75 ± 5 to 90 ± 8 µL from200 to 600 µL extract load volumes, respectively. Thus, the measured extract elution volumes were 125 ± 5 to510 ± 8 µL from 200 to 600 µL extract load volumes,respectively, which provided known and rather consistent elution volumes in the method.
In the validation study involving 235 mini-SPE car-tridges, final extracts averaged 278 ± 5 μL (1.9 % RSD),in which only 4 final extracts had ≈25 μL reduced volume.The robotic liquid handler operated flawlessly through-out the study, and perhaps vial weights were transcribed
22 IngeniousNews 02/2017
Automated Mini-Column Solid-Phase Extraction Cleanup for High-Throughput Analysis of…
1 3
improperly, bubbles materialized in the syringe, or mini-cartridge dead volumes were larger, which caused those four outliers.
Mini‑SPE Cleanup
Full scan LPGC-MS chromatograms of the reagent blank, kale, avocado, salmon, and pork QuEChERS extracts were compared before and after the mini-SPE cleanup using the 200–600 µL load volumes. Results indicated that the 30 mg C18/Z-Sep/CarbonX (20.7/8.3/1, w/w/w) mini-cartridges provided little cleanup for any of the 4 matrices independ-ent of extract load/elution volumes (see Supplemental information). The chromatograms appeared much the same in each injection. These mini-cartridges were devised for LC-MS/MS [12], and this LPGC-MS result is probably due to the lack of anh. MgSO4 in the cartridges to reduce water content in the final extracts. Density measurements of final extracts indicated that the 45 mg mini-cartridges contain-ing 20 mg anh. MgSO4 led to cleaned extracts (before addi-tion of AP + QC solution) of ≈2 % water (0.79 mg μL−1
density of the MeCN extracts) and the 30 mg cartridges without anh. MgSO4 maintained the same extract density (0.82 mg μL−1) as the initial extracts, which were ≈15 %moisture. Drier solutions are better for GC analyses and provide stronger adsorption properties for common sorb-ents (e.g. PSA, Z-Sep, silica, Florisil, Alumina).
In the case of the 45 mg mini-cartridges of 20/12/12/1 anh. MgSO4/PSA/C18/CarbonX, significant removal of matrix co-extractives was observed in the LPGC-MS chromatograms of kale, pork, and salmon, but little dif-ference was observed for avocado (see Fig. 2). As would be expected, greater cleanup took place using smaller load/elution volumes before breakthrough began to occur. Depending on analyte recoveries, 200–300 µL would be
preferably chosen to provide more cleanup and shorter time than achieved with larger volumes.
Unlike LPGC-MS, UV–Vis absorbance spectrometry of the 200–600 µL final extracts (200 µL of combined repli-cates in 96-well plates) showed similar cleanup efficien-cies using either the 45 or 30 mg mini-cartridges (see Sup-plemental information). As shown in Fig. 3, chlorophyll and xanthophyll co-extractives from the kale in particular were nearly eliminated by the sorbents, mainly due to Car-bonX. Salmon and pork extracts were nearly colorless, and measured UV–Vis cleanup efficiency was small compared to full scan LPGC-MS results. In the case of avocado as shown in Fig. 2, LPGC-MS showed little differences in full scan chromatograms, but UV–Vis spectra exhibited strong reduction in absorbance readings from 300 to 700 nm (see Supplemental information). Kale co-extractives were dra-matically reduced in both types of measurement; especially by the 45 mg mini-cartridges (see Figs. 2, 3).
Analyte Retention in Mini‑SPE
The extract elution volume not only affected the cleanup efficiency in mini-SPE, but analyte recoveries also depend on load/elution volume. LPGC-MS/MS was used to com-pare relative recoveries (w/o using IS) normalized to the average 600 μL result with respect to extract load volumes in triplicate for each of the four matrices. Figure 4 shows an example of typical results that were representative of nearly all of the pesticides, demonstrating that neither load/elution volume nor matrix made a significant difference in recoveries. The 30 mg 3-sorbent mixture mini-cartridges also gave similar analyte results as the 45 mg 4-sorb-ent mini-cartridges. Figure 5 shows the results for the IS with respect to extract load volumes. Only PAHs and a few other analytes with co-planar chemical structures gave less than complete elution, mainly due to partial retention on CarbonX. Hexachlorobenzene (HCB) is one the few pes-ticides that gave incomplete elution at 200 μL extract load volume. Figure 6 shows how 300 μL load volume (≈220μL elution) yielded ≈80 % relative HCB recovery whilestill removing ≈95 % of co-extracted chlorophyll from ini-tial QuEChERS extracts of kale. PBDE 183 and co-planar PCBs (126 and 169) yielded similar results as HCB, but large PAHs (≥3 rings) did not fully elute even with >500μL load volumes. Similar results were achieved with the 30 mg mini-cartridges, indicating that 1 mg CarbonX was mostly responsible for the retention of the PAHs. As shown in Supplemental information, no significant differ-ences were observed in the relative recoveries for the ana-lytes when using either type of mini-cartridge. Independ-ent of extract volumes, isotopically labeled IS of several PAHs were expected to help compensate for reduced actual recoveries in the final method (see Fig. 5).
y = 0.964x - 68R² = 0.9999
y = 0.036x + 68R² = 0.957
65
75
85
95
105
115
125
135
145
0
50
100
150
200
250
300
350
400
450
500
100 200 300 400 500 600
Dead
Vol
ume
(µL)
Elut
ed E
xtra
ct V
olum
e (µ
L)
Extract Volume Added (µL)
Vol. Eluted Dead Vol."Dead vol. increase" = 3.6 µL per 100 µL
Fig. 1 Eluted extract and dead volumes of the mini-SPE cartridges in cleanup of QuEChERS extracts of kale, avocado, pork, and salmon (n = 12 for each extract load volume)

23IngeniousNews 02/2017
Automated Mini-Column Solid-Phase Extraction Cleanup for High-Throughput Analysis of…
1 3
improperly, bubbles materialized in the syringe, or mini-cartridge dead volumes were larger, which caused those four outliers.
Mini‑SPE Cleanup
Full scan LPGC-MS chromatograms of the reagent blank, kale, avocado, salmon, and pork QuEChERS extracts were compared before and after the mini-SPE cleanup using the 200–600 µL load volumes. Results indicated that the 30 mg C18/Z-Sep/CarbonX (20.7/8.3/1, w/w/w) mini-cartridges provided little cleanup for any of the 4 matrices independ-ent of extract load/elution volumes (see Supplemental information). The chromatograms appeared much the same in each injection. These mini-cartridges were devised for LC-MS/MS [12], and this LPGC-MS result is probably due to the lack of anh. MgSO4 in the cartridges to reduce water content in the final extracts. Density measurements of final extracts indicated that the 45 mg mini-cartridges contain-ing 20 mg anh. MgSO4 led to cleaned extracts (before addi-tion of AP + QC solution) of ≈2 % water (0.79 mg μL−1
density of the MeCN extracts) and the 30 mg cartridges without anh. MgSO4 maintained the same extract density (0.82 mg μL−1) as the initial extracts, which were ≈15 %moisture. Drier solutions are better for GC analyses and provide stronger adsorption properties for common sorb-ents (e.g. PSA, Z-Sep, silica, Florisil, Alumina).
In the case of the 45 mg mini-cartridges of 20/12/12/1 anh. MgSO4/PSA/C18/CarbonX, significant removal of matrix co-extractives was observed in the LPGC-MS chromatograms of kale, pork, and salmon, but little dif-ference was observed for avocado (see Fig. 2). As would be expected, greater cleanup took place using smaller load/elution volumes before breakthrough began to occur. Depending on analyte recoveries, 200–300 µL would be
preferably chosen to provide more cleanup and shorter time than achieved with larger volumes.
Unlike LPGC-MS, UV–Vis absorbance spectrometry of the 200–600 µL final extracts (200 µL of combined repli-cates in 96-well plates) showed similar cleanup efficien-cies using either the 45 or 30 mg mini-cartridges (see Sup-plemental information). As shown in Fig. 3, chlorophyll and xanthophyll co-extractives from the kale in particular were nearly eliminated by the sorbents, mainly due to Car-bonX. Salmon and pork extracts were nearly colorless, and measured UV–Vis cleanup efficiency was small compared to full scan LPGC-MS results. In the case of avocado as shown in Fig. 2, LPGC-MS showed little differences in full scan chromatograms, but UV–Vis spectra exhibited strong reduction in absorbance readings from 300 to 700 nm (see Supplemental information). Kale co-extractives were dra-matically reduced in both types of measurement; especially by the 45 mg mini-cartridges (see Figs. 2, 3).
Analyte Retention in Mini‑SPE
The extract elution volume not only affected the cleanup efficiency in mini-SPE, but analyte recoveries also depend on load/elution volume. LPGC-MS/MS was used to com-pare relative recoveries (w/o using IS) normalized to the average 600 μL result with respect to extract load volumes in triplicate for each of the four matrices. Figure 4 shows an example of typical results that were representative of nearly all of the pesticides, demonstrating that neither load/elution volume nor matrix made a significant difference in recoveries. The 30 mg 3-sorbent mixture mini-cartridges also gave similar analyte results as the 45 mg 4-sorb-ent mini-cartridges. Figure 5 shows the results for the IS with respect to extract load volumes. Only PAHs and a few other analytes with co-planar chemical structures gave less than complete elution, mainly due to partial retention on CarbonX. Hexachlorobenzene (HCB) is one the few pes-ticides that gave incomplete elution at 200 μL extract load volume. Figure 6 shows how 300 μL load volume (≈220μL elution) yielded ≈80 % relative HCB recovery whilestill removing ≈95 % of co-extracted chlorophyll from ini-tial QuEChERS extracts of kale. PBDE 183 and co-planar PCBs (126 and 169) yielded similar results as HCB, but large PAHs (≥3 rings) did not fully elute even with >500μL load volumes. Similar results were achieved with the 30 mg mini-cartridges, indicating that 1 mg CarbonX was mostly responsible for the retention of the PAHs. As shown in Supplemental information, no significant differ-ences were observed in the relative recoveries for the ana-lytes when using either type of mini-cartridge. Independ-ent of extract volumes, isotopically labeled IS of several PAHs were expected to help compensate for reduced actual recoveries in the final method (see Fig. 5).
y = 0.964x - 68R² = 0.9999
y = 0.036x + 68R² = 0.957
65
75
85
95
105
115
125
135
145
0
50
100
150
200
250
300
350
400
450
500
100 200 300 400 500 600
Dead
Vol
ume
(µL)
Elut
ed E
xtra
ct V
olum
e (µ
L)
Extract Volume Added (µL)
Vol. Eluted Dead Vol."Dead vol. increase" = 3.6 µL per 100 µL
Fig. 1 Eluted extract and dead volumes of the mini-SPE cartridges in cleanup of QuEChERS extracts of kale, avocado, pork, and salmon (n = 12 for each extract load volume)
S. J. Lehotay et al.
1 3
Considering the notable cleanup efficiency observed in both UV–Vis and LPGC-MS for the 45 mg mini-car-tridges, especially at smaller load/elution volumes, and lack of retention of most analytes in QuEChERS extracts,
we chose to use 300 µL load volumes with those mini-car-tridges in the final method.
Method Validation and Summation Integration
For validation of the automated high-throughput cleanup and LPGC-MS/MS method, 10 representative food matri-ces were chosen using SANTE/11945/2015 [22] as a guide. The final method was conducted for two matri-ces per day in the following sequence: Day (1) Gala
No Cleanup
MeCN
Salmon
200 µL
300 µL
500 µL
600 µL
400 µL
Extract Volume
MeCN
200 µL
300 µL
500 µL
600 µL
400 µL
Extract VolumePork No Cleanup
No Cleanup
MeCN
200 µL
300 µL
500 µL
600 µL
400 µL
Extract VolumeKale
MeCN
Avocado
200 µL
300 µL
500 µL
600 µL
400 µL
Extract Volume
No Cleanup
Fig. 2 Total ion chromatograms in full scan LPGC-MS of the QuEChERS extracts of 4 matrixes before and after cleanup with the 45 mg mini-SPE cartridges using different extract load volumes
300 350 400 450 500 550 600 650 700
4.03.53.02.52.01.51.00.5
4.03.53.02.52.01.51.00.5
Fig. 3 Comparison of the UV–Vis spectra before and after cleanup of kale extracts using the 45 mg anh. MgSO4/PSA/C18/CarbonX mini-SPE cartridges
50%
60%
70%
80%
90%
100%
110%
150 200 250 300 350 400 450 500 550 600 650
Peak
are
a vs
. tha
t for
600
µL
Extract Load Volume (µL)
Kale SalmonPork Avocado
Fig. 4 Relative recoveries of bifenthrin in extracts of the 4 matrices (100 ng mL−1, n = 3 each) after automated cleanup using the 45 mgmini-cartridges

24 IngeniousNews 02/2017
Automated Mini-Column Solid-Phase Extraction Cleanup for High-Throughput Analysis of…
1 3
apple and kiwi; (2) carrot and kale; (3) navel orange and canned black olive; (4) wheat grain and dried basil; and (5) pork loin and salmon. QuEChERS has been exten-sively validated [24] and implemented in many labs [25], and to isolate the mini-SPE cleanup step in this study, ini-tial QuEChERS extracts were spiked (or not) with the 97 analytes at 10, 25, 50, and 100 ng mL−1 (n = 4 at each level and matrix). Each sequence began with seven blanks of each matrix, which were used for MM calibration standards, followed by the reagent blank and 16 spiked extracts of each matrix, for a total of 47 samples daily, and 235 altogether in 5 days sequentially. The LPGC-MS/MS sequences were conducted each day overnight, which included an additional 7 RO standards conducted at the beginning and end of each sequence, plus a system suit-ability standard as the first injection and 3 MeCN blanks injected after the 150 ng mL−1 (ng g−1) RO standards to
check for carry over. A total of 65 LPGC-MS/MS analy-ses were conducted each night, and 325 within 5 days. The same injection liner and autotune parameters were used in each sequence.
Summation integration function start and stop times for each analyte were set after the conclusion of all 325 analy-ses by ensuring that all analyte peaks fell within the inte-gration windows. The use of APs in LPGC-MS/MS led to highly consistent tR and peak shapes for all analytes, and relatively few chemical interferences in the chromato-grams for each MS/MS ion transition provided leeway to each side of the peak without significantly impacting the integrated peak areas. Figure 7 and Supplemental informa-tion show many examples of how the summation integra-tion approach worked for different analytes and matrices. Dechlorane plus, (es)fenvalerate, permethrin, deltamethrin, cyfluthrin, and cypermethrin gave multiple peaks with the same ion transitions, several of which could have been inte-grated separately, but we chose to integrate them together as a single analyte. Sapozhnikova and Lehotay previously presented several examples of LPGC-MS/MS separations of different closely eluting analytes with isobaric ion tran-sitions comparing columns from different manufacturers [17] (Figs. 4, 5, 6).
The Agilent summation function does not find the deflection point between unresolved peaks, which does not always occur at the exact same time in each chromatogram. Thus, benz(a)anthracene + chrysene and PCBs 118 + 123 and 156 + 157 could be distinguished individually by tR, but were integrated together because they closely co-eluted. We could have also integrated phenanthrene and anthracene together, but we chose to treat them separately and apply the default Agile2 integrator for purposes of comparison.
0%
20%
40%
60%
80%
100%
120%Re
la�v
e Re
cove
ry
200 300 400 500
Fig. 5 Relative recoveries vs. the 600 μL extract load volumes of the 11 IS spiked at 100 ng mL−1 in the avocado, kale, pork, and salmon extracts using different load volumes with the 45 mg mini-cartridges (n = 12 each)
50%
60%
70%
80%
90%
100%
50%
60%
70%
80%
90%
100%
150 200 250 300 350 400 450 500 550 600 650
%Re
mov
ed b
ased
on
Abso
rban
ce a
t 680
nm
HCB
Peak
Are
a vs
. Ma x
Extract Load Volume (µL)
% vs. Max HCB
Chlorophyll removal
Fig. 6 Elution of hexachlorobenzene (HCB) and removal of chloro-phyll from kale extracts passed through the 45 mg anh. MgSO4/PSA/C18/CarbonX mini-SPE cartridges

25IngeniousNews 02/2017
Automated Mini-Column Solid-Phase Extraction Cleanup for High-Throughput Analysis of…
1 3
apple and kiwi; (2) carrot and kale; (3) navel orange and canned black olive; (4) wheat grain and dried basil; and (5) pork loin and salmon. QuEChERS has been exten-sively validated [24] and implemented in many labs [25], and to isolate the mini-SPE cleanup step in this study, ini-tial QuEChERS extracts were spiked (or not) with the 97 analytes at 10, 25, 50, and 100 ng mL−1 (n = 4 at each level and matrix). Each sequence began with seven blanks of each matrix, which were used for MM calibration standards, followed by the reagent blank and 16 spiked extracts of each matrix, for a total of 47 samples daily, and 235 altogether in 5 days sequentially. The LPGC-MS/MS sequences were conducted each day overnight, which included an additional 7 RO standards conducted at the beginning and end of each sequence, plus a system suit-ability standard as the first injection and 3 MeCN blanks injected after the 150 ng mL−1 (ng g−1) RO standards to
check for carry over. A total of 65 LPGC-MS/MS analy-ses were conducted each night, and 325 within 5 days. The same injection liner and autotune parameters were used in each sequence.
Summation integration function start and stop times for each analyte were set after the conclusion of all 325 analy-ses by ensuring that all analyte peaks fell within the inte-gration windows. The use of APs in LPGC-MS/MS led to highly consistent tR and peak shapes for all analytes, and relatively few chemical interferences in the chromato-grams for each MS/MS ion transition provided leeway to each side of the peak without significantly impacting the integrated peak areas. Figure 7 and Supplemental informa-tion show many examples of how the summation integra-tion approach worked for different analytes and matrices. Dechlorane plus, (es)fenvalerate, permethrin, deltamethrin, cyfluthrin, and cypermethrin gave multiple peaks with the same ion transitions, several of which could have been inte-grated separately, but we chose to integrate them together as a single analyte. Sapozhnikova and Lehotay previously presented several examples of LPGC-MS/MS separations of different closely eluting analytes with isobaric ion tran-sitions comparing columns from different manufacturers [17] (Figs. 4, 5, 6).
The Agilent summation function does not find the deflection point between unresolved peaks, which does not always occur at the exact same time in each chromatogram. Thus, benz(a)anthracene + chrysene and PCBs 118 + 123 and 156 + 157 could be distinguished individually by tR, but were integrated together because they closely co-eluted. We could have also integrated phenanthrene and anthracene together, but we chose to treat them separately and apply the default Agile2 integrator for purposes of comparison.
0%
20%
40%
60%
80%
100%
120%
Rela
�ve
Reco
very
200 300 400 500
Fig. 5 Relative recoveries vs. the 600 μL extract load volumes of the 11 IS spiked at 100 ng mL−1 in the avocado, kale, pork, and salmon extracts using different load volumes with the 45 mg mini-cartridges (n = 12 each)
50%
60%
70%
80%
90%
100%
50%
60%
70%
80%
90%
100%
150 200 250 300 350 400 450 500 550 600 650
%Re
mov
ed b
ased
on
Abso
rban
ce a
t 680
nm
HCB
Peak
Are
a vs
. Ma x
Extract Load Volume (µL)
% vs. Max HCB
Chlorophyll removal
Fig. 6 Elution of hexachlorobenzene (HCB) and removal of chloro-phyll from kale extracts passed through the 45 mg anh. MgSO4/PSA/C18/CarbonX mini-SPE cartridges
S. J. Lehotay et al.
1 3
Dozens of manual re-integrations each of phenanthrene and anthracene were needed, especially at the lowest lev-els, to correct the mistakes by the default program when it selected the wrong peak or used an inconsistent baseline. In the case of the other 107 analytes, IS, and QC standard,
only spot-checking of integrations was conducted out of curiosity and no manual adjustments were made.
The 5-day validation experiment generated 66,950 data points (ion transition peaks) that would have taken an ana-lyst several days to check that each peak was integrated
acephate pyriproxyfen
apple kiwi apple kiwi
carrot
kale
carrot kale
orangeblackolive
orangeblack
olive
wheatgrain
driedbasil
wheatgrain
driedbasil
pork salmon pork salmon
Fig. 7 Summation integration of 10 ng mL−1 spikes for acephate and pyriproxyfen in the 10 matrices over the course of 5 days. The quali-fier ion met the ±10 % ratio relative to the fixed reference ratio for
all, but acephate in black olive and dried basil in these examples, as shown by the horizontal lines

26 IngeniousNews 02/2017
Automated Mini-Column Solid-Phase Extraction Cleanup for High-Throughput Analysis of…
1 3
(or not) appropriately and consistently. Using the summa-tion integration function, the analyst spent only a few hours to set parameters, and all results were generated within a matter of minutes. Not only was human review of results not needed, the consistency of the summation integrations was superior to human capabilities and led to reliable quan-titative results (see Supplemental information). Chemical interferences could be observed, especially in dried basil, orange, and black olive, but such interferants complicate peak integrations and worsen quality of results for any inte-gration function.
Different means of post-run data processing batches were considered before settling on the final approach to report results calculated with and without normalization to the IS (see Table 1) using MM calibration standards for the same matrix. Potentially better results could have been obtained by narrowing the summation integration time windows to exactly accommodate the peak widths for each matrix, which were analyzed within hours of each other, but the wider windows that fully covered all peaks for all 325 injections were used in all cases. One drawback of the current software version was that the reported ana-lyte tR was the midpoint between the integration start and stop times rather than the actual apex of the peak, and this should be corrected in the future.
Validation Results
Table 3 lists the compiled results with normalization to the IS for all 94 analytes (including pairs) in the 10 matrices spiked at different levels (n = 40 each), as wellas overall results for all levels and matrices (n = 160).Underlined font emphasizes when overall results yielded 100 % ± 10 % recoveries, and bold text indicates when <70or >120 % recovery and ≥25 % RSD were obtained. Whenusing the IS, 42 out of 97 analytes gave 90–110 % recov-eries and ≤10 % RSD, which is exceptional consideringthat 230 injections of 10 complex matrices at ultra-trace spiking levels were made without manual re-integrations or instrument maintenance over 5 days sequentially. For comparison, the overall average recoveries and RSD for each analyte without normalization to the IS are also pre-sented in Table 3. Clearly, the IS were needed to provide better precision in the results, and to account for partial retention of the larger PAHs. For nearly all pesticides and most FRs and PCBs, the IS only helped to account for vol-ume fluctuations in the mini-SPE cleanup step. The vari-ability of the elution volume can be observed in Fig. 1, and Table 3 shows how well the IS compensated for these fluc-tuations from day-to-day and matrix-to-matrix. The differ-ing amounts of water in the different matrices and initial and final extracts also likely contributed substantially to the variations without the IS.
When using the IS, only three analytes (PBEB, benz(a)anthracene + chrysene, and thiabendazole) had <70 %overall average recoveries (64, 68, and 67 %, respectively) and only six analytes (naphthalene, TPP, TBCO, fen-propathrin, deltamethrin, and thiabendazole) had overall RSDs >25 %. TPP and naphthalene were ubiquitous in all of the reagent blanks at varying concentrations averaging 7 and 75 ng mL−1, respectively, and similar levels in the final matrix extracts. Analytical conditions for fenpropathrin were not optimal, and an interferant averaging 18 ng g−1 equivalent response adversely affected its results. Deltame-thrin is known to degrade in the injection inlet [20], which was the main cause of its more variable results, which was also the case for methoxychlor to a lesser extent. Last, thiabendazole and TBCO (and TBECH) gave very broad chromatographic peaks. Despite the inconsistent results for those six analytes, the chromatographic peak shapes and results were very good for other notoriously difficult ana-lytes in GC, such as methamidophos, acephate, omethoate, dimethoate, carbofuran, chlorothalonil, imazalil, and myclobutanil (see Supplemental information). In fact, dimethoate was among those analytes that gave the best results, and cyfluthrin was another analyte that gave sur-prisingly high quality results.
Despite the much greater variability, the overall recover-ies without normalization to the IS were the same as when using the IS except PBEB and PCB 169 were 67 and 63 %, respectively, and 8 PAHs had 14–63 % uncompensated recoveries. As stated earlier, the 1 mg CarbonX was prob-ably the cause for the lower recoveries of structurally (co-)planar analytes, but the isotopically labeled IS worked well to improve accuracy in all cases, albeit an ideal IS was not obtained for benz(a)anthracene + chrysene or benzo(b + k)fluoranthene.
In addition to its high quality of results, the automated mini-SPE + LPGC-MS/MS method provided excellentruggedness in the analysis of all 325 samples. Due to the clean extracts, small injection volumes, mega-bore analyti-cal column, and use of APs, the same injection liner and septum was used for all 325 injections in 10 matrices over the course of 5 days. A picture of the used liner and sep-tum appears in Supplemental information. Even the fatty salmon matrix, which was analyzed last, showed very good peak shapes and perfectly linear calibration with the same high quality results as the other matrices (see Supplemental information).
Matrix Effects (MEs)
MEs were measured both with and without normalization of integrated peak areas to the IS. As in the case of recoveries, the IS helped to greatly reduce imprecision in the measure-ments. As shown in Supplemental information, the PCBs,
S. J. Lehotay et al.
1 3
Table 3 Average mini-SPE % recoveries (and %RSD) of the 94 analytes (including three pairs) in 10 matrices at four spiking levels (n = 40 ateach level, and n = 160 overall) in the validation study
Nos. Analyte 10ng mL−1
25ng mL−1
50ng mL−1
100ng mL−1
Overall vs. IS Overall w/o IS
Pesticides
1 Acephate 98 (16) 90 (14) 93 (20) 92 (20) 95 (17) 103 (41)
2 Aldrin 91 (12) 89 (10) 91 (11) 93 (8) 90 (11) 93 (24)
3 Atrazine 99 (8) 95 (5) 96 (3) 97 (4) 98 (6) 104 (26)
4 Bifenthrin 93 (8) 91 (5) 93 (9) 93 (9) 93 (9) 99 (30)
5 Carbofuran 102 (11) 97 (9) 98 (9) 101 (11) 101 (11) 106 (34)
6 Carbophenothion 99 (10) 94 (5) 97 (9) 97 (9) 98 (10) 105 (32)
7 Chlorothalonil 95 (16) 87 (14) 88 (16) 90 (17) 91 (16) 97 (31)
8 Chlorpyrifos 96 (8) 93 (4) 95 (4) 97 (4) 96 (6) 101 (25)
9 Coumaphos 94 (10) 91 (8) 92 (12) 91 (11) 93 (11) 101 (30)
10 Cyfluthrin 92 (8) 91 (7) 92 (10) 92 (9) 92 (9) 100 (29)
11 Cypermethrin 95 (14) 88 (8) 92 (13) 91 (11) 93 (13) 100 (37)
12 Cyprodinil 87 (8) 86 (5) 87 (7) 88 (7) 88 (7) 93 (28)
13 Deltamethrin 111 (50) 92 (22) 93 (19) 88 (22) 98 (34) 119 (59)
14 o,p′-DDE 94 (7) 91 (5) 92 (5) 94 (4) 93 (6) 98 (24)
15 p,p′-DDE 92 (8) 89 (7) 92 (5) 93 (4) 91 (7) 98 (30)
16 Diazinon 101 (10) 96 (7) 95 (5) 97 (5) 98 (8) 105 (29)
17 Dicrotophos 109 (20) 97 (11) 94 (9) 96 (9) 101 (15) 107 (35)
18 Dimethoate 101 (8) 96 (5) 96 (6) 98 (6) 99 (7) 106 (30)
19 Diphenylamine 102 (15) 97 (8) 98 (8) 100 (6) 100 (11) 106 (25)
20 Endosulfan I 98 (14) 93 (6) 94 (6) 95 (6) 95 (9) 100 (26)
21 Endosulfan II 97 (8) 93 (8) 94 (8) 95 (6) 96 (8) 102 (28)
22 Endosulfan sulfate 96 (18) 95 (9) 96 (11) 97 (8) 98 (13) 104 (31)
23 Esfenvalerate 96 (11) 91 (8) 93 (12) 93 (11) 94 (12) 103 (33)
24 Ethalfluralin 101 (12) 96 (9) 96 (10) 97 (7) 98 (10) 105 (25)
25 Ethoprop 99 (24) 98 (12) 97 (9) 98 (8) 98 (15) 104 (28)
26 Fenpropathrin 91 (70) 93 (34) 89 (26) 89 (17) 92 (41) 119 (90)
27 Fipronil 105 (12) 98 (10) 99 (13) 98 (12) 101 (12) 109 (32)
28 Flutriafol 99 (9) 95 (5) 96 (11) 96 (9) 98 (9) 105 (32)
29 Heptachlor 94 (14) 92 (13) 93 (11) 94 (10) 94 (12) 99 (25)
30 Heptachlor epoxide 98 (9) 95 (8) 95 (6) 97 (5) 97 (8) 102 (23)
31 Heptenophos 103 (15) 96 (10) 97 (12) 100 (8) 100 (13) 105 (27)
32 Hexachlorobenzene 83 (20) 87 (10) 89 (11) 90 (11) 86 (14) 88 (26)
33 Imazalil 83 (21) 81 (13) 83 (14) 83 (10) 83 (15) 87 (37)
34 Kresoxim-methyl 100 (10) 96 (6) 97 (8) 98 (7) 99 (8) 106 (29)
35 Lindane 100 (11) 97 (7) 97 (7) 99 (6) 99 (9) 104 (23)
36 Methamidophos 97 (16) 91 (15) 92 (16) 95 (16) 96 (16) 103 (35)
37 Methoxychlor 95 (25) 92 (23) 94 (26) 91 (25) 93 (25) 101 (39)
38 Mirex 83 (9) 82 (10) 85 (12) 85 (12) 83 (11) 88 (33)
39 Myclobutanil 99 (7) 95 (5) 96 (9) 96 (8) 98 (8) 105 (30)
40 cis-Nonachlor 96 (9) 91 (6) 92 (6) 94 (6) 94 (7) 101 (28)
41 trans-Nonachlor 93 (8) 91 (6) 92 (6) 94 (5) 93 (7) 98 (25)
42 Omethoate 103 (15) 96 (12) 90 (20) 93 (15) 97 (16) 106 (35)
43 o-Phenylphenol 102 (19) 97 (11) 98 (11) 100 (8) 100 (14) 104 (30)
44 Penconazole 94 (8) 92 (4) 93 (8) 94 (7) 94 (7) 101 (29)
45 Pentachlorothioanisole 93 (15) 92 (10) 94 (11) 96 (9) 93 (11) 96 (22)
46 Permethrin 92 (16) 92 (7) 93 (10) 92 (8) 93 (11) 101 (36)

27IngeniousNews 02/2017
S. J. Lehotay et al.
1 3
Table 3 Average mini-SPE % recoveries (and %RSD) of the 94 analytes (including three pairs) in 10 matrices at four spiking levels (n = 40 ateach level, and n = 160 overall) in the validation study
Nos. Analyte 10ng mL−1
25ng mL−1
50ng mL−1
100ng mL−1
Overall vs. IS Overall w/o IS
Pesticides
1 Acephate 98 (16) 90 (14) 93 (20) 92 (20) 95 (17) 103 (41)
2 Aldrin 91 (12) 89 (10) 91 (11) 93 (8) 90 (11) 93 (24)
3 Atrazine 99 (8) 95 (5) 96 (3) 97 (4) 98 (6) 104 (26)
4 Bifenthrin 93 (8) 91 (5) 93 (9) 93 (9) 93 (9) 99 (30)
5 Carbofuran 102 (11) 97 (9) 98 (9) 101 (11) 101 (11) 106 (34)
6 Carbophenothion 99 (10) 94 (5) 97 (9) 97 (9) 98 (10) 105 (32)
7 Chlorothalonil 95 (16) 87 (14) 88 (16) 90 (17) 91 (16) 97 (31)
8 Chlorpyrifos 96 (8) 93 (4) 95 (4) 97 (4) 96 (6) 101 (25)
9 Coumaphos 94 (10) 91 (8) 92 (12) 91 (11) 93 (11) 101 (30)
10 Cyfluthrin 92 (8) 91 (7) 92 (10) 92 (9) 92 (9) 100 (29)
11 Cypermethrin 95 (14) 88 (8) 92 (13) 91 (11) 93 (13) 100 (37)
12 Cyprodinil 87 (8) 86 (5) 87 (7) 88 (7) 88 (7) 93 (28)
13 Deltamethrin 111 (50) 92 (22) 93 (19) 88 (22) 98 (34) 119 (59)
14 o,p′-DDE 94 (7) 91 (5) 92 (5) 94 (4) 93 (6) 98 (24)
15 p,p′-DDE 92 (8) 89 (7) 92 (5) 93 (4) 91 (7) 98 (30)
16 Diazinon 101 (10) 96 (7) 95 (5) 97 (5) 98 (8) 105 (29)
17 Dicrotophos 109 (20) 97 (11) 94 (9) 96 (9) 101 (15) 107 (35)
18 Dimethoate 101 (8) 96 (5) 96 (6) 98 (6) 99 (7) 106 (30)
19 Diphenylamine 102 (15) 97 (8) 98 (8) 100 (6) 100 (11) 106 (25)
20 Endosulfan I 98 (14) 93 (6) 94 (6) 95 (6) 95 (9) 100 (26)
21 Endosulfan II 97 (8) 93 (8) 94 (8) 95 (6) 96 (8) 102 (28)
22 Endosulfan sulfate 96 (18) 95 (9) 96 (11) 97 (8) 98 (13) 104 (31)
23 Esfenvalerate 96 (11) 91 (8) 93 (12) 93 (11) 94 (12) 103 (33)
24 Ethalfluralin 101 (12) 96 (9) 96 (10) 97 (7) 98 (10) 105 (25)
25 Ethoprop 99 (24) 98 (12) 97 (9) 98 (8) 98 (15) 104 (28)
26 Fenpropathrin 91 (70) 93 (34) 89 (26) 89 (17) 92 (41) 119 (90)
27 Fipronil 105 (12) 98 (10) 99 (13) 98 (12) 101 (12) 109 (32)
28 Flutriafol 99 (9) 95 (5) 96 (11) 96 (9) 98 (9) 105 (32)
29 Heptachlor 94 (14) 92 (13) 93 (11) 94 (10) 94 (12) 99 (25)
30 Heptachlor epoxide 98 (9) 95 (8) 95 (6) 97 (5) 97 (8) 102 (23)
31 Heptenophos 103 (15) 96 (10) 97 (12) 100 (8) 100 (13) 105 (27)
32 Hexachlorobenzene 83 (20) 87 (10) 89 (11) 90 (11) 86 (14) 88 (26)
33 Imazalil 83 (21) 81 (13) 83 (14) 83 (10) 83 (15) 87 (37)
34 Kresoxim-methyl 100 (10) 96 (6) 97 (8) 98 (7) 99 (8) 106 (29)
35 Lindane 100 (11) 97 (7) 97 (7) 99 (6) 99 (9) 104 (23)
36 Methamidophos 97 (16) 91 (15) 92 (16) 95 (16) 96 (16) 103 (35)
37 Methoxychlor 95 (25) 92 (23) 94 (26) 91 (25) 93 (25) 101 (39)
38 Mirex 83 (9) 82 (10) 85 (12) 85 (12) 83 (11) 88 (33)
39 Myclobutanil 99 (7) 95 (5) 96 (9) 96 (8) 98 (8) 105 (30)
40 cis-Nonachlor 96 (9) 91 (6) 92 (6) 94 (6) 94 (7) 101 (28)
41 trans-Nonachlor 93 (8) 91 (6) 92 (6) 94 (5) 93 (7) 98 (25)
42 Omethoate 103 (15) 96 (12) 90 (20) 93 (15) 97 (16) 106 (35)
43 o-Phenylphenol 102 (19) 97 (11) 98 (11) 100 (8) 100 (14) 104 (30)
44 Penconazole 94 (8) 92 (4) 93 (8) 94 (7) 94 (7) 101 (29)
45 Pentachlorothioanisole 93 (15) 92 (10) 94 (11) 96 (9) 93 (11) 96 (22)
46 Permethrin 92 (16) 92 (7) 93 (10) 92 (8) 93 (11) 101 (36)

28 IngeniousNews 02/2017
Automated Mini-Column Solid-Phase Extraction Cleanup for High-Throughput Analysis of…
1 3
Table 3 continued
Nos. Analyte 10ng mL−1
25ng mL−1
50ng mL−1
100ng mL−1
Overall vs. IS Overall w/o IS
47 Piperonyl butoxide 96 (8) 92 (6) 94 (10) 93 (9) 95 (9) 103 (31)
48 Propargite 101 (15) 94 (9) 95 (14) 97 (14) 97 (16) 103 (30)
49 Pyridaben 93 (8) 89 (6) 91 (11) 91 (9) 92 (10) 100 (31)
50 Pyriproxyfen 93 (8) 91 (6) 92 (11) 92 (9) 93 (9) 102 (31)
51 Tebuconazole 93 (14) 87 (9) 90 (13) 89 (10) 91 (12) 100 (34)
52 Tetraconazole 99 (7) 97 (5) 97 (7) 98 (7) 99 (7) 105 (27)
53 Thiabendazole 63 (31) 64 (25) 69 (26) 70 (25) 67 (27) 71 (41)
54 Tribufos 95 (11) 88 (7) 91 (11) 90 (8) 92 (10) 99 (32)
FRs
1 BDE 183 101 (36) 100 (18) 100 (13) 101 (10) 100 (21) 76 (37)
2 Dechlorane plus (syn + anti) 99 (12) 99 (14) 99 (11) 100 (10) 98 (11) 80 (32)
3 PBB 153 103 (11) 101 (10) 103 (9) 105 (9) 102 (10) 81 (31)
4 PBEB 63 (20) 63 (11) 67 (10) 67 (15) 64 (15) 67 (33)
5 PBT 92 (11) 91 (9) 93 (10) 96 (12) 92 (11) 72 (29)
6 TBB 86 (10) 85 (7) 87 (6) 87 (8) 86 (8) 69 (33)
7 TBCO 102 (43) 93 (28) 91 (24) 93 (21) 96 (30) 104 (43)
8 TBECH 100 (25) 94 (17) 96 (16) 95 (12) 97 (18) 104 (32)
9 TBNPA 106 (26) 98 (14) 98 (16) 100 (11) 101 (18) 103 (34)
10 TBX 70 (12) 69 (8) 73 (7) 74 (10) 70 (11) 73 (26)
11 TCEP 101 (5) 97 (4) 96 (3) 98 (5) 99 (5) 105 (28)
12 TCPP 100 (7) 96 (4) 97 (3) 98 (4) 99 (6) 105 (28)
13 TDCPP 101 (9) 97 (7) 98 (11) 98 (10) 99 (10) 107 (32)
14 Triphenylphosphate 90 (39) 96 (27) 98 (25) 98 (23) 96 (28) 105 (46)
PAHs
1 Acenaphthene 100 (16) 99 (6) 100 (5) 101 (5) 100 (9) 100 (27)
2 Acenaphthalene 97 (6) 96 (5) 97 (3) 98 (3) 97 (5) 99 (22)
3 Anthracene 100 (11) 92 (5) 95 (5) 96 (4) 96 (8) 85 (27)
4 Benz(a)anthracene + Chrysene 69 (13) 66 (12) 67 (13) 68 (13) 68 (13) 40 (44)
5 Benzo(a)pyrene 109 (9) 97 (6) 95 (3) 97 (4) 100 (8) 22 (53)
6 Benzo(b + k)fluoranthene 123 (6) 115 (5) 113 (3) 115 (3) 117 (6) 27 (48)
7 Benzo(g,h,i)perylene 120 (15) 103 (8) 100 (4) 102 (4) 106 (12) 14 (64)
8 Dibenz(ah)anthracene 100 (13) 84 (8) 82 (5) 82 (5) 87 (13) 19 (58)
9 Fluoranthene 104 (5) 97 (4) 96 (3) 97 (3) 99 (5) 63 (32)
10 Fluorene 115 (17) 116 (10) 113 (7) 114 (8) 114 (12) 98 (24)
11 Indeno(1,2,3-c,d)pyrene 117 (14) 109 (12) 108 (8) 114 (12) 113 (12) 17 (61)
12 Naphthalene 128 (95) 118 (78) 117 (29) 108 (28) 115 (63) 114 (71)
13 Phenanthrene 114 (16) 101 (5) 99 (4) 99 (3) 104 (11) 89 (30)
14 Pyrene 108 (6) 99 (5) 97 (2) 98 (3) 101 (6) 57 (36)
PCBs
1 PCB 77 97 (17) 96 (7) 97 (8) 98 (9) 97 (11) 85 (29)
2 PCB 81 100 (8) 96 (8) 97 (6) 99 (7) 98 (8) 85 (27)
3 PCB 105 106 (7) 104 (8) 107 (6) 108 (6) 106 (7) 91 (26)
4 PCB 114 106 (5) 104 (7) 106 (7) 108 (8) 106 (7) 90 (26)
5 PCB 118 + 123 103 (8) 102 (7) 106 (7) 107 (7) 104 (8) 89 (28)
6 PCB 126 88 (12) 85 (9) 87 (11) 88 (11) 86 (11) 75 (29)
7 PCB 156 + 157 100 (8) 98 (8) 100 (9) 101 (9) 99 (9) 85 (26)
8 PCB 167 98 (7) 96 (8) 100 (8) 100 (9) 97 (9) 83 (28)
9 PCB 169 75 (19) 72 (13) 75 (13) 74 (14) 74 (15) 63 (30)
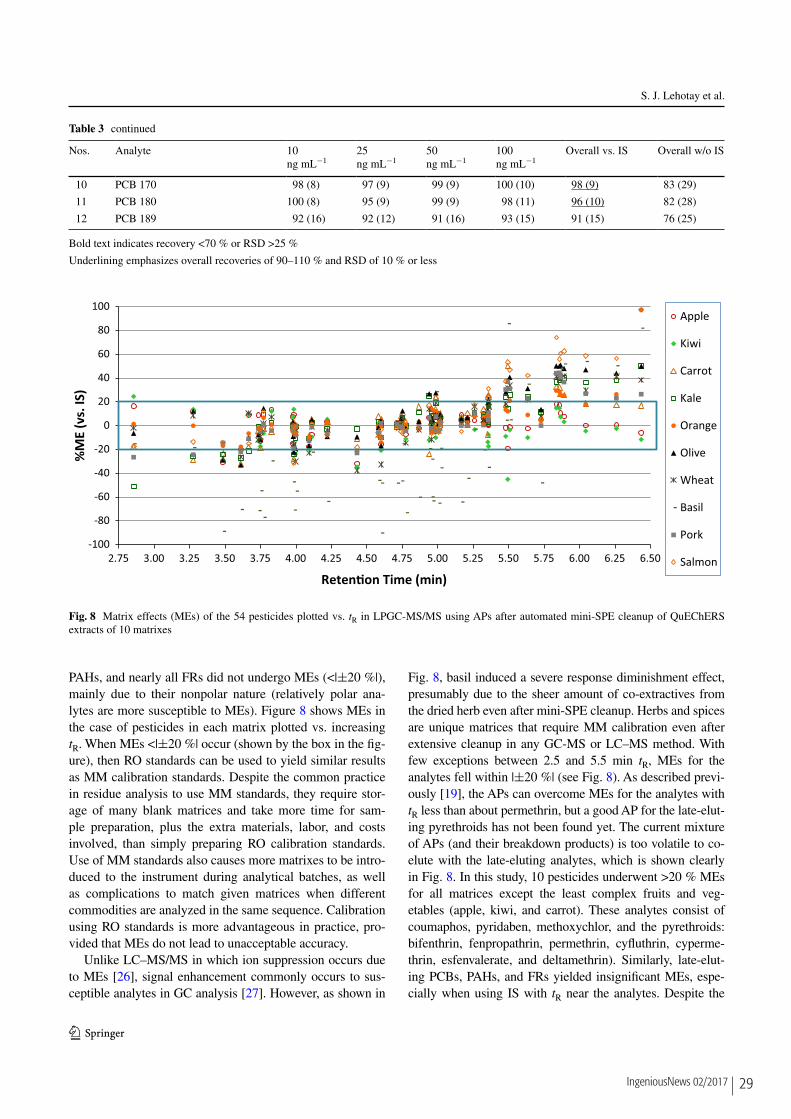
29IngeniousNews 02/2017
Automated Mini-Column Solid-Phase Extraction Cleanup for High-Throughput Analysis of…
1 3
Table 3 continued
Nos. Analyte 10ng mL−1
25ng mL−1
50ng mL−1
100ng mL−1
Overall vs. IS Overall w/o IS
47 Piperonyl butoxide 96 (8) 92 (6) 94 (10) 93 (9) 95 (9) 103 (31)
48 Propargite 101 (15) 94 (9) 95 (14) 97 (14) 97 (16) 103 (30)
49 Pyridaben 93 (8) 89 (6) 91 (11) 91 (9) 92 (10) 100 (31)
50 Pyriproxyfen 93 (8) 91 (6) 92 (11) 92 (9) 93 (9) 102 (31)
51 Tebuconazole 93 (14) 87 (9) 90 (13) 89 (10) 91 (12) 100 (34)
52 Tetraconazole 99 (7) 97 (5) 97 (7) 98 (7) 99 (7) 105 (27)
53 Thiabendazole 63 (31) 64 (25) 69 (26) 70 (25) 67 (27) 71 (41)
54 Tribufos 95 (11) 88 (7) 91 (11) 90 (8) 92 (10) 99 (32)
FRs
1 BDE 183 101 (36) 100 (18) 100 (13) 101 (10) 100 (21) 76 (37)
2 Dechlorane plus (syn + anti) 99 (12) 99 (14) 99 (11) 100 (10) 98 (11) 80 (32)
3 PBB 153 103 (11) 101 (10) 103 (9) 105 (9) 102 (10) 81 (31)
4 PBEB 63 (20) 63 (11) 67 (10) 67 (15) 64 (15) 67 (33)
5 PBT 92 (11) 91 (9) 93 (10) 96 (12) 92 (11) 72 (29)
6 TBB 86 (10) 85 (7) 87 (6) 87 (8) 86 (8) 69 (33)
7 TBCO 102 (43) 93 (28) 91 (24) 93 (21) 96 (30) 104 (43)
8 TBECH 100 (25) 94 (17) 96 (16) 95 (12) 97 (18) 104 (32)
9 TBNPA 106 (26) 98 (14) 98 (16) 100 (11) 101 (18) 103 (34)
10 TBX 70 (12) 69 (8) 73 (7) 74 (10) 70 (11) 73 (26)
11 TCEP 101 (5) 97 (4) 96 (3) 98 (5) 99 (5) 105 (28)
12 TCPP 100 (7) 96 (4) 97 (3) 98 (4) 99 (6) 105 (28)
13 TDCPP 101 (9) 97 (7) 98 (11) 98 (10) 99 (10) 107 (32)
14 Triphenylphosphate 90 (39) 96 (27) 98 (25) 98 (23) 96 (28) 105 (46)
PAHs
1 Acenaphthene 100 (16) 99 (6) 100 (5) 101 (5) 100 (9) 100 (27)
2 Acenaphthalene 97 (6) 96 (5) 97 (3) 98 (3) 97 (5) 99 (22)
3 Anthracene 100 (11) 92 (5) 95 (5) 96 (4) 96 (8) 85 (27)
4 Benz(a)anthracene + Chrysene 69 (13) 66 (12) 67 (13) 68 (13) 68 (13) 40 (44)
5 Benzo(a)pyrene 109 (9) 97 (6) 95 (3) 97 (4) 100 (8) 22 (53)
6 Benzo(b + k)fluoranthene 123 (6) 115 (5) 113 (3) 115 (3) 117 (6) 27 (48)
7 Benzo(g,h,i)perylene 120 (15) 103 (8) 100 (4) 102 (4) 106 (12) 14 (64)
8 Dibenz(ah)anthracene 100 (13) 84 (8) 82 (5) 82 (5) 87 (13) 19 (58)
9 Fluoranthene 104 (5) 97 (4) 96 (3) 97 (3) 99 (5) 63 (32)
10 Fluorene 115 (17) 116 (10) 113 (7) 114 (8) 114 (12) 98 (24)
11 Indeno(1,2,3-c,d)pyrene 117 (14) 109 (12) 108 (8) 114 (12) 113 (12) 17 (61)
12 Naphthalene 128 (95) 118 (78) 117 (29) 108 (28) 115 (63) 114 (71)
13 Phenanthrene 114 (16) 101 (5) 99 (4) 99 (3) 104 (11) 89 (30)
14 Pyrene 108 (6) 99 (5) 97 (2) 98 (3) 101 (6) 57 (36)
PCBs
1 PCB 77 97 (17) 96 (7) 97 (8) 98 (9) 97 (11) 85 (29)
2 PCB 81 100 (8) 96 (8) 97 (6) 99 (7) 98 (8) 85 (27)
3 PCB 105 106 (7) 104 (8) 107 (6) 108 (6) 106 (7) 91 (26)
4 PCB 114 106 (5) 104 (7) 106 (7) 108 (8) 106 (7) 90 (26)
5 PCB 118 + 123 103 (8) 102 (7) 106 (7) 107 (7) 104 (8) 89 (28)
6 PCB 126 88 (12) 85 (9) 87 (11) 88 (11) 86 (11) 75 (29)
7 PCB 156 + 157 100 (8) 98 (8) 100 (9) 101 (9) 99 (9) 85 (26)
8 PCB 167 98 (7) 96 (8) 100 (8) 100 (9) 97 (9) 83 (28)
9 PCB 169 75 (19) 72 (13) 75 (13) 74 (14) 74 (15) 63 (30)
S. J. Lehotay et al.
1 3
PAHs, and nearly all FRs did not undergo MEs (<|±20 %|),mainly due to their nonpolar nature (relatively polar ana-lytes are more susceptible to MEs). Figure 8 shows MEs in the case of pesticides in each matrix plotted vs. increasing tR. When MEs <|±20 %| occur (shown by the box in the fig-ure), then RO standards can be used to yield similar results as MM calibration standards. Despite the common practice in residue analysis to use MM standards, they require stor-age of many blank matrices and take more time for sam-ple preparation, plus the extra materials, labor, and costs involved, than simply preparing RO calibration standards. Use of MM standards also causes more matrixes to be intro-duced to the instrument during analytical batches, as well as complications to match given matrices when different commodities are analyzed in the same sequence. Calibration using RO standards is more advantageous in practice, pro-vided that MEs do not lead to unacceptable accuracy.
Unlike LC–MS/MS in which ion suppression occurs due to MEs [26], signal enhancement commonly occurs to sus-ceptible analytes in GC analysis [27]. However, as shown in
Fig. 8, basil induced a severe response diminishment effect, presumably due to the sheer amount of co-extractives from the dried herb even after mini-SPE cleanup. Herbs and spices are unique matrices that require MM calibration even after extensive cleanup in any GC-MS or LC–MS method. With few exceptions between 2.5 and 5.5 min tR, MEs for the analytes fell within |±20 %| (see Fig. 8). As described previ-ously [19], the APs can overcome MEs for the analytes with tR less than about permethrin, but a good AP for the late-elut-ing pyrethroids has not been found yet. The current mixture of APs (and their breakdown products) is too volatile to co-elute with the late-eluting analytes, which is shown clearly in Fig. 8. In this study, 10 pesticides underwent >20 % MEs for all matrices except the least complex fruits and veg-etables (apple, kiwi, and carrot). These analytes consist of coumaphos, pyridaben, methoxychlor, and the pyrethroids: bifenthrin, fenpropathrin, permethrin, cyfluthrin, cyperme-thrin, esfenvalerate, and deltamethrin). Similarly, late-elut-ing PCBs, PAHs, and FRs yielded insignificant MEs, espe-cially when using IS with tR near the analytes. Despite the
Table 3 continued
Nos. Analyte 10ng mL−1
25ng mL−1
50ng mL−1
100ng mL−1
Overall vs. IS Overall w/o IS
10 PCB 170 98 (8) 97 (9) 99 (9) 100 (10) 98 (9) 83 (29)
11 PCB 180 100 (8) 95 (9) 99 (9) 98 (11) 96 (10) 82 (28)
12 PCB 189 92 (16) 92 (12) 91 (16) 93 (15) 91 (15) 76 (25)
Bold text indicates recovery <70 % or RSD >25 %
Underlining emphasizes overall recoveries of 90–110 % and RSD of 10 % or less
-100
-80
-60
-40
-20
0
20
40
60
80
100
2.75 3.00 3.25 3.50 3.75 4.00 4.25 4.50 4.75 5.00 5.25 5.50 5.75 6.00 6.25 6.50
%M
E (v
s. IS
)
Reten�on Time (min)
Apple
Kiwi
Carrot
Kale
Orange
Olive
Wheat
Basil
Pork
Salmon
Fig. 8 Matrix effects (MEs) of the 54 pesticides plotted vs. tR in LPGC-MS/MS using APs after automated mini-SPE cleanup of QuEChERS extracts of 10 matrixes
30 IngeniousNews 02/2017
Automated Mini-Column Solid-Phase Extraction Cleanup for High-Throughput Analysis of…
1 3
nonpolar nature of these PCBs, PAHs, and FRs, MEs were observed to a greater extent without normalization to the IS, which leads us to hypothesize that use of an appropriate IS for pyrethroids may solve this problem with excessive MEs.
Conclusions
The automated mini-SPE cleanup coupled with LPGC-MS/MS analysis not only achieved high quality results for diverse type of analytes and foods, the approach also enabled reliable, high-throughput operations without much labor or instrument maintenance. The use of a state-of-the-art GC-MS/MS instrument permitted injection of merely 1 mg sample equivalent while still achieving <5 ng g−1 LOQs for all analytes (LOQ < 0.5 ng g−1 for most ana-lytes). The use of APs also helped lead to very consistent tR and peak shape for the analytes, even after hundreds of sample injections, which enabled use of summation func-tion integration to eliminate human review of chromato-graphic peak integrations. This data processing approach saved many hours of analyst time, which is usually the rate limiting in real-world practice.
Using the final method in unattended instrument operation, two analysts conducted the full validation study involving 235 samples in 5 days. One of the analysts performed initial QuEChERS extractions, and because we do not have barcode reading, the other analyst’s time in the lab was spent labeling vials and entering sample names into long sequences. In the final method, the automated mini-SPE step took 8 min per sample, and the LPGC-MS/MS step was 13 min including oven re-equilibration. In the future, we intend to substantially reduce the time needed for both operations.
Last, some incurred analytes were quantified and iden-tified >10 ng g−1 in the tested commodities: imazalil (1243 ng g−1) and thiabendazole (640 ng g−1) were detected in the oranges, p,p′-DDE (56 ng g−1) was deter-mined in kale, and diphenylamine (17 ng g−1) and thia-bendazole (16 ng g−1) were detected in the Gala apple. A few other pesticides were identified between the 5 ng g−1 lowest calibrated level and 10 ng g−1 reporting level. The practical application of this automated approach has been demonstrated to meet real-world monitoring needs.
Acknowledgments Thanks to CTC Analytics for the firmware, com-munications board, software, and training to operate the robotic liq-uid handler. Thanks also to ITSP Solutions and Hill Laboratories for devising initial methods as a template. Lijun Han’s sabbatical funding was provided by the China Scholarship Council (CSC).
Compliance with Ethical Standards
Conflict of interest All authors declare no conflicts of interest. This article does not contain any studies with human participants or animals performed by any of the authors.
Open Access This article is distributed under the terms of the Crea-tive Commons Attribution 4.0 International License (http://crea-tivecommons.org/licenses/by/4.0/), which permits unrestricted use, distribution, and reproduction in any medium, provided you give appropriate credit to the original author(s) and the source, provide a link to the Creative Commons license, and indicate if changes were made.
References
1. World Trade Organization (2014) International trade statistics2014
2. European Food Safety Authority (2015) The 2013 EuropeanUnion report on pesticide residues in food. EFSA J 13:1–169
3. USDA Agricultural Marketing Service (2014) Pesticide dataprogram annual summary, calendar year 2014. https://www.ams.usda.gov/sites/default/files/media/2014%20PDP%20Annual%20Summary.pdf
4. Food Safety Modernization Act (FSMA). http://www.gpo.gov/fdsys/pkg/PLAW-111publ353/pdf/PLAW-111publ353.pdf
5. Global MRL database. https://www.globalmrl.com/6. European Food Safety Authority (EFSA) Pesticide MRL har-
monisation programme. http://www.efsa.europa.eu/en/mrls/mrlharmonisation
7. Lehotay SJ, Sapozhnikova Y, Mol HGJ (2015) Current issuesinvolving screening and identification of chemical contami-nants in foods by mass spectrometry. TrAC. Trends Anal Chem69:62–75
8. Anastassiades M, Lehotay SJ, Stajnbaher D, Schenck FJ (2003)Fast and easy multiresidue method employing acetonitrileextraction/partitioning and “dispersive solid-phase extraction”for the determination of pesticide residues in produce. J AOACInt 86:412–431
9. Gonzalez-Curbelo MA, Socas-Rodriguez B, Herrera-HerreraAV, Gonzalez-Salamo J, Hernandez-Borges J, Rodriguez-Del-gado MA (2015) Evolution and applications of the QuEChERSmethod. TrAC. Trends Anal Chem 71:169–185
10. Sapozhnikova Y, Lehotay SJ (2013) Multi-class, multi-residueanalysis of pesticides, polychlorinated biphenyls, polycyclic aro-matic hydrocarbons, polybrominated diphenyl ethers and novelflame retardants in fish using fast, low-pressure gas chromatogra-phy–tandem mass spectrometry. Anal Chim Acta 758:80–92
11. Raynie D (2016) Trends in sample preparation. LCGC North Am34:174–188
12. Morris BD, Schriner RB (2015) Development of an automatedcolumn solid-phase extraction cleanup of QuEChERS extracts,using a zirconia-based sorbent, for pesticide residue analyses byLC-MS/MS. J Agric Food Chem 63:5107–5119
13. Han L, Sapozhnikova Y, Lehotay SJ (2014) Streamlined samplecleanup using combined dispersive solid-phase extraction and in-vial filtration for analysis of pesticides and environmental pollut-ants in shrimp. Anal Chim Acta 827:40–46
14. Alder L, Greulich K, Kempe G, Vieth B (2006) Residue analy-sis of 500 high priority pesticides: better by GC-MS or LC–MS/MS? Mass Spectrom. Rev. 25:838–865
15. Wang J, Chow W, Chang J, Wong JW (2014) Ultrahigh-perfor-mance liquid chromatography electrospray ionization Q-Orbitrapmass spectrometry for the analysis of 451 pesticide residues infruits and vegetables: method development and validation. JAgric Food Chem 62:10375–10391
16. Zhang ZL, Rhind SM (2011) Optimized determination of poly-brominated diphenyl ethers and polychlorinated biphenyls insheep serum by solid-phase extraction-gas chromatography-massspectrometry. Talanta 84:487–493

31IngeniousNews 02/2017
Automated Mini-Column Solid-Phase Extraction Cleanup for High-Throughput Analysis of…
1 3
nonpolar nature of these PCBs, PAHs, and FRs, MEs were observed to a greater extent without normalization to the IS, which leads us to hypothesize that use of an appropriate IS for pyrethroids may solve this problem with excessive MEs.
Conclusions
The automated mini-SPE cleanup coupled with LPGC-MS/MS analysis not only achieved high quality results for diverse type of analytes and foods, the approach also enabled reliable, high-throughput operations without much labor or instrument maintenance. The use of a state-of-the-art GC-MS/MS instrument permitted injection of merely 1 mg sample equivalent while still achieving <5 ng g−1 LOQs for all analytes (LOQ < 0.5 ng g−1 for most ana-lytes). The use of APs also helped lead to very consistent tR and peak shape for the analytes, even after hundreds of sample injections, which enabled use of summation func-tion integration to eliminate human review of chromato-graphic peak integrations. This data processing approach saved many hours of analyst time, which is usually the rate limiting in real-world practice.
Using the final method in unattended instrument operation, two analysts conducted the full validation study involving 235 samples in 5 days. One of the analysts performed initial QuEChERS extractions, and because we do not have barcode reading, the other analyst’s time in the lab was spent labeling vials and entering sample names into long sequences. In the final method, the automated mini-SPE step took 8 min per sample, and the LPGC-MS/MS step was 13 min including oven re-equilibration. In the future, we intend to substantially reduce the time needed for both operations.
Last, some incurred analytes were quantified and iden-tified >10 ng g−1 in the tested commodities: imazalil (1243 ng g−1) and thiabendazole (640 ng g−1) were detected in the oranges, p,p′-DDE (56 ng g−1) was deter-mined in kale, and diphenylamine (17 ng g−1) and thia-bendazole (16 ng g−1) were detected in the Gala apple. A few other pesticides were identified between the 5 ng g−1 lowest calibrated level and 10 ng g−1 reporting level. The practical application of this automated approach has been demonstrated to meet real-world monitoring needs.
Acknowledgments Thanks to CTC Analytics for the firmware, com-munications board, software, and training to operate the robotic liq-uid handler. Thanks also to ITSP Solutions and Hill Laboratories for devising initial methods as a template. Lijun Han’s sabbatical funding was provided by the China Scholarship Council (CSC).
Compliance with Ethical Standards
Conflict of interest All authors declare no conflicts of interest. This article does not contain any studies with human participants or animals performed by any of the authors.
Open Access This article is distributed under the terms of the Crea-tive Commons Attribution 4.0 International License (http://crea-tivecommons.org/licenses/by/4.0/), which permits unrestricted use, distribution, and reproduction in any medium, provided you give appropriate credit to the original author(s) and the source, provide a link to the Creative Commons license, and indicate if changes were made.
References
1. World Trade Organization (2014) International trade statistics2014
2. European Food Safety Authority (2015) The 2013 EuropeanUnion report on pesticide residues in food. EFSA J 13:1–169
3. USDA Agricultural Marketing Service (2014) Pesticide dataprogram annual summary, calendar year 2014. https://www.ams.usda.gov/sites/default/files/media/2014%20PDP%20Annual%20Summary.pdf
4. Food Safety Modernization Act (FSMA). http://www.gpo.gov/fdsys/pkg/PLAW-111publ353/pdf/PLAW-111publ353.pdf
5. Global MRL database. https://www.globalmrl.com/6. European Food Safety Authority (EFSA) Pesticide MRL har-
monisation programme. http://www.efsa.europa.eu/en/mrls/mrlharmonisation
7. Lehotay SJ, Sapozhnikova Y, Mol HGJ (2015) Current issuesinvolving screening and identification of chemical contami-nants in foods by mass spectrometry. TrAC. Trends Anal Chem69:62–75
8. Anastassiades M, Lehotay SJ, Stajnbaher D, Schenck FJ (2003)Fast and easy multiresidue method employing acetonitrileextraction/partitioning and “dispersive solid-phase extraction”for the determination of pesticide residues in produce. J AOACInt 86:412–431
9. Gonzalez-Curbelo MA, Socas-Rodriguez B, Herrera-HerreraAV, Gonzalez-Salamo J, Hernandez-Borges J, Rodriguez-Del-gado MA (2015) Evolution and applications of the QuEChERSmethod. TrAC. Trends Anal Chem 71:169–185
10. Sapozhnikova Y, Lehotay SJ (2013) Multi-class, multi-residueanalysis of pesticides, polychlorinated biphenyls, polycyclic aro-matic hydrocarbons, polybrominated diphenyl ethers and novelflame retardants in fish using fast, low-pressure gas chromatogra-phy–tandem mass spectrometry. Anal Chim Acta 758:80–92
11. Raynie D (2016) Trends in sample preparation. LCGC North Am34:174–188
12. Morris BD, Schriner RB (2015) Development of an automatedcolumn solid-phase extraction cleanup of QuEChERS extracts,using a zirconia-based sorbent, for pesticide residue analyses byLC-MS/MS. J Agric Food Chem 63:5107–5119
13. Han L, Sapozhnikova Y, Lehotay SJ (2014) Streamlined samplecleanup using combined dispersive solid-phase extraction and in-vial filtration for analysis of pesticides and environmental pollut-ants in shrimp. Anal Chim Acta 827:40–46
14. Alder L, Greulich K, Kempe G, Vieth B (2006) Residue analy-sis of 500 high priority pesticides: better by GC-MS or LC–MS/MS? Mass Spectrom. Rev. 25:838–865
15. Wang J, Chow W, Chang J, Wong JW (2014) Ultrahigh-perfor-mance liquid chromatography electrospray ionization Q-Orbitrapmass spectrometry for the analysis of 451 pesticide residues infruits and vegetables: method development and validation. JAgric Food Chem 62:10375–10391
16. Zhang ZL, Rhind SM (2011) Optimized determination of poly-brominated diphenyl ethers and polychlorinated biphenyls insheep serum by solid-phase extraction-gas chromatography-massspectrometry. Talanta 84:487–493
S. J. Lehotay et al.
1 3
17. Sapozhnikova Y, Lehotay SJ (2015) Review of recent develop-ments and applications in low-pressure (vacuum outlet) gas chro-matography. Anal Chim Acta 899:13–22
18. Han L, Sapozhnikova Y, Lehotay SJ (2016) Method validationfor 243 pesticides and environmental contaminants in meats andpoultry by tandem mass spectrometry coupled to low-pressuregas chromatography and ultrahigh-performance liquid chroma-tography. Food Control 66:270–282
19. Mastovska K, Lehotay SJ, Anastassiades M (2005) Combina-tion of analyte protectants to overcome matrix effects in routineGC analysis of pesticide residues in food matrixes. Anal Chem77:8129–8137
20. Mastovska K, Lehotay SJ (2004) Evaluation of common organicsolvents for gas chromatographic analysis and stability of multi-class pesticide residues. J Chromatogr A 1040:259–272
21. Koesukwiwat U, Lehotay SJ, Leepipatpiboon N (2011) Fast,low-pressure gas chromatography triple quadrupole tandem massspectrometry for analysis of 150 pesticide residues in fruits andvegetables. J Chromatogr A 1218:7039–7050
22. [SANTE/11945/2015] Guidance document on analytical qualitycontrol and method validation procedures for pesticides residues
analysis in food and feed. http://ec.europa.eu/food/plant/docs/plant_pesticides_mrl_guidelines_wrkdoc_11945_en.pdf
23. Klee MS, Blumberg LM (2002) Theoretical and practical aspectsof fast gas chromatography and method translation. J Chroma-togr Sci 40:234–247
24. Lehotay SJ (2007) Determination of pesticide residues in foodsby acetonitrile extraction and partitioning with magnesium sul-fate: collaborative study. J AOAC Int 90:485–520
25. Medina-Pastor P, Rodriguez-Torreblanca C, Andersson A, Fer-nandez-Alba AR (2010) European Commission proficiency testsfor pesticide residues in fruits and vegetables. TrAC. TrendsAnal Chem 29:70–83
26. Hajslova J, Zrostlikova J (2003) Matrix effects in (ultra)traceanalysis of pesticide residues in food and biotic matrices. J Chro-matogr A 1000:181–197
27. Erney DR, Gillespie AM, Gilvydis DM, Poole CF (1993)Explanation of the matrix-induced chromatographic responseenhancement of organophosphorus pesticides during open tubu-lar column gas chromatography with splitless or hot on-col-umn injection and flame photometric detection. J Chromatogr638:57–63

www.palsystem.comVisit our homepage for more information.