issue paper number 64 april 2019
TRANSCRIPT

Issue Paper Number 64April 2019
Reducing the Impacts of Agricultural Nutrients on Water Quality across a
Changing Landscape
AbstrAct
Agricultural productivity in the United States has doubled over the last 50 years through agricultural intensifi-cation and adoption of new innovative technologies. Although efficiency of our agricultural systems has increased, water quality remains a concern with minimal measured improvements ob-served nationwide. The purpose of this paper is to provide an overview of the processes, conservation practices, and
Complexities and difficulties associated with nutrient cycling and transport processes, management decisions and prac-tice trade-offs, and federal conservation program effectiveness create immense challenges to achieving and measuring water quality improvement goals. (Photo courtesy of Lisa Gjersvik.)
This publication was made possible through funding provided by the United Soybean Board (“USB”). As stipulated in the Soybean Promotion, Research, and Consumer Information Act, USDA’s Agricultural Marketing Service (“AMS”) has oversight responsibilities for USB. AMS prohibits the use of USB’s funds to influence legislation and/or to influence governmental policy or action. Any opinions, findings, conclusions, or recommendations expressed in this publication are those of the author(s) and do not necessarily reflect the views of USB, USDA, and/or AMS.
programs that influence the impact of agriculture on surface and groundwater quality. Complexities and difficulties associated with nutrient cycling and transport processes, management decisions and practice trade-offs, and federal conservation program effec-tiveness create immense challenges to achieving and measuring water quality improvement goals. Development of more precise nutrient recommenda-tions, advancement of water monitoring methods to better differentiate among
potential nutrient sources, design and implementation of novel conserva-tion practices that address dissolved nutrient loss and in-stream nutrient retention, increased knowledge of processes influencing nutrient supply and transport, and increased cost-effectiveness of conservation programs integrating regional and industry-based collaboration are needed to continue to improve water quality in agricultural landscapes.

COUNCIL FOR AGRICULTURAL SCIENCE AND TECHNOLOGY2
Authors
Heidi Peterson (Chair), Phosphorus Program, International Plant Nutrition Institute, Stillwater, Minnesota
Mark Williams, National Soil Erosion Research Laboratory, U.S. Department of Agriculture– Agricultural Research Service, West Lafayette, Indiana
Jane Frankenberger, Department of Agricultural and Biological Engineering, Purdue University, West Lafayette, Indiana
Kevin King, Soil Drainage Research Unit, U.S. Department of Agriculture– Agricultural Research Service, Columbus, Ohio
CAST Issue Paper 64 Task Force Members
Josh McGrath, Department of Plant and Soil Sciences, University of Kentucky, Lexington
Lara Moody, Stewardship and Sustain-ability Programs, The Fertilizer Institute, Washington, D.C.
Marc Ribaudo, Resource and Rural Economics Division, U.S. Department of Agriculture–Economic Research Service (retired), Garner, North Carolina
Jeff Strock, Department of Soil, Water, and Climate, University of Minnesota, Lamberton
Reviewers
Matthew Helmers, Department of Ag-ricultural and Biosystems Engineering, Iowa State University, Ames
(Kleinman et al. 2018). Specialization has increased cost efficiencies (Winsberg 1982), but it has reduced on-farm crop diversity. Individual U.S. farms typically produced four to five commodities prior to World War II; however, the number of commodities decreased to two—primar-ily corn and soybean—by 2000 (Dimitri, Effland, and Conklin 2005). Specializa-
tion of agriculture has also resulted in animal production systems that are often geographically separated from the major cropping systems that serve as the source of feed. Uncoupling of cropping and animal production systems can result in regions in which cropland is primar-ily dependent on mineral fertilizers for crop nutrition, whereas other regions
Kris Johnson, Science and Planning, The Nature Conservancy, Minneapo-lis, Minnesota
Nathan Nelson, Department of Agronomy, Kansas State University, Manhattan
CAST Coliaison
Sally Flis, Agronomy, The Fertilizer Institute, Washington, D.C.
Todd Peterson, North American Ag Team, The Nature Conservancy, Johnston, Iowa
IntroductIonThe Food and Agriculture Organiza-
tion projects global population increases of two billion people by 2050 (FAO 2017). In order to sustainably meet the corresponding increased demand for food, feed, and fiber, agricultural produc-tivity must focus on increased efficiency and decreased environmental losses. Agriculture serves as a foundation of the U.S. economy, supporting its relationship with the world through trade and humani-tarian aid. Historical trends in U.S. crop-land highlight the developments that have propelled U.S. productivity to today’s re-cord high levels, with crop yields, a core measurement of productivity, doubling since the 1980s (USDA–NASS 2018). As crop productivity increased, fertil-izer use efficiency also increased (Figure 1) (IPNI 2015, 2018). These increases have been achieved through the adop-tion of improved agricultural technology, including crop breeding advancements, the availability of agricultural pesticides, innovations in farm machinery design, and precision agriculture methods (Wang et al. 2015).
Gains in production intensity over the 20th century have been accompanied by specialization of cropland farming
Figure 1. Productivity calculated by comparing the bushels of corn produced in the United States per pound of fertilizer nutrients applied from 1964 to 2014 based on U.S. Department of Agriculture (USDA)–National Agricul- tural Statistics Service yield data and USDA–Economic Research Service fertilizer application data shows that corn fertilizer use efficiency nearly doubled between 1980 and 2014 (IPNI 2015).
Bus
hels
of C
orn
per P
ound
of F
ertil
izer
Nut
rient
s

3COUNCIL FOR AGRICULTURAL SCIENCE AND TECHNOLOGY
with dense animal production and less cropland cannot feasibly land-apply their nutrient-rich manure without risk of applying at rates higher than crop utilization or adding transportation costs. Specialization of agriculture has altered flows of resources, particularly nutrients, compared to historical norms, which can contribute to an array of environmental concerns (Sharpley et al. 2013).
Supplying external inputs of nutrients such as nitrogen (N) and phosphorus (P) to cropland in order to maximize crop production was first recognized nearly 200 years ago (Sprengel 1827), and today 40 to 60% of crop yield is attributable to fertilizer (Stewart et al. 2005). Improve-ment in crop production practices, the addition of precision farming tools, and modern data informatics support higher crop production to resource utilization ra-tios than previously possible (Balafoutis et al. 2017). Nevertheless, U.S. croplands continue to contribute to inland (e.g., streams, rivers, lakes) and coastal (e.g., estuaries, bays) water quality impairment. Agricultural nutrient water quality con-cerns focus on N and P, because these nu-trients contribute directly to water quality degradation through eutrophication when lost from cropped fields through erosion, surface runoff, or leachate to environmentally sensitive groundwater or downstream water bodies.
Although many sources, such as wastewater treatment plants, septic systems, or urban nonpoint sources, contribute nutrients to water bodies, agriculture remains a significant source in many areas of the United States. Nutri-ent losses to receiving waters can result in eutrophication, which manifests as the nuisance growth of algae and algal blooms. Algal growth in surface waters directly responds to nutrient enrichment (Smith 2003). Bloom conditions might result in major water quality disruptions such as objectionable taste and odor in drinking water, fish kills, or acute toxic or poisoning events (i.e., harmful algal blooms). For instance, more frequent and intense algal blooms have occurred in Lake Erie due to increased soluble nutri-ent contributions from river tributaries (Kane et al. 2014). In August 2014, mi-crocystin concentrations reached danger-ous levels, which resulted in a three-day
drinking water supply shutdown for the City of Toledo, Ohio, impacting 500,000 residents.
The number of coastal areas in the United States experiencing low oxygen conditions or hypoxia resulting from nu-trient enrichment has increased from 12 documented cases in 1960 to more than 300 cases in 2010 (Committee on Envi-ronment and Natural Resources 2010). In some areas of the country, such as the Chesapeake Bay and the mid-Atlantic, hypoxia-related issues have persisted since the 1950s. Concurrently, a grow-ing prevalence of hypoxia in the Gulf of Mexico and south Atlantic has emerged since the 1980s (Committee on Envi-ronment and Natural Resources 2010). Similar to the toxic algal bloom reported in Lake Erie in 2014, toxic cyanobac-teria have been implicated in human and animal illness and death in at least 43 states, with 19 states posting public health advisories in 2016 alone (Graham, Dubrovsky, and Eberts 2017).
Looking toward the future, U.S. agriculture faces an unprecedented chal-lenge—support growing domestic and global agricultural product demands (FAO 2017) while minimizing environ-mental impacts on local and regional water resources. With the adoption of new technology, innovative conserva-tion practices, and enhanced efficiency, increasing crop production and shrinking the environmental footprint of agriculture do not have to be at odds. The modern soil and water conservation movement was born largely over concerns about cropland agriculture in the first half of the 20th century. The Dust Bowl of the Great Plains in the 1930s, the general loss of farmland productivity, and impacts to wa-ter, air, and ecosystem services spawned conservation in the United States (Ben-nett and Chapline 1928; Leopold 1949). Conservation activities, however, can compete with other priorities, including the pursuit of profitability, belief systems, and local cultural practices (Ervin and Er-vin 1982; Knowler and Bradshaw 2007).
The purpose of this publication is to provide background detailing the under-lying complexities and challenges faced by U.S. cropland agriculture to sustain-ably meet water quality nutrient reduction goals while advancing productivity. There
are six main sections within the publica-tion, with the first section describing soil N and P nutrient cycles, which serve as the foundation to both crop produc-tion and environmental loss. The second section describes the current knowledge of factors that control nutrient loss to groundwater and surface water, while the third and fourth sections document nutri-ent management practices and common conservation practices, respectively, that farmers, land managers, and conservation professionals currently use to decrease agriculture’s impact on water quality. Section five highlights environmental policies, incentives, and programs, past and present, related to cropland agricul-ture and water quality. The final section summarizes the challenges and associated needs for agriculture to move toward improving efficiency, meeting water qual-ity goals, and sustaining crop production levels.
soIl nutrIent cyclesNutrients, such as N and P, exist in the
soil in multiple forms or pools. Nutri-ent cycles describe the pools in which nutrients reside and how they move into, out of, and among these different pools. In order to increase cropland productivity and reduce agriculture’s environmental impact, land managers must understand nutrient cycling. Farmers apply mineral fertilizers and manures to fields to meet crop nutrient needs. The quantity and form of nutrient in the soil and available to the plant, the amount of crop biomass produced along with the tissue nutrient concentration, and the efficiency of the applied nutrient combine to determine total nutrient requirements for any crop. Four main processes are prevalent in soil nutrient cycling: 1. Addition—the input of nutrients to
the soil system2. Translocation—movement of nutri-
ents within the soil without changing form
3. Transformation—chemical or biologi- cal conversion between chemical
assemblages containing the element4. Loss—the movement of nutrients
out of the soil system through the harvested grain, with water, or to the atmosphere as a gas

COUNCIL FOR AGRICULTURAL SCIENCE AND TECHNOLOGY4
Phosphorus CycleMineral fertilizers, manures, and other
organic residues (e.g., biosolids, plant residues) contain P in various forms, in-cluding plant available (soluble P), slow-ly available (P minerals and P attached to mineral surfaces), and plant unavailable. Phosphorus must be dissolved in the soil solution to be taken up by crops, typically as orthophosphate and soluble organic P compounds. Once P is removed from the soil solution, it is replenished by the residual P in the soil. The transformation of organic P forming into plant-available P occurs through mineralization. Inor-ganic P pools can also replenish the soil solution either through soil P miner-als dissolving into the soil solution or desorption of P attached to soil particles such as clay or minerals containing iron or aluminum (see Figure 2).
Similar to the replenishing of soil solution P when the concentration of P becomes low, P can also be removed from the soil solution when P concentra-tions become too great. Depending on the soil pH, dissolved P will precipitate and form solid calcium phosphate miner-als (high soil pH) or iron and aluminum phosphate minerals (low soil pH). Thus, plant-available P is often at its greatest concentration between a soil pH of 6.0 and 6.7. Phosphorus can also be removed from the soil solution and attach to soil particles like clays or iron and aluminum minerals via adsorption. Phosphorus can move with water running over the soil surface or percolating downward through the profile in either dissolved or particu-late forms. Particulate P losses include P attached to eroded soil particles, P in plant residues, or recent P inputs moved through incidental transfer.
Nitrogen CycleThe complexity of the N cycle exceeds
that of the P cycle due to the variabil-ity introduced by the many microbial processes involved. Plants take up N from inorganic forms. Mineral fertil-izer, manures, and other organic residues added to the soil as fertilizer contain N in both inorganic plant-available (ammo-nium [NH4
+], nitrate [NO3-]) and organic
(amino acids, amino sugars, complex or-ganic molecules) forms. The atmosphere also adds N to the soil cycle through
fixation and deposition. Nitrogen-fixing bacteria living in the soil or colonized on the roots of legumes, such as soybean, alfalfa, and clover, can convert nonreac-tive elemental nitrogen (N2 gas) from the atmosphere into plant-available forms. In addition, thermal fixation, either natural (e.g., lightning) or anthropogenic (e.g., internal combustion engines), converts atmospheric N2 to NH4
+, which can be deposited on the soil surface when it rains (see Figure 3).
Organic N in the soil can be trans-formed by soil microbes into plant-available NH4
+ through mineralization. Ammonium at the soil surface can volatize to the atmosphere as ammonia gas or it can be converted in a secondary process through nitrification by soil mi-crobes to NO3
-. Nitrate can be converted to nitrous oxide, a greenhouse gas, or N2 gas through denitrification. Nitrogen lost from the soil system via the movement of water can occur as NH4
+, NO3-, or organic
N, with the form of N largely determin-ing whether it is transported in surface runoff, attached to soil particles, or as leachate. As with P, N can be lost through surface runoff either dissolved as NO3
-, NH4
+, or soluble organic molecules, or in particulate form. In addition, N can be lost as NO3
-, which easily moves down-ward through the soil profile and con-nects to groundwater flow paths.
controls on nutrIent loss to surfAce WAters And GroundWAter
Nutrient loss from agricultural fields and watersheds is determined by the complex interaction among numerous physical, chemical, and biological vari-ables. These variables can be separated into two main factors—nutrient supply and nutrient transport—which are dis-
Figure 2. The P cycle. (Diagram courtesy of the International Plant Nutrition Institute.)

5COUNCIL FOR AGRICULTURAL SCIENCE AND TECHNOLOGY
cussed independently in this section. It is important to note, however, that it is the combination of both factors that ultimate-ly determines the risk of nutrient loss.
Nutrient Supply
Crop harvest removes nutrients from the field, which farmers replace through manure and fertilizer application. Fertil-izers and manures have the potential to elevate nutrient concentrations in surface runoff and subsurface leachate, particularly if applied beyond crop need. Although multiple site and environmental factors control hydrologic processes, gen-erally the risk of nutrient loss in surface runoff is greatest in the first precipitation or irrigation event after nutrient applica-tion, with losses generally decreasing over several weeks to months (Gascho et al. 1998; Kleinman et al. 2011). Thus, high rates of fertilizer and manure ap-plied to soils prior to periods of snowmelt or high rainfall, or shortly before irriga-
tion events, produce the greatest potential risk for elevated nutrient loss in runoff to downstream water bodies (King et al. 2018; Kleinman and Sharpley 2003; Wil-liams et al. 2011).
The magnitude of nutrient concentra-tions in runoff or leachate from recently applied nutrient sources is generally a function of the nutrient application rate, the nutrient form, the nutrient source solubility, and the dominant hydrologic transport mechanism (Kleinman et al. 2007; Mulla and Strock 2008). Fertilizer and manure application placement and timing can also affect both the magnitude and the duration of incidental nutrient transfer. Application placement meth-ods that incorporate or mix the nutri-ent source into the soil often result in decreased nutrient wash-off in runoff and leachate compared to surface applica-tion methods (Little, Bennett, and Miller 2005; Williams et al. 2018).
Although incidental transfers of el-
evated nutrients lessen during the weeks and months after nutrient application, over time a portion of nutrient inputs can accumulate in the soil across fields and watersheds. Accumulated nutrients can be remobilized years, decades, or even centuries after their initial application and function as a chronic source of nutrients to downstream water bodies. This is often referred to as “legacy” nutrient loss (Sharpley et al. 2013) and results from local and regional nutrient imbalances (i.e., nutrient inputs > nutrient removal) and the buildup of nutrients in soils and groundwater over time. It is estimated that annual N accumulation in soils throughout the Mississippi River Basin from 1957 to 2010 was between 25 and 70 kilograms (kg)/hectare (ha) (Van Me-ter et al. 2016), whereas P accumulated across North America between 1965 and 2007 at an average annual rate of 11 kg/ha (Sattari et al. 2012).
Phosphorus accumulation in surface soils (0–20 centimeters [cm]) represents the most pervasive legacy source of P to the environment (Sharpley et al. 2013). Concentrations of total P in agricultural soils can range from two to ten times greater than background concentrations under forest soils due to the legacy of historical P additions (Vitousek et al. 2009; Sattari et al. 2012). This legacy buildup can be spatially disproportionate across a watershed, leaving some agri-cultural soils below critical soil P fertility levels. A large fraction of total P loss in surface runoff and subsurface drain-age is in particulate form (i.e., P bound to soils); thus, erosion is an important mechanism for mobilizing P, including legacy P. Sharpley (1980) showed that eroded sediments can be enriched with P (up to five times) relative to the bulk soil due to the preferential erosion of fine soil particles with greater P content. The sorp-tion and desorption of P by soil is also important for P losses in both surface and subsurface pathways. Correlations have been observed between P concentrations in soils and dissolved P concentrations in surface runoff (Pote et al. 1996) and subsurface tile drainage (Duncan et al. 2017a). The buildup of the P supply in soils can therefore result in persistent P losses across multiple spatial scales (King et al. 2017).
Figure 3. The N cycle. (Diagram courtesy of the International Plant Nutrition Institute.)

COUNCIL FOR AGRICULTURAL SCIENCE AND TECHNOLOGY6
Nitrogen can also accumulate in soils over time when nutrient application rates exceed nutrient removal by crops and persist as a chronic source of N loss to downstream water bodies (Van Meter et al. 2016). Additionally, N in the form of NO3
- is highly mobile in the soil because of the negative charge, and it can leach below the crop rooting zone and into subsurface tile drainage or groundwater. In some locations, concentrations of NO3
- in groundwater under agricultural land use are documented to be five to seven times greater than concentrations of NO3
- under forest (Pionke and Urban 1985). In a long-term watershed study conducted prior to the 1990s, measured increases in groundwater NO3
- concentration were ap-proximately proportional to the increase in N fertilizer use over the same period (Böhlke and Denver 1995).
The percent of applied N that leaches to groundwater varies because of many factors. Puckett, Tesoriero, and Du-brovsky (2011) showed that a larger frac-
tion of applied N is leached to ground-water in irrigated areas, whereas in areas with subsurface tile drains and surface ditches, N is often diverted to surface water through tile drains, leaving less available to leach directly into ground-water. Research has demonstrated that even after four years of not applying N fertilizer in a corn-corn and corn-soybean rotation, irrigated sandy soils can still have NO3
- leachate losses above drinking water standards, illustrating the challenge of meeting water quality goals in corn cropping systems (Struffert et al. 2016). Where artificial drainage is not present, excess water at the land surface can infil-trate the soil and enter the groundwater system. Groundwater can discharge into surface water bodies where a stream in-tersects the water table. In most aquifers, groundwater moves at very slow rates, with groundwater residence times rang-ing from 0 to >50 years in many cases (Lindsey et al. 2003). Thus, depending on the residence time of groundwater
and the history of N fertilization, legacy N can be supplied to downstream water bodies for years to decades in the future (Gilmore et al. 2016; Sprague, Hirsch, and Aulenbach 2011).
Nutrient TransportResearch across diverse agricultural
landscapes in the United States, includ-ing the Mississippi River Basin (Gall et al. 2013) and Western Lake Erie Basin (Williams, King, Baker, et al. 2016), has shown that hydrological processes are an important component driving nutrient loss. Nutrient losses tend to be propor-tional to water flux as the result of both the buildup of nutrient supply (i.e., legacy nutrients) and the alteration of nutrient transport pathways. The alteration of nutrient transport pathways is perhaps most evident throughout the midwestern United States, where many agricultural fields are artificially drained with dense surface and subsurface drainage networks (Figures 4 and 5). Artificial subsurface
Figure 4. Artificial drainage of farmland soils has increased crop productivity, but as a result it created hydrologic connec- tivity between agricultural landscapes and waterways. In some regions, more than 50% of the cropland has been drained (Jaynes and James 2007).

7COUNCIL FOR AGRICULTURAL SCIENCE AND TECHNOLOGY
Figure 5. Agricultural fields are often artificially drained by a network of sub- surface pipes, also known as tile drainage, to remove excess water off the fields to decrease the impact of flooding and allow for earlier spring planting. (Image courtesy of transformingdrainage.org.)
Figure 6. Artificial drainage networks, including subsurface tile lines and drainage ditches, increase hydrologic connec- tivity of agricultural land- scapes. (Photo courtesy of Russell Derickson.)
drainage networks are often referred to as “tile” drainage, although the use of clay tile pipes has been replaced with the use of corrugated plastic tubing. Wetlands and soils with poor drainage throughout the Midwest have largely been drained over the past 150 years to facilitate crop production. For example, Bishop, Joens, and Zohrer (1998) estimated that between 95 and 99% of wetlands in Iowa have been lost due to artificial drainage. Effi-cient drainage systems provide numerous agronomic benefits, but they also greatly modify the magnitude, timing, and flow pathways of nutrient transport (King et al. 2015).
Surface ditches and subsurface tile drains increase the hydrologic connec-tivity of agricultural landscapes (Figure 6). For example, in the Prairie Pothole Region of the upper Midwest, surface water ponded in closed depressions is often routed via the artificial drainage network directly to a distant stream or ditch; whereas, prior to installation of the artificial drainage, this surface water (and
associated nutrients) would have re-mained isolated. Artificial drainage depth and spacing can also significantly affect nutrient transport. Ditches or tile drains spaced closer together often yield greater nutrient losses (Kladivko et al. 2004). Subsurface tile drains located deeper in the soil profile tend to increase nutrient loads (Strock et al. 2010). In watersheds with artificial drainage, the artificial drainage network can be the greatest con-tributor to nutrient loads at the watershed outlet. For example, subsurface tile drains accounted for 47%, 48%, and 62% of annual water, dissolved P, and NO3
- loads, respectively, exported from a watershed in Ohio (King, Williams, and Fausey 2015; Williams, King, and Fausey 2015).
Agricultural management practices that influence soil surface properties, such as the amount of residue cover, aggregate stability, and surface crust-ing, can play a critical role in nutrient transport by altering the amount of water that infiltrates into the soil versus the amount of water that runs off. Tebrügge and Düring (1999) found that fields with long-term no-tillage were less susceptible to surface sealing and erosion, were more resistant to the effects of compaction, and developed continuous macropores, which improved water infiltration rates com-pared to fields with conventional tillage. The conversion of natural to agricultural ecosystems has resulted in substantial depletion of soil organic matter (Lal 2004). Soil organic matter influences soil structure, infiltration (Minasny and Mc-Bratney 2017), and nutrient retention (Lal 2009). For instance, fine-textured soils with lesser organic matter content may be more prone to develop preferential flow pathways, which can route nutrient-laden water from surface soils directly to subsurface tile drains (Jarvis 2007). Although P concentrations in surface runoff are often greater than concentra-tions in leachate (Pease et al. 2018), it is important to acknowledge that large dissolved P and NO3
- leachate losses have been observed from no-till fields follow-ing surface application of fertilizers due to macropore transport (Daryanto, Wang, and Jacinthe 2017; Williams, King, Ford, et al. 2016).
Irrigation is important for reliable food production in many areas of the

COUNCIL FOR AGRICULTURAL SCIENCE AND TECHNOLOGY8
United States, with approximately 22.7 million ha (56 million acres) of irrigated cropland in 2013 (USDA–NASS 2014). Excess irrigation water can become “ir-rigation return flow” and be transported to water bodies as both surface runoff and subsurface drainage water (Bjorne-berg, Westermann, and Aase 2002). In many areas that require irrigation, natural rainfall does not typically produce either surface runoff or leaching (Bjorneberg et al. 2015); thus, irrigation and irrigation return flow that transports nutrients from agricultural fields to water bodies can sig-nificantly influence nutrient loss in these landscapes. For example, between 20 and 50% of water applied during furrow irrigation may run off a field depending on crop, management, water supply, and field conditions, carrying with it sediment and nutrients (Bjorneberg, Westermann, and Aase 2002). Irrigation practices can also increase the risk on NO3
- leaching to subsurface tile lines and groundwa-ter (Puckett, Tesoriero, and Dubrovsky 2011). The type of irrigation (e.g., furrow irrigation, sprinkler irrigation), frequency and timing of irrigation, and cropping system are important factors controlling nutrient loss from irrigated fields (Bjorne-berg et al. 2015).
Although current and historic an-thropogenic activities have substantially altered nutrient transport processes in agricultural fields and watersheds, climatic variables are also important in determining nutrient transport. Precipi-tation amount, duration, intensity, and timing not only influence the potential for nutrient transport within an event and the partitioning of water in surface and subsurface flow pathways, but also influ-ence antecedent soil moisture, which can determine the potential for nutrient loss in subsequent events.
Increasing climate variability and frequency of extreme events are predicted over the next century (IPCC 2014), which is likely to influence both the quantity and quality of water transported from agricultural landscapes (Wang et al. 2018). Changes in the magnitude and variability of precipitation are expected to result in shifts in the seasonal timing and magnitude of flows (Bosch et al. 2014; Stone, Hotchkiss, and Mearns 2003). For example, climate scenarios modeled by
Masaki and colleagues (2014) found that more water, and therefore more nutrients, in large rivers was likely to be transport-ed during a smaller fraction of the year across most of the United States. Phos-phorus losses are expected to increase because of more intense precipitation (Ockenden et al. 2017), and the vari-ability between dry and wet years will increase N losses and levels of concern in rivers (Loecke et al. 2017). Forecasted changes in air temperature and length of growing season may also influence the hydrologic cycle and potentially nutrient transport via changes in evapotranspira-tion (Marshall and Randhir 2008). As farmers adapt to changes in climatic vari-ables, further alteration of the hydrologic processes controlling nutrient transport (e.g., increased subsurface drainage in-tensity, increased irrigation) may occur.
nutrIent MAnAGeMent PrActIces to decreAse nItroGen And PhosPhorus losses
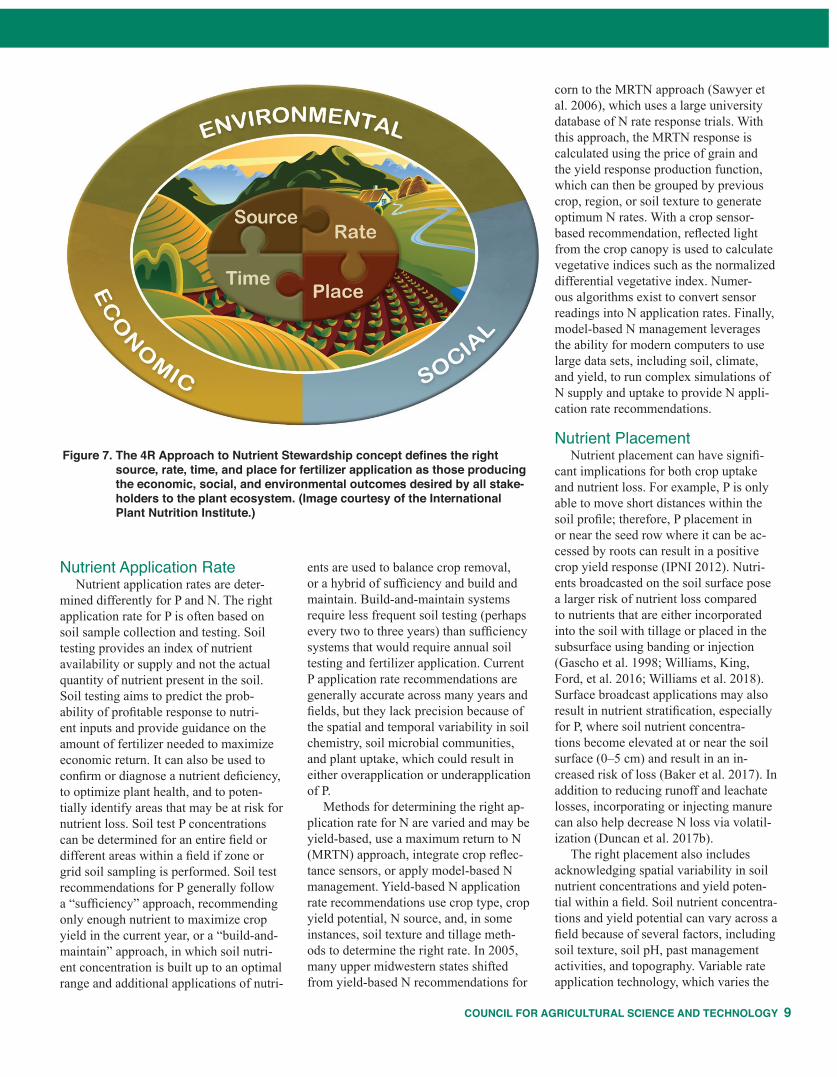
Nutrient management not only has direct implications for crop productivity, but it can also strongly influence nutrient losses to groundwater and surface water bodies. To maximize crop productivity and minimize environmental impact, four primary components of nutrient management should be considered—the source of the nutrient, the rate of nutrient application, how the nutrient is applied, and when the nutrient is applied. Defining the right nutrient source at the right rate, at the right time, and in the right place within the context of a well-managed cropping system has been adopted by the fertilizer industry as the “4R Approach to Nutrient Stewardship” (Figure 7) and helps convey how nutrients should be managed to ensure alignment with eco-nomic, social, and environmental goals (IPNI 2012). This section reviews basic information on the 4R approach as it relates to N and P losses to groundwater and surface water.
Nutrient SourceThe right source of nutrient is depen-
dent on the nutrient content, its solubility, and whether it is regionally available.
Most commercially produced mineral fertilizers are highly soluble when ap-plied to the soil and each contain differ-ent quantities of N and P, as well as other essential nutrients for crop development. Mineral fertilizers typically contain N and P in inorganic forms that are im-mediately available for crop uptake, but these nutrient forms can also be trans-ported with water and potentially lead to large losses if a rainfall or irrigation event occurs shortly after application (Smith et al. 2016). Manure, which is composed of animal feces, urine, and, in some cases, bedding materials and water, is also a common nutrient source applied to croplands, which can also serve as a source of organic matter (Lorimor, Pow-ers, and Sutton 2004). Manure nutrient, organic matter, and water content can vary greatly depending on the stage of animal growth, feeding practices, amount of bedding or water added to the manure, type of manure storage, and time that manure spends in storage. This variability makes manure more difficult to manage than mineral fertilizers (Lorimor, Powers, and Sutton 2004). Manure often contains nutrients in organic forms, which are less soluble than those found in mineral fertil-izers. When applied to the soil, organic nutrients mineralize over time, releasing nutrients that may be susceptible to loss through runoff or leaching.
The N to P ratio in manures does not typically match the ratio of N to P required by plants; thus, meeting crop N demands with manure may result in applying three to five times more P than the crop needs. In many livestock produc-tion areas, nutrient imbalances occur as a result and lead to buildup of nutrients, especially P, in excess of crop needs. These legacy nutrients present in soils can result in substantial and persistent nutrient losses to groundwater and sur-face water. Manure testing to determine nutrient content is a critical component of manure nutrient management. Nutri-ent losses from croplands with applied manure are not necessarily greater than nutrient losses from croplands receiving mineral fertilizers (Lory, Massey, and Joern 2008). When manure and fertil-izer are applied at the same application rate, annual nutrient losses are similar in magnitude (King et al. 2018).
9COUNCIL FOR AGRICULTURAL SCIENCE AND TECHNOLOGY
Nutrient Application RateNutrient application rates are deter-
mined differently for P and N. The right application rate for P is often based on soil sample collection and testing. Soil testing provides an index of nutrient availability or supply and not the actual quantity of nutrient present in the soil. Soil testing aims to predict the prob-ability of profitable response to nutri-ent inputs and provide guidance on the amount of fertilizer needed to maximize economic return. It can also be used to confirm or diagnose a nutrient deficiency, to optimize plant health, and to poten-tially identify areas that may be at risk for nutrient loss. Soil test P concentrations can be determined for an entire field or different areas within a field if zone or grid soil sampling is performed. Soil test recommendations for P generally follow a “sufficiency” approach, recommending only enough nutrient to maximize crop yield in the current year, or a “build-and-maintain” approach, in which soil nutri-ent concentration is built up to an optimal range and additional applications of nutri-
ents are used to balance crop removal, or a hybrid of sufficiency and build and maintain. Build-and-maintain systems require less frequent soil testing (perhaps every two to three years) than sufficiency systems that would require annual soil testing and fertilizer application. Current P application rate recommendations are generally accurate across many years and fields, but they lack precision because of the spatial and temporal variability in soil chemistry, soil microbial communities, and plant uptake, which could result in either overapplication or underapplication of P.
Methods for determining the right ap-plication rate for N are varied and may be yield-based, use a maximum return to N (MRTN) approach, integrate crop reflec-tance sensors, or apply model-based N management. Yield-based N application rate recommendations use crop type, crop yield potential, N source, and, in some instances, soil texture and tillage meth-ods to determine the right rate. In 2005, many upper midwestern states shifted from yield-based N recommendations for
corn to the MRTN approach (Sawyer et al. 2006), which uses a large university database of N rate response trials. With this approach, the MRTN response is calculated using the price of grain and the yield response production function, which can then be grouped by previous crop, region, or soil texture to generate optimum N rates. With a crop sensor-based recommendation, reflected light from the crop canopy is used to calculate vegetative indices such as the normalized differential vegetative index. Numer-ous algorithms exist to convert sensor readings into N application rates. Finally, model-based N management leverages the ability for modern computers to use large data sets, including soil, climate, and yield, to run complex simulations of N supply and uptake to provide N appli-cation rate recommendations.
Nutrient PlacementNutrient placement can have signifi-
cant implications for both crop uptake and nutrient loss. For example, P is only able to move short distances within the soil profile; therefore, P placement in or near the seed row where it can be ac-cessed by roots can result in a positive crop yield response (IPNI 2012). Nutri-ents broadcasted on the soil surface pose a larger risk of nutrient loss compared to nutrients that are either incorporated into the soil with tillage or placed in the subsurface using banding or injection (Gascho et al. 1998; Williams, King, Ford, et al. 2016; Williams et al. 2018). Surface broadcast applications may also result in nutrient stratification, especially for P, where soil nutrient concentra-tions become elevated at or near the soil surface (0–5 cm) and result in an in-creased risk of loss (Baker et al. 2017). In addition to reducing runoff and leachate losses, incorporating or injecting manure can also help decrease N loss via volatil-ization (Duncan et al. 2017b).
The right placement also includes acknowledging spatial variability in soil nutrient concentrations and yield poten-tial within a field. Soil nutrient concentra-tions and yield potential can vary across a field because of several factors, including soil texture, soil pH, past management activities, and topography. Variable rate application technology, which varies the
Figure 7. The 4R Approach to Nutrient Stewardship concept defines the right source, rate, time, and place for fertilizer application as those producing the economic, social, and environmental outcomes desired by all stake- holders to the plant ecosystem. (Image courtesy of the International Plant Nutrition Institute.)
COUNCIL FOR AGRICULTURAL SCIENCE AND TECHNOLOGY10
nutrient application rate according to the location within the field using geographic information systems and global position-ing systems, can not only help improve nutrient use efficiency, but also decrease the potential for nutrient losses (Harmel et al. 2004).
Nutrient TimingThe right timing of nutrient applica-
tion aims to ensure there is adequate nutrient supply during peak crop uptake and critical crop growth stages. Syn-chronizing nutrient applications with crop demand is not always easy because of several factors including crop type, environmental conditions (e.g., precipita-tion, soil moisture), and the time avail-able for farming operations. Phosphorus is often recommended to be applied at planting to ensure the P is available to early developing plants. Nitrogen can also be applied at planting or in split ap-plications, whereby a portion of the N is applied at planting and the remainder is applied later in the growing season to bet-ter match crop needs. Timing of nutrient applications can be further managed with slow- and controlled-release fertilizer technology, stabilizers, and inhibitors that can slow the transformation of applied nutrients within the soil.
Timing of nutrient application should also consider soil conditions and weather patterns to decrease the risk of nutrient loss. Nutrient application to frozen or snow-covered soils should generally be avoided because frozen soils can limit infiltration of meltwater or rainfall into the soil and lead to large runoff events (Srinivasan et al. 2006; Williams et al. 2011). Similarly, nutrient applications to saturated soils or immediately prior to large rainfall or irrigation events should be avoided to minimize the risk of nutri-ent loss. Events immediately following nutrient application can lead to significant nutrient loss (Smith et al. 2016) that, in some cases, can constitute a large propor-tion of the annual nutrient load (King et al. 2018).
In-fIeld, edGe-of-fIeld, And In-streAM conser-vAtIon PrActIces to decreAse the IMPAct of AGrIculture on WAter QuAlIty
Conservation practices, also referred to as best management practices (BMPs), can be used in combination with nutri-ent management to decrease nutrient loss from cropped fields (Strock et al. 2010). This section will provide an overview of some of the common conservation prac-tices used on croplands across the United States. The nutrient reduction potential for many conservation practices is often site specific due to differences in soils, climate, hydrology, and management sys-tems; thus, rather than focus on the range of nutrient removal potential, the authors highlight the primary mechanisms for nutrient removal for each practice and identify potential trade-offs.
Vegetated Filter Strips and Grassed Waterways
Vegetated filter strips, buffers, or riparian zones are often implemented between the edge of an agricultural field and a stream or drainage ditch. Similarly, grassed waterways can be established on sloping areas, with the primary purpose of stabilizing soil from erosion in natural
drainage ways. When positioned on the landscape in an area receiving surface runoff from agricultural fields, vegetated filter strips and grassed waterways can trap sediment and particulate nutrients (i.e., nutrients bound to the sediment) (Shipitalo et al. 2010). Vegetated filter strips can also intercept shallow ground-water flowing laterally toward the stream or ditch and decrease NO3
- concentrations (Vidon, Welsh, and Hassanzadeh 2018). These practices tend to be the most effi-cient at removing nutrients when surface flow is uniformly distributed and shallow, with efficiency substantially decreased when surface flow becomes concentrated or subsurface flow is short circuited through a subsurface drainage system. When not properly maintained, they can also accumulate sediment and nutrients and, as a result, become a nutrient source over time.
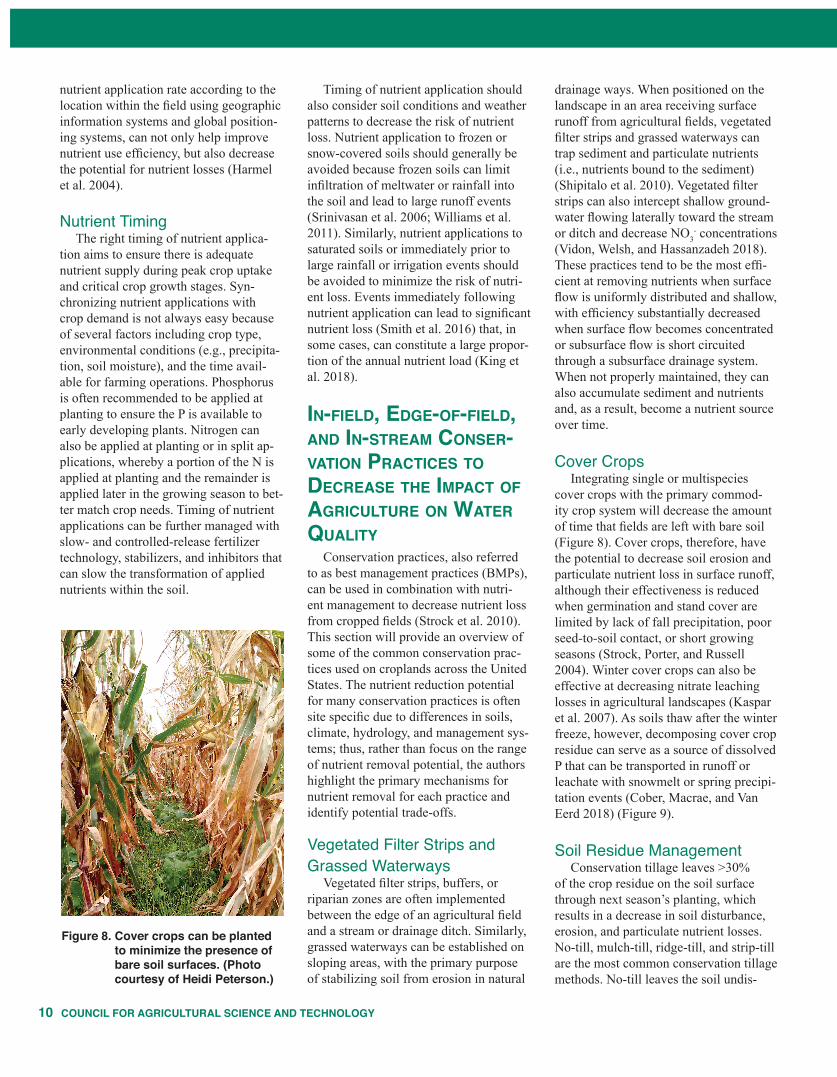
Cover CropsIntegrating single or multispecies
cover crops with the primary commod-ity crop system will decrease the amount of time that fields are left with bare soil (Figure 8). Cover crops, therefore, have the potential to decrease soil erosion and particulate nutrient loss in surface runoff, although their effectiveness is reduced when germination and stand cover are limited by lack of fall precipitation, poor seed-to-soil contact, or short growing seasons (Strock, Porter, and Russell 2004). Winter cover crops can also be effective at decreasing nitrate leaching losses in agricultural landscapes (Kaspar et al. 2007). As soils thaw after the winter freeze, however, decomposing cover crop residue can serve as a source of dissolved P that can be transported in runoff or leachate with snowmelt or spring precipi-tation events (Cober, Macrae, and Van Eerd 2018) (Figure 9).
Soil Residue ManagementConservation tillage leaves >30%
of the crop residue on the soil surface through next season’s planting, which results in a decrease in soil disturbance, erosion, and particulate nutrient losses. No-till, mulch-till, ridge-till, and strip-till are the most common conservation tillage methods. No-till leaves the soil undis-
Figure 8. Cover crops can be planted to minimize the presence of bare soil surfaces. (Photo courtesy of Heidi Peterson.)
11COUNCIL FOR AGRICULTURAL SCIENCE AND TECHNOLOGY
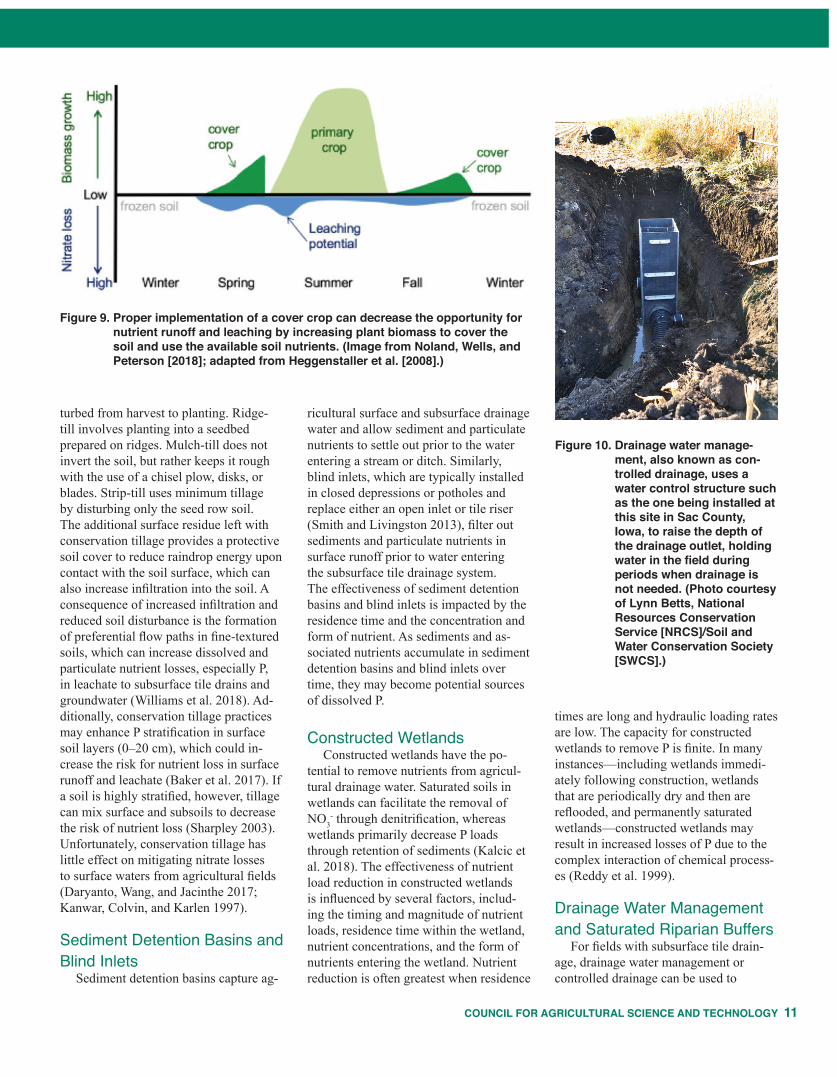
Figure 10. Drainage water manage- ment, also known as con- trolled drainage, uses a water control structure such as the one being installed at this site in Sac County, Iowa, to raise the depth of the drainage outlet, holding water in the field during periods when drainage is not needed. (Photo courtesy of Lynn Betts, National Resources Conservation Service [NRCS]/Soil and Water Conservation Society [SWCS].)
turbed from harvest to planting. Ridge-till involves planting into a seedbed prepared on ridges. Mulch-till does not invert the soil, but rather keeps it rough with the use of a chisel plow, disks, or blades. Strip-till uses minimum tillage by disturbing only the seed row soil. The additional surface residue left with conservation tillage provides a protective soil cover to reduce raindrop energy upon contact with the soil surface, which can also increase infiltration into the soil. A consequence of increased infiltration and reduced soil disturbance is the formation of preferential flow paths in fine-textured soils, which can increase dissolved and particulate nutrient losses, especially P, in leachate to subsurface tile drains and groundwater (Williams et al. 2018). Ad-ditionally, conservation tillage practices may enhance P stratification in surface soil layers (0–20 cm), which could in-crease the risk for nutrient loss in surface runoff and leachate (Baker et al. 2017). If a soil is highly stratified, however, tillage can mix surface and subsoils to decrease the risk of nutrient loss (Sharpley 2003). Unfortunately, conservation tillage has little effect on mitigating nitrate losses to surface waters from agricultural fields (Daryanto, Wang, and Jacinthe 2017; Kanwar, Colvin, and Karlen 1997).
Sediment Detention Basins and Blind Inlets
Sediment detention basins capture ag-
ricultural surface and subsurface drainage water and allow sediment and particulate nutrients to settle out prior to the water entering a stream or ditch. Similarly, blind inlets, which are typically installed in closed depressions or potholes and replace either an open inlet or tile riser (Smith and Livingston 2013), filter out sediments and particulate nutrients in surface runoff prior to water entering the subsurface tile drainage system. The effectiveness of sediment detention basins and blind inlets is impacted by the residence time and the concentration and form of nutrient. As sediments and as-sociated nutrients accumulate in sediment detention basins and blind inlets over time, they may become potential sources of dissolved P.
Constructed WetlandsConstructed wetlands have the po-
tential to remove nutrients from agricul-tural drainage water. Saturated soils in wetlands can facilitate the removal of NO3
- through denitrification, whereas wetlands primarily decrease P loads through retention of sediments (Kalcic et al. 2018). The effectiveness of nutrient load reduction in constructed wetlands is influenced by several factors, includ-ing the timing and magnitude of nutrient loads, residence time within the wetland, nutrient concentrations, and the form of nutrients entering the wetland. Nutrient reduction is often greatest when residence
times are long and hydraulic loading rates are low. The capacity for constructed wetlands to remove P is finite. In many instances—including wetlands immedi-ately following construction, wetlands that are periodically dry and then are reflooded, and permanently saturated wetlands—constructed wetlands may result in increased losses of P due to the complex interaction of chemical process-es (Reddy et al. 1999).
Drainage Water Management and Saturated Riparian Buffers
For fields with subsurface tile drain-age, drainage water management or controlled drainage can be used to
Figure 9. Proper implementation of a cover crop can decrease the opportunity for nutrient runoff and leaching by increasing plant biomass to cover the soil and use the available soil nutrients. (Image from Noland, Wells, and Peterson [2018]; adapted from Heggenstaller et al. [2008].)
COUNCIL FOR AGRICULTURAL SCIENCE AND TECHNOLOGY12
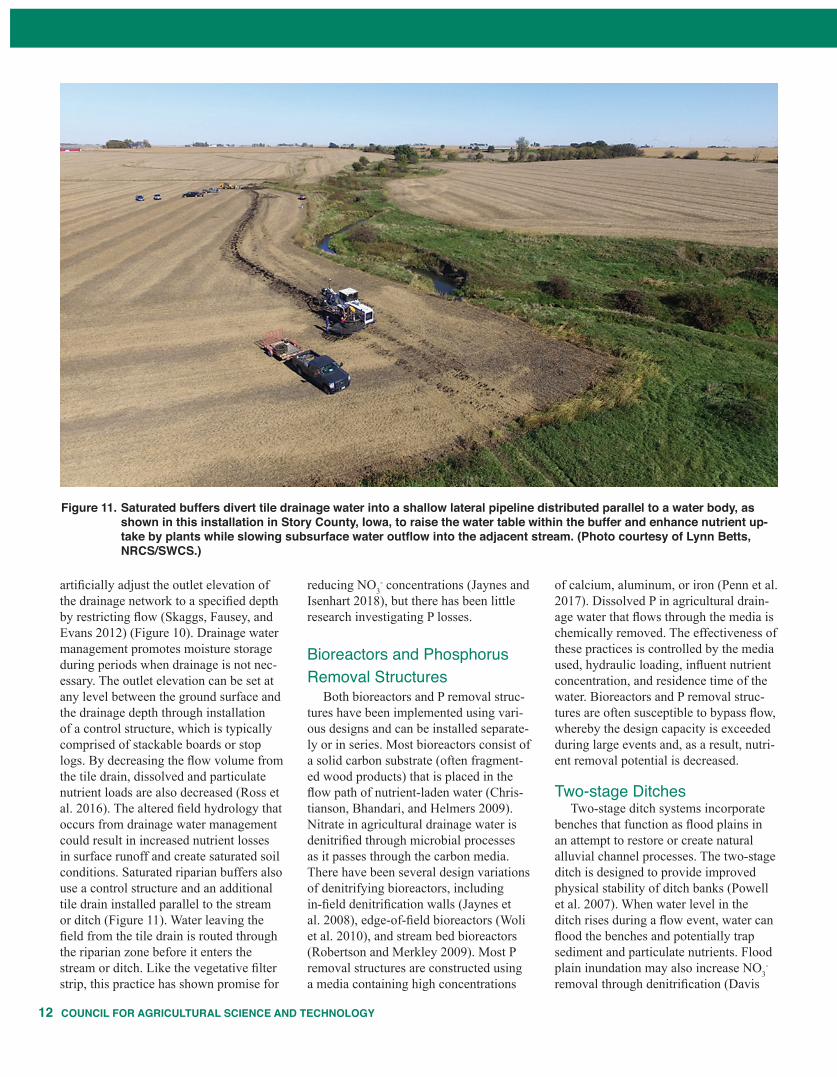
artificially adjust the outlet elevation of the drainage network to a specified depth by restricting flow (Skaggs, Fausey, and Evans 2012) (Figure 10). Drainage water management promotes moisture storage during periods when drainage is not nec-essary. The outlet elevation can be set at any level between the ground surface and the drainage depth through installation of a control structure, which is typically comprised of stackable boards or stop logs. By decreasing the flow volume from the tile drain, dissolved and particulate nutrient loads are also decreased (Ross et al. 2016). The altered field hydrology that occurs from drainage water management could result in increased nutrient losses in surface runoff and create saturated soil conditions. Saturated riparian buffers also use a control structure and an additional tile drain installed parallel to the stream or ditch (Figure 11). Water leaving the field from the tile drain is routed through the riparian zone before it enters the stream or ditch. Like the vegetative filter strip, this practice has shown promise for
reducing NO3- concentrations (Jaynes and
Isenhart 2018), but there has been little research investigating P losses.
Bioreactors and Phosphorus Removal Structures
Both bioreactors and P removal struc-tures have been implemented using vari-ous designs and can be installed separate-ly or in series. Most bioreactors consist of a solid carbon substrate (often fragment-ed wood products) that is placed in the flow path of nutrient-laden water (Chris-tianson, Bhandari, and Helmers 2009). Nitrate in agricultural drainage water is denitrified through microbial processes as it passes through the carbon media. There have been several design variations of denitrifying bioreactors, including in-field denitrification walls (Jaynes et al. 2008), edge-of-field bioreactors (Woli et al. 2010), and stream bed bioreactors (Robertson and Merkley 2009). Most P removal structures are constructed using a media containing high concentrations
of calcium, aluminum, or iron (Penn et al. 2017). Dissolved P in agricultural drain-age water that flows through the media is chemically removed. The effectiveness of these practices is controlled by the media used, hydraulic loading, influent nutrient concentration, and residence time of the water. Bioreactors and P removal struc-tures are often susceptible to bypass flow, whereby the design capacity is exceeded during large events and, as a result, nutri-ent removal potential is decreased.
Two-stage DitchesTwo-stage ditch systems incorporate
benches that function as flood plains in an attempt to restore or create natural alluvial channel processes. The two-stage ditch is designed to provide improved physical stability of ditch banks (Powell et al. 2007). When water level in the ditch rises during a flow event, water can flood the benches and potentially trap sediment and particulate nutrients. Flood plain inundation may also increase NO3
- removal through denitrification (Davis
Figure 11. Saturated buffers divert tile drainage water into a shallow lateral pipeline distributed parallel to a water body, as shown in this installation in Story County, Iowa, to raise the water table within the buffer and enhance nutrient up- take by plants while slowing subsurface water outflow into the adjacent stream. (Photo courtesy of Lynn Betts, NRCS/SWCS.)

13COUNCIL FOR AGRICULTURAL SCIENCE AND TECHNOLOGY
et al. 2015). Nutrient removal benefits of two-stage ditches largely depend on the frequency and length of flood plain inundation, the soil properties of the con-structed flood plain, and the vegetation, which influence the ability of the benches to trap sediment and their biological activity.
hIstorIcAl And current envIronMentAl PolIcy, IncentIves, ProGrAMs, And InItIAtIves
The public invests heavily in conser-vation programs to mitigate the impacts of nutrient loss on water quality from agricultural land, both through Farm Bill programs administered by the USDA and through the Clean Water Act (CWA) and other programs administered by the U.S. Environmental Protection Agency (EPA) and the states. This section reviews these programs and the approaches used.
U.S. Department of Agriculture Programs
The USDA has assisted farmers in improving soil and water conservation since the 1930s, and this has resulted in widespread implementation of conser-vation practices (USDA–NRCS 2016). Early programs focused primarily on soil conservation to maintain or improve soil productivity. Recently, water quality and protecting downstream resources have become a primary objective of USDA programs. United States Department of Agriculture conservation programs use combinations of technical assistance, education, and financial assistance to address conservation needs across U.S. croplands. Financial assistance is primar-ily provided through voluntary financial incentives that pay a portion of the cost of practice implementation, usually 50 to 75% of the costs, often referred to as cost sharing. The idea is that farmers pay part of the cost because they receive part of the benefit, typically conserva-tion of productive soil that can result in long-term benefits to landowners. These methods have resulted in significant progress in controlling soil erosion and loss of those nutrients that are associated
with sediment; however, this strategy is less effective in addressing losses of dissolved nutrients because the on-farm benefits are far less than the cost or effort required to reduce their loss. Although USDA programs are voluntary, conserva-tion compliance, which was enacted as part of the 1985 Farm Act, made eligibil-ity for federal financial assistance subject to compliance with the application of a soil conservation plan on highly erodible land and wetland protection for land that had not yet been converted to cropland. There currently are no similar compliance requirements that apply to decreasing nutrient losses.
Removing vulnerable and low-productivity cropland from agricultural production is one tool for improving soil and water conservation. Land retirement is therefore an important component of USDA conservation programs, starting with the Agricultural Adjustment Act (1936), continuing with the Soil Bank (1956), and since 1985 through the Conservation Reserve Program (CRP) (Claassen, Cattaneo, and Johansson 2008). The CRP is the largest USDA conservation program, funded at $1.8 bil-lion in 2018 (Stubbs 2018). Currently 9.7 million ha (24 million acres) are enrolled in the program, down from peak enroll-ment of approximately 15 million ha (37 million acres) in 2007, when the program acreage cap was set much higher in the 2002 Farm Bill. The CRP addresses water quality along with other enrollment goals, including wildlife habitat, soil productiv-ity, flood damage reduction, and carbon sequestration. In 2010, it was estimated to have reduced the loss of about 275 million kg and 55 million kg of N and P, respectively (USDA–FSA 2011). Johnson and colleagues (2016) conducted a CRP case study in Iowa to quantify the environmental benefits of CRP lands, and results suggested that the investments were justified based upon the value of public and private provided.
Working lands programs, which fund conservation on land that remains in crop or livestock production, have also been part of the USDA conservation programs since 1936 with the Agricul-tural Conservation Program. In 1996, the Environmental Quality Incentives Program (EQIP) succeeded the Agricul-
tural Conservation Program and several smaller programs, aiding eligible farmers to address soil, water, and related natural resource concerns on their lands. In 2018, EQIP was funded at $1.6 billion (Stubbs 2018). The Conservation Steward-ship Program (originally Conservation Security Program) provides payments for achieving certain levels of environmental service provision (Claassen, Cattaneo, and Johansson 2008) and is the third major USDA conservation program, with 2018 funding of $1.3 billion (Stubbs 2018). The effect of these programs is difficult to measure because many farmers have installed practices without assistance, efficiency will vary depending on landscape position and practice main-tenance, and water quality improvements are not an immediate response.
U.S. Environmental Protection Agency and State Programs
The Clean Water Act (passed in 1972 as the Federal Water Pollution Control Act) made point source pollution control a federal responsibility, but it allocated control of nonpoint source (NPS) pollu-tion to the states. With some exceptions, the states have opted for voluntary com-pliance strategies for agricultural NPS control. Most agricultural entities are NPSs, although large concentrated animal feeding operations that discharge directly to surface waters through a pipe or ditch are treated as point sources and must ob-tain permits. Although the requirements vary by state, manure management plans are commonly required for livestock op-erations with a capacity of more than 500 animal units to minimize manure or other wastewater runoff from fields to surface waters or groundwater.
In addition to permits for point sourc-es, the CWA requires states to establish water quality standards that include des-ignated uses and criteria to protect those uses. Narrative nutrient criteria exist in most states, although not the numeric criteria required by the CWA. The CWA also requires the development of total maximum daily loads (TMDLs) for water bodies that do not meet water quality standards due to nutrients (or other pol-lutants). A TMDL for nutrients sets limits on the total discharge from all sources,

COUNCIL FOR AGRICULTURAL SCIENCE AND TECHNOLOGY14
including NPSs. Although the TMDL allows states to rely on voluntary approaches to decrease nonpoint dis-charges, it could potentially lead to implementation of more regulatory ap-proaches. For example, at least 11 states have implemented a law banning P in lawn fertilizers in order to limit P dis-charge to urban surface waters. The EPA has responsibility for developing TMDLs if a state fails to act (USEPA 1993). Section 319 of the CWA established the EPA’s Nonpoint Source Program in 1987, granting states funds to develop and pro-mote NPS management plans and other programs, in which the EPA provides program guidance and technical support. The EPA has encouraged states to work together to address regional water quality problems (e.g., The Mississippi River/Gulf of Mexico Hypoxia Task Force).
Other federal laws may also affect agricultural NPS pollution. The Coastal Zone Management Act Reauthorization Amendments (CZARA) is a federally mandated program that does require spe-cific measures to deal with agricultural NPSs. The CZARA requires each state with an approved coastal zone manage-ment program to submit a program to implement management measures for NPS pollution to restore and protect coastal waters. The Safe Drinking Water Act requires the EPA to set standards for drinking water quality and require-ments for water treatment by public water systems (Morandi 1989). Source water assessment also requires states to deter-mine the susceptibility of source waters to adverse impacts prior to intake (Price and Heberling 2018).
WAter QuAlIty chAllenGes fAcInG u.s. AGrIculture In A chAnGInG lAndscAPe
The combined demands of increased agricultural production with reduced environmental impact require manage-ment strategies that can be sustained over the long term. These strategies must recognize the diversity in agriculture that results from differences in climate, physiography, ecology, economics, and culture (Zhang et al. 2007). This diversity
confounds uniform approaches to achiev-ing sustainable production systems. The previous sections presented current knowledge on nutrient cycling and trans-port together with nutrient management and structural conservation practices that land managers might use to reduce agriculture’s impact on water quality. These sections highlighted the additional progress needed and the complexities associated with managing NPS pollution. This final section presents several current and future challenges related to agricul-ture intensification and water quality.
Current Knowledge of N and P Rates Is Imprecise
Providing crops with an adequate supply of nutrients during critical growth stages is essential for increasing produc-tivity and profitability, but management decisions need to factor in the potential for environmental loss. Although the methods and approaches used to provide nutrient recommendations differ for N and P, current strategies for both N and P are generally imprecise and may result in over- or underapplication of nutrients. Even when farmers and crop advisors follow the best available nutrient recom-mendations, the applied nutrients may not be taken up by the crops that same season, resulting in less than 100% recovery. Crop nutrient needs can vary within and among fields as a function of soil physical, chemical, and biological properties; previous management activi-ties (especially for P); and year-to-year differences in weather (especially for N). In addition, advancements in crop genet-ics and the large variety of crop hybrids further complicate nutrient recommenda-tions, because differences in crop genet-ics may alter plant nutrient requirements and the efficiency of the plant at taking up nutrients from the soil. These compli-cating variables often favor risk-adverse strategies, which may unintentionally result in the overapplication of nutrients to prevent yield loss, especially for high-value crops.
Nutrients applied inefficiently or in excess of crop demand are susceptible to loss; thus, there is a need to develop more precise nutrient recommendations that account for differences in soil, plant,
and weather conditions. Smith and col-leagues (2018) reviewed survey results of row crop farmers in the Maumee River watershed, located in the Lake Erie Basin. They indicated that many farmers use science-based nutrient management recommendations with regard to soil testing as a guide for P fertilizer applica-tions. Phosphorus applications either met or were below fertilizer recommendations in more than 90% of the surveyed fields, yet the anticipated benefits had yet to be realized (Smith et al. 2018). Although it is difficult for nutrient rate recommenda-tions to be perfectly precise because of the imprecision within an agricultural system that complicates the ability to obtain representative soil samples and the complex variations at the time of nutri-ent application, the development of new technology is needed to better inform and guide application rates in conjunction with research aimed at better understand-ing the impacts of nutrient placement and timing.
Legacy Nutrients May Mask Water Quality Impacts of Current Conservation Efforts
Despite widespread adoption of nutri-ent management and structural conserva-tion practices across the United States, measurable reductions in nutrient load at watershed outlets are rarely apparent (Sharpley et al. 2013). Failure to decrease nutrient loads at the watershed scale may not imply that current conservation ef-forts are having no effect because legacy nutrients, which have built up in soils and groundwater over time, may mask or buffer the efforts of current conserva-tion. Lag times between conservation implementation and observed nutrient reductions can range from years to de-cades, depending on the amount of legacy nutrients stored throughout the watershed (Gilmore et al. 2016; Meals, Dressing, and Davenport 2010). The presence of rills, gullies, soil macropores, drainage ditches, and tile lines all serve as poten-tial conduits for mobilizing nutrients, saturating the soil’s sorption capacity, and releasing this stored nutrient as a source (Sharpley et al. 2013). Additionally, it can take several years for most conservation practices to achieve maximum reduction

15COUNCIL FOR AGRICULTURAL SCIENCE AND TECHNOLOGY
potential (Daniels et al. 2018). Currently, it is not possible to differentiate between recently applied nutrients and legacy nutrients, which makes it difficult to as-sess the effect of conservation on water quality at large watershed scales. Land modifications that increase erosion or hydrologic connectivity can rapidly in-crease the transfer of legacy P (Sharpley et al. 2013). These factors may lead to an incorrect conclusion that BMPs are not working. New methods or techniques for separating these sources of nutrient loss are needed to further evaluate the impact of current conservation. Differentiation of sources would also facilitate improved conservation practice design and imple-mentation by providing better informa-tion on how and where nutrients are being transported through the landscape.
Most Implemented Conserva-tion Practices Do Not Address Dissolved Nutrients
Many current conservation prac-tices—including vegetated filter strips,
grassed waterways, cover crops, tillage practices, sediment detention basins, and blind inlets—are designed to primarily address sediment and particulate nutrient loss. Regarding dissolved P loss, research results for these practices are often incon-clusive or suggest that they only result in marginal reductions or, in some cases, increases. Dissolved sources of nutrients represent a substantial proportion of an-nual nutrient loss that cannot be directly managed or treated in the short term with soil conservation practices. Currently available conservation practices that address dissolved nutrient loss typically have little or no economic benefits for producers. One practice that addresses multiple benefits, along with reduction of dissolved nutrients where tile drainage is prevalent and the crop season may have both excessively wet and dry periods, is drainage water recycling (Figure 12). Excess water is captured through the tile drains, stored in a pond or reservoir, and then used to irrigate crops during a water deficit. Additional research is needed to address site-specific design and imple-
mentation requirements of drainage water recycling and other innovative conserva-tion practices to economically address dissolved nutrients.
Few Conservation Practices Provide In-stream Nutrient Removal
The majority of conservation practices is designed for in-field or edge-of-field application, with few practices available to address nutrient loss within streams or ditches. Focusing on in-field and edge-of-field practices will likely result in unmet nutrient load reduction goals at the watershed scale due to the importance of groundwater, streambank erosion, and in-stream nutrient cycling on watershed nutrient loading (Williams, King, and Penn 2018). Implementation of in-stream conservation is further complicated by the fact that most agricultural ditches are managed by drainage boards or counties rather than individuals. There is a need to develop and implement conservation practices that address both dissolved nu-trient loss and in-stream nutrient removal to help mitigate the downstream impacts of agriculture on water quality.
Nutrient Reductions for Both Nutrient Management Practices and Conservation Practices Are Field Specific
The nutrient reduction potential for many nutrient management and struc-tural conservation practices is often site specific. For example, a grassed water-way or buffer strip may result in a greater nutrient loss reduction on one field where runoff is more concentrated, with less reduction effectiveness from a second similar field having less slope and more diffuse runoff. This creates a large chal-lenge for both conservation programs that are providing recommendations on prac-tices and farmers trying to decide which practice will fit within their management system. Throughout the United States, there is an urgency to solve water quality issues, which often leads to a tendency toward applied research that focuses on quantifying practice effectiveness outcomes. Recognizing that some level of nutrient loss is unavoidable from natural
Figure 12. Drainage water recycling is an innovative technology that diverts surface and subsurface drainage water into reservoirs where it is stored for crop reuse during dry months. (Image courtesy of transformingdrainage.org.)
COUNCIL FOR AGRICULTURAL SCIENCE AND TECHNOLOGY16
and anthropogenic sources, however, one question that must be answered is what to consider an acceptable level of nutri-ents in runoff from agricultural fields. A review of watershed analyses where edge-of-field water quality measure-ments were collected indicated that <5% of the applied N and P tends to be lost in runoff (Daniels et al. 2018; Galloway and Nustad 2017; Smith et al. 1983; Tomer et al. 2016), yet this small quantity can still result in environmentally significant impacts. Even natural, undisturbed land-scapes, such as native grasslands, contrib-ute average loads of 2 kg/ha total N and 0.5 kg/ha total P annually to surface water bodies (Harmel et al. 2006, 2008). Due to the complexity of nutrient cycles and transport processes that control how practices function (e.g., the role of soils, climate, hydrology, and management systems), multiple approaches such as certainty programs, field-scale and water-shed models, and edge-of-field monitor-ing must be considered for assessing the impact on downstream water quality (Harmel et al. 2018). Meeting water quality nutrient reduction goals requires both basic and applied research programs to understand the complex processes controlling nutrient loss in agricultural landscapes and develop new, innovative practices.
Conservation Program Success Requires Collaboration and Cost- effective Implementation
Current conservation programs are voluntary and rely on farmers to approach the agency to enroll and choose which resource issues to address. A potential weakness of this approach is that conser-vation improvements tend to be supply driven rather than demand driven (Shortle et al. 2012). That is, farmers propose contracting for conservation practices on a first-come, first-served basis, centered on their farm’s needs and management schedule. Many conservation decisions in this voluntary setting are driven by the bottom line, and the environmental impacts felt downstream, off the farm, are not necessarily considered. This may result in the implementation of practices
in areas that are less environmentally sensitive with minimum impact on down-stream water quality compared to other potential sites within the same or adjacent watershed.
Several conservation program fea-tures, including the targeting of critical source areas or pay-for-performance, could increase the investment in conser-vation measures that address off-farm issues and improve cost-effectiveness. Conservation programs can be more cost effective when specific fields or water-sheds contributing a disproportionate amount of nutrients are targeted for con-servation (Galzki, Birr, and Mulla 2011). These targeted areas and specialized con-servation initiatives, however, should be selected using a collaborative approach that considers local and regional input and data. Effective conservation pro-grams reward local conservationists who build collaborative working relationships with landowners and managers who have the most critical environmental concerns (Nowak 2011). Targeting conservation is difficult when programs follow a uniform and standardized pathway that requires a consistent set of requirements rather than directly engaging the land user in the resource issue (Nowak 2011). Farmers who can provide the most cost-effective control may not enroll in programs or may want to address other issues on their farms that more directly affect their net returns. In addition to federal conserva-tion programs, there are other consider-ations that farmers must include in their management decisions, such as crop insurance, lender agreements, and land-owner expectations, and some of these may be at odds with conservation initia-tive stipulations. Farmers who are ready to implement a practice typically apply when it fits within the complexity of their farm’s management schedule, which is not always consistent with a strictly defined program’s protocol or technical engineering staff availability.
Paying for performance based on the amount of nutrient loss reduction is also more cost effective than basing financial assistance payments on practice costs (Savage and Ribaudo 2016), and it does not require targeting of practices. Under this approach, farmers who can provide the most abatement at the lowest costs
have the greatest economic incentive to act. Practice-based payments tend to limit choice to practices that are cost shared, whereas performance-based poli-cies award innovations that lower costs. Regardless of the approach, the success of any voluntary conservation program relies on the availability of willing participants.
Several state programs also use regulation or involuntary economic incentives to address water quality issues when voluntary approaches fail to make desired progress. This includes perfor-mance taxes that create incentive to adopt conservation practices and peer pressure from farmers to their recalcitrant neigh-bors; development of watershed designa-tions, such as a watershed in distress, that triggers the implementation of regulation (Jacquemin et al. 2018); and monitoring-based “trigger” policies that place more stringent controls on nutrient manage-ment as concentrations in groundwater and surface water increase (Ribaudo and Caswell 1999). Implementing a TMDL on the Chesapeake Bay watershed by the EPA resulted in more resources devoted to the problem and initiated new regulatory and nonregulatory programs (Ribaudo, Savage, and Aillery 2014). Increasing program cost-effectiveness, through multiple approaches that engage industry organizations and companies and consider incentives for downstream ecological enhancement, is needed to more effectively and efficiently decrease nutrient loss from agriculture.
conclusIonsIn conclusion, agriculture today
reflects the outcome of historical shifts in management in which ambitious goals meet with challenges of production po-tential, profitability, cultural norms, and environmental resources (Kleinman et al. 2018). Complexities and difficulties asso-ciated with nutrient cycling and transport processes, management decisions and practice trade-offs, and program effec-tiveness highlight both significant prog-ress and immense challenges to achieving sustainable intensification while meeting water quality goals. To overcome these challenges, it is imperative that agricul-ture balances short-term management

17COUNCIL FOR AGRICULTURAL SCIENCE AND TECHNOLOGY
decisions (e.g., nutrient source, rate, placement, and timing) with long-term planning (e.g., processes controlling nutrient loss, conservation practice imple-mentation) such that crop production and profitability enhance rather than compete with environmental objectives. Achieving water quality goals will require continued research to better understand the com-plex processes controlling crop nutrient requirements and nutrient losses, creation of new conservation practices and tech-nologies to limit losses, and development of sustainable conservation programs that engage regional stakeholders to prioritize water quality objectives and integrate the complex attitudes and constraints associated with landowner conservation adoption.
lIterAture cItedBaker, D. B., L. T. Johnson, R. B. Confesor, and J.
P. Crumrine. 2017. Vertical stratification of soil phosphorus as a concern for dissolved phosphorus runoff in the Lake Erie basin. J Environ Qual 46:1287–1295.
Balafoutis, A., B. Beck, S. Fountas, J. Vangeyte, T. van der Wal, I. Soto, M. Gomez-Barbero, A. Barnes, and V. Eory. 2017. Precision agricul-ture technologies positively contributing to GHG emissions mitigation, farm productivity and economics. Sustainability 9:1–28.
Bennett, H. H. and W. R. Chapline. 1928. Soil Erosion—A National Menace. U.S. Depart-ment of Agriculture Circular No. 33, https://naldc.nal.usda.gov/download/CAT87212611/PDF (5 October 2018)
Bishop, R. A., A. J. Joens, and J. Zohrer. 1998. Iowa’s wetlands, present and future with a focus on prairie potholes. J Iowa Acad Sci 88:11–16.
Bjorneberg, D. L., D. T. Westermann, and J. K. Aase. 2002. Nutrient losses in surface irriga-tion runoff. J Soil Water Conserv 57:524–529.
Bjorneberg, D. L., A. B. Leytem, J. A. Ippolito, and A. C. Koehn. 2015. Phosphorus losses from an irrigated watershed in the northwestern United States: Case study of the Upper Snake Rock watershed. J Environ Qual 44:552–559.
Böhlke, J. K. and J. M. Denver. 1995. Combined use of groundwater dating, chemical, and isotopic analysis to resolve the history and fate of nitrate contamination in two agricultural watersheds, Atlantic Coastal Plain, Maryland. Water Resour Res 31:2319–2339.
Bosch, N. S., M. A. Evans, D. Scavia, and J. D. Allan. 2014. Interacting effects of climate change and agricultural BMPs on nutrient runoff entering Lake Erie. J Great Lakes Res 40:581–589.
Christianson, L. E., A. Bhandari, and M. J. Helmers. 2009. Emerging technology: Denitrification bioreactors for nitrate reduction in agricultural waters. J Soil Water Conserv 64:139A–141A.
Claassen, R., A. Cattaneo, and R. Johansson. 2008. Cost-effective design of agri-environmental payment programs: U.S. experience in theory
and practice. Ecol Econ 65:737–752.Cober, J. R., M. L. Macrae, and L. L. Van Eerd.
2018. Nutrient release from living and termi-nated cover crops under variable freeze-thaw cycles. Agron J 110 (3): 1036–1045.
Committee on Environment and Natural Resources. 2010. Scientific Assessment of Hypoxia in U.S. Coastal Waters. Interagency Working Group on Harmful Algal Blooms, Hypoxia, and Human Health of the Joint Subcommittee on Ocean Science and Technology, Washington, D.C.
Daniels, M. B., A. Sharpley, R. D. Harmel, and K. Anderson. 2018. The utilization of edge-of-field monitoring of agricultural runoff in addressing nonpoint source pollution. J Soil Water Conserv 73 (1): 1–8.
Daryanto, S., L. Wang, and P. A. Jacinthe. 2017. Impacts of no-tillage management on nitrate loss from corn, soybean and wheat cultivation: A meta-analysis. Sci Rep-UK 7:12117.
Davis, R. T., J. L. Tank, U. H. Mahl, S. G. Winikoff, and S. S. Roley. 2015. The influence of two-stage ditches with constructed floodplains on water column nutrients and sediments in agricultural streams. J Am Water Resour As 51:941–955.
Dimitri, C., A. Effland, and N. Conklin. 2005. The 20th Century Transformation of U.S. Agri-culture and Farm Policy. USDA Economic Research Service, Economic Information Bulletin No. 3, https://www.ers.usda.gov/webdocs/publications/44197/13566_eib3_1_.pdf?y=41055 (5 October 2018)
Duncan, E. W., C. J. Dell, P. J. A. Kleinman, and D. B. Beegle. 2017b. Nitrous oxide and ammonia emissions from injected and broadcast-applied dairy slurry. J Environ Qual 46:36–44.
Duncan, E. W., K. W. King, M. R. Williams, G. LaBarge, L. A. Pease, D. R. Smith, and N. R. Fausey. 2017a. Linking soil phosphorus to dis-solved phosphorus losses in the Midwest. Agr Environ Lett 2:170004.
Ervin, C. A. and D. E. Ervin. 1982. Factors affect-ing the use of soil conservation practices: Hypotheses, evidence, and policy implica-tions. Land Econ 58:277–292.
Food and Agriculture Organization of the United Nations (FAO). 2017. The Future of Food and Agriculture—Trends and Challenges. FAO, Rome, Italy.
Gall, H. E., J. Park, C. J. Harman, J. W. Jawitz, and P. S. C. Rao. 2013. Landscape filtering of hydrologic and biogeochemical responses in managed catchments. Landscape Ecol 28:651–664.
Galloway, J. M. and R. A. Nustad. 2017. Runoff and Water-quality Characteristics of Three Discovery Farms in North Dakota, 2008–16. U.S. Geological Survey Scientific Investiga-tions Report 2017-5124. 68 pp., https://doi.org/10.3133/sir20175124 (20 March 2019)
Galzki, J. C., A. S. Birr, and D. J. Mulla. 2011. Identifying critical agricultural areas with three-meter LiDAR elevation data for precision conservation. J Soil Water Conserv 66 (6): 423–430.
Gascho, G. J., R. D. Wauchope, J. G. Davis, C. C. Truman, C. C. Dowler, J. E. Hook, H. R. Sumner, and A. W. Johnson. 1998. Nitrate-nitrogen, soluble, and bioavailable phosphorus runoff from simulated rainfall after fertilizer application. Soil Sci Soc Am J 62:1711–1718.
Gilmore, T. E., D. P. Genereux, D. K. Solomon, K.
M. Farrell, and H. Mitasova. 2016. Quantify-ing an aquifer nitrate budget and future nitrate discharge using field data from streambeds and well nests. Water Resour Res 52:9046–9065, doi:10.1002/2016WR018976.
Graham, J. L., N. M. Dubrovsky, and S. M. Eberts. 2017. Cyanobacterial Harmful Algal Blooms and U.S. Geological Survey Science Capabili-ties. U.S. Geological Survey Open-file Report 2016-1174. 12 p., https://doi.org/10.3133/ofr20161174 (20 March 2019)
Harmel, D., S. Qian, K. Reckhow, and P. Casebolt. 2008. The MANAGE database: Nutrient load and site characteristic updates and runoff concentration data. J Environ Qual 37 (6): 2403–2406.
Harmel, R. D., A. L. Kenimer, S. W. Searcy, and H. A. Torbert. 2004. Runoff water quality impact of variable rate sidedress nitrogen application. Precis Agric 5:247–261.
Harmel, R. D., R. A. Pampell, A. B. Leytem, D. R. Smith, and R. L. Haney. 2018. Assessing edge-of-field nutrient runoff from agricultural lands in the United States: How clean is clean enough? J Soil Water Conserv 73 (1): 9–23.
Harmel, R. D., S. Potter, P. Casebolt, K. Reckhow, C. H. Green, and R. L. Haney. 2006. Com-pilation of measured nutrient load data for agricultural land uses in the United States. J Amer Water Resour As 42:1163–1178.
Heggenstaller, A. H., R. P. Anex, M. Liebman, D. N. Sundberg, and L. R. Gibson. 2008. Productiv-ity and nutrient dynamics in bioenergy double-cropping systems. Agron J 100:1740–1748.
Intergovernmental Panel on Climate Change (IPCC). 2014. Climate Change 2014: Synthe-sis Report. Contribution of Working Groups I, II, and III to the Fifth Assessment Report of the Intergovernmental Panel on Climate Change. Core writing team, R. K. Pachauri, and L. A. Meyer (eds.). IPCC, Geneva, Swit-zerland. 151 pp.
International Plant Nutrition Institute (IPNI). 2012. 4R Plant Nutrition Manual: A Manual for Improving the Management of Plant Nutrition, Metric Version. T. W. Bruulsema, P. E. Fixen, and G. D. Sulewski (eds.). IPNI, Norcross, Georgia.
International Plant Nutrition Institute (IPNI). 2015. United States Corn: Fertilizer Use Efficiency Doubles between 1980 and 2014, http://phos-phorus.ipni.net/article/PPP-3125 (4 February 2019)
International Plant Nutrition Institute (IPNI). 2018. Nutrient Use Geographic Information System (NuGIS), http://nugis.ipni.net (9 August 2018)
Jacquemin, S. J., L. T. Johnson, T. A. Dirksen, and G. McGlinch. 2018. Changes in water quality of Grand Lake St. Marys watershed following implementation of a distressed watershed rules package. J Environ Qual 47:113–120, doi:10.2134/jeq2017.08.0338.
Jarvis, N. J. 2007. A review of non-equilibrium water flow and solute transport in soil mac-ropores: Principles, controlling factors and consequences for water quality. Eur J Soil Sci 58:523–546.
Jaynes, D. B. and T. M. Isenhart. 2018. Performance of saturated riparian buffers in Iowa, USA. J Environ Qual, doi:10.2134/jeq2018.03.0115.
Jaynes, D. B. and D. E. James. 2007. The extent of farm drainage in the United States. Pp. 50–60. In Final Program and Abstracts, Soil and Water Conservation Society International

COUNCIL FOR AGRICULTURAL SCIENCE AND TECHNOLOGY18
Conference, Tampa, Florida, 21–25 July 2007, http://www.ars.usda.gov/SP2UserFiles/Place/36251500/TheExtentofFarmDrainagein-theUnitedStates.pdf (4 February 2019)
Jaynes, D. B., T. C. Kaspar, T. B. Mooreman, and T. B. Parkin. 2008. In situ bioreactors and deep drain-pipe installation to reduce nitrate losses in artificially drained fields. J Environ Qual 37:429–436.
Johnson, K. A., B. J. Dalzell, M. Donahue, J. Gourevitch, D. L. Johnson, G. S. Karlovits, B. Keeler, and J. T. Smith. 2016. Conservation Reserve Program (CRP) lands provide eco-system service benefits that exceed land rental payment costs. Ecosyst Serv 18:175–185.
Kalcic, M., W. Crumpton, X. Liu, J. D’Ambrosio, A. Ward, and J. Witter. 2018. Assessment of beyond-the-field nutrient management practices for agricultural crop systems with subsurface drainage. J Soil Water Conserv 73:62–74.
Kane, D. D., J. D. Conroy, R. P. Richards, D. B. Baker, and D. A. Culver. 2014. Re-eutrophi-cation of Lake Erie: Correlations between tributary nutrient loads and phytoplankton biomass. J Great Lakes Res 40:496–501.
Kanwar, R. S., T. S. Colvin, and D. L. Karlen. 1997. Ridge, moldboard, chisel, and no-till effects on tile water quality beneath two cropping systems. J Prod Agric 10:227–234.
Kaspar, T. C., D. B. Jaynes, T. B. Parkin, and T. B. Moorman. 2007. Rye cover crop and gamagrass strip effects on NO3
- concentra-tion and load in tile drainage. J Environ Qual 36:1503–1511.
King, K. W., M. R. Williams, and N. R. Fausey. 2015. Contributions of systematic tile drainage to watershed phosphorus transport. J Environ Qual 44:486–494.
King, K. W., M. R. Williams, L. T. Johnson, D. R. Smith, G. A. LaBarge, and N. R. Fausey. 2017. Phosphorus availability in Western Lake Erie Basin drainage waters: Legacy evidence across spatial scales. J Environ Qual 46:466–469.
King, K. W., M. R. Williams, G. A. LaBarge, D. R. Smith, J. M. Reutter, E. W. Duncan, and L. A. Pease. 2018. Addressing phosphorus loss in artificially drained landscapes with 4R nutrient management practices. J Soil Water Conserv 73:35–47.
King, K. W., M. R. Williams, M. L. Macrae, N. R. Fausey, J. Frankenberger, D. R. Smith, P. J. A. Kleinman, and L. C. Brown. 2015. Phospho-rus transport in agricultural subsurface drain-age: A review. J Environ Qual 44:467–485.
Kladivko, E. J., J. R. Frankenberger, D. B. Jaynes, D. W. Meek, B. J. Jenkinson, and N. R. Fausey. 2004. Nitrate leaching to subsur-face drains as affected by drain spacing and changes in crop production system. J Environ Qual 33:1803–1813.
Kleinman, P. J. A. and A. N. Sharpley. 2003. Effect of broadcast manure on runoff phosphorus concentrations over successive rainfall events. J Environ Qual 32:1072–1081.
Kleinman, P. J. A., A. N. Sharpley, R. W. Mc-Dowell, D. N. Flaten, A. R. Buda, L. Tao, L. Bergstrom, and Q. Zhu. 2011. Managing agricultural phosphorus for water quality protection: Principles for progress. Plant Soil 349:169–182.
Kleinman, P. J. A., S. Spiegal, J. R. Rigby, S. C. Goslee, J. M. Baker, B. T. Bestelmeyer, R.
K. Boughton, R. B. Bryant, M. A. Cavigelli, J. D. Derner, E. W. Duncan, D. C. Goodrich, D. R. Huggins, K. W. King, M. A. Liebig, M. A. Locke, S. B. Mirsky, G. E. Moglen, T. B. Moorman, F. B. Pierson, G. P. Robertson, E. J. Sadler, J. S. Shortle, J. L. Steiner, T. C. Strickland, H. M. Swain, T. Tsegaye, M. R. Williams, and C. L. Walthall. 2018. Advanc-ing the sustainability of U.S. agriculture through long-term research. J Environ Qual, doi:10.2134/jeq2018.05.0171.
Kleinman, P., D. Sullivan, A. Wolf, R. Brandt, H. Elliott, J. Kovar, A. Leytem, R. Maguire, P. Moore, L. Saporitio, A. Sharpley, A. Shober, T. Sims, J. Toth, G. Toor, H. Zhang, and T. Zhang. 2007. Selection of a water extractable phosphorus test for manures and biosolids as an indicator of runoff loss potential. J Environ Qual 36:1357–1367.
Knowler, D. and B. Bradshaw. 2007. Farmers’ adoption of conservation agriculture: A review and synthesis of recent research. Food Policy 32:25–48.
Lal, R. 2004. Soil carbon sequestration impacts on global climate change and food security. Sci-ence 304:1623–1627.
Lal, R. 2009. Challenges and opportunities in soil organic matter research. Eur J Soil Sci 60:158–169.
Leopold, A. 1949. A Sand County Almanac. Oxford University Press, Oxford, United Kingdom.
Lindsey, B. D., S. Phillips, C. A. Donnelly, G. K. Speiran, L. N. Plummer, J. K. Böhlke, M. J. Focazio, W. C. Burton, and E. Busenberg. 2003. Residence Times and Nitrate Transport in Groundwater Discharging to Streams in the Chesapeake Bay Watershed. U.S. Geologi-cal Survey, Water-Resources Investigations Report 03-4035. In cooperation with the Chesapeake Bay Program, New Cumberland, Pennsylvania.
Little, J. L., D. R. Bennett, and J. J. Miller. 2005. Nutrient and sediment losses under simulated rainfall following manure incorporation and different methods. J Environ Qual 34:1883–1895.
Loecke, T. E., A. J. Burgin, D. A. Riveros-Iregui, A. S. Ward, S. A. Thomas, C. A. Davis, and M. A. St. Clair. 2017. Weather whiplash in agri-cultural regions drives deterioration of water quality. Biogeochemistry 133 (1): 7–15.
Lorimor, J., W. Powers, and A. Sutton. 2004. Manure Characteristics. 2nd ed. Section 1, Manure Management Systems Series. Midwest Plan Service, Iowa State University, Ames, Iowa.
Lory, J. A., R. Massey, and B. C. Joern. 2008. Using manure as a fertilizer for crop production. Pp. 105–116. In Upper Mississippi River Sub-basin Hypoxia Nutrient Committee (eds.). Final Report: Gulf Hypoxia and Local Water Quality Concerns Workshop. American Soci-ety of Agricultural and Biological Engineers, St. Joseph, Michigan.
Marshall, E. and T. Randhir. 2008. Effect of climate change on watershed system: A regional analysis. Climate Change 89:263–280.
Masaki, Y., N. Hanasaki, K. Takahashi, and Y. Hijioka. 2014. Global-scale analysis on future changes in flow regimes using Gini and Lorenz asymmetry coefficients. Water Resour Res 50:4054–4078.
Meals, D. W., S. A. Dressing, and T. E. Davenport. 2010. Lag time in water quality response to
best management practices: A review. J Envi-ron Qual 39:85–96.
Minasny, B. and A. B. McBratney. 2017. Limited effect of organic matter on soil available water capacity. Eur J Soil Sci 69 (1): 39–47.
Morandi, L. B. 1989. State Groundwater Protec-tion Policies: A Legislator’s Guide. National Conference of State Legislatures, Washington, D.C.
Mulla, D. J. and J. S. Strock. 2008. Nitrogen transport processes in soil. Pp. 361–400. In J. S. Schepers and W. R. Raun (eds.). Agronomy Monograph Series No. 49: Nitrogen in Agricultural Systems. ASA-CSSA-SSSA, Madison, Wisconsin.
Noland, R., M. S. Wells, and H. Peterson. 2018. Enhancing cover crop nitrogen uptake with improved establishment. Better Crops 102 (2): 31–34.
Nowak, P. 2011. The conservation journey. J Soil Water Conserv 66 (3): 61A–64A.
Ockenden, M. C., M. J. Hollaway, K. J. Beven, A. L. Collins, R. Evans, P. D. Falloon, K. J. Forber, K. M. Hiscock, R. Kahana, C. J. A. Macleod, W. Tych, M. L. Villamizar, C. Wear-ing, P. J. A. Withers, J. G. Zhou, P. A. Barker, S. Burke, J. E. Freer, P. J. Johnes, M. A. Snell, B. W. J. Surridge, and P. M. Haygarth. 2017. Major agricultural changes required to miti-gate phosphorus losses under climate change. Nat Commun 8:161.
Pease, L. A., K. W. King, M. R. Williams, G. A. La-Barge, E. W. Duncan, and N. R. Fausey. 2018. Phosphorus export from artificially drained fields across the Eastern Corn Belt. J Great Lakes Res 44:43–53.
Penn, C., I. Chagas, A. Klimeski, and G. Lyng-sie. 2017. A review of phosphorus removal structures: How to assess and compare their performance. Water, doi:10.3390/w9080583.
Pionke, H. B. and J. B. Urban. 1985. Effect of agri-cultural land use on ground-water quality in a small Pennsylvania watershed. Groundwater 23:68–80.
Pote, D. H., T. C. Daniel, P. A. Moore Jr., D. J. Nichols, A. N. Sharpley, and D. R. Edwards. 1996. Relating extractable soil phosphorus to phosphorus losses in runoff. Soil Sci Soc Am J 60:855–859.
Powell, G. E., A. D. Ward, D. E. Mecklenburg, J. Draper, and W. Word. 2007. Two-stage chan-nel systems: Part 2, case studies. J Soil Water Conserv 62:286–296.
Price, J. I. and M. T. Heberling. 2018. The effects of source water quality on drinking water treat-ment costs: A review and synthesis of empiri-cal literature. Ecol Econ 151:195–209.
Puckett, L. J., A. J. Tesoriero, and N. M. Dubrovsky. 2011. Nitrogen contamination of surficial aquifers—A growing legacy. Environ Sci Technol 45:839–844.
Reddy, K. R., R. H. Kadlec, E. Flag, and P. M. Gale. 1999. Phosphorus retention in streams and wetlands: A review. Crit Rev Env Sci Tec 29:83–146.
Ribaudo, M. and M. Caswell. 1999. Environmental regulation in agriculture and the adoption of environmental technology. Ch. 2. In F. Casey, A. Schmitz, S. Swinton, and D. Zilberman (eds.). Flexible Incentives for the Adoption of Environmental Technologies in Agriculture. Kluwer Academic Publishers, Norwell, Mas-sachusetts.
Ribaudo, M., J. Savage, and M. Aillery. 2014. An

19COUNCIL FOR AGRICULTURAL SCIENCE AND TECHNOLOGY
Economic Assessment of Policy Options to Reduce Agricultural Pollutants in the Chesa-peake Bay. ERR-166, U.S. Department of Agriculture–Economic Research Service.
Robertson, W. D. and L. C. Merkley. 2009. In-stream bioreactor for agricultural nitrate treat-ment. J Environ Qual 38:230–237.
Ross, J. A., M. E. Herbert, S. P. Sowa, J. R. Fran-kenberger, K. W. King, S. F. Christopher, J. L. Tank, J. G. Arnold, M. J. White, and H. Yen. 2016. A synthesis and comparative evalua-tion of factors influencing the effectiveness of drainage water management. Agr Water Manage 178:366–376.
Sattari, S. Z., A. F. Bouwman, K. E. Giller, and M. K. van Ittersum. 2012. Residual soil phosphorus as the missing piece in the global phosphorus crisis puzzle. P Natl Acad Sci 109:6348–6363.
Savage, J. and M. Ribaudo. 2016. Improving the efficiency of voluntary water quality conserva-tion programs. Land Econ 92:148–166.
Sawyer, J., E. Nafziger, G. Randall, L. Bundy, G. Rehm, and B. Joern. 2006. Concepts and Ra-tionale for Regional Nitrogen Rate Guidelines for Corn. PM 2015. Iowa State University, University Extension, Ames, Iowa. 28 pp.
Sharpley, A. N. 1980. The enrichment of soil phos-phorus in runoff sediments. J Environ Qual 9:521–526.
Sharpley, A. N. 2003. Soil mixing to decrease stratification of phosphorus in manured soils. J Environ Qual 32:1375–1384.
Sharpley, A. N., H. P. Jarvie, A. Buda, L. May, and P. J. A. Kleinman. 2013. Phosphorus legacy: Overcoming the effects of past management practices to mitigate future water quality im-pairment. J Environ Qual 42:1308–1326.
Shipitalo, M. J., J. V. Bonta, E. A. Dayton, and L. B. Owens. 2010. Impact of grassed waterways and compost filter socks on the quality of sur-face runoff from corn fields. J Environ Qual 39:1009–1018.
Shortle, J., M. Ribaudo, R. Horan, and D. Bland-ford. 2012. Reforming agricultural nonpoint pollution policy in an increasingly budget-constrained environment. Environ Sci Technol 46:1316–1325.
Skaggs, R. W., N. R. Fausey, and R. O. Evans. 2012. Drainage water management. J Soil Water Conserv 67:167A–172A.
Smith, D. R. and S. J. Livingston. 2013. Managing farmed closed depressional areas using blind inlets to minimize phosphorus and nitrogen losses. Soil Use Manage 29:94–102.
Smith, D. R., R. D. Harmel, M. Williams, R. Haney, and K. W. King. 2016. Managing acute phosphorus loss with fertilizer source and placement: Proof of concept. Agr Environ Lett 1:150015.
Smith, D. R., R. S. Wilson, K. W. King, M. Zwonitzer, J. M. McGrath, R. D. Harmel, R. L. Haney, and L. T. Johnson. 2018. Lake Erie, phosphorus, and microcystin: Is it re-ally the farmer’s fault? J Soil Water Conserv 73 (1): 48–57, doi:10.2489/jswc.73.1.48.
Smith, S. J., R. G. Menzel, E. D. Rhoades, J. R. Williams, and H. V. Eck. 1983. Nutrient and sediment discharge from southern plain grass-lands. J Range Manage 36 (4): 435–439.
Smith, V. H. 2003. Eutrophication of freshwater and marine ecosystem: A global problem. Environ Sci Pollut R 10:126–139.
Sprague, L. A., R. M. Hirsch, and B. T. Aulenbach.
2011. Nitrate in the Mississippi River and its tributaries, 1980 to 2008: Are we making progress? Environ Sci Technol 45:7209–7216.
Sprengel, C. 1827. Ueber pflanzenhumus, hu-mussäure und humussaure salze (About plant humus, humic acids and salts of humic acids). Arch Pharm (Weinheim) 21 (3): 261–263, doi:10.1002/ardp.18270210315.
Srinivasan, M. S., R. B. Bryant, M. P. Callahan, and J. L. Weld. 2006. Manure management and nutrient loss under winter conditions: A litera-ture review. J Soil Water Conserv 61:200–208.
Stewart, W. M., D. W. Dibb, A. E. Johnston, and T. J. Smyth. 2005. The contribution of com-mercial fertilizer nutrients to food production. Agron J 97 (1): 1–6.
Stone, M. C., R. H. Hotchkiss, and L. O. Mearns. 2003. Water yield responses to high and low spatial resolution climate change scenarios in the Missouri River Basin. Geophys Res Lett 30:1186.
Strock, J. S., P. M. Porter, and M. P. Russell. 2004. Cover cropping to reduce nitrate loss through subsurface drainage in the northern U.S. corn belt. J Environ Qual 33:1010–1016.
Strock, J. S., P. J. A. Kleinman, K. W. King, and J. A. Delgado. 2010. Drainage water manage-ment for water quality protection. J Soil Water Conserv 65:131A–136A.
Struffert, A. M., J. C. Rubin, F. G. Fernández, and J. A. Lamb. 2016. Nitrogen management for corn and groundwater quality in upper Midwest irrigated sands. J Environ Qual 45:1557–1564.
Stubbs, M. 2018. Agricultural Conservation: A Guide to Programs. Congressional Research Service Report, https://fas.org/sgp/crs/misc/R40763.pdf (6 February 2019)
Tebrügge, F. and R. A. Düring. 1999. Reducing tillage intensity: A review of results from a long-term study in Germany. Soil Till Res 53:15–28.
Tomer, M. D., T. B. Moorman, J. L. Kovar, K. J. Cole, and D. J. Nichols. 2016. Eleven years of runoff and phosphorus losses from two fields with and without manure application, Iowa, USA. Agr Water Manage 168:104–111.
U.S. Department of Agriculture–Farm Service Agency (USDA–FSA). 2011. The Environ-mental Benefits of the Conservation Reserve Program, United States—2010, http://www.fsa.usda.Gov/Internet/FSA_File/united_states.pdf (6 February 2019)
U.S. Department of Agriculture–National Agri-cultural Statistics Service (USDA–NASS). 2014. 2013 Farm and Ranch Irrigation Survey. USDA–NASS, Washington, D.C., https://www.nass.usda.gov/Publications/AgCensus/2012/Online_Resources/Farm_and_Ranch_Irrigation_Survey/ (20 November 2018)
U.S. Department of Agriculture–National Agricul-tural Statistics Service (USDA–NASS). 2018. Crop Production Historical Track Records. ISSN: 2157-8990. USDA–NASS, Washing-ton, D.C., http://usda.mannlib.cornell.edu/usda/current/htrcp/htrcp-04-12-2018.pdf (20 November 2018).
U.S. Department of Agriculture–Natural Resources Conservation Service (USDA–NRCS). 2016. Effects of Conservation Practice Adoption on Cultivated Cropland Acres in the Western Lake Erie Basin, 2003–06 and 2012. 120 pp, https://www.nrcs.usda.gov/Internet/FSE_
DOCUMENTS/Nrcseprd889806.pdf (9 August 2018).
U.S. Environmental Protection Agency (USEPA). 1993. Guide to Federal Water Quality Pro-grams and Information. EPA-230-B-93-001. USEPA Office of Policy, Planning, and Evalu-ation, Washington, D.C.
Van Meter, K. J., N. B. Basu, J. J. Veenstra, and C. L. Burras. 2016. The nitrogen legacy: Emerging evidence of nitrogen accumulation in anthropogenic landscapes. Environ Res Lett 11:035014.
Vidon, P. G., M. K. Welsh, and Y. T. Hassanzadeh. 2018. Twenty years of riparian zone research (1997–2017): Where to next? J Environ Qual, doi:10.2134/jeq2018.01.0009.
Vitousek, P. M., R. Naylor, T. Crews, M. B. David, L. E. Drinkwater, and E. Holland. 2009. Nutri-ent imbalances in agricultural development. Science 324:1519–1520.
Wang, L., D. C. Flanagan, Z. Wang, and K. A. Cherkauer. 2018. Climate change impacts on nutrient losses of two watersheds in the Great Lakes region. Water 10 (4): 442.
Wang, S. L., P. Heisey, D. Schimmelpfennig, and E. Ball. 2015. Agricultural Productivity Growth in the United States: Measurement, Trends, and Drivers. ERR-189. U.S. Department of Agriculture–Economic Research Service, Washington, D.C.
Williams, M. R., K. W. King, and N. R. Fausey. 2015. Contribution of tile drains to basin discharge and nitrogen export in a headwater agricultural watershed. Agr Water Manage 158:42–50.
Williams, M. R., K. W. King, and C. J. Penn. 2018. Integrating temporal inequality into conservation planning to improve practice design and efficacy. J Am Water Resour As, doi:10.1111/1752-1688.12662.
Williams, M. R., G. W. Feyereisen, D. B. Beegle, R. D. Shannon, G. J. Folmar, and R. B. Bryant. 2011. Manure application under winter condi-tions: Nutrient runoff and leaching losses. T ASABE 54:891–899.
Williams, M. R., K. W. King, D. B. Baker, L. T. Johnson, D. R. Smith, and N. R. Fausey. 2016. Hydrologic and biogeochemical controls on phosphorus export from Western Lake Erie tributaries. J Great Lakes Res 42:1403–1411.
Williams, M. R., K. W. King, E. W. Duncan, L. A. Pease, and C. J. Penn. 2018. Fertilizer placement and tillage effects on phosphorus concentration in leachate from fine-textured soils. Soil Till Res 178:130–138.
Williams, M. R., K. W. King, W. Ford, A. R. Buda, and C. D. Kennedy. 2016. Effect of tillage on macropore flow and phosphorus transport to tile drains. Water Resour Res 52:2868–2882.
Winsberg, M. D. 1982. Agricultural specialization in the United States since World War II. Agr Hist 56:692–701.
Woli, K. P., M. B. David, R. A. Cooke, G. F. McIsaac, and C. A. Mitchell. 2010. Nitrogen balance in and export from agricultural fields associated with controlled drainage sys-tems and denitrifying bioreactors. Ecol Eng 36:1558–1566.
Zhang, W., T. H. Ricketts, C. Kreman, K. Carney, and S. M. Swinton. 2007. Ecosystem services and dis-services to agriculture. Ecol Econ 64:253–260.

COUNCIL FOR AGRICULTURAL SCIENCE AND TECHNOLOGY20
4420 West Lincoln WayAmes, Iowa 50014-3447, USA
(515) 292-2125E-mail: [email protected]
Web: www.cast-science.org
CAST Member Societies, Companies, and Nonprofit OrganizationsAGRICULTURAL AND APPLIED ECONOMICS ASSOCIATION ■ AMERICAN ASSOCIATION OF AVIAN PATHOLOGISTS ■ AMERICAN ASSOCIATION OF BOVINE PRACTITIONERS ■
AMERICAN BAR ASSOCIATION, SECTION OF ENVIRONMENT, ENERGY, & RESOURCES ■ AMERICAN DAIRY SCIENCE ASSOCIATION ■ AMERICAN FARM BUREAU FEDERATION ■ AMERICAN MEAT SCIENCE ASSOCIATION ■ AMERICAN METEOROLOGICAL SOCIETY, COMMITTEE ON AGRICULTURAL AND FOREST METEOROLOGY ■ AMERICAN SEED TRADE ASSOCIATION ■ AMERICAN SOCIETY FOR NUTRITION NUTRITIONAL SCIENCES COUNCIL ■ AMERICAN SOCIETY OF AGRICULTURAL AND BIOLOGICAL ENGINEERS ■ AMERICAN SOCIETY OF AGRONOMY ■ AMERICAN SOCIETY OF ANIMAL SCIENCE ■ AMERICAN SOCIETY OF PLANT BIOLOGISTS ■ AMERICAN VETERINARY MEDICAL ASSOCIATION ■ AQUATIC PLANT MANAGEMENT SOCIETY ■ BASF CORPORATION ■ BAYER ■ CAL POLY STATE UNIVERSITY ■ CORTEVA AGRISCIENCE, AGRICULTURE DIVISION OF DOWDUPONT ■ CROP SCIENCE SOCIETY OF AMERICA ■ CROPLIFE AMERICA ■ ENTOMOLOGICAL SOCIETY OF AMERICA ■ INNOVATION CENTER FOR U.S. DAIRY ■
NATIONAL CORN GROWERS ASSOCIATION/IOWA CORN PROMOTION BOARD ■ NATIONAL MILK PRODUCERS FEDERATION ■ NATIONAL PORK BOARD ■ NORTH CAROLINA BIOTECHNOLOGY CENTER ■ NORTH CENTRAL WEED SCIENCE SOCIETY ■ NORTHEASTERN WEED SCIENCE SOCIETY ■ POULTRY SCIENCE ASSOCIATION ■ RURAL SOCIOLOGICALSOCIETY ■ SOCIETY FOR IN VITRO BIOLOGY ■ SOIL SCIENCE SOCIETY OF AMERICA ■ SYNGENTA CROP PROTECTION ■ THE FERTILIZER INSTITUTE ■ TUSKEGEE UNIVERSITY ■ TYSON FOODS ■ UNITED SOYBEAN BOARD ■ UNIVERSITY OF NEVADA–RENO ■ WEED SCIENCE SOCIETY OF AMERICA ■ WESTERN SOCIETY OF WEED SCIENCE
Citation: Council for Agricultural Science and Technology (CAST). 2019. Reducing the Impacts of Agricultural Nutrients on Water Quality across a Changing Landscape. Issue Paper 64. CAST, Ames, Iowa.
The mission of the Council for Agricultural Science and Technology (CAST): CAST, through its network of experts, assembles, interprets, and communicates credible, balanced, science-based information to policymakers, the media, the private sector, and the public. The vision of CAST is a world where decision making related to agriculture and natural resources is based on credible information developed through reason, science, and consensus build-ing. CAST is a nonprofit organization composed of scientific societies and many individual, student, company, nonprofit, and associate society members. CAST's Board is composed of representatives of the scientific societies, commercial companies, nonprofit or trade organizations, and a Board of Directors. CAST was established in 1972 as a result of a meeting sponsored in 1970 by the National Academy of Sciences, National Research Council. ISSN 1070-0021
Additional copies of this Issue Paper are available from CAST, Carol Gostele, Managing Scientific Editor, http://www.cast-science.org.