issued september 2012 - usda...usda, nass arizona field office steven manheimer director 230 n. 1st...
TRANSCRIPT

2011 Arizona Agricultural Statistics Bulletin
Issued September 2012

Arizona Counties and Agricultural Statistics Districts
Cover photos courtesy of Arizona Cattle Grower’s Association, Sunkist Inc., and The History Place.
Mohave Coconino Navajo Apache
Yavapai
Gila
Greenlee
Cochise
Graham
Pima
Santa
Cruz
Yuma
La Paz
Maricopa
Pinal
80
10

Arizona Agricultural Statistics
230 N. 1st Avenue, Suite 303
Phoenix, Arizona 85003-1706
Telephone: (602) 280-8850 — Facsimile: (602) 280-8897
Web Page: http://www.nass.usda.gov/az/
E-Mail: [email protected]
Other Source for Information:
Arizona Department of Agriculture - www.azda.gov
University of Arizona - www.ag.arizona.edu
Office Staff:
Steven Manheimer, Director
Dave DeWalt, Deputy Director
Maria Bautista
Jonie Clark
Sharon Cochrane
Sean De Roon
Clare Jervis
Sharon Ricart
Chris Singh
Dianne Matta
NASDA Staff:
FIELD ENUMERATORS
Western
Melissa Huff, Supervisor
Scott McNaughton
Marilyn Evans
South Central and Eastern
Richard Bishop, Supervisor
John Cook
Central and North Eastern
Davalee Siders, Supervisor
Richard Franz
Norman Rockwell
Jannice Finney
Kathy Smith
Gayle Drager
Native American
Iva Honyestewa
Gloria Todachinnie
Marissa Jones
Gloria Hardy
Cassandra Bitsuie
Marlene Tacheene
TELEPHONE ENUMERATORS
Sharon Sheehan, Supervisor
Harvey Cohen
Merilou Hudson
Cooperative function of:
UNITED STATES DEPARTMENT
OF AGRICULTURE
National Agricultural Statistics
Service
Dr. Cynthia Clark, Administrator
Kevin Barnes, Director
of Western Field Operations
THE UNIVERSITY OF ARIZONA
College of Agriculture and Life
Sciences
Dr. Shane Burgess, Dean
Gary D. Thompson, Head
Department of Agricultural and
Resource Economics
ARIZONA DEPARTMENT OF
AGRICULTURE
Don Butler, Director

USDA, NASS
Arizona Field Office
Steven Manheimer
Director
230 N. 1st Avenue Suite 303
Phoenix, AZ 85003-1706
(602) 280-8850 [email protected]
Gary D. Thompson
Head, Dept. of Agricultural and
Resource Economics Econ 319B
University of Arizona
Tucson, AZ 85721 (520) 621-6242
Donald Butler
Director, Arizona
Department of Agriculture
1688 W Adams St. Phoenix AZ 85007
(602)542-0998
2011 Agricultural Statistics Bulletin
This year’s publication of Arizona Agricultural Statistics pays tribute to
several important milestones in agriculture. First, we honor our State’s
100-year anniversary with inclusion of new tables highlighting
agriculture’s growth and importance. The graphs and tables included
show some dramatic changes in the levels of agricultural production over
the last 100 years. USDA also is celebrating its 150-year anniversary and
a number of special events have been held throughout the U.S. Follow
@USDA on Twitter #USDA150 or go to www.usda.gov to learn more
about what we’re doing to commemorate USDA’s 150 years of service.
Additionally, 2012 is the year of the latest Census of Agriculture. USDA-
NASS will be mailing nearly 3 million census report forms to potential
farm and ranch operators at year’s end. Look for your census form in the
mail and don’t forget to mail it back. The census is a valuable way for
producers and rural America to show their strength – in numbers.
For the current year, farmers and ranchers generally saw growth in the
cash receipts for most commodities contributing to an increase in net farm
income. Important segments of Arizona agriculture including cotton, hay,
lettuce, beef production and milk production all saw an increase in cash
receipts compared to a year earlier.
Crop and livestock producers operate in a rapidly changing environment
and need a source for accurate and relevant statistics to make important
decisions. We hope all producers and others interested in agriculture will
use this publication, and the other reports released by USDA-NASS to
make well-informed decisions about their production and marketing. We
would also like to encourage you to take a look at our website. There is a
wealth of information available to you.
Everyone at the University of Arizona College of Agriculture and Life
Sciences and the Arizona Department of Agriculture has worked hard to
try and support Arizona farmers and ranchers as they dealt with the many
challenges that crop and livestock production present.
Our thanks also go to the thousands of Arizona crop and livestock
producers, agribusiness firms, and others who have voluntarily provided
information that makes this publication possible. If we can assist you in
any way, please contact us anytime.
Sincerely,
Steven Manheimer
Director

Table of Contents
Page
Cash Receipts Cash Receipts: All Commodities .................................................................. 1
Cash Receipts: All Commodities by County ................................................ 2
Farm Income Indicators ................................................................................ 3
Government Payments.................................................................................. 4
Historic Data and Charts of Major Commodities .................................... 5-33 Farm Numbers and Land in Farms ............................................................. 34
Farm Labor ................................................................................................. 35
Per Capita Consumption and Cash Rents ................................................... 36
Livestock Record Highs and Lows ............................................................................. 37
Summary .................................................................................................... 38
Cattle Review ....................................................................................................... 39
Cattle and Calves ....................................................................................... 40 Cattle on Feed and County Estimates ........................................................ 41
Grazing Fees............................................................................................... 42
Cattle Prices ............................................................................................... 43 Cattle Price Reactions................................................................................. 44
Dairy Review ....................................................................................................... 45
Milk Cows and Milk Production ...........................................................45-46
Dairy Products ........................................................................................... 46
Hogs Review ....................................................................................................... 47
Hogs and Pigs ........................................................................................47-48
Sheep Review ....................................................................................................... 49
Sheep, Lambs and Wool ........................................................................49-50
Goats Review, All Goats and Mohair ................................................................... 51
Meat Production Livestock Slaughter .................................................................................... 52 Commercial Slaughter ...........................................................................52-54
Honey Review, Colonies and Production ............................................................... 55
Crops
Field Crops Review .................................................................................... 56
Crop Summary ........................................................................................... 57
Record Highs and Lows ............................................................................. 58 Cotton ....................................................................................................59-62
Cottonseed .................................................................................................. 63
Cotton Running Bales Ginned and Produced.............................................. 64 Hay ........................................................................................................65-66
Wheat and Barley ....................................................................................... 67
Wheat Price Reactions ............................................................................... 68 Corn and Sorghum, Grain and Silage, Grain Stocks ................................... 69
County Estimates ...................................................................................70-72
Page
Vegetables, Melons, and Potatoes Review ....................................................................................................... 73
Lettuce, Head ............................................................................................. 74 Lettuce, Leaf .............................................................................................. 75
Lettuce, Romaine ....................................................................................... 75
Spinach ...................................................................................................... 75 Cabbage ..................................................................................................... 75
Broccoli ..................................................................................................... 76
Cauliflower ................................................................................................ 76 Chile Peppers ............................................................................................. 77
Potatoes ..................................................................................................... 77
Cantaloupes ............................................................................................... 78 Watermelons .............................................................................................. 78
Honeydews ................................................................................................ 78
Fruits and Nuts Review ....................................................................................................... 79
All Citrus ................................................................................................... 79 Lemons ...................................................................................................... 80
Tangerines ................................................................................................. 80
Apples ........................................................................................................ 81 Pecans ........................................................................................................ 81
Weather
Review ....................................................................................................... 82
Freeze Dates .............................................................................................. 83
Usual Planting and Harvesting Dates ......................................................... 84
Miscellaneous
County Profiles, Crops, Livestock ........................................................ 85-88
Land Ownership and Administration ......................................................... 89
Farm Computer Usage and Ownership ...................................................... 90
Commodities Rank by States ................................................................ 91-92 State Field Offices ..................................................................................... 93

1
Cash Receipts
Cash receipts are computed as marketing volume multiplied
by the price and are usually reported on a calendar-year
basis. Marketings come from current production or storage
of past year’s crop (assuming a crop is storable, such as
potatoes). Thus, the quantity available for sale (marketings),
can be thought of as coming from current production
less shrinkage and the amount used on farms for
food, feed and seed plus change in stored
quantity (inventory). On the other hand, value of
production, which is generally reported as a crop-year
statistic, is computed as production multiplied by the
average price. The difference between value of production
and cash receipts is usually only important to those
commodities which can be stored and thus have a specific
marketing pattern which extends through time from the date
of harvest.
Cash Receipts: All Commodities 1/
Commodity 2007 2008 2009 2010 2011 2/
---------------------------------------- 1,000 Dollars ---------------------------------------- Cotton lint, all 3/ 136,849 161,458 95,488 220,445 300,047
Cottonseed 29,314 35,109 25,055 34,396 61,821
Hay 179,233 238,836 183,963 174,291 244,930
Wheat 42,479 114,037 104,482 49,822 66,626 Barley 9,597 19,440 21,973 20,363 31,727 Corn, grain 10,138 11,597 9,921 16,355 28,311
Sorghum, grain 5,574 9,477 6,302 2,288 3,163
Potatoes 10,733 15,649 16,490 16,491 16,704
Lettuce, Head & Other 305,844 185,998 252,816 323,680 387,126
Lettuce, Leaf 86,284 81,281 67,940 93,509 115,644
Lettuce, Romaine 175,053 105,747 128,876 190,229 325,920
Onions 5,940 5,828 6,509 4/ 4/
Cauliflower 32,072 34,960 28,480 33,408 39,006
Broccoli 68,597 57,988 43,524 42,804 58,594
Honeydews 18,360 22,494 16,315 12,586 16,873
Cantaloupes 102,480 118,825 115,230 97,271 94,080
Watermelons 40,846 46,656 31,801 28,943 38,142
Spinach 18,766 28,215 45,864 45,000 85,730
Cabbage 17,366 18,257 19,000 23,047 28,175
Peppers, chile 12,992 10,964 10,429 10,369 3,961
Misc. vegetables 80,773 80,218 105,351 102,192 96,023
Grapefruit 1,155 5/ 5/ 5/ 5/ Oranges 2,700 2,312 732 5/ 5/
Lemons 49,100 26,996 25,433 35,705 18,011
Tangerines 5,153 7,218 2,928 4,328 4,259
Apples 5,040 4,021 1,305 3,048 2,647 Grapes 5/ 620 5/ 5/ 5/
Pecans 36,800 25,375 34,400 61,600 51,800
Misc. fruits & nuts 14,267 24,764 31,060 33,771 32,976
All other crops 479,624 455,149 355,625 330,859 333,745 Crops 1,983,146 1,949,545 1,792,071 2,018,697 2,494,466
Cattle and calves 700,314 637,016 600,422 637,948 816,172
Hogs 36,584 43,057 38,360 53,141 63,999 Sheep and lambs 4,685 6,102 4,644 5,754 6/
Dairy products 801,627 763,136 491,623 657,624 871,002
Honey 2,419 2,016 1,508 2,809 1,829
Wool 255 225 181 225 345
Mohair 250 110 99 132 220
Other livestock 44,157 53,427 44,643 60,654 62,832
Livestock and products 1,590,291 1,505,089 1,183,675 1,421,341 1,819,443 All commodities 3,573,437 3,454,634 2,975,746 3,440,038 4,313,909
Gov’t Payments 92,669 89,968 111,553 70,181 58,122
Total Cash Receipts 3,666,106 3,544,602 3,082,592 3,444,997 4,372,031
1/ Includes miscellaneous field crops, seed crops, and greenhouse/nursery. Source: United States Department of Agriculture, Economic Research Service;
Economic Indicators of the Farm Sector, State Financial Summary. 2/ Preliminary. 3/ Upland cotton only after 2007. Pima cotton included with All Other Crops
4/ Included in Misc. vegetables.
5/ Included with Misc. fruits & nuts.
6/ Sheep and Lamb cash receipts included with Other Livestock in 2011.

2
Cash Receipts: All Farm Commodities by County
---------------2010--------------- ---------------2011---------------1/
County Crops Livestock All Crops Livestock All
-------------------------------------------- 1,000 Dollars ----------------------------------------------
Apache 5,085 8,393 13,479 6,284 10,744 17,028
Cochise 78,466 46,001 124,467 96,959 58,885 155,844
Coconino 1,686 21,083 22,770 2,084 26,989 29,072
Gila 1,819 2,871 4,690 2,248 3,675 5,923
Graham 187,413 4,027 191,440 231,583 5,155 236,738
Greenlee 1,556 5,093 6,649 1,923 6,519 8,442
La Paz 141,454 2,736 144,191 174.793 3,502 178,295
Maricopa 418,080 448,812 866,893 516,614 574,520 1,091,134
Mohave 12,829 6,964 19,793 15.852 8,915 24,767
Navajo 4,764 45,189 49,953 5.887 57,846 63,733
Pima 52,116 19,479 71,595 64,399 24,935 89,334
Pinal 247,179 608,284 855,464 305,435 778,658 1,084,093
Santa Cruz 481 4,104 4,585 595 5,254 5,848
Yavapai 13,303 34,696 48,000 16,439 44,414 60,853
Yuma 852,462 163,608 1,016,070 1,053,372 209,433 1,262,805
Arizona 2/ 2,018,697 1,421,341 3,440,038 2,494,466 1,819,443 4,313,909
1/ Preliminary. 2/ Total may not add due to rounding.

3
Farm Income Indicators
Item 1/ 2006 2007 2008 2009 2010 2011
--------------------------------- 1,000 Dollars -------------------------------
Value of crop production 1,666,138 1,992,063 1,935,475 1,817,891
6
1,999,905 2,540,525
Food grains 29,789 42,434 118,808 104,482
49,822 66,626
Feed crops 187,621 218,039 301,926 222,159 213,287 308,131
Cotton 157,370 166,661 188,797 121,187 258,695 371,544
Oil crops 390 199 143 83 NA NA
Fruits and tree nuts 97,181 116,105 72,788 95,904 138,489 109,714
Vegetables 768,558 976,048 782,048 893,358 1,031,398 1,314,381
All other crops 428,573 479,425 494,562 354,898 327,005 324,069
Home consumption 687 746 897 643 579 789
Value of inventory adjustment 2/ -4,031 -7,594 -24,494 25,177 -19,370 45,271
Value of livestock production 1,325,212 1,664,885 1,527,272 1,107,952 1,369,637 1,874,986
Meat animals 785,511 741,583 686,175 643,426 696,843 880,171
Dairy products 504,448 801,627 763,136 491,623 657,624 871,002
Miscellaneous livestock 31,768 47,081 56,177 48,626 66,874 68,270
Home consumption 2,196 2,144 2,578 3,030 3,541 3,388
Value of inventory adjustment 2/ 1,289 72,450 19,206 -78,753 -55,245 52,155
Revenues from services and forestry 560,260 570,748 600,816 632,966 568,605 664,786
Machine hire and custom work 35,104 46,727 40,528 106,803 38,057 54,026
Forest products sold 300 255 255 247 247 240
Other farm income 121,858 118,107 137,122 101,111 99,972 152,549
Gross imputed rental value of farm dwellings 402,988 405,659 422,911 424,805 430,329 457,971
Value of agricultural sector production 3,551,609 4,227,696 4,063,563 3,558,809 3,938,147 5,080,297
Less: Purchased inputs 2,130,006 2,459,694 2,551,425 2,494,513 2,307,347 2,668,996
Farm origin 883,438 1,026,327 1,008,843 981,594 935,576 1,217,622
Feed purchased 417,726 560,604 566,377 534,586 482,134 702,114
Livestock and poultry purchased 296,790 299,087 255,933 238,091 237,064 276,746
Seed purchased 168,922 166,636 186,533 208,917 216,378 238,762
Manufactured inputs 407,984 486,357 588,999 528,915 523,257 643,699
Fertilizers and lime 126,916 154,827 199,979 192,040 169,846 230,193
Pesticides 110,339 126,312 147,661 140,545 145,882 147,661
Petroleum fuel and oils 124,181 152,583 176,197 138,349 148,185 189,206
Electricity 46,548 52,635 65,162 57,981 59,344 76,639
Other purchased inputs 838,584 947,010 953,583 984,004 848,514 807,675
Repair and maintenance of capital items 150,802 178,728 196,873 236,685 174,344 187,678
Machine hire and custom work 103,610 154,049 152,332 168,867 182,646 101,744
Marketing, storage, and transportation expenses 135,067 120,057 124,371 128,034 110,168 113,381
Contract labor 81,212 92,148 84,454 97,256 56,491 59,528
Miscellaneous expenses 367,893 402,028 395,553 353,162 324,865 345,344
Plus: Net government transactions 40,986 11,429 7,835 33,336 -10,102 -23,535
+ Direct Government payments 109,075 92,669 89,978 111,553 70,181 58,122
- Motor vehicle registration and licensing fees 2,653 4,607 4,768 5,250 4,483 5,857
- Property taxes 65,436 76,633 77,375 72,967 75,800 75,800
Gross value added 1,462,590 1,779,430 1,519,973 1,097,632 1,620,698 2,387,765
Less: Capital consumption 233,589 231,792 239,924 269,618 275,178 285,239
Net value added 1,229,001 1,547,638 1,280,049 828,014 1,345,520 2,102,526
Less: Payments to stakeholders 532,249 549,701 528,836
585,030 541,216 521,470
Employee compensation (total hired labor) 416,666 453,983 443,300 503,637 452,999 447,350
Net rent received by non-operator landlords 2,562 -22,710 -28,134 -34,851 -24,479 -30,378
Real estate and non-real estate interest 113,021 118,428 113,670 116,244 112,696 104,498
Net farm income 696,752 997,937 751,213 242,984 804,304 1,581,056
1/ Value of agricultural sector production is the gross value of the commodities and services produced within a year. Net value-added is the sector’s contribution to the National economy and is the sum of the income from production earned by all factors-of-production, regardless of ownership. Net farm income is the farm operators’ share of income from the sector’s production activities. The concept presented is consistent with that employed by the Organization for Economic Cooperation and Development.
2/ A positive value of inventory change represents current-year production not sold by December 31. A negative value is an offset to production from prior years
included in current-year sales. Source: United States Department of Agriculture, Economic Research Service, Economic Indicators of the Farm Sector, State
Financial Summary.
4
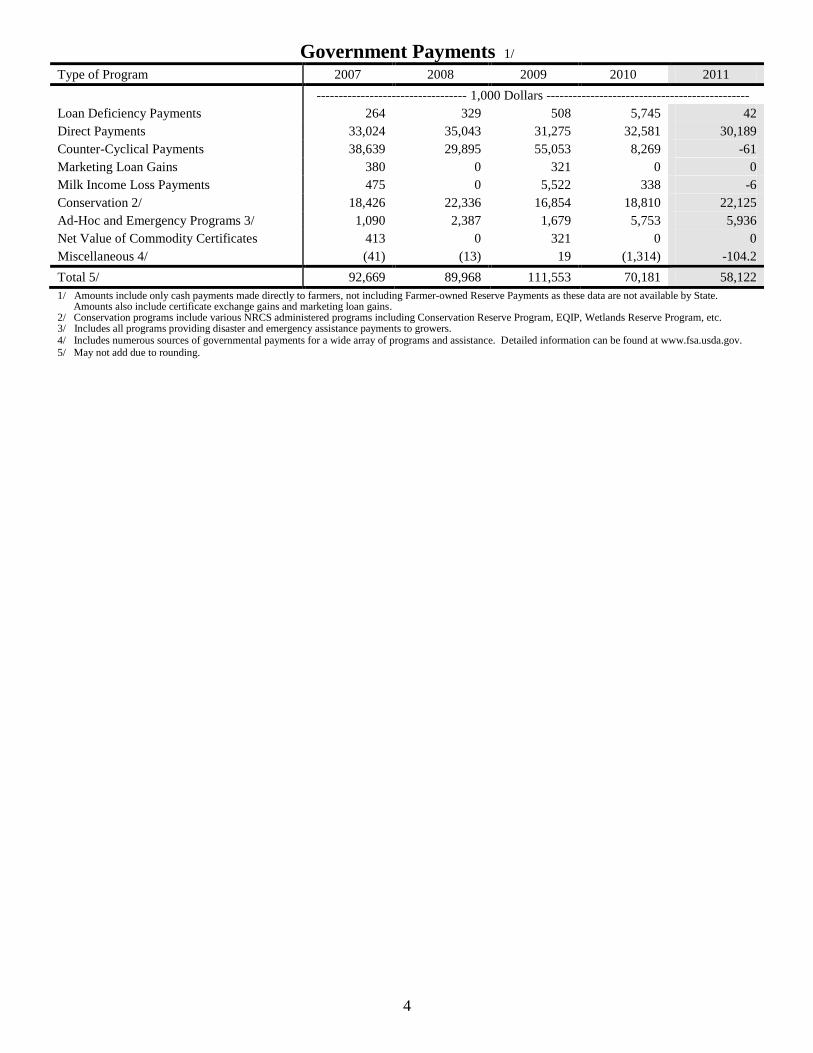
Government Payments 1/
Type of Program 2007 2008 2009 2010 2011
---------------------------------- 1,000 Dollars ----------------------------------------------
Loan Deficiency Payments 264 329 508 5,745 42
Direct Payments 33,024 35,043 31,275 32,581 30,189
Counter-Cyclical Payments 38,639 29,895 55,053 8,269 -61
Marketing Loan Gains 380 0 321 0 0
Milk Income Loss Payments 475 0 5,522 338 -6
Conservation 2/ 18,426 22,336 16,854 18,810 22,125
Ad-Hoc and Emergency Programs 3/ 1,090 2,387 1,679 5,753 5,936
Net Value of Commodity Certificates 413 0 321 0 0
Miscellaneous 4/ (41) (13) 19 (1,314) -104.2
Total 5/ 92,669 89,968 111,553 70,181 58,122
1/ Amounts include only cash payments made directly to farmers, not including Farmer-owned Reserve Payments as these data are not available by State. Amounts also include certificate exchange gains and marketing loan gains. 2/ Conservation programs include various NRCS administered programs including Conservation Reserve Program, EQIP, Wetlands Reserve Program, etc. 3/ Includes all programs providing disaster and emergency assistance payments to growers. 4/ Includes numerous sources of governmental payments for a wide array of programs and assistance. Detailed information can be found at www.fsa.usda.gov.
5/ May not add due to rounding.

5
Historic Inventory Data: Livestock, Arizona 1/
Year
All Cattle (000)
Beef Cows (000)
Milk Cows (000)
All Sheep (000)
All Hogs (000) Year
All Cattle (000)
Beef Cows (000)
Milk Cows (000)
All Sheep (000)
All Hogs (000)
1910 995
26
14 1960 1,019 343 53 488 32
1911 950
27
22 1961 1,047 337 54 496 28
1912 915
29
29 1962 1,056 366 54 516 30
1913 970
31
32 1963 1,130 373 54 533 30
1914 1,145
34
35 1964 1,100 378 56 560 28
1915 1,300
35
44 1965 1,140 388 56 605 28
1916 1,450
36
56 1966 1,101 361 56 601 36
1917 1,650
37
60 1967 1,156 390 56 534 48
1918 1,750
37
57 1968 1,160 376 55 487 60
1919 1,645
36
52 1969 1,206 369 53 500 69
1920 1,620 819 35 1,350 50 1970 1,302 367 49 508 81
1921 1,575 800 30 1,310 40 1971 1,289 346 50 506 97
1922 1,492 795 35 1,245 37 1972 1,295 348 50 503 82
1923 1,454 790 36 1,243 38 1973 1,420 342 53 502 81
1924 1,411 783 36 1,181 24 1974 1,390 351 61 488 99
1925 1,300 714 37 1,164 19 1975 1,170 372 64 510 97
1926 1,032 608 32 1,164 18 1976 1,280 312 68 470 99
1927 917 506 34 1,141 19 1977 1,065 319 68 466 102
1928 835 445 35 1,130 23 1978 1,135 297 68 400 144
1929 735 360 38 1,107 25 1979 1,200 287 70 425 149
1930 770 362 38 1,080 21 1980 1,050 258 72 385 180
1931 800 390 42 1,112 21 1981 1,075 285 75 372 170
1932 855 408 45 1,090 23 1982 1,000 275 80 377 170
1933 901 420 48 1,003 25 1983 1,000 278 82 343 150
1934 947 462 49 961 24 1984 980 268 82 306 170
1935 958 449 47 942 23 1985 1,050 272 83 266 175
1936 939 473 47 855 25 1986 1,050 293 88 278 155
1937 958 510 46 855 28 1987 1,000 268 87 283 130
1938 920 501 46 842 34 1988 960 260 90 284 130
1939 855 457 47 833 39 1989 880 263 92 284 100
1940 864 441 47 725 48 1990 830 259 91 262 110
1941 916 441 47 732 48 1991 840 249 96 235 100
1942 980 466 49 729 53 1992 900 279 96 220 106
1943 931 446 53 687 72 1993 890 284 96 205 140
1944 959 447 52 650 68 1994 870 259 106 220 170
1945 930 453 51 567 47 1995 850 243 112 170 125
1946 949 439 49 555 39 1996 850 232 118 160 150
1947 921 437 46 491 30 1997 810 218 122 150 145
1948 856 412 47 475 32 1998 820 220 130 140 115
1949 818 378 46 416 27 1999 810 218 132 140 140
1950 818 393 49 423 27 2000 840 200 135 140 9
1951 851 394 50 406 28 2001 860 195 140 120 133
1952 928 427 50 423 31 2002 860 185 140 115 138
1953 965 465 49 445 26 2003 840 170 155 115 127
1954 936 430 48 478 22 2004 880 185 155 119 150
1955 983 428 49 477 24 2005 930 190 165 115 142
1956 1,010 404 50 476 26 2006 970 205 170 125 148
1957 947 375 52 472 27 2007 980 200 175 140 175
1958 922 355 52 443 28 2008 1,000 195 185 155 165
1959 949 333 53 462 29 2009 1,020 200 190 150 167
2010 930 208 167 160 165
2011 870 180 185 150 180
1/ Missing data means no estimate was made or not disclosed.

6
600 700 800 900
1,000 1,100 1,200 1,300 1,400 1,500 1,600 1,700 1,800
19
10
19
14
19
18
19
22
19
26
19
30
19
34
19
38
19
42
19
46
19
50
19
54
19
58
19
62
19
66
19
70
19
74
19
78
19
82
19
86
19
90
19
94
19
98
20
02
20
06
20
10
Arizona All Cattle (000) Head
- 100 200 300 400 500 600 700 800 900
1,000 1,100 1,200 1,300 1,400
19
20
19
23
19
26
19
29
19
32
19
35
19
38
19
41
19
44
19
47
19
50
19
53
19
56
19
59
19
62
19
65
19
68
19
71
19
74
19
77
19
80
19
83
19
86
19
89
19
92
19
95
19
98
20
01
20
04
20
07
20
10
Arizona All Sheep (000) Head
0
20
40
60
80
100
120
140
160
180
19
10
19
13
19
16
19
19
19
22
19
25
19
28
19
31
19
34
19
37
19
40
19
43
19
46
19
49
19
52
19
55
19
58
19
61
19
64
19
67
19
70
19
73
19
76
19
79
19
82
19
85
19
88
19
91
19
94
19
97
20
00
20
03
20
06
20
09
Arizona All Hogs and Pigs
(000) Head

7
Historic Data: Upland Cotton, Arizona 1/
Year
HV Acres (000)
Yield Lbs
Prod’n Bales (000)
Price Per Lb.
Value ($ 000) Year
HV Acres (000)
Yield Lbs
Prod’n Bales (000)
Price Per Lb.
Value ($ 000)
1910
1960 399.8 979 815.3 0.304 124,451
1911
1961 366.1 1,045 797.1 0.329 131,549
1912
1962 364.1 1,162 881.6 0.313 138,576
1913
1963 325.3 1,120 758.9 0.313 119,156
1914
1964 328.0 1,085 742.0 0.298 106,180
1915
1965 307.0 1,157 740.0 0.295 104,788
1916
1966 218.0 1,053 478.0 0.213 48,738
1917 8.0 425 7.1
1967 216.0 928 418.0 0.297 59,650
1918 23.0 362 17.2
1968 269.0 1,230 688.0 0.235 77,762
1919 19.0 458 18.3
1969 277.0 1,033 595.0 0.223 63,713
1920 30.0 259 16.2
1970 241.0 920 462.1 0.227 52,448
1921 15.0 282 8.3
1971 241.0 928 466.0 0.300 66,955
1922 24.0 228 11.6 0.260
1972 271.0 1,067 603.0 0.293 84,738
1923 87.0 294 54.0 0.297
1973 276.0 1,063 611.0 0.433 126,999
1924 169.0 291 103.0 0.242 12,469 1974 392.0 1,218 995.0 0.441 210,622
1925 117.0 399 98.0 0.215 10,498 1975 268.0 1,027 573.0 0.531 146,046
1926 133.0 378 105.0 0.138 7,231 1976 340.0 1,178 834.0 0.642 257,005
1927 90.0 352 67.0 0.196 6,501 1977 515.0 997 1,070.0 0.561 288,130
1928 153.0 374 119.0 0.192 11,496 1978 538.0 953 1,068.0 0.574 295,255
1929 153.0 383 123.0 0.178 10,904 1979 575.0 1,069 1,280.0 0.681 420,864
1930 163.0 382 130.0 0.105 6,812 1980 549.0 1,184 1,354.0 0.742 488,090
1931 149.0 323 100.0 0.062 3,091 1981 599.0 1,247 1,556.0 0.560 425,722
1932 91.0 318 60.0 0.068 2,054 1982 470.0 1,118 1,095.0 0.606 318,514
1933 113.0 365 86.0 0.110 4,742 1983 284.0 1,225 725.0 0.683 237,684
1934 108.0 453 102.0 0.129 6,583 1984 429.0 1,227 1,097.0 0.601 316,463
1935 121.0 461 116.0 0.113 6,572 1985 359.0 1,241 928.0 0.582 259,246
1936 170.0 485 173.0 0.130 11,203 1986 249.0 1,301 675.0 0.543 175,932
1937 278.0 518 301.0 0.087 13,084 1987 289.0 1,410 849.0 0.657 267,741
1938 159.0 525 175.0 0.084 7,308 1988 349.0 1,190 865.0 0.572 237,494
1939 147.0 567 174.4 0.096 8,378 1989 239.0 1,303 649.0 0.659 205,292
1940 155.0 508 164.5 0.105 8,569 1990 348.0 1,119 811.0 0.692 269,382
1941 150.0 446 139.5 0.174 12,117 1991 359.0 1,201 898.0 0.604 260,348
1942 142.0 463 137.0 0.187 12,818 1992 323.0 1,077 725.0 0.530 184,440
1943 107.0 428 95.3 0.189 9,014 1993 315.0 1,204 790.0 0.581 220,315
1944 135.0 463 130.3 0.205 13,383 1994 312.0 1,203 782.0 0.706 265,004
1945 149.0 366 114.0 0.230 13,062 1995 364.0 1,046 793.0 0.729 277,487
1946 143.0 524 156.6 0.302 23,600 1996 314.0 1,189 778.0 0.697 260,288
1947 224.7 497 233.8 0.301 35,187 1997 324.0 1,255 847.0 0.647 263,044
1948 279.4 559 326.9 0.305 49,843 1998 248.0 1,177 608.0 0.547 159,636
1949 382.4 677 541.2 0.273 73,934 1999 269.0 1,278 716.0 0.439 150,876
1950 231.0 906 437.1 0.411 89,908 2000 278.0 1,366 791.0 0.397 150,733
1951 547.0 685 783.3 0.375 146,831 2001 290.0 1,142 690.0 0.284 94,061
1952 626.0 692 904.2 0.323 145,989 2002 213.0 1,381 613.0 0.463 136,233
1953 648.5 766 1,034.9 0.322 166,874 2003 213.0 1,239 550.0 0.664 175,296
1954 404.2 1,051 885.2 0.336 148,927 2004 238.0 1,458 723.0 0.444 154,086
1955 336.8 1,003 703.5 0.323 113,980 2005 229.0 1,289 615.0 0.516 152,323
1956 339.8 1,130 800.1 0.311 124,941 2006 188.0 1,420 556.0 0.499 133,173
1957 317.5 1,086 718.4 0.324 116,860 2007 168.0 1,469 514.0 0.596 147,045
1958 343.0 970 692.8 0.337 117,050 2008 133.0 1,462 405.0 0.585 113,724
1959 354.5 924 682.2 0.325 111,293 2009 144.0 1,477 443.0 0.651 138,429
2010 193.0 1,517 610.0 0.855 250,344
2011 248.0 1,548 800.0 0.944 362,496
1/ Missing data means no estimate was made or not disclosed.

8
0
100
200
300
400
500
600
700
19
17
19
20
19
23
19
26
19
29
19
32
19
35
19
38
19
41
19
44
19
47
19
50
19
53
19
56
19
59
19
62
19
65
19
68
19
71
19
74
19
77
19
80
19
83
19
86
19
89
19
92
19
95
19
98
20
01
20
04
20
07
20
10
Arizona Upland Cotton Harvested Acres
(000)
0
200
400
600
800
1,000
1,200
1,400
1,600
19
17
19
21
19
25
19
29
19
33
19
37
19
41
19
45
19
49
19
53
19
57
19
61
19
65
19
69
19
73
19
77
19
81
19
85
19
89
19
93
19
97
20
01
20
05
20
09
Arizona Upland Cotton Yield
Pounds per Acre

9
Historic Data: American-Pima Cotton, Arizona 1/
Year
HV Acres (000)
Yield Lbs
Prod’n Bales (000)
Price Per Lb.
Value ($ 000) Year
HV Acres (000)
Yield Lbs
Prod’n Bales (000)
Price Per Lb.
Value ($ 000)
1910
1960 26.2 563 30.7 0.549 8,102
1911
1961 25.9 518 28.0 0.603 8,092
1912 0.4 300 0.3
1962 40.9 665 56.7 0.538 14,636
1913 4.0 275 2.3
1963 61.7 602 77.4 0.525 19,509
1914 12.0 358 6.5
1964 47.0 562 55.0 0.482 12,720
1915 2.6 222 1.2
1965 32.9 657 45.1 0.474 10,251
1916 7.3 226 3.5
1966 34.2 507 36.1 0.480 8,319
1917 33.0 230 15.9
1967 28.7 574 34.3 0.475 7,826
1918 72.0 238 35.8
1968 29.3 721 44.0 0.403 8,514
1919 87.0 229 41.7
1969 33.4 533 37.1 0.403 7,173
1920 200.0 205 85.8
1970 32.8 407 27.8 0.440 5,868
1921 75.0 234 36.7
1971 44.4 456 42.1 0.439 8,883
1922 77.0 220 35.4 0.320 5,321 1972 39.9 587 48.8 0.413 9,671
1923 40.0 287 24.0 0.370 3,956 1973 34.0 597 42.3 0.970 19,692
1924 9.0 252 5.0 0.470 1,015 1974 34.7 729 52.7 0.626 15,837
1925 41.0 247 21.0 0.410 4,111 1975 29.8 612 38.0 0.786 14,337
1926 27.0 306 17.0 0.310 2,516 1976 30.0 804 50.3 1.020 24,627
1927 41.0 296 25.0 0.380 4,621 1977 42.3 738 65.0 0.886 27,643
1928 51.0 278 30.0 0.364 5,181 1978 34.2 754 53.7 0.910 23,456
1929 67.0 217 30.0 0.325 4,721 1979 43.3 743 67.0 1.010 32,482
1930 47.0 260 25.0 0.200 2,426 1980 42.1 824 72.3 1.080 37,480
1931 35.0 199 15.0 0.156 1,085 1981 33.6 767 53.7 0.940 24,229
1932 22.0 189 9.0 0.145 603 1982 41.6 760 65.9 1.000 31,632
1933 26.0 184 10.0 0.209 998 1983 29.3 768 46.9 1.020 22,962
1934 28.0 247 15.0 0.218 1,533 1984 50.3 841 88.1 0.925 39,116
1935 39.0 229 19.0 0.216 1,914 1985 56.3 927 108.7 0.882 46,019
1936 38.0 230 18.0 0.278 2,436 1986 73.8 965 148.3 0.892 63,496
1937 21.0 269 12.0 0.246 1,358 1987 90.8 1,126 213.0 1.040 106,330
1938 44.0 234 21.0 0.187 1,920 1988 128.0 904 241.0 1.180 136,502
1939 41.0 323 27.6 0.218 2,890 1989 244.5 936 477.0 0.956 218,886
1940 65.0 225 30.5 0.302 4,412 1990 124.0 751 194.0 1.040 96,845
1941 101.0 197 41.5 0.307 6,119 1991 103.0 860 184.5 0.976 86,435
1942 129.0 208 56.0 0.440 11,817 1992 102.0 649 138.0 0.776 51,402
1943 95.0 180 35.7 0.464 7,958 1993 56.9 734 87.0 0.916 38,252
1944 9.0 302 5.7 0.459 1,248 1994 47.9 806 80.4 1.030 39,750
1945 5.0 287 3.0 0.424 608 1995 48.1 720 72.2 1.190 41,241
1946 2.0 348 1.4 0.465 323 1996 41.9 852 74.4 1.060 37,855
1947 0.3 259 0.2 0.590 46 1997 22.0 912 41.8 0.982 19,703
1948 1.6 320 1.1 0.603 308 1998 15.5 830 26.8 0.924 11,886
1949 2.6 327 1.8 0.550 468 1999 8.9 879 16.3 0.868 6,791
1950 44.0 402 36.9 0.702 12,414 2000 4.9 705 7.2 0.967 3,342
1951 26.0 363 19.7 0.954 9,004 2001 7.5 928 14.5 0.848 5,902
1952 48.0 436 43.8 1.000 20,922 2002 8.2 1,013 17.3 0.885 7,349
1953 41.5 375 32.4 0.711 11,063 2003 2.4 920 4.6 1.170 2,583
1954 15.8 732 24.1 0.630 7,285 2004 3.0 896 5.6 1.230 3,306
1955 18.2 587 22.3 0.537 5,737 2005 4.1 820 7.0 1.180 3,965
1956 18.2 699 26.5 0.654 8,314 2006 7.0 919 13.4 0.900 5,789
1957 34.5 587 42.2 0.564 11,428 2007 2.5 883 4.6 0.943 2,082
1958 34.0 542 38.4 0.542 9,997 2008 0.8 480 0.8
1959 28.5 514 30.5 0.528 7,739 2009 1.6 1,170 3.9
2010 2.5 845 4.4 1.480 3,126
2011 10.0 960 20.0
1/ Missing data means no estimate was made or not disclosed.

10
0 25 50 75
100 125 150 175 200 225 250
19
12
19
16
19
20
19
24
19
28
19
32
19
36
19
40
19
44
19
48
19
52
19
56
19
60
19
64
19
68
19
72
19
76
19
80
19
84
19
88
19
92
19
96
20
00
20
04
20
08
Arizona Pima Cotton Harvested Acres
(000)
-
200
400
600
800
1,000
1,200
19
12
19
16
19
20
19
24
19
28
19
32
19
36
19
40
19
44
19
48
19
52
19
56
19
60
19
64
19
68
19
72
19
76
19
80
19
84
19
88
19
92
19
96
20
00
20
04
20
08
Arizona Pima Cotton Yield
Pounds per Acre

11
Historic Data: All Hay, Arizona
Year
HV Acres (000)
Yield Tons
Prod’n Tons (000)
Price Per Ton
Value ($ 000) Year
HV Acres (000)
Yield Tons
Prod’n Tons (000)
Price Per Ton
Value ($ 000)
1910 102 2.38 243 12.20 2,965 1960 275 4.31 1,184 25.10 29,718
1911 114 2.54 289 10.80 3,121 1961 277 4.36 1,209 23.20 28,048
1912 124 2.63 326 9.90 3,227 1962 257 4.31 1,108 26.10 28,918
1913 135 2.59 349 11.50 4,014 1963 236 4.70 1,110 30.70 34,077
1914 141 2.56 361 10.20 3,682 1964 249 4.44 1,106 25.30 27,982
1915 147 2.60 382 10.20 3,896 1965 240 4.88 1,170 24.90 29,133
1916 159 2.56 407 12.80 5,210 1966 240 4.70 1,127 26.50 29,866
1917 153 2.53 387 22.70 8,785 1967 233 4.82 1,122 30.50 34,221
1918 139 2.39 332 24.90 8,267 1968 239 4.91 1,174 24.00 28,176
1919 153 2.61 399 21.40 8,539 1969 224 4.89 1,096 28.00 30,688
1920 121 2.38 288 29.80 8,582 1970 243 5.42 1,318 31.50 41,517
1921 152 2.13 323 16.00 5,168 1971 240 5.30 1,272 33.00 41,976
1922 162 2.16 350 14.20 4,970 1972 259 5.30 1,372 35.00 48,020
1923 162 2.35 380 16.10 6,118 1973 253 5.68 1,438 43.00 61,834
1924 163 2.34 381 18.00 6,858 1974 245 5.63 1,379 56.00 77,224
1925 168 2.20 370 18.80 6,956 1975 220 5.91 1,301 59.00 76,759
1926 176 2.49 439 11.50 5,048 1976 200 6.33 1,265 68.50 86,653
1927 185 2.48 458 10.60 4,855 1977 205 5.86 1,202 65.00 78,130
1928 182 2.66 485 15.50 7,518 1978 200 5.69 1,137 60.50 68,789
1929 177 2.45 434 18.70 8,116 1979 190 5.75 1,093 81.00 88,533
1930 191 2.73 522 13.20 6,890 1980 195 6.46 1,260 82.50 103,950
1931 209 2.57 537 8.60 4,618 1981 190 6.40 1,216 74.00 89,984
1932 224 2.54 569 6.10 3,471 1982 185 6.71 1,241 73.50 91,214
1933 227 2.45 557 6.80 3,788 1983 170 6.81 1,157 93.00 107,601
1934 210 2.30 483 10.50 5,072 1984 165 6.72 1,108 84.50 93,626
1935 210 2.71 570 8.60 4,902 1985 167 6.64 1,109 79.50 88,166
1936 197 2.28 450 9.40 4,230 1986 177 7.13 1,262 70.50 88,971
1937 204 2.45 500 9.30 4,650 1987 190 7.28 1,383 81.50 112,715
1938 213 2.22 473 7.40 3,500 1988 180 7.36 1,325 89.50 118,588
1939 245 2.13 523 9.90 5,178 1989 185 6.92 1,280 98.50 126,080
1940 230 1.97 454 9.90 4,495 1990 195 7.29 1,421 96.00 135,439
1941 265 2.19 580 11.70 6,786 1991 200 7.13 1,426 70.50 100,651
1942 249 2.25 561 15.60 8,752 1992 180 6.80 1,224 63.50 77,498
1943 282 2.36 666 21.40 14,252 1993 185 6.68 1,236 92.50 114,432
1944 332 2.18 723 20.10 14,532 1994 195 6.80 1,326 100.00 133,554
1945 309 2.42 748 20.20 15,110 1995 195 7.14 1,392 78.50 109,496
1946 308 2.39 737 25.60 18,867 1996 179 7.53 1,347 94.00 126,592
1947 271 2.20 595 23.00 13,685 1997 230 7.42 1,706 111.00 187,594
1948 226 2.38 537 26.20 14,069 1998 240 7.25 1,740 89.50 154,190
1949 253 2.47 624 19.70 12,292 1999 240 7.30 1,752 88.50 153,434
1950 253 2.60 659 21.00 13,839 2000 247 7.57 1,870 94.00 174,688
1951 249 2.57 639 34.40 21,981 2001 258 7.22 1,862 99.00 183,273
1952 246 2.75 677 31.00 20,987 2002 275 7.40 2,034 99.50 202,289
1953 237 2.83 670 23.10 15,477 2003 275 7.86 2,162 89.00 192,843
1954 257 2.74 704 25.60 18,022 2004 275 7.71 2,119 99.50 210,161
1955 284 2.75 780 28.20 21,996 2005 300 7.75 2,324 124.00 287,336
1956 273 2.91 795 25.90 20,590 2006 295 7.63 2,251 130.00 292,630
1957 250 3.50 876 26.50 23,214 2007 295 7.43 2,192 150.00 328,864
1958 259 3.96 1,026 24.60 25,239 2008 295 8.08 2,383 184.00 438,356
1959 260 4.18 1,087 25.70 27,935 2009 310 8.16 2,530 121.00 306,430
2010 320 7.74 2,476 128.00 318,504
2011 285 7.77 2,215 219.00 484,590

12
0
50
100
150
200
250
300
350
19
10
19
13
19
16
19
19
19
22
19
25
19
28
19
31
19
34
19
37
19
40
19
43
19
46
19
49
19
52
19
55
19
58
19
61
19
64
19
67
19
70
19
73
19
76
19
79
19
82
19
85
19
88
19
91
19
94
19
97
20
00
20
03
20
06
20
09
Arizona All Hay Harvested Acres
(000)
0.00
1.00
2.00
3.00
4.00
5.00
6.00
7.00
8.00
9.00
19
10
19
13
19
16
19
19
19
22
19
25
19
28
19
31
19
34
19
37
19
40
19
43
19
46
19
49
19
52
19
55
19
58
19
61
19
64
19
67
19
70
19
73
19
76
19
79
19
82
19
85
19
88
19
91
19
94
19
97
20
00
20
03
20
06
20
09
Arizona All Hay Yield
Tons per Acre

13
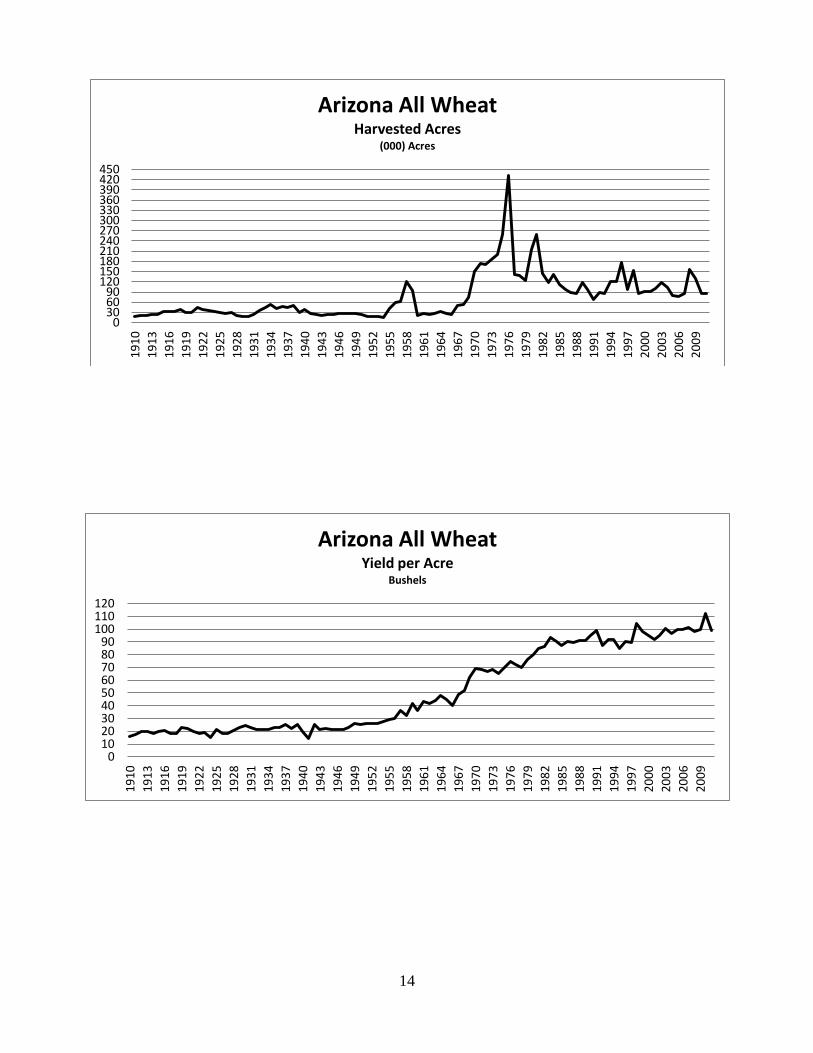
Historic Data: All Wheat, Arizona
Year
HV Acres (000)
Yield Bu
Prod’n Bushels
(000)
Price Per
Bushel Value
($ 000) Year
HV Acres (000)
Yield Bu
Prod’n Bushels
(000)
Price Per
Bushel Value
($ 000)
1910 19 16.0 304 1.07 325 1960 22 36.0 792 1.83 1,449
1911 20 17.5 350 0.94 329 1961 26 43.0 1,118 1.96 2,191 1912 21 19.5 410 0.95 390 1962 24 42.0 1,008 2.11 2,127 1913 23 19.5 448 1.12 502 1963 27 44.0 1,188 1.96 2,328 1914 25 18.5 462 1.23 568 1964 33 48.0 1,584 1.57 2,487 1915 32 20.0 640 1.28 819 1965 26 45.0 1,170 1.56 1,825 1916 34 20.5 697 1.12 781 1966 23 40.0 920 1.62 1,490 1917 32 18.0 576 2.23 1,284 1967 50 49.0 2,450 1.52 3,724 1918 38 18.5 703 2.11 1,483 1968 52 52.0 2,704 1.32 3,569 1919 31 23.0 713 2.34 1,668 1969 73 62.0 4,526 1.48 6,698 1920 29 22.0 638 2.47 1,576 1970 150 69.0 10,350 1.41 14,594 1921 44 19.5 858 1.91 1,639 1971 173 68.0 11,764 1.71 20,116 1922 40 18.0 720 1.34 965 1972 170 67.0 11,390 1.64 18,680 1923 36 19.0 684 1.16 793 1973 185 68.0 12,580 2.60 32,708 1924 32 15.3 490 1.33 652 1974 200 65.0 13,000 3.14 40,820 1925 29 21.5 624 1.72 1,073 1975 260 70.0 18,200 3.17 57,694 1926 28 18.5 518 1.37 710 1976 431 75.0 32,325 3.91 126,497 1927 31 18.0 558 1.31 731 1977 140 72.0 10,080 2.67 26,946 1928 22 20.5 451 1.35 609 1978 138 70.0 9,660 2.94 28,356 1929 18 23.0 414 1.32 546 1979 125 76.3 9,540 3.66 34,961 1930 17 24.5 416 1.16 483 1980 215 80.0 17,200 4.06 69,852 1931 24 23.0 552 0.74 408 1981 258 84.7 21,844 4.61 100,765 1932 36 21.0 756 0.55 416 1982 143 86.8 12,407 3.60 44,674 1933 43 21.5 924 0.80 739 1983 119 93.2 11,094 4.01 44,477 1934 54 21.5 1,161 0.82 952 1984 142 90.0 12,780 4.08 52,146 1935 41 23.0 943 0.82 773 1985 112 87.5 9,804 3.52 34,472 1936 48 23.0 1,104 0.89 983 1986 96 90.5 8,688 3.38 29,355 1937 45 25.5 1,148 1.00 1,148 1987 89 89.9 8,005 3.05 24,397 1938 50 22.0 1,100 0.74 814 1988 85 90.9 7,730 3.94 30,465 1939 31 25.0 775 0.77 597 1989 118 90.9 10,722 4.14 44,396 1940 39 20.0 780 0.82 640 1990 98 94.6 9,266 3.65 34,334 1941 27 14.5 392 1.04 408 1991 68 99.3 6,750 3.44 23,619 1942 23 25.0 575 1.16 667 1992 88 87.5 7,700 3.84 29,148 1943 22 21.0 462 1.50 693 1993 85 91.6 7,790 3.67 27,952 1944 24 22.5 540 1.59 859 1994 122 91.7 11,186 4.22 46,178 1945 24 21.0 504 1.70 857 1995 122 84.9 10,354 4.64 47,038 1946 27 21.0 567 2.13 1,208 1996 178 90.4 16,090 5.00 79,320 1947 28 21.0 588 2.48 1,458 1997 98 89.5 8,775 4.70 40,745 1948 28 23.0 644 2.17 1,397 1998 152 104.2 15,840 4.40 70,380 1949 28 26.2 734 1.90 1,395 1999 85 97.9 8,325 4.00 32,250 1950 25 25.0 625 1.83 1,194 2000 92 95.4 8,775 3.45 30,279 1951 18 26.0 468 2.17 1,016 2001 93 91.6 8,517 3.95 33,222 1952 17 26.0 442 2.20 972 2002 99 95.4 9,444 4.35 41,218 1953 18 26.0 468 2.16 1,011 2003 119 100.1 11,912 4.64 55,082 1954 15 28.0 420 2.15 903 2004 103 96.7 9,963 4.25 42,073 1955 42 29.0 1,218 1.85 2,253 2005 81 99.5 8,060 4.19 33,756 1956 58 30.0 1,740 1.90 3,306 2006 76 99.7 7,580 4.85 36,774 1957 63 36.0 2,268 2.02 4,581 2007 86 101.4 8,724 7.03 61,329 1958 122 32.0 3,904 1.76 6,871 2008 155 97.9 15,172 8.27 125,993 1959 94 42.0 3,948 1.64 6,475 2009 129 99.4 12,825 8.64 109,440
2010 85 112.2 9,535 5.61 53,501
2011 85 98.8 8,399 8.35 69,439
14
0 30 60 90
120 150 180 210 240 270 300 330 360 390 420 450
19
10
19
13
19
16
19
19
19
22
19
25
19
28
19
31
19
34
19
37
19
40
19
43
19
46
19
49
19
52
19
55
19
58
19
61
19
64
19
67
19
70
19
73
19
76
19
79
19
82
19
85
19
88
19
91
19
94
19
97
20
00
20
03
20
06
20
09
Arizona All Wheat Harvested Acres
(000) Acres
0 10 20 30 40 50 60 70 80 90
100 110 120
19
10
19
13
19
16
19
19
19
22
19
25
19
28
19
31
19
34
19
37
19
40
19
43
19
46
19
49
19
52
19
55
19
58
19
61
19
64
19
67
19
70
19
73
19
76
19
79
19
82
19
85
19
88
19
91
19
94
19
97
20
00
20
03
20
06
20
09
Arizona All Wheat Yield per Acre
Bushels

15
Historic Data: Barley, Arizona
Year
HV Acres (000)
Yield Bu
Prod’n Bushels
(000)
Price Per
Bushel Value
($ 000) Year
HV Acres (000)
Yield Bu
Prod’n Bushels
(000)
Price Per
Bushel Value
($ 000)
1910 34 29.0 986 0.68 670 1960 150 67.0 10,050 1.11 11,156
1911 31 29.5 914 0.68 622 1961 165 68.0 11,220 1.07 12,005
1912 31 30.5 946 0.71 672 1962 111 65.0 7,215 1.22 8,802
1913 29 29.0 841 0.71 597 1963 127 66.0 8,382 1.25 10,478
1914 27 29.0 783 0.64 501 1964 144 69.0 9,936 1.15 11,426
1915 26 30.5 793 0.70 555 1965 153 69.0 10,557 1.21 12,774
1916 25 28.5 712 0.78 555 1966 110 67.0 7,370 1.21 8,918
1917 27 29.0 783 1.38 1,081 1967 160 75.0 12,000 1.17 14,040
1918 24 28.0 672 1.46 981 1968 176 73.0 12,848 1.10 14,133
1919 22 31.0 682 1.13 771 1969 144 71.0 10,224 1.23 12,576
1920 15 30.0 450 1.67 752 1970 140 76.0 10,640 1.21 12,874
1921 21 29.0 609 1.09 664 1971 119 74.0 8,806 1.35 11,888
1922 22 25.0 550 0.91 500 1972 97 71.0 6,887 1.32 9,091
1923 23 30.0 690 0.85 586 1973 110 75.0 8,250 1.93 15,923
1924 20 26.5 530 0.93 493 1974 60 71.0 4,260 2.58 10,991
1925 16 32.0 512 0.91 466 1975 65 75.0 4,875 2.65 12,919
1926 13 27.0 351 0.72 253 1976 57 76.0 4,332 2.72 11,783
1927 10 30.0 300 0.72 216 1977 55 76.0 4,180 2.11 8,820
1928 8 30.5 244 0.86 210 1978 35 71.0 2,485 2.39 5,939
1929 16 29.0 464 0.82 380 1979 43 75.0 3,225 2.61 8,417
1930 17 28.0 476 0.69 328 1980 50 87.0 4,350 2.67 11,615
1931 19 30.0 570 0.48 274 1981 36 92.0 3,312 3.42 11,327
1932 23 30.0 690 0.36 248 1982 38 100.0 3,800 2.73 10,374
1933 22 32.0 704 0.49 345 1983 27 104.0 2,808 3.02 8,480
1934 27 29.1 786 0.56 440 1984 53 101.0 5,353 3.00 16,059
1935 36 33.0 1,188 0.53 630 1985 62 97.0 6,014 2.82 16,959
1936 24 34.0 816 0.57 465 1986 29 100.0 2,900 2.47 7,163
1937 26 29.0 754 0.69 520 1987 22 99.0 2,178 2.19 4,770
1938 31 31.0 961 0.48 461 1988 13 104.0 1,352 2.35 3,177
1939 32 34.0 1,088 0.48 522 1989 12 103.0 1,236 3.10 3,832
1940 35 32.0 1,120 0.54 605 1990 15 105.0 1,575 2.79 4,394
1941 44 32.0 1,408 0.62 873 1991 20 120.0 2,400 2.60 6,240
1942 58 34.0 1,972 0.69 1,361 1992 21 105.0 2,205 2.60 5,733
1943 52 31.0 1,612 1.05 1,693 1993 29 100.0 2,900 2.60 7,540
1944 74 42.0 3,108 1.12 3,481 1994 33 95.0 3,135 2.85 8,935
1945 78 38.0 2,964 1.03 3,053 1995 21 90.0 1,890 2.95 5,576
1946 85 40.0 3,400 1.36 4,624 1996 54 105.0 5,670 3.55 20,129
1947 97 43.0 4,171 1.45 6,048 1997 67 102.0 6,834 2.90 19,819
1948 146 51.0 7,446 1.26 9,382 1998 56 110.0 6,160 2.45 15,092
1949 126 50.0 6,300 1.07 6,741 1999 62 114.0 7,068 2.40 16,963
1950 157 50.0 7,850 1.09 8,557 2000 36 114.0 4,104 2.42 9,932
1951 98 50.0 4,900 1.44 7,056 2001 40 110.0 4,400 2.40 10,560
1952 107 55.0 5,885 1.47 8,651 2002 40 110.0 4,400 2.55 11,220
1953 141 55.0 7,755 1.25 9,694 2003 30 118.0 3,540 2.84 10,054
1954 268 52.0 13,936 1.09 15,190 2004 38 110.0 4,180 2.80 11,704
1955 174 64.0 11,136 1.06 11,804 2005 30 100.0 3,000 2.75 8,250
1956 151 65.0 9,815 1.09 10,698 2006 22 115.0 2,530 3.20 8,096
1957 148 63.0 9,324 1.10 10,256 2007 31 110.0 3,410 4.00 13,640
1958 135 63.0 8,505 1.08 9,185 2008 40 120.0 4,800 4.80 23,040
1959 144 62.0 8,928 1.13 10,089 2009 45 115.0 5,175 3.74 19,355
2010 44 125.0 5,500 3.82 21,010
2011 64 125.0 8,000 4.70 37,600

16
0 20 40 60 80
100 120 140 160 180 200 220 240 260 280
19
10
1
91
3
19
16
1
91
9
19
22
19
25
19
28
19
31
19
34
19
37
19
40
19
43
19
46
19
49
19
52
19
55
19
58
19
61
1
96
4
19
67
1
97
0
19
73
19
76
19
79
19
82
19
85
19
88
19
91
19
94
19
97
20
00
20
03
2
00
6
20
09
Arizona Barley Harvested Acres
(000) Acres
0 10 20 30 40 50 60 70 80 90
100 110 120 130
19
10
19
13
19
16
19
19
19
22
19
25
19
28
19
31
19
34
19
37
19
40
19
43
19
46
19
49
19
52
19
55
19
58
19
61
19
64
19
67
19
70
19
73
19
76
19
79
19
82
19
85
19
88
19
91
19
94
19
97
20
00
20
03
20
06
20
09
Arizona Barley Yield per Acre
Bushels

17
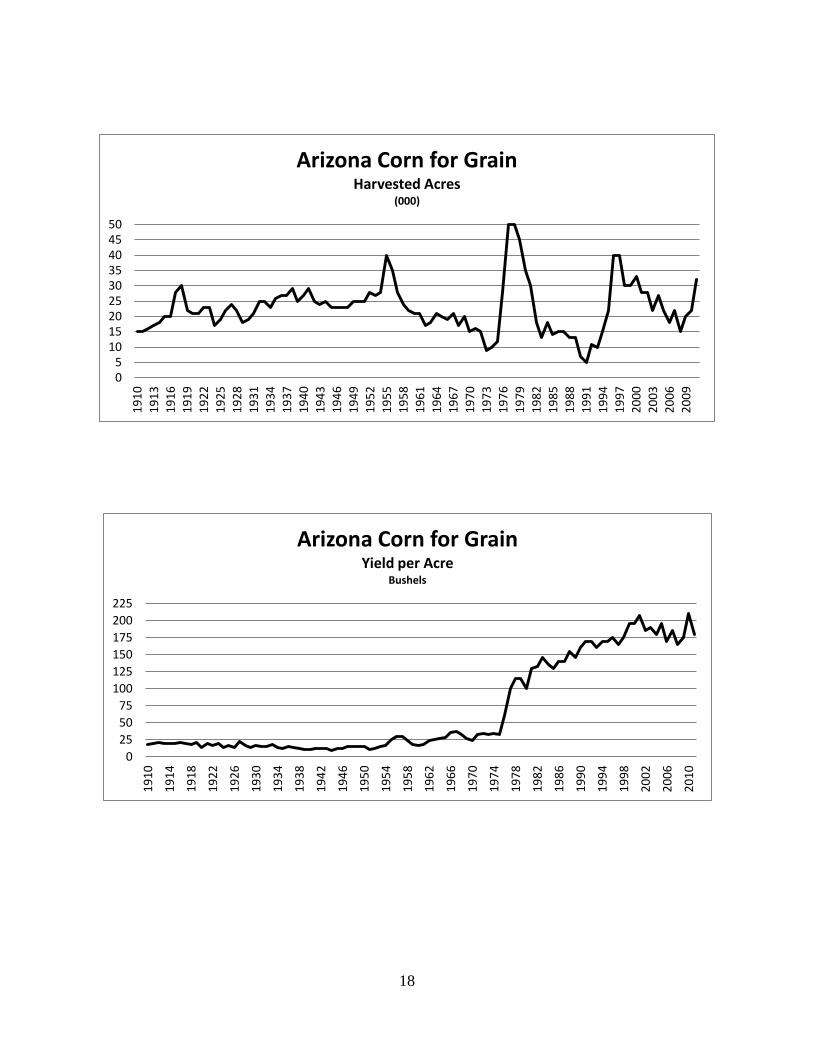
Historic Data: Corn For Grain, Arizona
Year
HV Acres (000)
Yield Bu
Prod’n Bushels
(000)
Price Per
Bushel Value
($ 000) Year
HV Acres (000)
Yield Bu
Prod’n Bushels
(000)
Price Per
Bushel Value
($ 000)
1910 15 18.0 270 1.08 292 1960 21 16.5 346 1.49 516
1911 15 19.0 285 1.01 288 1961 21 18.0 378 1.50 567
1912 16 21.0 336 0.99 333 1962 17 24.0 408 1.49 608
1913 17 19.0 323 1.18 381 1963 18 25.0 450 1.58 711
1914 18 20.0 360 1.15 414 1964 21 27.0 567 1.60 907
1915 20 19.0 380 1.12 429 1965 20 28.0 560 1.53 857
1916 20 21.5 430 1.43 615 1966 19 36.0 684 1.58 1,081
1917 28 19.0 532 1.95 1,037 1967 21 37.0 777 1.35 1,049
1918 30 18.0 540 2.27 1,226 1968 17 32.0 544 1.48 805
1919 22 21.0 462 2.01 929 1969 20 27.0 540 1.47 794
1920 21 13.0 273 1.54 420 1970 15 24.0 360 1.68 605
1921 21 19.0 399 1.15 459 1971 16 32.0 512 1.29 660
1922 23 17.0 391 1.18 461 1972 15 35.0 525 1.70 893
1923 23 19.0 437 1.11 485 1973 9 32.0 288 2.80 806
1924 17 13.3 226 1.45 328 1974 10 34.0 340 3.70 1,258
1925 19 16.0 304 1.21 368 1975 12 33.0 396 3.20 1,267
1926 22 14.0 308 1.17 360 1976 28 60.0 1,680 2.60 4,368
1927 24 23.0 552 1.26 696 1977 50 100.0 5,000 2.20 11,000
1928 22 17.0 374 1.49 557 1978 50 115.0 5,750 2.50 14,375
1929 18 14.0 252 1.35 340 1979 45 115.0 5,175 3.14 16,250
1930 19 17.0 323 1.05 339 1980 35 100.0 3,500 3.90 13,650
1931 21 15.0 315 0.76 239 1981 30 130.0 3,900 3.05 11,895
1932 25 15.0 375 0.69 259 1982 18 132.0 2,376 3.25 7,722
1933 25 18.0 450 0.75 338 1983 13 145.0 1,885 3.80 7,163
1934 23 13.5 310 1.06 329 1984 18 135.0 2,430 3.14 7,630
1935 26 12.0 312 0.83 259 1985 14 130.0 1,820 2.83 5,151
1936 27 15.0 405 1.12 454 1986 15 140.0 2,100 2.35 4,935
1937 27 13.0 351 0.86 302 1987 15 140.0 2,100 2.29 4,809
1938 29 12.0 348 0.79 275 1988 13 155.0 2,015 3.15 6,347
1939 25 10.9 272 0.84 228 1989 13 145.0 1,885 3.00 5,655
1940 27 11.0 297 0.80 238 1990 7 160.0 1,120 3.15 3,528
1941 29 11.5 334 0.92 307 1991 5 170.0 850 2.80 2,380
1942 25 11.5 288 1.11 320 1992 11 170.0 1,870 2.75 5,143
1943 24 11.5 276 1.50 414 1993 10 160.0 1,600 3.11 4,976
1944 25 9.2 230 1.57 361 1994 15 170.0 2,550 3.25 8,288
1945 23 12.0 276 1.71 472 1995 22 170.0 3,740 3.70 13,838
1946 23 12.0 276 2.03 560 1996 40 175.0 7,000 3.65 25,550
1947 23 15.5 356 2.79 993 1997 40 165.0 6,600 3.20 21,120
1948 23 15.5 356 2.12 755 1998 30 175.0 5,250 2.75 14,438
1949 25 15.5 388 1.87 726 1999 30 195.0 5,850 2.72 15,912
1950 25 15.0 375 2.04 765 2000 33 196.0 6,468 2.78 17,981
1951 25 10.5 262 2.39 626 2001 28 208.0 5,824 2.79 16,249
1952 28 12.5 350 2.01 704 2002 28 185.0 5,180 3.14 16,265
1953 27 15.0 405 1.97 798 2003 22 190.0 4,180 3.28 13,710
1954 28 16.0 448 1.90 851 2004 27 180.0 4,860 3.03 14,726
1955 40 25.0 1,000 1.58 1,580 2005 22 195.0 4,290 3.18 13,642
1956 35 30.0 1,050 1.76 1,848 2006 18 170.0 3,060 4.37 13,372
1957 28 30.5 854 1.62 1,383 2007 22 185.0 4,070 5.03 20,472
1958 24 24.0 576 1.46 841 2008 15 165.0 2,475 5.80 14,355
1959 22 17.5 385 1.52 585 2009 20 175.0 3,500 4.14 14,490
2010 22 210.0 4,620 5.80 26,796
2011 32 180.0 5,760 6.60 38,016
18
0 5
10 15 20 25 30 35 40 45 50
19
10
19
13
19
16
19
19
19
22
19
25
19
28
19
31
19
34
19
37
19
40
19
43
19
46
19
49
19
52
19
55
19
58
19
61
19
64
19
67
19
70
19
73
19
76
19
79
19
82
19
85
19
88
19
91
19
94
19
97
20
00
20
03
20
06
20
09
Arizona Corn for Grain Harvested Acres
(000)
0
25
50
75
100
125
150
175
200
225
19
10
19
14
19
18
19
22
19
26
19
30
19
34
19
38
19
42
19
46
19
50
19
54
19
58
19
62
19
66
19
70
19
74
19
78
19
82
19
86
19
90
19
94
19
98
20
02
20
06
20
10
Arizona Corn for Grain Yield per Acre
Bushels
19
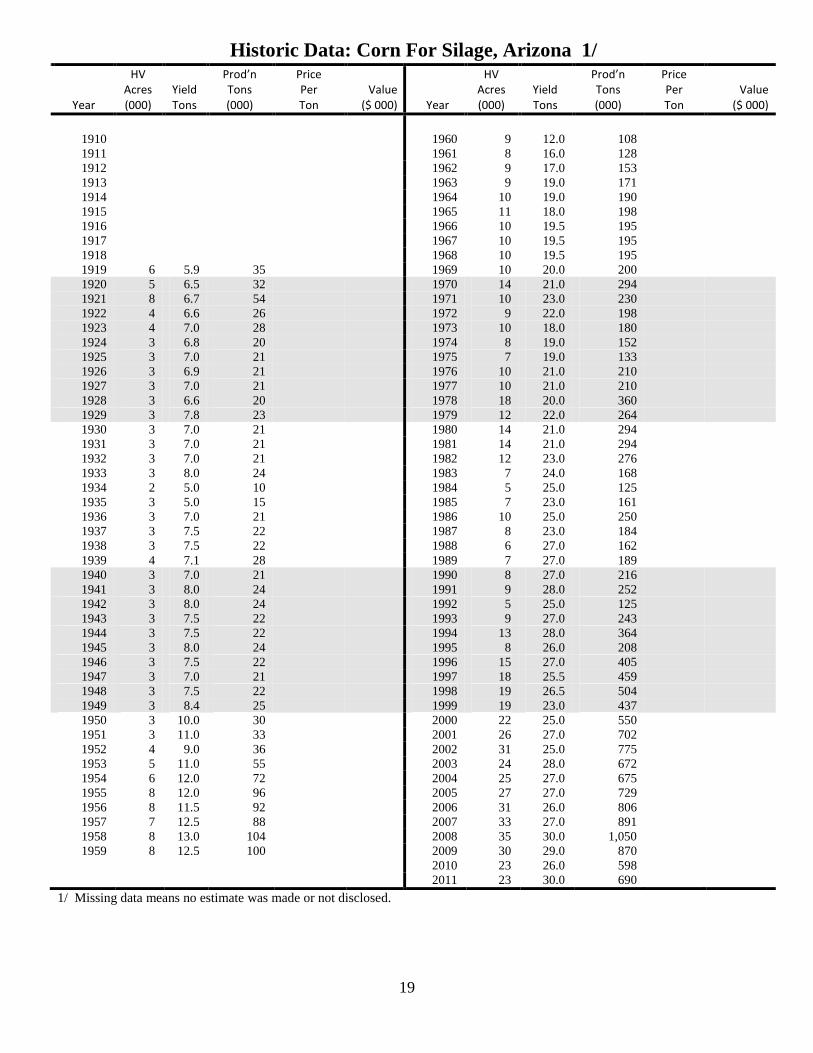
Historic Data: Corn For Silage, Arizona 1/
Year
HV Acres (000)
Yield Tons
Prod’n Tons (000)
Price Per Ton
Value ($ 000) Year
HV Acres (000)
Yield Tons
Prod’n Tons (000)
Price Per Ton
Value ($ 000)
1910
1960 9 12.0 108
1911
1961 8 16.0 128
1912
1962 9 17.0 153
1913
1963 9 19.0 171
1914
1964 10 19.0 190
1915
1965 11 18.0 198
1916
1966 10 19.5 195
1917
1967 10 19.5 195
1918
1968 10 19.5 195
1919 6 5.9 35
1969 10 20.0 200
1920 5 6.5 32
1970 14 21.0 294
1921 8 6.7 54
1971 10 23.0 230
1922 4 6.6 26
1972 9 22.0 198
1923 4 7.0 28
1973 10 18.0 180
1924 3 6.8 20
1974 8 19.0 152
1925 3 7.0 21
1975 7 19.0 133
1926 3 6.9 21
1976 10 21.0 210
1927 3 7.0 21
1977 10 21.0 210
1928 3 6.6 20
1978 18 20.0 360
1929 3 7.8 23
1979 12 22.0 264
1930 3 7.0 21
1980 14 21.0 294
1931 3 7.0 21
1981 14 21.0 294
1932 3 7.0 21
1982 12 23.0 276
1933 3 8.0 24
1983 7 24.0 168
1934 2 5.0 10
1984 5 25.0 125
1935 3 5.0 15
1985 7 23.0 161
1936 3 7.0 21
1986 10 25.0 250
1937 3 7.5 22
1987 8 23.0 184
1938 3 7.5 22
1988 6 27.0 162
1939 4 7.1 28
1989 7 27.0 189
1940 3 7.0 21
1990 8 27.0 216
1941 3 8.0 24
1991 9 28.0 252
1942 3 8.0 24
1992 5 25.0 125
1943 3 7.5 22
1993 9 27.0 243
1944 3 7.5 22
1994 13 28.0 364
1945 3 8.0 24
1995 8 26.0 208
1946 3 7.5 22
1996 15 27.0 405
1947 3 7.0 21
1997 18 25.5 459
1948 3 7.5 22
1998 19 26.5 504
1949 3 8.4 25
1999 19 23.0 437
1950 3 10.0 30
2000 22 25.0 550
1951 3 11.0 33
2001 26 27.0 702
1952 4 9.0 36
2002 31 25.0 775
1953 5 11.0 55
2003 24 28.0 672
1954 6 12.0 72
2004 25 27.0 675
1955 8 12.0 96
2005 27 27.0 729
1956 8 11.5 92
2006 31 26.0 806
1957 7 12.5 88
2007 33 27.0 891
1958 8 13.0 104
2008 35 30.0 1,050
1959 8 12.5 100
2009 30 29.0 870
2010 23 26.0 598
2011 23 30.0 690
1/ Missing data means no estimate was made or not disclosed.
20
0
5
10
15
20
25
30
35
19
19
19
22
19
25
19
28
19
31
19
34
19
37
19
40
19
43
19
46
19
49
19
52
19
55
19
58
19
61
19
64
19
67
19
70
19
73
19
76
19
79
19
82
19
85
19
88
19
91
19
94
19
97
20
00
20
03
20
06
20
09
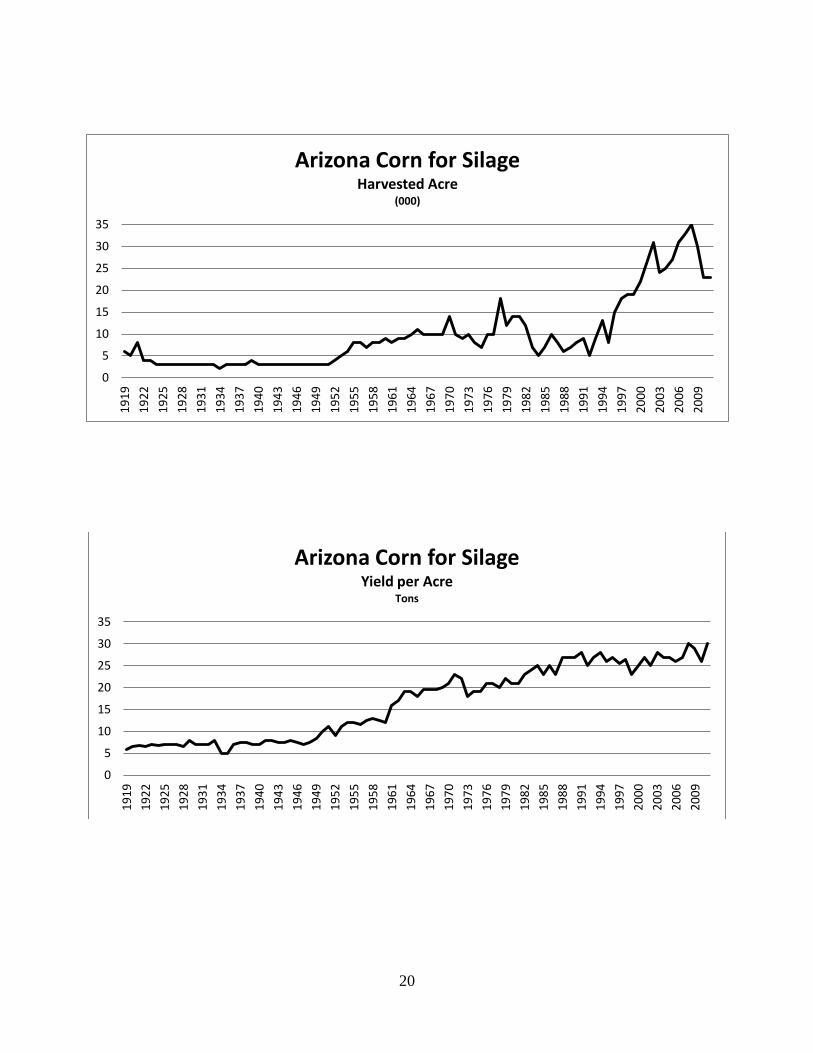
Arizona Corn for Silage Harvested Acre
(000)
0
5
10
15
20
25
30
35
19
19
19
22
19
25
19
28
19
31
19
34
19
37
19
40
19
43
19
46
19
49
19
52
19
55
19
58
19
61
19
64
19
67
19
70
19
73
19
76
19
79
19
82
19
85
19
88
19
91
19
94
19
97
20
00
20
03
20
06
20
09
Arizona Corn for Silage Yield per Acre
Tons

21
Historic Data: Sorghum For Grain, Arizona 1/
Year
HV Acres (000)
Yield Bu
Prod’n Bushels
(000)
Price Per Cwt
Value ($ 000) Year
HV Acres (000)
Yield Bu
Prod’n Bushels
(000)
Price Per Cwt
Value ($ 000)
1910
1960 117.0 58.0 6,786 2.00 7,600
1911
1961 115.0 71.0 8,165 2.02 9,226
1912
1962 98.0 65.0 6,370 2.07 7,389
1913
1963 104.0 72.0 7,488 2.18 9,135
1914
1964 123.0 75.5 9,286 2.25 11,700
1915
1965 166.0 75.0 12,450 2.20 15,314
1916
1966 195.0 77.0 15,015 2.12 17,868
1917
1967 246.0 81.0 19,926 2.09 23,313
1918
1968 216.0 79.0 17,064 2.04 19,453
1919 34.0 26.0 884 2.56 1,264 1969 175.0 75.0 13,125 2.36 17,325
1920 21.0 21.0 441 1.38 340 1970 163.0 70.0 11,410 2.54 16,202
1921 29.0 25.0 725 1.27 515 1971 129.0 73.0 9,417 2.36 12,430
1922 21.0 25.0 525 1.90 556 1972 107.0 78.0 8,346 3.08 14,355
1923 22.0 26.0 572 1.90 606 1973 111.0 72.0 7,992 5.06 22,617
1924 11.0 24.0 264 2.36 348 1974 110.0 78.0 8,580 6.13 29,429
1925 12.0 21.0 252 1.25 176 1975 100.0 68.0 6,800 5.21 19,856
1926 13.0 22.0 286 1.18 189 1976 40.0 73.0 2,920 4.28 7,008
1927 16.0 22.0 352 1.58 310 1977 30.0 80.0 2,400 3.67 4,944
1928 16.0 29.0 464 1.49 385 1978 25.0 78.0 1,950 4.61 5,031
1929 12.0 26.0 312 1.75 306 1979 25.0 71.0 1,775 5.72 5,680
1930 16.0 31.0 496 1.16 322 1980 26.0 80.0 2,080 6.67 7,779
1931 26.0 27.0 702 0.70 274 1981 26.0 78.0 2,028 5.69 6,469
1932 28.0 26.0 728 0.66 269 1982 15.0 79.0 1,185 5.23 3,472
1933 32.0 31.0 992 0.93 516 1983 13.0 76.0 988 6.50 3,596
1934 25.0 27.0 675 1.47 554 1984 16.0 85.0 1,360 5.85 4,461
1935 30.0 28.0 840 1.11 521 1985 16.0 81.0 1,296 5.15 3,732
1936 22.0 26.5 583 1.56 507 1986 12.0 87.0 1,044 4.10 2,401
1937 25.0 29.0 725 1.06 428 1987 11.0 90.0 990 4.17 2,317
1938 23.0 30.0 690 0.86 331 1988 4.0 100.0 400 5.50 1,232
1939 16.0 34.0 544 1.27 386 1989 3.0 80.0 240 5.05 679
1940 21.0 26.5 556 1.11 345 1990 1.0
61
193
1941 46.0 33.0 1,518 1.34 1,138 1991 1.5
107
330
1942 30.0 35.0 1,050 1.63 956 1992 10.0
714
2,640
1943 36.0 36.0 1,296 2.40 1,737 1993 20.0
1,071
4,200
1944 54.0 37.2 2,009 1.81 2,029 1994 15.0
696
3,510
1945 44.0 34.0 1,496 2.47 2,064 1995 12.0
857
1946 55.0 36.0 1,980 2.38 2,633 1996 45.0
3,375
1947 53.0 41.0 2,173 3.79 4,607 1997 22.0
982
1948 75.0 40.0 3,000 2.47 4,140 1998 14.0
982
1949 61.0 44.6 2,721 2.29 3,483 1999 5.0
286
1950 80.0 44.0 3,520 2.36 4,646 2000 9.0 80.0 720 4.45 1,794
1951 26.0 42.0 1,092 3.21 1,966 2001 6.0 80.0 480 4.00 1,075
1952 34.0 46.0 1,564 3.23 2,831 2002 6.0 70.0 420 4.60 1,082
1953 41.0 46.0 1,886 2.63 2,772 2003 6.0 90.0 540 4.80 1,452
1954 112.0 49.5 5,544 2.45 7,595 2004 6.0 90.0 540 4.80 1,452
1955 129.0 51.0 6,579 2.07 7,632 2005 7.0 95.0 665 5.00 1,862
1956 94.0 45.0 4,230 2.54 6,007 2006 7.0 90.0 630 7.80 2,752
1957 109.0 54.0 5,886 2.23 7,358 2007 20.0 90.0 1,800 8.60 8,669
1958 100.0 51.0 5,100 2.07 5,916 2008 27.0 90.0 2,430 9.40 12,792
1959 110.0 57.5 6,325 2.05 7,274 2009 8.0 85.0 680 6.20 2,361
2010 6.0 120.0 720 9.10 3,669
2011 6.0 100.0 600 12.50 4,200
1/ Missing data means no estimate was made or not disclosed.

22
Not in Federal Program 1990 – 1999. Acreage estimates from other sources.
Yields not estimated 1990 – 1999.
0 20 40 60 80
100 120 140 160 180 200 220 240
19
19
19
22
19
25
19
28
19
31
19
34
19
37
19
40
19
43
19
46
19
49
19
52
19
55
19
58
19
61
19
64
19
67
19
70
19
73
19
76
19
79
19
82
19
85
19
88
19
91
19
94
19
97
20
00
20
03
20
06
20
09
Arizona Sorghum for Grain Harvested Acres
(000)
0 10 20 30 40 50 60 70 80 90
100 110 120
19
19
19
22
19
25
19
28
19
31
19
34
19
37
19
40
19
43
19
46
19
49
19
52
19
55
19
58
19
61
19
64
19
67
19
70
19
73
19
76
19
79
19
82
19
85
19
88
19
91
19
94
19
97
20
00
20
03
20
06
20
09
Arizona Sorghum for Grain Yield per Acre
Bushels

23
Historic Data: Sorghum For Silage, Arizona 1/
Year
HV Acres (000)
Yield Tons
Prod’n Tons (000)
Price Per Ton
Value ($ 000) Year
HV Acres (000)
Yield Tons
Prod’n Tons (000)
Price Per Ton
Value ($ 000)
1910
1960 39.0 17.0 663
1911
1961 24.0 17.5 420
1912
1962 23.0 16.5 380
1913
1963 30.0 17.0 510
1914
1964 18.0 18.0 324
1915
1965 14.0 19.0 266
1916
1966 8.0 19.5 156
1917
1967 4.0 20.5 82
1918
1968 3.0 18.0 54
1919
1969 8.0 18.0 144
1920
1970 10.0 18.0 180
1921
1971 7.0 15.0 105
1922
1972 7.0 14.0 98
1923
1973 5.0 14.0 70
1924
1974 5.0 14.0 70
1925
1975 6.0 16.0 96
1926
1976 5.0 16.5 83
1927
1977 6.0 17.0 102
1928
1978 5.0 17.0 85
1929 6.0 9.0 54
1979 4.0 17.0 68
1930 8.0 10.0 80
1980 6.0 18.5 111
1931 8.0 9.0 72
1981 3.0 22.0 66
1932 7.0 9.0 63
1982 4.0 19.5 78
1933 10.0 10.0 100
1983 5.0 16.0 80
1934 8.0 9.0 72
1984 2.0 20.0 40
1935 10.0 9.5 95
1985 2.0 24.0 48
1936 10.0 9.0 90
1986 3.0 19.0 57
1937 11.0 9.5 104
1987 3.0 18.0 54
1938 8.0 10.0 80
1988 1.0 17.0 17
1939 6.0 10.0 60
1989 3.0 20.0 60
1940 6.0 11.0 66
1990 1.0
20
1941 6.0 10.0 60
1991 3.0
75
1942 7.0 11.0 77
1992 3.0
75
1943 6.0 10.0 60
1993 3.0
75
1944 9.0 12.0 108
1994 5.0
75
1945 6.0 11.5 69
1995 8.0
160
1946 12.0 11.5 138
1996 6.0
120
1947 4.0 11.0 44
1997 1.6
27
1948 10.0 11.0 110
1998 2.8
53
1949 11.0 11.5 126
1999 4.1
70
1950 11.0 10.0 110
2000 7.0 15.0 105
1951 9.0 11.5 104
2001 6.0 19.0 114
1952 10.0 12.0 120
2002 9.0 20.0 180
1953 9.0 13.0 117
2003 11.0 23.0 253
1954 25.0 12.5 312
2004 12.0 20.0 240
1955 32.0 13.5 432
2005 15.0 20.0 300
1956 43.0 14.0 602
2006 17.0 21.0 357
1957 50.0 14.0 700
2007 21.0 19.0 399
1958 45.0 14.5 652
2008 30.0 19.0 570
1959 36.0 14.5 522
2009 27.0 20.0 540
2010 18.0 22.0 396
2011 15.0 22.0 330
1/ Missing data means no estimate was made or not disclosed.

24
Not in Federal Program 1990 – 1999. Yields were not estimated.
0 5
10 15 20 25 30 35 40 45 50
19
29
19
32
19
35
19
38
19
41
19
44
19
47
19
50
19
53
19
56
19
59
19
62
19
65
19
68
19
71
19
74
19
77
19
80
19
83
19
86
19
89
19
92
19
95
19
98
20
01
20
04
20
07
20
10
Arizona Sorghum for Silage Harvested Acres
(000)
0 2 4 6 8
10 12 14 16 18 20 22 24
19
29
19
32
19
35
19
38
19
41
19
44
19
47
19
50
19
53
19
56
19
59
19
62
19
65
19
68
19
71
19
74
19
77
19
80
19
83
19
86
19
89
19
92
19
95
19
98
20
01
20
04
20
07
20
10
Arizona Sorghum for Silage Yield per Acre
Tons

25
Historic Data: Potatoes, Arizona 1/
Year
HV Acres (000)
Yield Cwt
Prod’n Cwt
(000)
Price Per Cwt
Value ($ 000) Year
HV Acres (000)
Yield Cwt
Prod’n Cwt
(000)
Price Per Cwt
Value ($ 000)
1910 1.0 45 45 1.82 82 1960 9.8 240 2,352 2.57 6,045
1911 1.0 50 50 2.62 132 1961 10.3 240 2,472 2.35 5,809
1912 1.0 58 58 1.97 114 1962 8.5 240 2,040 2.86 5,834
1913 2.0 45 90 2.33 210 1963 9.6 255 2,448 2.24 5,484
1914 2.0 53 107 2.07 221 1964 8.2 240 1,968 3.87 7,616
1915 2.0 50 101 2.03 205 1965 11.0 210 2,310 4.18 9,656
1916 2.0 55 109 3.00 328 1966 12.5 230 2,875 2.31 6,641
1917 4.0 55 218 3.17 692 1967 10.9 250 2,725 2.53 6,894
1918 5.0 43 216 2.83 612 1968 10.1 230 2,323 3.15 7,317
1919 3.0 42 126 3.73 470 1969 12.8 230 2,944 2.90 8,538
1920 4.0 54 216 3.72 803 1970 11.3 240 2,712 3.13 8,489
1921 4.0 69 276 2.68 741 1971 10.1 280 2,828 2.74 7,749
1922 5.0 51 255 2.17 552 1972 8.0 300 2,400 2.85 6,840
1923 4.0 36 144 2.37 341 1973 9.9 210 2,079 5.05 10,499
1924 3.0 32 97 3.33 324 1974 8.6 260 2,236 5.25 11,739
1925 3.0 34 103 4.08 419 1975 6.2 245 1,519 6.00 9,114
1926 4.0 36 144 3.37 485 1976 6.8 270 1,836 5.06 9,290
1927 4.0 54 216 2.97 641 1977 6.5 270 1,755 5.12 8,986
1928 3.0 44 133 2.40 320 1978 6.0 265 1,590 8.15 12,959
1929 2.0 63 126 3.32 418 1979 6.2 210 1,302 4.40 5,729
1930 2.2 72 158 2.62 414 1980 4.4 290 1,276 5.25 6,699
1931 2.6 63 164 1.77 289 1981 5.2 280 1,456 7.55 10,993
1932 2.6 69 179 1.47 263 1982 4.7 305 1,434 6.55 9,393
1933 2.8 75 210 1.97 413 1983 4.9 260 1,274 6.75 8,600
1934 1.8 63 113 1.73 197 1984 5.4 305 1,647 9.20 15,152
1935 1.3 72 94 1.45 136 1985 5.8 250 1,450 8.45 12,253
1936 1.2 81 97 1.83 178 1986 5.9 220 1,298 7.30 9,475
1937 1.3 72 94 1.50 140 1987 4.9 275 1,348 10.50 14,154
1938 1.3 78 101 1.22 123 1988 5.3 235 1,246 9.35 11,650
1939 1.5 79 118 1.40 165 1989 5.8 315 1,827 8.30 15,164
1940 1.6 90 144 1.53 221 1990 6.9 260 1,794 8.50 15,249
1941 2.1 78 164 1.72 281 1991 6.0 295 1,770 10.40 18,408
1942 2.5 135 337 2.22 747 1992 6.1 295 1,800 6.20 11,160
1943 6.0 132 792 2.87 2,270 1993 5.5 270 1,485 8.25 12,251
1944 5.2 148 767 2.67 2,046 1994 6.3 265 1,670 7.35 12,275
1945 5.9 149 881 3.15 2,776 1995 6.5 270 1,755 7.65 13,426
1946 6.2 173 1,072 2.32 2,483 1996 9.0 275 2,475 10.20 25,245
1947 5.3 182 964 3.43 3,308 1997 6.5 280 1,820 8.75 15,925
1948 5.2 192 998 3.13 3,128 1998 8.1 280 2,268 11.30 25,628
1949 4.2 170 714 3.27 2,335 1999 9.6 315 3,024 9.05 27,367
1950 4.9 215 1,054 2.16 2,277 2000 9.0 280 2,520 10.60 26,712
1951 3.8 220 836 2.66 2,224 2001 8.2 270 2,214 15.50 34,317
1952 4.0 225 900 4.18 3,762 2002 7.8 270 2,106 13.40 28,220
1953 5.7 250 1,425 1.86 2,650 2003 7.6 275 2,090 10.20 21,318
1954 4.5 230 1,035 2.53 2,619 2004 6.2 285 1,767 10.70 18,907
1955 5.3 255 1,352 2.39 3,231 2005 4.3 275 1,183 11.50 13,599
1956 4.3 250 1,075 4.50 4,838 2006 3.9 300 1,170 13.40 15,678
1957 6.5 265 1,722 1.86 3,203 2007 4.0 280 1,120 9.70 10,864
1958 9.6 185 1,776 2.64 4,689 2008 3.5 300 1,050 15.10 15,855
1959 7.8 250 1,950 4.11 8,014 2009 4.0 280 1,120 14.80 16,576
2010 3.7 280 1,036 16.20 16,783
2011 3.8 280 1,064
1/ Missing data means no estimate was made or not disclosed.

26
0 1 2 3 4 5 6 7 8 9
10 11 12 13
19
10
19
13
19
16
19
19
19
22
19
25
19
28
19
31
19
34
19
37
19
40
19
43
19
46
19
49
19
52
19
55
19
58
19
61
19
64
19
67
19
70
19
73
19
76
19
79
19
82
19
85
19
88
19
91
19
94
19
97
20
00
20
03
20
06
20
09
Arizona Potatoes Harvested Acres
(000)
0
50
100
150
200
250
300
350
19
10
19
14
19
18
19
22
19
26
19
30
19
34
19
38
19
42
19
46
19
50
19
54
19
58
19
62
19
66
19
70
19
74
19
78
19
82
19
86
19
90
19
94
19
98
20
02
20
06
20
10
Arizona Potatoes Yield per Acre
Cwt

27
Historic Acreage Data: Vegetables, Arizona 1/
Year
Head Lettuce Harvest Acres
Cabbage Harvest Acres
Broccoli Harvest Acres
Cauliflower Harvest Acres Year
Head Lettuce Harvest Acres
Cabbage Harvest Acres
Broccoli Harvest Acres
Cauliflower Harvest Acres
1910
1960 56,500 950 400 420
1911
1961 57,000
1,000 550 600
1912
1962 53,600
1,300 800 450
1913
1963 56,200
1,500 700 600
1914
1964 58,100
1,600 500 600
1915
1965 55,900
1,200 320 600
1916
1966 55,300
1,500 380 700
1917
1967 47,200
1,600 460 650
1918
1968 45,400
1,900 650 650
1919
1969 49,200
630 850 1,020
1920
1970 50,900
310 1,140 740
1921
1971 45,200
270 1,020 790
1922
1972 46,100
320 1,000 1,150
1923
1973 46,100
290 840 950
1924
1974 42,900
350 700 800
1925
1975 38,800
150 600 1,150
1926
1976 37,300
650 1,000
1927
180 1977 37,900
850 1,400
1928
200 1978 42,500
800 1,250
1929
150
300 1979 45,600
1,050 2,150
1930
180
300 1980 35,000
750 2,200
1931
270
680 1981 29,600
720 2,200
1932
300
880 1982 34,300
800 2,200
1933
230
1,000 1983 30,300
700 2,900
1934
310
680 1984 38,000
1,300 4,000
1935
420
300 1985 45,300
1,900 4,900
1936
290
300 1986 38,400
2,900 6,100
1937
500
200 1987 40,900
4,200 6,400
1938
440
450 1988 49,000
4,300 6,100
1939 37,900
550 400 800 1989 50,900
5,400 6,800
1940 33,900
630 450 350 1990 50,500
5,100 6,400
1941 38,300
500 600 430 1991 49,000
6,500 5,800
1942 39,500
630 1,100 960 1992 49,300
7,000 7,000
1943 33,200
960 1,400 1,500 1993 49,400
8,700 6,500
1944 38,000
2,200 1,900 2,200 1994 51,500
9,400 5,700
1945 41,300
1,600 2,000 1,600 1995 44,100
8,600 4,500
1946 47,000
1,500 2,600 2,900 1996 59,400
10,000 4,400
1947 43,700
900 2,100 2,700 1997 53,900
11,000 3,900
1948 42,300
1,500 1,600 2,400 1998 55,100
12,300 3,400
1949 40,700
1,000 1,400 1,500 1999 46,600
17,100 3,900
1950 44,800
900 1,000 1,600 2000 51,800
1,900 11,300 4,200
1951 42,600
1,300 800 1,000 2001 53,300
2,900 11,100 4,500
1952 41,200
800 600 850 2002 50,800
3,800 11,900 4,600
1953 38,400
1,500 650 750 2003 50,400
3,400 11,600 4,200
1954 33,200
1,100 600 500 2004 47,000
3,400 9,900 4,700
1955 37,100
700 500 210 2005 50,000
3,000 11,900 4,600
1956 46,000
1,100 500 230 2006 46,800
2,900 11,900 4,500
1957 52,500
1,300 450 320 2007 39,900
2,700 11,900 4,000
1958 64,500
1,000 700 270 2008 32,700
2,800 10,900 4,000
1959 62,000 1,100 500 320 2009 32,000
2,300 9,000 3,200
2010 34,000
2,100 7,200 3,000
2011 36,000 2,500 7,200 3,000
1/ Missing data means no estimate was made.

28
25,000
30,000
35,000
40,000
45,000
50,000
55,000
60,000
65,000
19
39
19
42
19
45
19
48
19
51
19
54
19
57
19
60
19
63
19
66
19
69
19
72
19
75
19
78
19
81
19
84
19
87
19
90
19
93
19
96
19
99
20
02
20
05
20
08
20
11
Arizona Head Lettuce Harvested Acres
-
2,000
4,000
6,000
8,000
10,000
12,000
14,000
16,000
18,000
19
39
19
42
19
45
19
48
19
51
19
54
19
57
19
60
19
63
19
66
19
69
19
72
19
75
19
78
19
81
19
84
19
87
19
90
19
93
19
96
19
99
20
02
20
05
20
08
20
11
Arizona Broccoli Harvested Acres
-
1,000
2,000
3,000
4,000
5,000
6,000
7,000
19
27
19
30
19
33
19
36
19
39
19
42
19
45
19
48
19
51
19
54
19
57
19
60
19
63
19
66
19
69
19
72
19
75
19
78
19
81
19
84
19
87
19
90
19
93
19
96
19
99
20
02
20
05
20
08
20
11
Arizona Cauliflower Harvested Acres

29
Historic Acreage Data: Melons, Arizona 1/
Year
Water-melon
Harvest Acres
Canta-loupe
Harvest Acres
Honeydew Harvest Acres
Year
Water-melon
Harvest Acres
Canta-loupe
Harvest Acres
Honeydew Harvest Acres
1910
1960 4,600
15,300
850
1911
1961 4,600
16,300
950
1912
1962 4,500
18,200
550
1913
1963 4,400
17,800
600
1914
1964 4,400
20,500
1,000
1915
1965 4,500
17,450
700
1916
1966 3,600
16,000
1,100
1917
1967 3,400
12,450
1,300
1918 800
1968 4,000
14,000
750
1919 850
1969 5,100
15,900
1,200
1920 500
1970 4,300
10,410
1,100
1921 1,200
1971 3,900
11,700
1,200
1922 1,200
1972 4,500
11,150
1,200
1923 900
1973 4,300
9,300
1,300
1924 1,230
1974 2,100
7,600
1,000
1925 1,100
1975 2,900
7,800
1,070
1926 1,200
1976 3,200
8,600
2,100
1927 1,200
1977 3,800
10,450
1,270
1928 1,000
3,000 1978 3,800
9,900
1,620
1929 1,100
1,000 1979 6,300
9,100
1,600
1930 1,040
1,100 1980 3,400
6,500
1,600
1931 1,000
200 1981 3,600
5,200
2,300
1932 960
300 1982 5,200
6,500
3,500
1933 860
1983 4,200
6,650
2,800
1934 900
100 1984 4,500
8,300
2,000
1935 1,080
200 1985 5,200
10,000
2,200
1936 940
500 1986 5,400
10,900
2,800
1937 900
8,500
1,000 1987 5,200
11,200
3,400
1938 1,600
8,400
1,000 1988 5,000
7,600
2,400
1939 2,000
8,900
1,200 1989 5,200
8,800
2,100
1940 1,600
10,300
1,400 1990 4,600
9,100
2,400
1941 1,800
13,500
2,500 1991 6,500
11,400
3,000
1942 2,500
12,100
1,300 1992 6,600
13,200
2,500
1943 2,700
9,300
1,700 1993 6,500
13,600
1,600
1944 3,900
11,200
2,800 1994 6,800
14,500
2,100
1945 2,200
14,600
3,200 1995 7,200
16,000
3,600
1946 4,000
16,900
4,000 1996 7,300
17,700
3,800
1947 3,500
20,100
3,200 1997 7,200
17,700
4,200
1948 4,400
25,000
4,000 1998 7,600
18,500
4,200
1949 5,500
21,600
2,600 1999 7,200
19,700
4,200
1950 5,000
22,200
2,300 2000 7,100
14,900
3,600
1951 5,200
23,900
2,700 2001 6,100
14,600
2,400
1952 4,100
14,200
2,200 2002 6,000
14,800
2,300
1953 5,000
23,300
2,700 2003 5,900
15,200
3,000
1954 6,000
21,500
3,300 2004 6,900
17,700
2,700
1955 4,900
23,200
2,900 2005 6,700
20,900
4,000
1956 5,000
19,600
2,700 2006 6,700
19,800
4,100
1957 5,800
12,500
750 2007 6,500
19,200
3,300
1958 7,400
22,600
1,900 2008 6,400
19,400
3,400
1959 6,200
19,300
400 2009 5,500
23,300
3,300
2010 5,300
20,800
3,100
2011 5,200
20,000
3,500
1/ Missing data means no estimate was made.

30
- 2,000 4,000 6,000 8,000
10,000 12,000 14,000 16,000 18,000 20,000 22,000 24,000
19
37
19
40
19
43
19
46
19
49
19
52
19
55
19
58
19
61
19
64
19
67
19
70
19
73
19
76
19
79
19
82
19
85
19
88
19
91
19
94
19
97
20
00
20
03
20
06
20
09
Arizona Cantaloupe Harvested Acres
-
1,000
2,000
3,000
4,000
5,000
6,000
7,000
8,000
19
18
19
22
19
26
19
30
19
34
19
38
19
42
19
46
19
50
19
54
19
58
19
62
19
66
19
70
19
74
19
78
19
82
19
86
19
90
19
94
19
98
20
02
20
06
20
10
Arizona Watermelon Harvested Acres
-
500
1,000
1,500
2,000
2,500
3,000
3,500
4,000
4,500
19
28
19
31
19
34
19
37
19
40
19
43
19
46
19
49
19
52
19
55
19
58
19
61
19
64
19
67
19
70
19
73
19
76
19
79
19
82
19
85
19
88
19
91
19
94
19
97
20
00
20
03
20
06
20
09
Arizona Honeydew Harvested Acres
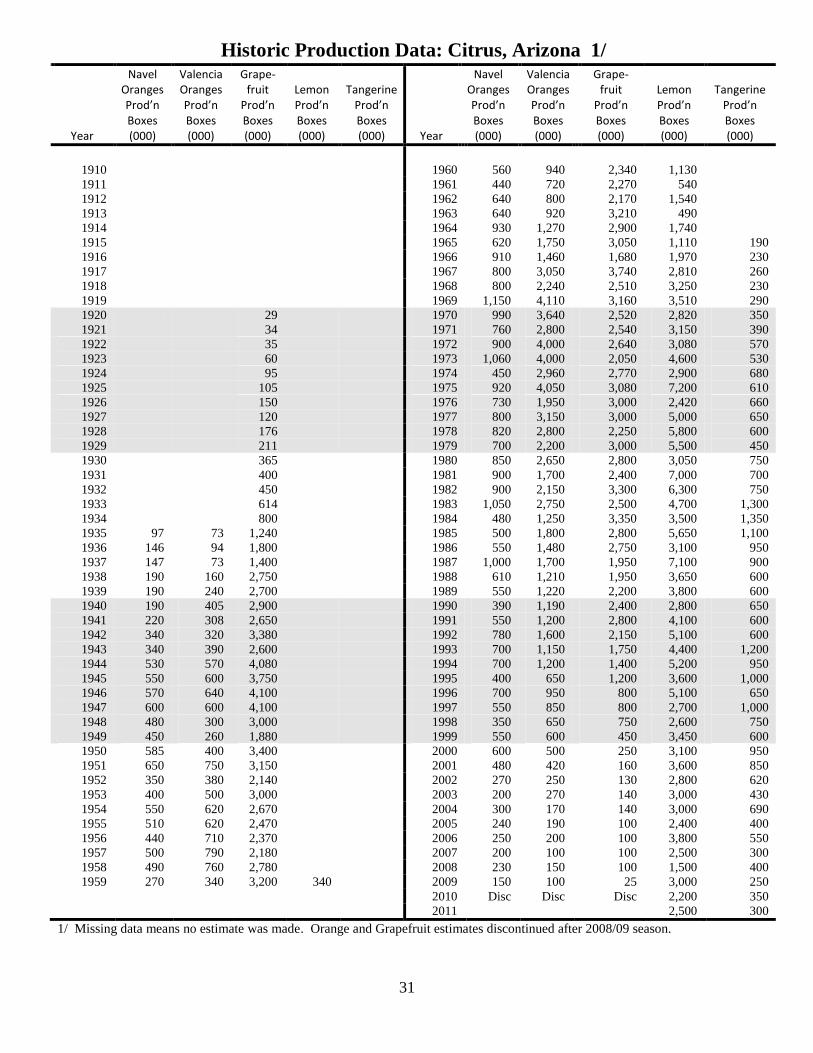
31
Historic Production Data: Citrus, Arizona 1/
Year
Navel Oranges Prod’n Boxes (000)
Valencia Oranges Prod’n Boxes (000)
Grape- fruit
Prod’n Boxes (000)
Lemon Prod’n Boxes (000)
Tangerine
Prod’n Boxes (000) Year
Navel Oranges Prod’n Boxes (000)
Valencia Oranges Prod’n Boxes (000)
Grape- fruit
Prod’n Boxes (000)
Lemon Prod’n Boxes (000)
Tangerine
Prod’n Boxes (000)
1910
1960 560 940 2,340 1,130
1911
1961 440 720 2,270 540
1912
1962 640 800 2,170 1,540
1913
1963 640 920 3,210 490
1914
1964 930 1,270 2,900 1,740
1915
1965 620 1,750 3,050 1,110 190
1916
1966 910 1,460 1,680 1,970 230
1917
1967 800 3,050 3,740 2,810 260
1918
1968 800 2,240 2,510 3,250 230
1919
1969 1,150 4,110 3,160 3,510 290
1920
29
1970 990 3,640 2,520 2,820 350
1921
34
1971 760 2,800 2,540 3,150 390
1922
35
1972 900 4,000 2,640 3,080 570
1923
60
1973 1,060 4,000 2,050 4,600 530
1924
95
1974 450 2,960 2,770 2,900 680
1925
105
1975 920 4,050 3,080 7,200 610
1926
150
1976 730 1,950 3,000 2,420 660
1927
120
1977 800 3,150 3,000 5,000 650
1928
176
1978 820 2,800 2,250 5,800 600
1929
211
1979 700 2,200 3,000 5,500 450
1930
365
1980 850 2,650 2,800 3,050 750
1931
400
1981 900 1,700 2,400 7,000 700
1932
450
1982 900 2,150 3,300 6,300 750
1933
614
1983 1,050 2,750 2,500 4,700 1,300
1934
800
1984 480 1,250 3,350 3,500 1,350
1935 97 73 1,240
1985 500 1,800 2,800 5,650 1,100
1936 146 94 1,800
1986 550 1,480 2,750 3,100 950
1937 147 73 1,400
1987 1,000 1,700 1,950 7,100 900
1938 190 160 2,750
1988 610 1,210 1,950 3,650 600
1939 190 240 2,700
1989 550 1,220 2,200 3,800 600
1940 190 405 2,900
1990 390 1,190 2,400 2,800 650
1941 220 308 2,650
1991 550 1,200 2,800 4,100 600
1942 340 320 3,380
1992 780 1,600 2,150 5,100 600
1943 340 390 2,600
1993 700 1,150 1,750 4,400 1,200
1944 530 570 4,080
1994 700 1,200 1,400 5,200 950
1945 550 600 3,750
1995 400 650 1,200 3,600 1,000
1946 570 640 4,100
1996 700 950 800 5,100 650
1947 600 600 4,100
1997 550 850 800 2,700 1,000
1948 480 300 3,000
1998 350 650 750 2,600 750
1949 450 260 1,880
1999 550 600 450 3,450 600
1950 585 400 3,400
2000 600 500 250 3,100 950
1951 650 750 3,150
2001 480 420 160 3,600 850
1952 350 380 2,140
2002 270 250 130 2,800 620
1953 400 500 3,000
2003 200 270 140 3,000 430
1954 550 620 2,670
2004 300 170 140 3,000 690
1955 510 620 2,470
2005 240 190 100 2,400 400
1956 440 710 2,370
2006 250 200 100 3,800 550
1957 500 790 2,180
2007 200 100 100 2,500 300
1958 490 760 2,780
2008 230 150 100 1,500 400
1959 270 340 3,200 340
2009 150 100 25 3,000 250
2010 Disc Disc Disc 2,200 350
2011
2,500 300
1/ Missing data means no estimate was made. Orange and Grapefruit estimates discontinued after 2008/09 season.

32
-
1,000
2,000
3,000
4,000
5,000
6,000
7,000
8,000 1
95
9
19
61
19
63
19
65
19
67
19
69
19
71
19
73
19
75
19
77
19
79
19
81
19
83
19
85
19
87
19
89
19
91
19
93
19
95
19
97
19
99
20
01
20
03
20
05
20
07
20
09
20
11
Arizona Lemons Utilized Production
(000) Boxes
0 100 200 300 400 500 600 700 800 900
1,000 1,100 1,200 1,300 1,400
19
65
19
67
19
69
19
71
19
73
19
75
19
77
19
79
19
81
19
83
19
85
19
87
19
89
19
91
19
93
19
95
19
97
19
99
20
01
20
03
20
05
20
07
20
09
20
11
Arizona Tangerines & Tangeloes Utilized Production
(000) Boxes

33
- 100 200 300 400 500 600 700 800 900
1,000 1,100 1,200
19
35
19
38
19
41
19
44
19
47
19
50
19
53
19
56
19
59
19
62
19
65
19
68
19
71
19
74
19
77
19
80
19
83
19
86
19
89
19
92
19
95
19
98
20
01
20
04
20
07
Arizona Navel Oranges Utilized Production
(000) Boxes
-
500
1,000
1,500
2,000
2,500
3,000
3,500
4,000
4,500
19
35
19
38
19
41
19
44
19
47
19
50
19
53
19
56
19
59
19
62
19
65
19
68
19
71
19
74
19
77
19
80
19
83
19
86
19
89
19
92
19
95
19
98
20
01
20
04
20
07
Arizona Valencia Oranges Utilized Production
(000) Boxes
-
500
1,000
1,500
2,000
2,500
3,000
3,500
4,000
4,500
19
20
19
23
19
26
19
29
19
32
19
35
19
38
19
41
19
44
19
47
19
50
19
53
19
56
19
59
19
62
19
65
19
68
19
71
19
74
19
77
19
80
19
83
19
86
19
89
19
92
19
95
19
98
20
01
20
04
20
07
Arizona Grapefruit
Utilized Production (000) Boxes

34
Arizona Number of Farms, Land in Farms, and Average Farm Size Year Number of Farms 1/ Land in Farms Average Farm Size
Number 1,000 Acres Acres 2007 15,600 26,100 1,673
2008 15,600 26,100 1,673
2009 15,500 26,100 1,684
2010 15,500 26,100 1,684
2011 15,500 26,100 1,684
United States Number of Farms, Land in Farms, and Average Farm Size Year Number of Farms 1/ Land in Farms Average Farm Size
Number 1,000 Acres Acres 2007 2,204,950 921,460 418
2008 2,200,100 919,910 418
2009 2,200,210 919,890 418
2010 2,192,000 918,840 419
2011 2,181,000 916,990 420
2011 Number of Farms and Land in Farms Highlights
The number of farms in the United States in 2011 is
estimated at 2.2 million, down slightly from 2010. Total land
in farms, at 917 million acres, decreased 1.85 million acres
from 2010. The average farm size is 420 acres, up 1 acre
from the previous year.
Farm numbers and land in farms are broken down into five
economic sales classes. Farms and ranches are classified into
these "sales classes" by summing their sales of agricultural
products and government program payments. Sales class
breaks occur at $10,000, $100,000, $250,000, and $500,000.
Farm numbers increased slightly in the $10,000-$99,999,
$250,000-$499,999, and $500,000 and over sales classes.
Higher commodity prices and larger value of sales
contributed to changes in the number of farms within these
sales classes. Farm numbers increased 1.3 percent, to
slightly over 600,000 farms in the $10,000 - $99,999 sales
class and 1.9 percent in the $250,000 - $499,999 sales class
to over 100,000 farms. Meanwhile, the number of farms in
the $500,000 and over sales class increased by 5.9 percent,
to 133,570 farms.
Land in farms increased in the largest sales class while
decreasing in all other sales classes. Land operated by farms
in the $500,000 & over in sales class increased 2.5 percent,
to 305.7 million acres. Land operated by farms in both
$1,000-$9,999 and $100,000-$249,999 sales classes
decreased by 3.5 percent, to 100.7 million acres and 138.7
million acres respectively.
The average farm size increased 1 acre in 2011 to 420 acres
per farm. However, average farm sizes declined in some of
the sales classes partially due to smaller farms moving up to
higher sales classes.
The number of operations with cattle totaled 922,000 for
2011, down 1 percent from 2010. Beef cow operations in
2011, at 734,000, were also down 1 percent from last year.
The number of milk cow operations for 2011 totaled 60,000,
down 4 percent from 2010.
The three operation classes: cattle, beef cows, and milk
cows, are classified into size groups independently.
Therefore, it is possible to have more beef cow operations in
a particular size group than cattle operations. As an
example, an operator with 75 cattle and 40 beef cows would
be classified in the 50-99 size group for cattle and 1-49 size
group for beef cows.
The number of operations with hogs totaled 69,100 for 2011,
unchanged from 2010. Places with 2,000 or more head
accounted for 87 percent of the inventory.
The number of operations with sheep totaled 80,000 for
2011, down 1 percent from 2010. Of all sheep operations
that include breeding sheep, 93.5 percent were comprised of
1-99 head, 5.4 percent had 100-499 head, and the remaining
1.1 percent were operations with 500 head or more.
Operations with 1-99 head account for 35.9 percent of the
inventory, 100-499 head account for 21.1 percent of the
inventory, and 500+ head account for 43.0 percent of the
inventory.
The number of operations with goats totaled 151,000 for
2011, down 1 percent from a year earlier. Angora goat
operations totaled 5,500, down 8 percent from 2010. Milk
goat operations totaled 31,000, unchanged from 2010. Meat
goat operations totaled 124,000, down 3 percent from a year
earlier. Total goat operations will be equal to or less than the
sum of angora, milk and meat goat operations since places
which own more than one goat type count as only one
operation.

35
Farm Labor
The farm employment and wage rate estimates are for the
week that includes the 12th of the month, which
corresponds to the week specified in general employment
and wage series of other Government agencies.
Hired workers include family members and other workers
who are paid for working on agricultural jobs for 1 hour or
more during the week of the 12th. Workers paid by a crew
leader or agricultural service firm hired by the farm or ranch
operator are not included in the number of hired workers or
wage rate statistics. A separate tabulation of these
agricultural service workers is maintained for the U.S.,
California, and Florida.
Hired Workers: Number, Hours Worked, and Wage Rates,
By Survey Week, January 2007-April 2012 1/
Survey Week
and Year
Hired Type of Worker Wage
Rates for
All
Hired
Workers
Number
of
Workers
Expected to be
Employed Number
of Hours
Worked
Field Livestock
Field &
Livestock
Combined 150 Days
or More
149 Days
or Less
--------------- 1,000 ---------------
Hours per
Week ---------- Dollars per Hour ----------
Dollars
per Hour
2007 January 7-13 2/
April 8-14 17 16 1 44.5 8.25 8.88 8.51 9.28 July 8-14 22 19 3 45.0 8.34 9.65 8.80 9.47 October 7-13 22 21 1 46.1 8.26 9.91 8.85 9.21
2008 January 6-12 15 14 1 46.6 8.68 10.47 9.41 9.95 April 6-12 17 16 1 43.6 9.38 10.69 9.97 10.55 July 6-12 20 17 3 42.0 9.21 11.44 9.85 10.55 October 12-18 21 19 2 44.5 9.44 10.80 10.00 10.70
2009 January 11-17 20 18 2 49.7 9.27 10.58 9.75 10.30 April 12-18 20 19 1 45.2 9.16 9.44 9.29 10.10
July 12-18 18 16 2 45.4 10.09 10.94 10.38 11.19 October 11-17 20 18 2 44.9 9.10 10.06 9.50 10.30
2010 January 10-16 19 18 1 49.4 8.47 9.59 8.90 9.44 April 11-17 18 16 2 40.7 9.18 10.97 10.25 11.10 July 11-17 19 16 3 44.6 9.70 9.69 9.70 10.50 October 10-16 17 15 2 47.1 9.43 10.07 9.75 10.45
2011 January 9-15 18 16 2 46.8 9.77 9.85 9.80 10.60
April 10-16 3/ July 10 - 16 16 15 1 46.8 9.89 10.65 10.20 11.10 October 9 - 15 19 16 3 49.1 8.77 10.55 9.50 10.10
2012 January 8 - 14 19 18 1 48.0 9.06 10.70 9.37 10.05 April 8 - 14 20 18 2 50.7 9.07 10.07 9.22 9.79
1/ Mountain III region includes Arizona and New Mexico. Excludes agricultural service workers.
2/ January 2007 Farm Labor Survey was not conducted.
3/ April 2011 Farm Labor Survey was discontinued.

36
Per Capita Consumption or Utilization of Various Foods, United States 1980 1985 1990 1995 2000 2005 2009
Fruits, and Vegetables (Pounds) 603.4 630.1 648.4 688.2 710.6 684.5 647.9 Apples (Pounds) 19.2 17.3 19.6 18.7 17.5 16.7 16.4 Cantaloupes (Pounds) 5.8 8.5 9.2 9.0 11.1 9.6 9.3 Watermelons (Pounds) 10.7 13.5 13.3 15.2 13.8 13.6 15.3 Fresh Citrus (Pounds) 26.1 21.5 21.4 23.8 23.5 21.6 20.7 Broccoli (Pounds) 1.4 2.6 3.4 4.3 5.9 5.3 6.1 Cabbage (Pounds) 8.0 8.7 8.3 8.1 8.9 7.8 7.3 Cauliflower (Pounds) 1.1 1.8 2.2 1.6 1.7 1.8 1.5 Head Lettuce (Pounds) 25.6 23.7 27.7 22.2 23.5 20.9 17.1 Tree Nuts (Pounds) 1.8 2.5 2.4 2.1 2.6 2.6 3.7 Beef (Pounds) 72.1 74.6 63.9 63.5 64.5 62.5 58.1 Pork (Pounds) 52.1 47.7 46.4 48.4 47.8 46.6 46.6 Chicken (Pounds) 32.7 36.4 42.4 48.2 54.2 60.5 56.0
Eggs (Shell) (Number) 236.2 216.5 186.2 172.3 172.0 172.8 172.9
Whole Milk (Gallons) 16.5 13.9 10.2 8.3 7.7 6.6 5.7 Reduced Fat Milk (2%) (Gals) 6.3 7.9 9.1 8.0 7.1 6.9 5.9 Reduced Fat Milk (1% - 0%)(Gals) 3.1 3.2 4.9 6.1 6.1 5.6 5.7 Yogurt (Excl. Frozen) (1/2 Pints) 4.6 7.3 7.8 11.4 12.0 19.1 NA Cheese (Pounds) 17.5 22.5 24.6 26.9 29.8 31.7 32.8 Ice Cream (Pounds) 17.5 18.1 15.8 15.5 16.7 14.6 13.4 Lowfat Ice Cream (Pounds) 7.1 6.9 7.7 7.4 7.3 6.7 6.8 Butter (Pounds) 4.5 5.3 4.0 4.7 4.5 4.6 4.9 Margarine (Pounds) 11.3 10.8 10.9 9.1 8.2 4.0 2.9 Flour & Cereal Prod. (Pounds) 146.3 159.0 180.8 189.4 199.2 191.3 194.5 Wheat Flour (Pounds) 116.9 124.6 135.9 140.0 146.3 134.3 134.6 Corn Products (Pounds) 12.9 17.2 21.4 24.9 28.4 31.4 33.0 High Fruct. Corn Syrup (Pounds) 19.0 45.2 49.6 57.6 62.6 59.1 50.1
Source: U.S. Department of Agriculture, Economic Research Service. Food Consumption, Prices, and Expenditures, Food Availability (Per Capital) Data System.
Cash Rents of Irrigated Cropland,
Arizona, by County, 2010-2011
County Dollars per Acre
2010 2011
Apache NA 56.00
Cochise 120.00 110.00
Graham 110.00 115.00
Greenlee 50.00 47.00
La Paz 170.00 160.00
Maricopa 97.50 108.00
Mohave NA 100.00
Pima 75.00 95.00
Pinal 102.00 100.00
Yuma 435.00 410.00
Other Counties 100.00 100.00
State Total 160.00 155.00
Cash Rents of Irrigated Cropland,
Arizona, 2005-2011
Year Dollars per Acre
2005 165.00
2006 180.00
2007 170.00
2008 180.00
2009 170.00
2010 160.00
2011 155.00

37
Livestock: Record Highs and Lows
Date Series
Began Unit Record Quantity Year 1/
Cattle:
Inventory - January 1 1867 1,000 Head High
Low
1,750
200
1918
1867
Calves born 1924 1,000 Head High
Low
484
244
1924
1929
Beef cows - January 1 1920 1,000 Head High
Low
819
170
1920
2003
Milk cows - January 1 1870 1,000 Head High
Low
190
1
2012
1876
Cattle on feed - January 1 1930 1,000 Head High
Low
655
23
1973
1930
Hogs:
Inventory - December 1 1869 1,000 Head High
Low
180
1
1980
1870
Sheep:
Inventory - January 1 1867 1,000 Head High
Low
1,420
12
1917
1867
Lamb crop 1924 1,000 Head High
Low
645
33
1926
2003
Wool production 1909 1,000 Pounds High
Low
8,000
490
1917
2002
Weight per fleece 1909 Pounds High
Low
7.6
5.8
1971
2002
Mohair 1909 2/ 1,000 Pounds High
Low
960
80
1931
2009
Milk:
Milk production 1924 Million Pounds High
Low
4,412
157
2011
1925
Milk production 1924 Pounds per
cow
High
Low
23,468
4,640
2011
1932
1/ The latest year a record was achieved. Some records were equaled in earlier years. 2/ Estimates were discontinued in 1971 and resumed in 1988.

38
Livestock Summary: Inventory and Value 1/ 2/
2010 2011 2012
Inventory Value Inventory Value Inventory Value
1,000
Head
1,000
Dollars
1,000
Head
1,000
Dollars
1,000
Head
1,000
Dollars
Cattle and calves 3/ 930 753,300 870 852,600 920 1,012,000
Beef cows that have calved 208 180 185
Milk cows that have calved 167 185 190
Beef cow replacement heifers 30 25 35
Milk cow replacement heifers 55 60 65
Other heifers 500+ Pounds 15 18 15
Steers 500 Pounds and over 300 275 300
Bulls 500 Pounds and over 20 17 20
Calves under 500 Pounds 135 110 110
Cattle on Feed 4/ 288 258 279
Hogs 5/ 167 14,529 165 18,150 180 21,600
Breeding hogs 20 20 20
Market hogs 147 145 160
Under 50 Pounds 54 60 64
50-119 Pounds 31 29 32
120-179 Pounds 31 28 31
180 Pounds and over 31 28 33
Sheep and Lambs 3/ 160 23,520 150 23,550 140 24,500
Breeding sheep and lambs 95 100 97
Ewes one year old and older 75 75 71
Rams one year old and older 6 7 6
Replacement lambs
14 18 20
Market sheep and lambs 65 50 43
Market lambs 60 45 39
Under 65 Pounds 18 12 10
65-84 Pounds 7 6 3
85-104 Pounds 15 13 5
105 Pounds and over 20 14 21
Market sheep 5 5 4
Goats 3/
Angora Goats 22 1,540 25 1,875 23 1,955
Milk Goats 2 2 3
Meat and Other Goats 25 35 29
1/ Totals may not add due to rounding. 2/ Value published only for the total inventory number. 3/ Estimates are based on January 1 of the current year. 4/ Total cattle on feed included in other classes. 5/ Estimates are based on December 1 of the previous year.

39
Cattle and Calves
Arizona’s inventory of cattle and calves on January 1, 2012
was estimated at 920,000 head, up 50,000 head from the
previous year. The 2011 calf crop of 290,000 was up 20,000
head from 2010. The value of cattle and calves on January 1
was $1.01 billion, up 19 percent from the previous year.
Cattle and calf marketings decreased 6 percent from last year
to 756 million pounds, the lowest since 2004. The gross
income from these marketings, however, increased 28 percent
to a record high $818 million.
Feedlot inventories ranged from a low of 258,000 head on
January 1 to a high of 292,000 head on November 1.
Arizona’s 12 livestock slaughter plants produced 413.7
million pounds of red meat during 2011, up 6 percent from
2010.
0
100
200
300
400
500
600
700
800
900
1000
1100
2003 2004 2005 2006 2007 2008 2009 2010 2011 2012
(000) All Cattle
Cattle Inventory
January 1, 2003-2012
Milk Cows Cattle on Feed All Other Cattle

40
All Cattle and Calves: Number on Farms and Value
2006 2007 2008 2009 2010 2011 2012
--------------------------------------- January 1 ---------------------------------------
All cattle & calves (1,000 Head) 970 980 1,000 1,020 930 870 920
Cows that have calved (1,000 Head)
Beef Cows 205 200 195 200 208 180 185
Milk Cows 170 175 185 190 167 185 190
Heifers 500 pounds & over (1,000 Head)
Beef cow replacement 30 35 30 35 30 25 35
Milk cow replacement 44 60 50 50 55 60 65
Other heifers 19 15 15 20 15 18 15
Steers 500 pounds & over (1,000 Head) 350 345 375 370 300 275 300
Bulls 500 pounds & over (1,000 Head) 22 20 20 20 20 17 20
Calves under 500 pounds (1,000 Head) 130 130 130 135 135 110 110
Value of all cattle & calves
Per head (Dollars) 1,090 1,010 1,110 970 810 980 1,100
Total (1,000 Dollars) 1,057,300 989,800 1,110,000 989,400 753,300 852,600 1,012,000
All Cattle and Calves: Inventory, Supply and Disposition
2006 2007 2008 2009 2010 2011 2012
--------------------------------------- 1,000 Head ---------------------------------------
Inventory January 1 970 980 1,000 1,020 930 870 920
Calf Crop 295 290 300 295 270 290 3/
In-shipments 500 540 511 492 432 487 3/
Marketings 1/
Cattle 592 613 597 666 578 543 3/
Calves 148 154 150 167 145 137 3/
Farm Slaughter 2/ 1 1 1 1 1 2 3/
Deaths
Cattle 24 23 23 23 20 25 3/
Calves 20 19 20 20 18 20 3/
1/ Includes custom slaughter for use on farms where produced and State outshipments, but excludes interfarm sales within the State.
2/ Excludes custom slaughter for farmers at commercial establishments.
3/ Not available until April 2013
All Cattle and Calves: Production and Income 2005 2006 2007 2008 2009 2010 2011
Production (1,000 Pounds) 1/ 590,105 587,975 606,782 596,198 609,364 554,199 562,343
Marketings (1,000 Pounds) 2/ 811,920 821,390 850,910 828,630 924,620 802,080 756,220
Average price per 100 Pounds (Dollars)
Cattle 93.40 88.30 79.90 74.80 62.30 76.80 3/
Calves 126.00 125.00 116.00 106.00 102.00 118.00 3/
Value of production (1,000 Dollars) 498,648 466,516 425,743 400,785 320,523 373,561 589,075
Cash receipts (1,000 Dollars) 4/ 775,944 745,249 700,313 637,016 600,422 637,949 816,172
Value of home consumption
(1,000 Dollars) 2,876 2,774 2,747 2,496 2,169 2,787 2,178
Gross income (1,000 Dollars) 778,820 748,023 703,060 639,512 602,591 640,736 818,350
1/ Adjustments made for changes in inventory and for inshipments. 2/ Excludes custom slaughter for use on farms where produced and interfarm sales within the State.
3/ Discontinued.
4/ Receipts from marketings and sale of farm slaughter.

41
Cattle on Feed: Inventory 1/
Month 2005 2006 2007 2008 2009 2010 2011
------------------------------------------------1,000 Head-----------------------------------------------
January 1 331 334 334 368 358 287 258
February 1 328 346 334 373 349 290 266
March 1 324 351 329 377 342 286 269
April 1 326 351 340 374 330 278 276
May 1 330 345 340 370 311 268 282
June 1 331 341 340 365 301 263 290
July 1 324 344 343 356 287 255 287
August 1 314 339 341 357 275 248 287
September 1 314 336 348 362 275 240 283
October 1 318 336 350 360 275 240 280
November 1 323 342 360 362 279 251 292
December 1 328 341 367 359 282 249 290
1/ Cattle and calves on feed are animals for slaughter market being fed a ration of grain or other concentrates and are expected to
produce a carcass that will grade select or better.
Cattle County Estimates, 2011-2012
County
January 1
All Cattle and Calves Beef Cows Milk Cows
2011 2012 2011 1/ 2012 1/ 2011 2012
Apache 30,000 35,000
Coconino 40,000 39,000
Gila 7,000 8,000
Navajo 28,000 25,000
Yavapai 40,000 45,000
Cochise
50,000
50,000
Graham 9,000 10,000
Greenlee 5,000 6,000
Maricopa 180,000 190,000 98,000 98,000
Pima 14,000 18,000
Pinal 310,000 330,000 65,000 69,000
Santa Cruz 14,000 14,000
Other Counties 143,000 150,000 22,000 23,000
State Total 870,000 920,000 180,000 185,000 185,000 190,000
1/ County estimates discontinued.

42
Grazing Fees
As of 2010, approximately 45 percent of Arizona's total area
of 72,750,000 acres is Federal and State public trust land
administered by the United States Department of Interior
(USDI) Bureau of Land Management, the United States
Department of Agriculture (USDA) Forest Service, and the
Arizona State Land Department. A majority of these public
lands are leased for livestock grazing.
For the years 1979-1985, fees for grazing on Federal public
lands were determined by a formula established in the Public
Rangelands Improvement Act of 1978 (PRIA). The act
expired December 31, 1985. On February 14, 1986, in the
absence of Congressional action, the President, through
Executive Order 12548, indefinitely extended the PRIA
formula, subject to a few minor changes.
These minor changes included: (1) the Forage Value Index
would use the weighted average estimate of the annual rental
charge per head per month, rather than Animal Unit Month;
(2) the Beef Cattle Price Index means the weighted average
annual selling price for beef cattle in the 11 Western States,
and (3) the Prices Paid Index would reflect selected livestock
production costs in the Western States. In addition, The
Executive Order specified that the fee shall not be less than
$1.35 per Animal Unit Month and that annual adjustments
would not exceed plus or minus 25 percent of the previous
year’s grazing fee.
Effective March 1988, the Secretary of Agriculture issued a
final ruling that established regulations for annually
determining Federal grazing fees. The fee system now in
effect is the formula prescribed in the Executive Order of
February 1986 and, in most respects, is the same grazing fee
formula enacted by Congress in 1978. Grazing fees will be
based on a rate per head month.
A head month is a month's use and occupancy of range by
one animal, except for sheep or goats. A full head month's
fee is charged for a month of grazing by adult animals; if the
grazing animal is weaned or 6 months of age or older at the
time of entering the Federal lands; or will become 12 months
of age during the permitted period of use. For fee purposes,
5 sheep or goats are equivalent to one cow, bull, steer,
heifer, horse, or mule.
Grazing fee formula components are compiled by the USDA
Agricultural Statistics Board and furnished to USDI Bureau
of Land Management and the USDA Forest Service for
calculating the grazing fee each year.
Public Land Grazing Fee Formulation *
Grazing Fee Components Base Year
1964-68 2006 2007 2008 2009 2010 2011 2012
Grazing Rates on Private Land (Dollars) 1/
3.65 14.60 15.10 15.60 16.20 15.80 16.10 16.80
Forage Value Index (FVI) 2/
100 400 414 427 444 433 441 460
Average Price Received for Beef Cattle
per Cwt (Dollars) 3/
22.04 91.04 92.17 86.80 86.89 78.21 87.69 112.29
Beef Cattle Price Index (BCPI) 4/
100 413 418 394 394 355 398 509
Prices Paid Index (PPI) 5/ 100 686 724 762 891 806 866 946
Federal Grazing Fee (Dollars) 6/
(1.23) 1.56 1.35 1.35 1.35 1.35 1.35 1.35
State Grazing Fee (Dollars) (0.95) 2.52 2.40 2.29 2.23 2.28 2.30 2.41
* The Federal Grazing Fee for the year specified, as constrained by Presidential Executive Order 12548, is based on prior year values for the formula components. 1/ Privately-owned, non-irrigated land in eleven western states: Arizona, California, Colorado, Idaho, Montana, Nevada, New Mexico, Oregon, Utah,
Washington, and Wyoming. Rates are per head month. Private Fee Grazing Rates, for the prior year, are published by NASS-USDA in the January
Agricultural Prices report. 2/ Private land grazing rates current year divided by base year times 100.
3/ Average for twelve months November-October prior to the fee year for eleven western states, see footnote 1. Average Beef Cattle Price for the Nov-Oct
period, are published by NASS-USDA in the December Agricultural Prices report.
4/ Beef cattle price current year divided by base year times 100.
5/ Index of prices paid for beef cattle production inputs as percent of base year. The Prices Paid Index for Beef Cattle Production for the Nov-Oct period, are
published by NASS-USDA in the December Agricultural Prices report. 6/ The grazing fee = base year fee (FVI + BCPI - PPI)/100. 2012 for example = $1.23 (460 + 509 - 946)/100 = $-0.27 (Federal). Per Executive Order, $1.35 is
the legal minimum.

43
Cattle: Monthly and Marketing Year Average Prices Received 2005-2011 2005 2006 2007 2008 2009 2010 2011 1/
----------------------------------------------- Dollars per Cwt ------------------------------------------------
All Beef Cattle 2/
January 97.20 89.50 76.80 76.80 58.40 65.10
February 97.10 92.70 75.90 75.20 63.80 70.50
March 99.60 88.20 79.10 74.70 63.00 75.10
April 103.00 90.00 83.20 75.60 70.10 77.70
May 98.80 92.50 84.60 82.70 66.80 77.70
June 92.90 92.70 84.40 82.30 59.00 74.50
July 91.50 94.40 83.80 83.80 66.70 79.20
August 91.30 92.70 83.20 78.90 60.30 82.10
September 89.30 92.20 81.80 74.80 61.60 80.50
October 88.20 82.80 75.40 65.80 57.50 76.60
November 87.10 75.30 73.50 62.60 58.50 77.50
December 87.50 77.60 77.00 61.10 61.80 83.90
Marketing year average 93.40 88.30 79.90 74.80 62.30 76.80
Steers and Heifers
January 106.00 108.00 93.50 96.00 86.00 84.00
February 106.00 107.00 94.00 95.00 83.00 87.00
March 110.00 103.00 98.00 94.00 82.00 94.00
April 114.00 103.00 100.00 92.00 86.00 98.00
May 109.00 106.00 99.00 95.00 86.00 99.00
June 103.00 105.00 95.00 97.00 84.00 94.00
July 102.00 106.00 93.00 101.00 83.00 93.00
August 103.00 110.00 95.00 100.00 82.00 95.00
September 102.00 111.00 97.00 101.00 86.00 98.00
October 103.00 101.00 97.00 94.00 84.00 97.00
November 103.00 93.00 96.00 94.00 86.00 98.00
December 103.00 92.00 97.00 89.00 82.00 102.00
Marketing year average 105.00 104.00 96.10 95.60 84.10 95.10
Calves
January 125.00 128.00 107.00 110.00 100.00 105.00
February 131.00 129.00 114.00 114.00 101.00 117.00
March 133.00 127.00 118.00 110.00 100.00 123.00
April 137.00 126.00 119.00 105.00 107.00 126.00
May 130.00 126.00 114.00 111.00 108.00 115.00
June 123.00 129.00 109.00 102.00 98.00 108.00
July 125.00 135.00 124.00 101.00 105.00 119.00
August 124.00 133.00 124.00 118.00 110.00 123.00
September 123.00 133.00 120.00 112.00 101.00 115.00
October 120.00 123.00 115.00 95.00 95.00 112.00
November 120.00 110.00 111.00 97.00 98.00 119.00
December 123.00 106.00 112.00 94.00 101.00 127.00
Marketing year average 126.00 125.00 116.00 106.00 102.00 118.00
Cows 3/
January 54.40 46.30 43.00 48.00 40.00 49.00
February 56.40 47.30 45.00 52.00 43.00 54.00
March 55.50 48.10 47.00 53.00 44.00 57.00
April 56.50 46.40 49.00 51.00 49.00 61.00
May 60.60 44.50 51.00 54.00 49.00 64.00
June 57.10 43.60 51.00 55.00 45.00 62.00
July 56.30 45.00 53.00 58.00 49.00 61.00
August 54.30 45.90 53.00 61.00 47.00 61.00
September 51.10 46.30 51.00 60.00 46.00 60.00
October 46.20 45.70 49.00 50.00 45.00 57.00
November 44.00 43.70 46.00 45.00 43.00 57.00
December 47.60 42.40 47.00 40.00 46.00 60.00
Marketing year average 52.50 45.40 48.50 52.30 45.40 58.70
1/ State level estimates discontinued. 2/ “Cows” and “Steers and Heifers” combined. 3/ Beef cows and cull dairy cows sold for slaughter.

44
Annual Cattle Price Reactions to Cattle on Feed Releases
Marketing Year
Number of and Average Price Changes 1/
Week Prior to Release Week After Release
Increases Decreases Increases Decreases
Number Average Number Average Number Average Number Average
Dollars
Dollars
Dollars
Dollars
2001 5 0.84 7 1.78 5 1.87 7 1.47
2002 9 1.24 3 1.40 5 1.14 7 1.68
2003 5 3.73 7 2.41 5 1.90 7 3.24
2004 9 1.73 3 1.85 5 4.07 7 1.83
2005 2 1.65 10 1.43 5 1.01 7 1.28
2006 9 0.96 3 1.26 7 1.76 5 1.61
2007 5 0.78 7 1.36 8 1.67 4 1.51
2008 6 0.95 6 1.81 9 1.57 3 1.03
2009 5 1.72 7 0.91 6 1.26 6 0.62
2010 7 2.39 5 1.15 3 2.03 9 0.97
2011 4 2.14 8 2.53 7 2.41 5 1.67
1/ Based on the weekly weighted average prices per cwt. for live steers and heifers from feedlots in Texas, Oklahoma, New Mexico, Kansas, Nebraska, Colorado,
Iowa, and Minnesota. Total increases and decreases may not add to twelve for a year when the week-to-week price does not change. Source: Market News, Agricultural Marketing Service.
Monthly Cattle Price Reactions to Cattle on Feed Releases
Average Price 1/ Change From
Release Date
Inventory Change
2/ Week Prior
Week of
Release Week After
Week Before
to Week of
Release
Week of
Release to
Week After
Percent Dollars
Jan 21, 2011 4.6 107.61 105.85 104.36 -1.76 -1.49
Feb, 18 2011 5.6 106.21 109.75 111.07 3.54 1.32
Mar, 18 2011 5.0 117.93 114.24 114.18 -3.69 -0.06
Apr 21, 2011 5.0 119.10 119.16 116.79 0.06 -2.37
May 20, 2011 7.4 112.86 108.29 104.85 -4.57 -3.44
Jun 17, 2011 4.1 106.03 109.30 112.16 3.27 2.86
Jul 22, 2011 3.8 110.93 108.39 108.59 -2.54 0.20
Aug 19, 2011 7.6 116.13 113.96 112.96 -2.17 -1.00
Sep 23, 2011 5.3 117.03 115.89 120.25 -1.14 4.36
Oct 21, 2011 4.9 119.11 120.80 121.00 1.69 0.20
Nov 18, 2011 3.7 125.45 122.75 124.94 -2.70 2.19
Dec 16, 2011 4.0 120.52 118.89 124.60 -1.63 5.71
1/ Based on the weekly weighted average prices per cwt. for live steers and heifers from feedlots in Texas, Oklahoma, New Mexico, Kansas, Nebraska, Colorado,
Iowa, and Minnesota. Total increases and decreases may not add to twelve for a year when the week-to-week price does not change. Source: Market News,
Agricultural Marketing Service. 2/ Percent change from previous year at time of each report.
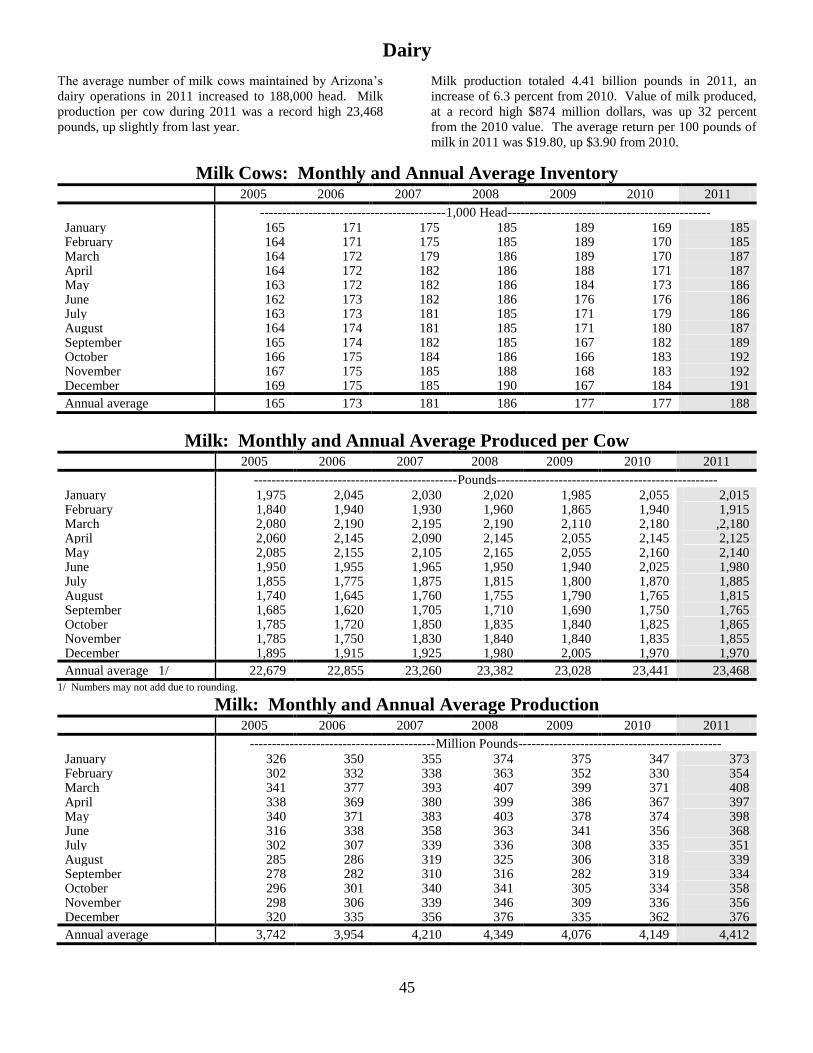
45
Dairy
The average number of milk cows maintained by Arizona’s
dairy operations in 2011 increased to 188,000 head. Milk
production per cow during 2011 was a record high 23,468
pounds, up slightly from last year.
Milk production totaled 4.41 billion pounds in 2011, an
increase of 6.3 percent from 2010. Value of milk produced,
at a record high $874 million dollars, was up 32 percent
from the 2010 value. The average return per 100 pounds of
milk in 2011 was $19.80, up $3.90 from 2010.
Milk Cows: Monthly and Annual Average Inventory 2005 2006 2007 2008 2009 2010 2011
------------------------------------------1,000 Head----------------------------------------------
January 165 171 175
185 189 169 185 February 164 171 175 185 189 170 185 March 164 172 179 186 189 170 187 April 164 172 182 186 188 171 187 May 163 172 182 186 184 173 186 June 162 173 182 186 176 176 186 July 163 173 181 185 171 179 186 August 164 174 181 185 171 180 187 September 165 174 182 185 167 182 189 October 166 175 184 186 166 183 192 November 167 175 185 188 168 183 192 December 169 175 185 190
167 184 191
Annual average 165 173 181 186 177 177 188
Milk: Monthly and Annual Average Produced per Cow 2005 2006 2007 2008 2009 2010 2011
----------------------------------------------Pounds--------------------------------------------------
January 1,975 2,045 2,030
1,930
2,020 1,985 2,055 2,015 February 1,840 1,940 1,930 1,960 1,865 1,940 1,915 March 2,080 2,190 2,195 2,190 2,110 2,180 ,2,180 April 2,060 2,145 2,090 2,145 2,055 2,145 2,125 May 2,085 2,155 2,105 2,165 2,055 2,160 2,140 June 1,950 1,955 1,965 1,950 1,940 2,025 1,980 July 1,855 1,775 1,875 1,815 1,800 1,870 1,885 August 1,740 1,645 1,760 1,755 1,790 1,765 1,815 September 1,685 1,620 1,705 1,710 1,690 1,750 1,765 October 1,785 1,720 1,850 1,835 1,840 1,825 1,865 November 1,785 1,750 1,830 1,840 1,840 1,835 1,855 December 1,895 1,915 1,925 1,980 2,005 1,970 1,970
Annual average 1/ 22,679 22,855 23,260 23,382 23,028 23,441 23,468
1/ Numbers may not add due to rounding.
Milk: Monthly and Annual Average Production 2005 2006 2007 2008 2009 2010 2011
------------------------------------------Million Pounds----------------------------------------------
January 326 350 355 374 375 347 373 February 302 332 338 363 352 330 354 March 341 377 393 407 399 371 408 April 338 369 380 399 386 367 397 May 340 371 383 403 378 374 398 June 316 338 358 363 341 356 368 July 302 307 339 336 308 335 351 August 285 286 319 325 306 318 339 September 278 282 310 316 282 319 334 October 296 301 340 341 305 334 358 November 298 306 339 346 309 336 356 December 320 335 356 376 335 362 376
Annual average 3,742 3,954 4,210 4,349 4,076 4,149 4,412

46
Milk Production: Marketings and Income
2005 2006 2007 2008 2009 2010 2011
Combined marketings of milk and cream
Milk marketed (Million Pounds) 3,729 3,941 4,197 4,336 4,063 4,136 4,399
Average returns (Dollars)
Per 100 pounds of milk 14.90 12.80 19.10 17.60 12.10 15.90 19.80
Per pound of milkfat 4.15 3.57 5.32 4.94 3.47 4.54 3.55
Cash receipts from marketings (1,000 Dollars) 555,621 504,448 801,627 763,136 491,623 657,624 871,002
Used for milk, cream & butter where produced
Milk utilized (Million Pounds) 1 1 1 1 1 1 1
Value (1,000 Dollars) 149 128 191 176 121 159 198
Gross producer income (1,000 Dollars) 1/ 555,770 504,576 801,818 763,312 491,744 657,783 871,200
1/ Cash receipts from marketings of milk and cream plus value of milk used for home consumption.
Dairy: Milk Cows, Production of Milk and Milkfat, and Value
2005 2006 2007 2008 2009 2010 2011
Milk cows (1,000 head) 1/ 165 173 181 186 177 177 188
Production per milk cow (Pounds)
Milk 22,679 22,855 23,260 23,382 23,028 23,441 23,468
Milkfat 814 820 835 832 804 820 833
Milkfat in all milk produced (Percent) 3.59 3.59 3.59 3.56 3.49 3.50 3.55
Total production (Million Pounds)
Milk 3,742 3,954 4,210 4,349 4,076 4,149 4,412
Milkfat 134.3 141.9 151.1 154.8 142.3 145.2 156.6
Value of milk produced (1,000 Dollars) 2/ 557,558 506,112 804,110 765,424 493,196 659,691 873,576
1/ Average number during year, excluding heifers not yet fresh. 2/ Value at average returns per 100 pounds of milk in combined marketings of milk and cream. Includes value of milk fed to calves.
Dairy Products
Arizona has 6 dairy plants manufacturing dairy products.
Among the products are cheeses, sour cream, yogurt, ice
cream, cottage cheese, nonfat dry milk, milk protein
concentrate and more. We are unable to publish statistics
specific to Arizona production without divulging individual
plant information.
Nationally, total cheese production, excluding cottage
cheeses, was 10.6 billion pounds, 1.5 percent above 2010
production. Wisconsin was the leading State with 24.9
percent of the production.
American type cheese production was 4.27 billion pounds,
0.5 percent below 2010 and accounted for 40.3 percent of
total cheese in 2011. Wisconsin was the leading State in
American type cheese production with 18.6 percent of the
production.
Butter production in the United States during 2011 totaled
1.81 billion pounds, 15.7 percent above 2010. California
accounted for 34.4 percent of the production.
Dry milk powders (2011 United States production,
comparisons with 2010) Nonfat dry milk, human - 1.51
billion pounds, down 3.1 percent. Skim milk powders - 446
million pounds, up 75.7 percent.
Whey products (2011 United States production, comparisons
with 2010) Dry whey, total - 1.01 billion pounds, down
slightly. Lactose, human and animal - 1.00 billion pounds,
up 10.1 percent. Whey protein concentrate, total - 431
million pounds, up 0.7 percent. Frozen products (2011
United States production, comparisons with 2010) Ice
cream, Regular (total) - 900 million gallons, down 3.1
percent. Ice cream, Lowfat (total) - 440 million gallons, up
5.8 percent. Sherbet (total) - 45.0 million gallons, down 8.7
percent. Frozen Yogurt (total) - 60.7 million gallons, up 21.2
percent.

47
Hogs and Pigs
On December 1, 2011, Arizona’s hog inventory was estimated
at 180,000 head, up 15,000 from the previous year. Breeding
hogs were estimated at 20,000 head and market hogs totaled
160,000 head. The market value of Arizona’s hog inventory
was $21.6 million.
There were 37,000 sows that farrowed during 2011, up 2,000
head from the previous year. Pigs per litter totaled 10.51, up
from 9.78 a year earlier. Total pig crop of 389,000 head was
up 43,000 head from 2010.
Marketings totaled 368,000 head in 2011, up 29,000 from
2009. The gross income of the industry totaled $63.7 million,
an increase of 19 percent from the previous year.
Hogs and Pigs: Inventory by Class, Weight Group, and Farm Value 1/ 2005 2006 2007 2008 2009 2010 2011
---------------------------------------------- 1,000 Head -----------------------------------------------
Breeding 15 16 17 17 20 20 20
Market 127 132 158 148 147 145 160
Market by weight groups:
Under 50 Pounds 2/ 46 49 62 50 54 60 64
50-119 Pounds 2/ 27 28 32 37 31 29 32
120-179 Pounds 27 27 32 31 31 28 31
180 Pounds and over 27 28 32 30 31 28 33
All Hogs 142 148 175 165 167 165 180
Value
Per head (Dollars) 100 93 76 93 87 110 120
Total (1,000 Dollars) 14,200 13,764 13,300 15,345 14,529 18,150 21,600
1/ December 1, 2005 – 2011
2/ Beginning in 2008, the market weight group under 50 pounds was changed from under 60 pounds and the 50 – 119 pound group was changed from the 60 – 119 pounds.
Hogs and Pigs: Inventory, Supply, and Disposition
2005 2006 2007 2008 2009 2010 2011 2012
----------------------------------------------- 1,000 Head ------------------------------------------------
Inventory December 1 1/ 150 142 148 175 165 167 165 180.0
Pig crop 276 279 303 313 309 346 389 4/
In-shipments 40 40 24 9 5 7 9 4/
Marketings 2/ 279 270 273 308 292 339 368 4/
Farm slaughter 3/ 1 1 1 1 1 1 1 4/
Deaths 44 42 26 23 19 15 14 4/
1/ December 1 of previous year. 2/ Includes animals for slaughter markets, as well as younger animals shipped to other states for feeding or breeding purposes. Excludes inter-farm sales within the state and farm slaughter. 3/ Excludes custom slaughter for farmers at commercial establishments. 4/ Not available until April 2013.

48
Pig Crop 1/ 2005 2006 2007 2008 2009 2010 2011
Arizona
Sows farrowed (1,000 Head) 30 31 32 32 32 35 37
Pigs per litter (Number) 9.20 9.00 9.47 9.78 9.66 9.89 10.51
Pig crop (1,000 Head) 276 279 303 313 309 346 389
United States
Sows farrowed (1,000 Head) 11,533 11,631 12,247 12,225 11,904 11,626 11,555
Pigs per litter (Number) 9.02 9.08 9.22 9.41 9.62 9.78 9.97
Pig crop (1,000 Head) 103,975 105,633 112,874 115,030 114,542 113,685 115,486
1/ December 1 previous year through November current year.
Hogs and Pigs: Production and Income
2005 2006 2007 2008 2009 2010 2011
Production (1,000 Pounds) 1/ 65,561 64,284 67,324 75,380 76,521 80,582 92,934
Marketings (1,000 Pounds) 2/ 69,500 67,250 68,000 76,750 75,660 82,134 91,750 Average price per cwt (Dollars) 59.20 52.90 53.80 56.10 50.70 64.70 3/
Value of production 37,728 32,393 34,363 41,713 38,575 51,594 63,606
Cash receipts 4/ 41,144 35,575 36,584 43,057 38,360 53,141 63,399
Value of home consumption 184 203 216 231 267 312 342
Gross income 41,328 35,778 36,800 43,288 38,627 53,453 63,741
1/ Adjustments made for changes in inventory and for inshipments. 2/ Excludes custom slaughter for use on farms where produced and interfarm sales within Arizona. 3/ Discontinued. 4/ Receipts from marketings and the sale of farm slaughter. Includes allowance for higher average price of State inshipments and outshipments of feeder pigs.

49
Sheep, Lambs, and Wool
Arizona’s sheep and lamb inventory on January 1, 2012 was
estimated at 140,000 head, down 10,000 head from a year ago.
Breeding sheep and lamb inventory was estimated at 97,000
head, down 3,000 head from January 1, 2011. Market sheep
and lamb inventory, at 43,000 head, decreased by 7,000 head
from the previous year.
Average wool prices increased 20 cents from last year to 50
cents per pound. Wool production was valued at $345,000, up
$120,000 from the previous year.
Sheep and lamb disposition and income estimates were
discontinued after 2010.
Sheep: By Class, and Farm Value
2006 2007 2008 2009 2010 2011 2012
-------------------------------------------- January 1 --------------------------------------------
Breeding sheep and lambs (1,000 Head)
Ewes 64 70 76 75 75 75 71 Rams 5 5 6 6 6 7 6 Replacement lambs 11 12 8 9 14 18 20 Market sheep and lambs (1,000 Head) 45 53 65 60 65 50 43 All sheep and lambs (1,000 Head) 125 140 155 150 160 150 140 Farm Value Per head (Dollars) 141 140 146 153 147 157 175 Total (1,000 Dollars) 17,625 19,600 22,630 22,950 23,520 23,550 24,500
Sheep and Lambs: Inventory, Supply, and Disposition
2006 2007 2008 2009 2010 2011 2012
----------------------------------------- 1,000 Head -----------------------------------------
Inventory January 1 125 140 155 150 160 150 140 Lamb crop 48 50 47 50 48 48 3/
In-shipments 51 49 49 42 29 1/ 1/
Marketings 2/
Sheep 24 19 20 16 16.5 1/ 1/
Lambs 41 45 61 46 49 1/ 1/
Farm slaughter 2/ 13 13 13 13 13 12.5 3/
Deaths
Sheep 3 3 3 3 4.5 6 3/
Lambs 3 4 4 4 4 6 3/
1/ Supply and Disposition estimates discontinued after 2010.
2/ Excludes custom slaughter for farmers at commercial establishments. 3/ Not available until January 2013.

50
Sheep and Lambs: Production and Income 2005 2006 2007 2008 2009 2010 2011
Production (1,000 Pounds) 2/ 4,673 4,322 4,163 3,822 4,149 4,215 1/
Marketings (1,000 Pounds) 3/ 8,653 7,024 6,525 8,100 6,210 6,548 1/
Average price per 100 Pounds (Dollars)
Sheep 45.00 38.00 36.00 34.00 35.00 45.00
1/
Lambs 105.00 90.00 95.00 96.00 96.00 110.00 1/
Value of production (1,000 Dollars) 4,550 3,418 3,358 3,314 3,566 3,824 1/
Cash receipts (1,000 Dollars) 4/ 8,142 4,687 4,685 6,102 4,644 5,754 1/
Value of home consumption (1,000 Dollars) 1,400 1,025 1,084 1,094 1,138 1,492 1/
Gross income (1,000 Dollars) 9,542 5,712 5,769 7,196 5,782 7,246 1/
1/ Discontinued after 2010. 2/ Adjustments made for changes in inventory and for inshipments. 3/ Excludes custom slaughter for use on farms where produced and interfarm sales within Arizona. 4/ Receipts from marketings and sale of farm slaughter.
Wool: Production and Value
2006 2007 2008 2009 2010 2011
All sheep shorn (1,000 Head) 110 120 120 120 120 110
Weight per fleece (Pounds) 6.2 6.3 6.3 6.0 6.3 6.3
Shorn wool production (1,000 Pounds) 680 750 750 725 750 690
Average price per pound (Cents) 35 34 30 25 30 50
Value of production (1,000 Dollars) 1/ 238 255 225 181 225 345
1/ Production multiplied by marketing year average price.
40
60
80
100
120
140
160
180
40
60
80
100
120
140
160
180
2006 2007 2008 2009 2010 2011 2012
$/Head (000) Head
Sheep Inventory & Value
January 1, 2006-2012
Head $/Head
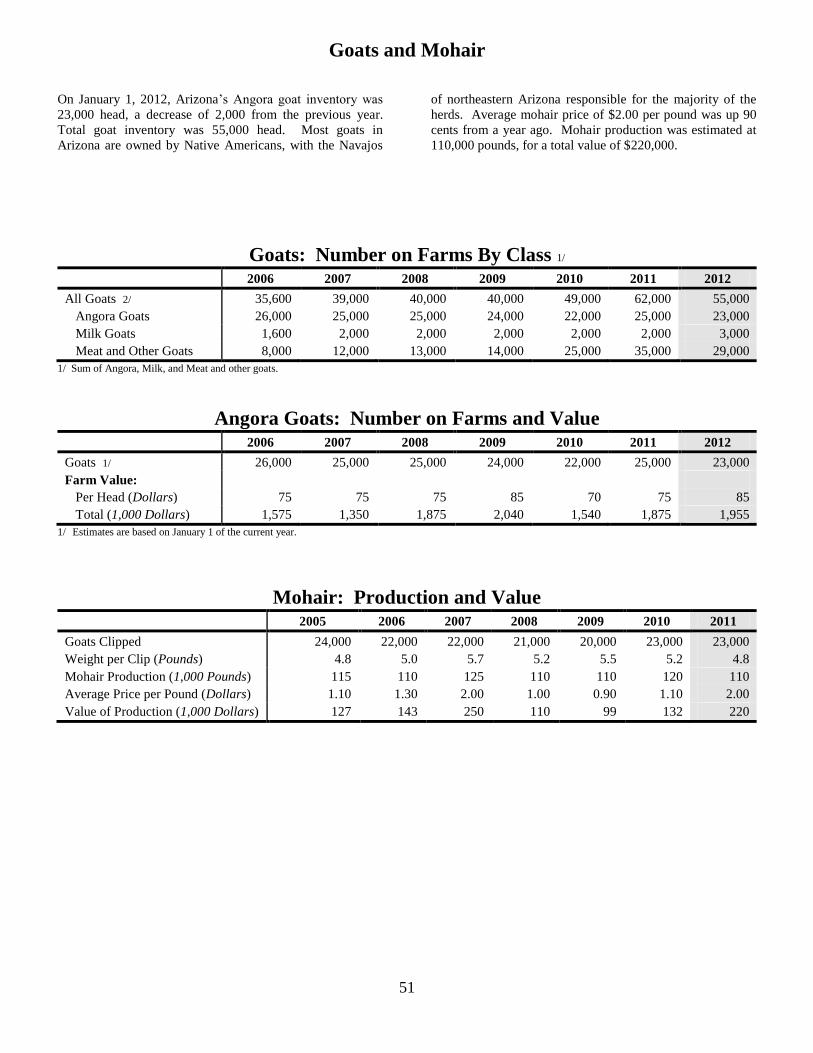
51
Goats and Mohair
On January 1, 2012, Arizona’s Angora goat inventory was
23,000 head, a decrease of 2,000 from the previous year.
Total goat inventory was 55,000 head. Most goats in
Arizona are owned by Native Americans, with the Navajos
of northeastern Arizona responsible for the majority of the
herds. Average mohair price of $2.00 per pound was up 90
cents from a year ago. Mohair production was estimated at
110,000 pounds, for a total value of $220,000.
Goats: Number on Farms By Class 1/
2006 2007 2008 2009 2010 2011 2012
All Goats 2/ 35,600 39,000 40,000 40,000 49,000 62,000 55,000
Angora Goats 26,000 25,000 25,000 24,000 22,000 25,000 23,000
Milk Goats 1,600 2,000 2,000 2,000 2,000 2,000 3,000
Meat and Other Goats 8,000 12,000 13,000 14,000 25,000 35,000 29,000
1/ Sum of Angora, Milk, and Meat and other goats.
Angora Goats: Number on Farms and Value
2006 2007 2008 2009 2010 2011 2012
Goats 1/ 26,000 25,000 25,000 24,000 22,000 25,000 23,000
Farm Value:
Per Head (Dollars) 75 75 75 85 70 75 85
Total (1,000 Dollars) 1,575 1,350 1,875 2,040 1,540 1,875 1,955
1/ Estimates are based on January 1 of the current year.
Mohair: Production and Value
2005 2006 2007 2008 2009 2010 2011
Goats Clipped 24,000 22,000 22,000 21,000 20,000 23,000 23,000
Weight per Clip (Pounds) 4.8 5.0 5.7 5.2 5.5 5.2 4.8
Mohair Production (1,000 Pounds) 115 110 125 110 110 120 110
Average Price per Pound (Dollars) 1.10 1.30 2.00 1.00 0.90 1.10 2.00
Value of Production (1,000 Dollars) 127 143 250 110 99 132 220

52
Meat Production
Livestock Slaughter Plants: Number by Type of Inspection,
January 1, 2006-2012 1/
2006 2007 2008 2009 2010 2011 2012
-----------------------------------------------------Number----------------------------------------------------
Under Federal Inspection 3 3 2 2 3 3 3
Other 10 11 11 10 9 9 9
Total 13 14 13 12 12 12 12
1/ Includes “Temporarily Closed” Plants.
Commercial Red Meat Production: Number of Pounds by Month, 2005-2011 1/
2005 2006 2007 2008 2009 2010 2011
----------------------------------------------------1,000 Pounds------------------------------------------------
January 28,300 33,000 33,500 34,000 31,500 31,000 31,300
February 26,000 27,700 31,100 35,400 29,200 29,900 34,800
March 30,000 35,400 33,700 33,100 31,200 34,100 33,400
April 27,500 28,800 30,400 36,800 30,600 33,800 29,700
May 28,700 33,000 33,100 36,600 30,400 32,900 32,600
June 30,200 31,900 35,800 34,000 31,600 32,300 38,600
July 29,300 33,900 36,200 34,900 32,200 31,500 36,200
August 33,800 34,700 35,600 33,900 30,700 32,800 37,600
September 31,100 31,500 34,800 33,500 29,000 32,300 34,500
October 27,900 30,800 36,100 32,600 27,600 31,200 33,300
November 33,600 33,800 34,100 29,600 28,900 34,500 33,200
December 34,100 32,100 31,500 33,700 29,700 34,900 38,400
Year 2/ 360,500 386,500 405,900 408,300 362,500 391,200 413,700
1/ Includes total beef, veal, pork, and lamb and mutton, excluding farm slaughter. 2/ Numbers may not add due to rounding.

53
Commercial Cattle Slaughter: Number of Head and
Total Live Weight by Month, 2005-2011 1/
2005 2/ 2006 2/ 2007 2008 2009 2010 2011
------------------------------------------------- Number ------------------------------------------------
January 41,600 43,100 45,100 43,600 42,600
February 38,500 44,900 40,000 41,600 47,100
March 41,900 41,700 43,200 47,400 44,700
April 37,800 46,200 41,700 47,400 39,800
May 40,900 46,000 42,600 47,800 44,100
June 44,400 42,400 46,400 46,800 52,000
July 44,400 45,200 44,900 43,700 49,500
August 43,900 45,900 45,400 44,100 52,000
September 43,000 47,600 41,700 44,300 48,600
October 45,200 46,900 41,100 43,000 46,400
November 42,900 42,300 41,900 47,900 46,300
December 39,400 46,900 41,800 48,000 52,000
Total 3/ 504,100 539,100 515,900 545,500 565,000
---------------------------------------- 1,000 Pounds Live Weight ---------------------------------------
January 57,628 60,173 57,860 56,239 54,560
February 53,598 63,151 52,266 53,592 60,779
March 58,019 58,998 56,483 61,300 57,618
April 51,883 64,708 54,154 61,368 50,845
May 56,079 63,164 54,426 60,222 55,947
June 60,428 58,703 58,182 59,121 66,475
July 61,039 61,689 57,120 55,430 62,763
August 60,665 62,376 57,325 56,893 65,592
September 59,846 62,079 52,975 56,843 60,915
October 63,752 60,258 51,137 55,603 58,966
November 60,123 54,711 53,504 61,829 59,323
December 55,377 61,712 54,002 61,665 67,219
Total 3/ 698,437 731,723 659,433 700,105 721,003
1/ Includes slaughter in federally inspected and in other slaughter plants, but excludes animals slaughtered on farms. 2/ Not published to avoid disclosure of individual operations. 3/ Numbers may not add due to rounding.
Commercial Hog Slaughter: Number of Head and
Total Live Weight by Month, 2005-20111/ 2/
2005 2006 2007 2008 2009 2010 2011
------------------------------------------------- Number ------------------------------------------------
January 400 300 300 300 100 100 100
February 300 200 200 100 100 100 100
March 400 300 200 200 200 200 200
April 600 900 500 500 200 200 200
May 500 300 400 300 100 100 100
June 200 200 200 100 100 100 100
July 100 200 100 200 100 100 100
August 200 200 100 100 100 100
September 400 300 300 200 200 200 200
October 200 200 300 100 100 100 200
November 300 200 200 100 100 100 100
December 300 300 200 100 100 100 100
Total 3/ 4,000 3,500 2,900 2,100 1,500 1,500 1,500
See footnotes at end of table ---Continued on next page

54
Commercial Hog Slaughter: Number of Head and
Total Live Weight by Month, 2005-2011 1/ 2/ —Continued
2005 2006 2007 2008 2009 2010 2011
---------------------------------------- 1,000 Pounds Live Weight ---------------------------------------
January 50 49 39 44 42 31 29
February 37 29 34 27 21 24 18
March 82 71 44 40 40 47 39
April 135 206 116 109 47 45 40
May 99 65 95 58 24 28 34
June 42 35 40 36 16 21 20
July 25 26 23 28 17 20 16
August 30 28 25 16 23 23
September 81 71 57 42 56 49 50
October 46 43 52 34 32 30 41
November 51 38 44 18 35 30 22
December 32 44 29 30 34 21 28
Total 3/ 710 705 599 483 377 369 360
1/ Includes slaughter in federally inspected and in other slaughtering plants, but excludes animals slaughtered on farms. 2/ Data not published to avoid disclosing individual operations.
3/ Numbers may not add due to rounding.
Commercial Sheep and Lamb Slaughter: Number of Head and
Total Live Weight by Month, 2005-2011 1/ 2/
2005 2006 2007 2008 2009 2010 2011
------------------------------------------------- Number ------------------------------------------------
January 100 100 100 100 200 100
February 100 100 100 100 100 100
March 200 100 100 200 200 200
April 300 200 100 200 200 300
May 100 100 100 100 200 200
June 100 100 100 200 200
July 100 100 200 200 200
August 100 100 300 300 300
September 200 200 100 400 300 300
October 200 100 100 300 200 200
November 100 100 100 200 200 300
December 100 100 100 300 300 200
Total 3/ 1,400 1,500 1,000 2,400 2,700 2,700
---------------------------------------- 1,000 Pounds Live Weight ---------------------------------------
January 13 7 6 6 20 18
February 6 18 8 7 16 20
March 30 15 13 27 32 30
April 35 20 15 27 30 32
May 9 12 10 15 22 18
June 9 11 15 26 26
July 7 5 17 25 23
August 9 5 24 29 38
September 22 18 11 35 34 31
October 14 12 14 26 28 26
November 7 8 8 23 25 30
December 11 10 7 32 32 31
Total 3/ 166 145 107 255 318 324
1/ Includes slaughter in federally inspected and in other slaughter plants, but excludes animals slaughtered on farms. 2/ Data not published to avoid disclosing individual operations. 3/ Numbers may not add due to rounding.

55
Honey
Arizona’s honey production during 2011 was estimated at 1.22
million pounds, a 34 percent decrease from 2010. Average
yield from the 23,000 honey producing colonies was 53
pounds per colony, 24 pounds less than last year.
Prices for the 2011 honey crop averaged $1.50 per pound, a
decrease of 2 cents from last year. The value of the honey
produced by Arizona apiarists was estimated at $1.83 million,
a decrease of 35 percent from 2010.
Estimates of honey production and colonies represent
operations where honey is taken from colonies for sale or
human consumption. Honey produced by beekeepers with
fewer than five colonies is not included. Packaged bees and
bees for pollination are included only if some honey was
removed for human consumption.
Honey: Number of Colonies, Yield, Production, Price, and Value
2005 2006 2007 2008 2009 2010 2011
Honey producing colonies (1,000) 1/ 36 30 30 25 20 24 23
Yield per colony (Pounds) 50 65 64 64 52 77 53
Production (1,000 Pounds) 1,800 1,950 1,920 1,600 1,040 1,848 1,219
Average price per pound (Dollars) 2/ 1.04 0.91 1.26 1.26 1.45 1.52 1.50
Value of production (1,000 Dollars) 3/ 1,872 1,775 2,419 2,016 1,508 2,809 1,829
1/ Honey producing colonies are the maximum number of colonies from which honey was taken during the year. It is possible to
take honey from colonies which did not survive the entire year. 2/ Average price per pound based on expanded sales.
3/ Value of production is equal to production multiplied by average price per pound.
0.50
0.60
0.70
0.80
0.90
1.00
1.10
1.20
1.30
1.40
1.50
1.60
0
200
400
600
800
1,000
1,200
1,400
1,600
1,800
2,000
2,200
2,400
2,600
2005 2006 2007 2008 2009 2010 2011
$ / P
ou
nd
(00
0)
Po
un
ds
Honey Production & Price
2005-2011
(000) Pounds $ / Pound

56
Field Crops
Hay: Arizona’s 2011 alfalfa yield again led the nation at 8.3
tons per acre. California was the next closest state, at 6.9
tons per acre. Nationally, alfalfa yields averaged 3.40 tons
per acre. Arizona’s harvested acres, at 250,000, was down
11 percent from last year. Total production was 2.08 million
tons. Acreage of other hay cut decreased 5,000 acres to
35,000 acres. Production was set at 140,000 tons.
Preliminary marketing year average prices for alfalfa
increased to a record high $222.00 per ton, $93 more than in
2010. Prices for other hay during the marketing year
averaged a record high $171.00, an increase of $47 from last
year.
Cotton: Upland, at 250,000 planted acres, was up 55,000
from 2010. Yield averaged a record high 1,548 pounds per
acre, up 31 pounds from last year’s record high yield.
Upland production was estimated at 800,000 bales, an
increase of 190,000 bales from 2010 and the highest
production since 1997. American-Pima, at 10,000 acres
planted, was up 7,500 acres from last year. Total American-
Pima production was 20,000 bales, the highest since 1998.
The average price for Arizona upland cotton through
December, 2011 was a record high 94.4 cents per pound.
The average price for U.S. American-Pima cotton through
December, 2011 was $1.64 per pound, a 15 cent decrease
from the previous year.
Corn: Acreage, at 55,000 acres planted, was up 10,000
acres from last year. Of the 55,000 acres, 32,000 were
harvested for grain and 23,000 for silage. The average yield
for grain, at 180 bushels per acre, was down 30 bushels from
a year ago. Prices received for grain corn was $6.60 per
bushel, up 80 cents from the previous year.
Wheat: Acreage planted to Durum wheat was the same as
the previous year at 80,000 acres. Average yield, at 101
bushels per acre, was down 14 bushels per acre from the
2010 crop. The average price received, at $8.35 per bushel
was up $2.74 per bushel from a year ago.
Other wheat planted acreage, at 7,000 acres, was down 2,000
acres from the previous year. Yield averaged 70 bushels per
acre, down 5 bushels from a year earlier. Other wheat is
included in winter wheat nationally. The national average
yield was 46.2 bushels per acre. Prices averaged $6.70 per
bushel in Arizona and $6.85 nationally.
Barley: Planted area was estimated at 65,000 acres, up
20,000 acres from the previous year and the highest acreage
since 1997. Of those 65,000 acres, 64,000 acres were
harvested for grain, yielding 125 bushels per acre, netting a
production of 8.00 million bushels, the highest production
since 1973.
The marketing year average price in Arizona, at $4.70 per
bushel, was up 88 cents from a year earlier. Nationally,
barley prices averaged $5.40 a bushel.
Sorghum: Planted acreage in the State was 22,000, with
6,000 acres harvested for grain and 15,000 acres for silage.
Average yield for grain, at 100 bushels per acre, was down
20 bushels from a year ago. Annual average price received
for sorghum grain was a record high $12.50 per cwt, an
increase of $3.40 per cwt from last year.
Dry Beans: This is Arizona’s third year in the dry edible
bean estimating program. Arizona producers harvested
8,200 acres of dry edible beans in 2011, The average yield
was 1,890 pounds per acre, 10 pounds higher than the 2010
yield. Arizona’s total production was 155,000 cwt., down
88,000 cwt from the previous year.
All Hay, $485
All Sorghum, $8.2
Barley, $37.6
Cottonseed, $90.8
All Corn, $69.0
All Wheat, $69.4
Upland Cotton (Lint),
$362
Field Crop Value of Production
2011 Season
(Million Dollars)
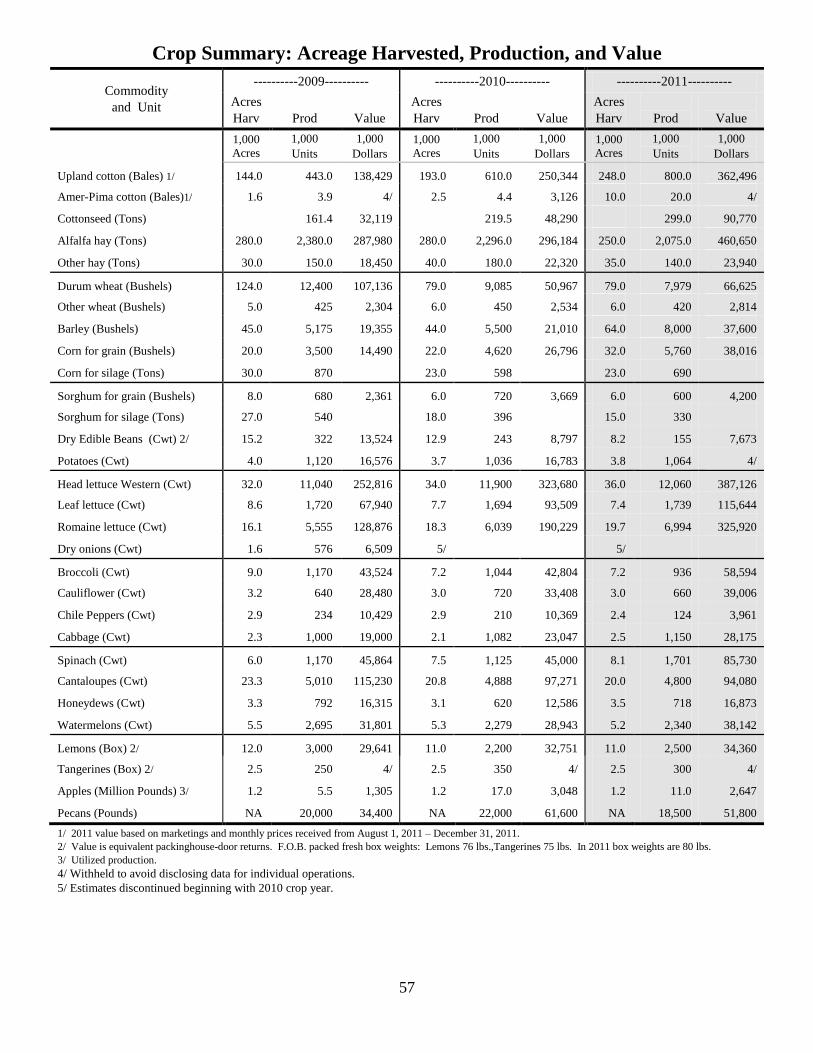
57
Crop Summary: Acreage Harvested, Production, and Value
Commodity
and Unit
----------2009---------- ----------2010---------- ----------2011----------
Acres
Harv
Prod
Value
Acres
Harv
Prod
Value
Acres
Harv
Prod
Value
1,000
Acres
1,000
Units
1,000
Dollars
1,000
Acres
1,000
Units
1,000
Dollars
1,000
Acres
1,000
Units
1,000
Dollars
Upland cotton (Bales) 1/ 144.0 443.0 138,429 193.0 610.0 250,344 248.0 800.0 362,496
Amer-Pima cotton (Bales)1/ 1.6 3.9 4/ 2.5 4.4 3,126 10.0 20.0 4/
Cottonseed (Tons) 161.4 32,119 219.5 48,290 299.0 90,770
Alfalfa hay (Tons) 280.0 2,380.0 287,980 280.0 2,296.0 296,184 250.0 2,075.0 460,650
Other hay (Tons) 30.0 150.0 18,450 40.0 180.0 22,320 35.0 140.0 23,940
Durum wheat (Bushels) 124.0 12,400 107,136 79.0 9,085 50,967 79.0 7,979 66,625
Other wheat (Bushels) 5.0 425 2,304 6.0 450 2,534 6.0 420 2,814
Barley (Bushels) 45.0 5,175 19,355 44.0 5,500 21,010 64.0 8,000 37,600
Corn for grain (Bushels) 20.0 3,500 14,490 22.0 4,620 26,796 32.0 5,760 38,016
Corn for silage (Tons) 30.0 870 23.0 598 23.0 690
Sorghum for grain (Bushels) 8.0 680 2,361 6.0 720 3,669 6.0 600 4,200
Sorghum for silage (Tons) 27.0 540 18.0 396 15.0 330
Dry Edible Beans (Cwt) 2/ 15.2 322 13,524 12.9 243 8,797 8.2 155 7,673
Potatoes (Cwt) 4.0 1,120 16,576 3.7 1,036 16,783 3.8 1,064 4/
Head lettuce Western (Cwt) 32.0 11,040 252,816 34.0 11,900 323,680 36.0 12,060 387,126
Leaf lettuce (Cwt) 8.6 1,720 67,940 7.7 1,694 93,509 7.4 1,739 115,644
Romaine lettuce (Cwt) 16.1 5,555 128,876 18.3 6,039 190,229 19.7 6,994 325,920
Dry onions (Cwt) 1.6 576 6,509 5/ 5/
Broccoli (Cwt) 9.0 1,170 43,524 7.2 1,044 42,804 7.2 936 58,594
Cauliflower (Cwt) 3.2 640 28,480 3.0 720 33,408 3.0 660 39,006
Chile Peppers (Cwt) 2.9 234 10,429 2.9 210 10,369 2.4 124 3,961
Cabbage (Cwt) 2.3 1,000 19,000 2.1 1,082 23,047 2.5 1,150 28,175
Spinach (Cwt) 6.0 1,170 45,864 7.5 1,125 45,000 8.1 1,701 85,730
Cantaloupes (Cwt) 23.3 5,010 115,230 20.8 4,888 97,271 20.0 4,800 94,080
Honeydews (Cwt) 3.3 792 16,315 3.1 620 12,586 3.5 718 16,873
Watermelons (Cwt) 5.5 2,695 31,801 5.3 2,279 28,943 5.2 2,340 38,142
Lemons (Box) 2/ 12.0 3,000 29,641 11.0 2,200 32,751 11.0 2,500 34,360
Tangerines (Box) 2/ 2.5 250 4/ 2.5 350 4/ 2.5 300 4/
Apples (Million Pounds) 3/ 1.2 5.5 1,305 1.2 17.0 3,048 1.2 11.0 2,647
Pecans (Pounds) NA 20,000 34,400 NA 22,000 61,600 NA 18,500 51,800
1/ 2011 value based on marketings and monthly prices received from August 1, 2011 – December 31, 2011.
2/ Value is equivalent packinghouse-door returns. F.O.B. packed fresh box weights: Lemons 76 lbs.,Tangerines 75 lbs. In 2011 box weights are 80 lbs.
3/ Utilized production.
4/ Withheld to avoid disclosing data for individual operations.
5/ Estimates discontinued beginning with 2010 crop year.

58
Crops: Record Highs and Lows
Date
Series
began
Record
-------Acreage------- ----------Yield------------ ----------Production-----------
Harvested Year 1/ Unit Per acre Year 1/ Unit Total Year 1/
1,000 Acres 1,000 Units
All cotton 1912 High
Low
690.0
0.4
1953
1912
Pounds 1,526.0
212.0
2011
1920
Bales 1,609.7
0.3
1981
1912
Upland cotton
1917 High
Low
648.5
8.0
1953
1917
Pounds 1,548.0
228.0
2011
1922
Bales 1,556.0
7.1
1981
1917
Amer-Pima cotton
1912 High
Low
244.5
0.3
1989
1947
Pounds 1,170.0
180.0
2009
1943
Bales 477.0
0.2
1989
1947
Cottonseed 1917 High
Low
Tons 631
10
1981
1917
All hay 1909 High Low
332.0 98.0
1944 1909
Tons 8.16 1.97
2009 1940
Tons 2,530 237
2009 1909
Alfalfa hay 1919 High Low
280.0 82.0
2009 1920
Tons 8.60 2.20
2008 1940
Tons 2,380 238
2009 1920
All wheat 1882 High Low
431.0 11.0
1976 1883
Bushel 112.2 12.0
2010 1890
Bushels 32,325 182
1976 1894
Durum wheat
1976 High Low
319.0 39.0
1976 1991
Bushel 115.0 70.0
2010 1978
Bushel 23,925 3,705
1976 1991
Other Wheat 2/
1909 High Low
260.0 2.0
1975 2006
Bushel 105.0 14.5
1999 1941
Bushel 18,200 160
1975 2005
Barley 1882 High
Low
268.0
8.0
1954
1928
Bushel 125.0
21.5 2011
1893
Bushel 13,936
244
1954
1928
Corn for grain
1882 High Low
50.0 3.0
1978 1887
Bushel 208.0 9.2
2001 1944
Bushel 7,000 57
1996 1887
Corn for silage
1919 High Low
35.8 2.0
2008 1934
Tons 30.0
5.0 2011
1935 Tons 1,050
10 2008 1934
Potatoes 1899 High Low
12.8 1.0
1969 1912
Cwt 315.0 18.0
1989 1900
Cwt 3,024 18
1999 1900
All oranges
1919/20 High Low
Box 5,260 54
1968/69 1927/28
Navel oranges
1934/35 High Low
Box 1,150 87
1968/69 1934/35
Valencia oranges
1934/35 High Low
Box 4,110 73
1968/69 1936/37
Grapefruit 1919/20 High Low
Box 4,100 25
1946/47 2008/09
Lemons 1958/59 High Low
Box 7,200 340
1974/75 1958/59
Tangerines 1964/65 High
Low Box 1,350
190 1983/84 1964/65
All grapes 1909 High
Low Tons 31,000
0.3 1987 1920
.. All apples 1981 High
Low Pounds 100,000
280 1996 1983
.. 1/ The latest year a record was achieved. Some records were equaled in earlier years. 2/ Included durum wheat prior to 1976.
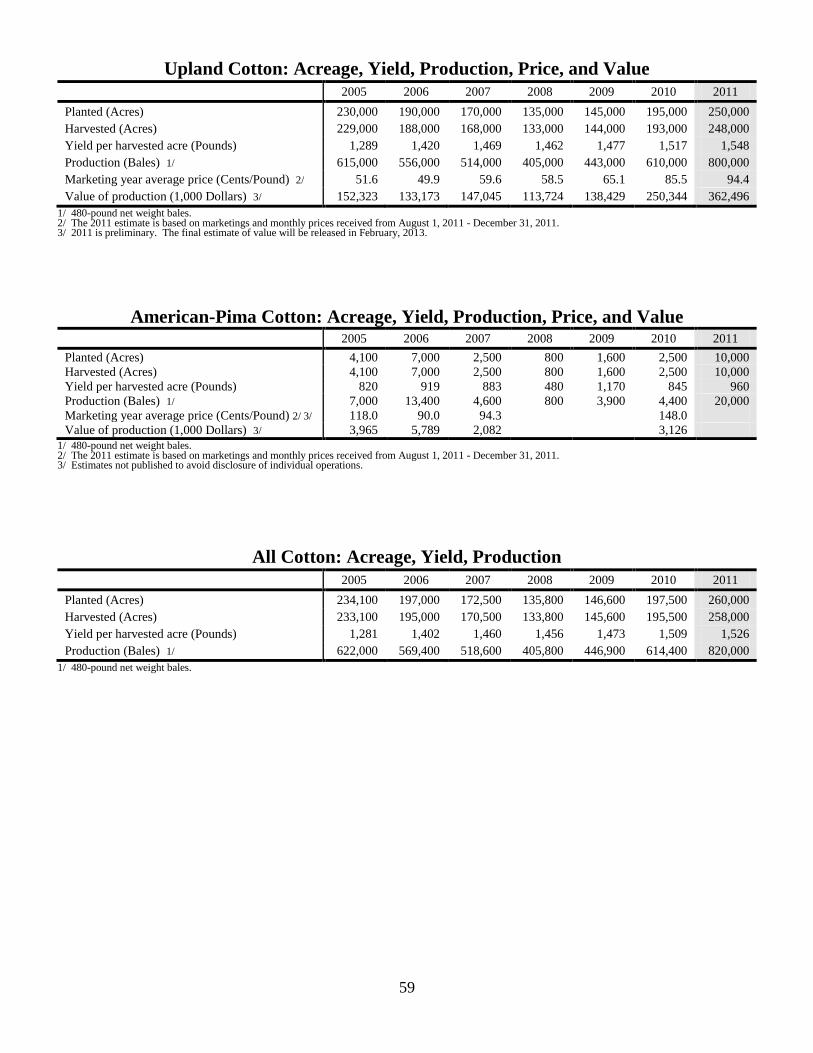
59
Upland Cotton: Acreage, Yield, Production, Price, and Value
2005 2006 2007 2008 2009 2010 2011
Planted (Acres) 230,000 190,000 170,000 135,000 145,000 195,000 250,000
Harvested (Acres) 229,000 188,000 168,000 133,000 144,000 193,000 248,000
Yield per harvested acre (Pounds) 1,289 1,420 1,469 1,462 1,477 1,517 1,548
Production (Bales) 1/ 615,000 556,000 514,000 405,000 443,000 610,000 800,000
Marketing year average price (Cents/Pound) 2/ 51.6 49.9 59.6 58.5 65.1 85.5 94.4
Value of production (1,000 Dollars) 3/ 152,323 133,173 147,045 113,724 138,429 250,344 362,496
1/ 480-pound net weight bales. 2/ The 2011 estimate is based on marketings and monthly prices received from August 1, 2011 - December 31, 2011. 3/ 2011 is preliminary. The final estimate of value will be released in February, 2013.
American-Pima Cotton: Acreage, Yield, Production, Price, and Value 2005 2006 2007 2008 2009 2010 2011
Planted (Acres) 4,100 7,000 2,500 800 1,600 2,500 10,000
Harvested (Acres) 4,100 7,000 2,500 800 1,600 2,500 10,000
Yield per harvested acre (Pounds) 820 919 883 480 1,170 845 960
Production (Bales) 1/ 7,000 13,400 4,600 800 3,900 4,400 20,000
Marketing year average price (Cents/Pound) 2/ 3/ 118.0 90.0 94.3 148.0
Value of production (1,000 Dollars) 3/ 3,965 5,789 2,082 3,126
1/ 480-pound net weight bales. 2/ The 2011 estimate is based on marketings and monthly prices received from August 1, 2011 - December 31, 2011. 3/ Estimates not published to avoid disclosure of individual operations.
All Cotton: Acreage, Yield, Production
2005 2006 2007 2008 2009 2010 2011
Planted (Acres) 234,100 197,000 172,500 135,800 146,600 197,500 260,000
Harvested (Acres) 233,100 195,000 170,500 133,800 145,600 195,500 258,000
Yield per harvested acre (Pounds) 1,281 1,402 1,460 1,456 1,473 1,509 1,526
Production (Bales) 1/ 622,000 569,400 518,600 405,800 446,900 614,400 820,000
1/ 480-pound net weight bales.

60
Upland Cotton Varieties Planted In 2011, the most popular upland cotton variety planted in
United States was Phytogen 375 WRF, according to USDAs
Agricultural Marketing Service, Cotton Division. It was the
fifth most popular variety planted in Arizona. Deltapines’s
DP 164 B2RF was the most popular variety planted in
Arizona. It was planted to 32 percent of the State’s Upland
acreage.
Pima Cotton Varieties Planted In 2011, the most popular pima cotton variety planted was
Phytogen’s PHY 805 RF variety which was planted to 60
percent of the US pima cotton acreage. Arizona’s top pima
variety was also Phytogen’s PHY 805 RF variety planted to
79 percent of Arizona’s pima cotton acreage.
Upland Cotton: Arizona Percentage Planted to Specified Varieties 1/ Variety 2007 2008 2009 2010 2011
------------------------------------------ Percent -------------------------------------------- Deltapine DP 164 B2RF 10.65 28.53 25.29 27.20 32.46
Deltapine DP 1044 B2RF 1.50 11.08
Bayer CropScience ‐ Stoneville ST 4498 B2RF 2.32 6.62 16.00 8.22
Deltapine DP 912 B2RF 2.38 7.80 7.42
Phytogen PHY 375 WRF 4.40 5.54
Bayer CropScience ‐ FiberMax FM 1740 B2F 0.32 9.60 5.11
Deltapine DP 935 B2RF 0.75 7.10 3.53
Deltapine DP 1048 B2RF 1.80 2.66
Deltapine DP 161 B2RF 9.03 15.29 1.30 2.43
Bayer CropScience ‐ Stoneville ST 5288 B2F 1.50 2.17
Bayer CropScience ‐ Stoneville ST 4427 B2F 1.97
Deltapine DP 1028 B2RF 1.20 1.92
Bayer CropScience ‐ Stoneville ST 4554 B2RF 4.57 10.17 13.46 4.00 1.67
Bayer CropScience ‐ Stoneville ST 5458 B2F 3.18 0.90 1.66
Bayer CropScience ‐ FiberMax FM 9063 B2F 2.18 2.07 3.73 0.80 1.28
Bayer CropScience ‐ FiberMax FM 9170 B2F 4.50 1.27
Deltapine DP 924 B2RF 1.28 1.30 1.18
Deltapine DP 449 BG/RR 18.67 6.20 1.12 0.50 1.10
Bayer CropScience ‐ FiberMax FM 9180 B2F 2.42 0.50 1.09
Deltapine DP 1032B2RF 0.86
Deltapine DP 920 B2RF 0.67 0.40 0.65
Bayer CropScience ‐ FiberMax FM 9058 F 0.60
Phytogen PHY 565 WRF 0.50 0.58
All Other 2/ 63.93 41.68 23.49 7.20 3.55
1/ Ranked by largest percent in 2011. 2/ Includes most commonly used varieties. Source: United States Department of Agriculture, Agricultural Marketing Service, Cotton Division.
Pima Cotton: Estimated Percentage Planted to Specified Varieties 1/ Variety 2007 2008 3/ 2009 3/ 2010 3/ 2011
------------------------------------------- Percent -------------------------------------------- Phytogen PHY 805 RF 78.90
Phytogen PHY 830 8.72
Phytogen PHY 800 Pima 13.33 4.53
Deltapine DP 360 1.31
All Other 2/ 86.67 6.54
1/ Ranked by largest percent in 2011. 2/ Includes most commonly used varieties. Source: United States Department of Agriculture, Agricultural Marketing Service, Cotton Division. 3/ Not Available.
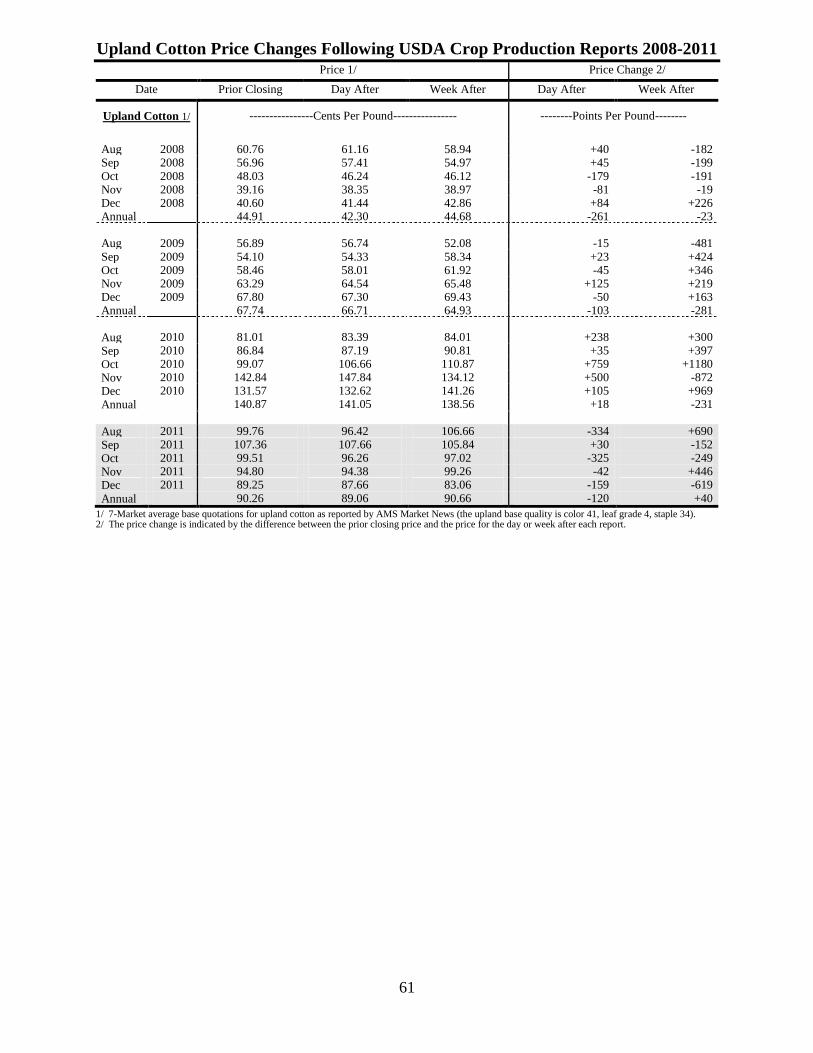
61
Upland Cotton Price Changes Following USDA Crop Production Reports 2008-2011 Price 1/ Price Change 2/
Date Prior Closing Day After Week After Day After Week After
Upland Cotton 1/ ----------------Cents Per Pound---------------- --------Points Per Pound--------
Aug 2008 60.76 61.16 58.94 +40 -182 Sep 2008 56.96 57.41 54.97 +45 -199 Oct 2008 48.03 46.24 46.12 -179 -191 Nov 2008 39.16 38.35 38.97 -81 -19 Dec 2008 40.60 41.44 42.86 +84 +226 Annual 44.91 42.30 44.68 -261 -23
Aug 2009 56.89 56.74 52.08 -15 -481 Sep 2009 54.10 54.33 58.34 +23 +424 Oct 2009 58.46 58.01 61.92 -45 +346 Nov 2009 63.29 64.54 65.48 +125 +219 Dec 2009 67.80 67.30 69.43 -50 +163 Annual 67.74 66.71 64.93 -103 -281
Aug 2010 81.01 83.39 84.01 +238 +300
Sep 2010 86.84 87.19 90.81 +35 +397
Oct 2010 99.07 106.66 110.87 +759 +1180
Nov 2010 142.84 147.84 134.12 +500 -872
Dec 2010 131.57 132.62 141.26 +105 +969
Annual 140.87 141.05 138.56 +18 -231
Aug 2011 99.76 96.42 106.66 -334 +690
Sep 2011 107.36 107.66 105.84 +30 -152
Oct 2011 99.51 96.26 97.02 -325 -249
Nov 2011 94.80 94.38 99.26 -42 +446
Dec 2011 89.25 87.66 83.06 -159 -619
Annual 90.26 89.06 90.66 -120 +40
1/ 7-Market average base quotations for upland cotton as reported by AMS Market News (the upland base quality is color 41, leaf grade 4, staple 34). 2/ The price change is indicated by the difference between the prior closing price and the price for the day or week after each report.

62
Cotton Progress
Survey Week 2005 2006 2007 2008 2009 2010 2011
------------------------------------------------Percent of Acreage-----------------------------------------------
Planted:
March 30 6 8 9 15 16 20 10
April 10 19 15 20 22 24 30 20
April 20 40 33 38 40 35 37 38
April 30 65 56 60 55 55 65 68
May 10 88 79 75 69 70 80 81
May 20 93 90 95 83 88 87 93
May 30 98 98 98 87 97 91 99
Squaring:
May 30 8 5 15 8 5 5 10
June 10 25 27 35 23 15 25 34
June 20 40 48 60 50 28 43 52
June 30 66 65 73 62 40 50 69
July 10 82 88 92 75 75 70 75
July 20 90 100 100 85 85 82 87
Setting Bolls:
June 20 6 7 10 8 5 5 10
June 30 16 20 29 22 16 15 26
July 10 48 49 50 40 42 25 32
July 20 65 73 70 50 56 56 54
July 30 83 96 85 65 78 74 70
August 10 89 97 89 85 87 82 87
Open Bolls:
August 10 15 23 23 20 17 25 33
August 20 29 34 35 35 37 29 40
August 30 43 58 58 58 48 46 57
September 10 64 75 69 75 65 65 73
September 20 77 82 85 88 82 80 86
September 30 92 92 95 96 88 90 93
October 10 96 96 98 99 92 97 98
Harvested:
September 10 0 7 7 13 13 7 5
September 20 5 12 11 16 17 12 15
September 30 13 18 15 22 23 17 19
October 10 18 23 21 26 28 20 22
October 20 30 32 34 34 38 23 33
October 30 45 44 47 45 52 40 40
November 10 52 58 64 55 67 48 52
November 20 73 67 72 62 73 60 60
November 30 82 79 78 70 79 65 68
December 10 86 89 87 78 88 78 75
December 20 90 95 92 84 95 92 86
December 30 97 97 95 92 99 98 90
January 10 100 100 100 99 100 99 94

63
Cottonseed: Production, Disposition, Price, and Value 2005 2006 2007 2008 2009 2010 2011
Production (1,000 Tons) 262.5 214.2 182.8 140.3 161.4 219.5 299.0
Farm disposition
Sales to oil mills (1,000 Tons)
Other uses (1,000 Tons) 1/ 262.5 214.2 182.8 140.3 161.4 219.5 299.0
Seed for planting (1,000 Tons) 2/ 3/ 1.5 1.3 1.1 1.1 1.5 2.0 1.5
Marketing year average price ($ per Ton) 134 167 198 285 199 220 313
Value of production (1,000 Dollars) 4/ 35,175 35,771 36,194 39,986 32,119 48,290 90,770
1/ Includes planting seed, feed, exports, inter-farm sales, shrinkage, losses, and other uses. 2/ Included in ‘other’ farm disposition. Seed for planting is produced in crop year shown, but used in the following year. 3/ 2010 Revised. 4/ 2011 is preliminary. The final estimate of value will be released in February, 2013.
Cottonseed: Monthly and Marketing Year
Average Prices Received by Growers
2005/06 2006/07 2007/08 2008/09 2009/10 2010/11 2011/12
September 1/ 1/ 2/ 2/ 2/ 2/ 1/
October 149 172 206 360 187 2/ 1/
November 134 164 194 290 177 212 302
December 131 170 192 272 198 204 309
January 136 162 206 277 231 227 307
February 127 173 2/ 2/ 2/ 2/ 299
Marketing year average 134 167 198 285 199 220 313
1/ Not published to avoid disclosure of individual firms.
2/ Insufficient movement to establish a price.

64
All Cotton: Running Bales Ginned and Produced
Upland American-Pima
Year
Running
Bales
Ginned
Equivalent
480-Pound
Bales Ginned
Running
Bales
Produced
Year
Running
Bales
Ginned
Equivalent
480-Pound
Bales Ginned
Running
Bales
Produced
---------------Bales--------------- ---------------Bales---------------
2005 572,300 589,000 597,300 2005 6,750 6,950 6,750
2006 516,600 530,700 541,050 2006 13,350 13,800 12,900
2007 480,200 491,900 501,300 2007 4,450 4,550 4,400
2008 376,600 386,800 393,700 2008 750 750 750
2009 420,350 433,850 428,500 2009 3,950 4,050 3,750
2010 560,500 577,200 591,900 2010 4,200 4,350 4,250
2011 738,300 755,050 778,950 2011 19,850 20,500 19,600
0%
10%
20%
30%
40%
50%
60%
70%
80%
90%
100%
0%
10%
20%
30%
40%
50%
60%
70%
80%
90%
100%
Oct 1 Oct 15 Nov 1 Nov 15 Dec 1 Dec 15 Jan 1 Jan 15 Feb 1 Final
All Cotton Running Bales Percent of Total Crop Ginned
2007 - 2011
2007 2008 2009 2010 2011

65
All Hay: Acreage, Yield, Production, Price, and Value 1/ 2005 2006 2007 2008 2009 2010 2011
Harvested (Acres) 300,000 295,000 295,000 295,000 310,000 320,000 285,000
Yield per acre (Tons) 7.75 7.63 7.43 8.08 8.16 7.74 7.77
Production (1,000 Tons) 2,324 2,251 2,192 2,383 2,530 2,476 2,215
Marketing year average price ($ per Ton) 2/ 124.00 130.00 150.00 184.00 121.00 128.00 219.00
Value of production (1,000 Dollars) 287,336 292,630 328,864 438,356 306,430 318,504 484,590
1/ Does not include green chop or grazed. 2/ Average price for the April through March marketing season.
Alfalfa Hay: Acreage, Yield, Production, Price, and Value 1/ 2005 2006 2007 2008 2009 2010 2011
Harvested (Acres) 260,000 250,000 255,000 260,000 280,000 280,000 250,000
Yield per acre (Tons) 8.40 8.30 8.00 8.60 8.50 8.20 8.30
Production (1,000 Tons) 2,184 2,075 2,040 2,236 2,380 2,296 2,075
Marketing year average price ($ per Ton) 2/ 124.00 130.00 151.00 185.00 121.00 129.00 222.00
Value of production (1,000 Dollars) 270,816 269,750 308,040 413,660 287,980 296,184 460,650
1/ Does not include green chop or grazed. 2/ Average price for the April through March marketing season.
Other Hay: Acreage, Yield, Production, Price, and Value 1/ 2005 2006 2007 2008 2009 2010 2011
Harvested (Acres) 40,000 45,000 40,000 35,000 30,000 40,000 35,000
Yield per acre (Tons) 3.50 3.90 3.80 4.20 5.00 4.50 4.00
Production (1,000 Tons) 140 176 152 147 150 180 140
Marketing year average price ($ per Ton) 2/ 118.00 130.00 137.00 168.00 123.00 124.00 171.00
Value of production (1,000 Dollars) 16,520 22,880 20,824 24,696 18,450 22,320 23,940
1/ Does not include green chop or grazed. 2/ Average price for the April through March marketing season.
Hay Stocks: On-Farm 2005 2006 2007 2008 2009 2010 2011
------------------------------------ Tons------------------------------------- May 1 35,000 40,000 35,000 36,000 50,000 60,000 40,000
December 1 350,000 350,000 260,000 475,000 500,000 365,000 250,000

66
All Hay: Monthly and Marketing Year Average Prices Received by Growers 1/ 2005/06 2006/07 2007/08 2008/09 2009/10 2010/11 2011/12 2/
------------------------------------------------ Dollars per Ton -----------------------------------------------
April 115.00 135.00 143.00 178.00 155.00 120.00
0000110.00
179.00 May 130.00 135.00 149.00 185.00 150.00 125.00 213.00 June 130.00 135.00 150.00 189.00 126.00 129.00 226.00 July 124.00 128.00 149.00 188.00 120.00 129.00 226.00 August 123.00 123.00 145.00 185.00 111.00 120.00 216.00 September 119.00 121.00 142.00 183.00 106.00 120.00 216.00 October 119.00 123.00 142.00 189.00 106.00 125.00 223.00 November 120.00 123.00 145.00 184.00 106.00 125.00 233.00 December 120.00 125.00 153.00 187.00 105.00 130.00 248.00 January 125.00 127.00 160.00 187.00 110.00 139.00 247.00 February 130.00 135.00 164.00 180.00 110.00 153.00 252.00 March 128.00 140.00 172.00 170.00 115.00 176.00 255.00
Marketing year average 124.00 130.00 150.00 184.00 121.00 128.00 219.00
1/ Does not include green chop or grazed. 2/ Preliminary for 2011/12.
Alfalfa Hay: Monthly and Marketing Year Average Prices Received by Growers 1/ 2005/06 2006/07 2007/08 2008/09 2009/10 2010/11 2011/12 2/
------------------------------------------------ Dollars per Ton -----------------------------------------------
April 115.00 135.00 143.00 178.00 155.00
0
120.00 180.00 May 130.00 135.00 149.00 185.00 150.00 125.00 215.00 June 130.00 135.00 151.00 190.00 125.00 130.00 230.00 July 125.00 128.00 151.00 190.00 120.00 130.00 230.00 August 123.00 123.00 146.00 187.00 110.00 120.00 220.00 September 120.00 120.00 143.00 185.00 105.00 120.00 220.00 October 120.00 123.00 143.00 190.00 105.00 125.00 225.00 November 120.00 123.00 146.00 185.00 105.00 125.00 235.00 December 120.00 125.00 153.00 188.00 105.00 130.00 250.00 January 125.00 127.00 160.00 188.00 110.00 140.00 250.00 February 130.00 135.00 165.00 180.00 110.00 155.00 255.00 March 128.00 140.00 172.00 170.00 115.00 180.00 260.00
Marketing year average 124.00 130.00 151.00 185.00 121.00 129.00 222.00
1/ Does not include green chop or grazed. 2/ Preliminary for 2011/12.
Other Hay: Monthly and Marketing Year Average Prices Received by Growers 1/ 2005/06 2006/07 2007/08 2008/09 2009/10 2010/11 2011/12 2/
------------------------------------------------ Dollars per Ton -----------------------------------------------
April 112.00 130.00 138.00 160.00
165.00 120.00 140.00 May 125.00 130.00 142.00 165.00 160.00 125.00 155.00 June 125.00 130.00 138.00 170.00 135.00 125.00 170.00 July 120.00 133.00 138.00 170.00 125.00 125.00 170.00 August 120.00 128.00 135.00 167.00 115.00 120.00 180.00 September 110.00 126.00 130.00 165.00 120.00 125.00 170.00 October 110.00 126.00 130.00 170.00 125.00 125.00 165.00 November 110.00 126.00 134.00 170.00 120.00 120.00 185.00 December 110.00 130.00 140.00 169.00 110.00 125.00 200.00 January 120.00 133.00 146.00 169.00 100.00 125.00 180.00 February 125.00 133.00 150.00 175.00 105.00 125.00 185.00 March 125.00 138.00 155.00 173.00 110.00 125.00 195.00
Marketing year average 118.00 130.00 137.00 168.00 123.00 124.00 171.00
1/ Does not include green chop or grazed. 2/ Preliminary for 2011/12.

67
Durum Wheat: Acreage, Yield, Production, Price, and Value
2005 2006 2007 2008 2009 2010 2011
Planted for all purposes (Acres) 80,000 75,000 83,000 150,000 125,000 80,000 80,000
For Grain
Harvested (Acres) 79,000 74,000 82,000 149,000 124,000 79,000 79,000
Yield per acre (Bushels) 100.0 100.0 102.0 98.0 100.0 115.0 101.0
Production (000 Bushels) 7,900 7,400 8,364 14,602 12,400 9,085 7,979
Marketing year average price ($ per Bu) 1/ 2/ 4.20 4.85 7.11 8.34 8.64 5.61 8.35
Value of production (1,000 Dollars) 33,180 35,890 59,468 121,781 107,136 50,967 66,625
1/ Average price for the May through April marketing season. 2/ Final price and value for 2011 will be released October, 2012.
Other Wheat: Acreage, Yield, Production, Price, and Value
2005 2006 2007 2008 2009 2010 2011
Planted for all purposes (Acres) 5,000 4,000 6,000 9,000 7,000 9,000 7,000
For Grain
Harvested (Acres) 2,000 2,000 4,000 6,000 5,000 6,000 6,000
Yield per acre (Bushels) 80.0 90.0 90.0 95.0 85.0 75.0 70.0
Production (000 Bushels) 160 180 360 570 425 450 420
Marketing year average price ($ per Bu) 1/ 2/ 3.60 4.91 5.17 7.39 5.42 5.63 6.70
Value of production (1,000 Dollars) 576 884 1,861 4,212 2,304 2,534 2,814
1/ Average price for the May through April marketing season. 2/ Final price and value for 2011 will be released October, 2012.
All Wheat: Acreage, Yield, Production, Price, and Value
2005 2006 2007 2008 2009 2010 2011
Planted for all purposes (Acres) 85,000 79,000 89,000 159,000 132,000 89,000 87,000
For Grain
Harvested (Acres) 81,000 76,000 86,000 155,000 129,000 85,000 85,000
Yield per acre (Bushels) 99.5 99.7 101.4 97.9 99.4 112.2 98.8
Production (000 Bushels) 8,060 7,580 8,724 15,172 12,825 9,535 8,399
Marketing year average price ($ per Bu) 1/ 2/ 4.19 4.85 7.03 8.27 8.64 5.61 8.35
Value of production (1,000 Dollars) 33,756 36,774 61,329 125,993 109,440 53,501 69,439
1/ Average price for the May through April marketing season. 2/ Final price and value for 2011 will be released October, 2012.
Barley: Acreage, Yield, Production, Price, and Value
2005 2006 2007 2008 2009 2010 2011
Planted for all purposes (Acres) 34,000 25,000 33,000 42,000 48,000 45,000 65,000
For Grain
Harvested (Acres) 30,000 22,000 31,000 40,000 45,000 44,000 64,000
Yield per acre (Bushels) 100.0 115.0 110.0 120.0 115.0 125.0 125.0
Production (000 Bushels) 3,000 2,530 3,410 4,800 5,175 5,500 8,000
Marketing year average price ($ per Bu) 1/ 2/ 2.75 3.20 4.00 4.80 3.74 3.82 4.70
Value of production (1,000 Dollars) 8,250 8,096 13,640 23,040 19,355 21,010 37,600
1/ Average price for the May through April marketing season. 2/ Final price and value for 2011 will be released October, 2012.

68
Wheat: Price Changes Following USDA Crop Production Reports 2008-2011 Price 1/ Price Change 2/
Date Prior Closing Day After Week After Day After Week After
Wheat 1/
----------------Dollars Per Bushel----------------
--------Cents Per Bushel--------
May 2008 9.13 8.96 8.72 -17 -41 Jun 2008 8.46 8.67 9.26 +21 +80 Jul 2008 8.54 8.70 8.39 +16 -15 Aug 2008 8.08 8.10 8.73 +2 +65 Annual 2008 6.70
6.77 5.93 +7 -77
May 2009 6.30 6.34 6.40 +4 +10 Jun 2009 6.73 6.55 6.30 -18 -43 Jul 2009 5.28 5.24 5.37 -4 +9 Aug 2009 4.90 4.94 4.74 +4 -16 Annual 2009 4.24 4.37 4.41 +13 +17
May 2010 4.53 4.55 4.40 +2 -13 Jun 2010 3.98 4.03 4.30 +5 +32 Jul 2010 5.02 4.93 5.21 -9 +19 Aug 2010 6.40 6.60 6.40 +20 NC Annual 2010 6.37 6.28 6.48 -9 +11
May 2011 9.26 8.97 8.88 -29 -38 Jun 2011 8.85 8.71 8.19 -14 -66 Jul 2011 7.41 7.63 7.91 +22 +50 Aug 2011 7.92 8.23 8.42 +31 +50 Annual 2011 7.57 7.21 7.15 -36 -42
1/ Closing cash price for Kansas City #1 hard winter wheat (ordinary protein) - reported by AMS Grain Market News. 2/ The price change is indicated by the difference between the prior closing price and the price for the day or week after each report.
Wheat: Price Changes Following USDA Grain Stocks Reports 2008-2011 Price 1/ Price Change 2/
Date Prior Closing Day After Week After Day After Week After
Wheat 1/
----------------Dollars Per Bushel----------------
--------Cents Per Bushel--------
Mar 2008 10.52 9.95 10.64 -57 +12 Jun 2008 9.20 8.91 8.55 -29 -65 Sep 2008 6.70 6.77 5.93 +7 -77 Dec 2008 6.71 6.15 6.29 -56 -42
Mar 2009 5.72 5.90 6.20 +18 +48 Jun 2009 5.80 5.55 5.27 -25 -53 Sep 2009 4.24 4.37 4.41 +13 +17 Dec 2009 5.35 5.03 4.75 -32 -60
Mar 2010 4.52 4.34 4.54 -18 +2 Jun 2010 4.13 4.45 4.71 +32 +58 Sep 2010 6.37 6.28 6.48 -9 +11 Dec 2010 7.86 8.00 8.25 +14 +39
Mar 2011 8.14 8.60 8.92 +46 +78 Jun 2011 7.85 7.28 7.68 -57 -17 Sep 2011 7.57 7.21 7.15 -36 -42 Dec 2011 7.62 7.33 7.18 -29 -44
1/ Closing cash price for Kansas City #1 hard winter wheat (ordinary protein) - reported by AMS Grain Market News. 2/ The price change is indicated by the difference between the prior closing price and the price for the day or week after each report.

69
Corn for Grain: Acreage, Yield, Production, Price, and Value
2005 2006 2007 2008 2009 2010 2011
Planted for all purposes (Acres) 50,000 50,000 55,000 50,000 50,000 45,000 55,000
Harvested (Acres) 22,000 18,000 22,000 15,000 20,000 22,000 32,000
Yield per acre (Bushels) 195.0 170.0 185.0 165.0 175.0 210.0 180.0
Production (000 Bushels) 4,290 3,060 4,070 2,475 3,500 4,620 5,760
Marketing year average price ($ per Bu) 1/ 3.18 4.37 5.03 5.80 4.14 5.80 6.60
Value of production (1,000 Dollars) 13,642 13,372 20,472 14,355 14,490 26,796 38,016
1/ Average price for the September through August marketing season.
Corn for Silage: Acreage, Yield, and Production
2005 2006 2007 2008 2009 2010 2011
Harvested (Acres) 27,000 31,000 33,000 35,000 30,000 23,000 23,000
Yield per acre (Tons) 27.0 26.0 27.0 30.0 29.0 26.0 30.0
Production (Tons) 729,000 806,000 891,000 1,050,000 870,000 598,000 690,000
Sorghum for Grain: Acreage, Yield, Production, Price, and Value
2005 2006 2007 2008 2009 2010 2011
Planted for all purposes (Acres) 23,000 24,000 42,000 57,000 35,000 25,000 22,000
Harvested (Acres) 7,000 7,000 20,000 27,000 8,000 6,000 6,000
Yield per acre (Bushels) 95.0 90.0 90.0 90.0 85.0 120.0 100.0
Production (000 Bushels) 665 630 1,800 2,430 680 720 600
Marketing year average price ($ per Cwt) 1/ 5.00 7.80 8.60 9.40 6.20 9.10 12.50
Value of production (1,000 Dollars) 1/ 1,862 2,752 8,669 12,792 2,361 3,669 4,200
1/ Final price and value for 2011 will be released October, 2012.
Sorghum for Silage: Acreage, Yield, and Production 2005 2006 2007 2008 2009 2010 2011
Harvested (Acres) 15,000 17,000 21,000 30,000 27,000 18,000 15,000
Yield per acre (Tons) 20.0 21.0 19.0 19.0 20.0 22.0 22.0
Production (Tons) 300,000 357,000 399,000 570,000 540,000 396,000 330,000
Grain Stocks: Off-Farm Storage Facilities
2005 2006 2007 2008 2009 2010 2011
---------------------------------- December 1 ---------------------------------
Facilities (Number) 1/ 20 20 22 22 22 22 22
Storage capacity (000 Bu) 17,000 17,000 18,000 19,000 19,000 19,000 20,000
1/ Includes mills, elevators, warehouses, terminals, processors, and commercial feedlots

70
Upland Cotton County Estimates, 2010-2011
County Planted Acres Harvested Acres Yield per Acre Production
2010 2011 2010 2011 2010 2011 2010 2011
Pounds Bales 1/
District 10
Other Counties 2/ 6,000 6,000 6,000 6,000 1,120 1,440 14,000 18,000
District 10 Total 6,000 6,000 6,000 6,000 1,120 1,440 14,000 18,000
District 80
Graham 19,800 17,500 19,800 17,200 1,438 1,535 59,300 55,000
La Paz 12,500 22,300 12,500 22,300 1,882 1,937 49,000 90,000
Maricopa 31,000 48,000 30,300 47,500 1,537 1,485 97,000 147,000
Pima 9,300 10,000 9,200 10,000 1,435 1,392 27,500 29,000
Pinal 95,900 112,500 95,300 112,200 1,539 1,587 305,500 371,000
Yuma 15,200 23,500 15,100 23,000 1,478 1,440 46,500 69,000
Other Counties 2/ 5,300 10,200 4,800 9,800 1,120 1,029 11,200 21,000
District 80 Total 189,000 244,000 187,000 242,000 1,530 1,551 596,000 782,000
State Total 195,000 250,000 193,000 248,000 1,517 1,548 610,000 800,000
1/ 480- pound net weight bales.
2/ Acres combined to avoid disclosure of individual operations.
American Pima Cotton County Estimates, 2010-2011
County Planted Acres Harvested Acres Yield per Acre Production
2010 2011 2010 2011 2010 2011 2010 2011
Pounds Bales 1/
District 80
Graham
Yuma
4,700
1,700
4,700
1,700
868
1,158
8,500
4,100
Other Counties 2/ 2,500 3,600 2,500 3,600 845 987 4,400 7,400
District 80 Total 2,500 10,000 2,500 10,000 845 960 4,400 20,000
State Total 2,500 10,000 2,500 10,000 845 960 4,400 20,000
1/ 480- pound net weight bales. 2/ Acres combined to avoid disclosure of individual operations.

71
Alfalfa Hay County Estimates, 2010-2011
County Harvested Acres Yield per Acre Production
2010 2011 2010 2011 2010 2011
Tons Tons
District 10
Apache 1,100 3.75 4,100
Mohave 9,000 6.35 57,000
Other Counties 1/ 3,900 14,000 4.10 5.35 15,900 75,000
District 10 Total 14,000 14,000 5.50 5.35 77,000 75,000
District 80
Cochise 16,000 15,000 6.20 7.15 99,200 107,000
Graham 3,400 2,000 6.10 6.75 20,700 13,500
La Paz 66,000 52,000 8.70 7.95 574,200 413,000
Maricopa 85,000 80,000 8.40 9.40 714,000 750,000
Pima 2,400 2,000 9.25 9.50 22,200 19,000
Pinal 64,000 55,000 8.30 8.80 531,200 485,000
Yuma 27,000 28,000 9.00 7.15 243,000 200,000
Other Counties 1/ 2,200 2,000 6.60 6.25 14,500 12,500
District 80 Total 266,000 236,000 8.35 8.45 2,219,000 2,000,000
State Total 280,000 250,000 8.20 8.30 2,296,000 2,075,000
1/ Combined counties to avoid disclosure of individual operations or too small to warrant estimate.

72
Durum Wheat County Estimates, 2010-2011
County Planted Harvested Yield Production
2010 2011 2010 2011 2010 2011 2010 2011
Acres Acres Bushels Bushels
District 80
La Paz 4,500 5,800 4,300 5,800 103.0 100.0 443,000 580,000
Maricopa 13,500 11,000 13,400 10,700 104.0 80.4 1,394,000 860,000
Pima 4,500 4,400 90.0 396,000
Pinal 7,500 7,200 7,400 7,200 112.0 90.3 829,000 650,000
Yuma 47,000 50,000 46,800 49,500 123.0 108.9 5,757,000 5,389,000
Other Counties 1/ 3,000 6,000 2,700 5,800 98.5 86.2 266,000 500,000
District 80 Total 80,000 80,000 79,000 79,000 115.0 101.0 9,085,000 7,979,000
State Total 80,000 80,000 79,000 79,000 115.0 101.0 9,085,000 7,979,000
1/ Counties not published to avoid producer disclosure or too small to warrant an estimate.
Barley County Estimates, 2010-2011
County Planted Acres Harvested Acres Yield Production
2010 2011 2010 2011 2010 2011 2010 2011
District 80 Bushels Bushels
Graham 1,600 1,400 83.6 117,000
Maricopa 15,000 15,000 125.0 1,875,000
Pinal 20,000 19,500 137.5 2,681,000
Yuma 3,500 3,300 90.0 297,000
Other Counties 1/ 4,900 65,000 4,800 64,000 110.4 125.0 530,000 8,000,000
District 80 Total 45,000 44,000 125.0 5,500,000
State Total 45,000 65,000 44,000 64,000 125.0 125.0 5,500,000 8,000,000
1/ Counties not published to avoid producer disclosure or too small to warrant an estimate.

73
Vegetables, Melons, and Potatoes
Arizona has a unique place in the agricultural industry in
that it is capable of producing an ever increasing variety of
vegetables nearly year round. With mild winters in the
lower elevations and the cooler summer temperatures in the
higher elevations, the State produces an impressive variety
of vegetables and melons throughout the year. Nationally,
Arizona ranked third in the production of fresh market
vegetables and second to only California in the production of
head lettuce, leaf and romaine lettuce, broccoli, cauliflower,
spinach, cantaloupes, and honeydews.
During the 2011 season, 115,000 harvested acres were
devoted to the principal vegetables and melon crops in
Arizona, an increase of 3 percent from a year earlier.
Western head lettuce was the leader in acreage with 36,000
acres harvested, an increase of 2,000 acres from the previous
season. Cantaloupes acreage totaled 20,000, and is second
ranked in terms of acreage harvested. Crops showing
increases in acreage from a year earlier include head lettuce,
romaine lettuce, cabbage, spinach, and honeydew. Major
vegetable crops with acreage below the previous year
included chile peppers, cantaloupes, leaf lettuce, and
watermelons.
The value of all principal vegetables and melons produced in
Arizona during 2011 totaled $1.19 billion, an increase of 32
percent from the previous year.
Total Head Lettuce,
36,000 Broccoli, 7,200
Cabbage, 2,500
Cauliflower,
3,000 Chile Peppers, 2,400
Leaf Lettuce, 7,400
Romaine, 19,700
Spinach, 8,100
Cantaloupe, 20,000 Watermelon, 5,200
Honeydew, 3,500
Vegetable & Melon Harvested Acres
2010-11
115,000 Total Acres

74
Head Lettuce: Acreage, Yield, Production, Price, and Value
2004/05 2005/06 2006/07 2007/08 2008/09 2009/10 2010/11
Planted (Acres) 50,400 47,000 40,000 33,000 32,500 34,500 36,500
Harvested (Acres) 50,000 46,800 39,900 32,700 32,000 34,000 36,000
Yield per acre (Cwt) 314 325 365 360 345 350 335
Production (1,000 Cwt) 15,724 15,210 14,564 11,772 11,040 11,900 12,060
Marketing year average price ($/Cwt) 1/ 14.60 14.10 21.00 15.80 22.90 27.20 32.10
Value of production (1,000 Dollars) 230,330 214,461 305,844 185,998 252,816 323,680 387,126
1/ Average price for the November through April marketing season.
Head Lettuce: Monthly Prices Received by Growers 2004/05 2005/06 2006/07 2007/08 2008/09 2009/10 2010/11
---------------------------------------Dollars per Cwt--------------------------------------
November 12.30 8.82 11.20 16.70 20.40 51.40 38.00
December 13.60 16.40 22.70 16.30 24.10 40.90 18.20
January 11.50 10.40 21.40 18.00 29.90 18.20 28.00
February 11.30 11.80 15.30 13.30 18.00 14.60 54.90
March 23.70 19.20 30.20 14.70 20.10 23.40 37.70
April 24.10 21.40 16.20 17.60 31.10 19.30 16.70

75
Leaf Lettuce: Acreage, Yield, Production, Price, and Value
2004/05 2005/06 2006/07 2007/08 2008/09 2009/10 2010/11
Planted (Acres) 9,000 10,000 10,700 10,000 8,800 7,900 7,500
Harvested (Acres) 8,900 9,900 10,600 9,800 8,600 7,700 7,400
Yield per acre (Cwt) 245 230 200 220 200 220 235
Production (1,000 Cwt) 2,181 2,277 2,120 2,156 1,720 1,694 1,739
Marketing year average price ($/Cwt) 1/ 52.70 28.20 40.70 37.70 39.50 55.20 66.50
Value of production (1,000 Dollars) 114,939 64,211 86,284 81,281 67,940 93,509 115,644
1/ Average price for the November through April marketing season.
Romaine Lettuce: Acreage, Yield, Production, Price, and Value
2004/05 2005/06 2006/07 2007/08 2008/09 2009/10 2010/11
Planted (Acres) 19,500 18,500 17,500 16,500 16,300 18,500 20,000
Harvested (Acres) 19,400 18,400 17,400 16,400 16,100 18,300 19,700
Yield per acre (Cwt) 330 350 285 310 345 330 355
Production (1,000 Cwt) 6,402 6,440 4,959 5,084 5,555 6,039 6,994
Marketing year average price ($/Cwt) 1/ 24.20 15.90 35.30 20.80 23.20 31.50 46.60
Value of production (1,000 Dollars) 154,928 102,396 175,053 105,747 128,876 190,229 325,920
1/ Average price for the November through April marketing season.
Spinach: Acreage, Yield, Production, Price, and Value
2004/05 2005/06 2006/07 2007/08 2008/09 2009/10 2010/11
Planted (Acres) 5,800 5,000 3,800 5,000 6,000 7,600 8,400
Harvested (Acres) 5,700 4,900 3,700 5,000 6,000 7,500 8,100
Yield per acre (Cwt) 185 175 160 165 195 150 210
Production (1,000 Cwt) 1,055 858 592 825 1,170 1,125 1,701
Marketing year average price ($/Cwt) 1/ 30.50 23.60 31.70 34.20 39.20 40.00 50.40
Value of production (1,000 Dollars) 32,178 20,249 18,766 28,215 45,864 45,000 85,730
1/ Average price for the November through April marketing season.
Cabbage: Acreage, Yield, Production, Price, and Value 2004/05 2005/06 2006/07 2007/08 2008/09 2009/10 2010/11
Planted (Acres) 3,000 2,900 2,700 2,800 2,300 2,100 2,500
Harvested (Acres) 3,000 2,900 2,700 2,800 2,300 2,100 2,500
Yield per acre (Cwt) 370 380 320 405 435 515 460
Production (1,000 Cwt) 1,110 1,102 864 1,134 1,000 1,082 1,150
Marketing year average price ($/Cwt) 16.30 20.70 20.10 16.10 19.00 21.30 24.50
Value of production (1,000 Dollars) 18,093 22,811 17,366 18,257 19,000 23,047 28,175
1/ Average price for the November through April marketing season.
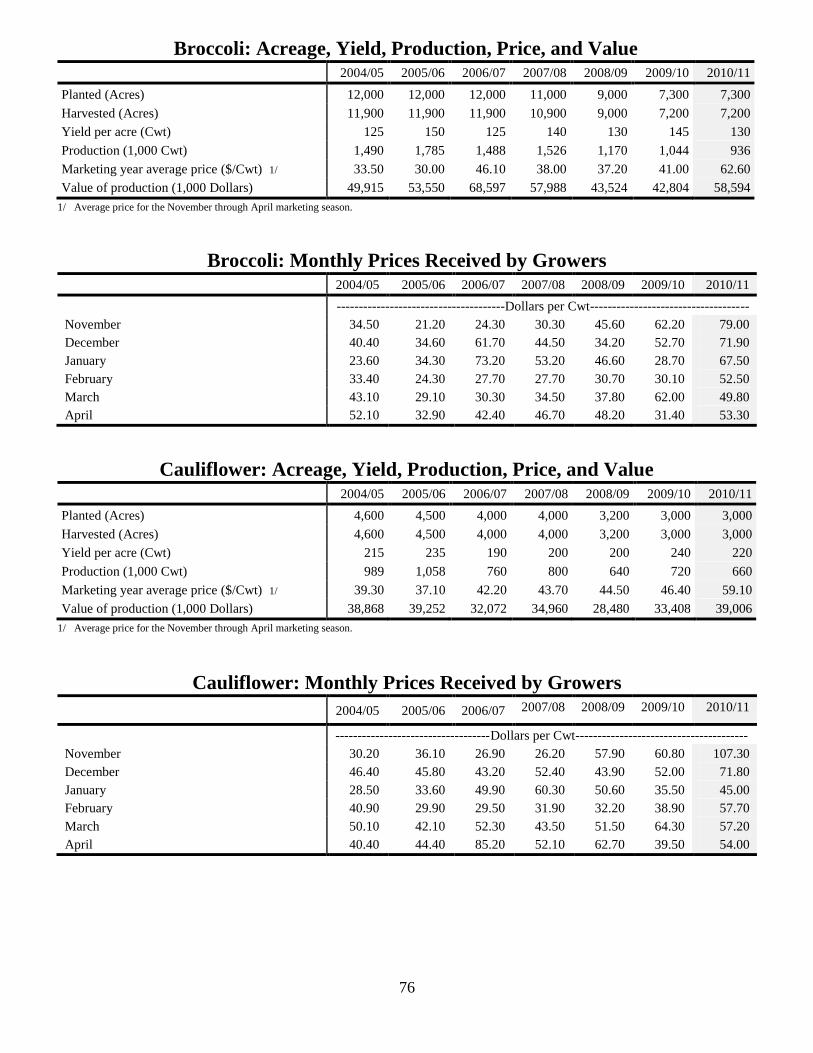
76
Broccoli: Acreage, Yield, Production, Price, and Value 2004/05 2005/06 2006/07 2007/08 2008/09 2009/10 2010/11
Planted (Acres) 12,000 12,000 12,000 11,000 9,000 7,300 7,300
Harvested (Acres) 11,900 11,900 11,900 10,900 9,000 7,200 7,200
Yield per acre (Cwt) 125 150 125 140 130 145 130
Production (1,000 Cwt) 1,490 1,785 1,488 1,526 1,170 1,044 936
Marketing year average price ($/Cwt) 1/ 33.50 30.00 46.10 38.00 37.20 41.00 62.60
Value of production (1,000 Dollars) 49,915 53,550 68,597 57,988 43,524 42,804 58,594
1/ Average price for the November through April marketing season.
Broccoli: Monthly Prices Received by Growers 2004/05 2005/06 2006/07 2007/08 2008/09 2009/10 2010/11
--------------------------------------Dollars per Cwt------------------------------------
November 34.50 21.20 24.30 30.30 45.60 62.20 79.00
December 40.40 34.60 61.70 44.50 34.20 52.70 71.90
January 23.60 34.30 73.20 53.20 46.60 28.70 67.50
February 33.40 24.30 27.70 27.70 30.70 30.10 52.50
March 43.10 29.10 30.30 34.50 37.80 62.00 49.80
April 52.10 32.90 42.40 46.70 48.20 31.40 53.30
Cauliflower: Acreage, Yield, Production, Price, and Value
2004/05 2005/06 2006/07 2007/08 2008/09 2009/10 2010/11
Planted (Acres) 4,600 4,500 4,000 4,000 3,200 3,000 3,000
Harvested (Acres) 4,600 4,500 4,000 4,000 3,200 3,000 3,000
Yield per acre (Cwt) 215 235 190 200 200 240 220
Production (1,000 Cwt) 989 1,058 760 800 640 720 660
Marketing year average price ($/Cwt) 1/ 39.30 37.10 42.20 43.70 44.50 46.40 59.10
Value of production (1,000 Dollars) 38,868 39,252 32,072 34,960 28,480 33,408 39,006
1/ Average price for the November through April marketing season.
Cauliflower: Monthly Prices Received by Growers
2004/05 2005/06 2006/07 2007/08 2008/09 2009/10 2010/11
-----------------------------------Dollars per Cwt---------------------------------------
November 30.20 36.10 26.90 26.20 57.90 60.80 107.30
December 46.40 45.80 43.20 52.40 43.90 52.00 71.80
January 28.50 33.60 49.90 60.30 50.60 35.50 45.00
February 40.90 29.90 29.50 31.90 32.20 38.90 57.70
March 50.10 42.10 52.30 43.50 51.50 64.30 57.20
April 40.40 44.40 85.20 52.10 62.70 39.50 54.00

77
Chile Peppers: Acreage, Yield, Production, Price, and Value 1/ 2005 2006 2007 2008 2009 2010 2011
Planted (Acres) 6,000 5,500 4,000 3,500 3,000 3,000 2,600
Harvested (Acres) 5,900 5,400 3,600 3,000 2,900 2,900 2,400
Yield per acre (Cwt) 95 85 80 75 81 72 52
Production (1,000 Cwt) 560 460 288 224 234 210 124
Marketing year average price ($/Cwt) 33.70 34.40 45.10 48.90 44.60 49.40 31.90
Value of production (1,000 Dollars) 18,862 15,840 12,992 10,964 10,429 10,369 3,961
1/ Chile peppers are defined as all peppers excluding bell peppers.
Potatoes: Acreage, Yield, Production, Price, and Value
2005 2006 2007 2008 2009 2010 2011
Planted (Acres)
4,300 3,900 4,000 3,500 4,000 3,700 3,800
Harvested (Acres) 4,300 3,900 4,000 3,500 4,000 3,700 3,800
Yield per acre (Cwt) 275 300 280 300 280 280 280
Production (1,000 Cwt) 1,183 1,170 1,120 1,050 1,120 1,036 1,064
Marketing year average price ($ per Cwt) 1/ 11.50 13.40 9.70 15.10 14.80 16.20 2/
Value of production (1,000 Dollars) 13,599 15,678 10,864 15,855 16,576 16,783 2/
1/ Average price for the April through August marketing season. 2/ Estimates not published to avoid disclosure of individual operations.

78
All Cantaloupe: Acreage, Yield, Production, and Value
2004/05 2005/06 2006/07 2007/08 2008/09 2009/10 2010/11
Planted (Acres) 21,000 20,000 19,300 19,500 23,500 21,000 20,200
Harvested (Acres) 20,900 19,800 19,200 19,400 23,300 20,800 20,000
Fall 8,000 7,300 7,100 7,500 9,800 8,800 9,700
Spring 12,900 12,500 12,100 11,900 13,500 12,000 10,300
Yield per acre (Cwt) 280 300 305 250 215 235 240
Production (1,000 Cwt) 5,852 5,940 5,856 4,850 5,010 4,888 4,800
Marketing year average price ($/Cwt) 1/ 17.10 16.40 17.50 24.50 23.00 19.90 19.60
Value of production (1,000 Dollars) 100,069 97,416 102,480 118,825 115,230 97,271 94,080
1/ Average price for the May through August and September through December marketing seasons.
All Cantaloupe: Monthly Prices Received by Growers
2004/05 2005/06 2006/07 2007/08 2008/09 2009/10 2010/11
--------------------------------------Dollars per Cwt-----------------------------------
September 20.30 12.80 8.10 16.10 24.30 24.60 11.90
October 15.60 13.50 19.10 36.80 24.40 26.60 16.10
November 17.20 14.80 28.20 38.50 32.20 15.40 37.10
December 23.60 15.10
May 18.20 25.60 27.20 21.70 14.80 30.80 18.10
June 17.70 18.80 11.90 16.60 22.50 18.20 16.30
July 17.90 10.70 10.90 20.60 13.50 15.70 23.00
August 12.00
Watermelon: Acreage, Yield, Production, Price, and Value
2004/05 2005/06 2006/07 2007/08 2008/09 2009/10 2010/11
Planted (Acres) 6,800 6,800 6,600 6,500 5,500 5,500 5,300
Harvested (Acres) 6,700 6,700 6,500 6,400 5,500 5,300 5,200
Yield per acre (Cwt) 420 495 515 450 490 430 450
Production (1,000 Cwt) 2,814 3,317 3,348 2,880 2,695 2,279 2,340
Marketing year average price ($/Cwt) 1/ 15.20 12.00 12.20 16.20 11.80 12.70 16.30
Value of production (1,000 Dollars) 42,773 39,804 40,846 46,656 31,801 28,943 38,142
1/ Average price for the October/November and June/July marketing seasons.
All Honeydews: Acreage, Yield, Production, Price and Value
2004/05 2005/06 2006/07 2007/08 2008/09 2009/10 2010/11
Planted (Acres) 4,100 4,200 3,500 3,600 3,400 3,200 3,600
Harvested (Acres) 4,000 4,100 3,300 3,400 3,300 3,100 3,500
Fall 700 1,300 1,200 1,400 1,600 1,400 1,500
Summer 3,300 2,800 2,100 2,000 1,700 1,700 2,000
Yield per acre (Cwt) 240 310 335 240 240 200 205
Production (1,000 Cwt) 960 1,271 1,106 815 792 620 718
Marketing year average price ($/Cwt) 1/ 23.80 20.60 16.60 27.60 20.60 20.30 23.50
Value of production (1,000 Dollars) 22,848 26,183 18,360 22,494 16,315 12,586 16,873
1/ Average price for the October/November and June/July marketing seasons.

79
Fruit and Nut
Apples: Arizona’s utilized apple production was 11.0
million pounds, a decrease of 6.00 million pounds from last
year’s crop. The total crop value was $2.65 million, down
13 percent from last year’s $3.05 million. The average price
per pound, at 24.1 cents was 6.2 cents higher than in 2010.
Pecans: Arizona remains the nation’s fourth leading State
in pecan production for 2011, with production of 18.5
million pounds. This was 16 percent less than last year.
Nationally, pecan production was down 8 percent from last
year. The Arizona pecan price averaged $2.80 per pound,
the same as in 2010. The U.S. average price of $2.43 per
pound represents an increase of 13 cents from the previous
year.
Citrus: Arizona's total citrus production increased 15
percent from last season. Arizona lemon growers harvested
2.50 million boxes of lemons and tangerine growers utilized
300,000 boxes.
Citrus utilized production for the 2010-2011 season totaled
11.7 million tons, up 7 percent from the 2009-2010 season.
Florida accounted for 63 percent of total United States citrus
production, California totaled 33 percent, and Texas and
Arizona produced the remaining 4 percent. Utilized citrus
production was up from the previous year in all citrus
reporting States.
Florida's orange production, at 140 million boxes, is up 5
percent from the previous season. Bearing citrus acreage in
Florida, at 440,000 acres, is 11,000 acres below the 2009-
2010 season. This is the lowest bearing acreage since the
1990-91 season. Florida's frozen concentrated orange juice
yield at 1.58608 gallons per box was up 2 percent from last
season.
The value of the 2010-2011 United States citrus crop was up
slightly from last season, at $2.98 billion (packinghouse-
door equivalent). Orange value of production decreased 1
percent from last season while grapefruit value is down 6
percent. Tangerine and mandarin value of production is 15
percent higher than last season and lemon value of
production is up 1 percent. Tangelo value increased 48
percent from the previous season.
All Citrus: Arizona Acreage, Production, and Value 2/
2004/05 2005/06 2006/07 2007/08 2008/09 2009/10 2010/11
Harvested (Acres) 22,500 20,100 17,900 17,400 17,300 13,500 13,500
Utilization of production (1,000 Tons) 127 185 120 90 133 97 112
Fresh 79 108 89 62 54 51 60
Processed 48 77 31 28 79 46 52
Value of production (1,000 Dollars) 1/ 38,134 46,132 62,916 61,834 35,602 37,230 38,059
1/ Equivalent packinghouse door returns. Marketing season November-July. 2/ Oranges and grapefruit excluded after the 2008-09 crop year.

80
Lemons: Acreage, Yield, Production, Price, and Value
2004/05 2005/06 2006/07 2007/08 2008/09 2009/10 2010/11
Harvested (Acres) 13,500 13,000 12,500 12,000 12,000 11,000 11,000
Yield per acre (Boxes) 1/ 178 292 200 125 250 200 227
Utilization of Production (1,000 Boxes) 1/
Fresh 1,325 2,167 1,895 982 1,114 1,118 1,313
Processed 1,075 1,633 605 518 1,886 1,082 1,187
Total 2,400 3,800 2,500 1,500 3,000 2,200 2,500
Season average price ($ per Box) 2/ 11.85 9.37 22.05 33.32 9.88 14.89 13.74
Value of production (1,000 Dollars) 28,443 35,601 55,137 49,982 29,641 32,751 34,360
1/ Net weight per box, 76 pounds through 2009/10 season. 80 pounds in 2010/11 season. . 2/ Equivalent packinghouse door returns. Marketing season September-May.
Lemons: Season Average Price and Equivalent Returns by Utilization
2004/05 2005/06 2006/07 2007/08 2008/09 2009/10 2010/11
---------------------------------- Dollars per Box 1/ --------------------------------------- F.O.B. packed fresh 31.00 26.60 39.30 61.40 32.50 37.40 34.80 Equivalent returns Packinghouse door All 11.85 9.37 22.05 33.32 9.88 14.89 13.74 Fresh 21.32 16.73 29.23 51.13 22.02 D D Processed 0.18 (0.40) (0.42) (0.44) 2.71 D D On-tree All 6.64 4.06 16.63 27.79 4.24 9.14 7.87 Fresh 16.11 11.42 23.81 45.60 16.38 D D Processed (5.03) (5.71) (-5.84) (5.97) 2.93 D D
1/ Net weight per box, 76 pounds through 2009/10 season. 80 pounds in 2010/11 season. D = Withheld to avoid disclosing data for individual operations.
Tangerines: Acreage, Yield, Production, Price, and Value 1/
2004/05 2005/06 2006/07 2007/08 2008/09 2009/10 2010/11
Harvested (Acres) 3,800 3,000 2,200 2,500 2,500 2,500 2,500
Yield per acre (Boxes) 2/ 105 183 136 160 100 140 120
Utilization of Production (1,000 Boxes) 2/
Fresh 322 357 178 310 146 205 183
Processed 78 193 122 90 104 145 117
Total 400 550 300 400 250 350 300
Season average price ($ per Box) 3/ 13.49 12.00 13.43 21.58 13.45 D D
Value of production (1,000 Dollars) 5,396 6,601 4,030 8,634 3,362 D D
1/ Includes tangelos and tangors. D = Withheld to avoid disclosing data for individual operations. 2/ Net weight per box, 75 pounds through 2009/10 season. 80 pounds in 2010/11 season.. 3/ Equivalent packinghouse door returns. Marketing season September-May.
Tangerines: Season Average Price and Equivalent Returns by Utilization 1/
2004/05 2005/06 2006/07 2007/08 2008/09 2009/10 2010/11
-------------------------- Dollars per Box 2/ ------------------------------------ F.O.B. packed fresh 25.70 27.40 31.70 37.20 32.60 37.20 D Equivalent returns Packinghouse door All 13.49 12.00 13.43 21.58 13.45 D D Fresh 16.82 18.34 22.46 27.78 22.99 D D Processed (0.26) 0.28 0.26 0.24 0.05 D D On-tree All 10.37 8.82 10.19 18.28 10.08 D D Fresh 13.70 15.16 19.22 24.48 19.62 D D Processed (3.38) (2.90) (2.98) (3.06) (3.32) D D
1/ Includes tangelos and tangors. D = Withheld to avoid disclosing data for individual operations. 2/ Net weight per box, 75 pounds through 2009/10 season. 80 pounds in 2010/11 season.

81
Apples: Acreage, Yield, Production, Price, and Value
2005 2006 2007 2008 2009 2010 2011
Bearing acreage (Acres) 1,100 1,100 1,200 1,200 1,200 1,200 1,200
Yield per acre (Pounds) 1/ 20,200 27,400 19,200 15,000 4,580 14,200 9,170
Utilization of production: (Million Pounds)
Fresh 5.0 4.0 4.0 2.0 1.2 2.0 1.0
Processed 17.0 26.0 19.0 16.0 4.3 15.0 10.0
Total 22.0 30.0 23.0 18.0 5.5 17.0 11.0
Season average price ($ per Pound) 0.240 0.181 0.219 0.223 0.237 0.179 0.241
Value of utilized production (1,000 Dollars) 5,275 5,438 5,040 4,021 1,305 3,048 2,647
1/ Yield is based on total production, which includes unharvested production and fruit harvested but not sold due to market conditions.
Pecans: Production, Price, and Value
2005 2006 2007 2008 2009 2010 2011
Utilized production (1,000 Pounds) 22,000 14,000 23,000 17,500 20,000 22,000 18,500
Price per Pound (Dollars) 1.600 1.750 1.600 1.450 1.720 2.800 2.800
Value of production (1,000 Dollars) 35,200 24,500 36,800 25,375 34,400 61,600 51,800

82
2011 Weather Review
With Arizona’s diverse topography, the State’s temperatures
range from the wintertime cold in the higher mountain areas
to the searing summertime heat of the desert areas.
Arizona’s wide spectrum of climate and terrain support a
remarkable agricultural diversity. Virtually all crops in
Arizona are irrigated, meaning yield variability is less
influenced by rainfall here than in the rain-dependent
agricultural states. Weather conditions are still important to
crop farmers in making planting and harvesting decisions.
The highest recorded temperature in 2011 was 121 degrees
at East Mesa on July 2. Bellemont recorded the lowest
temperature of 30 degrees below zero on January 1st.
January: Temperatures across the State were below normal
early in the New Year, but above normal after the middle of
the month. Very little precipitation fell throughout the
month. The vegetable harvest continued in full swing and
sheeping off occurred on various alfalfa fields across the
State. Range and pasture conditions toward the end of the
month were mostly fair to good.
February: Temperatures across the State were mostly below
normal during February. Precipitation in the form of rain or
snow had fallen throughout the month. The vegetable
harvest continued in full swing and sheeping off occurred on
various alfalfa fields across the State. Range and pasture
conditions remained mostly fair to good across the State.
March: Temperatures remained below normal early in
March then warmed up only to be back below normal
toward the end of March. Precipitation fell throughout the
month. Cotton planting was underway the first week of
March. Alfalfa harvesting continued for Arizona. The
winter vegetable harvest remained active throughout March.
Range and pasture conditions remained mostly fair to good
due to the rain showers throughout the month.
April: Temperatures were near normal to above normal
throughout April. Rains fell mainly during the 2nd
week of
the month. Cotton planting was about two-thirds complete
by the final week of the month. The winter vegetable
harvest was wrapping up. Range and pasture conditions
began to dry out as temperatures rose. By the end of the
month more than a third was in very poor to poor condition.
May: Range and pasture conditions continued to dry out
with the warmer temperatures and dry winds. More than
half was in very poor to poor condition. Miscellaneous
melons, potatoes, and onions were harvested this month.
Temperatures were near normal the first half of May, but
above normal toward the end of the month. Most of the
rains fell during the third week of May. Cotton planting was
wrapping up by month’s end and squaring had occurred on
just over 10 percent of the acreage.
June: Cotton squaring had occurred on two-thirds of the
acreage and bolls had set on about twenty percent by the end
of the month. Potato, onion, and melon harvesting remained
active. Temperatures were mostly below normal early in
June, then above normal the second half of the month. Very
little precipitation fell during June. The dry weather
negatively impacted grazing areas. Stock tanks were drying
up and hauling water became necessary. Nearly two-thirds
of the range was in very poor to poor condition.
July: Cotton bolls were set on a third of the crop early in
July, but setting bolls was 88 percent complete by August 1.
Melon harvest continued throughout July. Temperatures
were above normal for most of the month. Seasonal rains
fell every week, especially in Southeastern areas of Arizona.
Stock tanks were replenished in some areas, but remained
dry in others. Range condition varied from very poor to
good, depending on elevation.
August: Temperatures continued above normal throughout
August and many areas continued to receive good doses of
precipitation. All bolls were set by month’s end and just
over half of the acreage had open bolls. Range conditions
improved slightly from the various showers that fell across
grazing areas.
September: Cotton harvesting started in the Yuma area
during the first week and was just under 20 percent complete
State wide by month’s end. Melon harvesting continued
active in a few areas. Temperatures continued above
normal the first half of the month and seasonal rains
continued to drench many areas around the State. Range and
pasture conditions improved after the much needed rains.
October: Temperatures were mostly above normal during
October. Various showers fell during the first two weeks of
the month, but then the weather turned dry until late in the
month. Virtually all cotton bolls had opened by the second
week of October and harvesting was nearly 50 percent
complete by month’s end. Cooler weather slowed any new
growth on range and pasturelands across the State. Stock
tanks were drying out in a few locatons.
November: Weekly temperatures were below normal during
the first half of November but were above normal during the
second half. Many areas received rain throughout the
month. Sheeping off occurred in the alfalfa regions around
the State. Cotton harvest was about three-fourths complete
by the end of the month. The winter vegetable and citrus
harvest began in early November. Low elevation pastures
benefitted from the various storms that hit Arizona.
December: the cotton harvest progress fell behind the 5-year
average by the end of the year. Temperatures alternated
weekly between above normal and below normal
temperatures. Precipitation fell in many areas throughout
the month. The winter vegetable and citrus harvest
continued in the desert southwest part of the State. Sheeping
off was also active. The year ended with nearly half of the
range in fair to good condition and half in very poor to poor
condition.

83
Freeze Dates: Last 32o Temperatures in Spring and First in Fall
District
and
Station
2007 2008 2009 2010 2011 2007 2008 2009 2010 2011
Last in Spring First in Fall
Canyon de Chelly May 7 May 3 April 20 May 12 May 10 Oct 7 Oct 12 Oct 2 Oct 26 Oct 9
Casa Grande NM Mar 2 Mar 6 Feb 19 Jan 11 Feb 15 Dec 15 Nov 6 Dec 4 Nov 23 Nov 8
Douglas/Bisbee Apr 14 Apr 18 April 18 May 1 April 11 Dec 3 Nov 6 Oct 28 Nov 8 Nov 8
Flagstaff AP Jun 8 Jun 13 April 30 May 30 Jun 20 Sep 18 Oct 6 Oct 1 Oct 8 Oct 7
Gila Bend Mar 2 Feb 6 Jan 28 1/ Feb 11 Dec 22 Dec 27 Dec 5 Nov 26 Dec 5
Grand Canyon Jun 9 Jun 12 April 30 May 29 M Sep 24 Oct 6 Aug 7 Oct 8 Oct 6
Kingman Mar 4 Apr 17 April 9 April 30 Apr 10 Nov 22 Oct 12 Oct 28 Nov 10 Nov 8
Litchfield Park Jan 17 Jan 18 1/ 1/ Feb 4 Dec 26 Dec 27 Dec 26 Nov 29 Dec 6
Maricopa Mar 2 Mar 18 Feb 16 Feb 23 Feb28 Nov 25 Dec 6 Oct 29 Nov 24 Dec 2
Payson Apr 24 Apr 22 April 26 May 12 May 3 Oct 21 Oct 12 M Oct 26 Oct 8
Phoenix Jan 15 1/ 1/ 1/ Feb 4 1/ 1/ 1/ Dec 31 1/
Prescott May 6 May 3 April 26 May 3 May 30 Oct 7 Oct 12 M Oct 27 Oct 7
Safford M Mar 20 April 17 May 1 Apr 13 M Oct 13 Oct 29 Nov 10 Nov 6
St. Johns Apr 22 May 3 April 30 May 12 May 19 Oct 7 Oct 12 Oct 2 Oct 29 Oct 8
Tacna Mar 2 Feb 6 Feb 20 Jan 11 Feb 28 Nov 25 Dec 21 Nov 16 Nov 23 Dec 4
Tucson Int AP Mar 3 Feb 7 Feb 14 1/ Feb 28 M Dec 21 Dec 4 Nov 26 Dec 5
Willcox M M April 18 May 3 May 1 M Oct 13 Oct 29 Nov 6 Oct 8
Winslow Apr 20 May 3 April 26 May 3 May 10 Oct 7 Oct 11 Oct 2 Oct 26 Oct 8
Yuma Jan 18 1/ Jan 6 1/ Feb 5 1/ 1/ M Nov 27 1/
1/ No low temperature of 32o or less.
M - Insufficient or partial data. M is appended to average and/or total values computed with 1-9 daily values missing. M appears alone if 10 or more daily values
are missing. Source: United States Department of Commerce, National Oceanic and Atmospheric Administration, Climatological Data

84

85
County Profiles APACHE COUNTY
Crops 2011 Acres harvested Yield per acre Production Livestock Inventory January 1, 2012
Alfalfa hay 1/ All cattle and calves 35,000
COCHISE COUNTY Crops 2011 Acres harvested Yield per acre Production Livestock Inventory January 1, 2012
Upland cotton 1/ All cattle and calves 50,000 Pima Durum wheat
1/ 1/
Barley 1/ Alfalfa hay 15.000 7.15 ton 107,000 ton
COCONINO COUNTY Crops 2011 Acres harvested Yield per acre Production Livestock Inventory January 1, 2012
Alfalfa hay 1/ All cattle and calves 39,000
GILA COUNTY
Crops 2011 Acres harvested Yield per acre Production Livestock Inventory January 1, 2012
Upland cotton 1/ All cattle and calves 8,000 Alfalfa hay 1/
1/ Estimates too small to warrant estimate or not published to avoid disclosure of individual operations.

86
County Profiles GRAHAM COUNTY
Crops 2011 Acres harvested Yield per acre Production Livestock Inventory January 1, 2012 Upland cotton 17,200 1,535 pound 55,000 bale All cattle and calves 10,000 Pima cotton 4,700 868 pound 8,500 bale Durum wheat 1/ Barley 1/ Alfalfa hay 2,000 6.75 ton 13,500 ton
GREENLEE COUNTY
Crops 2011 Acres harvested Yield per acre Production Livestock Inventory January 1, 2012 Upland cotton 1/ All cattle and calves 6,000 Alfalfa hay 1/
LA PAZ COUNTY
Crops 2011 Acres harvested Yield per acre Production Livestock Inventory January 1, 2012 Upland cotton 22,300 1,937 pound 90,000 bale All cattle and calves 1/ Durum wheat 5,800 100.0 bu 580,000 bu Alfalfa hay 52,000 7.95 ton 413,000 ton Barley 1/ Pima cotton 1/
MARICOPA COUNTY
Crops 2011 Acres harvested Yield per acre Production Livestock Inventory January 1, 2012 Upland cotton 47,500 1,485 pound 147,000 bale All cattle and calves 190,000 Pima cotton 1/ Durum wheat 10,700 80.4 bu 860,000 bu Barley 1/ Alfalfa hay 80,000 9.40 ton 750,000 ton
1/ Estimates too small to warrant estimate or not published to avoid disclosure of individual operations.

87
County Profiles
MOHAVE COUNTY
Crops 2011 Acres harvested Yield per acre Production Livestock Inventory January 1, 2012
Upland cotton 1/ All cattle and calves 1/
Alfalfa hay 1/
Durum wheat 1/
Barley 1/
NAVAJO COUNTY
Crops 2011 Acres harvested Yield per acre Production Livestock Inventory January 1, 2012
Alfalfa hay 1/ All cattle and calves 25,000
PIMA COUNTY
Crops 2011 Acres harvested
Yield per acre Production Livestock Inventory January 1, 2012
Upland cotton 10,000 1,392 pound 29,000 bale All cattle and calves 18,000
Durum wheat 1/
Barley 1/
Alfalfa hay 2,000 9.50 ton 19,000 ton
PINAL COUNTY
Crops 2011 Acres harvested
Yield per acre Production Livestock Inventory January 1, 2012
Upland cotton 112,200 1,587 pound 371,000 bale All cattle and calves 330,000
Pima cotton 1/
Durum wheat 7,200 90.3 bu 650,000 bu
Barley 1/
Alfalfa hay 55,000 8.80 ton 485,000 ton
1/ Estimates too small to warrant estimate or not published to avoid disclosure of individual operations.

88
County Profiles SANTA CRUZ COUNTY
Crops 2011 Acres harvested Yield per acre Production Livestock Inventory January 1, 2012
Alfalfa hay 1/ All cattle and calves 14,000
YAVAPAI COUNTY
Crops 2011 Acres harvested Yield per acre Production Livestock Inventory January 1, 2012
Alfalfa hay 1/ All cattle and calves 45,000
Barley 1/
YUMA COUNTY
Crops 2011 Acres harvested Yield per acre Production Livestock Inventory January 1, 2012
Upland cotton 23,000 1,440 pound 69,000 bale All cattle and calves 1/
Pima cotton 1,700 1,158 pound 4,100 bale
Durum wheat 49,500 108.9 bu 5,389,000 bu
Barley 1/
Alfalfa hay 28,000 7.15 ton 200,000 ton
1/ Estimates too small to warrant estimate or not published to avoid disclosure of individual operations.

89
Land Ownership and Administration: Acreage & Percent of Total by County 1/
Forest
Service
Bureau of
Land
Management
State of
Arizona
Indian
Reservations
Individual or
Corporate
Other
Public
Lands 2/
Total
Area
------Area of------
County Land Water
--------------------------------------------------------------1,000 Acres--------------------------------------------------------
Apache 493 99 668 4,795 941 182 7,178 7,170 8
Cochise 489 397 1,374 0 1,586 131 3,977 3,977 0
Coconino 3,247 606 1,125 4,555 1,584 815 11,932 11,912 20
Gila 1,699 66 31 1,162 107 2 3,067 3,047 20
Graham 380 718 496 1,081 298 2 2,975 2,971 4
Greenlee 748 156 173 0 98 0 1,175 1,175 0
La Paz 0 1,670 255 248 148 571 2,892 2,884 8
Maricopa 655 1,732 642 270 1,748 855 5,902 5,877 25
Mohave 5 4,789 566 576 1,460 1,231 8,627 8,537 80
Navajo 487 89 372 4,240 1,150 31 6,369 6,367 2
Pima 337 375 862 2,475 805 1,024 5,878 5,878 0
Pinal 219 384 1,204 699 877 55 3,438 3,434 4
Santa Cruz 417 14 62 0 286 13 792 792 0
Yavapai 1,985 606 1,265 3 1,323 18 5,200 5,196 4
Yuma 0 479 188 7 374 2,487 3,535 3,533 2
Total 11,161 12,180 9,283 20,111 12,785 7,417 72,937 72,750 187 3/
County
Forest Service
Bureau of Land
Management
State of
Arizona
Indian Reservations
Individual or
Corporate
Other Public
Lands 2/
---------------------------------------------------Percent of Total Area---------------------------------------------------
Apache 7 1 9 67 13 3
Cochise 12 10 35 0 40 3
Coconino 27 5 9 38 13 7
Gila 55 2 1 38 3 4/
Graham 13 24 17 36 10 4/
Greenlee 64 13 15 0 8 0
La Paz 0 58 9 9 5 20
Maricopa 11 29 11 5 30 14
Mohave 4/ 56 7 7 17 14
Navajo 8 1 6 67 18 4/
Pima 6 6 15 42 14 17
Pinal 6 11 35 20 26 2
Santa Cruz 53 2 8 0 36 2
Yavapai 38 12 24 4/ 25 4/
Yuma 0 14 5 4/ 11 70
Total 15 17 13 28 18 10
1/ Source: State Land Department (2007) 2/ Includes land administered by National Park Service, Department of Defense, Fish and Wildlife Service, Bureau of Reclamation, and other state, county, and city public land. 3/ National Resources Inventory 2003, USDA NRCS. 4/ Less than 0.5 percent.

90
Farm Computer Usage and Ownership
DSL was the most common method of accessing the
Internet, with 38 percent of U.S. farms using it, up from
36 percent in 2009. Dialup access dropped from 23
percent in 2009 to 12 percent in 2011. Satellite and
wireless were each reported as the primary Internet
access methods on 15 and 20 percent of those U.S. farms
with Internet access, respectively. Cable was reported as
the primary access method on 11 percent of the farms,
the same level as 2009.
A total of 62 percent of U.S. farms now have Internet
access, compared with 59 percent in 2009. Sixty-five
percent of farms have access to a computer in 2011, up 1
percentage point from 2009. The proportion of U.S.
farms owning or leasing a computer in 2011, at 63
percent, was up 2 percentage points from 2009. Farms
using computers for their farm business remained
virtually stable at 37 percent in 2011 compared to 36
percent in 2009.
In 2011, 84 percent of U.S. farms with sales and
government payments of $250,000 or more have access
to a computer, 83 percent own or lease a computer, 72
percent are using a computer for their farm business, and
82 percent have Internet access. For farms with sales
and government payments between $100,000 and
$249,999, the figures are: 68 percent have access to a
computer, 68 percent own or lease a computer, 52
percent are using a computer for their farm business, and
67 percent have Internet access. Of the farms with sales
and government payments between $10,000 and
$99,999, 63 percent reported having computer access, 62
percent own or lease a computer, 41 percent use a
computer for their farm business, and 60 percent have
Internet access.
For crop farms, 67 percent have computer access and 41
percent use a computer for their farm business in 2011,
up 2 and 1 percentage points from 2009, respectively.
Internet access for crop farms has increased to 64
percent in 2011, compared with 60 percent in 2009. In
2011, a total of 63 percent of livestock farms have
computer access and 61 percent have Internet access.
Farm Computer Usage and Ownership, Arizona/Nevada and United States, 2011 Farms…. AZ/NV percent US percent 1/
With Computer Access 55 65
With Internet Access 55 62
Have Purchased Agricultural Inputs Over Internet 11 14
Have Conducted Agricultural Marketing Over Internet 4 12
Access USDA/NASS Reports Over Internet 3 7
Access Other USDA Reports and Service Over Internet 11 13
Access Other Federal Government Web Sites Over Internet 9 14
Use Dialup Primarily 22 12
Use DSL Primarily 20 38
Use Cable Primarily 17 11
Use Satellite Primarily 18 15
Use Wireless Primarily 11 20
Use Other/Unknown Primarily 12 4 1/ Excludes Alaska and Hawaii

Category Unit First Second Third Fourth Fifth Sixth Seventh Eighth Ninth Tenth Arizona
Rank General:
Number of Farms & TX MO IA OK KY CA MN TN WI IL 37
Ranches – 2011 Number 245,000 106,500 92,300 85,500 85,300 81,500 79,800 77,300 77,000 74,600 15,500
Land in Farms & TX MT KS NE SD NM ND OK CO IA 15
Ranches - 2011 1,000 Acres 130,000 60,500 46,000 45,500 43,650 43,400 39,600 34,700 31,300 30,700 26,100
Cash Receipts CA IA TX NE IL MN KS IN WI NC 29
(Preliminary) Million Dollars 43,544 29,892 22,681 21,815 19,820 18,536 15,859 11,837 11,741 10,543 4,314
Field Crops:
Pima Cotton CA TX AZ NM 3
production 1,000 Bales 785.0 40.0 20.0 6.2 20.0
Upland Cotton TX GA AR MS NC TN AZ MO AL CA 7
production 1,000 Bales 3,500 2,465 1,277 1,200 1,026 813 800 741 685 556 800
Cottonseed TX GA CA AR MS MO NC AZ TN AL
l 8
production 1,000 Tons 1,228 756 565 437 421 341 313 299 272 215 299
Durum Wheat ND CA MT AZ ID SD 4
production 1,000 Bushels 18,233 12,535 10,780 7,979 759 196 7,979
Dry Edible Beans ND MI MN NE ID WA CA WY CO NM 14
production 1,000 Cwt 4,940 3,360 2,281 2,100 1,880 1,463 1,026 726 585 277 155
Corn for Grain IA IL NE MN IN SD WI OH KS MO 37
production 1,000 Bushels 2,356,400
286 1,946,800 1,536,000
22
1,201,200
062 839,500 653,400 517,920 508,760 449,400 349,980 5,760
Corn for Silage WI CA NY PA MN ID MI IA KS SD 29
production 1,000 Tonss 15,698 12,350 7,520 6,510 6,300 6,188 5,400 4,100 3,850 3,100 690
Barley ID MT ND WA AZ CO VA WY CA PA 5
production 1,000 Bushels 46,500 31,000 16,450 8,510 8,000 7,938 6,160 6,111 4,725 3,575 8,000
Alfalfa Hay SD CA MT ID MN ND WI NE CO IA 13
production 1,000 Tons 6,345 6,072 4,400 4,300 4,070 3,643 3,220 3,159 2,880 2,788 2,075
Other Hay MO KY TX TN VA NE KS PA SD AR 43
production 1,000 Tons 5,600 4,620 3,960 3,906 2,816 2,465 2,450 2,392 2,280 2,224 140
Potatoes ID WA WI OR CO ND MN MI CA ME 23
production 1,000 Cwt 127,070 98,400 25,000 23,342 22,919 18,865 16,685 15,180 15,048 14,310 1,064
Principal Field Crops IA IL KS MN NE ND SD MO IN TX 37
harvested acreage 1,000 Acres 24,336 22,743 20,917 19,312 18,923 17,758 16,309 13,338 12,237 12,157 780
Lemons CA AZ 2
production 1,000 Boxes 21,000 2,500 2,500
Oranges FL CA TX NA
production 1,000 Boxes 140,300 61,500 1,949
Grapefruit FL TX CA NA
production 1,000 Boxes 19,750 6,300 4,100
Tangerines CA FL AZ 3
production 1,000 Boxes 9,900 4,650 300 300
Pecans GA NM TX AL AZ LA OK MS FL CA 5
production 1,000 Pounds 102,000 61,000 32,000 19,000 18,500 10,000 6000 5,000 4,000 3,700 18,500
Apples WA NY MI PA CA VA NC OR WV OH 25
production Million Pounds 5,410 1,220 985 458 280 220 140 92.5 67 66.6 11
91

Category Unit First Second Third Fourth Fifth Sixth Seventh Eighth Ninth Tenth Arizona
Vegetables:
Head Lettuce CA AZ 2
production 1,000 Cwt 36,750 12,060 12,060
Leaf Lettuce CA AZ 2
production 1,000 Cwt 10,557 1,739 1,739
Romaine Lettuce CA AZ 2
production 1,000 Cwt 17,641 6,994 6,994
Cauliflower CA AZ NY 2
production 1,000 Cwt 6,460 660 49 660
Broccoli CA AZ 2
production 1,000 Cwt 20,247 936 936
Spring Onions TX GA CA NA
production 1,000 Cwt 3,360 2,965 2,520
Cabbage CA NY FL CO TX GA AZ NC WI MI 7
production 1,000 Cwt 5,070 4,708 2,754 1,288 1,200 1,196 1,150 897 896 759 1,150
Spinach (Fresh) CA AZ NJ TX 2
production 1,000 Cwt 3,822 1,701 186 108 1,701
Peppers, Chile CA NM TX AZ 4
production 1,000 Cwt 2,528 2,032 152 124 124
Cantaloupes CA AZ GA IN SC CO TX PA MD 2
production 1,000 Cwt 11,070 4,800 1,040 572 455 399 275 185 44 4,800
Honeydews CA AZ TX 2
production 1,000 Cwt 2,318 718 180 718
Watermelons CA FL TX GA IN SC AZ NC DE MO 7
production 1,000 Cwt 7,800 7,564 5,250 4,290 3,024 2,660 2,340 1,938 1,050 957 2,340
Principal Vegetables CA FL AZ GA NY TX MI WA NC OH 3
Harvested acres Acres 753,700 185,100 115,000 101,800 58,530 54,000 52,700 40,800 37,900 31,330 115,000
Livestock:
All Cattle & Calves TX NE KS CA OK IA/MO SD WI CO MT 31
January 1, 2012 1,000 Head 11,900 6,450 6,100 5,350 4,500 3,900 3,650 3,400 2,750 2,500 920
Cattle on Feed TX NE KS IA CO CA OK SD MN AZ 10
January 1, 2012 1,000 Head 2,950 2,650 2,370 1,300 1,170 510 380 320 310 279 279
Cows that have Calved TX CA MO NE OK SD KS WI MT IA 35
January 1, 2012 1,000 Head 4,800 2,400 1,950 1,940 1,780 1,700 1,550 1,530 1,470 1,100 375
Calf Crop TX CA OK MO NE SD MT KS WI IA 36
2011 1,000 Head 4,650 2,030 1,850 1,820 1,690 1,620 1,470 1,420 1,380 1,050 290
All Sheep & Lambs TX CA CO WY UT SD ID MT OR IA 12
January 1, 2012 1,000 Head 650 570 460 370 305 285 240 225 200 195 140
Angora Goats TX AZ NM CA OR MO
ENGENG N ENG CO/MN 2
January 1, 2012 1,000 Head 85 23 11.5 3.5 2.4 1.5 1.1 1.0 23
Hogs and Pigs IA NC MN IL IN NE MO OK OH KS 22
December 1, 2011 1,000 Head 20,000 8,900 7,800 4,650 3,850 3,150 2,750 2,300 2,150 1,890 180
Honey ND CA SD MT FL MN MI TX WI ID 22
total production 1,000 Pounds 32,660 17,760 16,500 13,340 10,980 6,360 4,736 4,524 3,591 3,132 1,219
Milk CA WI ID NY PA TX MN MI NM WA 12
total produced Million pounds 41,462 26,117 13,256 12,826 10,604 9,582 8,890 8,478 8,177 6,169 4,412
92

93
USDA NASS Field Offices
ALABAMA Box 240578
Montgomery 36124-0578 334-279-3555 ALASKA Box 799 Palmer 99645-0799 907-745-4272 ARIZONA 230 N. 1st Avenue Suite 303 Phoenix 85003-1706 602-280-8850 ARKANSAS 10800 Financial Centre Pkwy. Suite 110
Little Rock 72211
501-228-9926
CALIFORNIA Box 1258
Sacramento 95812-1258
916-498-5161
COLORADO One Denver Federal Center
Bldg 67, Room 630
Denver 80225 303-236-2300
DELAWARE
Delaware Dept. of Ag Bldg.
2320 S. Dupont Highway Dover 19901
302-698-4537
FLORIDA Box 945200
Maitland 32794-5200
407-648-6013
GEORGIA Stephens Federal Bldg
355 E. Hancock Ave.
Suite 320 Athens 30601
706-546-2236
HAWAII
State Dept. of Agriculture Bldg. 1428 S. King St.
Honolulu 96814-2512
808-973-2907
IDAHO
Box 1699 Boise 83701-1969
208-334-1507
ILLINOIS
Box 19283
Springfield 62794-9283 217-492-4295
INDIANA 1435 Win Hentschel Blvd.
Suite 110
West Lafayette 47906-4145 765-494-8371
IOWA
210 Walnut Street
Suite 833 Des Moines 50309
515-284-4340
KANSAS
Box 3534
Topeka 66601-3534 785-233-2230
KENTUCKY
Box 1120
Louisville 40201-1120 502-582-5293
LOUISIANA
Box 65038
Baton Rouge 70896-5038 225-922-1362
MARYLAND
50 Harry S. Truman Pkwy
Suite 202 Annapolis 21401
410-841-5740
MICHIGAN
Box 26248 East Lansing 48909-6248
517-324-5300
MINNESOTA
Box 7068 St. Paul 55107-7068
651-201-6030
MISSISSIPPI
Box 980 Jackson 39205-0980
601-965-4575
MISSOURI Box L
Columbia 65205
573-876-0950
MONTANA
10 W. 15th Street Suite 3100
Helena 59626
406-441-1240
NEBRASKA
Box 81069
Lincoln 68501-1069 402-437-5541
NEVADA
Box 8880
Reno 89507-8880 775-972-6001
NEW ENGLAND
New Hampshire, Vermont, Connecticut, Rhode Island,
Massachusetts, Maine
53 Pleasant St., Rm. 2100 Concord, N.H. 03301
603-224-9639
NEW JERSEY
PO Box 330 Trenton 08625-0330
609-292-6385
NEW MEXICO
Box 1809 Las Cruces 88004-1809
575-522-6023
NEW YORK
10B Airline Drive Albany 12235-1004
518-457-5570
NORTH CAROLINA
Box 27767 Raleigh 27611-7767
919-856-4394
NORTH DAKOTA
Box 3166 Fargo 58108-3166
701-239-5306
OHIO
Box 686 Reynoldsburg 43068-0686
614-728-2100
OKLAHOMA
Box 528804 Oklahoma City 73152-8804
405-522-6190
OREGON 805 SW Broadway
Suite 910
Portland 97204 503-326-2131
PENNSYLVANIA
Box 60607
Harrisburg 17106-0607 717-787-3904
PUERTO RICO
Box 10163
Santurce 00907-1163 787-723-3773
SOUTH CAROLINA
Box 8
Columbia 29202-0008 803-765-5333
SOUTH DAKOTA
Box 5068
Sioux Falls 57117-5068 605-323-6500
TENNESSEE
Box 41505
Nashville 37204-1505 615-781-5300
TEXAS
Box 70
Austin 78767-0070 512-916-5581
UTAH
Box 25007
Salt Lake City 84125-5007 801-524-5003
VIRGINIA Box 1659 Richmond 23218-1659 804-771-2493 WASHINGTON Box 609 Olympia 98507-0609 360-709-2400 WEST VIRGINIA 1900 Kanawha Blvd. E Charleston 25305 304-345-5958 WISCONSIN Box 8934 Madison 53708-8934 608-224-4848 WYOMING Box 1148 Cheyenne 82003-1148 307-432-5600

UNITED STATES DEPARTMENT OF
AGRICULTURE
NASS - Arizona Field Office
230 N. 1st Ave, Ste 303
Phoenix, Arizona 85003-1706
-----------------------------------
OFFICIAL BUSINESS Penalty For Private Use $300
ADDRESS SERVICE REQUESTED
www.usda.gov/nass/
PRESORTED STANDARD POSTAGE & FEES PAID USDA PERMIT NO. G-38
PRESORTED STANDARD POSTAGE & FEES PAID
USDA PERMIT NO. G-38
OFFICIAL BUSINESS ADDRESS SERVICE REQUESTED