issues: data set evaluating environmental drivers of
TRANSCRIPT
- 1 -
TIEE Teaching Issues and Experiments in Ecology - Volume 16, April 2020
TIEE, Volume 16 © 2020 – Justin T. Nguyen, David J. Civitello, Karena H. Nguyen, and the Ecological Society of America. Teaching Issues and Experiments in Ecology (TIEE) is a project of the Committee on Diversity and Education of the Ecological Society of America (http://tiee.esa.org).
ISSUES: DATA SET Evaluating environmental drivers of disease outbreaks from seasonal trends Justin T. Nguyen, David J. Civitello, Karena H. Nguyen Department of Biology, Emory University, Atlanta, GA 30322 Corresponding author: Karena H. Nguyen ([email protected])
Disease outbreaks, such as those caused by Escherichia coli, can show seasonal trends. By DataBase Center for Life Science (DBCLS) and authorized for publication under the Creative Commons Attribution 4.0 International license via Wikimedia Commons (https://commons.wikimedia.org/w/index.php?curid=75011250). THE ECOLOGICAL QUESTION: What are the seasonal patterns and potential environmental drivers of common bacterial and parasitic diseases in the United States? ECOLOGICAL CONTENT: Ecophysiology, disease ecology, parasitology, seasonality, long-term observations
WHAT STUDENTS DO: Students receive a data set from the Centers for Disease Control and Prevention National Outbreak Reporting System (CDC NORS) containing the number of illnesses, hospitalizations, and deaths

- 2 -
TIEE Teaching Issues and Experiments in Ecology - Volume 16, April 2020
TIEE, Volume 16 © 2020 – Justin T. Nguyen, David J. Civitello, Karena H. Nguyen, and the Ecological Society of America. Teaching Issues and Experiments in Ecology (TIEE) is a project of the Committee on Diversity and Education of the Ecological Society of America (http://tiee.esa.org).
associated with outbreaks of a pathogen (i.e., Cryptosporidium, Cyclospora, Escherichia, Giardia, or Legionella). Data sets contain monthly records aggregated at the state level, along with transmission route and etiology. Students use Google Sheets to visualize seasonal trends in the data and develop hypotheses about potential ecological or environmental drivers of these patterns. Next, students conduct a literature search to find studies that evaluate a causal link between the hypothesized driver(s) and outbreak frequency or severity. Students share these findings in and across groups using a jigsaw structure. STUDENT-ACTIVE APPROACHES: Guided Inquiry, Cooperative Learning, Jigsaw, Quantitative Learning
SKILLS: First, students build skills required to visualize, interpret, and communicate field patterns by using raw data to create, label, and present bar graphs and interpret the data associated with those visualizations. Next, students develop critical thinking skills by developing ecological hypotheses to explain these field patterns. Students then develop research and written science communication skills by conducting their own literature search to find and summarize studies assessing their hypotheses. Lastly, students develop oral science communication skills by informally sharing their findings within and among groups.
ASSESSABLE OUTCOMES: ● Creating and interpreting figures that display seasonal patterns and measures of
virulence for a pathogen with correctly labeled axes using data sets from the CDC NORS
● Generating appropriate hypotheses based on reasonable interpretations of the self-generated figures
● Summarizing primary literature sources that assess the hypotheses in an annotated bibliography
● Informally presenting findings to classmates in groups to demonstrate oral scientific communication skills
● Predicting how environmental drivers of disease may impact bacteria and parasites in the future via a concept map
SOURCE:
• Centers for Disease Control and Prevention National Outbreak Reporting System (CDC NORS): https://wwwn.cdc.gov/norsdashboard/
ACKNOWLEDGEMENTS: We would like to thank the Centers for Disease and Control and Prevention for the data sets used in this module and the various students in BIOL 347 - Disease Ecology at Emory University who provided feedback to improve the activities.

- 3 -
TIEE Teaching Issues and Experiments in Ecology - Volume 16, April 2020
TIEE, Volume 16 © 2020 – Justin T. Nguyen, David J. Civitello, Karena H. Nguyen, and the Ecological Society of America. Teaching Issues and Experiments in Ecology (TIEE) is a project of the Committee on Diversity and Education of the Ecological Society of America (http://tiee.esa.org).
OVERVIEW OF THE ECOLOGICAL BACKGROUND
Ecophysiology examines how biotic and abiotic factors influence an organisms’ function and how individuals adapt in response to these environmental changes (Ferry-Graham and Gibb 2008). Additionally, ecophysiology aims to examine how the environment may directly or indirectly affect individual physiology and whether these effects scale up to influence population dynamics and species interactions. Research in this field therefore ranges from the molecular level, such as how temperature affects membrane permeability and protein denaturation (Gates 1980), to the population, community, and ecosystem levels, such as the impacts of sublethal and fluctuating exposure to hypoxic conditions on the metabolic rate, grazing rate, calcification, and reproductive investment of sea urchins under climate change conditions (Low and Micheli 2020).
The physiological responses of organisms to environmental changes influence distribution, abundance, growth rates, and species interactions. For example, global patterns of plant biomass, primary production, and community diversity are profoundly influenced by variation in temperature and water availability (Teeri and Stowe 1976, Churkina and Running 1998, Crimmins et al. 2011). Similarly, the responses of hosts and parasites to environmental factors can have profound consequences on the timing and severity of disease outbreaks under current and future scenarios (Krist et al. 2004, Altizer et al. 2013, Rohr et al. 2013, Stensgaard et al. 2019). For example, physiological constraints of the parasite Plasmodium falciparum and its mosquito vector Anopheles gambiae influence the seasonality of malaria transmission (Mordecai et al. 2013). A model combining these constraints with information on moisture availability, estimates of human population density, and predicted future climate scenarios predicts that Africa will see a net decrease in the amount of area suitable for malaria transmission. Areas suitable for year-round transmission and seasonal transmission will also likely shift to different parts of Africa (Ryan et al. 2015), suggesting that abiotic factors are an important driver of spatial and temporal trends in distribution and abundance.
By examining the seasonal trends in outbreaks of different bacteria and parasites, we may identify ecological or environmental factors that shape important traits, which could help improve predictions of disease severity, spread, and abundance in the future.
LITERATURE CITED: Altizer, S., R. S. Ostfeld, P. T. Johnson, S. Kutz, and C. D. Harvell. 2013. Climate change and infectious diseases: from evidence to a predictive framework. Science 341:514-519.

- 4 -
TIEE Teaching Issues and Experiments in Ecology - Volume 16, April 2020
TIEE, Volume 16 © 2020 – Justin T. Nguyen, David J. Civitello, Karena H. Nguyen, and the Ecological Society of America. Teaching Issues and Experiments in Ecology (TIEE) is a project of the Committee on Diversity and Education of the Ecological Society of America (http://tiee.esa.org).
Churkina, G., and S. W. Running. 1998. Contrasting Climatic Controls on the Estimated Productivity of Global Terrestrial Biomes. Ecosystems 1:206-215. Crimmins, S. M., S. Z. Dobrowski, J. A. Greenberg, J. T. Abatzoglou, and A. R. Mynsberge. 2011. Changes in climatic water balance drive downhill shifts in plant species' optimum elevations. Science 331:324-327. Ferry-Graham, L. A., and A. C. Gibb. 2008. Ecophysiology. Pages 1121-1125 Encyclopedia of Ecology. Elsevier Inc. Gates, D. M. 1980. Biophysical Ecology. Springer-Verlag New York. Krist, A. C., J. Jokela, J. Wiehn, and C. M. Lively. 2004. Effects of host condition on susceptibility to infection, parasite developmental rate, and parasite transmission in a snail-trematode interaction. J Evol Biol 17:33-40. Low, N. H. N., and F. Micheli. 2020. Short- and long-term impacts of variable hypoxia exposures on kelp forest sea urchins. Sci Rep 10:2632. Mordecai, E. A., K. P. Paaijmans, L. R. Johnson, C. Balzer, T. Ben-Horin, E. de Moor, A. McNally, S. Pawar, S. J. Ryan, T. C. Smith, and K. D. Lafferty. 2013. Optimal temperature for malaria transmission is dramatically lower than previously predicted. Ecol Lett 16:22-30. Rohr, J. R., T. R. Raffel, A. R. Blaustein, P. T. Johnson, S. H. Paull, and S. Young. 2013. Using physiology to understand climate-driven changes in disease and their implications for conservation. Conserv Physiol 1:cot022. Ryan, S. J., A. McNally, L. R. Johnson, E. A. Mordecai, T. Ben-Horin, K. Paaijmans, and K. D. Lafferty. 2015. Mapping Physiological Suitability Limits for Malaria in Africa Under Climate Change. Vector Borne Zoonotic Dis 15:718-725. Stensgaard, A. S., P. Vounatsou, M. E. Sengupta, and J. Utzinger. 2019. Schistosomes, snails and climate change: Current trends and future expectations. Acta Trop 190:257-268. Teeri, J. A., and L. G. Stowe. 1976. Climatic patterns and the distribution of C4 grasses in North America. Oecologia 23:1-12.
DATA SETS For faculty:
● Faculty Answer Key (Faculty-Key.pdf) ● Cryptosporidium outbreak data (Cryptosporidium_Instructor.xlsx) ● Cyclospora outbreak data (Cyclospora_Instructor.xlsx) ● Escherichia outbreak data (Escherichia_Instructor.xlsx) ● Giardia outbreak data (Giardia_Instructor.xlsx) ● Legionella outbreak data (Legionella_Instructor.xlsx)

- 5 -
TIEE Teaching Issues and Experiments in Ecology - Volume 16, April 2020
TIEE, Volume 16 © 2020 – Justin T. Nguyen, David J. Civitello, Karena H. Nguyen, and the Ecological Society of America. Teaching Issues and Experiments in Ecology (TIEE) is a project of the Committee on Diversity and Education of the Ecological Society of America (http://tiee.esa.org).
For students:
● Cryptosporidium outbreak data (Cryptosporidium_Student.xlsx) ● Cyclospora outbreak data (Cyclospora_Student.xlsx) ● Escherichia outbreak data (Escherichia_Student.xlsx) ● Giardia outbreak data (Giardia_Student.xlsx) ● Legionella outbreak data (Legionella_Student.xlsx)
These data are publicly available through the Centers for Disease Control and Prevention (CDC). National Outbreak Reporting System Dashboard. Atlanta, Georgia: U.S. Department of Health and Human Services, CDC. Last accessed <26Feb2020>. Available from URL: wwwn.cdc.gov/norsdashboard. The CDC gives permission for this data set to be posted and distributed on the TIEE website.

- 6 -
TIEE Teaching Issues and Experiments in Ecology - Volume 16, April 2020
TIEE, Volume 16 © 2020 – Justin T. Nguyen, David J. Civitello, Karena H. Nguyen, and the Ecological Society of America. Teaching Issues and Experiments in Ecology (TIEE) is a project of the Committee on Diversity and Education of the Ecological Society of America (http://tiee.esa.org).
STUDENT INSTRUCTIONS Background Ecophysiology examines how biotic and abiotic factors influence an organism’s function and how individuals adapt in response to these environmental changes. The interactions between pathogens, host and non-host populations, and the environment can influence the timing and severity of disease outbreaks. For example, many physiological traits of parasites and hosts operate at an optimum temperature (Mordecai et al. 2013), and deviations from these optimum temperatures can reduce the infectivity, survival, or reproduction of parasites or hosts (Anderson et al. 1982, Somero 2010, Studer et al. 2010, Rohr et al. 2018). Individual ecophysiology also can influence the seasonal distribution and abundance of pathogens (Altizer et al. 2006, Shocket et al. 2018). For example, the pathogen Vibrio vulnificus can cause gastroenteritis, septicemia, and other severe infections in humans. V. vulnificus optimally reproduces when salinity is low and when water temperatures exceed 20°C (Kelly 1982), which leads to peak abundances during warm summer and fall months (Paz et al. 2007, Mahmud et al. 2008). Investigating seasonal trends in the distribution and abundance of pathogens therefore can enable ecologists to generate hypotheses about the importance of environmental factors in driving disease transmission. Disease outbreaks are a concern globally, and this exercise focuses on five pathogens that have a major impact on health outcomes in the United States. All five pathogens can be transmitted through the environment; therefore, their distribution and abundance may be affected by environmental conditions. The genus Cryptosporidium contains many parasitic species that cause respiratory and gastrointestinal illnesses (i.e., cryptosporidiosis). People typically become infected when they ingest oocysts in recreational or drinking water. The oocysts migrate to the small intestine and infect the intestinal epithelial tissue, which can then cause vomiting, diarrhea, weight loss, or persistent cough (CDC 2019). Cryptosporidium oocysts that passed through a major water treatment plant were the source of a massive outbreak in Milwaukee, WI that affected over 400,000 residents (MacKenzie et al. 1994). It continues to be one of the major causes of waterborne diseases in the U.S. today. Escherichia coli is a gram-negative bacterium that typically resides in the intestines of many endo- and ectothermic organisms and is generally not harmful. However, recently emerging strains of Shiga toxin-producing E. coli (STEC) (e.g., E. coli O157:H7) and enterotoxigenic E. coli (ETEC) can cause severe diarrhea (CDC 2020). Infection occurs by ingesting contaminated water or
- 7 -
TIEE Teaching Issues and Experiments in Ecology - Volume 16, April 2020
TIEE, Volume 16 © 2020 – Justin T. Nguyen, David J. Civitello, Karena H. Nguyen, and the Ecological Society of America. Teaching Issues and Experiments in Ecology (TIEE) is a project of the Committee on Diversity and Education of the Ecological Society of America (http://tiee.esa.org).
undercooked or raw food. STEC and ETEC are currently two of the more common foodborne pathogens in the U.S. and have been responsible for food recalls of produce, meat products, and flour (CDC 2020). Cyclospora cayetanensis is a protozoan that is endemic in tropical and subtropical regions. Infection occurs by ingesting sporulated oocysts in contaminated food or water. After ingestion, sporozoites are released in the gastrointestinal tract and go on to invade epithelial cells (CDC 2018a). Common symptoms include diarrhea, weight loss, nausea, fatigue, fever, and vomiting. Although C. cayetanensis is not endemic to the U.S., outbreaks have been attributed to produce importation and overseas travel to endemic countries. Due to increased globalization and dependence on global food supply chains, there is concern that outbreaks will become more frequent in the future (Chacin-Bonilla 2010). Giardia lamblia (also known as Giardia intestinalis and Giardia duodenalis) is a flagellate protozoan that is commonly found in developing countries and has multiple hosts, including humans. It is typically transmitted through the ingestion of cysts in contaminated food and water. The cysts release trophozoites in the proximal small bowel where they multiply (CDC 2015). Commonly known as “traveler’s diarrhea,” symptoms include diarrhea, gas, greasy stools, abdominal cramps, vomiting, and dehydration. Globally, it is recognized as one of the biggest causes of diarrheal disease and of illness/death in children under the age of five (Kotloff et al. 2013). It is also one of the most common parasites found in stool specimens in the U.S. Legionella pneumophila is a gram-negative bacterium that is typically found in freshwater environments. Disease outbreaks occur when the bacteria enter an environment suitable for replication, such as cooling towers that are part of air condition systems for large buildings or wastewater treatment plants. Infection occurs via inhalation of contaminated water droplets in the air and can lead to Legionnaires’ disease, a severe form of pneumonia that has a case fatality rate of 9%. Additional symptoms include cough, fever, muscle aches, headaches, and shortness of breath. Although outbreaks can be prevented by employing chemical, thermal, or ultraviolet treatment methods, the number of outbreaks has increased since 2000 (CDC 2018b). Infectious disease surveillance is an important tool for monitoring and tracking the incidence and prevalence of disease outbreaks. Moreover, by examining long-term, temporal trends, public health organizations can better allocate resources and implement protocols to prevent future outbreaks from occurring.

- 8 -
TIEE Teaching Issues and Experiments in Ecology - Volume 16, April 2020
TIEE, Volume 16 © 2020 – Justin T. Nguyen, David J. Civitello, Karena H. Nguyen, and the Ecological Society of America. Teaching Issues and Experiments in Ecology (TIEE) is a project of the Committee on Diversity and Education of the Ecological Society of America (http://tiee.esa.org).
Literature Cited Altizer, S., A. Dobson, P. Hosseini, P. Hudson, M. Pascual, and P. Rohani. 2006. Seasonality and the dynamics of infectious diseases. Ecol Lett 9:467-484. Anderson, R. M., J. G. Mercer, R. A. Wilson, and N. P. Carter. 1982. Transmission of Schistosoma mansoni from man to snail: experimental studies of miracidial survival and infectivity in relation to larval age, water temperature, host size and host age. Parasitology 85 (Pt 2):339-360. CDC. 2015. Giardia. Centers for Disease Control and Prevention. CDC. 2018a. Cyclosporiasis (Cyclospora Infection). Centers for Disease Control and Prevention. CDC. 2018b. Legionella (Legionnaires' Disease and Pontiac Fever). Centers for Disease Control and Prevention. CDC. 2019. Parasites - Cryptosporidium (also known as "Crypto"). Centers for Disease Control and Prevention. CDC. 2020. E. coli (Escherichia coli). Centers for Disease Control and Prevention. Chacin-Bonilla, L. 2010. Epidemiology of Cyclospora cayetanensis: A review focusing in endemic areas. Acta Trop 115:181-193. Kelly, M. T. 1982. Effect of temperature and salinity on Vibrio (Beneckea) vulnificus occurrence in a Gulf Coast environment. Appl Environ Microbiol 44:820-824. Kotloff, K. L., J. P. Nataro, W. C. Blackwelder, D. Nasrin, T. H. Farag, S. Panchalingam, Y. Wu, S. O. Sow, D. Sur, R. F. Breiman, A. S. G. Faruque, A. K. M. Zaidi, D. Saha, P. L. Alonso, B. Tamboura, D. Sanogo, U. Onwuchekwa, B. Manna, T. Ramamurthy, S. Kanungo, J. B. Ochieng, R. Omore, J. O. Oundo, A. Hossain, S. K. Das, S. Ahmed, S. Qureshi, F. Quadri, R. A. Adegbola, M. Antonio, M. J. Hossain, A. Akinsola, I. Mandomando, T. Nhampossa, S. Acácio, K. Biswas, C. E. O'Reilly, E. D. Mintz, L. Y. Berkeley, K. Muhsen, H. Sommerfelt, R. M. Robins-Browne, and M. M. Levine. 2013. Burden and aetiology of diarrhoeal disease in infants and young children in developing countries (the Global Enteric Multicenter Study, GEMS): a prospective, case-control study. The Lancet 382:209-222. MacKenzie, W. R., N. J. Hoxie, M. E. Proctor, M. S. Gradus, K. A. Blair, D. E. Peterson, J. J. Kazmierczak, D. G. Addiss, K. R. Fox, J. B. Rose, and et al. 1994. A massive outbreak in Milwaukee of cryptosporidium infection transmitted through the public water supply. N Engl J Med 331:161-167.

- 9 -
TIEE Teaching Issues and Experiments in Ecology - Volume 16, April 2020
TIEE, Volume 16 © 2020 – Justin T. Nguyen, David J. Civitello, Karena H. Nguyen, and the Ecological Society of America. Teaching Issues and Experiments in Ecology (TIEE) is a project of the Committee on Diversity and Education of the Ecological Society of America (http://tiee.esa.org).
Mahmud, Z. H., S. B. Neogi, A. Kassu, B. T. Mai Huong, I. K. Jahid, M. S. Islam, and F. Ota. 2008. Occurrence, seasonality and genetic diversity of Vibrio vulnificus in coastal seaweeds and water along the Kii Channel, Japan. FEMS Microbiol Ecol 64:209-218. Mordecai, E. A., K. P. Paaijmans, L. R. Johnson, C. Balzer, T. Ben-Horin, E. de Moor, A. McNally, S. Pawar, S. J. Ryan, T. C. Smith, and K. D. Lafferty. 2013. Optimal temperature for malaria transmission is dramatically lower than previously predicted. Ecol Lett 16:22-30. Paz, S., N. Bisharat, E. Paz, O. Kidar, and D. Cohen. 2007. Climate change and the emergence of Vibrio vulnificus disease in Israel. Environ Res 103:390-396. Rohr, J. R., D. J. Civitello, J. M. Cohen, E. A. Roznik, B. Sinervo, and A. I. Dell. 2018. The complex drivers of thermal acclimation and breadth in ectotherms. Ecol Lett 21:1425-1439. Shocket, M. S., D. Vergara, A. J. Sickbert, J. M. Walsman, A. T. Strauss, J. L. Hite, M. A. Duffy, C. E. Caceres, and S. R. Hall. 2018. Parasite rearing and infection temperatures jointly influence disease transmission and shape seasonality of epidemics. Ecology 99:1975-1987. Somero, G. N. 2010. The physiology of climate change: how potentials for acclimatization and genetic adaptation will determine 'winners' and 'losers'. J Exp Biol 213:912-920. Studer, A., D. W. Thieltges, and R. Poulin. 2010. Parasites and global warming: net effects of temperature on an intertidal host–parasite system. Marine Ecology Progress Series 415:11-22. Approach: The learning outcomes for Parts 1-3 are as follows:
1. Create figures in Google Sheets (or R) that display seasonal patterns in abundance or virulence for the pathogen with correctly labeled axes.*
2. Explain the life cycle of the bacteria or parasite. 3. Generate appropriate hypotheses about which (if any) environmental
factors may be influencing the transmission or virulence of the pathogen based on the self-generated* figures and pathogen’s life cycle.
4. Find related literature sources to assess the hypotheses. 5. Demonstrate oral scientific communication skills by informally presenting
findings to classmates. 6. Predict how future environmental change scenarios may impact outbreaks
or virulence. * Your instructor may also provide these figures to you.

- 10 -
TIEE Teaching Issues and Experiments in Ecology - Volume 16, April 2020
TIEE, Volume 16 © 2020 – Justin T. Nguyen, David J. Civitello, Karena H. Nguyen, and the Ecological Society of America. Teaching Issues and Experiments in Ecology (TIEE) is a project of the Committee on Diversity and Education of the Ecological Society of America (http://tiee.esa.org).
Student worksheets: Part 1: Raw data from CDC NORS Purpose In Part 1, you will work in a group to construct a series of figures in Google Sheets using a data set for a particular pathogen from the CDC NORS. Each individual should maintain their own answer sheet to the questions below, but you should work as a team to answer the questions. Each group member should have a role! For example, the analyst could enter formulas in the shared document, the data visualizer could prepare figures and label axes, the moderator could lead the discussion of the figure, and the recorder could create a written summary of the interpretation, highlighting consensus or disagreement. You can swap roles for different questions or take on multiple roles if needed. After this, your group will work to develop hypotheses about what environmental factors might be driving the temporal trends you see. Introduction and background The Centers for Disease Control and Prevention (CDC) National Outbreak Reporting System (NORS) is a domestic surveillance data platform that contains data about outbreaks that have been reported to the CDC and that the CDC has reviewed. CDC-NORS has been one of the central surveillance systems for the U.S. since 2009 and is updated annually. County and state public health agencies report outbreaks to CDC-NORS, who synthesize these data. Along with data on disease outbreaks in the U.S., CDC-NORS also contains the paper-based Foodborne Disease Outbreak Reporting System (1973-1997), the electronic-based Foodborne Disease Outbreak Reporting System (1998-2008), and the Waterborne Disease and Outbreak Surveillance System (1971 - 2008). According to CDC-NORS, an outbreak is defined as “the occurrence of two or more cases of a similar illness resulting from a common exposure”. The cause of these outbreaks could be foodborne, waterborne, environmentally transmitted, person-to-person, spillover from wildlife and/or domesticated animals, or outbreaks of unknown cause. In the event of an outbreak, county or state public health agencies record epidemiological data such as year, month, location of outbreak (state), primary mode of infection, etiology of outbreak, serotype/genotype of etiology, observed setting of outbreak, number of illnesses, number of hospitalizations, number of patients who are confirmed to be hospitalized, number of deaths, number of confirmed deaths from those diagnosed, whether the outbreak is vector or foodborne, observed contaminated food ingredient (if foodborne), Interagency Food Safety Analytics Collaboration (IFSAC) categorization of contaminated food ingredient, context of waterborne outbreak, setting of waterborne outbreak, suspected animal transmission,

- 11 -
TIEE Teaching Issues and Experiments in Ecology - Volume 16, April 2020
TIEE, Volume 16 © 2020 – Justin T. Nguyen, David J. Civitello, Karena H. Nguyen, and the Ecological Society of America. Teaching Issues and Experiments in Ecology (TIEE) is a project of the Committee on Diversity and Education of the Ecological Society of America (http://tiee.esa.org).
specific animal type, and investigation status of the body of water for waterborne outbreaks. These data are submitted to the CDC, who analyze the data for quality assurance. Once cross-examined, the data are added to the public CDC-NORS database. For the purposes of this activity, we will focus on month, the number of outbreaks, and the number of illnesses. Using the data provided, use Google Sheets (or R) to create figures with appropriately labeled axes that examine patterns in the transmission and virulence for your pathogen. Your figures should answer the following prompts:
1. Describe the seasonal patterns in estimates of pathogen transmission. E.g.,
a. What are the number of outbreaks per month? b. What is the average size of outbreaks per month? c. What is the total number of illnesses per month?
2. Describe the seasonal patterns in indices of virulence of the pathogen and how they relate to estimates of pathogen transmission.
a. What data would you use to describe pathogen virulence? b. How do the figures (from question 1) relate to each other?
3. Based on the data provided by the CDC NORS and the life cycle of the pathogen, develop a hypothesis (or hypotheses) about which (if any) environmental factors may be influencing the transmission or virulence of the pathogen. Provide the rationale behind your hypothesis. Websites describing the life cycle or the main modes of transmission for each pathogen are provided below:
a. Cryptosporidium: https://www.cdc.gov/parasites/crypto/pathogen.html
b. Cyclospora: https://www.cdc.gov/parasites/cyclosporiasis/biology.html
c. Escherichia coli: https://www.cdc.gov/ecoli/ecoli-prevention.html d. Giardia: https://www.cdc.gov/parasites/giardia/pathogen.html e. Legionella: https://www.cdc.gov/legionella/about/causes-
transmission.html

- 12 -
TIEE Teaching Issues and Experiments in Ecology - Volume 16, April 2020
TIEE, Volume 16 © 2020 – Justin T. Nguyen, David J. Civitello, Karena H. Nguyen, and the Ecological Society of America. Teaching Issues and Experiments in Ecology (TIEE) is a project of the Committee on Diversity and Education of the Ecological Society of America (http://tiee.esa.org).
Part 2: Conducting a literature search Purpose Based on the hypotheses developed in Part 1, you will work in the same group to conduct a literature search to find studies that assess a causal mechanism for why the transmission or virulence of your pathogen may or may not show seasonal trends. For this portion of the activity, you should critically examine peer-reviewed literature to see how other researchers have tested a hypothesis similar or related to yours. Remember to assign a role to each team member after you have identified journal articles as a team. For example, each team member could summarize a different section of the paper (i.e., objective, methods, results, and conclusions). You can swap roles for different papers or summarize sections together if needed. Introduction and background Google Scholar and Web of Science are only two databases out of many that can provide access to a wide range of peer-reviewed articles. Google Scholar is a web search engine that allows you to broadly search through numerous journals. Web of Science is a website that provides access to many databases for articles and journals from multiple disciplines. When reading a scientific journal/article, the abstract is usually the first thing you see. You can read the abstract to get a general overview of the paper. Searching for papers in Google Scholar/Web of Science Go to https://scholar.google.com/. You should be on the homepage for the website. You can type in your pathogen to see what articles appear. It will be beneficial for you to add the word “outbreak” to narrow down the type of articles you see. Try other search terms that relate to your hypotheses as well.

- 13 -
TIEE Teaching Issues and Experiments in Ecology - Volume 16, April 2020
TIEE, Volume 16 © 2020 – Justin T. Nguyen, David J. Civitello, Karena H. Nguyen, and the Ecological Society of America. Teaching Issues and Experiments in Ecology (TIEE) is a project of the Committee on Diversity and Education of the Ecological Society of America (http://tiee.esa.org).
What you should see is a list of articles with very brief samples of what is in the article. Select an article to read the paper and see what the article contains. It is more difficult in Google Scholar to see filters for peer-reviewed articles, but Google Scholar does provide an easy first glimpse of available research into your outbreaks.

- 14 -
TIEE Teaching Issues and Experiments in Ecology - Volume 16, April 2020
TIEE, Volume 16 © 2020 – Justin T. Nguyen, David J. Civitello, Karena H. Nguyen, and the Ecological Society of America. Teaching Issues and Experiments in Ecology (TIEE) is a project of the Committee on Diversity and Education of the Ecological Society of America (http://tiee.esa.org).
Similarly, Web of Science utilizes a homepage where you can type in the name of your pathogen and look for peer-reviewed articles. This search engine is usually accessed through your institution’s library website.
It may be more effective to include additional search terms to find more relevant articles. Click on the option “+ Add row”. This will add another entry to add another search term.

- 15 -
TIEE Teaching Issues and Experiments in Ecology - Volume 16, April 2020
TIEE, Volume 16 © 2020 – Justin T. Nguyen, David J. Civitello, Karena H. Nguyen, and the Ecological Society of America. Teaching Issues and Experiments in Ecology (TIEE) is a project of the Committee on Diversity and Education of the Ecological Society of America (http://tiee.esa.org).
This will allow you to be more specific with your search. In this case, we are only looking at cryptosporidium articles that included the topic of the outbreak. Think about other search terms you can include. Complete the following objectives for this section:
1. Within your group, conduct a literature search to find studies that assess the hypothesis (or hypotheses) you developed in Part 1 (it does not have to match exactly and can be a related idea). Find at least five papers assessing a causal mechanism for why transmission or virulence of your pathogen may or may not show seasonal trends. Be sure to connect how the paper relates to your hypothesis, e.g., do the researchers examine the effect of the environmental factor you hypothesize to influence the seasonality of outbreaks of your pathogen? Explicitly state how the results support or refute your proposed hypothesis of what environmental factors are driving seasonal transmission or virulence.
2. Compile a shared annotated bibliography. For each paper, be sure to briefly summarize the study objective, methods, results, and conclusions (5-10 sentences per source).
3. Discuss what additional data (at least 5 examples) you think the CDC could collect to give a more comprehensive view of disease outbreaks for your pathogen.

- 16 -
TIEE Teaching Issues and Experiments in Ecology - Volume 16, April 2020
TIEE, Volume 16 © 2020 – Justin T. Nguyen, David J. Civitello, Karena H. Nguyen, and the Ecological Society of America. Teaching Issues and Experiments in Ecology (TIEE) is a project of the Committee on Diversity and Education of the Ecological Society of America (http://tiee.esa.org).
Similar to part 1, you should maintain your own answer sheet to the prompts, but work as a team to answer the questions. By the end of part 2, you should have a consensus among your group about the following:
❏ The life cycle of your pathogen ❏ The temporal trends you saw in the figures for your pathogen ❏ How these temporal trends informed the development of your
hypothesis/hypotheses ❏ How researchers have assessed the hypothesis your group developed (or
a similar hypothesis) and the findings from those studies Part 3: Comparing and contrasting parasitic and bacterial diseases Purpose In this portion of the activity, you will recombine into groups with different pathogens to compare and contrast the life cycle of your pathogen and how that might influence the temporal trends seen in your data. You will also teach your peers about what you found in Parts 1 and 2. Lastly, you will discuss how you think environmental drivers of disease may impact pathogen virulence in the future. Record your notes and discussion as a group. Based on what you have learned from Parts 1 and 2, discuss the following prompts:
1. Describe the life cycle of your pathogen to your new group members. Construct a list of similarities and differences in the life cycles of the different pathogens. Brainstorm and record ≥5 ways these similarities and differences could influence pathogen transmission.
2. Next, describe the temporal trends you saw in your data set to your peers. How did the information from the figures influence the development of your hypothesis?
3. What did your initial group find from the literature search? Did you find studies that support your hypothesis?
4. Together, broadly discuss how environmental drivers of disease might impact pathogen outbreaks or virulence in the future. Create a concept map of how environmental factors could interact to impact pathogen outbreaks or virulence.

- 17 -
TIEE Teaching Issues and Experiments in Ecology - Volume 16, April 2020
TIEE, Volume 16 © 2020 – Justin T. Nguyen, David J. Civitello, Karena H. Nguyen, and the Ecological Society of America. Teaching Issues and Experiments in Ecology (TIEE) is a project of the Committee on Diversity and Education of the Ecological Society of America (http://tiee.esa.org).
NOTES TO FACULTY The goal of this activity is to introduce students to the basic scientific process, from data visualization and interpretation, to hypothesis generation and the communication of their findings to peers, within the context of disease ecology. Students will be introduced to a data set containing information about outbreaks for a pathogen and will create figures to visualize the data in Google Sheets. Students will work in groups to interpret the figures they have created and develop hypotheses about what environmental drivers may be influencing the trends they see in the data. Next, they will find primary literature sources to assess their claims and share these findings with individuals from different groups. The latter portion will facilitate data sharing and collaboration among peers. Comments on introducing this activity to your students A brief introduction to ecophysiology and disease ecology would be beneficial for students in an upper-level lab, whereas a more in-depth discussion may be beneficial for a freshman, sophomore, or non-majors lab. The CDC and all literature cited should provide some background information for instructors unfamiliar with this topic. How to use this activity in a class This module can be completed during a longer class period (> 75 minutes) if students are familiar with Google Sheets, data interpretation, and conducting a literature search. It is suggested that if instructors want to break the module up into multiple class periods, Part 1 should be completed first, and Parts 2 and 3 should be completed together. However, all three parts could be completed separately if the class size is large and the instructors want to ensure that all work can be completed in class. It is recommended that there be no more than 4-5 students per group, as larger group sizes may impede collaboration among peers. We suggest that all parts be completed in class, as this activity relies heavily on group collaboration and group discussion. Comments on data accessibility We provide the data sets in this activity to minimize download issues and to avoid having students view the figures that are visible on the CDC NORS website. The current data sets contain data collected from 1998-2017. If instructors want to check for up-to-date data, they can visit https://wwwn.cdc.gov/norsdashboard/ and narrow the search terms by Etiology for each specific pathogen. Excel spreadsheets with “current search data” can be downloaded at the bottom of the page. Comments on possible extensions/additions this activity

- 18 -
TIEE Teaching Issues and Experiments in Ecology - Volume 16, April 2020
TIEE, Volume 16 © 2020 – Justin T. Nguyen, David J. Civitello, Karena H. Nguyen, and the Ecological Society of America. Teaching Issues and Experiments in Ecology (TIEE) is a project of the Committee on Diversity and Education of the Ecological Society of America (http://tiee.esa.org).
If you or your students are proficient at the programming language R, we have provided an R Markdown file you can view and use. The activity can be adapted to have students write their own R code to visualize the data. For classes with proficiency in R, the aggregate() function can be used on the data sets to conduct the analysis (see Nguyen et al_Faculty-Key.pdf). Alternatively, the instructor can provide the figures to students. The latter can also be done if the class period is short and the instructor would rather focus on the guided questions and interpretations of the data. Lastly, this activity only explores a portion of the data set. Instructors could design questions that examine the “Setting” in which outbreaks took place or related environmental factors (e.g., “Water Exposure”) if these variables are of interest. Comments on the jigsaw technique Parts 1-3 are designed to employ the jigsaw technique, which first sorts students into “expert” groups that study one particular issue and then re-sorts students into “working” groups to learn from each other. For this activity, parts 1-2 allow students to develop expertise for one pathogen. In part 3, students will recombine into groups with individuals representing each pathogen. This progression allows for cooperative learning among peers and increases individual accountability. We recommend that you or a TA pre-sort students into “expert” and “working” groups to further streamline the activity. Comments on challenges to anticipate and solve
● Students have varying experiences with Google Sheets. It would be beneficial for you or your TA to circle through the groups to aid with any issues that arise from inexperience with Google Sheets. We have provided detailed instructions to alleviate some of these problems, but students may still face conceptual challenges with understanding the various functions. A walkthrough of basic functions in Google Sheets should be considered if familiarity with Google Sheets appears low among students. Similar concerns would apply to R.
● Difficulties generating plots. For some students, this may be the first time they are being asked to create figures from a data set. Encourage students to look at the raw data set first, e.g., what data are provided, how the data are divided, and the column titles. We have provided a tab with metadata to clarify what type of data is contained within each column. Walking through one data set as an example for the entire class could alleviate this concern. This may help overwhelmed students understand that they are only going to examine some of the data provided. We recommend using the Cyclospora data set if you decide to work through one data set with the class.

- 19 -
TIEE Teaching Issues and Experiments in Ecology - Volume 16, April 2020
TIEE, Volume 16 © 2020 – Justin T. Nguyen, David J. Civitello, Karena H. Nguyen, and the Ecological Society of America. Teaching Issues and Experiments in Ecology (TIEE) is a project of the Committee on Diversity and Education of the Ecological Society of America (http://tiee.esa.org).
● Difficulties interpreting the data. This may also be the first time students are being asked to interpret data from figures they have created on their own. This is where it may be beneficial for you or a TA to view the Instructor Key. It will help to be familiar with the trends in the data sets to better guide students.
● Difficulties discussing indices of virulence. The concept of pathogen virulence may be new to many students. We found that students had different ideas about how to measure virulence based on the data sets provided, but discussions eventually converged to using mortality as a metric. We recommend that instructors allow for this discussion to develop organically, but to nudge students towards using mortality-related data if they are getting off track.
● Difficulties developing a hypothesis. It may be beneficial to introduce the concept of hypothesis development for all students. Some resources for guiding hypothesis generation include:
McPherson, G.R. 2001. Teaching & Learning the Scientific Method. The American Biology Teacher 63(4):242-245.
Windschitl et al. 2008. Beyond the scientific method: Model‐based inquiry as a new paradigm of preference for school science investigations. Science Education 92(5): 941-967 (doi: https://doi.org/10.1002/sce.20259).
Stress that students need to connect what they know about their pathogen to the trends they see in the data in order to formulate an appropriate hypothesis. You or your TA should review these hypotheses before they move on to finding primary literature sources. Students might also be concerned that they have to generate the “correct” hypothesis. It could be helpful to encourage them to consider all plausible hypotheses and remind them that science typically progresses by eliminating or refuting unsupported hypotheses.
● Difficulties finding and interpreting literature sources. It may be easy for students to pick the first few papers that come up after a simple search on Google Scholar or Web of Science. Encourage students to write an annotated bibliography of these papers (e.g., study objective, methods, results, and conclusions in 5-10 sentences per source) and explicitly connect how the study evaluates their hypothesis. Encourage students to move beyond the abstract and interpret the figures of the paper.
● Unwillingness to work and share in groups. Students may feel uncomfortable working in groups. We have provided suggestions in parts 1 and 2 for how students could define individual roles, but it may be

- 20 -
TIEE Teaching Issues and Experiments in Ecology - Volume 16, April 2020
TIEE, Volume 16 © 2020 – Justin T. Nguyen, David J. Civitello, Karena H. Nguyen, and the Ecological Society of America. Teaching Issues and Experiments in Ecology (TIEE) is a project of the Committee on Diversity and Education of the Ecological Society of America (http://tiee.esa.org).
beneficial for you or a TA to check-in and confirm that roles have been allocated. Let students know that their grade will be dependent on an individual worksheet for parts 1 and 2, their ability to explain their findings to peers in part 3 (the jigsaw activity in part 3 was created to increase individual accountability), and the group discussion they complete in part 3. Stress that collaboration is a tenet of science and scientific communication, and that they are practicing these skills!
Assessment of student learning outcomes Below we have provided the worksheet questions and an example of structured rubrics from which to grade students. It is possible that grading could be adapted for completion instead. Part 1: Raw data from CDC NORS Using the data provided, use Google Sheets (or R) to create figures with appropriately labeled axes that examine patterns in the transmission and virulence for your pathogen. Your figures should answer the following prompts:
1. Describe the seasonal patterns in estimates of pathogen transmission. E.g.,
a. What are the number of outbreaks per month? b. What is the average size of outbreaks per month? c. What is the total number of illnesses per month?
2. Describe the seasonal patterns in indices of virulence of the pathogen and how they relate to estimates of pathogen transmission.
a. What data would you use to describe pathogen virulence? b. How do the figures (from question 1) relate to each other?
3. Based on the data provided by the CDC NORS and the life cycle of the pathogen, develop a hypothesis (or hypotheses) about which (if any) environmental factors may be influencing the transmission or virulence of the pathogen. Provide the rationale behind your hypothesis. Websites describing the life cycle or the main modes of transmission for each pathogen are provided below:
a. Cryptosporidium: https://www.cdc.gov/parasites/crypto/pathogen.html
b. Cyclospora: https://www.cdc.gov/parasites/cyclosporiasis/biology.html
c. Escherichia coli: https://www.cdc.gov/ecoli/ecoli-prevention.html d. Giardia: https://www.cdc.gov/parasites/giardia/pathogen.html e. Legionella: https://www.cdc.gov/legionella/about/causes-
transmission.html

- 21 -
TIEE Teaching Issues and Experiments in Ecology - Volume 16, April 2020
TIEE, Volume 16 © 2020 – Justin T. Nguyen, David J. Civitello, Karena H. Nguyen, and the Ecological Society of America. Teaching Issues and Experiments in Ecology (TIEE) is a project of the Committee on Diversity and Education of the Ecological Society of America (http://tiee.esa.org).
Points and Criteria
1 2 3 4 5
Q1 Major errors in calculating seasonal patterns from the raw data; figures not provided
Major errors in calculating seasonal patterns from the raw data; figures are missing >2 components
Some errors in calculating seasonal patterns from the raw data; figures are missing 1 component
Seasonal patterns calculated correctly from the raw data; figures are missing 1 component
Seasonal patterns calculated correctly from the raw data; figures are complete
Q2 Students unable to interpret the figures and summarize data trends
Students able to interpret the figures but need much guidance to summarize data trends
Students able to interpret the figures but need some guidance to summarize data trends
Students able to interpret the figures and need little guidance to summarize data trends
Students able to interpret the figures and how they relate to each other
Q3 No hypotheses are developed
Hypotheses do not relate to pathogen physiology or data trends
Hypotheses based on only pathogen physiology or data trends with no connections
Hypotheses do not logically connect pathogen physiology and data trends; poor rationale provided
Hypotheses logically connect pathogen physiology, rationale is provided, and data trends and are testable
Part 2: Conducting a literature search Complete the following objectives for this section:
1. Within your group, conduct a literature search to find studies that assess the hypothesis (or hypotheses) you developed in Part 1 (it does not have to match exactly and can be a related idea). Find at least five papers assessing a causal mechanism for why transmission or virulence of your pathogen may or may not show seasonal trends. Be sure to connect how the paper relates to your hypothesis, e.g., do the researchers examine the effect of the environmental factor you hypothesize to influence the seasonality of outbreaks of your pathogen? Explicitly state how the results

- 22 -
TIEE Teaching Issues and Experiments in Ecology - Volume 16, April 2020
TIEE, Volume 16 © 2020 – Justin T. Nguyen, David J. Civitello, Karena H. Nguyen, and the Ecological Society of America. Teaching Issues and Experiments in Ecology (TIEE) is a project of the Committee on Diversity and Education of the Ecological Society of America (http://tiee.esa.org).
support or refute your proposed hypothesis of what environmental factors are driving seasonal transmission or virulence.
2. Compile a shared annotated bibliography. For each paper, be sure to briefly summarize the study objective, methods, results, and conclusions (5-10 sentences per source).
3. Discuss what additional data (at least 5 examples) you think the CDC could collect to give a more comprehensive view of disease outbreaks for your pathogen.
Points and Criteria
1 2 3 4 5
Q1 5 papers do not relate to the hypothesis
>3 papers do not relate to the hypothesis
All papers relate to the hypothesis, but students have much difficulty explaining how the studies assess their hypothesis
All papers relate to the hypothesis, but students have some difficulty explaining how the studies assess their hypothesis
All papers relate to the hypothesis, and student can explain how the studies assess their hypothesis
Q2 Annotated bibliography not completed
Annotations missing ≥3 components
Annotations missing 2 components
Annotations missing 1 component
Annotations contain all components and are 5-10 sentences
Q3 Students provide 0 additional types of data CDC could collect
Students provide 1 additional type of data CDC could collect
Students provide 2-3 additional types of data CDC could collect
Students provide 4 additional types of data CDC could collect
Students provide ≥5 additional types of data CDC could collect

- 23 -
TIEE Teaching Issues and Experiments in Ecology - Volume 16, April 2020
TIEE, Volume 16 © 2020 – Justin T. Nguyen, David J. Civitello, Karena H. Nguyen, and the Ecological Society of America. Teaching Issues and Experiments in Ecology (TIEE) is a project of the Committee on Diversity and Education of the Ecological Society of America (http://tiee.esa.org).
Part 3: Comparing and contrasting parasitic and bacterial diseases in the United States Based on what you have learned from Parts 1 and 2, discuss the following prompts:
1. Describe the life cycle of your pathogen to your new group members. Construct a list of similarities and differences in the life cycles of the different pathogens. Brainstorm and record ≥5 ways these similarities and differences could influence pathogen transmission.
2. Next, describe the temporal trends you saw in your data set to your peers. How did the information from the figures influence the development of your hypothesis?
3. What did your initial group find from the literature search? Did you find studies that support your hypothesis?
4. Together, broadly discuss how environmental drivers of disease might impact pathogen outbreaks or virulence in the future. Create a concept map of how environmental factors could interact to impact pathogen outbreaks or virulence.

- 24 -
TIEE Teaching Issues and Experiments in Ecology - Volume 16, April 2020
TIEE, Volume 16 © 2020 – Justin T. Nguyen, David J. Civitello, Karena H. Nguyen, and the Ecological Society of America. Teaching Issues and Experiments in Ecology (TIEE) is a project of the Committee on Diversity and Education of the Ecological Society of America (http://tiee.esa.org).
Points and Criteria
1 2 3 4 5
Q1 Students cannot describe similarities and differences between pathogens or how these factors might influence its transmission
Students describe similarities and differences between pathogens but not how these factors might influence its transmission
Students describe similarities and differences between pathogens and provide 1-2 examples of how these factors might influence its transmission
Students describe similarities and differences between pathogens and provide 3-4 examples of how these factors might influence its transmission
Students describe similarities and differences between pathogens and provide ≥5 examples of how these factors might influence transmission
Q1 Students do not describe whether temporal trends were present or how this influenced hypothesis development
Students incorrectly describe temporal trends for their pathogen, and minimally discuss how this influenced hypothesis development
Students correctly describe temporal trends for their pathogen, but discuss how this influenced hypothesis development
Students correctly describe temporal trends for their pathogen, but minimally discuss how this influenced hypothesis development
Students correctly describe temporal trends for their pathogen and discuss how this influenced hypothesis development
Q3 & Q4
Student does not share their findings with the group and does not contribute to the concept map of how pathogen virulence may be impacted
Student minimally shares their findings with the group and minimally contributes to the concept map of how pathogen
Student shares their findings with their group and minimally participates in discussions of how pathogen virulence may be impacted and
Student shares their findings with their group and provides some suggestions to the concept map for how pathogen
Student shares their findings with their group and actively contributes to the concept map of how pathogen virulence may be impacted

- 25 -
TIEE Teaching Issues and Experiments in Ecology - Volume 16, April 2020
TIEE, Volume 16 © 2020 – Justin T. Nguyen, David J. Civitello, Karena H. Nguyen, and the Ecological Society of America. Teaching Issues and Experiments in Ecology (TIEE) is a project of the Committee on Diversity and Education of the Ecological Society of America (http://tiee.esa.org).
virulence may be impacted
moderately contributes to the concept map of how pathogen virulence may be impacted
virulence may be impacted

- 26 -
TIEE Teaching Issues and Experiments in Ecology - Volume 16, April 2020
TIEE, Volume 16 © 2020 – Justin T. Nguyen, David J. Civitello, Karena H. Nguyen, and the Ecological Society of America. Teaching Issues and Experiments in Ecology (TIEE) is a project of the Committee on Diversity and Education of the Ecological Society of America (http://tiee.esa.org).
APPENDIX Detailed instructions for visualizing the data sets in Google Sheets
Upload the appropriate data set for your pathogen onto Google Drive. Open the data set with Google Sheets.

- 27 -
TIEE Teaching Issues and Experiments in Ecology - Volume 16, April 2020
TIEE, Volume 16 © 2020 – Justin T. Nguyen, David J. Civitello, Karena H. Nguyen, and the Ecological Society of America. Teaching Issues and Experiments in Ecology (TIEE) is a project of the Committee on Diversity and Education of the Ecological Society of America (http://tiee.esa.org).
Open a new sheet in your Google Sheet file by clicking on the + sign (red circle). This creates a new sheet to organize your data.

- 28 -
TIEE Teaching Issues and Experiments in Ecology - Volume 16, April 2020
TIEE, Volume 16 © 2020 – Justin T. Nguyen, David J. Civitello, Karena H. Nguyen, and the Ecological Society of America. Teaching Issues and Experiments in Ecology (TIEE) is a project of the Committee on Diversity and Education of the Ecological Society of America (http://tiee.esa.org).
Rename the new sheet “Number of Outbreaks” by right clicking on “Sheet1” and clicking on “Rename” from the drop-down menu.
The first task is to calculate the number of outbreaks per month. Label Column A “Months” and Column B “Number of Outbreaks”. Write the names of the months in column A (Note: In the data set, 1 refers to January, 2 to February, 3 to March, etc.). You will create a formula to calculate the number of outbreaks in any given month in Column B. The “COUNTIF” function will be used.

- 29 -
TIEE Teaching Issues and Experiments in Ecology - Volume 16, April 2020
TIEE, Volume 16 © 2020 – Justin T. Nguyen, David J. Civitello, Karena H. Nguyen, and the Ecological Society of America. Teaching Issues and Experiments in Ecology (TIEE) is a project of the Committee on Diversity and Education of the Ecological Society of America (http://tiee.esa.org).
Highlight cell B2 (shown in the red box). Insert into the box: =COUNTIF (shown in the blue box).
The function is set up as “=COUNTIF(Range, Criterion)”. ‘Range’ is the desired collection of cells. ‘Criterion’ is the specified value from that collection of cells. First, add a left parenthesis after “=COUNTIF” (shown in the red box). It should read “=COUNTIF(“.

- 30 -
TIEE Teaching Issues and Experiments in Ecology - Volume 16, April 2020
TIEE, Volume 16 © 2020 – Justin T. Nguyen, David J. Civitello, Karena H. Nguyen, and the Ecological Society of America. Teaching Issues and Experiments in Ecology (TIEE) is a project of the Committee on Diversity and Education of the Ecological Society of America (http://tiee.esa.org).
Next, we need to specify the ‘Range’ variable. For the ‘Range’, type in ‘Outbreak Data’!B:B. This specifies that the ‘Range’ is Column B from the “Outbreak Data” sheet. This can also be accomplished by highlighting Column B Cells in the “Outbreak Data” sheet while the B2 cell is highlighted.

- 31 -
TIEE Teaching Issues and Experiments in Ecology - Volume 16, April 2020
TIEE, Volume 16 © 2020 – Justin T. Nguyen, David J. Civitello, Karena H. Nguyen, and the Ecological Society of America. Teaching Issues and Experiments in Ecology (TIEE) is a project of the Committee on Diversity and Education of the Ecological Society of America (http://tiee.esa.org).
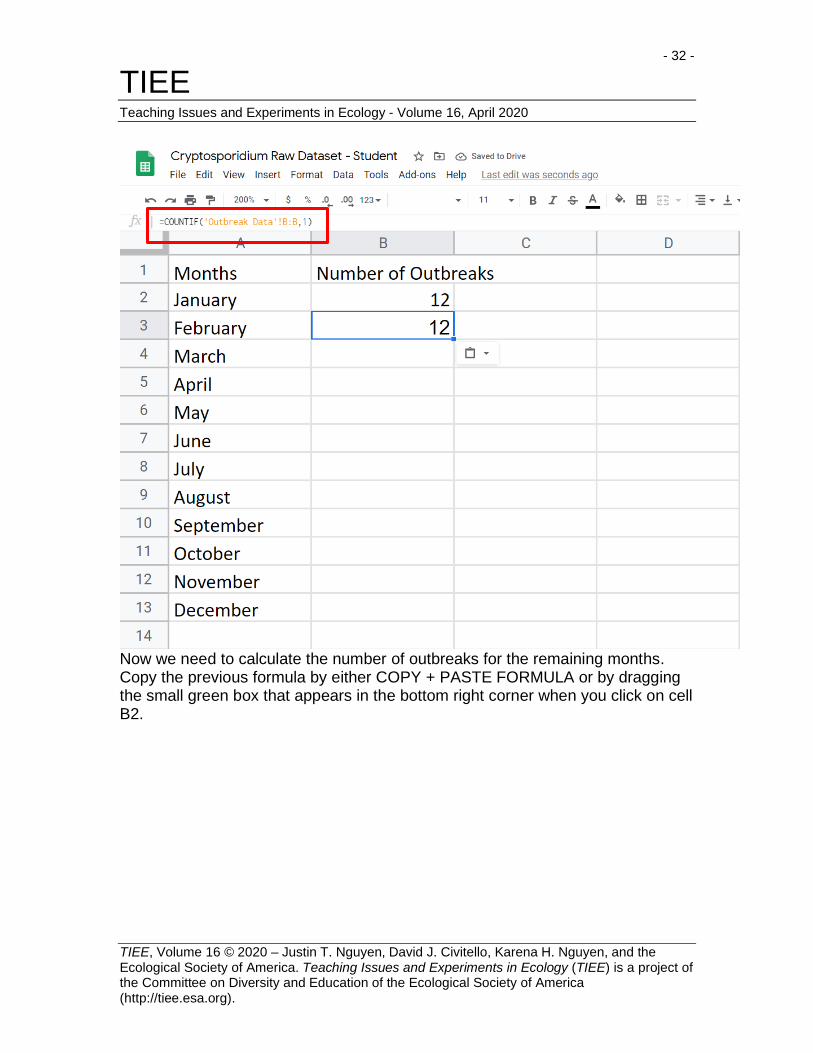
Next, we need to specify the ‘Criterion’ variable. Since we want the number of outbreaks in January, enter “1” for the criteria. The end formula should be =COUNTIF('Outbreak Data'!B:B,1). This tells us that 12 outbreaks happened in the month of January.
- 32 -
TIEE Teaching Issues and Experiments in Ecology - Volume 16, April 2020
TIEE, Volume 16 © 2020 – Justin T. Nguyen, David J. Civitello, Karena H. Nguyen, and the Ecological Society of America. Teaching Issues and Experiments in Ecology (TIEE) is a project of the Committee on Diversity and Education of the Ecological Society of America (http://tiee.esa.org).
Now we need to calculate the number of outbreaks for the remaining months. Copy the previous formula by either COPY + PASTE FORMULA or by dragging the small green box that appears in the bottom right corner when you click on cell B2.

- 33 -
TIEE Teaching Issues and Experiments in Ecology - Volume 16, April 2020
TIEE, Volume 16 © 2020 – Justin T. Nguyen, David J. Civitello, Karena H. Nguyen, and the Ecological Society of America. Teaching Issues and Experiments in Ecology (TIEE) is a project of the Committee on Diversity and Education of the Ecological Society of America (http://tiee.esa.org).
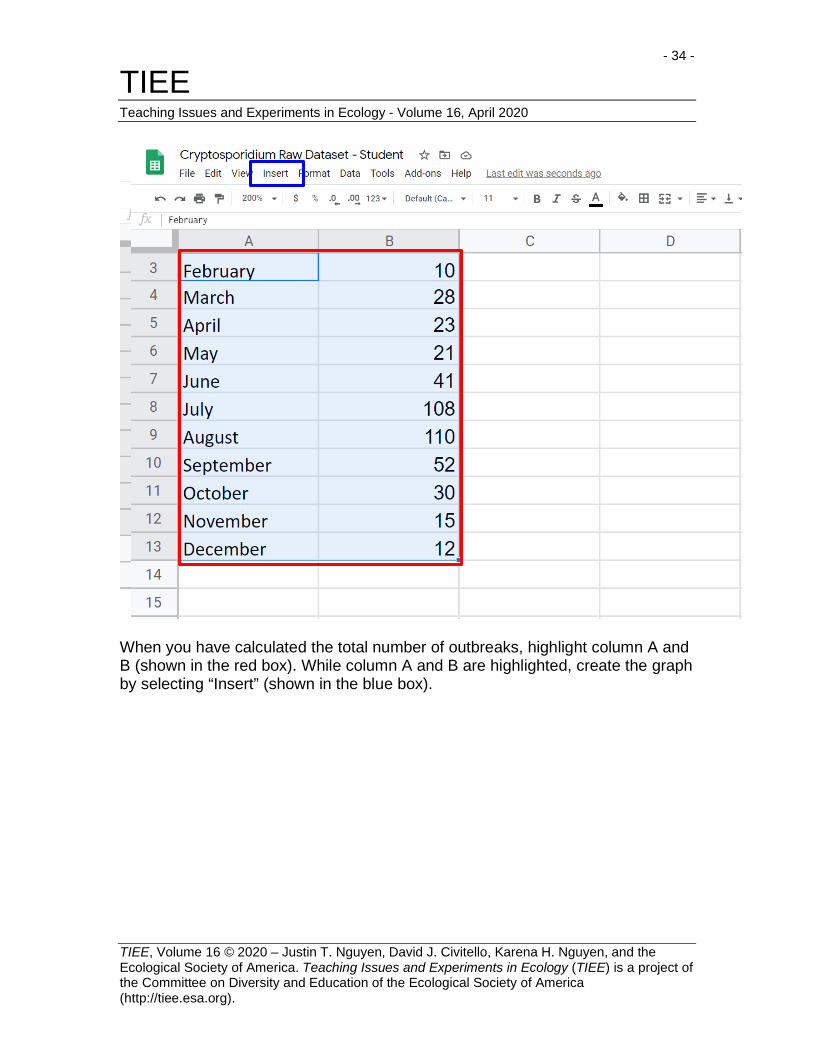
Since the formula remains the same, we need to change the ‘Criterion’ variable for the right month. For February, change the ‘Criterion’ variable to “2” to give you the number of outbreaks in February. You should see that there are 10 outbreaks that have been in February. Repeat these steps for the remaining months, e.g., change the last number to “3” in cell B4 to give you the number of outbreaks in March, change the last number to “4” in cell B5 to give you the number of outbreaks in April, etc.
- 34 -
TIEE Teaching Issues and Experiments in Ecology - Volume 16, April 2020
TIEE, Volume 16 © 2020 – Justin T. Nguyen, David J. Civitello, Karena H. Nguyen, and the Ecological Society of America. Teaching Issues and Experiments in Ecology (TIEE) is a project of the Committee on Diversity and Education of the Ecological Society of America (http://tiee.esa.org).
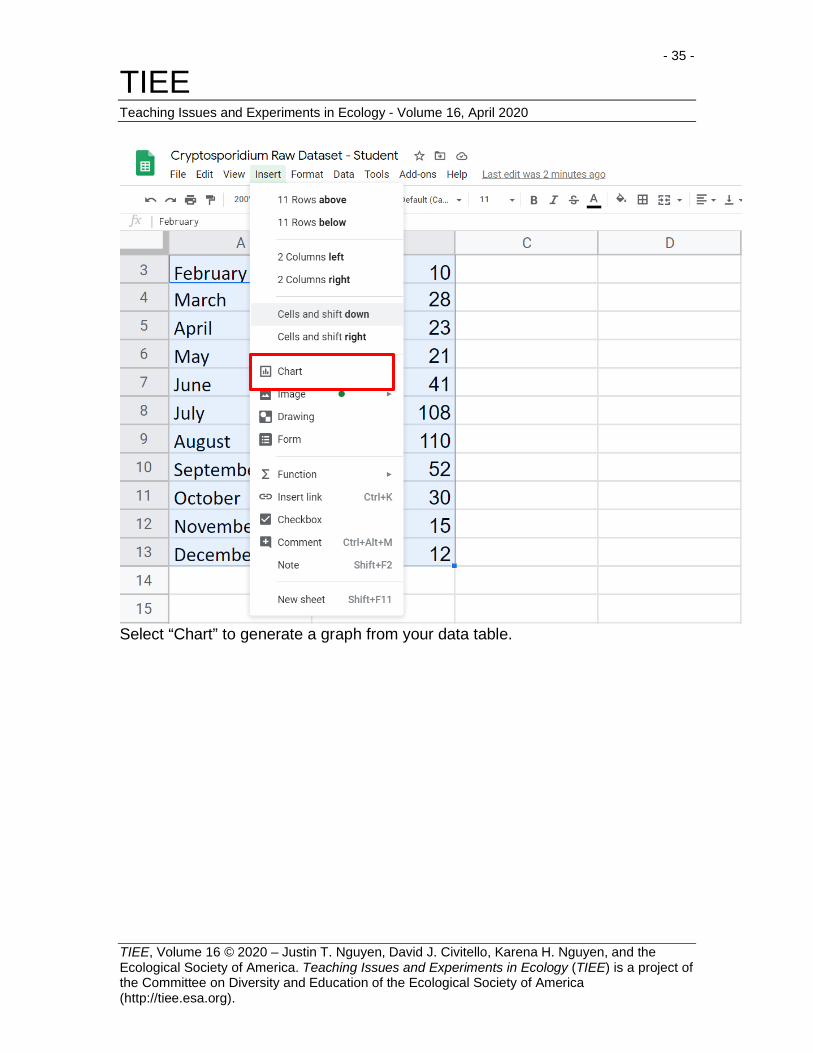
When you have calculated the total number of outbreaks, highlight column A and B (shown in the red box). While column A and B are highlighted, create the graph by selecting “Insert” (shown in the blue box).
- 35 -
TIEE Teaching Issues and Experiments in Ecology - Volume 16, April 2020
TIEE, Volume 16 © 2020 – Justin T. Nguyen, David J. Civitello, Karena H. Nguyen, and the Ecological Society of America. Teaching Issues and Experiments in Ecology (TIEE) is a project of the Committee on Diversity and Education of the Ecological Society of America (http://tiee.esa.org).
Select “Chart” to generate a graph from your data table.

- 36 -
TIEE Teaching Issues and Experiments in Ecology - Volume 16, April 2020
TIEE, Volume 16 © 2020 – Justin T. Nguyen, David J. Civitello, Karena H. Nguyen, and the Ecological Society of America. Teaching Issues and Experiments in Ecology (TIEE) is a project of the Committee on Diversity and Education of the Ecological Society of America (http://tiee.esa.org).
A chart will be generated, but it may not be the type of visualization that you want.
Double click on the chart and a menu will appear on the right side of the screen (shown in the red box). Then select “Setup” (shown in the blue box).

- 37 -
TIEE Teaching Issues and Experiments in Ecology - Volume 16, April 2020
TIEE, Volume 16 © 2020 – Justin T. Nguyen, David J. Civitello, Karena H. Nguyen, and the Ecological Society of America. Teaching Issues and Experiments in Ecology (TIEE) is a project of the Committee on Diversity and Education of the Ecological Society of America (http://tiee.esa.org).
Under chart type, select the down arrow to change your chart to other graph types.

- 38 -
TIEE Teaching Issues and Experiments in Ecology - Volume 16, April 2020
TIEE, Volume 16 © 2020 – Justin T. Nguyen, David J. Civitello, Karena H. Nguyen, and the Ecological Society of America. Teaching Issues and Experiments in Ecology (TIEE) is a project of the Committee on Diversity and Education of the Ecological Society of America (http://tiee.esa.org).
Press the “Customize” tab to change the main title, axis titles, etc.
Your figure should look something like this.
- 39 -
TIEE Teaching Issues and Experiments in Ecology - Volume 16, April 2020
TIEE, Volume 16 © 2020 – Justin T. Nguyen, David J. Civitello, Karena H. Nguyen, and the Ecological Society of America. Teaching Issues and Experiments in Ecology (TIEE) is a project of the Committee on Diversity and Education of the Ecological Society of America (http://tiee.esa.org).
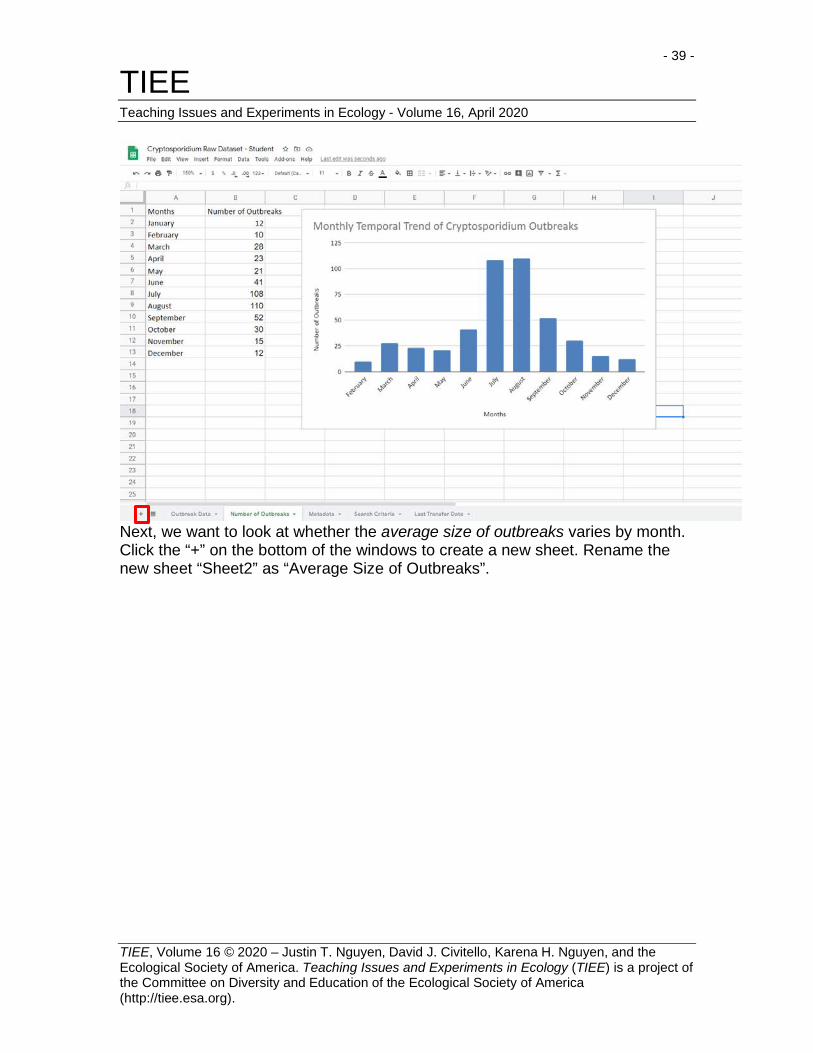
Next, we want to look at whether the average size of outbreaks varies by month. Click the “+” on the bottom of the windows to create a new sheet. Rename the new sheet “Sheet2” as “Average Size of Outbreaks”.

- 40 -
TIEE Teaching Issues and Experiments in Ecology - Volume 16, April 2020
TIEE, Volume 16 © 2020 – Justin T. Nguyen, David J. Civitello, Karena H. Nguyen, and the Ecological Society of America. Teaching Issues and Experiments in Ecology (TIEE) is a project of the Committee on Diversity and Education of the Ecological Society of America (http://tiee.esa.org).
In the new “Average Size of Outbreaks” sheet, label Column A “Month” and Column B “Avg. Size of Outbreaks”. Add the names of the months into Column A. For column B, we want to calculate the average number of illnesses per outbreak across months. This can be done by using the “AVERAGEIF” function.

- 41 -
TIEE Teaching Issues and Experiments in Ecology - Volume 16, April 2020
TIEE, Volume 16 © 2020 – Justin T. Nguyen, David J. Civitello, Karena H. Nguyen, and the Ecological Society of America. Teaching Issues and Experiments in Ecology (TIEE) is a project of the Committee on Diversity and Education of the Ecological Society of America (http://tiee.esa.org).
The “AVERAGEIF” function has three components =AVERAGEIF(Criteria_range,Criterion,Average_range). ‘Criteria_range’ refers to the variable that is being utilized to filter out data. ‘Criterion’ is the desired data points from the range. ‘Average_range’ refers to the data points being averaged.
- 42 -
TIEE Teaching Issues and Experiments in Ecology - Volume 16, April 2020
TIEE, Volume 16 © 2020 – Justin T. Nguyen, David J. Civitello, Karena H. Nguyen, and the Ecological Society of America. Teaching Issues and Experiments in Ecology (TIEE) is a project of the Committee on Diversity and Education of the Ecological Society of America (http://tiee.esa.org).
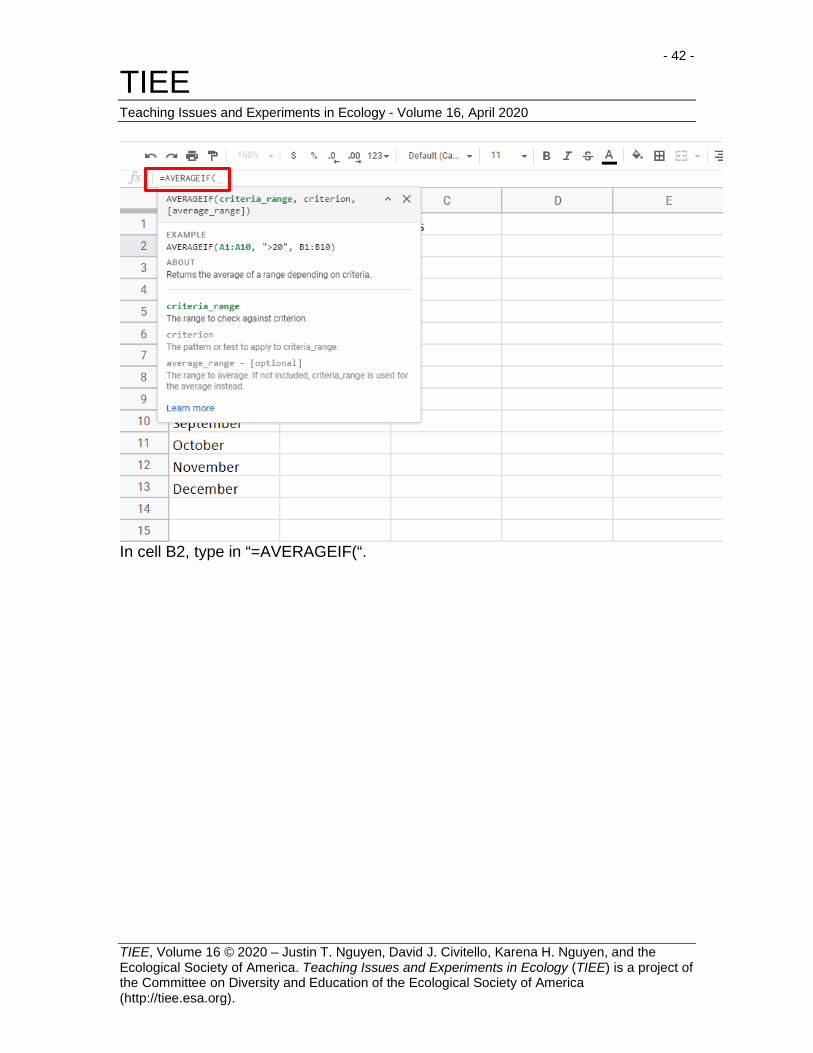
In cell B2, type in “=AVERAGEIF(“.

- 43 -
TIEE Teaching Issues and Experiments in Ecology - Volume 16, April 2020
TIEE, Volume 16 © 2020 – Justin T. Nguyen, David J. Civitello, Karena H. Nguyen, and the Ecological Society of America. Teaching Issues and Experiments in Ecology (TIEE) is a project of the Committee on Diversity and Education of the Ecological Society of America (http://tiee.esa.org).
As before, then type in ‘Outbreak Data’!B:B’. This specifies that the ‘Range’ is Column B from the “Outbreak Data” sheet. This can also be accomplished by highlighting Column B Cells in the “Outbreak Data” sheet while the B2 cell is highlighted (shown in the red box). The formula selection will work correctly when you see a small window pop up with your formula from the “Average Size of Outbreaks” sheet on the “Outbreak Data” sheet (shown in the blue box).

- 44 -
TIEE Teaching Issues and Experiments in Ecology - Volume 16, April 2020
TIEE, Volume 16 © 2020 – Justin T. Nguyen, David J. Civitello, Karena H. Nguyen, and the Ecological Society of America. Teaching Issues and Experiments in Ecology (TIEE) is a project of the Committee on Diversity and Education of the Ecological Society of America (http://tiee.esa.org).
Go back to the “Average Size of Outbreaks” sheet. The B2 cell should be displaying =AVERAGEIF('Outbreak Data'!B:B) in cell B2. #N/A is shown because the function is incomplete.

- 45 -
TIEE Teaching Issues and Experiments in Ecology - Volume 16, April 2020
TIEE, Volume 16 © 2020 – Justin T. Nguyen, David J. Civitello, Karena H. Nguyen, and the Ecological Society of America. Teaching Issues and Experiments in Ecology (TIEE) is a project of the Committee on Diversity and Education of the Ecological Society of America (http://tiee.esa.org).
Now we need to specify the ‘Criterion’ variable, which is the month “1”. This can be done by adding “,1” to the formula. It should now be “=AVERAGEIF('Outbreak Data'!B:B,1). Even though a value shows up in cell B2, we need to specify one last variable.

- 46 -
TIEE Teaching Issues and Experiments in Ecology - Volume 16, April 2020
TIEE, Volume 16 © 2020 – Justin T. Nguyen, David J. Civitello, Karena H. Nguyen, and the Ecological Society of America. Teaching Issues and Experiments in Ecology (TIEE) is a project of the Committee on Diversity and Education of the Ecological Society of America (http://tiee.esa.org).
Lastly, add a comma after the “1” in the formula to add the ‘average_range’ variable.

- 47 -
TIEE Teaching Issues and Experiments in Ecology - Volume 16, April 2020
TIEE, Volume 16 © 2020 – Justin T. Nguyen, David J. Civitello, Karena H. Nguyen, and the Ecological Society of America. Teaching Issues and Experiments in Ecology (TIEE) is a project of the Committee on Diversity and Education of the Ecological Society of America (http://tiee.esa.org).
Return to the “Outbreak Data” sheet, and highlight the “Illness” column of the data set (shown in the red box). The pop-up window should appear as before with the finished formula (shown in the blue box).

- 48 -
TIEE Teaching Issues and Experiments in Ecology - Volume 16, April 2020
TIEE, Volume 16 © 2020 – Justin T. Nguyen, David J. Civitello, Karena H. Nguyen, and the Ecological Society of America. Teaching Issues and Experiments in Ecology (TIEE) is a project of the Committee on Diversity and Education of the Ecological Society of America (http://tiee.esa.org).
Go back to the “Average Size of Outbreaks” sheet, and check cell B2. It should now read “=AVERAGEIF('Outbreak Data'!B:B,1,'Outbreak Data'!I:I)”. For this dataset, there were on average, 14.75 illnesses per outbreak in January.

- 49 -
TIEE Teaching Issues and Experiments in Ecology - Volume 16, April 2020
TIEE, Volume 16 © 2020 – Justin T. Nguyen, David J. Civitello, Karena H. Nguyen, and the Ecological Society of America. Teaching Issues and Experiments in Ecology (TIEE) is a project of the Committee on Diversity and Education of the Ecological Society of America (http://tiee.esa.org).
Now, copy the previous formula to the remaining cells in your new sheet by either COPY + PASTE FORMULA or by dragging the small green box that appears in the bottom right corner when you click on cell B2. The same formula will appear for the other boxes. Change the ‘Criterion’ variable to “2” for February. For this data set, there were 9.7 illnesses per outbreak for February. Repeat this process for the remaining months (changing the ‘Criterion’ variable only).

- 50 -
TIEE Teaching Issues and Experiments in Ecology - Volume 16, April 2020
TIEE, Volume 16 © 2020 – Justin T. Nguyen, David J. Civitello, Karena H. Nguyen, and the Ecological Society of America. Teaching Issues and Experiments in Ecology (TIEE) is a project of the Committee on Diversity and Education of the Ecological Society of America (http://tiee.esa.org).
Create a graph as described previously, and add x- and y-axes and a figure title.

- 51 -
TIEE Teaching Issues and Experiments in Ecology - Volume 16, April 2020
TIEE, Volume 16 © 2020 – Justin T. Nguyen, David J. Civitello, Karena H. Nguyen, and the Ecological Society of America. Teaching Issues and Experiments in Ecology (TIEE) is a project of the Committee on Diversity and Education of the Ecological Society of America (http://tiee.esa.org).
What about the total number of cases of illness in a given month? Open a new sheet and rename it as “Total Number of Illnesses”. Label Column A as “Month” and label Column B as “Total Number of Illnesses”. For this calculation, we want to sum the total number of illnesses reported in each month by using the formula “SUMIF”.

- 52 -
TIEE Teaching Issues and Experiments in Ecology - Volume 16, April 2020
TIEE, Volume 16 © 2020 – Justin T. Nguyen, David J. Civitello, Karena H. Nguyen, and the Ecological Society of America. Teaching Issues and Experiments in Ecology (TIEE) is a project of the Committee on Diversity and Education of the Ecological Society of America (http://tiee.esa.org).
Type “=SUMIF(“ into cell B2. The “SUMIF” formula has three components =SUMIF(Range, Criterion, Sum_range). ‘Range’ refers to the variable that is being utilized to filter out data. ‘Criterion’ is the desired data points from the range. ‘Sum_range’ refers to the data points being summed.

- 53 -
TIEE Teaching Issues and Experiments in Ecology - Volume 16, April 2020
TIEE, Volume 16 © 2020 – Justin T. Nguyen, David J. Civitello, Karena H. Nguyen, and the Ecological Society of America. Teaching Issues and Experiments in Ecology (TIEE) is a project of the Committee on Diversity and Education of the Ecological Society of America (http://tiee.esa.org).
Select cell B2 and as before, select column B (“Month”) in the ‘Outbreak Data’ sheet. For ‘Criterion’ type “1” for January. For ‘Sum_range’ highlight the column labeled “Illnesses” in the ‘Outbreak Data’ sheet. The end formula for B2 should be “=SUMIF('Outbreak Data'!B:B,2,'Outbreak Data'!I:I)”. This formula is exactly the same as the “AVERAGEIF” function except you are replacing “AVERAGEIF” with “SUMIF”. You should get 177 total illnesses for January.

- 54 -
TIEE Teaching Issues and Experiments in Ecology - Volume 16, April 2020
TIEE, Volume 16 © 2020 – Justin T. Nguyen, David J. Civitello, Karena H. Nguyen, and the Ecological Society of America. Teaching Issues and Experiments in Ecology (TIEE) is a project of the Committee on Diversity and Education of the Ecological Society of America (http://tiee.esa.org).
To insert the formula for all of the other months, COPY + PASTE the FORMULA or drag the small green box that appears in the bottom right corner when you click on cell B2. Change the ‘Criterion’ variable to the corresponding month (“2” for February, “3” for March, etc.).
- 55 -
TIEE Teaching Issues and Experiments in Ecology - Volume 16, April 2020
TIEE, Volume 16 © 2020 – Justin T. Nguyen, David J. Civitello, Karena H. Nguyen, and the Ecological Society of America. Teaching Issues and Experiments in Ecology (TIEE) is a project of the Committee on Diversity and Education of the Ecological Society of America (http://tiee.esa.org).
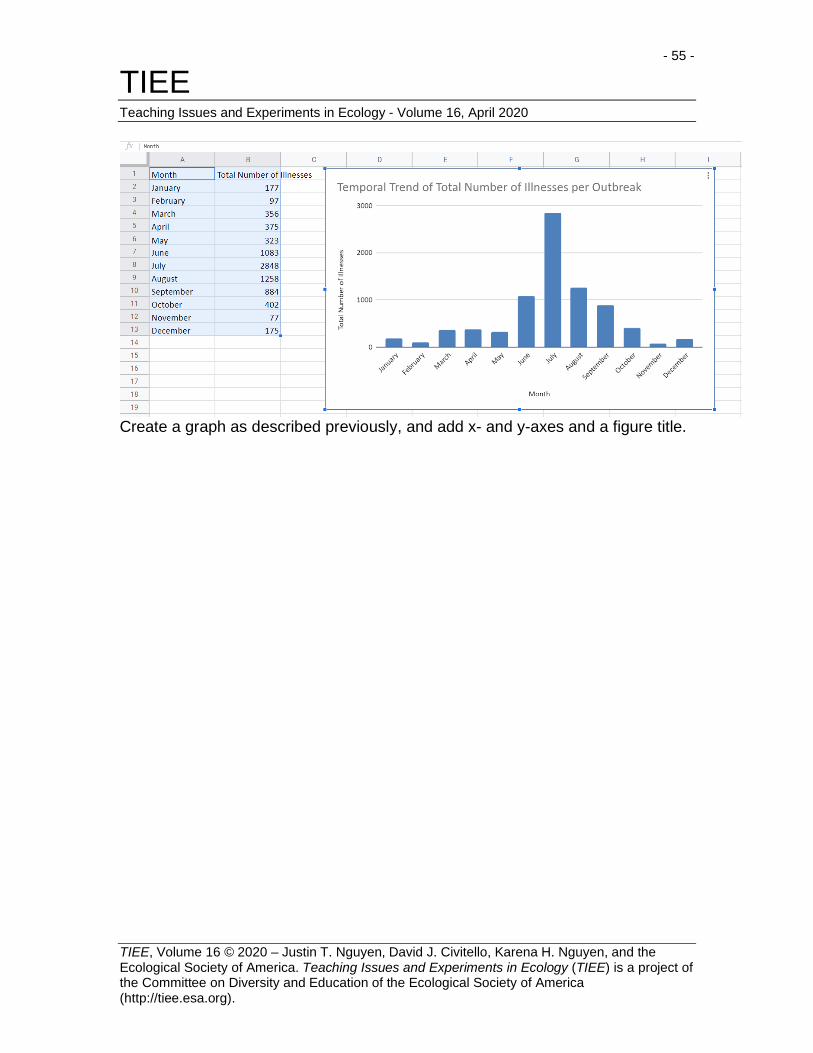
Create a graph as described previously, and add x- and y-axes and a figure title.

- 56 -
TIEE Teaching Issues and Experiments in Ecology - Volume 16, April 2020
TIEE, Volume 16 © 2020 – Justin T. Nguyen, David J. Civitello, Karena H. Nguyen, and the Ecological Society of America. Teaching Issues and Experiments in Ecology (TIEE) is a project of the Committee on Diversity and Education of the Ecological Society of America (http://tiee.esa.org).
Detailed instructions for visualizing the data sets in Google Sheets with Pivot Tables
We can also use Pivot Tables to create the summary tables. First, highlight the entire dataset by typing “CTRL + A”. This confirms that the pivot table will use all the data.
With the data highlighted, select “Data” and a drop-down menu will appear. Select “Pivot Table” from the menu (shown in the red box).

- 57 -
TIEE Teaching Issues and Experiments in Ecology - Volume 16, April 2020
TIEE, Volume 16 © 2020 – Justin T. Nguyen, David J. Civitello, Karena H. Nguyen, and the Ecological Society of America. Teaching Issues and Experiments in Ecology (TIEE) is a project of the Committee on Diversity and Education of the Ecological Society of America (http://tiee.esa.org).
Select the “Create” button that appears on the screen (shown in the red box).
A new sheet will appear in your data set labeled “Pivot Table 1” with a blank table on the sheet.

- 58 -
TIEE Teaching Issues and Experiments in Ecology - Volume 16, April 2020
TIEE, Volume 16 © 2020 – Justin T. Nguyen, David J. Civitello, Karena H. Nguyen, and the Ecological Society of America. Teaching Issues and Experiments in Ecology (TIEE) is a project of the Committee on Diversity and Education of the Ecological Society of America (http://tiee.esa.org).
A window will appear on the right side of the screen with “Pivot table editor”. We want to adjust the ‘Rows’ and ‘Values’ to complete the calculations.
To calculate the number of outbreaks per month, designate “Month” as the ‘Rows’ variable, “Month” as the ‘Values’ variable, and specify “Count” as the desired function. Figures can be created from these tables as described previously.

- 59 -
TIEE Teaching Issues and Experiments in Ecology - Volume 16, April 2020
TIEE, Volume 16 © 2020 – Justin T. Nguyen, David J. Civitello, Karena H. Nguyen, and the Ecological Society of America. Teaching Issues and Experiments in Ecology (TIEE) is a project of the Committee on Diversity and Education of the Ecological Society of America (http://tiee.esa.org).
To calculate how the average size of outbreaks varies by month, designate “Month” as the ‘Rows’ variable, “Illnesses” as the ‘Values’ variable, and specify “Average” as the desired function. Figures can be created from these tables as described previously.
To calculate the total number of cases of illness in a given month, designate “Month” as the ‘Rows’ variable, “Illnesses” as the ‘Values’ variable, and specify “Sum” as the desired function. Figures can be created from these tables as described previously.

- 60 -
TIEE Teaching Issues and Experiments in Ecology - Volume 16, April 2020
TIEE, Volume 16 © 2020 – Justin T. Nguyen, David J. Civitello, Karena H. Nguyen, and the Ecological Society of America. Teaching Issues and Experiments in Ecology (TIEE) is a project of the Committee on Diversity and Education of the Ecological Society of America (http://tiee.esa.org).
COPYRIGHT STATEMENT The Ecological Society of America (ESA) holds the copyright for TIEE Volume 16, and the authors retain the copyright for the content of individual contributions (although some text, figures, and data sets may bear further copyright notice). No part of this publication may be reproduced, stored in a retrieval system, or transmitted, in any form or by any means, electronic, mechanical, photocopying, recording, or otherwise, without the prior written permission of the copyright owner. Use solely at one's own institution with no intent for profit is excluded from the preceding copyright restriction, unless otherwise noted. Proper credit to this publication must be included in your lecture or laboratory course materials (print, electronic, or other means of reproduction) for each use.
To reiterate, you are welcome to download some or all of the material posted at this site for your use in your course(s), which does not include commercial uses for profit. Also, please be aware of the legal restrictions on copyright use for published materials posted at this site. We have obtained permission to use all copyrighted materials, data, figures, tables, images, etc. posted at this site solely for the uses described at TIEE site.
GENERIC DISCLAIMER Adult supervision is recommended when performing this lab activity. We also recommend that common sense and proper safety precautions be followed by all participants. No responsibility is implied or taken by the contributing author, the editors of this Volume, nor anyone associated with maintaining the TIEE web site, nor by their academic employers, nor by the Ecological Society of America for anyone who sustains injuries as a result of using the materials or ideas, or performing the procedures put forth at the TIEE web site, or in any printed materials that derive therefrom.