issues in estimating the cost and effectiveness of …€¦ · order of cost to produce steps of...
TRANSCRIPT

4/2010 Jaccard-Simon Fraser University 1
Mark Jaccard
School of Resource and Environmental ManagementSimon Fraser University
Vancouver
April, 2010FEEM, Venice
emrgemrgenergy and materials research group
emrgemrgenergy and materials research group
Issues in Estimating the Cost and Effectiveness of Climate Policies

4/2010 Jaccard-Simon Fraser University 2
emrgemrgenergy and materials research group
emrgemrgenergy and materials research group Presentation overview
Estimating the cost of energy efficiency: revisiting old debates.
Hybrid models for simulating energy-environment policies and their implications for estimating energy efficiency potential.
Estimating the likely effectiveness and contribution of energy efficiency policies – some empirical case studies.

4/2010 Jaccard-Simon Fraser University 3
emrgemrgenergy and materials research group
emrgemrgenergy and materials research group
Calculating energy conservation cost curves
Compare a conventional technology with a higher efficiency alternative providing the same service.
Divide extra capital cost of efficient technology by its discounted energy savings = life-cycle-cost of conservation ($/kwh).
Graph estimated total energy savings (each service) in ascendingorder of cost to produce steps of conservation cost curve.
Initial steps could have negative costs; all steps costing less than utility rates are privately profitable; all steps costing less than new energy supply are socially profitable.

4/2010 Jaccard-Simon Fraser University 4
emrgemrgenergy and materials research group
emrgemrgenergy and materials research group
electricity saved
$ / kWh
efficient fridges
delivered cost from newgeneration
efficient motorsefficient light bulbs
Energy conservation cost curve
0
efficientbuilding shell
electricity rates

4/2010 Jaccard-Simon Fraser University 5
emrgemrgenergy and materials research group
emrgemrgenergy and materials research group
Calculating GHG abatement cost curves
Compare a conventional technology with a lower emission alternative for the same service.
Calculate present value of capital and operating costs of both technologies.
Take the difference in these costs and divide by the difference between emissions = cost of abatement ($/tonne of CO2).
Graph estimated total emissions reductions (each service) in ascending order of cost to produce abatement cost curve.
Initial steps could have negative costs, meaning profits + GHG abatement (“win-win”, “no regrets”)

4/2010 Jaccard-Simon Fraser University 6
emrgemrgenergy and materials research group
emrgemrgenergy and materials research group
GHG abatement cost curve
energy efficiency dominant

4/2010 Jaccard-Simon Fraser University 7
emrgemrgenergy and materials research group
emrgemrgenergy and materials research group
Issues with the use of cost curves
Conservation cost curves were popular 30 years ago and GHG abatement cost curves 20 years ago.
They fell out of favor with most energy-economy modelers, who argued these curves mislead about costs and are unhelpful with policy.
Yet these cost curves have recently re-emerged in GHG abatement policy discussions, rekindling old debates.
“Déjà vu all over again.”

4/2010 Jaccard-Simon Fraser University 8
electricity saved
$ / kWh
efficient fridges
Delivered cost fromnew generation
efficient motorsefficient light bulbs
0
efficientbuilding shell
Assumed independent
emrgemrgenergy and materials research group
emrgemrgenergy and materials research group
Issue #1Actions assumed independent
Construction of cost curves implies that each action is completely independent of every other action. (extreme partial equilibrium analysis)
(1) demand-side, (2) supply-demand including price, (3) micro-macro rebounds

4/2010 Jaccard-Simon Fraser University 9
emrgemrgenergy and materials research group
emrgemrgenergy and materials research group
Issue #2Market conditions assumed
homogeneous
Market evidence shows that acquisition of a more efficient or lower emission technology will cost X for the first 20% of the market, X+Y for the next 20%, X+Y+Z for the next 20%, and so on.
Reasons include:– different age of existing capital stock and hence cost of replacement at a
particular time
– local differences in transaction costs – learning, acquisition, installation and operation
4/2010 Jaccard-Simon Fraser University 10
emrgemrgenergy and materials research group
emrgemrgenergy and materials research group
Issue #3Technologies assumed perfect
substitutes
Quality of service assumed identical.
But some technologies provide (or are perceived to provide) lower quality service – a frequent concern with new technologies (e.g., efficient lightbulbs, transit vs personal vehicles)
Risk assumed identical.
But (1) long payback investments usually higher cost risk, and (2) new technologies usually higher failure risk.
Incorporating this risk usually causes higher “expected cost” for high efficiency / low emissions technologies.

4/2010 Jaccard-Simon Fraser University 11
emrgemrgenergy and materials research group
emrgemrgenergy and materials research group
electricity saved
$ / kWh
Correction for expected cost
0
ordering could also change
expected cost higher

4/2010 Jaccard-Simon Fraser University 12
Modeler response to first three “issues” with cost curves
emrgemrgenergy and materials research group
emrgemrgenergy and materials research group
Construct integrated models:– energy supply with energy demand– energy system with rest of economy– economy with natural system (integrated assessment models)
Track vintages of equipment stocks and portray heterogeneous character of market response
Estimate model behavioral parameters that explicitly or implicitly incorporate:
– non-financial values (preferences related to technology attributes)– perceived and real differences in risk
(parameters could be “price elasticities” or specific “behavioral parameters” in a model that simulates technology choice)

4/2010 Jaccard-Simon Fraser University 13
emrgemrgenergy and materials research group
emrgemrgenergy and materials research group
Energy-economy models: Estimating marginal abatement
cost (MAC) curves
Using elasticities or other behavioral parameters, energy-economy models simulate responses of firms and households to changing energy prices due to market developments or emissions pricing policies.
Graphing the results from raising the price of CO2 produces a marginal abatement cost (MAC) curve. This differs from conservation or abatement cost curves because:
– Each point on curve has simultaneous actions occurring (equilibrium effects)
– A particular action (more efficient fridges) occurs continuously along the curve, if model includes capital stock vintages and market heterogeneity.
– If model incorporates intangible costs and responsiveness to pricing policy (a simulation model), MAC curve likely to be much higher.

4/2010 Jaccard-Simon Fraser University 14
Energy-economy model:sample MAC curve
emrgemrgenergy and materials research group
emrgemrgenergy and materials research group
40%20%
50
100
150
200
GHG abatement
$ / tonneCO2e
multiple locationshigh efficiency fridge(heterogeneous market)
simultaneous actions at one point (integrated model), including equilibrium feedbacks
includes transactions costs, preferences and risks throughout curve

4/2010 Jaccard-Simon Fraser University 15
emrgemrgenergy and materials research group
emrgemrgenergy and materials research group
McKinsey study vs. CIMS hybrid model MAC: US - 2030
$/tCO2
0
-100
100
200
300
1 2 3 4Gigatonnes CO2 abated
McKinsey abatement cost curve
CIMS marginal abatement cost curve

4/2010 Jaccard-Simon Fraser University 16
emrgemrgenergy and materials research group
emrgemrgenergy and materials research group
CIMS: A technology choice simulation model – “hybrid”
Model keeps explicit track of capital stocks of different types of technologies in terms of efficiency and emissions level.
Technology choices driven by three uncertain parameters – time preference, degree of market heterogeneity, technology specific intangible costs. Parameters estimated using revealed and stated preference research.(see next slide)
Model has other dynamics – learning curves, neighbor effect, rebound effect – which also require parameter estimation (published studies)
Technology simulation model provides elasticity of substitution values for a CGE model (global model, US model, Canada model). Price shockingof CIMS produces “pseudo data” for estimating ESUBs for the CGE.

4/2010 Jaccard-Simon Fraser University 17
Three key behavioural parameters:– Discount rate (r) – reflecting time preference with respect to
technology acquisition decisions– Intangible cost (i) – preferences associated with technology
quality attributes, including differential risk– Market heterogeneity (v) - different consumers and businesses
face different costs, have different perceptions and preferences.
CIMS: Technology choice algorithm
MS j =CC j ⋅CRFj +OC j + EC j + i j( )−v
CCk ⋅CRFk +OCk + ECk + ik( )−v∑CRFj =
r1− (1+ r)−n j
LCC
emrgemrgenergy and materials research group
emrgemrgenergy and materials research group

4/2010 Jaccard-Simon Fraser University 18
Discrete choice models to estimate r, i and v in CIMS
emrgemrgenergy and materials research group
emrgemrgenergy and materials research group
AC
CCrββ
=AC
jji β
β=
v = ordinary least squares to estimate value for which predictions from CIMS are consistent with those from the DCM model. Depends on size of error terms relative to values of beta parameters.
jECOCCCjj eECOCCCU ++++= ββββStandard discrete choice model for technology choice surveys
Survey / Observation
EmpiricalModel (DCM)
CIMS’ r,i and v

4/2010 Jaccard-Simon Fraser University 19
emrgemrgenergy and materials research group
emrgemrgenergy and materials research group
Empirically estimated behavioral parameters – uncertainty
propagated to model outputs
0%
5%
10%
15%
20%
25%
30%
35%
40%
2000 2005 2010 2015 2020 2025 2030 2035 2040
Year
Cog
ener
atio
n M
arke
t Sha
re In
crea
se
over
Bus
ines
s as
Usu
al
95% C.I.MLE estimate

4/2010 Jaccard-Simon Fraser University 20
emrgemrgenergy and materials research group
emrgemrgenergy and materials research group
150120 18030 60 90
50
100
150
200
GHG reduction (MT CO2e)
$ / tonne CO2e
CIMS
MARKAL
Simulation vs optimization, CIMS vs MARKAL: Canada-Kyoto
target, 2000-2010

4/2010 Jaccard-Simon Fraser University 21
emrgemrgenergy and materials research group
emrgemrgenergy and materials research group
Issue #4Cost curve policy implications
Studies producing conservation and abatement cost curves often silent on policy.
But, implicit cost message:
“It is cheap to achieve substantial reductions of energy use and/or emissions.”
Implicit policy implication:
“With conservation so cheap, little need for emissions pricing and regulations. Just focus on information and subsidies (including offsets) to drive energy conservation.”

4/2010 Jaccard-Simon Fraser University 22
1950s 1960s 1970s 1990s1980s 2000s
**
*
*
* *
**
*
*
**
*
* **
*
*
*
*
*
*
*
***
*
*
*
*
* *
*
*
Kwh/m3
average fridge efficiency
*
**
*** *
emrgemrgenergy and materials research group
emrgemrgenergy and materials research group
Policy challenges: efficiency subsidies and free-riders
must accelerate efficiency trend

4/2010 Jaccard-Simon Fraser University 23
emrgemrgenergy and materials research group
emrgemrgenergy and materials research group
Estimated free-ridership rates: quasi-experiments
Technology Source Free-ridershipFurnace Malm (1996) 89%Refrigerator Train and Atherton (1995) 36%Air conditioner Train and Atherton (1995) 66%Building shell retrofit Grosche and Vance (2009) 50%Electric utility DSM programs – various
Loughran and Kulick(2004)
50-90%
Hybrid vehicles Chandra et al. (2009) 74%

4/2010 Jaccard-Simon Fraser University 24
emrgemrgenergy and materials research group
emrgemrgenergy and materials research group
Rivers and Jaccard, 2009
Estimated effectiveness of efficiency subsidies in Canada

4/2010 Jaccard-Simon Fraser University 25
Net effect of subsidies on energy use
Free riders – evidence suggests 25-75%
Direct rebound – evidence suggests 5-20%
Productivity rebound – uncertain, but initial evidence suggests high rebound potential when policy is efficiency subsidies (new devices, new energy services)
emrgemrgenergy and materials research group
emrgemrgenergy and materials research group

4/2010 Jaccard-Simon Fraser University 26
emrgemrgenergy and materials research group
emrgemrgenergy and materials research group
US data for “other” household devices - number
Steve Groves, SFU – 2009

4/2010 Jaccard-Simon Fraser University 27
emrgemrgenergy and materials research group
emrgemrgenergy and materials research group
US data for “other” household devices – electricity consumption
Steve Groves, SFU – 2009

4/2010 Jaccard-Simon Fraser University 28
emrgemrgenergy and materials research group
emrgemrgenergy and materials research group
Bottom-up estimate of efficiency’s contribution: Canada in 2050

4/2010 Jaccard-Simon Fraser University 29
emrgemrgenergy and materials research group
emrgemrgenergy and materials research group
Hybrid estimate of efficiency’s contribution: Canada in 2050

4/2010 Jaccard-Simon Fraser University 30
emrgemrgenergy and materials research group
emrgemrgenergy and materials research group
Incremental contribution of non-price policies: Canada 2050

4/2010 Jaccard-Simon Fraser University 31
0
1000
2000
3000
4000
5000
6000
7000
2005 2010 2015 2020 2025 2030 2035 2040 2045 2050
Reference Case
Carbon Tax
Energy Tax
Standards
Subsidies
Standards and Tax
emrgemrgenergy and materials research group
emrgemrgenergy and materials research group
CIMS EMF25: US CO2e Emissions Incl. Elec. Gen.
(Million Tons)

4/2010 Jaccard-Simon Fraser University 32
0
10
20
30
40
50
60
70
80
90
100
2005 2010 2015 2020 2025 2030 2035 2040 2045 2050
Reference Case
Carbon Tax
Energy Tax
Standards
Subsidies
Standards and Tax
emrgemrgenergy and materials research group
emrgemrgenergy and materials research group
CIMS EMF25: US Energy Consumption Excl. Elec.
Gen. (QBTU)
4/2010 Jaccard-Simon Fraser University 33
emrgemrgenergy and materials research group
emrgemrgenergy and materials research group
Extra slides

4/2010 Jaccard-Simon Fraser University 34
emrgemrgenergy and materials research group
emrgemrgenergy and materials research group
Views on profitable efficiency
Technologist’s profitable efficiency
Greater technical energy efficiency
If environmentalexternalities
were internalized?
Baseline efficiency trend
Economist’s profitable efficiency
Passage of time
Address real market failures:•Information as public good,•Average cost pricing of utilities
Economist’s critique:•Technologies differ with respect to risk,•Technologies differ with respect to quality
Technologist’s explanation:•Market barriers: financing, info,split-incentive, capacity

4/2010 Jaccard-Simon Fraser University 35
Parameter Implications -Market Heterogeneity
Relative Price of Tech A to Tech B
0
0.1
0.2
0.3
0.4
0.5
0.6
0.7
0.8
0.9
1
0 0.25 0.5 0.75 1 1.25
Mar
ket S
hare
of T
ech
A
Power Parameter, v100 5020 106 31 0.5
Point where Tech A is 15% cheaper than Tech B
Source: Nyboer, 1997
4/2010 Jaccard-Simon Fraser University 36
emrgemrgenergy and materials research group
emrgemrgenergy and materials research group
Carbon offsets:another form of subsidy
Definition of offset – a “subsidy,” usually from one private entity to another, to help fund an action that reduces emissions from what they otherwise would be (business as usual)
Voluntary offset – individuals and corporations can voluntarily acquire offsets in order to reduce their net emissions
Regulated entity offset – a cap and trade system could allow a regulated entity to meet some or all of its emission reductions by acquiring offsets from unregulated entities (Alberta, Canada, CDM of the Kyoto Protocol)
Governments require, and offsetter companies promise, that offsets are “verified to be additional and permanent”

4/2010 Jaccard-Simon Fraser University 37
emrgemrgenergy and materials research group
emrgemrgenergy and materials research group Range of carbon offsets
1. Improve energy efficiency so that less fossil fuels are combusted and less GHG emitted
2. Subsidize renewable energy to reduce the carbon that otherwise would have been emitted
3. Changing agricultural practices, such as tillage, manure handling and livestock feed.
4. Planting trees to increase carbon in biomass on the earth’s surface
5. Capture or prevent a GHG emission (land fill gases, pipeline methane leaks, carbon capture and storage)

4/2010 Jaccard-Simon Fraser University 38
emrgemrgenergy and materials research group
emrgemrgenergy and materials research group
Offsets via the Clean Development Mechanism
Warr and Victor, 2008
4/2010 Jaccard-Simon Fraser University 39
emrgemrgenergy and materials research group
emrgemrgenergy and materials research group
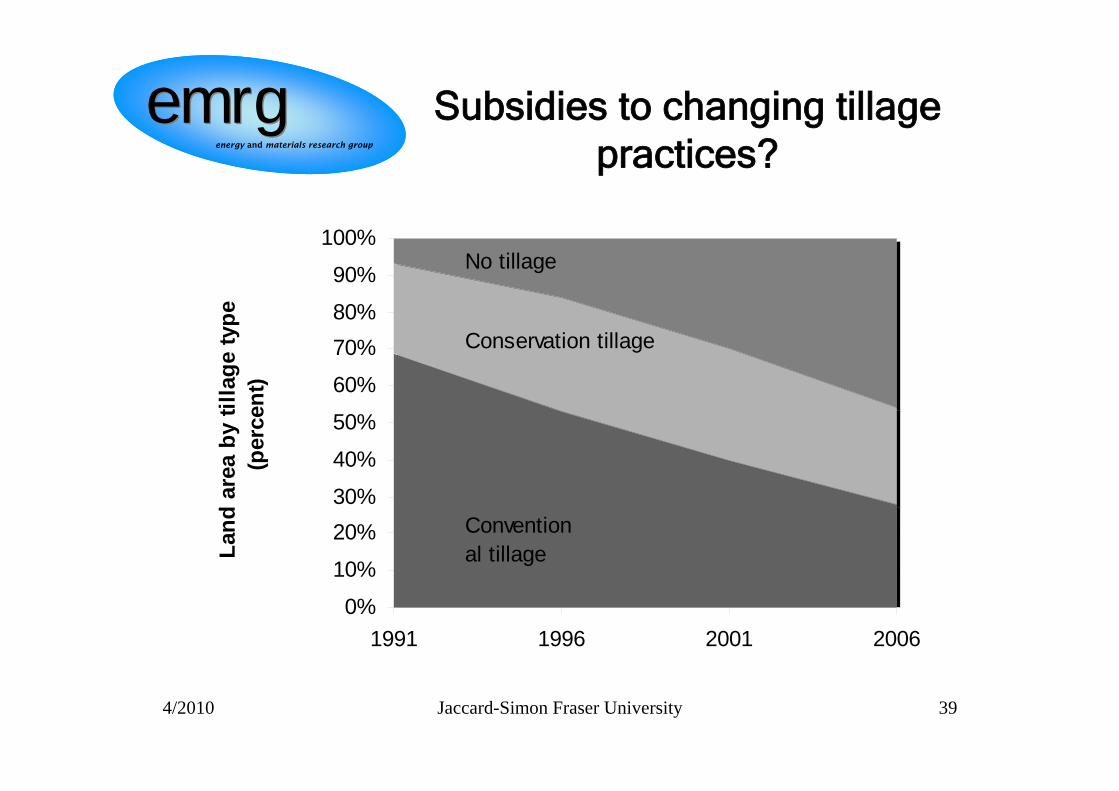
Subsidies to changing tillage practices?
0%
10%
20%30%
40%
50%
60%
70%80%
90%
100%
1991 1996 2001 2006
Land
are
a by
tilla
ge ty
pe
(per
cent
)
Conventional tillage
Conservation tillage
No tillage

4/2010 Jaccard-Simon Fraser University 40
emrgemrgenergy and materials research group
emrgemrgenergy and materials research group Afforestation offsets
Subsidize x percentage of landowners to plant trees on marginal agricultural land.
Offsetter companies verify that the trees are planted and the land remains forested.
Over time this policy should raise the value of agricultural land relative to forested land.
This would cause some forest owners with land of moderate agricultural value to convert it to agriculture.
This is leakage – economists call it a general equilibrium effect.