issues in local government reform in indiaboxjenk/locgov5.pdf2 issues in local government reform in...
TRANSCRIPT

Issues in local government reform in India.
Nirvikar SinghDepartment of Economics
University of CaliforniaSanta Cruz
June 1997revised November 1997
Abstract
This paper reviews the status of rural and urban local governments in India. Thefocus is on the recent constitutional reforms that strengthen local government, (includingsubsequent supporting legislation), and the implications for changing local government toachieve more effective delivery of services to constituent populations. Particular attentionis paid to finances and revenues, since enhancing local government fiscal resources iscrucial for the success of reform in this dimension . An overview of the financial situationand resources of this level of government is provided, plus an economic analysis of thepolitical, managerial and other institutional constraints on effective local governmentservice provision.
This is a substantially revised version of a paper prepared for a World Bank workshop on decentralization.I am indebted to Shanta Devarajan and David Wildasin for encouragement. Gunnar Eskeland providedmany suggestions, ideas and conversations that helped clarify my thoughts and guide my analysis. He andM. Govinda Rao both read the June 1997 draft very carefully, and made numerous comments that helpedto substantially improve the paper. Pritam Singh Kohli read an earlier draft, and provided me with manyuseful suggestions. Some of the revision was undertaken while I was a Visiting Fellow at the Australia-South Asia Research Centre at Australian National University: I am most grateful for their hospitality.Of course, I alone am responsible for remaining errors and shortcomings. In particular, neither the WorldBank nor any affiliated organization is responsible for the views expressed here.

2
Issues in local government reform in India.
Nirvikar SinghDepartment of EconomicsUniversity of California, Santa CruzNovember 1997
I. INTRODUCTION
India has over 250,000 local governments, but their expenditure as a share ofGNP is only about 2 %1. These figures include a great deal of heterogeneity, from themunicipal corporations of the largest metropolitan cities to the smallest villagepanchayats. In the case of rural governments, they include up to three tiers ofgovernment below the level of state government. This paper aims to encompass thisdiversity of local governments, and identify some common features that affect them all,while still recognizing the diversity of situations. In particular, a common analyticalframework that examines functional responsibilities, revenue sources, and institutions andincentives is applied to the overall analysis of local government in India.
Recent legislative changes, that is, the 73rd and 74th amendments to the Indianconstitution, and following legislation by the states, have the potential to significantly alterthe role and relative importance of local governments in India. This paper also seeks toexamine the reforms signaled or enabled by this legislation, and to highlight some of thepractical difficulties involved in changing local government to achieve more effectivedelivery of services to constituent populations. Particular attention is paid to finances andrevenues, since enhancing local government fiscal resources is crucial for the success ofreform in this dimension . However, I also analyze the political, managerial and otherinstitutional constraints on effective local government service provision, as these factorswill also be crucial to improving such provision.
The structure of the paper is as follows. In section II, I provide an overview ofsome features of local government in India, both rural and urban. While comprehensivedata are relatively old, and often fragmentary, the resulting picture is up-to-date: greatheterogeneity in the nature of the organization, revenues and expenditures of localgovernments. This section also provides a summary of the constitutional amendments,their rationale, and main features. Sections III - V then proceed to explore the nature ofIndian local governments in more detail, along three dimensions: expenditureresponsibilities, revenue authority, and organizational features. The first two of thesecategories correspond to the standard public economics analysis of expenditure andrevenue assignment2. The third dimension was first stressed by political scientists3, but
1 These figures are from Datta (1992), Tables 4.1 and 4.2, p. 180. The corresponding figure for localshare of all government expenditures in India is about 6 %.2 See, for example, Musgrave and Musgrave (1984).3 See, for example, Ostrom, Schroeder and Wynne (1992).

3
recently has been analyzed by economists as well4. In this typology, I am followingDillinger (1994), who provides this lucid expression of the issues:
The evidence ... suggests that there are three elements to reform in the structure of urban servicedelivery: (a) the clarification of functional responsibilities between the levels of government; (b) theauthorization of revenue sources corresponding to functional responsibilities; and (c) the institution of asystem of accountability that encompasses both regulation by central government and incentives forresponsiveness to local constituents. (p. 2, paragraph vii)
For this paper, I extend the scope of Dillinger’s framework to rural as well as to urbangovernments, and regulation must include state governments as well as the centralgovernment. With these extensions, the above quote succinctly expresses the range ofissues faced in the reform of local government in India. Section VI of the paper providesa summary conclusion, relating local government reform to the broader economic changestaking place in India.
Before turning to details in subsequent sections, we can provide a summary of thispaper’s conclusions within the above framework. The recent constitutional amendmentsdefine local government functional responsibilities quite extensively, but do not necessarilydelineate them clearly vis-à-vis the responsibilities of the state governments: there issubstantial potential overlap, and there may be a period of negotiation between thedifferent sub-central tiers. To the extent that politicians and bureaucrats at higher levelsare reluctant to give up authority, and because of the lack of clear accountability due tothis overlap, this may be a difficult transition. In practice, therefore, the dimensions ofrevenue assignment and institutional incentives will be crucial in enabling change in termsof actual expenditure responsibilities.
With respect to revenue authority, the main change in the legislation may be thecreation of state level finance commissions, which are intended to bring greatertransparency and rule-based criteria to transfers from state to local governments. Whetherthis will increase local revenues is doubtful, given the states’ own fiscal difficulties.However, there is some evidence that local governments in India have not always usedtheir legally assigned revenue potential. Whether they do so now will depend on thechanges in institutions and the structure of incentives enabled by the reform legislation, butthere is some reason for optimism.
In some sense, therefore, the success of local government reform in India dependson the factor most emphasized by Dillinger: a system of accountability including regulationfrom above, as well as responsiveness to local constituents. Here, the legislation marks asignificant departure, introducing direct elections at each tier of local government, andrestricting the ability of state governments to indefinitely supersede elected localgovernment officials. The resulting changes in incentives have the potential to alter bothde facto functional responsibilities and the raising of revenue by local government. India’slegislation for strengthening local government has therefore certainly paid attention to all
4 See, for example, Cremer, Estache and Seabright (1995).

4
three elements of reform emphasized by Dillinger, and has set the stage for more effectivelocal government service provision. In this paper I shall expand on the possibilitiescreated, and the potential pitfalls.
II. OVERVIEW
The natural place to start examining local government in India is actually thestates, which are significant political units, and together spend almost as much as thecentral government. The states have traditionally controlled local governments veryclosely. In many areas, there is a substantial overlap in the functional responsibilities ofstates and of local governments, and, in practice, states have often ruled local jurisdictionsdirectly, either by ordinary appointment of local officials, or by dismissing elected localofficials on various pretexts and replacing them with state government officials asadministrators. Examining the data at the state level also allows one to get a sense of theheterogeneity of characteristics across India: state level data is quite complete andrelatively reliable, and there has been considerable research on center-state governmentrelations.
Demographics and development levels
Table I presents basic statistics for 16 of India’s states, covering 96.5 % of India’spopulation. The excluded states and union territories, with the exception of Delhi, are allsmall in population, and, except for Goa, fall in the class of “special category” states,being border states, typically with ethnically distinct populations5. Several characteristicsof the state data in Table I are worth noting. The size range is quite large, as are thepopulations encompassed: with the exception of Himachal Pradesh, the states havepopulation sizes more typically associated with nations. The largest, Uttar Pradesh, wouldbe in the top ten of countries ordered by population size, but even Haryana, the 15thlargest, with 16 million people, has a population larger than many European nations.
Population density, which may be a useful indicator the appropriate locus ofgovernment, also varies greatly (a factor of eight from lowest to highest), from lows in thehilly or desert states of Himachal Pradesh, Rajasthan and Madhya Pradesh to the denselypopulated states of Kerala and West Bengal. Data on urbanization is presented in the thirdnumerical column of Table I: the percentage of rural population in the 16 states rangesroughly between 60 and 90 per cent, with Maharashtra being at one extreme and HimachalPradesh and Assam at the other. Maharashtra contains the big city of Mumbai (Bombay),which skews the proportion, but other states with high percentages of urban populationare Gujarat and Tamil Nadu. There is not a strong correlation between density and thepercentage of the population in urban areas, although the relationship is clearly positive.
5 Assam and Himachal Pradesh, which are also special category states, are included in Table I because oftheir size. Rao (1997) provides some data on 25 Indian states (see, e.g., his Table 5, p. 19).

5
TABLE IBasic State Statistics
Population inmillions
1991
Densityper sq.
km.
Per centurban
Per capitaincome (Rs.)
1989-90
Literacyrate per
cent
Schoolenrollment rate
per 1000
Andhra Pradesh 66.51 242 26.90 3,986 44.1 134.96Assam 22.41 286 11.07 3,196 52.9 178.85Bihar 86.37 497 13.14 2,186 38.5 130.37Gujarat 41.31 211 34.50 5,368 61.3 184.27Haryana 16.46 372 24.61 6,026 55.8 153.77Himachal Pradesh 5.17 93 8.70 4,269 63.9 207.11Karnataka 44.98 235 30.92 4,305 56.0 175.29Kerala 29.10 749 26.39 3,451 89.8 206.99Madhya Pradesh 66.18 149 23.18 2,995 44.2 152.60Maharashtra 78.94 257 38.69 6,604 64.9 188.72Orissa 31.66 203 13.39 2,965 49.1 152.49Punjab 20.28 403 29.54 7,674 58.5 155.44Rajasthan 44.01 129 22.88 3,219 38.6 137.02Tamil Nadu 55.86 429 34.16 3,593 62.7 201.95Uttar Pradesh 139.11 473 19.84 3,092 41.6 127.01West Bengal 68.08 767 27.48 4,193 57.7 145.98
Total 816.43Average 51.03 285 24.94 3,907 51.5 155.87
Source: Compiled from Mathew (1994)
The next column of Table I gives figures on per capita income. The poorest stateby this measure is Bihar, and the richest is Punjab, with their ratio being 3.56. Again, this isa substantial degree of heterogeneity. Columns five and six provide alternative measuresof development: the literacy rate and the school enrollment rate: these also showsubstantial variation, though not as much as per capita income. The two measures arehighly correlated (0.83), but neither is strongly correlated with per capita income (0.36for literacy and 0.22 for enrollment).
The lesson of Table I is that one may have to be prepared to examine localgovernment in India on a state-by-state basis, given the great disparities in thecharacteristics of the different states. This considerably complicates the task of analysisand evaluation. Obviously one could add other statistics, such as on health, roads, accessto water supplies, and so on. These would provide a fuller picture of the different Indianstates, but are not necessary for our main point7.
6 These numbers often vary in quality across states. However, the figures for 1993-94 per capita statedomestic product in Rao (1997) give only a marginally lower ratio between Punjab and Bihar of 3.37.7 Matthew (1994) provides such state-level data.

6
Local government demographics
I begin with a state-by-state map of rural local governments in India, in Table II.There are a large number of such governments at the village level, but the count appearsto be quite reliable. There are three tiers of such government, with different names indifferent states, which I shall generically call, in ascending order, village8, block anddistrict. The traditional council of five of the villages, the panchayat, gives the commonterm “Panchayati Raj” to India’s system of rural local government.
TABLE IIRural local governments
Villagegovernments
(grampanchayats)
Blockcouncils
(panchayatsamitis)
Districtcouncils
(zillaparishads)
Electoratein millions
Populationper village
government
Populationper blockcouncil.
Populationper district
council
Andhra Pradesh 19,519 1,092 22 44.67 2,500 45,000 2,210,000Assam 2,486 196 43 10.15 8,000 102,000 463,000Bihar 11,653 589 52 NA 6,400 127,000 1,443,000Gujarat 13,256 182 19 NA 2,000 149,000 1,424,000Haryana 5,996 109 16 NA 2,100 114,000 776,000Himachal Pradesh 2,597 69 12 NA 1,800 68,000 393,000Karnataka 5,641 NA 20 20.64 5,500 NA 1,554,000Kerala 990 152 14 NA 21,600 141,000 1,530,000Madhya Pradesh 30,924 459 45 3.08 1,600 111,000 1,130,000Maharashtra 26,584 296 29 NA 1,800 164,000 1,669,000Orissa 5,264 314 30 1.81 5,200 87,000 914,000Punjab 11,596 136 14 9.20 1,200 105,000 1,021,000Rajasthan 9,189 237 31 NA 3,700 143,000 1,095,000Tamil Nadu 12,787 387 22 3.67 2,900 95,000 1,672,000Uttar Pradesh 73,917 897 63 70.20 1,500 124,000 1,770,000West Bengal 3,325 340 16 30.57 14,800 145,000 3,086,000
Median populationper government
2,700 114,000 1,433,500
Total number 235,724 5,455 448
Notes: Figures in last three columns are based on rural population only.Population per village government is rounded to the nearest hundred, for the other two levels to the nearest thousand.
Source: Compiled from Mathew (1994)
8 It is important to note that in doing so, I am simplifying, since the lowest level in many states wouldinvolve a group of villages.

7
The first three columns of Table II report the number of local governments at eachlevel. The last three columns give some idea of the “span of control”. It is seen that thepopulation per village government is extremely small, with the median across the stateaverages being only 2,700. There is considerable variation among the states, but the onlytwo obvious outliers are Kerala and West Bengal. These are also by far the most denselypopulated states, but the difference is more a reflection of a different institutionalarrangement in these states. For most states, the small jurisdictions of these villagegovernments raises questions of economic efficiency and viability. Populations per blockcouncil are considerably larger, with a median across these 16 states of 114,000, more ofthe order of county governments in the United States, for example. The block level isimportant in approximating the constituencies of the lower houses of the state legislatures,known as Legislative Assemblies. Populations per district council are quite large, with amedian across the states of close to 1.5 million. The district is approximately the size ofthe constituency of the member of the Lok Sabha, the lower house of the nationalparliament9. Both the higher tiers also display considerable variation across states, in thesizes of populations at each government level. Overall, however, some of the variation inthe sizes of the states themselves gets removed as one goes down to lower levels ofgovernment.
The block and district levels - particularly the latter- have, in fact, been importantcomponents of the central administrative apparatus, even prior to independence.Considerable administrative discretion has rested with appointed officials, usually of theIndian Administrative Service (IAS), at the block and district levels. Although IASmembers are assigned to states, they are all part of an all-India bureaucratic structure, andcan thus be assumed to be responsive to central as well as state-level political imperatives.The block and district levels have also been important in conceptualizing theimplementation of India’s central plans, and strengthening block-level implementation hasbeen a significant part of attempts to decentralize the planning process. The size ofpopulations as shown in Table II suggests that, since the lowest level is so small in size,the intermediate level may be more important for rural local government reform than hasbeen emphasized in previous discussions, to internalize externalities and to take advantageof economies of scale and scope. These arguments extend to the highest level, the district,but are counterbalanced by its size, in absolute terms (affecting the “span of control”) aswell as relative to the state level (affecting the ability of state governments to maintainhard budget constraints for the lower level). The highest level of rural local governmentmight not even be characterized as “local” in this respect: basic public services willtypically have smaller constituencies. The issue of the interaction between central andstate bureaucrats and elected local government officials has been, and will continue to beimportant, and will be taken up in discussing incentives in section V.
The figures for electorates in Table II are very incomplete, and the reasons for thesmall electorates reported for Madhya Pradesh, Orissa and Tamil Nadu are not clear. In
9Of course these constituencies will include urban populations, excluded from the calculations in Table II.

8
TABLE IIIState legislation and electoral systems, 1992
Years in whichlegislation passed
Tiers Mode ofelection
Andhra Pradesh 1964 1986 Village DirectBlock Indirect
District Indirect
Assam 1972 Village DirectDistrict Indirect
Bihar 1947 Village DirectBlock Indirect
District Indirect
Gujarat 1961 Village DirectBlock Indirect
District Indirect
Haryana 1952 1961 Village DirectBlock Indirect
Himachal Pradesh 1968 Village DirectBlock Indirect
District Indirect
Karnataka 1983 Village DirectBlock None
District Direct
Kerala 1960 1979 Village Direct
Madhya Pradesh 1990 Village DirectBlock Nominated
District Nominated
Maharashtra 1958 1961 Village DirectBlock Indirect
District Indirect
Orissa 1959 1964 Village DirectBlock Indirect
Punjab 1952 1961 Village DirectBlock Indirect
District Indirect
Rajasthan 1953 1959 Village DirectBlock Indirect
District Indirect
Tamil Nadu 1958 Village DirectBlock Direct
District Nominated
Uttar Pradesh 1947 1961 Village DirectBlock Nominated
District Nominated
West Bengal 1973 Village DirectBlock Indirect
District IndirectSource: adapted from Singh and Misra (1993)

9
the other states, they appear to reflect universal suffrage at the level of local government.However, until the recent legislative changes, the ability to exercise this suffrage was verylimited. Dillinger (1994) notes that at any given time since independence, 40-50 per centof local government bodies in India, have been under state supersession. Furthermore,there was an inherent structural limitation on this exercise, since in most states only thelowest level of rural local government, the village, had directly elected local governmentofficials. The nature of electoral systems for rural local governments before the recentreforms is summarized in Table III. It may be noted that only Karnataka and Tamil Naduhad direct elections above the village level - though Tamil Nadu was a state where rurallocal elections were not held for a stretch of 15 years. On the other hand, Kerala andWest Bengal had larger average populations at the lowest level, and both had politicaltraditions of decentralization. Hence the information in Table III must be supplementedwith the different states’ experience10. However, note that states such as Madhya Pradeshand Uttar Pradesh did not even have indirect elections at the higher two levels of rurallocal government, those bodies being nominated by state governments. This alonesuggests less decentralization or local control compared to states where such electionswere possible. Finally, note that several states had only one or two tiers of rural localgovernment, even though both block and district are part of the nationwide administrativestructure.
Turning to urban local governments, figures for these are presented in Table IV.This data is less recent, being from 1979-80, and the classifications seem somewhat lessreliable11. The total number of urban local bodies, about 2600 in the table, has gone wellbeyond 3000 more recently12. The structure of the urban governments in the table isdifferent from that of rural bodies, in that there is no tier system. The first three columnsof Table IV are governments of different sizes, from corporations (which do have smallerunits such as wards within them) down to municipalities, and then town and notified areacommittees, but the latter are not components of municipalities or corporations.However, size is not the only criterion for classification, and political, economic andhistorical factors can also matter. Thus, within each category, as well as across states,there is considerable variation in the nature of urban local bodies.
In general, it is true that corporations have more autonomy and widerresponsibilities than municipalities, with town and notified area committees being mostrestricted. A major difference between notified or town area committees on the one handand municipalities and corporations on the other is that the former category has notinvolved any elected governing body: the committees are appointed by state governments. 10 Each state has its own history of local government legislation, political traditions, land ownershipsystems, and so on, all of which affect the functioning of local government. It is beyond the scope of thispaper to provide even minimal details of each state’s experience with local government. Mathew (1994)surveys the states’ histories of rural local governments. Some of the variation in the states with respect tourban local governments will come across in the case studies referenced later in the paper. Also see Rao(1986) and Jetha (1992).11 This observation is based on inconsistencies in the numbers from the two sources. I have used Rao’snumbers, except in separating out corporations , which are missing from his table.12 Sachdeva (1993) reports a figure of 3301 in 1989 (p. 23).

10
However, to the extent that elected municipalities and corporations have been superseded,the distinction becomes less important. Even in cases where municipalities andcorporations have functioning elected governing bodies, state governments have typically
TABLE IVUrban local bodies
Corporations Municipalities Town Area andNotified AreaCommittees
Totalnumber
Est. 1976-77urban popn.in millions
Popn. perurban area
Andhra Pradesh 1 85 0 86 9.75 113,372Assam 1 23 38 62 2.09 33,710Bihar 1 71 78 150 7.64 50,933Gujarat 5 51 1 57 8.64 151,579Haryana 0 64 0 64 2.30 35,938Himachal Pradesh 1 18 16 35 0.26 7,429Karnataka 3 227 6 236 8.68 36,780Kerala 3 43 0 46 4.07 88,478Madhya Pradesh 6 200 77 283 7.78 27,491Maharashtra 5 221 0 226 19.07 84,381Orissa 0 98 28 126 2.08 16,508Punjab 3 97 7 107 4.52 42,243Rajasthan 0 192 0 192 5.30 27,604Tamil Nadu 2 108 0 110 NA NAUttar Pradesh 5 193 448 646 14.92 23,096West Bengal 2 93 5 100 14.55 145,500
Source: Number of governments compiled and adapted from Datta (1984), Table 1, p. 2, and Rao (1986), Table 4.4,p. 66. Population figures from Datta (1984), Table 12, p. 21.
retained considerable discretion and bureaucratic control over even the largest urban localgovernments, for example through municipal commissioners (who would typically be IASmembers). Two other indicators of heterogeneity in urban governments across states maybe noted. One is the disproportionate use of notified and town area committees by statessuch as Uttar Pradesh and Bihar. The other is the variation in population per urbangovernment among the states. Some indication of this comes from the last column ofTable IV, though these numbers somewhat understate the per-government populations,being based on urban population estimates for 1976-77, rather than 1979-80. Obviously,some of the high figures reflect the inclusion of large cities in the averages, such asMumbai in Maharashtra, and the smallest figure comes for the hill state of HimachalPradesh, but the dispersion of these numbers helps to indicate the variation in whatconstitutes an urban area across the major states.
11
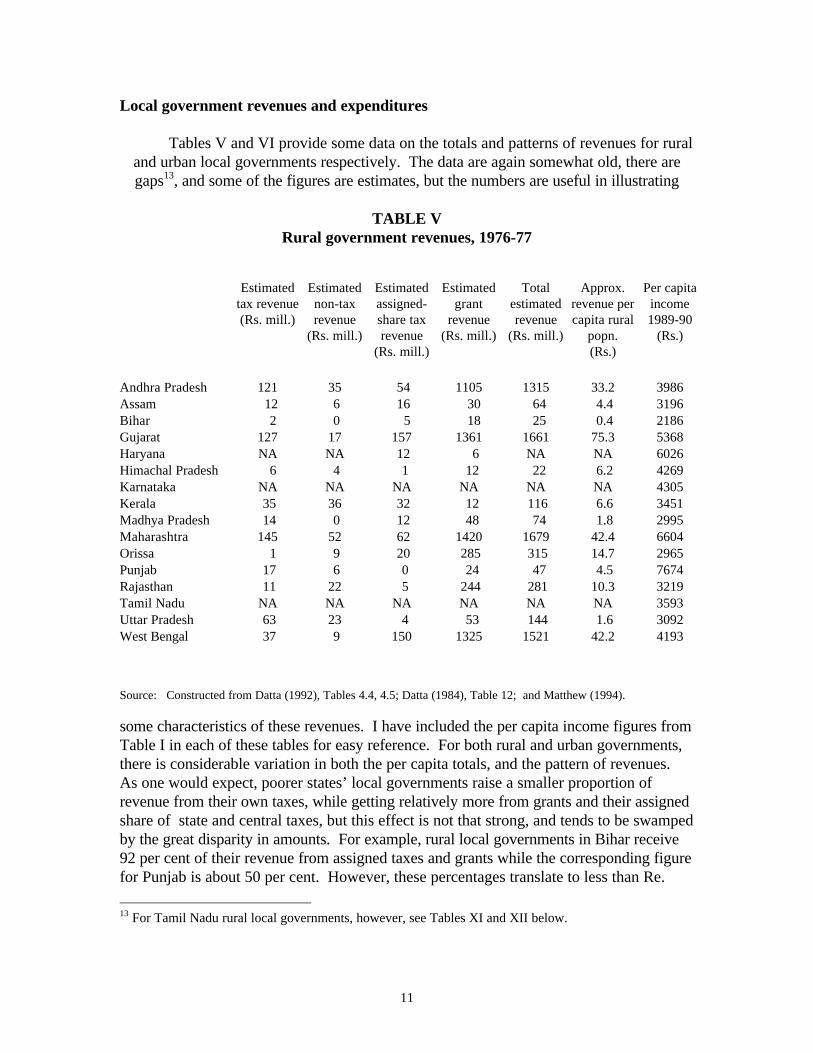
Local government revenues and expenditures
Tables V and VI provide some data on the totals and patterns of revenues for ruraland urban local governments respectively. The data are again somewhat old, there aregaps13, and some of the figures are estimates, but the numbers are useful in illustrating
TABLE VRural government revenues, 1976-77
Estimatedtax revenue(Rs. mill.)
Estimatednon-taxrevenue
(Rs. mill.)
Estimatedassigned-share taxrevenue
(Rs. mill.)
Estimatedgrant
revenue(Rs. mill.)
Totalestimatedrevenue
(Rs. mill.)
Approx.revenue percapita rural
popn.(Rs.)
Per capitaincome1989-90
(Rs.)
Andhra Pradesh 121 35 54 1105 1315 33.2 3986Assam 12 6 16 30 64 4.4 3196Bihar 2 0 5 18 25 0.4 2186Gujarat 127 17 157 1361 1661 75.3 5368Haryana NA NA 12 6 NA NA 6026Himachal Pradesh 6 4 1 12 22 6.2 4269Karnataka NA NA NA NA NA NA 4305Kerala 35 36 32 12 116 6.6 3451Madhya Pradesh 14 0 12 48 74 1.8 2995Maharashtra 145 52 62 1420 1679 42.4 6604Orissa 1 9 20 285 315 14.7 2965Punjab 17 6 0 24 47 4.5 7674Rajasthan 11 22 5 244 281 10.3 3219Tamil Nadu NA NA NA NA NA NA 3593Uttar Pradesh 63 23 4 53 144 1.6 3092West Bengal 37 9 150 1325 1521 42.2 4193
Source: Constructed from Datta (1992), Tables 4.4, 4.5; Datta (1984), Table 12; and Matthew (1994).
some characteristics of these revenues. I have included the per capita income figures fromTable I in each of these tables for easy reference. For both rural and urban governments,there is considerable variation in both the per capita totals, and the pattern of revenues.As one would expect, poorer states’ local governments raise a smaller proportion ofrevenue from their own taxes, while getting relatively more from grants and their assignedshare of state and central taxes, but this effect is not that strong, and tends to be swampedby the great disparity in amounts. For example, rural local governments in Bihar receive92 per cent of their revenue from assigned taxes and grants while the corresponding figurefor Punjab is about 50 per cent. However, these percentages translate to less than Re.
13 For Tamil Nadu rural local governments, however, see Tables XI and XII below.

0.40 per capita from these sources in Bihar14, and more than five times that amount percapita in Punjab. One way to emphasize the wide variation of revenues per capita acrossthe states is to observe the ratios of maximum to minimum for these state averages. Theseare over six for urban local governments and as much as 100 for rural local governments.In comparison, per capita incomes vary by a factor of only 3.5 across these states15.
TABLE VIUrban government revenues, 1976-77
Estimatedtax revenue(Rs. mill.)
Estimatednon-taxrevenue
(Rs. mill.)
Estimatedassigned-share taxrevenue
(Rs. mill.)
Estimatedgrant
revenue(Rs. mill.)
Totalestimatedrevenue
(Rs. mill.)
Approx.revenue per
capitaurban
popn. (Rs.)
Per capitaincome1989-90
(Rs.)
Andhra Pradesh 148 210 23 95 476 48.9 3986Assam 23 32 0 4 59 28.2 3196Bihar 52 0 11 71 134 17.5 2186Gujarat 355 113 NA 55 523 60.5 5368Haryana 90 24 1 4 119 51.6 6026Himachal Pradesh 13 5 0 4 21 81.8 4269Karnataka 207 116 0 17 340 39.2 4305Kerala 65 26 9 6 105 25.9 3451Madhya Pradesh 210 62 70 92 434 55.8 2995Maharashtra 1262 713 57 281 2313 121.3 6604Orissa 36 24 7 29 95 45.6 2965Punjab 116 11 0 11 138 30.6 7674Rajasthan 155 69 0 27 250 47.2 3219Tamil Nadu NA NA NA NA NA NA 3593Uttar Pradesh 291 143 0 108 542 36.3 3092West Bengal 207 46 39 92 384 26.4 4193
Source: Constructed from Datta (1992), Tables 4.4, 4.5; Datta (1984), Table 12; and Matthew (1994).
It is also useful to calculate the correlations of the different per capita figures. Thecorrelations of per capita local government revenue with per capita income are bothsimilarly positive, being 0.42 for rural and 0.43 for urban governments. The correlationbetween per capita rural and urban local government revenues is 0.39. These numbers arecertainly not small, but neither are they large: clearly other things matter in determining 14 The figures for Bihar and some other states are remarkably low, but this may truly reflect greatercentralization at the level of the state government, as well as poverty.15 Excluding the extreme values for each category produces the following ratios between highest andlowest: 2.2 for per capita income, 3.2 for per capita urban government revenue, and about 26 for rural percapita revenue. The variation in revenues per capita across states may also be quantified by calculatingcoefficients of variation. For urban local governments, the coefficient of variation in per capita revenuesis 0.55. For rural local governments, it is as high as 1.22. Again, the coefficient of variation for percapita income is lower, being only 0.36.

the level of revenue raised by local governments besides how well-off their states are. Onepossibility, given the variation in political emphasis on decentralization in different states,and their different histories and characteristics, is to focus on political and institutionalexplanations. However, the basic demographic and electoral institutions data in Tables IIand III also do not provide any obvious explanation of the differences across states in localgovernment revenue-raising. For example, differences in the sizes of jurisdictions and thelegislative structures between states such as Gujarat and Haryana do not by themselvescapture the relevant differences in politics and institutions. Some of the variation isexplained by differences in legislative assignments, which are quite substantial, even afterthe recent reforms16, but even these do not, by themselves, explain the differences acrossstates in local revenue raising.
Returning to the pattern of revenue sources in Tables V and VI, it is evident fromTable V that rural governments in many of the states rely on funds collected at a higherlevel for most of their revenue. The average for the states with available data in this tableis 75 % from grants and shared taxes, with only Kerala and Uttar Pradesh below 50 %.This is not in itself a cause for concern: it is reminiscent of the importance of central-statetransfers in India. The rationality and transparency of transfers, however, is of concern, asdiscussed in section IV. Transfers are much lower as a percentage of urban localgovernment revenues (18.7% vs. 89.2%17) but the difference is not as large whenexamined in terms of per capita moneys transferred. For example, grants to ruralgovernments averaged about Rs. 13 per capita in this period, not too much larger than percapita grants to urban governments, which averaged about Rs. 8 per capita18. Severalobservations on patterns of revenue close out this overview. First, Gujarat andMaharashtra, with significant commercial/industrial cities, stand out in terms of urban taxrevenue19. The low figure for West Bengal, which includes Calcutta, is somewhat of acontrast, though it is balanced to a degree by the high per capita figure for ruralgovernment revenue. Finally, the pattern of revenue sources in Kerala seems the mostbalanced, particularly for rural governments, and this state will be a useful case study inthe subsequent analysis. As noted before, West Bengal and Kerala are also two states thathave a tradition of decentralization.
I do not have data on expenditures by state for urban governments, butexpenditure patterns for a sample of municipal authorities in 1975-76 are presented inTable VII, while aggregate data for rural local governments in 1976-77 and urban localgovernments in 1976-77 and 1986-87 are given in Table VIII. The data in Table VII
16 Rajaraman et al (1996), Tables 1-4, summarize some of the relevant differences across states withrespect to rural local governments.17These numbers are taken from a different source (see Table X), and therefore are slightly different fromthose calculated from the tables here.18 Neither of these numbers is large in absolute magnitude, or as a percentage of per capita GNP, but theyare significant fractions of local government revenue. This difference, of course, reflects the overall lowlevels of local government spending.19 These states are also able to export taxes to poorer states: this issue is discussed in section IV.

14
TABLE VII
Expenditure Patterns, Sample Municipal Authorities, 1976-77
Generaladministration
Collectionof revenue
Publichealth
Publicsafety
Medical Watersupply
Education Roads Loanrepayments
Other
Andhra Pradesh 7.9 2.0 22.9 3.7 0.1 16.8 18.7 21.0 0.3 6.7Assam 16.3 7.8 21.2 9.0 1.5 7.3 0.3 10.2 3.6 22.9Bihar 13.7 1.1 29.9 6.9 0.9 3.7 7.4 12.3 13.2 10.8Gujarat 5.1 4.2 8.9 2.3 6.6 2.5 10.3 0.0 10.0 50.3Haryana 13.5 0.2 27.0 7.7 5.5 16.2 0.9 3.1 1.7 24.4Himachal Pradesh 14.0 14.1 28.5 4.9 0.3 14.2 0.1 3.6 0.9 19.6Karnataka 16.7 0.0 17.1 8.3 1.8 8.1 1.1 0.0 6.6 40.3Kerala 32.7 1.6 12.2 7.7 11.2 6.2 1.0 7.8 7.6 12.2Madhya Pradesh 17.9 11.1 20.6 7.4 1.5 9.4 4.3 4.5 7.1 16.3Maharashtra 6.5 5.9 15.9 4.4 13.5 5.1 9.3 12.0 4.0 23.3Orissa 12.5 11.2 23.8 8.3 0.9 2.7 12.5 0.1 3.3 24.6Punjab 12.6 17.2 28.4 8.9 1.5 9.1 0.6 4.3 9.9 8.5Rajasthan 15.2 14.6 48.5 8.5 0.8 1.6 0.7 0.1 2.1 8.0Tamil Nadu 15.7 0.2 24.8 4.7 5.8 11.3 14.8 4.5 7.5 10.7Uttar Pradesh 8.1 11.0 41.3 5.0 3.3 6.5 2.2 0.4 6.2 16.0West Bengal 27.8 2.7 21.9 5.4 2.3 6.8 7.2 2.4 0.6 22.9
Source: Datta (1984), Table 10, p. 18.

15
indicate substantial variations in the patterns of spending. Administration takes upanywhere from 5.1 per cent (Gujarat) to 32.69 per cent (Kerala) of expenditure, publichealth from 8.9 per cent (Gujarat again) to 48.5 per cent (Rajasthan), and so on.However, the large size and the variation in the residual category, “Other” makesinferences difficult. Another problem may be that categories are defined differently:Gujarat municipal authorities in this sample spent 6.6 per cent of their outlay in thecategory “Medical”, versus only 0.8 per cent for Rajasthan. Combining the categories“Public Health” and “Medical” would somewhat reduce the disparity in the spendingpattern. Finally, it should also be noted that the differences do not necessarily reflectdifferences in actual spending, but may simply be the consequence of different expenditureassignments among the states. For example, public health expenditures may beundertaken more at the state level in Gujarat relative to Rajasthan. This kind of possibilitycan presumably be checked by examining state level data20.
TABLE VIIILocal Government Expenditures
Rural Urban 1976-77 1976-77 1986-87
Amount(Rs. million)
Per cent Amount(Rs. million)
Per cent Amount(Rs. million)
Per cent
Administration 582 8.0 584 9.8 547 8.8Tax collection 23 0.3 268 4.5 249 4.0Water supply 145 2.0 690 11.6 796 12.8Public health and sanitation
9 0.1 436 7.4 1,231 19.8
Roads 276 3.8 644 10.9 591 9.5Education 3,081 42.4 580 9.8 653 10.5Health 222 3.1 619 10.4 174 2.8Other services* 1,884 25.9 1,526 25.7 1,443 23.2Revenue surplus 1,043 14.2 586 9.9 535 8.6
Total 7,265 100 5,933 100 6,219 100
*Public safety, recreation, welfare, and loan repaymentSource: Datta (1992), Table 4.4, p. 182.
Turning to Table VIII, we see some expected differences in spending patternsbetween rural and urban local governments. The former spend less of their total on water
20 For example, for Gujarat, in 1986-87, “health” made up 3.5 per cent of current expenditures of Rs.25,244 million in the state budget (Jetha, 1992a, Tables 8.1 and 8.4, pp. 413, 415). In Uttar Pradesh,another state with a high percentage allocated to these categories in Table VII, “medical, health andsanitation” constituted 5.9 per cent of current outlays over 1980-90 (Bajaj and Agarwal, 1992, Table 7.21,p. 365). These amounts dwarf the spending at the local level.

16
supply, public health and sanitation, and roads, all of which are quintessential urbanservices. Datta (1992) also suggests that rural authorities tended to spend more oneducation, health and welfare because of the greater availability of categorical grants forthese, and because of their heavy reliance on grants. The pattern of expenditure in urbanlocal governments does not show much change over the decade, with the only major shiftbeing from “health” to “public health and sanitation”, perhaps reflecting a recategorizationof expenditures. Interestingly, the figures for both types of government show revenuesurpluses, unusual for government in India. The reason for this nonexpenditure ofavailable funds is discussed in section IV.
Local government legislation: overview
Throughout the period after independence, state and central governments in Indiaappointed a series of committees to examine the functioning of local government, andrecommend improvements. In addition, various Finance Commissions maderecommendations on this subject. The (aptly named) Central Council of Local Self-Government was created in 1954, under Article 263 of the Constitution, to coordinateurban development issues between the center and states. Rural issues remained separatefrom urban at the state level, but received even greater attention, and states repeatedlypassed legislation dealing with the structures of Panchayati Raj21. This legislation wasoften the result of recommendations made by centrally constituted committees.
In 1988, another central committee recommended that Panchayati Raj bodiesshould be given constitutional status. After two failed attempts in the next two years, in1991 two separate amendment bills were introduced, covering panchayats andmunicipalities respectively. These were passed by both houses of parliament towards theend of 1992, ratified by more than half the state assemblies, and brought into force as the73rd and 74th amendments to the Constitution of India in 1993. These amendmentsrequired individual states to pass appropriate legislation, since local government remaineda state subject under the constitution, and individual states have proceeded to do so.
What were the key features of the change brought about by the amendments?With regard to rural local governments, the uniformity of the number of tiers, criticized inearlier versions of the bills, was retained, with an exception only for the smallest states,with populations below 2 million. This imposes a three tier structure (village, intermediateblock/taluk, and district) on the larger states, including those such as Kerala, which hadchosen to have two tiers of local government prior to the amendment22. However, thisseems to be a relatively minor issue, given the flexibility states have in implementation.The crucial change is the reduction of state government discretion concerning elections tolocal government bodies. Under the new laws, elections to panchayats must be held every
21 Full texts of such legislations are in Singh and Misra (1993). A collection of historical materialpertaining to such efforts is in Venkatarangaiya and Pattabhiram (1969). Mathew (1994) also provides amore detailed history of committees and legislation.22 Recall that Table II provides the summary of the tier system in the different major states prior to theconstitutional amendment.

17
five years. Elections to constitute new bodies must be completed before the term expires.If a panchayat is dissolved prematurely, elections must be compulsorily held within sixmonths, the new body to serve out the remainder of the five year term. These provisionswill presumably prevent situations such as that in Tamil Nadu, where, as noted before, atone stage panchayat elections were not held for 15 years, being repeatedly announced andthen postponed by successive state governments. With regard to urban localgovernments, there is a similar strengthening of the electoral requirements, preventinglengthy supersessions of local powers by the state government, and replacing appointedposts with elected ones.
The 73rd amendment gives considerable attention to the nature of elections for thethree tiers of rural local government. Direct elections are specified for seats at all levels,this, too, being a significant change from the situation before the amendments, whenindirect elections or nomination were the norm for the higher two rural tiers (see Table II).Seats are reserved for scheduled castes and scheduled tribes in proportion to theirpopulation, and offices of chairpersons at all three levels are also reserved in proportion totheir population in the state. One third of the seats and of offices of chairpersons arereserved for women. Chairpersons at the intermediate and district levels are to be electedby the panchayat membership, while either direct or indirect elections of chairpersons arepermitted at the village level. State level election commissions are to be created tosupervise and manage the electoral processes. At the intermediate and district levels,chairpersons of bodies one level below can be made members, as can MPs (Members ofParliament), MLAs (Members of Legislative Assemblies) and MLCs (Members ofLegislative Councils).
The act provides for one additional potential avenue of representation andaccountability of local government. Each village or group of villages will have a gramsabha, a body comprising all registered voters in the area. The functions of the gramsabha are left up to the states, and are not further specified, but the Karnataka PanchayatAct of 1983 provides some indication of how these may function23. This act (nowreplaced by the new legislation) provided for periodic meetings of gram sabhas, toconsider the report of the panchayat, proposals for new programs for villagedevelopment, implementation of sanitation and drainage schemes through voluntary labor,programs of adult education, and similar issues. The purpose of these gram sabhas is toprovide a measure of direct democracy, but their actual role seems likely to remain limited,given their lack of authority or control.
Another vital feature of the reform is its attention to the financial resources of localgovernment. State government legislatures are expected to provide adequate funds forlocal governments, through grants, the assignment of tax revenues, and the authority tocollect taxes, tolls and fees. This will not be entirely at the discretion of the legislatures,since in each state a finance commission must be established (with five year terms, as is thecase with the central finance commission) which will determine the principles for providing 23 See Singh and Misra (1993), p. 127.
18
local governments with adequate resources, including totals of funds and rules for taxsharing. This creation of state level finance commissions is particularly significant: bymaking local revenues more predictable and less subject to conditions of the stategovernments, it has the potential to allow local governments to make expendituredecisions more independently of state governments. The envisaged structure parallels thatof the central finance commissions24, as well as being similar to the provisions of theKarnataka Panchayat Act of 1983. States will retain considerable discretion and control,but the experience at the center-state level suggests that state finance commissions, thoughadvisory in nature, will be important. States will also be responsible for making provisionswith respect to the maintenance and auditing of lower level government accounts.
Other aspects of the reform include the creation of a new (eleventh) schedule inthe Constitution, of 29 subjects (including agriculture, animal husbandry, land and watermanagement, irrigation, roads, education, electricity, and welfare programs) as panchayatresponsibilities; specific responsibilities for preparing development plans; the creation ofdistrict planning committees to consolidate the plans prepared by panchayats andmunicipalities; and additional provisions concerning eligibility for and composition of rurallocal governments. All of these provisions have been debated, and often criticized, insome detail25. I will try to evaluate some of the salient issues in subsequent sections.
The 74th Amendment, known as the Nagarpalika Act26, provides a parallel set ofreforms for urban and transitional areas. For areas in transition from rural to urban, nagarpanchayats are to be constituted, and, for most provisions of the Act, are treated equallywith municipalities. The composition of municipalities remains under the guidelines of thestates, subject to the population categories outlined in the amendment (5,000 to 10,000for a nagar panchayat, 10,000 to 20,000 for a municipal council, etc.). A noteworthyfeature is the legislative creation of tiers within larger municipalities, in the form of wardsand zones, with their own committees. As is the case for rural local governments, a keyfeature of the legislation is the strengthening of local election procedures, with members atthe ward and municipal level being chosen by direct elections. The zonal committees aremore of an intermediate level, their composition being the chairpersons of the wardcommittees in the zone.
Many of the provisions of the Panchayat Act, including composition, reservations,duration, and the role of state finance commissions, are directly applied to municipalities in
24 The central Finance Commission is constituted every five years with a charge to makerecommendations that cover a period concurrent to the period of a five year plan. Its membershipincludes academics, civil servants and politicians, but the government selects, and hence to some extentcontrols, who serves on each commission. Its existence and broad functions are mandated in the IndianConstitution. The commission decides on central-state tax revenue sharing, as well as the division amongthe states. The rationale for such an institution can be seen as providing a way of allowing flexibility inassignment, without making assignment questions politically subservient to the legislature. Transparencyand the use of rules are also promoted in this manner. See M.G. Rao (1994, 1995) for further discussion.25 See, for example, Mathew (1994) and Singh (1997).26 The text of the 1989 version of the act may be found in Sachdeva (1993), pp. 406-416.

19
the Nagarpalika Act. Paralleling the creation of the eleventh schedule in the Constitution,the legislation also creates a twelfth schedule for municipalities, including public healthand sanitation, communications, and various welfare services. Significantly, law andorder are not on this list. Finally, the act requires the constitution of planning committeesat the level of districts and metropolitan areas.
In the next three sections, I turn to a more detailed examination of the structuresof Indian local government, following the framework outlined in the introduction. Indoing so, I discuss the structures in place before the amendments, as well examining inmore detail the changes sought by the new legislation just summarized.
III. FUNCTIONAL RESPONSIBILITIES
In this section, I will treat rural local governments first, and then urban localgovernments. In each case, I discuss the situation prior to the recent local governmentreform package, then the changes being effected. I then assess overall the issue offunctional responsibilities in Indian local government. Two categories of problems areidentified with respect to the assignment of responsibilities: (1) excessive narrowness, and(2) lack of clarity. The recent reforms provide some improvement with respect to thefirst, but not clearly with respect to the second.
Rural local governments
Pre-reformPrior to the passage of the constitutional amendments, the functional
responsibilities of rural local governments were in many cases extremely limited. Forexample, based on national constitutional assignments, Datta (1992)27 lists only five areasthat were the sole jurisdiction of rural local governments: control of noxious vegetationand animals, sanitation and waste disposal, disposal of the dead, animal pounds and theprevention of cattle trespass, and drinking water supply. Another six areas of ruralgovernment responsibility were shared with state government: primary education, roadsand bridges, ferries and waterways, agriculture including extension, minor irrigation andwater development, and markets and fairs. In most of these latter cases, the localgovernment had a minor role relative to that of the state. This reflected both the differentrevenue capacities, as well as the organizational structures: state governments’ commandover resources, as well as their authority over the bureaucrats who were often the actualdecision-makers, far exceeded that of rural local governments.
Since each state had its own Panchayati Raj legislation, there was substantialvariation in the assignment of expenditure responsibilities across states. Theseassignments were often broader on paper than in practice. For example, the KeralaPanchayat Act of 1960 listed 13 basic responsibilities, the most notable addition to Datta’s
27 This list, as well as other data on functional responsibilities, is in Appendix 4.1 of his paper.

20
list being the maintenance of the village court28. However, there was a supplementary listof 59 specific activities, falling in seven areas, including agriculture, animal husbandry,education and culture, social welfare, public health and sanitation, and public works.Despite the impressive list of functional responsibilities in the state’s Panchayat Act therewere actually only three main categories of expenditure29: public works (maintenance,repairs and extension of rural roads and bridges, and parks and gardens), water supply anddrainage (including installation and maintenance), and street lights (provision, maintenanceand electricity charges). The combined per capita expenditures for 1981-82 in these threeareas were only about Rs. 5. Thus, long legislative assignments did not translate intosignificant functional responsibilities in practice.
The assignment of responsibility for the three main categories in Kerala illustratessome further issues. With respect to road maintenance, the expenditure typically went forrepeated repairs of earthen roads, which were washed away every monsoon, rather thanfor conversion to metalled roads as desired by constituents. This at least partly seems tobe the result of an overly narrow assignment of functional responsibility (and resources) tothe rural governments. The assignment of responsibility in the other two categories alsoreveals oddities. The rural water supply schemes were the responsibility of a state-levelspecial-purpose water authority (or its predecessor, a state government department), withpanchayats being charged on a formula basis for a share of the capital costs, as well as formaintenance expenses. Both the capital costs and maintenance charges were notapparently based on any well articulated economic grounds of benefits provided. Theresult was disputes with respect to both. The situation with respect to street lightingseemed to parallel that of water, with problems caused by the lack of accurate (or any)metering of electricity usage for this purpose, and disputes between the panchayats andthe state electricity board. To some extent, the problem in all these cases was not justwith the assignment of responsibilities, but with the level of revenues and theorganizational structures throughout the state and local governments.
Another dimension of assignment to rural local governments is the division ofresponsibilities across tiers (these were absent in Kerala). For example, Shah (1990)provides information on three districts in the Kumaun hills in Uttar Pradesh. The functionsof different tiers in the state in the 1980’s, in ascending order, were:
1. Gaon Panchayat [village group]Sanitation and health; public works; agriculture; forests; animal husbandry; village industries; welfare activities and promotion of voluntary bodies; education; sports and culture and general administration and security.
28 See Government of Kerala (1986), Appendix IV.29 Here I am focusing on expenditure related to service provision: the largest category of expenditure byfar was “establishment charges”, representing an astonishing 67% to 65% of self-raised income of thepanchayats, for the years 1980-81 to 1983-84 (Government of Kerala, 1986, p. 103). Aziz (1993), in asample of mandal panchayats (groups of villages) in Karnataka, similarly found that for the years 1987-1992 the two main categories of expenditure were civic amenities and public works, with very little spenton health or education. Pande (1994) reported a similar concentration of expenditures for a panchayat inHimachal Pradesh in 1985-90. See also Oomen (1995).

21
2. Kshetra Samiti [block]Sanitation and health; public works; planning; coordination; supervision and execution of developmental programmes including agency functions.
3. Zila Parishad [district]Public works; planning; coordination; supervision and execution of developmental programmes including agency functions. (Shah, 1990, p. 61).
The two higher tiers thus appear as implementing agencies of the state government, ratherthan as local government bodies in this set-up. And in practice, even functions such aseducation, which appear only in the list for the lowest tier, were substantially under thecontrol of state government agencies. This situation was typical for other states also.
Two examples given by Shah, based on interviews, illustrate some of the problemswith the functional assignment across the many levels of government. The head of onepanchayat related that the construction of a proposed road (within the responsibility of thevillage level) was begun, and the Zila Parishad sanctioned the release of panchayat fundsfor this purpose, but this was held up at the intermediate level, causing problems for thevillage. In another case, a village wished to obtain drinking water whose source was in agovernment forest, but was unable to get a response from the appropriate stategovernment bureaucrats. In both these cases, functional responsibilities were notionallyassigned to the village level, but village level decision makers did not have practicalcontrol - the responsibility was actually fragmented.
Post-reformAs noted earlier, the 73rd Amendment created a list of 29 different areas of rural
local government functional responsibility. Potentially, therefore, there is a considerableexpansion in the expenditure responsibilities of rural local governments. However, twodifficulties loom. The first of these has been illustrated above: most of the items in thenew schedule are concurrently state government responsibilities30. This concurrencerequires some alteration in the relative revenue capacities of the levels of government, andin the lines of control throughout the governmental apparatus within the states. Thisincludes the division of functional responsibilities among the different rural tiers (as in theexamples from Shah, 1990). The state level legislations based on the amendment do notalways clarify this division31. Without attention to these issues, situations such as thosedescribed above will still occur.
The second potential difficulty is enforcement, and the assignment of law andorder in general. Recall that the Kerala act did include the maintenance of village courtsas a panchayat responsibility. However, the history of decentralization of such functionsto the local level in India has been problematic. Before independence the primary role oftraditional panchayats was as petty courts, with limited functions as providers of public
30 Datta (1992) , Table 1, identifies only 10, relatively minor responsibilities as exclusive to localgovernments, with the other 19 involving overlapping responsibility.31 See Rajaraman et al (1996), p. 1074.

22
goods. The judicial role of panchayats was therefore given some attention afterindependence. An attempt was made to create separate nyaya panchayats (NPs) to handlejudicial matters. Despite the informality and flexibility of procedures in the NPs, therewere considerable delays and arrears at that level, attributable to the lack of training ofpersonnel, of institution building in general, and ultimately to a lack of adequate funding.Overall, the NP system became effectively moribund32. The idea of devolving law andorder to the district level was mooted in discussions of the Karnataka reforms of 1983,but was completely absent from the constitutional amendments: law and order remains astate subject33. The lesson from the failure of nyaya panchayats may not be thatdecentralization of judicial processes will not work, but that the existing structures of thejudicial components of government must be decentralized with adequate resourcesprovided for its success34. The point is that this is a functional responsibility that hasimportant complementarities with other local responsibilities35.
Urban local governments
Pre-reformAs one would expect, the list of functional responsibilities is longer for urban than
for rural governments. For the pre-reform phase, based on constitutional assignments,Datta (1992) lists 14 exclusive functions, and 16 that were concurrent with the stategovernments. Fire services, health centers, libraries, land use, regulation of industry andcommerce, and parks and playgrounds were examples of areas of urban governmentresponsibility not included in the rural government list. The pattern of expenditurenationwide in broad categories was shown in Table VIII. In addition, each state has itsown legislation governing urban areas in various classes, typically through generalMunicipal Acts, but sometimes, for large metropolitan cities such as Mumbai, throughcity-specific legislation. As a result, there was great variation in actual functionalresponsibilities across cities, even those of similar sizes, with cities such as Mumbai andAhmedabad having broader responsibilities. For example, the Ahmedabad Corporationplays a major role in education, health, water supply, bus transportation and townplanning, while in Chennai (Madras) these are provided by state level institutions (Jetha,1992). Even in the big cities, while functions such as police protection was organized at
32 Galanter (1989), Chapter 4, examines the judicial role of panchayats and nyaya panchayats in detail.33 As quoted in Mathew (1994), p. 13, social activist Swami Agnivesh asked, "Who will wield the lathi[stick used by police]in the villages? Whose orders will the police take to use force?" The answer at thattime, from Abdul Nazir Sab, the Panchayati Raj and Rural Development Minister of Karnataka, was, " Itis our intention that the police should come under the control of the zilla parishads. But we cannot do allthese things simultaneously. We will do it step-by-step when the district government is constituted." Asit turned out, this never happened in Karnataka. However, Bihar, Himachal Pradesh, and Punjab havegiven panchayats some judicial functions in their state-level legislation (Oomen, 1995, p. 14).34 In fact, the problems of delay and arrears are pervasive at all levels of the Indian judicial system. SeeMookherjee (1993), for example.35 Again, the decentralization of law enforcement may be significant for revenue enhancement also (taxenforcement for example), once again illustrating the tripartite framework of expenditure, revenue andorganizational incentives that we are using. On the other hand, economies of scale may work in theopposite direction.

23
the local level in terms of jurisdiction, effective control was at the state level, withpersonnel recruited to state or central police services.
Bhagwan (1983) and Jetha (1992) provide some more detailed information on thefunctioning of the five biggest Indian cities: Ahmedabad Calcutta, Chennai, Delhi, andMumbai, plus Trivandrum. Table IX summarizes expenditure on the revenue account36
for these cities, for the major categories of services. Bhagwan discusses the MunicipalCorporation of Delhi’s (MCD) expenditures, focusing on inefficiencies in provision, butalso providing examples of lack of clear, permanent assignments of responsibilities. Forexample, in 1971, the Slum Department (responsible for providing essential services toslum dwellers) was transferred from the MCD to the Delhi Development Authority(DDA), but transferred back in 1978, and back again to the DDA in 1980! The DDA alsohas jurisdiction over some gardens and green belt areas, resulting in some confusion of
TABLE IXSix metropolitan cities, per capita expenditures in current rupees
Delhi Mumbai Calcutta Chennai Ahmedabad Trivandrum
Year 1977-78 1977-78 1977-78 1977-78 1988-89 1988-89 1988-89
Public health 36.23 47.84 18.03 24.73 21.4 66.0 8.9Education 30.69 32.36 4.90 25.38 43.4 101.6 3.0Public works 12.39 31.32 20.17 22.57 16.9 78.8 55.9Public safety andconveniences
7.00 36.68 3.41 22.04
Miscellaneous* 5.30 25.30 2.86 3.51Other 70.5 58.0 5.5
Total 91.61 173.50 49.37 98.23 152.2 304.4 73.3
Sources: 1977-78 figures, Bhagwan (1983), Table 5.2, p. 56; 1988-89 figures, Jetha (1992a), Table 2.7, p. 16. Theclassification schemes are somewhat different in the two sources.*Construction and maintenance of swimming pools, stadia, community halls, tourist camps, and night shelters forhomeless; promotion of sports and cultural activities; old age pensions for poor; etc.
responsibilities. Other problems have arisen in dealing with Delhi’s smaller municipalbody, the New Delhi Municipal Committee (NDMC), which obtains services such as fireprotection and electricity from the MCD, but is lax in payment for such services. Therelationship between the two bodies is complicated by the fact that most centralgovernment offices and housing are in the NDMC’s geographical area. These issues,
36 For Delhi, expenditure on the revenue account made up about 83% of the expenditure in thesecategories, the remainder being on the capital account (Bhagwan, 1983, Table 5.1, pp. 53-54). Also, thesefigures are for “development expenditure”, excluding administration, costs of collection, etc.Development expenditure made up about 93% of the expenditure in Delhi’s Municipal Corporation(MCD). Finally, the figures are only for the MCD, by far the largest of Delhi’s municipal bodies.

24
therefore, are again problems of institutional structure rather than functional responsibilityalone.
A striking example of lack of clear functional responsibility comes from Ludhiana,the largest city and industrial center (population about 660,000 in 1981) of the relativelywealthy state of Punjab. The state government has, over the years, established severalspecial purpose agencies to perform functions which would normally come undermunicipal authority. These agencies include the Punjab Housing and Development Board,Punjab Water Supply and Sewerage Board, and various Improvement Trusts. Here is adescription of one consequence:
Labour colony and the adjoining housing areas ... are virtually a hell on earth...The sewerage hascollapsed...As many as 264 one bedroom double storey houses built by the Housing Board for the labourand 400 houses for the low income group stand in knee deep water. The sewerage had failed four yearsago and all pleas for repairing it are said to have gone unheeded. The saddest part is that no departmentis willing to own responsibility. The Housing Board authorities say they have handed over the colony tothe Municipal Corporation while the Corporation dodges the issue by saying it has not taken over thecolony. The Public Health Department which laid the sewerage is also not willing to acceptresponsibility and repair it. (Sachdeva, 1991, pp. 95-96, emphases added)
Of course one can also look at this as an example of lack of clear jurisdiction, or of failureof accountability, but one part of the problem again lies with a lack of clear assignment offunctional responsibility, particularly due to the existence of multiple government bodieswith notional responsibilities for the same function in the same jurisdiction.
Improvement Trusts have been set up by the Punjab government for developmenttasks such as provision of open space, laying out or altering streets, housing the poor , andland management37. They are nominated bodies directly under the control of stategovernment, though with some municipal government representatives. The list of tasks ofsuch agencies reflect a common characteristic of local government in India: capitalexpenditures for a particular function, say, providing roads, are undertaken by a nonlocalbody, while maintenance is left up to the local government. The example from Ludhiana isanother illustration of this approach. In such cases, there is a clear assignment of tasks,but not one which provides effective incentives for provision of the service.
Post-reformThe 74th Amendment to the Constitution created a list of 37 areas of responsibility
for urban local governments. This did not represent as dramatic a potential expansion ofresponsibility as did the corresponding reform for rural local governments. Examples ofadditional responsibilities include secondary and adult education, vital statistics, housingand land use, promotion and development of industrial and commercial estates, andelectricity distribution. However, some of these additional assignments were already being
37 Thus they are quite similar to the DDA in function (Sachdeva, 1993, p. 304). These kinds of bodieshave their ancestry in sanitary commissions set up in the 19th century in Bengal, Bombay and Madras.See Sachdeva (1991), Chapter VI. The recent justification for such agencies has been in terms of the lackof local fiscal and managerial capacity, as well as budgetary flexibility and economies from specialization.

25
carried out by larger urban bodies, such as the Delhi Electric Supply Undertaking underthe MCD. Furthermore, there is no change in the state or concurrent lists in theconstitution, and therefore the state governments retain considerable authority overfunctions now notionally in the urban local government sphere. The issue of law andorder was discussed at some length in the context of rural local governments, where it stillmight be argued that decentralization in this dimension is problematical38. However, forcities and larger towns, it would seem that the assignment of judicial functions to the locallevel, with local control, would be feasible. However, this has not been done in the recentconstitutional changes.
Assessment
Local governments, both rural and urban, provide examples of a lack of clarity inthe division of functional responsibilities. This occurs in several specific ways. First, thesame general expenditure or service category is often the statutory responsibility of thestate government as well as its subordinate local governments. Second, even where broadareas are explicitly divided, this is not necessarily done in a manner that promotesincentives for efficiency: the division of capital expenditures by the state and operationsand maintenance by the local government for the provision of a given service is the mainexample of this. Third, there has been a tendency for state governments to encroach onwhat might otherwise be well-defined municipal responsibilities, through the creation ofspecial purpose agencies, or through the intervention of state government departments39.Fourth, even when local functional responsibilities have been clear, they have beenrelatively narrowly defined, leading to inefficiencies such as the repeated repair of earthen(rural) roads rather than construction of more durable alternatives. Finally, the assignmentof functional responsibilities has not always been efficient, in terms of allowing localgovernments control over activities with economies of scope or complementarities: lawand order, or judicial services more generally, has been stressed as the most importantcase of this.
Obviously, the above five problems overlap to a considerable extent. Also, as hasbeen stressed in presenting the examples in this section, the problem of functionalassignment is linked very closely with issues of revenue availability and organizational orinstitutional incentives. This is, of course, the point stressed by Dillinger (1994), and iswell illustrated, therefore, by the Indian experience. These issues will be developed furtherin the following sections. I close this section with some positives. Despite the problemshighlighted so far, there are several favorable features or developments in assigningfunctional responsibilities to local governments, even though the recent reform legislationdoes not completely addresses the above five issues.. There has always been someattempt at explicitness in the various state legislation, and the constitutional amendmentstake this a step further, their new schedules providing a floor on local government
38 For example, Bayley (1969, p. 403) notes issues of competence and parochialism.39 It should be noted here that this is not always at the initiative of the state government. The centralgovernment, through its Planning Commission, and international lending agencies have also favored oreven pushed for the creation of such state-level special purpose agencies.

26
responsibilities that must, in principle, be respected by the states. This reform alsobroadens local government responsibilities, reducing to some extent the problem ofexcessive narrowness. The three tier system imposed on rural local governments alsohelps to clarify assignments to the extent that the higher two tiers have specificcoordination responsibilities, and are meant to be more like components of localgovernment than agencies of the state government. In terms of allowing for geographicaldistinctions, the Indian experience reflects a well thought out framework and progression,unlike some of the examples mentioned by Dillinger (1994, p. 25) of a “one-size-fits-all”approach. The recent legislation also deals with his stricture that the graduation process inIndia lags behind the rate of urban growth: there are explicit provisions now made forareas in transition from rural to urban.
IV. REVENUE
Local government responsibilities in India have been broadened and strengthened.How will they be able to carry them out, when even previous narrower responsibilitieswere often beyond budgetary means of local governments? As numerous commentatorshave emphasized, raising additional local government revenue will be a key requirement.In this section, I examine the experience with local government revenues in more detail, aswell as the implications of legislative changes for revenues. I begin with an overview thatincludes some example cases; then turn to individual revenue sources - taxes, user charges,transfers and loans; and finally evaluate prospects in the new framework. In each case, Idistinguish between the situations of rural and urban governments
Overview
Tables V and VI presented statewise revenue figures for rural and urban localgovernments respectively. In section II, I stressed the heterogeneity across states40, andhighlighted some of the differences between rural and urban government revenue sources.Datta (1992) provides some additional data on local government revenues, aggregated atthe national level, but disaggregated by tiers of rural local government and types of urbanlocal government. These are summarized in Table X. First, note that grants and sharedtaxes dominated for rural governments, while taxes were more important for urbangovernments. Second, rural local government revenues were heavily skewed towards theupper tier, which was typically not directly elected, and sometimes just nominated by the
40 Differences across states reflect institutional variations or special circumstances. For example, in TableV, the high assigned-share tax revenue of urban governments in Madhya Pradesh reflects their share ofthe state entry tax. In many other states, transit taxes (called octroi) are collected by the urbangovernments themselves. The figures for Maharashtra are exceptional because of the inclusion ofMumbai, which, in 1977-78 had a revenue of Rs. 1,706 million, of which taxes accounted for Rs. 1,382million (Bhagwan ,1983). These figures dominate urban government revenues in Maharashtra.

27
TABLE XLocal government revenue by tier/type 1976-77
percentagesTax Non-tax Shared
taxes/grantsTotal Average
population('000)
Revenue percapita (Rs.)
Revenue perauthority(Rs. '000)
Rural Tiers District councils 6.0 1.2 92.0 100 1500 17.3 25,950 Block councils 14.2 0.2 85.6 100 75 2.2 165 Village governments 34.8 18.2 47.0 100 1.5 2.5 3.75
Total 8.1 2.7 89.2 100
Urban Types Municipal corporations 72.3 14.1 13.6 100 500 125.0 62,500 Municipal councils 58.4 19.2 22.4 100 50 66.0 3,300 Town/notified committees 49.0 18.0 33.0 100 7.5 46.0 345
Total 54.4 26.9 18.7 100
Source: Datta (1992) Tables 4.6 and 4.7, pp. 185-186.
state government. In many cases, they were just state agencies, control over theirexpenditure being effectively determined by state government officials. Third, the percapita revenue of the smallest urban governments, town and notified area committees,with an average population of 7,500, was considerably greater than the per capita revenueof the much larger rural district councils and block councils.
Tables XI and XII provide data on revenue patterns of the lowest and intermediatetiers of rural governments by state. These are more recent than the data in Table V, aswell as being disaggregated by level. They are also somewhat more detailed in terms ofrevenue sources41. For the lowest level (Table XI), local governments in some states aremuch better able to mobilize income from taxes and fees or from land revenue. As notedearlier, some of this difference is a consequence of different legislative assignments. Inother states, the panchayats rely much more on grants from higher level governments.The figures are not completely comparable across states. For example, only the figuresfor Andhra Pradesh and Uttar Pradesh include central grants under the Jawahar RozgarYojana (JRY) scheme of poverty alleviation grants. For the intermediate level (TableXII), there were similar variations across states, with Gujarat standing out in terms ofaverage revenue per block.
41 However, concerns about data quality and comparability across states apply. For example, Haryanapanchayats are shown in Table XI as obtaining a significant fraction of revenue from land, whileRajaraman et al (1995) state that “Haryana does not levy land revenue at all” (p. 1076).

28
TABLE XIRevenue pattern, panchayats, 1989-90
percentagesTaxes and
feesLand
revenueRevenuesharing
Grants Other Total Per capitarevenue
(Rs.)
Andhra Pradesh 13.6 0.0 6.6 78.5 1.3 100 40.6Assam , NA NA NA NA NA NA NABihar NA NA NA NA NA NA NAGujarat 31.0 0.8 2.8 41.9 23.5 100 27.6Haryana 13.2 61.6 0.0 11.2 14.0 100 10.9Himachal Pradesh 6.9 0.0 1.4 11.3 80.4 100 9.7Karnataka NA NA NA NA NA NA NAKerala 63.4 0.1 0.0 14.5 22.0 100 31.4Madhya Pradesh 0.0 92.1 0.0 7.9 0.0 100 0.5Maharashtra 45.2 0.0 6.5 25.2 23.1 100 12.0Orissa 5.6 2.7 0.0 85.3 6.4 100 2.4Punjab 1.0 33.9 1.1 50.9 13.1 100 26.4Rajasthan 0.0 4.9 0.0 95.1 0.0 100 40.4Tamil Nadu 33.3 0.0 31.8 34.9 0.0 100 3.1Uttar Pradesh 1.5 0.0 4.7 91.7 2.1 100 53.2West Bengal NA NA NA NA NA NA NA
Source: Oomen (1995), Table 1A, p. 24
Revenue sources and structures
I discuss taxes, fees, transfers and borrowing in turn. Tax sharing is discussed indetail under transfers. Each of these revenue instruments raises different issues. Forexample, Dillinger (1994, p. 26), notes that “The choice of instruments depends on theobjectives, and the objectives vary according to the function that is being financed”. Inparticular, services where benefits are private and the externality (or merit good) aspect isnot strong are better candidates for user charges or local taxes. On the other hand, to theextent that revenue sources are not earmarked, there is not necessarily a simplecorrespondence between functions and instruments in practice. However, it remains truethat the behavioral and distributional impact of each revenue instrument needs to be bornein mind.
TaxesExamining Table V, we see that the share of rural government revenue that comes
from local taxes was quite low in 1976-77, ranging from a high of 29.6 per cent in Keraladown to 0.3 per cent in Orissa. The national average for these figures was only 8.1 percent in that year. The figures for 1989-90 in Tables XI and XII indicate somewhat higher

29
TABLE XIIRevenue pattern, block level, 1989-90
percentages
Taxes andfees
Landrevenue
Revenuesharing
Grants Other Total Averageper block(Rs. mill.)
Andhra Pradesh 0.0 0.0 2.8 96.6 0.6 100 3.98Assam , NA NA NA NA NA NA NABihar NA NA NA NA NA NA NAGujarat 4.2 3.4 5.4 79.9 7.1 100 10.87Haryana 29.8 0.0 0.0 70.2 0.0 100 0.08Himachal Pradesh 96.2 3.8 0.0 0.0 0.0 100 0.08Karnataka NA NA NA NA NA NA NAKerala NA NA NA NA NA NA NAMadhya Pradesh 96.2 3.8 0.0 0.0 0.0 100 NAMaharashtra NA NA NA NA NA NA NAOrissa 0.0 0.0 0.0 100.0 0.0 100 0.11Punjab 1.3 0.0 7.0 36.8 54.9 100 0.52Rajasthan 27.7 0.0 4.8 38.7 28.8 100 0.05Tamil Nadu 4.4 0.0 5.1 90.5 0.0 100 5.56Uttar Pradesh 46.2 0.0 0.0 47.8 6.0 100 0.27West Bengal NA NA NA NA NA NA NA
Source: Oomen (1995), Table 1B, p. 25
percentages for tax revenue, but they are still very low for many states. Yet rural localgovernments have had 27 different taxes (20 exclusive, 7 concurrent with the stategovernment) available to them42. Exclusive taxes included terminal taxes and octroi;property and building taxes; oil engine, food, timber, fishery and produce taxes; andprofession and labor taxes. Concurrent taxes included those on commercial crops and onland. For the lowest rural government level in some states, land revenue was a significantproportion of revenue (Table XI). In others states, the state governments dominated inland taxes: collection would be by the state, with an assigned local share, and this wouldbe included in the third column of Table V. The figures for tax sharing are also quitesmall. Hence, the lack of revenue-raising through taxes by rural local governments isnoteworthy.
Comprehensive rural data disaggregated below the state level is scarce, but data atthe district level for Kerala (one of the more decentralized states with respect to rural localgovernments), illustrates several factors in the lack of revenue-raising through taxes bythese governments: (1) rates, (2) assessments, (3) coverage. These in turn are related tothe institutions and incentives of local government. The data for Kerala also provide
42 These figures, and the individual lists, are taken from Datta (1992), who compiled them from therelevant constitutional provisions.

30
further information on the structure of rural government taxes. The discussion of this datais supplemented with information on other states where possible.
Table XIII provides a breakdown of the per capita tax revenue, as well as othermajor sources of revenue for Kerala districts. There were 1001 panchayats in these 14districts, with an average population of about 22,000. The data include all major taxesand other major sources of revenue, except grants, for which districtwise data was notavailable. The variation in the amounts and pattern of revenues across the districts is nottoo large: this probably reflects the relative economic and social equality of Kerala. Thevariation in total per capita tax collections across districts appears to be positivelycorrelated with the degree of urbanization43.
TABLE XIIIBreakdown of rural government revenue per capita,
by district, Kerala , 1981-82 (Rupees)
Main tax sources
% Urban1991
Professiontax (Rs.)
Buildingtax (Rs.)
Entertain-ment tax
(Rs.)
Vehicle,show and
servicetaxes(Rs.)
Taxrevenue,
mainsources
(Rs.)
Non-taxrevenue
(Rs.)
Share ofduty onpropertytransfer
(Rs.)
Totalrevenue,
mainsources(Rs.)
Trivandrum 33.88 0.78 1.14 0.62 0.09 2.63 1.19 3.85 7.68Quilon 18.53 0.96 1.37 1.40 0.19 3.92 1.15 3.60 8.66Alleppey 30.46 0.91 1.47 0.69 0.20 3.28 0.95 2.53 6.76Pathanamthitta 13.05 1.15 1.83 0.52 0.25 3.75 2.12 4.72 10.60Idukki 4.72 1.56 2.36 0.89 0.07 4.88 1.00 2.43 8.31Kottayam 17.55 1.29 2.06 0.78 0.26 4.38 0.88 3.36 8.63Ernakulam 48.74 1.39 2.13 1.05 0.14 4.72 1.55 3.80 10.07Trichur 26.31 1.06 1.85 1.50 0.15 4.55 0.89 3.35 8.79Palghat 15.72 1.08 1.42 1.56 0.17 4.23 0.69 2.34 7.27Malappuram 9.12 0.62 0.99 0.97 0.11 2.69 0.98 2.05 5.73Kozhikode 38.34 1.05 1.42 1.27 0.10 3.84 0.89 1.83 6.56Wynad 3.41 1.22 2.57 2.35 0.12 6.26 1.47 2.70 10.43Cannanore 50.87 0.95 1.82 1.16 0.12 4.04 0.85 2.33 7.23Kasargode 16.45 0.79 1.39 0.84 0.03 3.06 0.94 2.37 6.37
State Average 26.39 1.03 1.61 1.10 0.15 3.89 1.07 2.95 7.91
Source: Compiled from Government of Kerala (1986), various tables. Percentage urban from Mathew (1994).
43 This statement is not based directly on the per capita figures reported, which used the population figuresin Government of Kerala (1986). Instead, since those figures appear to include urban populations, theywere adjusted by the percentage of urban population, in calculating a correlation coefficient of 0.64.
31
The building tax is the most important of rural taxes in Kerala, followed byprofession and entertainment taxes, with others being quite minor. The levy of the buildingtax is compulsory, with minimum and maximum rates fixed by the state government. Thisis typically the practice in other states as well: the building tax is the most common ofpanchayat taxes. In states with multiple tiers of rural government, the tax is levied by thelowest tier. The need for minimum rates is illustrated by the experience in Kerala. Theminimum rate was raised from 4 to 6 per cent of annual rental value in 1978, leading to a61 per cent increase in revenue from this source44 that year. Seventy per cent ofpanchayats taxed at the lowest possible rate in 1983-84: this reluctance on the part oflocal governments to tax as much as they are allowed is a general theme in descriptions ofIndian local governments, and is examined further in section V.
Besides tax rates, a significant dimension in determining the revenue from buildingtaxes is the assessed value. Aside from issues of the details of the system of assessment(often difficult where market transactions are rare or not well recorded), a commonproblem is simply outdated valuations. This is well illustrated by the Kerala example,where there was a jump of 51 per cent in building tax revenue in 1983-84, the year inwhich quinquennial assessment revisions were begun. Other states typically still fail toassess values systematically or regularly, making the tax rate itself of limited significance inaffecting revenue raised45.
Finally, the coverage of a tax such as the building tax is important for revenue.Here, the data is not detailed, but some egregious examples of exemption are provided forKerala (Government of Kerala, 1986, p. 21): twelve panchayats exempted 50 per cent ormore of buildings from the building tax. Another problem is the exemption of certaintypes of buildings from the tax: for example, in Haryana, all non-residential structures areexempt (Rajaraman et al, 1996).
Other rural property-based local taxes are possible, besides the building tax.Levies on non-agricultural land exist in several states, extending to agricultural land inBihar, Kerala and Punjab (Rajaraman et al, 1996). While there is considerable scope forrevenue from taxes on land, actual collections in most states are low (Tables V, XI, XII):in fact, this is true of state-level land taxes as well. Taxes on non-motorized vehiclescannot be a major source of revenue, but there is also scope for sharing motor vehicle taxrevenue (collected in urban areas) with rural local governments: currently, Kerala (TableXIII) is an exception in doing this. There are also a few instances of other property-basedrural taxes. D.S.K. Rao (1995) documents the success of a levy on agricultural pumpsetsin West Bengal, after the management of tubewells was transferred from the stategovernment to the panchayat level. Betterment levies or developmental charges, whichare common for urban local governments, are rare (Rajaraman et al, 1996).
44 Government of Kerala (1986), Table , p. 16. Such figures are typically not corrected for inflation, butthat has typically been in single digits in India.45 In some cases, the building tax is not even ad valorem, but a specific levy: see Rajaraman et al (1996).

32
Other rural data on taxes at a disaggregated level illustrates that taxes are relativelyimportant at the lowest level, but sometimes only as a significant fraction of low amounts.For example, for panchayats in the district of Nainital in Uttar Pradesh, in 1979-80,average revenues per block ranged from Rs. 0.2 to Rs. 1.2 per capita, with about 70 %coming from taxes (Shah, 1990). Reasons for such low figures include the poverty of thestate, particularly of hill districts such as Nainital, but also the relative centralization ofgovernment in Uttar Pradesh (Tables III and V). More recent data (1992-93) on 11panchayats in Saharanpur district of Uttar Pradesh provide own revenue figures (includingsharing of land revenue) of Rs. 96,750 per panchayat, with 36 % of that being raisedthrough taxes (Oomen, 1995, Appendix B). By this period, panchayats’ own revenueswere supplemented by substantial JRY grants from the center, which were 3.4 times ownrevenues in this sample. Oomen (1995, pp. 8-9) reports on two other studies, illustratingextremes of revenue-raising through taxes. Bankala panchayat in Sirmaur district ofHimachal Pradesh raised only 0.5 % of its expenditure on its own over the period 1985-90. In a sample of eight panchayats in Karnataka (a relatively decentralized state) for1991-92, taxes were 44 % of revenue, and over 50 % of revenue excluding JRY grants.The absolute amounts were also relatively large, though again there was great variationacross the eight panchayats, with the degree of urbanization playing a significant positiverole in both the amount of revenue raised and the proportion of revenue from taxes. Inthese data, the breakdown of revenue from different taxes is not available.
Disaggregated data on urban government tax revenues is more plentiful. Urbangovernments also had more tax instruments available to them. Datta (1992) notes that 20different taxes were available to urban governments, nine exclusively to them and 11concurrent with state governments. Unlike in the case of rural governments, several ofthese were significant taxes, with two of them, octroi (a levy on goods entering a localarea) and property taxes, accounting for 90 per cent of nationwide municipal tax revenue(70 per cent and 20 per cent respectively)46. For example, the towns of Ludhiana(described earlier) and Patiala (smaller, with a municipal committee) in Punjab received 72and 65 per cent, respectively, of their income from octroi in 1985-86, and 18 and 10 percent respectively from property taxes. Other common taxes included vehicle, professionand terminal taxes. Overall, taxes accounted for a major share of revenue, especially inlarger cities or in towns with corporations. This is illustrated in Table XIV for six cities47.Note that Chennai and Trivandrum relied on only two taxes for the bulk of revenue fromthis source, even when octroi was not available. The MCD of Delhi, had 16 taxes availableto it48, but only five of these were important.
46 Datta (1984) gives a somewhat different breakdown in Table I, p. 44: 54 per cent of urban localgovernment tax revenue from property taxes, and 41 per cent from octroi in 1976-77.47 Jetha (1992) provides some data on the overall importance of taxes for the states in which Ahmedabad,Trivandrum and Chennai lie: Gujarat, Kerala and Tamil Nadu, respectively. Tax revenue of urban localbodies as a percentage of current expenditure was 67.7 (Gujarat, 1989-90), 77.8 (Tamil Nadu, 1984-85),and 119.1 (Kerala, 1985-86). However, note that urban local expenditures were much smallerpercentages of state expenditures in Kerala and Tamil Nadu (Jetha, 1992, Table 2.4). See Table VI also.48 Of these, nine were compulsory, including taxes on property, theaters, vehicles, entertainment andproperty transfers, and a terminal tax (essentially equivalent to octroi). The terminal, entertainment andvehicle taxes were central government levies, shared by the MCD with the NDMC and one other local
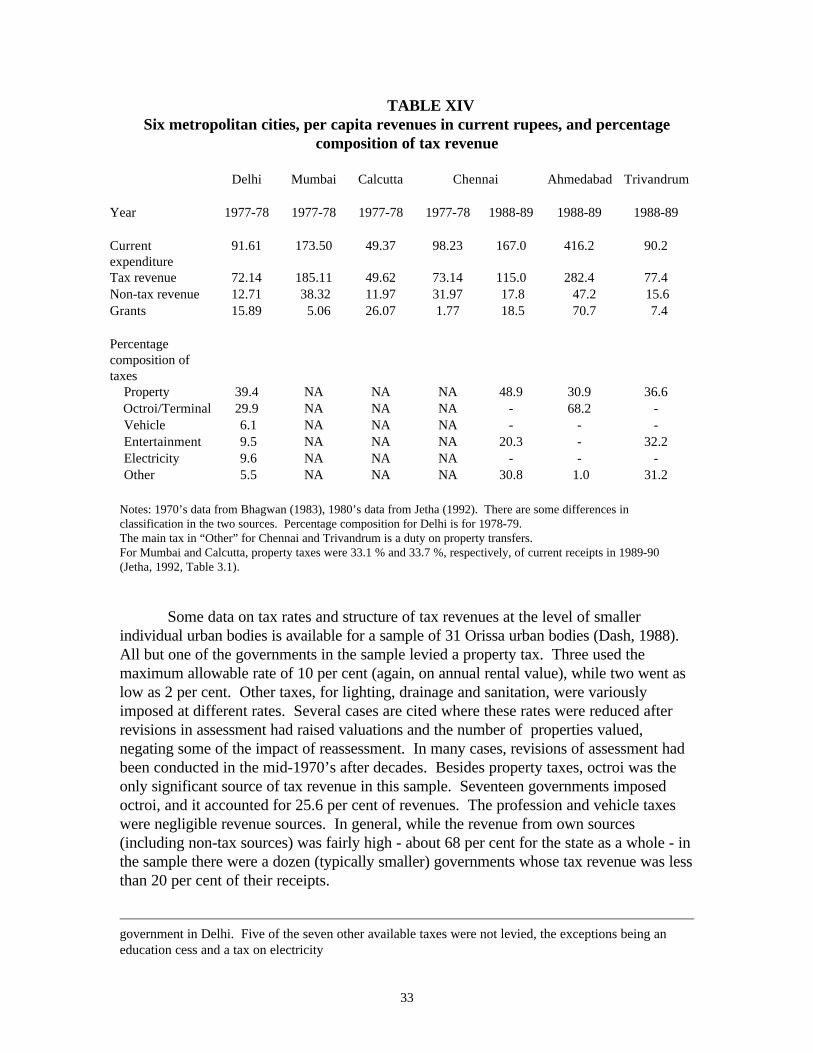
33
TABLE XIVSix metropolitan cities, per capita revenues in current rupees, and percentage
composition of tax revenue
Delhi Mumbai Calcutta Chennai Ahmedabad Trivandrum
Year 1977-78 1977-78 1977-78 1977-78 1988-89 1988-89 1988-89
Currentexpenditure
91.61 173.50 49.37 98.23 167.0 416.2 90.2
Tax revenue 72.14 185.11 49.62 73.14 115.0 282.4 77.4Non-tax revenue 12.71 38.32 11.97 31.97 17.8 47.2 15.6Grants 15.89 5.06 26.07 1.77 18.5 70.7 7.4
Percentagecomposition oftaxes Property 39.4 NA NA NA 48.9 30.9 36.6
Octroi/Terminal 29.9 NA NA NA - 68.2 - Vehicle 6.1 NA NA NA - - - Entertainment 9.5 NA NA NA 20.3 - 32.2 Electricity 9.6 NA NA NA - - - Other 5.5 NA NA NA 30.8 1.0 31.2
Notes: 1970’s data from Bhagwan (1983), 1980’s data from Jetha (1992). There are some differences inclassification in the two sources. Percentage composition for Delhi is for 1978-79.The main tax in “Other” for Chennai and Trivandrum is a duty on property transfers.For Mumbai and Calcutta, property taxes were 33.1 % and 33.7 %, respectively, of current receipts in 1989-90(Jetha, 1992, Table 3.1).
Some data on tax rates and structure of tax revenues at the level of smallerindividual urban bodies is available for a sample of 31 Orissa urban bodies (Dash, 1988).All but one of the governments in the sample levied a property tax. Three used themaximum allowable rate of 10 per cent (again, on annual rental value), while two went aslow as 2 per cent. Other taxes, for lighting, drainage and sanitation, were variouslyimposed at different rates. Several cases are cited where these rates were reduced afterrevisions in assessment had raised valuations and the number of properties valued,negating some of the impact of reassessment. In many cases, revisions of assessment hadbeen conducted in the mid-1970’s after decades. Besides property taxes, octroi was theonly significant source of tax revenue in this sample. Seventeen governments imposedoctroi, and it accounted for 25.6 per cent of revenues. The profession and vehicle taxeswere negligible revenue sources. In general, while the revenue from own sources(including non-tax sources) was fairly high - about 68 per cent for the state as a whole - inthe sample there were a dozen (typically smaller) governments whose tax revenue was lessthan 20 per cent of their receipts.
government in Delhi. Five of the seven other available taxes were not levied, the exceptions being aneducation cess and a tax on electricity

34
Problems with rates, assessments and coverage, noted in the case of ruralgovernments, are also pervasive in urban local bodies. In addition, there is data for citieson problems with collection, which compound the problems with rates and bases inrestricting tax revenues of local governments. Property tax rates were higher in the bigcities than in smaller towns or rural areas, with progressive structures, so that the marginalrate was as high as 30% in Ahmedabad. At the same time, these high rates were undercutby problems of failure to include properties in the base and of undervaluation for taxassessment. The problem of valuation in cities and towns is complicated by the existenceof rent control laws, combined with the use of annual rental value as the base for taxation.Rates of collection are often below 50 per cent for taxes such as those on property, beingas low as 17.8 % for Ahmedabad in 1990-91. Furthermore, these collection rates fellthrough the 1980’s49. While one can develop sets of normative criteria for reform ofurban local tax structure and administration (Jetha, 1992),implementing these requiresconsidering institutional incentives, and I return to this issue in section V.
The focus above has been on the property tax, because it is the most appropriatelocal tax in terms of minimizing distortions. On the other hand, octroi, which is soimportant for urban local governments, is inefficient, subject to corruption, andexcessively distortionary50. Some states have abolished it, but others have introduced it inrecent years. Madhya Pradesh and Karnataka replaced it with a state entry tax, which hassome of the same effects51. Part of the problem is that simple abolition of such a tax doesnot immediately provide local governments with a replacement source of revenue. Thoughin the longer run it may give them incentives to improve the collection of property taxes,this will not be an easy administrative task. In some cities and towns, particularly whereoctroi is not available, entertainment taxes provide significant revenue. While no singletax can replace octroi revenues, better use of taxes on entertainment, motor vehicles,professions and utilities, which are all reasonable local tax bases, can help collectively.Furthermore, local surcharges on state taxes such as sales taxes are also underutilized.Taxes on utilities such as electricity and water can be quite similar to user fees in practice:this category is discussed below.
To some extent, local tax reform has to be part of the national effort atrationalizing the tax system. Some taxes which are properly local are currently preemptedby state governments. Other taxes (for example, a surcharge on property transfer duty)are conveniently or effectively collected by the state government on behalf of localities,but the system of transferring or allocating the proceeds to local governments isinefficient. Considerable work has recently been done on reforming central taxes, withattention to how this will impact state level tax systems. Attention to local governments
49 See Jetha (1992), Table 3.3. Mumbai did relatively well, with a 72 % collection rate in the same year.Chennai, Calcutta and Trivandrum were in between these two extremes.50 The inefficiency and distortionary effects of octroi include high collection costs and the high taxation ofintermediate and capital goods. There are also problems of tax exporting in this case. See Jetha (1992,Ch. 6).51 An entry tax does economize on collection costs, using dealer returns instead of roadside checkposts.At the same time, the tax is no longer strictly a local tax.

35
can and should be a part of such ongoing attempts. The constitutional amendments, whileexpanding and formalizing the assignment of functional responsibilities to localgovernments, merely instruct the states to provide local governments with adequaterevenues or revenue instruments. This requires analysis of rates, bases and collection aswell as the nature and number of taxes that local governments are permitted to impose.Tax revenues are low because of incentive constraints as well as statutory ones. Finally,note that issues of local government revenue adequacy also require consideration of othersources as well as taxes.
FeesThe boundary between specific or earmarked taxes and fees or user charges is
somewhat arbitrary in the case of some goods provided by local governments. Theclassification partly depends on the closeness of the connection between usage andpayment: a pure public good where exclusion is impossible requires taxes. But in the caseof goods like water going to individual houses, users can be charged access fees as well asfor use - the latter if it can be monitored. In some states, local authorities use these formsof charges as well as taxes for water added on to property tax assessments. This taxrevenue may go into a general fund, however. The classification as tax or charge cantherefore also depend on the ownership or earmarking of the revenue52. With theseconceptual complexities acknowledged, I will proceed to follow the budgetaryclassifications used in discussing revenue from fees and user charges. I first treat rural andthen urban governments.
The state-level data in Table V show non-tax revenue that is considerably smallerthan tax revenue, except for Orissa and Kerala, and the numbers for Orissa in bothcategories combined are minuscule, being about Rs. 0.40 per capita. The most commonfees are user charges for water and lighting. These are typically collected at the lowestrural level and, in the absence of monitoring ability, are flat fees. On the other hand,charges for sanitation, or for public events such as fairs and festivals, are not frequentlyassigned or employed. Panchayats are also usually not empowered to levy user chargeson health and education53, even though aspects of these functions are assigned to them.Thus the general ability of panchayats to charge for services has been unduly limited.
Some more detail is available for Kerala. The per capita figure for Kerala fromTable V is about Rs. 2, but the number in Table XIII (from a different source) is only halfthis, and may exclude some revenue sources. The components of the numbers in TableXIII are income from panchayat properties, and licenses, fees and fines. The latterincluded a broad range of charges related to trade and commerce, therefore often similarto taxes in nature. The revenue from licenses, fees and fines was the smaller componentfor every one of the districts (though not necessarily at the individual panchayat level).For the state as a whole, the proportion of non-tax revenue from this source was 23 per
52 This principle is not necessarily followed in local government budgets: for example, Jetha (1992) treatsChennai’s lighting tax as a service charge, though it seems to go into general revenues. Revenue fromthis tax is therefore not included in Table XIV.53 Bihar, Haryana, Rajasthan and Uttar Pradesh are the exceptions. See Rajaraman et al, 1996.

36
cent. Income from panchayat properties was mainly derived from enterprises such asmarket complexes, shopping centers, lodgings and bus stands. Case studies by the statepanchayat finance commission suggested that these enterprises were indeed almost alwaysprofitable, though the rates of return were low.
For the sample of panchayats in Nainital district (Shah, 1990), tax was Rs. 328,000in 1979-80, dwarfing non-tax revenues of Rs. 23,000 from the land managementcommittee and Rs. 2,000 from the forest panchayat. The tiny latter figure is interestingbecause this is a region where deforestation is a serious problem. Forests are a major ruralresource, and were traditionally community property. Somanathan (1991) describes theseformer types of property structures, and their more recent erosion. This process istherefore partly reflected in the lack of income from what might have otherwise been asignificant panchayat asset. The lack is particularly significant given the economicstructure of the region, with little scope for non-agricultural/forestry activities, and henceof revenue from license fees for trade or similar charges. The generality of this problem ofassignment is noted by Rajaraman et al (1996). Only Gujarat and Maharashtra shareforest revenue with rural governments, in both cases with the highest, district-level tier,and at quite low rates. However, Gujarat allows for additional sharing with panchayats inforested areas, as a substitute for land revenue. This is a significant exception from whichother states can learn.
Turning to urban local governments, we see from Table VI that non-tax revenuevaried considerably across states, as a percentage of total state revenue. Figures in thetable imply percentages ranging from 0.5 for Bihar to 44.7 for Andhra Pradesh. Thecategories included in non-tax revenue were income from municipal property, incomefrom municipal enterprises, and interest on investments. In fact, little of the total wasderived from enterprises, except for some larger industrial or commercial cities in Gujarat,Maharashtra, Kerala and Tamil Nadu (Rao, 1986, p. 187). The pattern of municipalenterprises in Kerala was similar to that of rural government enterprises in the state, whichwere discussed above.
Per capita non-tax revenues for six cities in various years are reported in TableXIV: they are small relative to tax revenues, but not as low as in some other cases. InLudhiana, for example, various fees provided just about Re. 1 per capita in 1982-83,which was under 4 per cent of the corporation’s revenue. For Delhi, income fromproperty and license fees were the main contributors to non-tax revenue, while the MCD’swater and electricity supply enterprises ran deficits in 1977-78 and subsequent years(Bhagwan, 1983, Chapter 7). For Ahmedabad, Chennai, and Trivandrum, also, usercharges and fees provided only small fractions of the costs of providing water, sewerage,bus transportation and land development (Jetha, 1992, Chapter 4). In some cases, such aswater supply, the poor quality of the provision made charging difficult, either for technicalor political reasons. In the cases of bus transportation, health and education, distributionalconsiderations presumably play a role, with better-off citizens using and paying for privatealternatives. In such cases, the quality of the public service is often very low. The lowrates of cost recovery for land development, through charges or betterment levies, can not

37
be explained by concern for distribution: those being subsidized in this way are notrelatively poor. Estimates of the subsidies involved in urban land development are as highas 90 % (Jetha, 1992, p. 56).
Similar patterns exist in data for smaller urban areas. For the sample of 31 urbanlocal bodies in Orissa in 1975-76, on average 7.83 per cent of revenue came from incomefrom municipal property (Dash, 1988, p. 100), varying from a low of 2.12 per cent to34.75 per cent (Dash, p. 139). This variation appears to have been the result ofexogenous circumstances: whether the urban body owned valuable land and buildings ornot. Income from other municipal enterprises appeared negligible. This sample hadconsiderably lower non-tax revenue per capita than the figures for Orissa in Table VI:given that it included all of the largest of the state’s urban areas, this suggests that theremay be differences in classification in the two data sets. Again, little revenue was raisedfrom user charges and fees, and the quality of the services provided was often low.
Overall, fees are used more in urban areas than by rural governments, but are oftencloser to taxes in their application than to charges for services provided. Neither fees norgenuine user charges generate much revenue, as a proportion of the cost of serviceprovision, with one or two exceptions in large cities. Non-tax income in urban areas isoften generated from the ownership of property and buildings, but again, this is rarelysignificant. Municipal enterprises are also not a major source of revenue. The problem oflow recovery of costs through user charges and fees is not mitigated by provision throughspecial-purpose bodies. Urban water supply, bus transportation and land developmentauthorities all typically run deficits. There is evidence for urban bus transportation and forsolid waste management that private provision can be an effective alternative. In cases ofpublic provision, better regulation and administration are typically required.
Two final points are noteworthy. First, while the use of fees and charges in urbanarea is limited and in need of improvement, the fact that even smaller urban governmentsare sometimes able to successfully raise revenue from this source points the way forexpanding this method of revenue-raising by rural governments, including throughownership of local assets such as forests. Second, more generally, the problem of raisingrevenue from user charges and fees is related to the lack of incentives of governmentdecision-makers, as well as the low quality of provision of services. To repeat the pointmade in the case of taxes, the structure of institutions and incentives has to be addressed ifimprovements in local government revenue-raising are to occur.
TransfersTwo types of transfers are important in Indian fiscal federalism, whether between
center and states (where they are particularly significant) or between state and localgovernments. These are tax-revenue transfers and grants. Tables V, VI and X illustratedthe difference between rural and urban local governments with regard to transfers(typically from states), with grants being particularly important for rural governments54.The rationale for transferring tax revenues in whole or in part to a lower level government 54 See also Tables XI and XII, for rural government tiers.
38
can be in terms of lower collection costs at the higher level or coordination to avoid unduetax competition, the higher-level government acting as an agent for the lower level.Formula-based tax-sharing transfers also have the advantage over grants of rising with taxrevenues, while grants are typically not indexed for inflation. Considerations of fiscalcapacity or redistribution do not require that the form of the transfer be through taxsharing: block grants are then appropriate. If the higher-level government wishes toencourage lower-level revenue mobilization, matching grants can be used. And if it wishesto encourage spending in particular categories, specific or categorical grants areappropriate.
A key issue in such transfers is the amount of discretion involved. Dillingercomments, “Perhaps the most important measure developing countries can take is toreduce the unnecessary side effects of existing transfer programs - to reduce theuncertainty and bargaining that now accompanies intergovernmental financial flows andremove incentives for strategic behavior”55. Until the recent constitutional amendments,transfers from state to local governments have been largely at the discretion of stategovernments, though mandated in general form by individual state legislative acts.
Transfers from the central government to rural governments have increased sincethe time covered in Tables V and VI, due to the increase in poverty alleviation schemes(particularly the JRY), as well as developmental projects coordinated with the planningprocess. These transfers are to the district level rural governments, and passed down tothe lowest level, but are typically controlled by the state governments, since the districtlevel has served as an agency of the state government. The data is also not consistent onthese types of transfers: they may or may not show up as rural local government revenue(Table XI).
Of shared taxes at the rural level, the potentially important ones are duty ontransfer of property, land revenue, motor vehicle taxes and entertainment taxes. Some ofthese have been touched on in the discussion of local taxes, and there is no reason whyentertainment taxes should not be purely local, based on the nature of the service provided(cinemas). The duty on transfer of property is an important component, on average, ofstate government revenues, and panchayats typically share a surcharge imposed by thestate on this duty56, collected by the state along with the basic duty. Kerala’s exampleillustrates (Table XIII). The duty on transfer of property has been a major contributor tothe revenues of that state’s panchayats: for rural local governments in the state, thisrevenue source exceeded the contribution of any other single tax. Of the total revenue(pooled at the taluk, or intermediate level), 75 per cent was transferred to panchayatsaccording to population, while the remainder was according to other criteria such as area,resources and development needs. This kind of well-defined assignment and sharing of a
55 Dillinger (1994), p. 30. This point is also made in Rao (1992) and in other studies of transfers to localgovernments in India, as well as in the context of central-state transfers in India by Kletzer and Singh(1997).56 Gujarat and Rajasthan allow panchayats to levy these surcharges, with a state-imposed cap on the rate(Rajaraman et al, 1996, p. 1077).

39
tax is similar in many respects to the approach to central-state transfers by the centralfinance commission, but has been less common in state-local transfers. At the same time,it has the problem, common in central-state tax-sharing, of weak incentives for collection:distribution by origin would provide local governments with an incentive to aid incollection.
Revenue from agricultural land is, with two or three exceptions, only in the fiscaldomain of state governments. State governments give widely varying shares of this levyto rural local governments at one or more of the three tiers. This share is as much as100% in some states, and is typically divided among local governments by formulaesimilar to the one described for Kerala’s duty on property transfers. Thus, as emphasizedby Rajaraman et al (1996), incentives for collection are almost completely absent. This,together with political economy factors, has reduced the revenue from this tax tonegligible amounts, and there is a strong case for this tax to be made purely local.
Kerala is the only state that shares the state-level motor vehicles tax with rural aswell as urban local governments, though the amounts are relatively small (Table XIII), andpayments were made irregularly (Government of Kerala, 1986). However, there is aneconomic case for all state governments to do this: maintenance of rural roads is animportant panchayat responsibility everywhere, and the current system of fundingmaintenance, even in Kerala, is inadequate57. Similar arguments for sharing with ruralgovernments can also be made for state taxes on liquor and diesel fuel, which are sharedwith urban local bodies (Rajaraman et al, 1996).
Grants are significant for rural local governments, in relative if not absolute terms(Tables V, X, XI, XII). The later years’ data in these tables suggests that theirimportance, particularly at the local level, has been increasing: this is due to schemes suchas the JRY. However, even when spending is nominally at the local level, effective controlof the grant moneys has often been at the state government level. Thus, some of thedifferences among states in these tables may simply reflect accounting conventions ratherthan actual decentralization of funds.
Kerala provides a useful case study on state grants to rural local governments. Thedata in Table XIII do not include such grants, since this was not available by district.However, they are discussed in the panchayat finance commission report (Government ofKerala, 1986). In addition to statutory tax-sharing transfers, there were 26 types of non-statutory grants. Many of these were specific grants, for drainage, water supply,irrigation, road maintenance, and street lighting, for example. Some of these specificgrants had matching provisions. Others had distributional motives. At least one had acurious incentive structure: the establishment grant was paid to meet establishment costsin excess of a fixed percentage of “normal income” (recall the discussion in footnote 29).A large grant category was that of developmental activities, which includedcommunication, irrigation, and some facilities construction. Some of these “development”grants also had matching provisions, others did not: all were part of the Indian five-year 57 Recall the discussion of this issue in section III, on functional responsibilities.

40
planning exercise, and this led to a very lumpy payment of grants, with Rs. 100 millionbeing disbursed in 1980-81, and less than Rs. 40 million in total over the next four years.
The panchayats in the Kumaun hills region of Uttar Pradesh (Shah, 1990), did notreceive any tax-revenue share from the state in 1979-80. On the other hand, as in the caseof Kerala (and other states), grants were received for development purposes as part of theplanning process. These were matching grants for specific projects proposed bypanchayat officials, with funds coming from the intermediate level (block or area councils)or the state government Development Department. The potential grants at the districtlevel were large, exceeding tax revenues, but less than 20 per cent of the allotment hadbeen utilized, due to uncertainty about the actual level of funds that would be available toan individual panchayat. Later data from the same state (Saharanpur district, 1992-93,from Oomen, 1995, Appendix B) shows panchayats receiving some share of land revenue,but this and all other panchayat revenues being dwarfed by JRY grants.
Various case studies from Himachal Pradesh, Karnataka and Maharashtra,summarized in Oomen (1995), bear out the large and increasing role played by grantsrelative to other rural local revenue sources. While the variety of grant schemes is notedin these studies (similar to the case of Kerala), most grants seem to be specific in nature.The case studies also suggest the perverse incentive effects of these grants on revenueeffort by local governments. Exceptions are states such as West Bengal, which has asystem of incentive grants tied to the collection of state taxes and mobilization of smallsavings. However, even in West Bengal, JRY grants appeared as the main source ofrevenue at the highest rural local level, the district (Oomen, 1995, Appendix C), and areperceived as overwhelming state and local incentives (Oomen, p. 11). These studiessuggest that issues of tax effort, tax-sharing and user charges at the rural local level willrequire attention to the system of grants to local bodies.
Once again, data on transfers to urban governments is more plentiful58. Onaverage, for the states in Table VI, 3.7 per cent of revenue came from assigned or sharedtaxes, and 14.8 per cent from grants. Shared or assigned taxes for urban governmentsincluded duty on transfer of property, motor vehicle taxes and entertainment taxes. Grantswere mostly specific or categorical. Data on grants for six cities is provided in Table XIV.The tax revenue figures in this table include some shared tax revenues, and these werediscussed to some extent with other taxes. Trivandrum and Chennai relied more on sharedtaxes, while Ahmedabad received more grants: these differences were reflections ofdiffering statewide systems for transfers to urban local bodies. In Delhi, after 1970, theonly important transfer was statutory educational grants, which were close to 13 per centof total revenue for the MCD in 1978-79 (based on the central government providing 50per cent of recurring education expenditures).
Rao (1992) provides a detailed analysis of transfers to urban governments in fivestates: Gujarat, Kerala, Maharashtra, Tamil Nadu and West Bengal. Gujarat and Kerala’stransfers were relatively systematic, with Gujarat relying more on grants and Kerala on tax 58 In particular, the study by Rao (1992) is an excellent source.

41
sharing. Almost all grants in Gujarat were specific, with 19 grant categories in the mid-1980’s. For corporations - of which Ahmedabad is the largest - only five categories wereused, and the primary education grant constituted almost 74 % of transfers. Corporationsalso received money from an education cess and from entertainment taxes, the latterearmarked for capital expenditures. Municipalities’ main transfers were for primaryeducation (40 %), capital expenditures from entertainment tax revenue (25 %) anddearness allowance59 (16%), with small percentages from the numerous other specificgrants for various health and sanitation expenditures (Jetha, 1992, Table 5.1). Data forKerala’s transfers to urban local bodies reveal a pattern somewhat similar to that oftransfers to panchayats, but with greater autonomy. The main taxes were onentertainment (cinemas), professions, motor vehicles, and transfers of property. The firsttwo of these were assigned to urban local bodies, while the latter two were shared indifferent ways. Urban governments were permitted to levy a surcharge on the state dutyon property transfers, while the share of vehicle tax revenue was distributed as a specificgrant for road maintenance. Tax sharing was also the main transfer vehicle in Tamil Nadu,with entertainment and property transfer taxes being the main sources. Chennai alsoreceives a share of receipts from a sales tax surcharge, based on collections within the citylimits. Specific grants were relatively minor since the 1990 assumption of primaryeducation financing by the state government. For Maharashtra, 94 % of transfers in 1990were specific grants. The three most important categories being for education (29 % ofspecific grants), dearness allowance (21 %) and development grants to backward regions(15 %). Several grants, such as those to assist in debt servicing, were highly discretionaryin nature. The West Bengal transfer system shares some features with the other states:dearness allowance grants are significant (33 % of transfers), followed by education grants(13 %). Shared tax revenue is about equal to that of grants, with the entry tax (similar tooctroi) and entertainment tax providing almost all urban revenue from shared taxes.
Individual case studies round out the above picture. In Ludhiana and Patiala, inPunjab, general and specific grants from the state government made up about 10 per centof municipal income (Sachdeva, 1991). Sachdeva notes their inadequate levels, but alsopoints out several cases of lack of full utilization (p. 168) because of two barriers. First,expenditures had to be sanctioned by the state government’s Local GovernmentDepartment. Second, the work, in many cases, had to be carried out by a stategovernment department. In the sample of 31 urban local bodies in Orissa, grants andshared taxes made up about 30 per cent of revenue in 1975-76 (Dash, 1988, p. 115) orRs. 7.18 per capita, with most of this coming from grants. The largest category wasgrants given to meet a part of the dearness allowance of local government employees: thismade up 51.8 per cent of transfers. Other grants covered part of the base salaries of localgovernment employees. Dash also describes wide variations in grants across the urbangovernments in his sample, as well as over time. There was an absence of transparencyand certainty in such grants, leading him to state, “Thus the system of grants-in-aid is apolitical weapon in the hands of the State Government to control the working of urban
59 “Dearness allowance” is a cost-of-living-based component of income which is adjusted to compensatefor inflation, without the necessity of altering the base salary structure.

42
local bodies and to extend patronage...” (p. 119). Problems of lack of utilization of fundsare also described for this sample.
The situation for both rural and urban local governments is one where transfers areoften of limited value not just because of their small size, but more significantly because oftheir discretionary nature, leading to uncertainty and bargaining. This effect iscompounded by the incomplete nature of the transfers: strings being attached not only tocategories of expenditure, but also to specific details of implementation. One can arguesuch controls were necessary because of the lack of internal controls and expertise, andthis argument will be considered in section V. Furthermore, grants for specific categoriessuch as marginal personnel expenses section have obvious perverse incentive effects onexpenditure decisions. Distribution formulas used by states, while trying to achieve someequalization of resources for different local bodies, also tend to adversely affect incentivesfor collection. Finally, many transfers are discretionary, without clear economicrationales.
A simpler, more transparent system of transfers may be desirable and feasible, withmore tax sharing, and the use of fewer types of grants, with block grants to achieve equity.These changes that may be aided by the new legislation that mandates state financecommissions. While these will still be subject to the discretion of state governments, theexperience at the center and in states such as Kerala and Karnataka suggests that suchcommissions do, over time establish rules, conventions and precedents, and achievedegrees of certainty and transparency that might not obtain otherwise60.
BorrowingThe official literature on Indian government finance often distinguishes between
“developmental” and “non-developmental” or between “plan” and “non-plan” activities orexpenditures. The former dichotomy is conceptual, and the latter, in principle, reflects theinstitutional implementation of the former. However, distinctions made in this way canobscure the economically more fundamental distinction between capital and currentexpenditures. Investment expenditures whose benefits will accrue in the future are naturalcandidates for financing through borrowing, and, to the extent that many local servicesrequire infrastructure (local roads, street lights, parks), borrowing is potentially importantfor local governments. The efficiency argument for tax collection to be performed byhigher levels of government has some force for borrowing as well, but the incentiveproblems thus created can be severe. These issues will be taken up in the followingdiscussion of Indian local government borrowing. Of course, it should be noted thatborrowing is in a different category than the other three revenue sources considered, sinceit creates future expenditure (repayment) obligations.
60 This is no guarantee of optimality: grants with perverse incentives persisted in Kerala despite theexistence of its Panchayat Finance Commission. A further complication, which has also existed at thecenter-state level, is that the parallel set of discretionary transfers made for central sector and centrallysponsored schemes will continue. I return to these in considering borrowing.

43
TABLE XV
Municipal debt, in millions of current Rupees
1960-61 1976-77
Andhra Pradesh 17.9 66.8Assam 0.3 6.2Bihar 0.9 31.4Gujarat 4.4 109.7Haryana NA 22.7Himachal Pradesh NA NAKarnataka 1.6 34.3Kerala NA NAMadhya Pradesh 5.9 81.4Maharashtra 4.8 278.1Orissa 0.6 2.7Punjab 1.3 14.0Rajasthan 1.5 0.4Tamil Nadu 13.6 NAUttar Pradesh 5.4 11.0West Bengal 1.8 5.5
Total 68.0 667.7
Source: Rao (1986), Table 9.1, p. 231.Notes: Figures for 1960-61 are state loans only. Figures for 1976-77 include state loans (Rs. 378.1 million) and
market borrowing (Rs. 289.6 million). Figures for Punjab 1960-61 are for undivided Punjab (including Haryana).
Local government borrowing in India has been ad hoc and limited in nature.Tables V and VI on revenue sources do not include proceeds from borrowing. Table VIIIshows aggregate revenue surpluses for rural and urban local governments. While rurallocal governments have not been major borrowers, urban governments have increasinglygone into debt: hence Table VIII does not describe well the recent situation61. Table XVprovides some statewise data on stocks of municipal debt, which does give some idea ofthe extent of borrowing by urban local governments, and the diversity among the states inthis respect. The figures indicate that there have been differences in the growth of suchborrowing across states. Rao (1986) notes that close to 90 % of the debt was that ofcorporations (the urban governments of the larger cities), and of port trusts, the latter
61 Datta (1992, p. 152) calls these surpluses partly a “legal fiction, since local authorities are required topresent a surplus budget to meet contingent liabilities and actual shortfalls in revenues”. However, hegoes on to suggest that these surpluses may actually be real and large, motivated by two reasons:uncertainties in external aid which depress actual expenditures, and attempts to finance some capitalexpenditures from revenue surpluses. The first reason may explain why, according to Datta, “there is nodiscernible cycle of ... accumulation and utilization” of these surpluses. On the other hand, Jetha (1992)and Rao (1992) describe a situation where urban finances are less sound: postponed debt service paymentsare often not included in budget figures, leading to deficits being understated or hidden (Jetha, p. 13).

44
having large, specialized infrastructure requirements62. According to Rao, in 1976-77municipal debt was 10.1 % of their total income, comparable to the percentage for thecentral government, but substantially lower than the corresponding number for the stategovernments overall (58.4 % in 1975-76). Only 1.5 % of municipal borrowings in 1967were from the market (Rao, 1986). However, by 1976-77, over 40 per cent of the stockof municipal debt was the result of market borrowing. Hence, at least in some cases,there was a shift in the pattern of borrowing over the years. Yet the shift may beoverstated, to the extent that borrowing was from nationalized banks, or from othergovernment-owned financial institutions. Datta (1992) notes the weak distinction betweenloans made by state governments as part of the planning process, and institutionalfinancing of local projects, also routed through the states. He does put market borrowingsof corporations, with repayments ensured by mandated sinking funds, in a differentcategory. These issues will be taken up in looking at specific examples and case studies.
Case studies of rural government borrowing are from Kerala and West Bengal.The Kerala Panchayat Finance Commission report noted the practice of rural localgovernments incurring loans from the state’s Rural Development Board (RDB) forcreating remunerative assets. These projects, however, were required to be carried out bythe RDB itself. Examples of such projects were Rural Water Supply Schemes, for which,until 1984, 50 % of the capital cost came from the government-owned Life InsuranceCorporation of India as loans to the RDB, and 50 % from the state government.Panchayats were charged 25 % of the capital cost, in some sense a forced loan. In 1987,ownership of such projects was transferred to a specialized state-level water agency, andthe loan liability was also removed. This example indicates the institutional complexitiesof rural local government “loans”. I do not have data on the amounts of such RDB loans,but the report gives a figure of Rs. 2 to 2.5 million for annual loans directly from the stategovernment to panchayats. This represented a tiny fraction of the aggregate panchayatincome in the early 1980’s of Rs. 200 to 300 million, indicating the overall unimportanceof rural government borrowing even in Kerala.
West Bengal, like Kerala, has been one of the states most willing to decentralize.The National Rural Employment Programme (NREP) was a central government programdesigned to employ the rural poor in creating productive community assets which wouldfurther benefit the poor, as well as strengthening rural infrastructure in general63.Examples included rural roads, water supply schemes, minor irrigation and flood control,forestry projects, schools, houses, and panchayat offices. Funding for such projects wasto come from loans from the nationalized banks, as well as central government transfers.While this was a national initiative from the central government, implementation in WestBengal was significantly more decentralized, with plans being prepared starting withproposals submitted by the gram panchayats to the block level councils, which in turnmade consolidated proposals to the district councils. Execution, monitoring andmaintenance were also largely panchayat responsibilities in West Bengal, much more so
62 The breakdown given by Rao (1986) for 1967 was: city corporations, 50.8 %; port trusts, 41.1%;municipalities, 8.1 % (p. 232).63 Subsequently, this was consolidated along with other similar programs into the JRY.

45
than the national average64. While the familiar problem of lack of certainty in budgets wasalso present in this case (leading as usual to sporadic or low utilization of funds), localcontrol was more clear cut than in previous examples. Bank borrowing represented 30 %of proposed revenue for the Birbhum District Plan for 1989-90 (Lieten, 1992, Table N7.2,p. 218). Of course this was not market borrowing, being government directed throughnationalized banks, and with the state being ultimately responsible for payback, but it didrepresent borrowed resources over which rural local governments had control. This wasin contrast to other states where the lowest level of rural government (typically the onlydirectly elected level) had little role. However, even in West Bengal, rural localgovernments did not have access to borrowed funds in the same way that large urbangovernments did. Even district councils, representing populations as large as big cities,did not have the powers or legislative authority available to city corporations.
Other data on rural government borrowing is scarce, partly because it has beenvery limited. In the Kumaun hills region of Uttar Pradesh (Shah, 1990), borrowingappeared to be absent as a source of finance in 1979-80. This is not surprising, given thepoverty of the region: capital expenditures were typically made from state governmentgrants, often channeled through the higher tiers of rural government, and also ofteninitiated at a higher level. Oomen (1995, p.6) notes that Uttar Pradesh and Bihar nowhave Panchayat Finance Corporations which make investment loans to panchayats. Theircapital is contributed by rural governments, the state government, and public financeinstitutions. However, data in Oomen (Tables 1A, 1B) indicate very small percentages(under 1.5 %) of revenue from loans for panchayats in Himachal Pradesh, Orissa, andUttar Pradesh, and 3.5 % of revenue for the middle tier in Gujarat, though in some statesloans may be hidden in the “Other” category.
Borrowing is more significant for urban governments. I have noted that citycorporations have been the major source of urban local government borrowing (settingaside the special case of port trusts). For Delhi, in 1978-79, the MCD borrowed almost20 % of its current revenue (i.e., excluding the borrowing)65. A large part of this wascentral government loans for slum improvement schemes, responsibility for which hadbeen passed back and forth between the MCD and the DDA, as discussed in section II. Inthe early 1970’s borrowing was only 5 to 7 % of revenue. The debt burden - the amountdue on borrowings - was 4.4 % of revenue in 1978-79, lower than in previous years.However, the MCD began defaulting on loan payments almost every year from 1966-67.By 1979, 602 loan installments were overdue. These problems are not surprising if onenotes that in many years the MCD ran deficits on both its current and its capital account.In the 1980’s, city governments in Ahmedabad, Chennai, and Trivandrum often ran 64 In a sample conducted by the central Department of Rural Development, panchayats in West Bengalwere responsible for maintenance in 99 % of cases (India, 35%) and execution in 73 % of cases (India,42%). Local materials were used more in West Bengal than in other states, and a higher proportion ofprojects in the sample were deemed successful compared to the rest of the country. See Lieten (1992), p.221.65 The current revenue figure was Rs. 560.4 million. Current and capital expenditure figures for 1978-79were Rs. 637.7 million and Rs. 121.8 million respectively, indicating a deficit on each account for the year(Bhagwan, 1983, p. 43).

46
deficits on current and capital accounts, despite postponing debt service (Jetha, 1992,Table 2.5). Sources of capital finance were varied in these three cities. Grants were aminor source for Ahmedabad, which received substantial loans from the state government,the World Bank, and the Housing and Urban Development Corporation (HUDCO), aswell as public borrowing. Chennai and Trivandrum relied more on grants, though theKerala Urban Development Finance Corporation (KUDFC) was an important source ofborrowing for Trivandrum. To some extent, these cities were representative of patterns intheir respective states, though Tamil Nadu’s other municipal bodies relied more onborrowing than Chennai66.
There is similar evidence on borrowing for smaller towns and cities. Figures forLudhiana (Sachdeva, 1991, Table 8.6) show its corporation’s repayment of loans reachingas high as 11.1 per cent of expenditure in 1983-84, but then falling to 2.2 per cent or lessin the subsequent three years. However, this did not give a true picture of thecorporation’s finances, which are described as in a state of virtual bankruptcy in 1988,with large bills and loans outstanding. At the same time, loans from the state governmentwere made, but not used in a timely manner. Housing, water supply and sewerage projectsfor even the bigger Punjab cities were being handled by state government-created bodiessuch as the Housing Development Board and the Water Supply and Sewerage Board.These agencies borrowed from the Life Insurance Corporation (LIC), HUDCO, and theWorld Bank’s International Development Authority, and did implement some significantprojects. However, while municipal financial contributions were required, theimplementation and the recovery of costs from beneficiaries were subject to inefficienciesassociated with a lack of clear assignment of responsibilities.
In Orissa, also, water and housing projects were sometimes funded by stategovernment borrowing from the LIC and HUDCO, respectively. Urban local bodiesborrowed for these projects, as well as to finance sanitation projects, commercialinfrastructure, street lighting, and even arrears of employee dearness allowance. Theirloans came from the state government as well as the LIC. In the mid-1970’s, loans tourban local bodies in Orissa averaged about Rs. 2 per capita, quite small relative to the percapita current revenue of Rs. 45 reported in Table VI. Water supply projects were animportant case of loan financing, and the state government required two-thirds of theircosts to be met by local loans, arranged by the state, with one third in grants. However,execution of the projects was the responsibility of the state Public Health Department.Dash (1988) describes problems of implementation in this situation, with overdue andabandoned projects (p. 137) costing the local government, but not generating benefits orrevenue. The state government typically adjusted its grants to localities downward by theamount due on the loans. Local body chairmen in some cases expressed the view thatthese projects were forced upon them. Another feature in Dash’s sample was the failureto utilize borrowed funds in a timely manner, even though interest was being charged.Thus, while urban local borrowing was not large overall, it was not organized in a mannerconsistent with the efficient allocation of capital.
66 These statements are based on various tables in the Appendix to Jetha (1992).

47
These problems with local borrowing are especially noteworthy in light of thefairly stringent statutory restrictions placed on local governments in India. These includedrestrictions on rates, amounts, aggregate borrowing and length of terms. Individual loansrequire approval of the state and or the central government, as well as consultation withand approval of the Reserve Bank of India (RBI). Open market borrowings are alsosubject to higher level government and RBI supervision and approval (Datta, 1984, pp.77-78). Clearly, no system of monitoring and regulation is perfect, and credit markets areparticularly vulnerable, but the evidence suggests a misallocation of effort in some of thisregulation in India, resulting in a misallocation (not enough in some cases, in the wrongplace in others) of capital for local infrastructure. The constitutional amendmentsreforming local governments did not address the issue of local borrowing, and this isappropriate, in that the whole issue of financial sector reform needs to be tackled, withchanges at this level properly following other innovations. This will also be the time toaddress plan-related transfers: the central planning exercise has in some cases driven thekinds of schemes typified by the examples above, and these transfers have been theultimate source of funds for local infrastructure investment.
Assessment
I began this section by observing that expanded functional responsibilities for localgovernment would require additional revenue. Rural local governments rely heavily ontransfers from state governments for revenue. These transfers are often uncertain andrestricted in ways that make their effective use difficult. For the lowest rural tier, taxes area significant fraction of revenue. While even doubling revenue from this source would stillimply low per capita levels, assigning better tax instruments (Rajaraman et al, 1996) canaid in more efficient resource use at the local level (for example, through benefit taxessuch as market fees), and establishing a more effective tax administration can aid inbuilding institutional capacity. In some states, there are sufficient tax instruments assignedby statutes: the problems are in exercising statutory authority67, administering the tax, andestablishing a clear tax assignment. The first problem arises because of inefficiencies inservice provision, which may need prior improvement by other means. This will also setthe stage for more effective use of fees and user charges. The third problem arisesbecause the more significant sources of tax revenue are typically also assigned to stategovernments. Hence clearer rules for tax-sharing are essential, including completeassignment of taxes such as land revenue to the local level as a possibility .
The new state level finance commissions, modeled on the central financecommission and previous state-level commissions, will be crucial in achieving clarity,
67 The following quote from Shah (1990, pp. 137-38), on the nexus of responsibilities, revenues andinstitutions, is apt: “the Gaon Panchayats ... have been vested with considerable powers to raise theirrevenues. In addition to ...duties like sanitation, road repairing , street lighting, etc. the panchayats havealso the responsibility of developing the socio-economic life of the people...[P]anchayats, thoughempowered to levy taxes, have been ...slack in collecting them...[A]rrears could be realized as arrears ofland revenues. But no panchayat dares to take such repressive steps ... because it is bound to generatebitterness among the people against the panchayat personnel.”

48
transparency and certainty with respect to tax-sharing and grants to local governments.This will be beneficial in reducing the costs of bargaining and uncertainty, even if theamount of transfers does not increase. A removal of perverse incentives in such transferswill also help: data on administrative expenditures by local governments does not indicatethat local governments are always more efficient under current incentives. Since the statefinance commissions will take time to become operational and effective, the central financecommission, in its latest report, has allocated funds for local governments in itsrecommendations on transfers from the center to the states (Finance Commission, 1994).Borrowing for capital expenditures by rural local governments would be the last piece tofall into place, since it is predicated on a development of institutional capacity, as well asother financial reforms. Borrowing is unlikely to ever be significant at the lowest tier,because of its small size, but there is no reason why the upper two tiers of ruralgovernment, now given a more independent status, should not eventually follow in thefootsteps of municipalities in borrowing. Organizations such as Kerala’s RDB or DistrictRural Development Agencies in other states are a step in the direction of more transparentchanneling of capital for rural infrastructure, but are far from market-driven. This mattersto the extent that the criteria for making loans and for ensuring repayment are not efficientwithout some market discipline. The issue of the state government’s role as a guarantorof such loans, which creates a moral hazard problem for local borrowing, will have to beaddressed.
The issues for urban local government revenue are similar in nature, but theemphasis is different, given the different mix of their revenue sources, as well as theirdiffering responsibilities. For example, urban bodies have greater abilities to tax, andgreater scope for charging for services. The importance of taxes for urban bodies’revenue suggests that the payoff from improving the take from this source will berelatively high. To the extent that the property tax is less distortionary than octroi, theother main source of urban tax revenue, improving its enforcement and collection is apriority68. As in the case of rural governments, improving efficiency of service provisionmay be a necessary precondition or adjunct to more effective tax revenue raising andgreater reliance on user charges and fees.
Jetha (1992) and other studies emphasize the critical state of India’s urbaninfrastructure, reflecting both a lack and ineffective use of capital funds. For urban localgovernments, improving access to capital, through borrowing from the private capitalmarket, can perhaps follow more easily on improvements in revenue raising from taxesand fees: this precondition making repayment more feasible. Reliance on allocation ofcapital through a political process will then be lessened, as stressed by Dillinger (1994).Dillinger also discusses the possibility of municipal credit institutions, which have beentried in many countries, as a transitional approach to greater market reliance, creating anarm’s length between the government and the lending process. Such institutions havebeen suggested in India on several occasions - for example by the Rural UrbanRelationship Committee in 1966 - and their working in Kerala, Tamil Nadu and West 68 Recommendations for this can be found in several sources, including Datta (1984), Rao (1986), Jetha(1992), Sachdeva (1993), and Dillinger (1993).

49
Bengal is described in Rao (1992). Organizations like the LIC and HUDCO have playedsomewhat of an intermediary role in India, but to the extent that they also lend to stategovernments and their agencies (which may then make loans to local governments), theymay be less able to maintain the required distance from political considerations. Bodiesthat lend only to local governments would also avoid crowding out when stategovernments are also clients. This crowding out is likely when state governmentdepartments are providers of infrastructure, as is often currently the case. Finally, state -level municipal finance institutions may be better able to incorporate subsidies for smallermunicipalities, or allow cross-subsidization across different types of projects than nationalinstitutions with more diverse clients (Rao, 1992)69.
V. INSTITUTIONS AND INCENTIVES
Indian local government operates within an elaborate and quite well thought outsystem of legislation. Yet statutes cannot specify the minutiae of organizational detailrequired for efficient functioning. I shall take all the positives of local government in Indiasomewhat for granted, and focus on current problems and issues. The nature of theinstitutions that constitute local government is important70. Also, a persistent theme in thedescription of local government functions and revenues in sections III and IV has been theinteractions between different levels of government. These interactions have oftendamaged incentives, or even made them perverse. I therefore turn to this third piece ofthe puzzle in understanding local government in India.
Responsiveness and electoral accountability
Any democratic government can be thought of as an agent of its constituents. Assuch, the problem of organizational design for local government can be thought of as oneof setting this agent in a context that provides appropriate incentives for action. Thepractical complications make this a problem without a simple or unique answer, of course:there are multiple constituents with diverse preferences, and the agent itself is anorganization and not an individual. This means there are several different aspects toconsider. I shall not consider the diversity of preferences very much in the followingdiscussion. Although preference diversity is an important component of theories of why
69 On the other hand, a national level institution specialized in local level borrowing may be moreinsulated from state-level pressures for bailouts or rescheduling.70 For example, the 31 urban local authorities (municipalities and notified area committees) in Orissa inDash’s (1988) sample show considerable variation in receipts and expenditures per capita. While theseare each positively correlated with population size (with correlation coefficients of 0.36 and 0.33respectively), a regression to explain per capita receipts with a dummy variable for status (1 for amunicipality, 0 for a notified are committee), as well as population, makes the latter statisticallyinsignificant. In other words, the organizational form is important for revenue raising, rather than size, inthis sample of urban governments. This is also the conclusion in Rao et al (1985) for a study ofRajasthan.

50
decentralization can be welfare-enhancing71, my focus is to take this as given, and askwhat will make local government more effective than it has been in India till now. Inanswering this question, there are at least two levels of incentives to consider.
First, we can consider the provision of incentives to the government body as awhole. Accountability is the mechanism for providing these incentives, whileresponsiveness to constituent preferences is the expression of these incentives.Accountability comes from monitoring and auditing performance, and from rewards andpunishments based on performance. For democratic governments, the electoral process(“voice”) provides the most prominent reward-punishment mechanism, assuming there areattractive rewards associated with elective office, and that the basis for electoral judgmentis not too noisy. Of course, a different, more basic level of controls and accountability isprovided by the legal system, to prevent malfeasance or fraud.
The second level of incentives is within the government organization: not everygovernment employee can be elected72. Non-elected government personnel’s incentivesare then determined by conventional organizational devices: bonuses, promotions,terminations, and so on. To the extent that elected officials’ own incentives are powerfulenough, and they have the flexibility to act, they will seek to influence non-electedpersonnel to act in constituents’ interests also. Two fundamental departures from thismodel in the Indian local government context have been the lack of flexibility in designingincentives within local organizations, and the lack of direct electoral incentives for chiefdecision-makers at the local government level. Both these departures reflect the intrusionof higher level governments into the details of local action.
This brings me to a key aspect of local government incentives: the existence of ahigher level of government. In smaller countries, the national government lies directlyabove local governments. In India, of course, the state governments are the maininfluence on local governments. However, as noted in the overview, the dual role playedby the central bureaucracy (the IAS, as well as the Indian Police Service), with their statecadres but also a centralized ethos, complicates matters. In general, the lack of regular,direct local government elections in India, either because of the absence of legislativeprovisions, or because of the overawing of local elective institutions by state governments,has meant that state or central non-elected officials have often been key local governmentdecision-makers. This, does not mean an absence of incentives to be responsive, butinstead a less direct mechanism of accountability.
In such a situation, local political accountability might work something like this:constituents, rather than being able to vote out a city government, they are unhappy with,have to register their dissatisfaction about a non-elected agent of the state government
71 See, for example, Olson (1986) and Oates (1991).72 The issue here is presumably the relative efficiency of different incentive mechanisms: it is very costlyfor voters to assess the performance of each member in a government organization, especially when theorganization’s performance is a product of joint efforts. Appropriate electoral incentives for key personnelshould lead them to provide incentives in turn for their subordinates.

51
who is running the city. They complain to the lowest-level elected official available, theirMLA, who then pressures the bureaucrat as a way of being responsive to constituents.Such a process loses transparency and certainty, as compared to direct, open elections73.A further problem is the application of incentives at a higher level of government. Thestate-level politician represents a local constituency, but not just on local matters: she willalso participate in state-level policy making. This means that voters are not permitted todiscriminate as finely as they can when they can separately vote for local and for state-level elected officials, possibly weakening the responsiveness of government overall. Thiseffect is compounded if the local government is smaller than the smallest state governmentconstituency74. This is certainly true in India, where legislative constituencies in stategovernment (the constituencies of MLAs) correspond very roughly with the block or otherintermediate level of rural local government. But this is much larger than the smallestrural or urban local governments, so MLAs’ constituencies do not coincide with singlelocal jurisdictions.
The provision for regular elections at the local level in the recent constitutionalamendments - so that even if a local government is dismissed, fresh elections must be heldwithin six months - has the potential to increase the responsiveness and accountability oflocal government in a fairly obvious and direct way. While state governments maycontinue to try and postpone local elections when it suits them75, they will no longer havethe law on their side. If one accepts that direct electoral accountability is preferable tobureaucratic or indirect electoral accountability, then the above argument applies also tothe new requirement for direct elections at the upper two rural government tiers, and forvarious urban government forms. Replacing indirectly elected or nominated governingbodies with directly elected representatives has the potential to increase responsivenessand accountability by providing decision-makers with more direct incentives to pleaseconstituents.
It must be admitted that the empirical evidence for responsiveness is very limited,and in some cases responsiveness does not have positive outcomes. For example, Dash(1988, p. 223) gives examples of the Puri Municipal Council in Orissa providingreductions in or exemptions from octroi taxes to specific commercial products, benefitinglocal interest groups. Concerns about elite domination of elected rural local bodies have 73 Of course even elected local officials may be vulnerable to higher level interference. An example isrelated by a former senior civil servant in his memoirs (Sivaraman, 1991). He was serving in the Orissagovernment administration when a group of villagers petitioned him to overturn their panchayat’sdecision on some matter. Sivaraman refused, but found himself transferred soon after, when the villagers(presumably with some relationship that gave them clout) pressed their case with the state’s chiefminister. Still, elected local officials with a clear assignment of responsibilities are more likely to beinsulated from such pressures than are bureaucrats directly under the state administration: Sivaraman’stransfer illustrates bureaucrats’ vulnerability.74 A nice formalization of related ideas is in Seabright (1996), which also allows for uncertainty inoutcomes that affects the ability of voters to discriminate. In that paper, there is a tradeoff, sincecentralization may provide coordination benefits.75 This is what the Karnataka state government did with elections to the upper two rural tiers after beingthe first state to pass new legislation in conformity with the amendment. See Mathew (1994, pp. 102-103).

52
existed since independence, with examples being commonly observed, in academic studies(Crook and Manor, 1994, for Karnataka) and elsewhere (Naipaul, 1975, for westernIndia). All the case studies discussed in previous sections mention or imply the reluctanceof local governments to impose taxes, being responsive to their constituents in this respect(see footnote 67, for example). And Sachdeva (1991, Chapter 10) argues that localpolitics can simply reflect state level rather than local issues, weakening the incentives forlocal responsiveness. Finally, Bajaj and Sharma (1995) note problems of informationrequired to assess elected officials:
When village pradhans were entrusted JRY funds for construction of community assets, the village community at large did not have knowledge about the total funds received and the annual expenditure incurred on various projects. The pradhan and the village panchayat officer, who jointly operated the panchayat account, kept the details a closely guarded secret. (p. M-79)
Thus electoral accountability alone is not enough, and must be supplemented by othermeasures, so that local governments respond effectively, and to the right signals.
In fact, examples also illustrate that local government in India can overcomeproblems of elite domination and of monitoring to assess performance. Bajaj and Sharmago on to describe the resolution of the monitoring problem:
[The higher level] government made it mandatory for information to be posted publicly about the works executed, estimated and actual expenditure and savings if any. The displaying of relevant information on bulletin boards in public places and community halls resulted in community pressure on pradhans to account for public funds, and had the effect of many unfinished projects being rapidly completed.
With respect to elite domination, as long ago as 1965, Béteille observed, in his study of arural area of Tamil Nadu, “Adult franchise and Panchayati Raj have introduced newprocesses into village society” (p. 221), and “political and legislative changes have alteredthe bargaining positions of the old economic classes” (p. 223). Béteille argues that localelections increased the power of those who were worse off but in larger numbers, ratherthan perpetuating or increasing domination by the traditional rural elite. The final exampleis urban. While the Shiv Sena is better known for other aspects of its ideology, its successas a political organization has also been built on its attention to ward and municipalconstituencies in Mumbai: it has striven for and achieved electoral rewards by beingresponsive to those near the bottom of the economic ladder (Naipaul, 1975).
Monitoring and regulation
The example above from Bajaj and Sharma illustrates an important complement toelectoral accountability: the need to be able to monitor performance. This is a requirementwhatever the nature of the incentive system, electoral or bureaucratic. In the case ofelectoral incentives, there is a broad connection between those who are the beneficiaries,the monitors and the implementers of (electoral) rewards and punishments: these tasks areall done by citizens. There are incentive efficiencies in having these tasks performed bythe same individuals, since this avoids the need to provide incentives to delegated

53
monitors with different preferences. However, there are diseconomies associated withlarge numbers of principals and with lack of specialization. These factors create a role formore specialized monitoring and regulation, through watchdog groups, journalists andother media, and - where poor performance is connected to illegality - the police and thejudiciary.
The requirement for disclosure of information is a common and important exampleof regulation. Conceivably, it could be imposed by constituents themselves, but in theBajaj-Sharma example, and many other cases, disclosure requirements are imposed andenforced by higher levels of government, for reasons of economies of scale or scope or toensure commitment. In many cases, monitoring is also performed by another organization,rather than by constituents: essentially, one agent (for example, the financial auditor76)monitors another (the local government). There is no conceptual reason why suchauditing or monitoring has to be done by the state government. Some functions of thisnature can be and are performed by internal auditors or by private companies. Even ifmonitoring is done by a higher level government, it could conceivably be performed by thenext tier up, at least for the two lower rural tiers.
In practice, the state government in India is the main body for monitoring localgovernment performance. This is for two reasons: the state government is whereexpertise has been, and it is where true ownership or control of resources has been. Andyet, the case studies used in this paper (Bhagwan, Dash, Sachdeva, Shah) are replete withexamples of misuse of funds, through incompetence, malfeasance, or both. It is possiblethat focusing on selected examples gives a misleadingly gloomy picture, but one can notexcuse failures to follow basic accounting procedures, or outright misappropriation. Twolinked explanations are plausible. First, the level of auditing, both quantitatively andqualitatively, is inadequate. This seems to be borne out by the case studies, as well as thesurveys by Datta (1984) and Rao (1986), and applies not just to the identification ofirregularities, but also to the enforcement of minimum accounting standards. Second,more effort seems to be devoted to other kinds of monitoring rather than to auditing orperformance monitoring. Presumably, both these explanations can be traced to theweakness of the accountability of state governments for local government performance.
One simple way to phrase the problem of local government monitoring is todistinguish between input and output monitoring. There is no general case for preferringone over the other in the provision of incentives, but the case of local government in Indiaseems to be marked by excessive control of inputs and process, to the detriment ofattention to performance and outcomes77. Several examples were given in sections III andIV of detailed approval required from higher level governments for relatively small
76 The case of the media as monitor is somewhat different, in that they are not agents of citizens, butrather independent entrepreneurs in providing monitoring services.77 The choice between input and output monitoring is a complicated one, since certain means may beundesirable in themselves, if they involve corruption or illegality, even though the ends are thus achieved.Mookherjee (1997) analyzes these and other issues in a model of tax administration. See also thereferences in that piece.

54
projects or expenditures, sometimes as part of a top-down national and state planningexercise in which local governments had little input. At the same time, performance couldoften be neglected, with overdue and abandoned projects being commonly cited in thestudies referenced in this paper. I think it is useful to characterize this situation as animbalance in the types of monitoring used. To some extent, this imbalance may bechanged by direct electoral accountability of local governments.
The reference to the planning process above is significant, because the nature ofregulation of local governments in India has been driven by the overall top-down approachto economic policy, relying on the case-by-case discretion of government decision-makers,in areas such as industrial location and expansion, and the allocation of capital generally.The central government’s shift since 1991 from case-by-case regulation to setting generalregulatory standards may provide a model for reformulating state regulation of localgovernments. These issues have not really been addressed in local government reformlegislation, and will require some attention.
Control
The discussion of regulation raises the more general issue of control. We can thinkof this broadly in terms of ownership or property rights. Local governments in India havehad a very restricted locus of control or ownership. While the statutory assignment ofresponsibilities and authority has been ambitious, it has often overlapped substantially withstate government functions and revenue authority. Local decisions have often been madeby state or central bureaucrats. Requirements for approval of specific expenditures havefurther circumscribed the authority of local governments. Personnel practices andassignments have also been heavily state-controlled. Control of local land use (such as inthe example of forest resources discussed in section IV) is also often in the hands of stategovernments. A key issue in the development of local government will be whether theseloci of control change to any substantial degree, despite the absence of these issues fromrecent legislation.
Here, the recent legislative provision for regular local elections is potentially veryimportant. One reason for the lack of clear evidence on the positive effects of electoralaccountability is the paucity of extended periods of locally elected governments in manyplaces, as well as the lack of complementary powers (even elected governments wereseverely restricted in their actions). If elected local governments become the norm, this initself creates the possibility for more positive action, even without further legislativechanges. For example, an elected city mayor may have greater incentives to implementinfrastructure projects more effectively to please constituents than would a stategovernment bureaucrat. To attract capital for such projects78, there are incentives to bemore efficient in accounting and internal control. At the same time, external agencies mayhave an easier time dealing with elected governments that will be in office for a predictable
78 Of course this was something which the elected panchayat leaders in the example from Bajaj andSharma (1995) did not have to do, since they chiefly allocated funds received from higher levelgovernments.
55
amount of time79, making specialized state functional departments or specialized state-level agencies (such as housing or water supply boards) relatively less attractive aschannels for investment.
On the other hand, there will always be projects where economies of scale orspillover benefits indicate that greater efficiency will be attained by action at the statelevel. However, for the rural sector, the block and district levels may prove suitable formany larger scale actions, since they will have an independent existence and electoralsupport hitherto absent in almost every case. While the block and district levels have beenthe focus for plan implementation in rural areas, they have typically been (de jure or defacto) state agencies in this role, with effective control remaining at the state government(or even national) level. To the extent that, in the new system, local governments can actindependently of state agencies, jurisdictional conflicts such as in some of the examples insections III and IV can be avoided: such independence goes hand in hand with clearassignments.
State government control in the past has often been implemented by functionaldepartments at the state level. Even in states where local government legislation has givenmunicipal governments somewhat more nominal autonomy, this freedom has been limitedin practice by functional department control of municipal authorities. Bhattacharya(1972), in four case studies80, traces the reasons for this control partly to the role offunctional departments as providers of technical assistance. This supposed technical rolehas been motivated by concerns for efficiency - in turn driven by a perceived lack ofexpertise at the local government level. In practice, this has often translated into directcontrol of decision-making, rather than technical assistance coupled with performancemonitoring. The lack of well-designed systems of state-local transfers, discussed insection IV, has reinforced this tendency, since, in the absence of appropriate incentivegrants, direct control becomes relatively more appealing. While Bhattacharya discussesonly urban cases, the problems are similar for rural local governments. The solution, sincelocal governments will continue to require outside expertise, is to make sure that their newstatus gives them control in contracting for technical help, including going to the privatesector, the national government, or even other state and local governments as alternativesto their own state government.
Efficiency
The different aspects of institutions discussed so far, accountability, monitoringand control, ultimately matter to the extent that they improve efficiency in the provision ofpublic services. I close this discussion with a more explicit look at the connection between
79 The new legislation will presumably support this by curtailing incentives for state governmentsupersession of elected local bodies. Of course this is not a guarantee that dealing with local governmentbodies will become easy for outside funding agencies.80 The cases are water supply in Gujarat, primary education in Maharashtra, roads in Tamil Nadu, andhealth services in West Bengal. Bhattacharya characterizes Tamil Nadu’s municipalities as the leastautonomous, followed by Maharashtra, West Bengal and Gujarat.

56
accountability and efficiency. In the appendix, I analyze a simple model of government-citizen decision-making, adapted from Inman (1985). This model was originallydeveloped to analyze tax limitations imposed by voters in some states in the U.S. Therelevance here is the repeated observation for Indian local governments that their decision-makers are reluctant to impose higher taxes, or to collect existing taxes because they fearvoters’ displeasure. At the same time, the level of local public services is often perceivedas too low. The model displays this type of equilibrium. It also shows that increasingefficiency, perhaps even slightly, may lead to a very different equilibrium, with higherlevels of provision and higher welfare. The relevance to the above discussion is that iflocal government reforms provide an environment where the efficiency of provisionincreases through better regulatory structures81, there may be perceptible improvement inthe performance of local government in India.
The model also allows a comparison of full and partial accountability in a simpleway. In the model, partial accountability, which allows local government decision-makersto choose service levels given citizen demand, may be better for citizens than noaccountability at all, but it is also possible that partial accountability is no better forcitizens than the case of no accountability. Citizens are likely to be best off with fullaccountability, where citizens can choose service levels and rewards, given an acceptanceconstraint for competitive government decision-makers. Even with full accountability, theequilibrium may not be very desirable for citizens, and small increases in efficiency maysubstantially improve outcomes because of discontinuities in behavior.
The main lesson of the model in the appendix is thus to tie together in a simpleway the discussion of accountability and monitoring. Both electoral accountability andimprovements in regulatory mechanisms will be required for more efficient provision ofpublic services. The legislative reforms have reshaped the mechanisms of accountabilityfor local government, but the details of the new relationship between local and stategovernments will need to be worked out.
VI. CONCLUSION
This paper has focused exclusively on local governments, including theirinteractions with state-level governments and government agencies. The interplay ofassignments of functional responsibility, revenue authority, and organizational structureshas been stressed in examining past and possible future reforms of local government. It isuseful to conclude by relating these reforms to the country’s broader set of economicpolicy changes.
Reform of local government in India has had a different impetus and history thanthe changes put in motion by the 1991 balance of payments crisis. However, they areclosely connected by the issue of reducing fiscal deficits, and the management of 81 The model does not endogenize this link between regulation and efficiency, but this can presumably bedone along the lines of the approach taken in Mookherjee (1997) and the references therein.

57
government finances in general. It is now well recognized that the structure of fiscalfederalism in India has contributed to the overall problem of government deficits. Thestates, used to operating with soft budget constraints, have seen their finances deteriorate,and the post-reform squeeze has tended to reduce their spending on social and economicservices such as education and health. In this climate, there are real concerns about thefiscal impact of local government reform. For example, the recent World Bank countrystudy, in discussing tax reform, tax sharing and the disincentives for lower level resourcemobilization, offers the following caution:
The 73rd Amendment...is an important and welcome change, aimed at increasing the autonomy of local governments. However, it may accentuate fiscal indiscipline by establishing between states and local governments a system of transfers similar to theone in place between the central and state governments.
Related concerns, that the center will ultimately have to channel resources to localgovernments, directly and through the states, are expressed in the Tenth FinanceCommission report (Finance Commission, 1994, Chapters 10 and 15).
However, I think the Indian case offers some positive prospects, for the followingreasons. First, the decentralization is down to the local level, where smaller constituenciesmake it easier to impose hard budget constraints. Second, the quote from the World Bankstudy seems to neglect the fact that the central finance commissions have done a relativelygood job, within its constraints: greater problems have arisen with more discretionarytransfers, including categorical grants and loans. This has been the only system operatingbetween the state and local levels. The creation of state finance commissions has thepotential to reduce such discretionary transfers from the states to local governments, andto increase the transparency, certainty and, ultimately, efficiency of such transfers. Thestate commissions can also learn from the past, and avoid grant schemes with perverseincentives, such as those which pay for marginal personnel costs.
While making intergovernment transfers more efficient will help, raising resourcesmore effectively is crucial. Here also, the broader set of reforms may turn out to becomplementary to the reform of local government. One may think of the underlying goalof economic reforms in India as the achievement of a more efficient use of resources (andcapital in particular), to support higher growth. Reforms of trade, industry and financialmarkets are all, in some way, driven by this basic objective. Relying on smoothlyfunctioning (and well-regulated) financial markets to allocate capital, in this view, iscrucial for government as well as for the private sector. Historically, state and localgovernments have not been able to engage in market borrowing. Instead, they have reliedon top-down funding through the central planning process, which has often not beenresponsive to the wants of local residents. Since many municipal service projects involvelong-lasting capital and equipment, the building up of local capital has been hindered. Thecreation of urban local governments with independent status, legal authority and regularlyelected officials, raises the possibility that local governments may eventually be able toborrow money in the financial markets for local sanitation, roads and schools. Again, forthis to work, hard budget constraints must exist: municipalities should not be allowed to

58
expect a bail-out if they overspend. Clearly, this development will take time, but it shouldbe noted that the central government has taken the first steps towards market borrowingitself, representing a major break with past practice.
Improving the effectiveness of the tax system is another avenue for revenueenhancement, and is necessary for local government borrowing as well, since borrowingfor non-remunerative public projects requires future tax revenues to fund loan repayment.True representative government at the local level is more likely to be able to raise revenuethrough taxes, if the citizens thereby are able to more closely connect benefits receivedwith taxes paid. The discussion in section IV highlighted several respects in which theassignment and administration of local taxes might be improved. A third route forincreasing local governments’ revenues to meet their new functional responsibilities is usercharges. For many local government goods, user charges and fees can be quite close totaxes in practice, and both these sources of revenue have been constrained partly by theinefficient delivery of public services. Local governments with limited accountability, andtypically little freedom of action with respect to expenditures, have tended not to riskupsetting constituents by raising resources through these means, preferring to rely onwhatever funding they could obtain from higher-level governments. Constituents havebeen unwilling to pay more for an inefficient provision of services.
Ultimately, therefore, the primary issue to be considered is whetherdecentralization will permit the more efficient use of government funds. Greaterresponsiveness to constituents as a result of local democracy and decentralization shouldcertainly help. However, this paper has stressed that complementary reforms inorganizational structures, to improve incentives for government decision-makers, arenecessary to reap the full benefits of greater electoral accountability at the local level.Some possible changes are quite drastic, such as the transfer of existing staff from centraland state government to local government, and the reorganization of administration at alllevels. However, changing the incentives within existing institutional structures can alsohave a strong payoff. Together with some reallocation of personnel, this can mitigateconcerns that increasing local government responsibilities will require large increases in“establishment costs” (Rajaraman et al, 1996). Increasing efficiency of provision can bethe basis for more effective use of taxes and fees.
Whether increases in efficiency in local government are possible or likely remainsto be seen, but the outcome of even partial economic reforms at the national level has beento suggest that the idea of a low “Hindu rate of growth” may be a myth, and further gainsmay be feasible at subnational levels. India’s legislation for strengthening localgovernment did not (and could not) explicitly deal with all the details of incentives andinstitutional structures discussed in this paper, but it has paid attention to all threeelements of reform emphasized in the introduction: functional responsibilities, revenuesources, and structures of accountability, and may therefore have at least set the stage formore effective local government service provision.

59
REFERENCES
Aziz, A. (1993), Decentralised Planning: The Karnataka Experience, New Delhi: SagePublications.
Bajaj, J.L., and O.P. Agarwal (1992), “State Finances in Uttar Pradesh: 1965-90”, in StateFinances in India, ed., Amaresh Bagchi, J.L. Bajaj, and William A. Byrd, New Delhi:Vikas Publishing House.
Bajaj, J.L., and Rita Sharma (1995), “Improving Government Delivery Systems: SomeIssues and Prospects”, Economic and Political Weekly, May 27, M73-M80.
Bayley, David H. (1969), The Police and Political Development in India, Princeton, NJ:Princeton University Press.
Béteille, André (1965), Caste, Class, and Power: Changing Patterns of Stratification in aTanjore Village, Berkeley: University of California Press.
Bhattacharya, Mohit (1972), State Municipal Relations, New Delhi: Indian Institute ofPublic Administration.
Crémer, Jacques, Antonio Estache and Paul Seabright (1995), "The Decentralization ofPublic Services: Lessons From the Theory of the Firm", in Decentralizing Infrastructure:Advantages and Limitations, ed., Antonio Estache, World Bank Discussion Paper 290.
Crook, R., and J. Manor (1994), Enhancing Participation and Institutional Performance:Democratic Decentralization in South Asia and West Africa, Report to OverseasDevelopment Administration, U.K.
Dash, Gokulananda (1988), Municipal Finance in India: Based on Orissa, New Delhi:Concept Publishing.
Datta, Abhijit (1992), “Local Government Finances: Trends, Issues and Reforms”, in StateFinances in India, ed., Amaresh Bagchi, J.L. Bajaj, and William A. Byrd, New Delhi:Vikas Publishing House.
Datta, Abhijit (1984), Municipal Finances in India, New Delhi: Indian Institute of PublicAdministration.
Dillinger, William (1994), Decentralization and Its Implications for Urban ServiceDelivery, UNDP/UNCHS/World Bank Urban Management Programme Discussion Paper,UMP 16.
Dillinger, William (1993), Property Tax Reform: Guidelines and Recommendations,UNDP/UNCHS/World Bank Urban Management Programme Discussion Paper, UMP 1.

60
Finance Commission (1994), Report for 1995-2000, Government of India: New Delhi.
Galanter, Marc (1989), Law and Society in Modern India, Delhi: Oxford University Press.
Government of Karnataka (1989), Report of the Finance Commission for Zilla Parishadsand Mandal Panchayats, Bangalore: Govt. of Karnataka.
Government of Kerala (1986), Report of the Panchayat Finance Commission,Trivandrum: Govt. of Kerala .
Inman, Robert P. (1985), “The ‘New’ Political Economy”, in Handbook of PublicEconomics, Volume 2, ed., Alan Auerbach and Martin Feldstein, Amsterdam: NorthHolland.
Jetha, Nizar (1992), “Financing of Municipal Services in India: Selected Issues”, WorldBank Report No. 10452-IN.
Jetha, Nizar (1992a), “Gujarat State Finances”, in State Finances in India, ed., AmareshBagchi, J.L. Bajaj, and William A. Byrd, New Delhi: Vikas Publishing House.
Kletzer, Kenneth and Nirvikar Singh (1997), "The Political Economy of Indian FiscalFederalism", forthcoming, Fiscal Policy in India, ed., Sudipto Mundle, New Delhi:Oxford University Press.
Lieten, Georges K. (1992), Continuity and Change in Rural West Bengal, New Delhi:Sage Publications.
Mathew George (1994), ed., Status of Panchayati Raj in the States of India, 1994,Institute of Social Sciences, New Delhi: Concept Publishing Company.
Mookherjee, Dilip (1997), “Incentive Reforms in Developing Country Bureaucracies:Lessons from Tax Administration”, paper presented at Annual World Bank Conference onDevelopment Economics, Washington, D.C., April 30 and May 1.
Mookherjee, Dilip (1993), "Redefining the Economic Role of the State: The Role of'Positive' and 'Negative' Institutional Reforms in India", paper presented at conference onEconomic Liberalization in South Asia, University of California, Berkeley, April.
Musgrave, Peggy, and Richard Musgrave (1984), Public Finance in Theory and Practice,New York: McGraw Hill.
Naipaul, V.S. (1975), India: A Wounded Civilization, New York: Alfred Knopf.

61
Oates, W. (1991), "Principles of Fiscal Federalism: A Survey of Recent Theoretical andEmpirical Research", IRIS Working Paper No. 21, University of Maryland, College Park.
Olson, M. (1986), "Toward a More General Theory of Governmental Structure",American Economic Review, May.
Oomen, M.A. (1995), “Panchayats and their Finances”, Institute of Social Sciences Paper,New Delhi.
Ostrom, Elinor, L. Schroeder, and S. Wynne (1992), Institutional Incentives andSustainable Development, Boulder, CO: Westview Press.
Pande, A.K. (1994), “Flow of Funds in Panchayat Benkala During the Seventh Five YearPlan”, Journal of Rural Development, v. 13(2).
Rajaraman, Indira, O.P. Bohra, and V.S. Renganathan (1996), “Augmentation ofPanchayat Resources”, Economic and Political Weekly, May 4, 1071-1083.
Rao, D.S.K. (1995), “Farmer Management of Public Tubewells in West Bengal”,Economic and Political Weekly, September 30, A117-A122.
Rao, M. Govinda (1997), “Intergovernmental Fiscal Relations in a Planned Economy: TheIndian Case”, processed, Australia South Asia Research Centre, Research School ofPacific and Asian Studies, Australian National University.
Rao, M. Govinda (1995), "Fiscal Federalism in India: Problems and Prospects",forthcoming, Sudipto Mundle (ed.), Fiscal Policy in India, New Delhi: Oxford UniversityPress.
Rao, M. Govinda (1994), "Intergovernment Transfers in India", processed, paperpresented at Conference on Fiscal Transfer Systems, Qingdao, China, July 25-29.
Rao, M. Govinda (1992), “State Government Transfers to Urban Local Bodies”,processed, National Institute of Public Finance and Policy, New Delhi.
Rao, M. Govinda, G. Pradhan and O. P. Bohra (1985), " Alternatives to Octroi inRajasthan" , processed, National Institute of Public Finance and Policy, New Delhi.
Rao, N. Rajagopala (1986), Municipal Finances in India (Theory and Practice), NewDelhi: Inter-India Publications.
Sachdeva, Pardeep (1991), Dynamics of Municipal Government and Politics in India,Allahabad: Kitab Mahal.

62
Sachdeva, Pardeep (1993), Urban Local Government and Administration in India,Allahabad: Kitab Mahal.
Seabright, Paul (1996), “Accountability and Decentralization in Government: AnIncomplete Contracts Model”, European Economic Review, 40, 61-89.
Shah, B.L. (1990), The Role of Panchayats in Integrated Rural Development, New Delhi:Cosmo Publications.
Singh, Nirvikar (1997), “Governance and Reform in India”, Journal of InternationalTrade and Economic Development, June.
Singh, S.S. and Suresh Misra (1993), Legislative Framework of Panchayati Raj in India,New Delhi: Intellectual Publishing House.
Sivaraman B. (1991), Bitter Sweet: Governance of India in Transition, New Delhi: AshishPublishing House.
Somanathan, E. (1991), “Deforestation, Property Rights and Incentives in CentralHimalaya”, Economic and Political Weekly, January 26, PE37-PE46.
Venkatarangaiya, M., and M. Pattabhiram (1969), Local Government in India: SelectReadings, Calcutta: Allied Publishers.
World Bank (1995), India: Recent Economic Developments and Prospects, Washington,D.C.: The World Bank.

63
APPENDIX
The model is of a single politician-bureaucrat and a single citizen-voter. The choicevariables are the level of public service provision (quality adjusted), denoted x, and the perunit wage of the politician, denoted w. The politician’s income is y = wx. The effortrequired to produce x is e=rx, where r is an efficiency parameter. The utility functions ofthe two individuals are:
Politician: U(y, e) = u(y) - c(e) = u(wx) - c(rx)
Voter: V(x, y) = v(x) - k(y) = v(x) - k(wx)
u, v are strictly concave; c, k are strictly convex. All functions are twice differentiable.
Competitive provision
Suppose that both sides take w as given, and choose their optimal x as a function of w.The first order conditions are Ux = 0 and Vx = 0. Given the concavity of the functions,these are sufficient for local maxima, and can be solved respectively to give xs(w, r), thesupply function, and xd(w), the demand function.
The supply function is upward sloping if yu′′/u′ < 1, while the demand curve is alwaysdownward sloping.
Furthermore, each side has a reservation utility, U0 and V0 respectively. The latter can beequal to V(0, 0), i.e., the absence of public services. If the solution to the first ordercondition is below the reservation utility, the global maximum is zero. Figure 1 shows theindividual optima and an interior competitive equilibrium.
FIGURE 1
Politician Voter Equilibrium

64
No accountability
Several alternative situations of control are possible. If the politician is monopolistic, andchooses x and w subject only to the constraint that V ≥ V0, a possible equilibrium is shownin Figure 2.
FIGURE 2
Partial accountability
Possibly somewhat better for citizens is the case where the politician also faces theconstraint that x = xd(w). Figure 3 shows two cases. On the left, only the demandconstraint is binding. The voters are better off than in Figure 2, but with a lower level ofpublic services than in the full monopolistic case. On the right, however, both constraintsare binding, and voters are not only no better off, but they have a lower level of publicservices. In fact, the outcome is not on the Pareto frontier. This case, perhaps, looselyapproximates the state of Indian local government, with partial accountability only.
FIGURE 3

65
Yet another possibility is that citizens can choose their optimal combination of xand w, given a competitive supply of politicians. Two cases are shown in Figure 4.Again, provision of public services is suboptimal, but citizens are actually better off than inthe full competitive case of Figure 1.
FIGURE 4
Efficiency
Increases in efficiency of public good provision in this model are reductions in theinput requirement parameter r. It is easy to check that xs
r(w, r) < 0, so that increasingefficiency shifts the supply curve to the right. A case where a relatively small increase inefficiency leads to a substantial increase in the level of service is shown in Figure 5.
FIGURE 5
In this model, equilibria with a low level of provision of public services may not beworse for citizens, since they pay less also. However, if there are many citizens enjoying anonrival good, the low-service equilibrium may be worse for them, due to the inability tocoordinate.