issues pertaining to cane supply reliability and
TRANSCRIPT

ISSUES PERTAINING TO CANE SUPPLY RELIABILITY
AND STOCKPILING AT THE UMFOLOZI SUGAR MILL
– MODEL DEVELOPMENT AND APPLICATION
GLN Boote
Submitted in fulfilment of the requirements
for the degree Master of Science in Engineering
Faculty of Engineering
University of KwaZulu-Natal
22 August 2011
Supervisor: Prof. Carel Bezuidenhout
Co-supervisor: Prof. Peter Lyne
EXAMINAR‟S COPY

ii
DECLARATION
As the candidate‟s Supervisor I agree/do not agree to the submission of this thesis.
Supervisor: ________________________ Date: _____________________
I ................................................................................ declare that
i) The research reported in this dissertation/thesis, except where otherwise
indicated, is my original work.
ii) This dissertation/thesis has not been submitted for any degree or
examination at any other university.
iii) This dissertation/thesis does not contain other persons‟ data, pictures,
graphs or other information, unless specifically acknowledged as being
sourced from other persons.
iv) This dissertation/thesis does not contain other persons‟ writing, unless
specifically acknowledged as being sourced from other researchers.
Where other written sources have been quoted, then:
a. their words have been re-written but the general information
attributed to them has been referenced;
b. where their exact words have been used, their writing has been
placed inside quotation marks, and referenced.
v) Where I have reproduced a publication of which I am an author, co-
author or editor, I have indicated in detail which part of the publication
was actually written by myself alone and have fully referenced such
publications.
vi) This dissertation/thesis does not contain text, graphics or tables copied
and pasted from the Internet, unless specifically acknowledged, and the
source being detailed in the dissertation/thesis and in the References
sections.
Signed: ________________________ Date: _____________________

iii
ACKNOWLEDGEMENTS
Prof. Carel Bezuidenhout and Prof. Peter Lyne, University of KwaZulu-Natal, School of
Bioresources Engineering, for their professional guidance and support for the duration
of my research.
Prof. Alan Hansen, University of Illinois, Department of Agricultural and Biological
Engineering, for providing me with the opportunity to participate in the exchange
program with the University of Illinois, and for providing useful advice during my
literature review.
The South African Sugar Research Institute (SASRI) for the necessary funding and
student subsistence required for the research.
The Umfolozi Sugar Mill, in particular Dr. Adey Wynne and Mr. Carl Allsopp, for their
support of the research and assistance in the organisation of meetings and workshops.
Mr. Lawrence McGrath, from the Umfolozi Sugar Planters Ltd (UCOSP), for the
sharing of technical information and data regarding the operation of the Umfolozi
tramway system.
The School of Bioresources Engineering and Environmental Hydrology, for providing
me with the knowledge and skills to participate in postgraduate research.

iv
ABSTRACT
The co-owned Umfolozi Mill area has developed as an integrated supply chain. Cane
supply reliability was identified as a potential area for productivity improvement at
Umfolozi. It is important that the cane supply to a sugar mill arrives at a steady and
reliable rate. A reliable cane supply ensures that the mill can operate at an optimum
efficiency. Sugarcane supply reliability depends on how the mill area adapts to
unforeseeable changes in the supply chain. An important aspect to this is the weather
and how it affects the harvesting regimes. The sugarcane supply chain at Umfolozi is
divided into two branches, road transport and tram transport. The trams account for
70 % of the cane delivered to the mill and the can is sourced from a climatically
homogenous region. In the occurrence of a rainfall event of above 5 mm, infield
harvesting cannot take place on the Umfolozi Flats; hence 70 % of the mill‟s supply is
halted for one or more days. To address the problem, a stochastic model was created to
simulate the effectiveness of an enlarged cane stockpile if it were maintained on the
current tram sidings outside the mill and were crushed when wet weather prevented
further harvesting. The stockpile was simulated on a first-in first-out principle and was
able to supply the mill with enough cane to continue running for 24 hours. The model
was then used to conduct a series of Monte Carlo simulations on which sensitivity
analyses and economic feasibility assessments were carried out. Results show that the
stockpile was effective in reducing the length of milling season and the number of no-
cane stops. However, on further analysis into the implications of creating a stockpile it
was found that 1% recoverable value (RV) was lost during the 24-hours that the cane is
stored outside the mill. The loss in revenue as a result of the RV reduction had a
negative impact on any savings created with the implementation of the stockpile. This
result made apparent the negative impact of deterioration to the whole supply chain.
Further research is required to determine more accurately the rate of deterioration, and
therefore, quantify more accurately the losses that occur in the supply chain. A
significant outcome of the study was the development of a mechanistic tool which drove
decision making at Umfolozi Sugar Mill. It lead to the development of the modelling
framework LOMZI, a simulations based framework which places more emphasis on
environmental factors and risks.

v
TABLE OF CONTENTS
Page
1. INTRODUCTION ................................................................................................ 1
2. AN OVERVIEW OF CAUSE AND EFFECTS WITHIN TRAMWAY
TRANSPORT SYSTEMS AND SUGAR MILL ................................................. 3
2.1 Sugarcane Tramway Systems ................................................................... 3
2.1.1 Tramway layout ............................................................................ 3
2.1.2 Tramway operation ....................................................................... 4
2.2 Sugar Mill Systems ................................................................................... 6
2.2.1 Input factors .................................................................................. 9
2.2.2 Output requirements .................................................................... 10
2.3 Juice Extraction ....................................................................................... 11
2.3.1 Cane knifing ................................................................................ 11
2.3.2 Shredding .................................................................................... 11
2.3.3 Milling ......................................................................................... 12
2.3.4 Diffusion ..................................................................................... 12
2.4 Energy Production and Consumption ..................................................... 14
2.5 Juice Clarification ................................................................................... 16
2.5.1 Screening ..................................................................................... 16
2.5.2 Heating ........................................................................................ 16
2.5.3 Clarification ................................................................................. 17
2.5.4 Filtration ...................................................................................... 18
2.6 Juice Evaporation and Crystallisation ..................................................... 18
2.6.1 Evaporation ................................................................................. 18
2.6.2 Condensers and vacuum equipment ............................................ 19
2.6.3 Syrup clarification ....................................................................... 20
2.6.4 Crystallisation ............................................................................. 20
2.7 Cooling Crystallisers ............................................................................... 21
2.8 Centrifuging ............................................................................................ 22
2.9 Drying ..................................................................................................... 22
2.10 Discussion and Conclusions ................................................................... 22
3. METHODOLOGY – MODEL DEVELOPMENT, ASSUMPTIONS AND
DATA ANALYSIS ............................................................................................. 24

vi
3.1 Umfolozi Mill and LOMZI ..................................................................... 24
3.2 Rainfall receiver operating characteristics analysis ................................ 27
3.3 Mill Mechanical Breakdowns ................................................................. 31
3.4 Mill Crush Rate ....................................................................................... 32
3.5 Stockpile Size and Rate of Replenishment ............................................. 33
3.6 Cost of No-cane Stops ............................................................................ 34
3.7 Recoverable Value (RV) Data Input ....................................................... 34
3.8 Sucrose Deterioration in the Stockpile ................................................... 36
3.9 Capital Investment and Budgeting .......................................................... 39
3.10 Simulations ............................................................................................. 40
4. RESULTS AND DISCUSSION ......................................................................... 42
4.1 Stockpile Simulations ............................................................................. 42
4.2 Cane Deterioration .................................................................................. 49
4.3 Discussion ............................................................................................... 52
5. CONCLUSIONS AND RECOMMENDATIONS FOR FUTURE
RESEARCH ........................................................................................................ 53
5.1 Conclusions ............................................................................................. 53
5.2 Recommendations for Further Research ................................................. 54
6. REFERENCES ................................................................................................... 56
7. APPENDICES .................................................................................................... 62

vii
LIST OF FIGURES
Page
Figure 2.1 Tram truck infield haulage ........................................................................ 5
Figure 2.2 Setting a loaded tram truck back onto the tram lines ................................ 6
Figure 2.3 Generic steps of raw sugar production (after Engelbrecht et al., 2009) ... 8
Figure 3.1 Factors considered in the LOMZI model at Umfolozi Mill .................... 25
Figure 3.2 Orthophoto of the Umfolozi Sugar Mill with an insert of the tram
siding where the stockpile is to be created. ............................................ 26
Figure 3.3 Umfolozi Sugar Mill and tram sidings where the stockpile will be
created. .................................................................................................... 27
Figure 3.4 ROC graph used to determine the most suitable rainfall limits that
indicate wet field conditions at Umfolozi ............................................... 28
Figure 3.5 Markov probabilities for the Umfolozi Land Owners Association
rainfall station ......................................................................................... 29
Figure 3.6 Rainfall depth probability i.e. the type of rainfall that can be expected
during the season .................................................................................... 30
Figure 3.7 Distribution of mill breakdown data from the previous three seasons ... 32
Figure 3.8 Variation of RV% cane at Umfolozi Sugar Mill .................................... 35
Figure 3.9 Average daily temperate at Umfolozi ..................................................... 37
Figure 4.1 Average quantity of cane present in the stockpile (tons) throughout
the season (cane deterioration excluded) ................................................ 43
Figure 4.2 The simulated trend between LOMS, the number of wet field days
and the implementation of a stockpile at Umfolozi Mill (cane
deterioration excluded) ........................................................................... 44
Figure 4.3 The simulated trend between total number of no-cane stop hours, wet
field days and the implementation of a stockpile at Umfolozi Mill
(cane deterioration excluded) .................................................................. 45
Figure 4.4 The potential savings materialised when implementing a stockpile
against the number of wet field days (cane deterioration excluded) ...... 46
Figure 4.5 A histogram of 1000 seasons of total saving due to stockpiling at
Umfolozi (cane deterioration excluded) ................................................. 47
Figure 4.6 Seasons to break even with change in total savings (cane
deterioration excluded) ........................................................................... 49

viii
Figure 4.7 Total savings sensitivity to the percentage reduction of RV % at
varying temperatures ............................................................................... 51

ix
LIST OF TABLES
Page
Table 2.1 Analysis for grades of sugar in South Africa (after Rein, 2007) ............ 10
Table 3.1 Rainfall limit (p) categories used to correlate rainfall with no-cane
stops at Umfolozi .................................................................................... 27
Table 3.2 Basic statistics of mill mechanical mill stop data at Umfolozi ............... 31
Table 3.3 Average, maximum and minimum hourly crush rates (t.hr -1) for the
seasons 2007 – 2009 at Umfolozi Mill ................................................... 33
Table 3.4 Summary of no-cane stop costs .............................................................. 34
Table 3.5 Input parameters to the capital budget .................................................... 40
Table 4.1 Capital budget for a saving of R 2 560 000, definitions of the terms
used are provided in Appendix A (cane deterioration excluded) ........... 48

1
1. INTRODUCTION
Over the past decade the South African sugar industry has been under pressure to
increase efficiency and hence profit margins, mainly as a result of the deregulation of
the agriculture and food sector (Gaucher et al., 2003). Added to this is the fact that
sugar supply areas in South Africa have become less reactive to changes due to the silo
optimisation (Gaucher et al., 2003) and have not grown or are producing less sugar
(Meyer and van Antwerpen, 2001). The sugar supply chain has been identified as an
area through which increased gains can be realised. Increased gains are possible by
improving the management of the cane supply to the mill in an integrated manner (Le
Gal et al., 2004).
The multi stakeholder environment in which the South African sugar industry operates
provides a difficult environment for optimisation (Le Gal et al., 2003). Stakeholders
have optimised their own particular area of interest to the possible detriment of the
whole system (Le Gal et al., 2003). If the management of the supply chain is not
efficient, the quantity and quality of cane that is delivered to the mill will be reduced,
and therefore impacts negative on the quality of sugar produced (Le Gal et al., 2003).
To increase efficiency new measures that provide more flexibility and hence a better
ability to adapt to change are required. Potential advancements to the sugar supply chain
should be based on global solutions that have an overall positive effect on the sugar
supply chain.
Seventy percent of the cane supply to the Umfolozi Sugar Mill is grown on the
Umfolozi Flats. The flats are climatically homogeneous, experience a high water table
and are comprised mainly of fine silt. The combination of these factors prevents infield
harvesting after rainfall events resulting in low cane supply reliability and hence no-
cane stops at the mill. It has been reported that this has a profound effect on the
operation of the mill as well as on the length of milling season (LOMS). A modelling
approach may help to assess the effect of creating a stockpile of cane outside the mill in
order to reduce the frequency of no-cane stops. The model should take into account how
the rainfall patterns vary over the season and its effect on LOMS.

2
There have been a number of researchers in South Africa who have developed models
in order to optimise season length and simulate cane supply management for example
Le Gal et al. (2003) and Wynne and Groom (2003). However, to the author‟s
knowledge, a simulation model which takes into account how changes in rainfall affect
the length of milling season (LOMS) has not been developed. The impact of rainfall on
the cane supply reliability and length of milling season will be the focus of this
research.
In order to unlock the potential in the supply of cane to the mill, tools are required that
can capture the complexity of the system, and once created, stakeholders need to be able
to review and discuss the potential changes (Muchow et al., 2000). In addition, the
relationship between the miller and grower must be the focus in order to improve the
coordination and hence increase the reliability of the mill supply (Gaucher et al., 2003).
Simulation modelling allows for a more comprehensive understanding of how the
supply chain operates, rather than supplying one optimised solution, provoking more
discussion and negotiation amongst stakeholders (Hatchuel and Molet, 1986; de Geus,
1992; Le Gal et al., 2003). In creating a simulation model a holistic view of the mill is
obtained (Barnes et al., 2000).
The aim of the study was not only to model the Umfolozi system but also to develop a
comprehensive stochastic model which can be used to assess the impact of creating a
stockpile of cane outside a mill. The first objective of the research, presented in Chapter
2, was to conduct a literature review on cane supply by tram systems and the cause and
effect relationships experienced within a mill as a result of the harvesting conditions,
no-cane stops and cane deterioration. Chapter 3 details the methodology behind the
development of the modelling framework, named LOMZI. The results of the model are
presented in Chapter 4. The final objective of the research was to analyse the results of
the model. Chapter 5 details the final conclusions and impacts of the model.
This research did not attempt to optimise the number of tram trucks present in the
model. The model also did not attempt to develop a new standard for length of milling
season, it serves to highlight the impact of rainfall and how it affects on the milling
season.

3
2. AN OVERVIEW OF CAUSE AND EFFECTS
WITHIN TRAMWAY TRANSPORT SYSTEMS AND SUGAR
MILL
In order to assess the effect of rainfall and no-cane stops on a sugar mill it is first
necessary to briefly cover the method of cane transport to the mill. The literature review
therefore begins with an overview of sugarcane tramways in South Africa. It then
focuses on the effect of rainfall and no-cane stops on the processes in a sugar mill.
2.1 Sugarcane Tramway Systems
Tramways systems were first reported in the South African Sugar Journal in the 1920s
(Warner, 1923). The reports mainly focused on the sharing of practical experience from
sugar estates. In many of the reports the tram systems were praised as an extremely
cheap form of transport (Anonymous, 1927; Palairet, 1932). There was a decrease in the
use of tramways in the mid-1960s mainly as a result of increased cost of replacing
tracks and rolling stock (Meyer, 2005). In many areas this would have been excessive,
especially after flood damage. The Umfolozi Mill operates the last remaining tramways
system.
2.1.1 Tramway layout
A well planned layout of tramways was essential to the optimum performance of the
system (Warner, 1923; Anonymous, 1927). The gradient and radius of corners needed
to be suitable for the size of engine and trucks used. A set of guidelines were developed
for the planning of a tramway system (Warner, 1923; Palairet, 1932). If these guidelines
have been followed during the planning stages the systems would have operate
economically, efficiently and there would have been be a reduction in wear and tear
(Anonymous, 1927).
The degree of investment in the system would have been based on the amount of cane
that is to be moved (Warner, 1923). Like most transport system tramways are only

4
economical when used at a maximum capacity. The extremely high capital cost of a
tram system is dependent on the total length of the track required and the running cost
of the total area served, however, it is almost completely independent of the total tons of
cane handled (Palairet, 1932). Tramway systems are therefore only suited to areas of
high yield.
Advantages of tramway systems as listed by Palairet (1932) are:
Cane is only handled once
The tram system is usually managed by the mill or company and therefore
provides a greater opportunity for optimisation.
Normal wet weather is not a retarding factor to the delivery of trucks. However,
infield transport is still affected.
2.1.2 Tramway operation
The usual tramway system consists of a network of tramlines, tram trucks, locomotives,
infield transport equipment, and specialised spiller configurations at the mill. The
system components of tramway systems are relatively simple. However, the capital
expenditure required for their implementation is extremely high (Meyer, 2005).
Because of the complex network and delivery schedules, tramways are usually operated
by the sugar mill or by a single company. Tram trucks are delivered each morning to
fields where the individual growers take over loading. The number of trucks delivered is
dependent on the daily rateable delivery for that particular grower.
Infield Loading
Infield loading is controlled by the individual grower. The mechanism of loading has
changed during the past century. The first method was either to manually carry cane to
the tram truck on the track or to construct temporary tracks into the field (Warner, 1923;
Anonymous, 1927). In 1948 a new method of loading was devised. The method
involved transporting the tram truck into the field by tractor from where it was directly
loaded (Maclean, 1949). This method of loading is still used in Umfolozi, however,
5
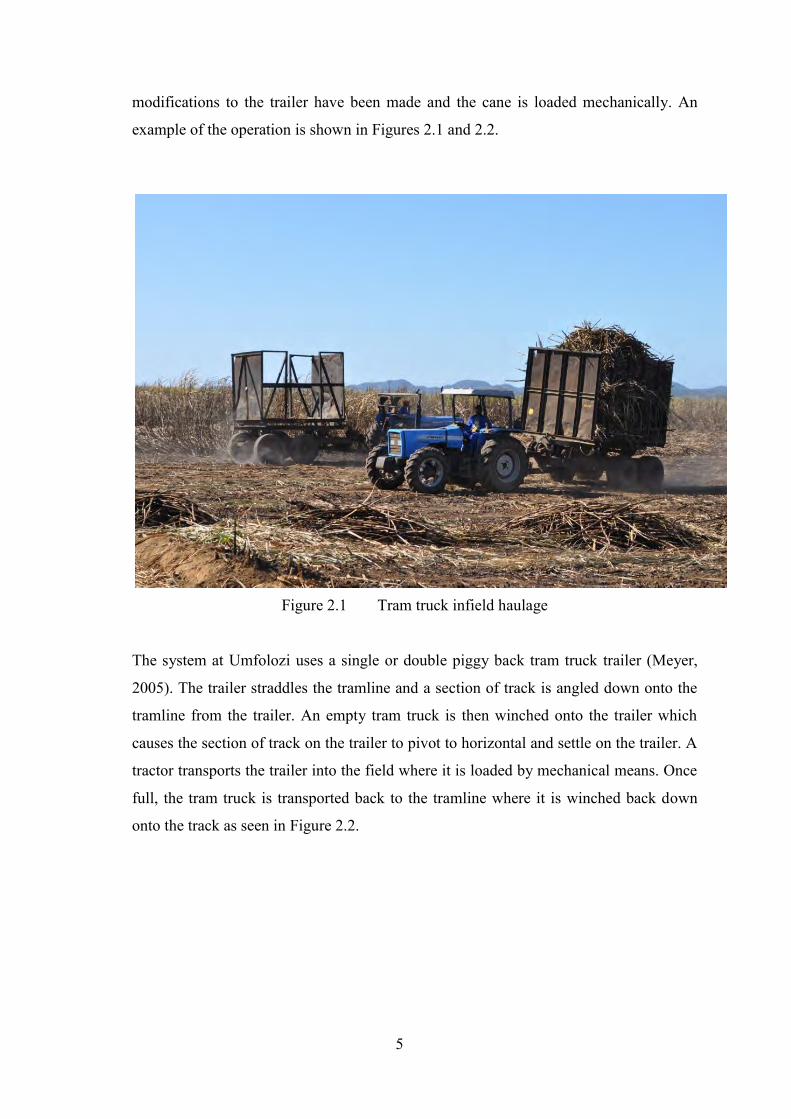
modifications to the trailer have been made and the cane is loaded mechanically. An
example of the operation is shown in Figures 2.1 and 2.2.
Figure 2.1 Tram truck infield haulage
The system at Umfolozi uses a single or double piggy back tram truck trailer (Meyer,
2005). The trailer straddles the tramline and a section of track is angled down onto the
tramline from the trailer. An empty tram truck is then winched onto the trailer which
causes the section of track on the trailer to pivot to horizontal and settle on the trailer. A
tractor transports the trailer into the field where it is loaded by mechanical means. Once
full, the tram truck is transported back to the tramline where it is winched back down
onto the track as seen in Figure 2.2.

6
Figure 2.2 Setting a loaded tram truck back onto the tram lines
2.2 Sugar Mill Systems
Processes within the sugar mills are fairly generic, normally only differing in the
equipment used. Rein (2007) published a cane sugar engineering hand book, which
comprehensively covers the production of sugar. This reference has been used
throughout the literature review to introduce each process. Since this is purely an
introduction, a review of the latest scientific publications concerning each process fell
outside the scope of this review. The cause and effect relationships covered have been
sourced from studies conducted mainly in South African sugar mills.
Rein (2007) introduces the first step in the production of raw sugar as the preparation of
the cane stalk. This involves the washing of the cane, knifing and shredding to produce
a cane fibre bed. The fibre bed is fed into either a diffuser or milling tandem. The aim of
the diffuser or mill is to extract sucrose rich juice from the fibre bed with the least
amount of impurities. The diffuser uses hot water to wash the sucrose from the fibre
bed, while the milling tandems use pressure, as well as a relatively small amount of
water to remove the sucrose. Diffused fibres exiting the diffuser are normally milled by
rollers to squash out the remaining juice.
7
The juice extracted from the diffuser or milling tandem, most commonly termed raw
juice, is passed through a clarifier. The clarifier removes unwanted substances from the
raw juice, such as soil, cane fibre particles and impurities that contribute towards a
darker raw sugar colour (Rein, 2007). The clarifier uses various flocculants, which
collect unwanted particles causing them to settle to the bottom of the tank forming a
mud (Rein, 2007). The solution that results from the clarifier is termed clear juice. Mud
is a waste product and is passed through a press filter where excessive water is removed
and where the remaining solids are usually returned to the fields as fertiliser
(Engelbrecht et al., 2009). An alternative to filtering mud is to pass it back into the
diffuser, here the cane fibre acts as a filter (Rein, 2007).
Evaporation follows the clarification process. In the evaporation process the water
content of the clear juice is reduced in order to form syrup (Rein, 2007). The syrup is
then processed through three crystalliser pans, A, B and C, each pan crystallising lower
quality syrup (Rein, 2007). With the addition of seed crystals to these pans,
crystallisation occurs, thus growing the seed crystals (Rein, 2007). After evaporation in
the pans, the resultant sugar crystals and clear juice, now termed massecuite, is mixed to
obtain an even consistency and then passed through a centrifuge (Engelbrecht et al.,
2009). The centrifuge separates the sugar crystals from the remaining syrup or
molasses, as it becomes known towards the end of the process. The crystals are then
sent to drying and storage/packaging. The remaining syrup is passed to the next
evaporation pan or passed out of the C pan as molasses (Engelbrecht et al., 2009). The
newly created sugar crystals are dried to ensure suitable properties for handling and to
prevent degradation during storage (Rein, 2007).
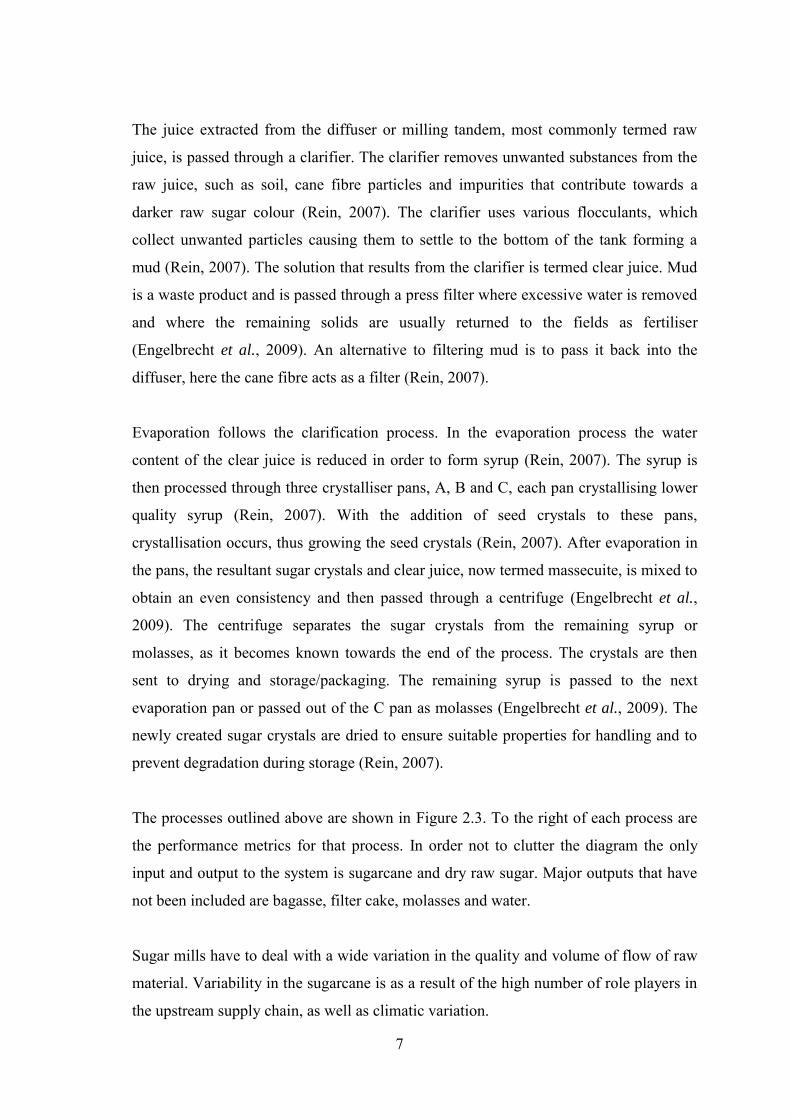
The processes outlined above are shown in Figure 2.3. To the right of each process are
the performance metrics for that process. In order not to clutter the diagram the only
input and output to the system is sugarcane and dry raw sugar. Major outputs that have
not been included are bagasse, filter cake, molasses and water.
Sugar mills have to deal with a wide variation in the quality and volume of flow of raw
material. Variability in the sugarcane is as a result of the high number of role players in
the upstream supply chain, as well as climatic variation.

8
CANE KNIFING
SHREDDING
DIFFUSION MILLING
SCREENING
HEATING
CLARIFICATION
FILTRATION
EVAPORATION
SYRUP CLARIFICATION
CRYSTALLISATION
COOLING CRYSTALLISERS
CENTRIFUGING
DRYING
Billet LengthConsistency
Preparation Index
DRITemp
Imbibition Water VolumepH
Insoluble Solids ContentCleanliness
TemperatureDegree of Flashing
Suspended Solids Concentration
ImpuritiesJuice Turbidity
Suspended SolidsSucrose Content in Mud
Rate of Heat TransferConcentration of Sucrose
Colour
ViscositySuspended Solids Content
Temperature
Shape of CrystalCrystal Content
ViscositySupersaturation Coefficient
Purity of SyrupCirculation
Temperature
Supersaturated Coefficient
Residence TimeTemperature
Speed of OperationEven Distribution of Massecuite Layer
Volume of Wash Water Used
TemperatureMoisture Content
MUD RECYCLING
SUGARCANE
DRY RAW SUGAR
Figure 2.3 Generic steps of raw sugar production (after Engelbrecht et al., 2009)
9
2.2.1 Input factors
There are a number of factors that affect the processes throughout the mill. The most
important of these factors is cane quality and quantity. Without consistent and high
quality cane, quality sugar cannot be produced.
The quality of the cane is partly affected by the delay between harvesting and crushing
(Barnes et al., 1998), also, the method of harvesting (Meyer et al., 2002), cane variety
(Barker and Davis, 2005) and the time of year during which the cane is harvested affect
quality (Smits and Blunt, 1976; Barker and Davis, 2005). For example, an increase in
the delay of transferring the harvested cane to the mill increases the loss of sucrose, as
well as the build up of impurities in the cane stalk (Reid and Lionnet, 1989; Ravno and
Purchase, 2005). The prevailing climatic conditions exacerbate the losses and build up
of impurities (Reid and Lionnet, 1989). During the warm wet summer months,
deterioration rates are higher compared to winter months (Ravno and Purchase, 2005).
The purity of the sugarcane crop changes as the season progresses (Lonsdale and
Gosnell, 1976). Lonsdale and Grosnell (1976) found that purity is lowest in the
beginning of the season i.e. March, and increases in July after which it is fairly constant
until December. Eggleston and Harper (2006) found that mannitol, formed by the
bacterial degradation of sugarcane, is a good indicator of harvest to crush delay related
cane quality.
Dextran is formed from the breakdown of sucrose as a result of bacterial action, thus
important factors that control its formation are temperature, moisture and residence time
(Ravno and Purchase, 2005). The formation of dextran is also increased when
mechanical chopper harvesting is undertaken due the increased surface area and
exposure of the cane ends to contamination (Ravno and Purchase, 2005).
If the cane has not been completely burnt, it has been reported that the dextran content
increases (Simpson and Davis, 1998). Dextran creates a number of problems throughout
the sugar mill, as well as within the subsequent refinery. The dextran also forms a sticky
residue to which soil particles attach, contributing to the soil entering the mill (Simpson
and Davis, 1998). Simpson and Davis (1998) suggest that high soil content will cause
excessively high levels of mud. This in turn causes insoluble calcium phosphate, a

10
suspended solid, to be carried over into the clear juice, resulting in poor quality sugar
(Simpson and Davis, 1998). Soil can also increase the wear and tear on the hammer mill
and shredders.
2.2.2 Output requirements
Raw sugar can be consumed directly, however, it is usually processed further in a sugar
refinery. The sugar mill is therefore, required to produce a raw sugar quality that meets
the expectations of the refiner. Sugar quality is measured according to a variety of
factors namely, pol, colour, ash, insoluble solids, filterability, dextran, starch, reducing
sugars and grain size/distribution (Rein, 2007). All of the above affect the cost and ease
of refining.
In South Africa raw sugars are divided into three quality groups. The groups are
classified according to the parameters mentioned above. Table 2.1 contains the values
with which the raw sugar qualities are analysed. Payments for raw sugar are based on
the pol value of the raw sugar. In addition to this there are bonuses and penalties for the
various characteristics of the sugar (Rein, 2007).
Table 2.1 Analysis for grades of sugar in South Africa (after Rein, 2007)
Property Very High
Pol (VHP)
High Pol
(HP)
Low Pol
(LP)
Pol in °Z 99.3 98.9 97.8
Moisture in g / 100 g 0.10 0.24 0.35
Reducing Sugars in g / 100 g 0.16 0.50 1.10
Ash in g / 100 g 0.15 0.17 0.20
Colour in IU 1500 1800 2200
Starch in mg / kg 110 110 110
Dextran in mg / kg 90 90 90

11
2.3 Juice Extraction
Sugarcane is delivered to the mill as either complete stalks or billeted into shorter pieces
(Engelbrecht et al., 2009). The cane undergoes three processes before bagasse and raw
juice are produced, namely cane knifing, shredding, and milling or diffusion
(Engelbrecht et al., 2009). The purpose of juice extraction is to rupture as many cane
plant cells as possible and then to separate the soluble from the insoluble particles
(Payne, 1968; Moor, 1994).
2.3.1 Cane knifing
If not already billeted, as a result of mechanical chopper harvesting, cane knifing
involves the reduction in size of the cane stalk into small billeted pieces (Rein, 2007).
Cane knifing prepares the stalks into an even bed that will ensure a stable flow of cane
into the shredder without blockages (Ried, 1994). Ried (1994) reports that the tip
velocity of the knives affects the quality of the preparation. The knifing of the cane
should not cause an excessive reduction in fibre length as this would impede diffusion
(Reid, 1995). Longer fibre lengths ensure that the fibre bed in the diffuser is loosely
packed, allowing for higher percolation rates (Reid, 1995). The concerns with the cane
knifes are wearing and damage due to excessive soil, rocks and foreign objects, such as
metal chains in the incoming cane (Ried, 1994). There is an increase in the amount of
soil entering the mill during rainy weather (Ried, 1994). Following knifing, the billeted
cane is fed into the shredder, which serves to rupture the cell walls of the cane stalk.
2.3.2 Shredding
Shredding is achieved by feeding the billeted cane from the knifing process through a
series of hammers, which shred the billets into a fine bed of fibre (Moor, 1994). It
involves the extensive destruction of the cell walls of the cane stalk (Reid, 1995).
Complete destruction of the cell ensures a high extraction rate in the diffuser (Payne,
1968; Moor, 1994). In the report of cane shredding, Moor (1994) states that cane should
not be over prepared as it leads to “pulping” of the fibre. Pulping causes difficulties in
the transfer of fibre through the mill and leads to decreased percolation rates in the
diffuser (Moor, 1994). The shredder is also susceptible to wear and tear as a result of

12
soil, rocks and foreign objects. A damaged shredder will decrease the preparation index
contributing to poor extraction (Smits and Blunt, 1976).
The shredding of billeted cane stalks was previously measured using the Preparation
Index (PI), the amount of sucrose which can be washed from the cane relative to the
total quantity of sucrose present, measured as a percentage (Loubser and Gooch, 2004).
The new method to measure the preparation of cane is called the Diffusion Rate Index
(DRI). The DRI is a measure of the time taken to remove a certain Brix from the
shredded cane sample (Loubser and Gooch, 2004); therefore, it is a measure of how
easily Brix can be removed rather than how many cane cells are open as in the PI
method (Loubser and Gooch, 2004). Brix is the measure of dissolved solids in sugar,
juice, liquor or syrup using a refractometer in units of °Bx (Rein, 2007). For example, in
the case of a pure sugar-water solution of 25°Bx there is 1 part sugar to 3 parts water.
2.3.3 Milling
Milling uses pressure to expel the fluids from the fibre bed (Engelbrecht et al., 2009).
Milling is no longer a popular method of extraction in sugar mills, with only 9% of
sugarcane in South Africa processed by milling (Lionnet et al., 2005). Milling is not
severely affected by no-cane stops due to the relatively short residence time of cane
fibre in the milling tandem.
2.3.4 Diffusion
The diffuser is the more common method of extraction of sucrose from the cane fibre
and has largely replaced milling (Reid, 1995). Soluble particles are washed out of the
cane by a counter-current leaching process (Rein and Woodburn, 1974). The amount of
soil, degree of cane preparation, bulk fibre density and pH of the percolating liquid has
an effect on the diffuser efficiency (Lionnet et al., 2005). These factors contribute to the
rate at which percolation takes place.
Poor percolation results in flooding, hence a decrease in extraction (Lionnet et al.,
2005). Operational problems concerning flooding include overflow of fibre out of the
feed or discharge ends of the diffuser and spilling cane juice (Lionnet et al., 2005).
Mitigation of the problems results in downtime and hence a reduction in the volume of

13
cane processed (Lionnet et al., 2005). Flooding can be avoided by decreasing the
throughput and imbibition of the diffuser, i.e. allowing more time for percolation (Rama
et al., 2006). Rama et al. (2006) also suggest removing suspended solids from the cane
bed to ensure efficient permeability especially during high ash loads.
High loads of suspended solids enter the mill with the cane as a result of high soil loads.
This usually occurs during rainy weather, especially when there is a delay between
harvest and milling, allowing the dextran “glue” to accumulate soil (Simpson and
Davis, 1998). High clay content soil has the most effect on the percolation rate (Lionnet
et al., 2005). In experiments conducted by Lionnet et al. (2005), and confirmed by
Rama et al. (2006), it was found that the impermeable nature of clay prevented the free
flow of imbibition water through the samples.
Liming in the diffuser is undertaken to maintain high pH imbibition water in order to (a)
reduce the silica levels in the clear juice, (b) limit corrosion and (c) reduce inversion
(Walthew et al., 1998). Inversion is the changing of sucrose to glucose and fructose
(Rein, 2007). Reducing silica levels helps prevent scale build up in the evaporators
(Walthew et al., 1998). Liming, however, may also reduce the permeability of the cane
bed (Lionnet et al., 2005). If poor quality lime is used, such as lime containing extra
silica, the positive effect of a high pH will not be realised (Lionnet and Walthew, 2004).
At a high pH both silica and Brix will continue to be leached from the cane fibre;
however, the rate at which Brix is leached will decrease more rapidly than that of silica
(Walthew et al., 1998). This is more significant if the pH of the solution is above 8.5
(Lionnet and Walthew, 2004). Silica is not easily removed during clarification
(Walthew et al., 1998).
Temperature affects the rate of sucrose extraction in the diffuser. Reid (1995) suggests
that temperatures should be maintained above 75°C in order to attain high extraction
rates. The average temperature of the diffuser should be maintained at 85°C (Reid,
1995). High temperatures result in an increase in the juice colour (Reid, 1995). For
example, Reid (1995) reports that at the Amatikulu Mill a 10°C drop in temperature
resulted in a 25% reduction in colour. Diffusion results in raw sugar of higher colour,
but lower impurities than that of milling, depending on the temperature of the diffuser
(Reid, 1995). According to Reid (1995) raw sugar colour from a diffuser is on average

14
about 25% higher than sugar from a milling tandem. This may be a disadvantage when
the goal is to produce a low colour sugar, or when milling a white sugar (Reid, 1995).
The main benefit of the diffuser is the fact that the starch is removed from the raw juice
as a result of the high temperatures (Reid, 1995). The higher temperature denatures the
starch allowing enzymes to further break the starch down (Reid, 1995).
In diffusers the measurement of microbiological breakdown is possible. The organism,
hyperthermophiles, is responsible for the breakdown of sucrose to lactic acid (Reid,
1995). The lactic acid content in the diffuser is measureable, and is a relationship that
exists between the sucrose lost and the lactic acid produced (Reid, 1995). For every part
of lactic acid formed there is a resultant two parts sucrose loss, as well as a drop in juice
purity (Reid, 1995). Cane fibre that is left in the diffuser is prone to microbiological
breakdown. The start up and shut down of diffusers are, therefore, a cause of concern in
a sugar mill (Reid, 1995). If the stops last for over six hours it is advisable to clear the
cane fibre in the diffuser to prevent the degradation of the sugar (Reid, 1995).
2.4 Energy Production and Consumption
Sugar mills have the potential to produce enough energy to operate without input from
external sources. However, there are factors that change the amount and quality of fuel
supplied to the boilers, as well as the efficiency of the boilers.
The energy in a sugar mill is supplied mainly by the burning of bagasse, the waste
product of sucrose extraction. The bagasse is fed into the boilers where it is burned for
steam and electrical energy production (Rein, 2007). Energy is required at all stages
within the mill, even when the processing of cane has ceased. Therefore, there is a
requirement to store excess bagasse or to have an alternative source of energy, such as
coal (Ried, 2006).
The quantity and quality of the bagasse affects the amount of energy that is available for
steam production. The quantity of the bagasse is measured by the fibre content of the
cane, while the quality is measured by the calorific value and combustion efficiency
(Ried, 2006). The calorific value of bagasse is not significantly affected by the amount
of fibre, pith, cane stalks and cane tops (Don and Mellet, 1977). Ried (2006) states that

15
the most important factor concerning the calorific value and combustion efficiency of
the bagasse is the amount of moisture remaining after sucrose extraction. The moisture
of the bagasse is controlled at the dewatering mill, if the moisture content rises to above
55%, additional alternative fuel needs to be added, often in the form of coal (Ried,
2006). Alternative fuel may also need to be added if the ash percentage in the bagasse
rises above 5% (Ried, 2006).
In order to achieve a higher degree of extraction the quantity of imbibition water used in
the diffuser and mill tandem may be increased (Rein, 2007). An increase in imbibition
water dilutes the raw juice, and therefore, more energy is required to evaporate the
additional water. A further addition of water occurs in the vacuum pan to maintain and
control the growth of crystals and in the centrifuge to wash the crystals of syrup (Ried,
2006). Both these processes place a further demand on energy for evaporation (Ried,
2006). In the case of poor syrup quality as a result of poor cane quality an increase in
the amount of water may be required (Ried, 2006).
The boiler converts the by-product from sugar extraction, bagasse, to steam and
electrical energy for use in the sugar mill. The operation and maintenance of the boiler
is affected by the quality of the incoming fuel, which in most cases is bagasse, and the
quality of the boiler feed water. Sand in the bagasse, more typical of diffusers, can result
in wear in the boilers (Reid, 1995).
The quality of the feed water to the boiler affects the operation and maintenance of the
boiler (Reid and Dunsmore, 1991). Sucrose is identified as a great cause of boiler
problems. Reid and Dunsmore (1991) report that if sucrose contamination occurs at a
concentration more than 200 ppm operational problems within the boiler can be
expected. At high temperatures the sucrose breaks down into organic acids. These lower
the pH of the feed water causing an increase in the conductivity resulting in corrosion
(Reid and Dunsmore, 1991). To correct the low pH caustic soda can be added to the
feed water to bring the pH back to the required 11.0. Dosing with caustic soda however
is not desired and it can increase the total dissolved solids (Reid and Dunsmore, 1991).

16
Sucrose causes damage to the boiler components which leads to costly repairs and
boiler downtime. Some examples of damage and problems as listed by Reid and
Dunsmore (1991) are foaming, carry-over and fouling of strainers, steam traps, control
valves and turbine blades. Carbonaceous deposits can also form on the boiler drum and
heating surfaces, which reduces heat transfer and may cause blockages or corrosion
(Reid and Dunsmore, 1991). Sucrose concentrations of 20 ppm are deemed as being
safe provided the chemical treatment of feed water is adequate (Reid and Dunsmore,
1991).
The chemical treatment of the water aids in the control of deposits and scaling of
insoluble compounds in the boilers (Cuddihy et al., 2005). The deposit and scaling are
as a result of a decreasing solubility of the deposit forming salts with increasing
temperature and concentration (Cuddihy et al., 2005).
2.5 Juice Clarification
Juice clarification reduces the number of insoluble particles in the raw juice resulting in
a clear juice ready for crystallisation. This step in the sugar mill involves the removal of
bagacillo from the raw juice, heating of the juice and lastly the removal of suspended
particles from the raw juice. Clarification produces a clear juice and a waste product
termed mud. The mud can be reworked to extract any remaining sucrose.
2.5.1 Screening
Screening is required to remove the larger insoluble solids from the raw juice after the
diffuser or milling tandem (Meadows, 1996; Rein, 2007). The remaining smaller
particles are removed through clarification (Rein, 2007). Screening is relatively
unaffected by no-cane stops and deterioration, however, if high loads of soil enter the
mill the screen may experience increased wear (Meadows, 1996).
2.5.2 Heating
The purpose of heating is to bring the temperature of the raw juice slightly above 100°C
to allow for effective flashing prior to clarification (Meadows, 1996). Flashing removes
air particles attached to the non-soluble particles, and therefore enhances the rate of
settling in the clarification tanks (Meadows, 1996). The heating process is required to

17
increase the temperature of the raw juice from ambient temperature, if a milling tandem
is used, or from 60 ˚C in the case of a diffuser (Rein, 2007). Once the juice has reached
the required temperature it is flashed in a flash tank to remove trapped air and to ensure
a constant temperature juice to the clarifier (Rein, 2007).
An operational problem associated with heat exchangers is the build up of scale on the
inside of tubes or on the plates and can constitute a significant resistance to heat transfer
within a few days (Rein, 2007). This scaling is very similar to that encountered in the
evaporators as discussed in Sections 2.6.1 and 2.6.4. A major cause of increased scaling
is an increase in the silica content of the raw juice. Increased silica in the raw juice is
mainly as a result of an increase in the amount of sand that enters the sugar mill (Rein,
1990). Rein (1990) reports in a study at Felixton Mill that the increase in sand entering
the mill was attributed to stale cane as a result of delays due to the rain. Tests conducted
by James et al. (1978) show that the scaling results in a reduction in the heat transfer
coefficient and, therefore, an increase in the time to heat the raw juice to the required
temperature.
2.5.3 Clarification
The most common method of clarification in sugar mills today is defecation. This
involves the addition of lime as a flocculant to the raw juice, which forms flocs that trap
suspended matter. As the particles gain mass they settle as mud to the bottom of the
tank where it can be drained out. The mud is filtered or passed back to the diffuser in
order to extract more sucrose. This process is described in Section 2.5.4. The purpose of
clarification is to remove suspended matter and to provide a clear juice of minimum
turbidity, colour and low calcium content. The main cause of suspended matter is cane
containing high loads of soil. This is more prevalent when harvesting in wet conditions
after a no-cane stop or when deterioration is high as a result of a long burn to crush
delay. The filterability of raw melt in the sugar refinery after the production of a raw
sugar may be affected by the impurities remaining in the sugar after clarification
(Mkhize, 2003). This is mainly due to the high loads of suspended solids and turbidity
(Mkhize, 2003). The frequent start up and shut down of the mill, often as a result of no-
cane stops, can also cause high turbidity problems. This becomes more of a problem
towards the end of the season when the supply of cane to the mill is unsteady (Mkhize,

18
2003). The effects of inconsistent operation of the mill on the clear juice could last a
couple of hours.
During clarification there is a possibility of mud carryover. Carryover can contain fine
suspended matter from the clarifier. Dextran as a result of deterioration in the raw juice
has been identified as the cause of the fine suspended matter (Ravno and Purchase,
2005). The dextran acts a protective colloid and inhibits coagulation, therefore
preventing the entrapment of fine matter in the mud (Ravno and Purchase, 2005). The
fine matter has an effect on the quality of the sugar, increasing the ash content and
increasing its colour (Ravno and Purchase, 2005).
2.5.4 Filtration
Rein (2007) states that the mud from the clarifier still contains a certain amount of raw
juice. In order to recover the juice the mud is passed through a filtering system.
Bagacillo, fine bagasse particles, are added to the mud from the clarifier aiding in the
mud filtration. The bagacillo is added in the mud mixture to optimise permeability of
the pressed mud, which is now termed filter cake. Ideal conditions for permeability are
at temperatures above 75 ˚C and at pH levels slightly below 8.5. The filtrate from the
process is returned to the raw juice from the diffuser or mill.
2.6 Juice Evaporation and Crystallisation
The most important process in the sugar mill is the removal of large amounts of water
and the subsequent crystallisation of the sucrose. The quality of the final sugar crystal is
affected by the method of crystallisation, the stage at which the crystal is formed and the
impurities present in the syrup. Before crystallisation can take place the clear juice must
first be reduced to form syrup and clarified once more using floatation.
2.6.1 Evaporation
In order to produce a syrup ready for crystallisation a substantial amount of water must
be evaporated from the clear juice. The evaporation process reduces the water content of
the clear juice to a concentration of 65 to 68% dissolved solids, forming a substance
called syrup (Rein, 2007). This is just below the crystallisation point of syrup, thus
enabling storage in liquid state (Rein, 2007). Evaporation is undertaken in multiple

19
effect evaporators using steam as the energy source (Rein, 2007). Most of the energy
produced from the boilers is used in evaporation. The efficiency of the process
therefore, has a profound effect on the overall energy efficiency of the mill and vice
versa, energy problems will first affect the evaporation stage (Rein, 2007). Optimum
performance is achieved when the steam supply to the evaporators is constant, ensuring
steady operation (Rein, 2007). In addition to a constant steady operation the physical
level of juice inside the tubes should be 25 to 50% of the maximum height which
produces optimum circulation and heat transfer in the evaporator (Rein, 2007).
At high temperatures the reducing sugars that are present in the clear juice can easily
affect the colour of the resultant sugar. The increase in colour is more pronounced when
high viscosity syrup is processed (Rein, 2007). It is, therefore, more desirable to have a
lower temperature profile across the evaporators and to heat the high viscosity syrup at
the lowest temperature (Rein, 2007). For this reason cocurrent flow of the clear juice
and steam is used in the sugar industry (Rein, 2007). Cocurrent flow through the
evaporator also reduces the residence time of the dissolved solids, thus minimising the
time for degradation of the sucrose (Rein, 2007).
Scale in evaporators affects the heat transfer and hence the efficiency of the evaporator
(Rein, 2007). A major component of scale is silica, which is deposited as the Brix
increases across the evaporator train and pans (Walthew et al., 1998). The amount of
silica present in the clear juice is determined by the quality of cane entering the mill and
the pH of the imbibition water used in the diffuser (Walthew et al., 1998). In this case
the poor quality cane is often as a result of harvesting cane during, or too soon after, a
rainfall event which increases the soil load entering the mill.
2.6.2 Condensers and vacuum equipment
Rein (2007) states that condensers and vacuum equipment are required to condense
water vapour produced from the evaporators. To induce cooling the vapour from the
evaporators comes into direct contact with the cooling water. Common types of
condensers are the countercurrent multi-tray condenser and rain type condensers. An
alternative is the multi-jet condenser, which injects a fine mist of water into the flow of
the warm vapour. The difference in temperature between the vapour and the cooling

20
water determines the amount of cooling water required. The vacuum equipment is used
to remove the incondensable gases from the condensers. In order to reduce the
temperature of the cooling water spray ponds or cooling towers are used to reject the
heat to the atmosphere. The efficiency of this process is generally not directly
influenced by no-cane stops or deteriorated cane.
2.6.3 Syrup clarification
Syrup clarification is usually required when producing sugar for direct consumption
after the sugar mill. Rein (2007) states that syrup clarification reduces the suspended
solids content, hence the colour of the final sugar crystals. Syrup clarification uses
clarification by floatation. Floatation clarification is preferred because the high viscosity
of the syrup does not allow for clarification by settlement (Rein, 2007). Syrup
clarification involves the addition of a polyacrylamide flocculant followed by the
aeration of the syrup (Rein, 2007). Other chemicals such as sulphates or phosphates can
be added to achieve a certain sugar quality (Rein, 2007). The flocculant causes the
suspended particles to combine allowing the fine air bubbles to carry these particles to
the surface of the clarifier. The layer of scum that forms on the top of the clarifier is
continuously removed while clear syrup is drained off the bottom of the clarifier. The
temperature of the syrup affects the efficiency at which the suspended solids are
removed. It is suggested that there are improvements in the removal of suspended solids
up to a temperature of 85 ˚C (Rein and Cox, 1987). Syrup clarification reduces the final
viscosity of the molasses by about 25% (Rein and Cox, 1987). The reduced viscosity
allows for higher Brix massecuite and the use of less steam and water on the centrifuges
(Rein and Cox, 1987). However, deteriorated cane as a result of no-cane stops may
increase the viscosities and negatively affect the process. If the impurities are not
removed from the syrup they will obstruct the development of high quality crystals.
2.6.4 Crystallisation
Crystallisation of sucrose occurs when the sugar solution becomes supersaturated. The
objective of crystallisation is to bring the syrup into the supersaturated state and control
it at a specific concentration to achieve a steady rate of crystallisation (Rein, 2007).

21
Crystallisation of the sugar solution usually takes place by passing the solution through
three pans, each pan crystallising a lower grade of syrup or massecuite as the substance
becomes known when it contain fluid and crystals. The degree of crystallisation that can
take place in the pan is dependent on the viscosity of the massecuite and its ability to
flow out the pan (Rein, 2007). Before the massecuite becomes too solid it is drained out
of the pan and is centrifuged to separate the sugar crystals from the remaining
massecuite. The remaining massecuite is fed into the next pan. This process it repeated
again until a final molasses is produced. The number of steps required to achieve final
molasses is dependent on the purity of the syrup (Rein, 2007). A no-cane stop increases
the impurities present in the syrup. The impurities increase the viscosity of the
massecuite and therefore reduce the time that the sucrose can remain in the crystalliser.
The sucrose that did not crystallise may be lost to the molasses.
2.7 Cooling Crystallisers
Rein (2007) describes that cooling crystallisers are designed to maximise crystallisation
after passing through the crystallising pans. The massecuite that leaves the vacuum pan
is supersaturated and hot, hence further crystallisation can be induced by cooling.
Cooling crystallisation is undertaken prior to centrifuging in either batch or continuous
crystallisers. It is preferable to operate a continuous cooling crystalliser as it requires
less labour and automation. The massecuite is cooled by coils through which cooling
water is passed. The operational objectives during cooling crystallisation are to ensure
the required residence time and target temperature on leaving the crystalliser are
achieved. The correct outlet temperature of the massecuite is attained by controlling the
rate of flow of cooling water through the cooling pipes.
Problems may occur in the cooling crystalliser if the Brix of the solution is high, or the
massecuite is cooled down further than normal as a result of mill breakdowns or
particularly cold weather (Rein, 2007). Lower than normal temperature results in a
massecuite that is too viscous for the operation of the mixing drives. A solution to the
problem is to either increase the temperature of the cooling water or to blend molasses
into the cooling crystallisers (Rein, 2007). No-cane stops will affect the energy available
to this process and necessitate the burning of a substitute fuel, such as coal, to prevent
the crystallisers from becoming dysfunctional.

22
2.8 Centrifuging
Centrifuging separates the liquid also known as molasses from the crystals after
crystallisation. It utilises a centrifugal force, which drives out the molasses from
between the sugar crystals. Rein (2007) states that additional wash water can be added
to the centrifuge to remove the remaining liquid from the crystals.
As discussed in Section 2.6.4 the presence of dextran and other impurities in the raw
juice causes deformation of the sugar crystals. This makes them susceptible to breaking
during centrifuging and the subsequent blockage of the screens (Smits and Blunt, 1976).
In the event of a no-cane stop the degree of deterioration increases. As a result, the
amount of dextran in the processing stream is increased, therefore, reducing the quality
of the sugar crystal.
2.9 Drying
The drying of the raw sugar is the last process in the sugar mill before it is sold to the
market or to the sugar refinery. Drying is required to ensure free flowing characteristics
are obtained for handling purposes and to meet customer specifications (Rein, 2007). In
addition to attaining the physical properties required by the customer, drying is also
required to prevent sucrose loss as a result of microbiological or chemical degradation
(Rein, 2007).
2.10 Discussion and Conclusions
This literature review has highlighted the link between the quality of cane that is
delivered to the mill and the profound effect on the quality of raw sugar that is
produced. It has also highlighted the importance of consistent cane supply in order to
ensure stabilised milling processes.
In the case of the Umfolozi Sugar Mill, a majority of the cane is sourced from the
Umfolozi Flats. The ability to harvest on the flats is sensitive to rainfall which disrupts
the cane supply. In addition to this the cane that is delivered after a rainfall is often
deteriorated and of poor quality containing large amounts of soil. The literature review
has shown that with inconsistent cane volumes there is a build up of impurities in the

23
mill which reduces the quality of the raw sugar produced. There is also an increase in
the operational costs of the mill. In summary the mill is affected by no-cane stops and
deterioration in the following ways:
Increased quantities of soil in the cane which results in increases wear,
predominately in the shredders and boilers.
Sand reduces the rate of percolation in the diffuser, increasing the risk of
flooding and reducing the diffuser efficiency.
Sand also increases the silica content of the raw juice resulting in more scale in
the evaporation processes, reducing efficiency.
The start-up and shut-down of the mill increases the risk of deterioration within
the mill.
There is often a need for an alternative energy source as a result of the disruption
to the supply of bagasse to the boilers.
Deterioration produces dextran which develops a sticky residue on the cane stalk
and therefore transports more soil into the mill.
Deterioration produces impurities which hinder the formation of sugar crystals.
The viscosity of the syrup is increased thus requiring more water and energy for
crystal formation.
Considering the effect of no-cane stops and deterioration on a sugar mill it was decided
that this would be the focus of the study. In the case of Umfolozi this involves
mitigating the effect of rainfall on the Umfolozi Flats. Although this literature review
went into detail pertaining to milling, the model development will, to a larger extent
aggregate these issues and combine them with supply chain dynamics.

24
3. METHODOLOGY – MODEL DEVELOPMENT, ASSUMPTIONS
AND DATA ANALYSIS
The literature review outlined the need for a sugar mill to operate at a constant rate and
process sugarcane of a consistent quality. A constant and reliable cane supply is attained
by managing different sectors in the cane supply area to ensure growers are harvesting
at a constant rate, thus having an equal share of the peak recoverable value (RV) period
or compensated if the harvesting occurs early or late in the season (Le Gal et al., 2004).
A factor that affects the constant supply of cane to the sugar mill on a large scale is the
prevailing weather systems. Rainfall prevents infield mobility, the ability to burn and
increases the amount of sand contained in the harvested cane. This has a detrimental
effect on the quality of raw sugar produced and the operating costs of a sugar mill. In
order to reduce the negative effect of a rainfall event a counter measure is needed which
can be implemented when harvesting is affected.
3.1 Umfolozi Mill and LOMZI
The Umfolozi Mill area is particularly susceptible to rainfall events. Cane in the
Umfolozi sugar mill is supplied mainly by the Umfolozi Flats. The flats are a densely-
farmed and highly-productive area of land on the flood plains of the Umfolozi River.
While the remainder of the mill‟s cane supply is sourced from areas relatively remote in
relation to the flats and can, therefore, be assumed to experience different weather
conditions. The Umfolozi Flats are prone to wet conditions because of the type of soils,
topography and high water table. Harvesting is therefore inhibited even after a small
amount of rainfall (McGrath, 2010).
Stakeholder discussions and analysis of the Umfolozi Mill area revealed that no-cane
stops occur too frequently as a result of rainfall. To ensure that there is sufficient cane
for the mill to continue operating a stockpile of cane could be created. The stockpile
would typically be crushed when there is insufficient cane supply to the mill after a
rainstorm.
A stochastic model, named LOMZI, was created in order to evaluate the potential effect
of a stockpile outside the mill. The name LOMZI is derived from a combination of its

25
potential effect on the LOMS and the area in which it was developed. The model was
based on a daily time step with variable rainfall records as the main driver. A series of
assumptions have been used in the case of insufficient data or when the system became
too complex to model stochastically. These assumptions are discussed in this chapter.
LOMZI was created in Microsoft Excel® with the use of pivot tables and basic
programming to run simulations. It consists of an input sheet where all the aspects that
affect the delivery and quantity of cane outside a mill are taken into consideration.
These are summarised in Figure 3.1 and are listed as in the model in Appendix B. The
inputs to the model are processed within the model sheet using a line of formulae to
represent each day in the season. A summary line from the model sheet is transferred to
the output sheet after each season. Basic programming is used to simulate the specified
number of seasons. In order to ensure that the model did not produce unrealistic
outcomes the most conservative assumptions were maintained at all times.
Figure 3.1 Factors considered in the LOMZI model at Umfolozi Mill
The entire Umfolozi Flats is serviced by a tramway system. A perspective view of the
mill and the tram sidings is supplied in Figure 3.3. The photo is taken in the off season
hence all the tram trucks are currently in the sidings. These sidings will be used to store
the cane stockpile. An orthophoto of the Umfolozi Sugar Mill has been provided in
Figure 3.2. The extent of the Umfolozi Flats has been marked out and the approximate
position of the Umfolozi Land Owners Association (ULOA) Rainfall Station is shown.

26
Figure 3.2 Orthophoto of the Umfolozi Sugar Mill with an insert of the tram siding where the stockpile is to be created.
Are-a of llats se!'Yiced by tram network
Approxim:ttc trnm muillints
Rivt"rs
ULOA R:tintitll Station
Umfolo:r.i Sugar Mill and tmm sidings

27
Figure 3.3 Umfolozi Sugar Mill and tram sidings where the stockpile will be
created.
3.2 Rainfall receiver operating characteristics analysis
Receiver Operating Characteristics (ROC) analysis (Fawcett, 2006) was used to
calibrate the depth of rainfall that leads to wet field conditions and hence no-cane stops.
ROC analysis has been used in signal detection theory to determine the trade-off
between correct predictions and false alarms (Fawcett, 2006). The results from the
model are analysed using a confusion matrix in order to create a ROC graph which
indicates visually how well the model predicts a certain outcome (Fawcett, 2006). Using
these criteria, three seasons were analysed to determine the most appropriate set of
limits, for example, whether 15 mm of rain will prevent harvesting for one or two days.
The ROC analysis of the four different scenarios is shown in Table 3.1.
Table 3.1 Rainfall limit (p) categories used to correlate rainfall with no-cane stops
at Umfolozi
Rainfall Scenario 1 Scenario 2 Scenario 3 Scenario 4
1 wet day 5mm ≤ p <
20 mm
5mm ≤ p <
20 mm
5mm ≤ p <
15 mm
5mm ≤ p <
10 mm
2 wet days 20mm ≤ p 20mm ≤ p <
30 mm
15mm ≤ p <
30 mm
10mm ≤ p <
30 mm
3 wet days - 30 mm ≤ p 30 mm ≤ p 30 mm ≤ p

28
The four scenarios are plotted on the ROC graph in Figure 3.4. Points closest to the top
left corner are considered a better prediction of the actual circumstance i.e. a true
positive rate of one and a false positive rate of zero. It was concluded that Scenario 4
(Table 3.1) was representative of the real situation.
Figure 3.4 ROC graph used to determine the most suitable rainfall limits that
indicate wet field conditions at Umfolozi
A rainfall generator was based on a Markov chain, which generates the probability of
multiday rainfall events. The Markov chain works on the principle that once a rainfall
event has taken place, the probability of rainfall recurring the following day changes
(James and Caskey, 1963). The probability may increase or decrease, depending on the
type of rainfall that occurs in the region during different times of the year. In the case of
Umfolozi, for the majority of the season, there was a lower probability for multiday
rainfall events than single day events. Figure 3.5 depicts the probability for a rainfall
event, given that the previous day was dry (Pdry), and the probability for a rainfall event,
given that the previous day was wet (Pwet). These values were derived from the 50 year
rainfall data set at ULOA. The graphs show two short periods (in February and October)
0
0.1
0.2
0.3
0.4
0.5
0.6
0.7
0.8
0.9
1
0 0.1 0.2 0.3 0.4 0.5 0.6 0.7 0.8 0.9 1
True
Pos
itive
Rat
e
False Positive Rate
Scenario 1Scenario 2Scenario3Scenario 4

29
when multiday rainfall event were more likely. The probabilities of different amounts of
rainfall were used to develop the rainfall generator. Multi-day rainfall events were of
higher concern because of their effect on the supply of cane. It can be argued that during
the early summer months there was a need to have two days of cane on hand or that the
mill may need to shut down for a few weeks.
Figure 3.5 Markov probabilities for the Umfolozi Land Owners Association rainfall
station
Rainfall was the main driver of no-cane stops, thus it was the basis on which the model
was developed. Rainfall data were obtained from the SASRI weather web page
(http://portal.sasa.org.za/weatherweb). Station 151, ULOA (28°29'0" S, 32°17'0" E) was
assumed representative of the Umfolozi Flats, based on its centrality. The position of
the rainfall station was marked on the orthophoto in Figure 3.2. The station had
uninterrupted daily rainfall records for 53 years. These rainfall records were used to
calibrate a stochastic rainfall generator as described below.
The first step in the development of a rainfall generator was to determine whether it
rained on a particular day. For example using Figure 3.5, if on the 30th of April it did not
rain, the probability of rainfall (Pdry) on the 1st of May would be approximately 0.10. A
0.00
0.02
0.04
0.06
0.08
0.10
0.12
0.14
0.16
0.18
0.20
Jan
Feb
Mar
Apr
May Jun
Jul
Aug Sep
Oct
Nov Dec
Prob
abili
ty
Pdry PwetPwet Pdry

30
random number between zero and one was then generated. If this number was below
0.10 a rainfall event occurred. The second step was to determine the amount of rainfall
that would occur. A second random number between zero and one was generated and
compared to the probability limits as seen in Figure 3.6. For the 1st of May, if the
number was between 0.00 and 0.20 then less than 5 mm of rain fell on that day. If the
random number was between 0.20 and 0.53 then the amount of rainfall that fell was
between 5 mm and 10 mm. If the random number was between 0.53 and 0.86 then the
amount of rainfall that fell was between 10 mm and 30 mm. Finally, if the random
number was between 0.86 and 1.00 then the amount of rainfall that fell was above
30 mm. From Figure 3.5, the probability to determine if it rains on the 2nd of May (Pwet )
then changes to 0.04. Therefore if the random number was below 0.04 it would have
rained for 2 days. The rainfall amount probabilities (Figure 3.6) are used again to
determine the amount of rainfall that can be expected on the second day of rain.
Figure 3.6 Rainfall depth probability i.e. the type of rainfall that can be expected
during the season
0
0.1
0.2
0.3
0.4
0.5
0.6
0.7
0.8
0.9
1
Jan
Feb
Mar
Apr
May Jun
Jul
Aug Sep
Oct
Nov Dec
Prob
abili
ty
"30" "10-30" "5-10" "<5"5mm≤p<10mm 10mm≤p<30mm p≥30mm p<5mm

31
3.3 Mill Mechanical Breakdowns
In order to accurately model the mill activity during the season, it was necessary to
simulate random mechanical mill breakdowns. The reason for the frequent breakdowns
was mainly as a result of a lack of maintenance. During the previous ownership little
effort was made to maintain the mill. Breakdowns are similar to no-cane mill stops;
however, the effect of a mill breakdown is more severe because of its unpredictability.
Management therefore cannot go through the same procedures of shutting down the mill
as they would when they were expecting a no-cane stop. Without the correct shutdown
procedures, it can be expected that the losses during start-up and shut-down will be
higher compared to no-cane stops (Table 3.4).
Mill breakdowns result in an increase in the length of the milling season. In order to
factor in the effect of an unpredicted mill breakdown, historic data were analysed in an
attempt to determine the frequency at which the mill experienced breakdowns. Over the
period 2007 – 2009 the mill experienced breakdowns on 64% of the days in operation.
The basic statistics from the mill stop data are summarised in Table 3.2.
Table 3.2 Basic statistics of mill mechanical mill stop data at Umfolozi
Statistic Value
Number of mill breakdowns 591
Breakdown frequency 64%
Minimum duration 0.05 hours
Maximum duration 24 hours
Mean duration 4.128 hours
Variance in duration 23.199
Coefficient of variance 1.167
The first step in creating a mill breakdown generator was to determine whether a
breakdown would occur on a particular day. On each day a random number between
zero and one was generated. If the number was less than 0.64 a mill breakdown would

32
be assumed. If so, the second step was to determine the length of the mill breakdown.
The duration of each breakdown ranged from 0.05 hours to 24 hours. A β-distribution
function was fitted to the breakdown duration data, as depicted in Figure 3.7. The β-
distribution function was used to calculate the duration of the mill stop based on the
parameters obtained from the β-distribution curve in Figure 3.7.
Figure 3.7 Distribution of mill breakdown data from the previous three seasons
3.4 Mill Crush Rate
Data supplied by the mill show that the mill crush rate was constantly adjusted in an
attempt to maintain a flow of cane through the mill. For example, if management knows
that there has been a problem with the tram system, the mill is set at the slowest
possible rate until supply is back to normal. The previous three seasons were analysed
to determine the maximum, minimum and average hourly crush rates. The mill‟s crush
rate can vary from 152 t.hr-1 to 407 t.hr-1. The average crush rate of the mill over the
past three seasons was 298 t.hr-1. Table 3.3 summarises the past three seasons‟ crush
rates in more detail.
0
0.05
0.1
0.15
0.2
0.25
0.3
1 2 3 4 5 6 7 8 9 10 11 12 13 14 15 16 17 18 19 20 21 22 23 24
Prop
ortio
n pe
r bar
Duration per mill breakdown (hours)

33
Table 3.3 Average, maximum and minimum hourly crush rates (t.hr -1) for the
seasons 2007 – 2009 at Umfolozi Mill
2007 2008 2009 Overall Average
Average 289 313 291 298
Maximum 418 390 412 407
Minimum 135 193 125 152
In the model, it was conservatively assumed that the crush rate varies between a
minimum crush rate of 83 t.hr-1 and an average crush rate of 220 t.hr-1, limited by how
much cane was available i.e. the mill cannot run faster to „catch up‟ lost time
(Williamson, 2010). The production manager stipulated a minimum crush rate of
83 t.hr-1 for the mill to continue running (Williamson, 2010). In the model the average
crush rate was calculated by determining the rate required for the mill to crush the
seasons‟ predicted tonnage of cane within the standard LOMS, without the
implementation of a stockpile. According to the data available from the past five
seasons, the mill generally opened in the second week of April and closed around the
23rd – 24th of December. This equates to an approximate season length of 260 days. In
order to achieve a LOMS of 260 days the average crush rate in the model was set to
220 t.hr-1.
3.5 Stockpile Size and Rate of Replenishment
The Umfolozi Mill does not currently maintain a substantial stockpile. It was decided
that the stockpile in the model should be able to keep the mill running for an additional
24-hours. Thus, during a no-cane stop the stockpile should be capable of mitigating
5 mm – 10 mm rainfall events. The size of the stockpile was therefore set to 3696 tons
(70% x 24 hr x 220 t.hr-1) – one days worth of cane from the Umfolozi Flats.
During simulations, the rate of replenishment of the stockpile was assumed to be
constant at 10% of the total stockpile i.e. 369.6 tons of cane was added to the stockpile
every day. While maintaining first-in first-out principle the stockpile would achieve
maximum capacity after 10 days. The assumption that the harvesting teams would be
able to increase their capacity by 10% was confirmed by the tram system manager.

34
3.6 Cost of No-cane Stops
A no-cane stop occurs when there is insufficient cane for the mill to continue crushing.
The processes in the sugar mill require a constant flow of material to operate at an
optimum. A no-cane stop prevents the constant supply of cane to the mill, creating
inefficiencies and increasing the cost of sugar production. Another factor that required
consideration was cane deterioration and contamination. For example, if cane remains
in the diffuser for prolonged periods of time, non-sucrose contaminants such as dextran
develop. This affects the quality of the sugar crystal development.
In order to estimate the typical cost of a no-cane stop at the Umfolozi Mill, contact was
made with the mill production manager. The main costs of a no-cane stop constitute the
cost of coal and the liquidation cost. During a stop the mill can burn up to 100 tons of
coal, 50 tons during shut-down and 50 tons during start-up (Williamson, 2010). In
addition to the coal, there was approximately 10 tons of sugar that was lost as a result of
liquidation. During the development of the model, the cost of coal was set at R 710 per
ton and sugar losses were equated to R 4 400 per ton. The total cost of a mill stop, start
up and shut down, was calculated to be R 115 000. Table 3.4 gives a summary of the
components and cost of the no-cane mill stop. The table was used to determine the cost
of each mill stop and summed over the entire milling season.
Table 3.4 Summary of no-cane stop costs
Component Quantity (tons)
Cost per ton (Rand per
annum)
Component Cost (Rand per annum)
Coal 100
710 71 000
Liquidation Losses
10 4 400 44 000
Total 115 000
3.7 Recoverable Value (RV) Data Input
Average daily RV values were generated for each day of the milling season. RV
attempts to account for the effect that cane quality has on sucrose recovery, and
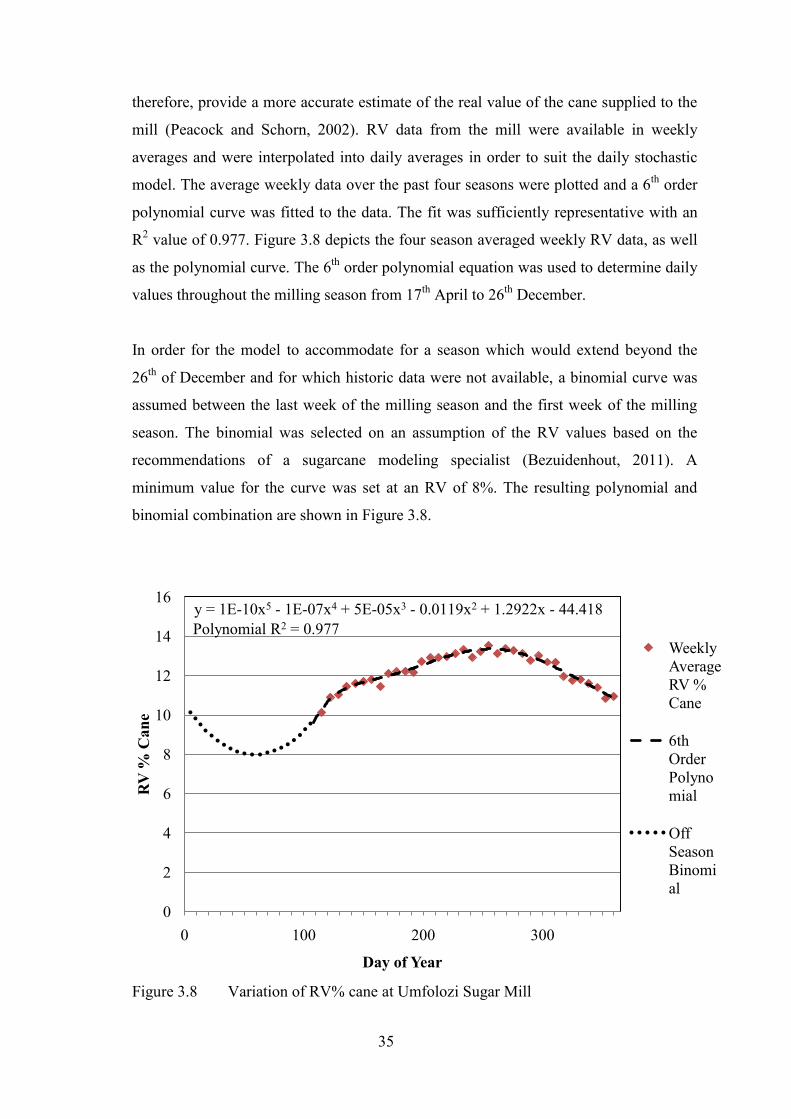
35
therefore, provide a more accurate estimate of the real value of the cane supplied to the
mill (Peacock and Schorn, 2002). RV data from the mill were available in weekly
averages and were interpolated into daily averages in order to suit the daily stochastic
model. The average weekly data over the past four seasons were plotted and a 6th order
polynomial curve was fitted to the data. The fit was sufficiently representative with an
R2 value of 0.977. Figure 3.8 depicts the four season averaged weekly RV data, as well
as the polynomial curve. The 6th order polynomial equation was used to determine daily
values throughout the milling season from 17th April to 26th December.
In order for the model to accommodate for a season which would extend beyond the
26th of December and for which historic data were not available, a binomial curve was
assumed between the last week of the milling season and the first week of the milling
season. The binomial was selected on an assumption of the RV values based on the
recommendations of a sugarcane modeling specialist (Bezuidenhout, 2011). A
minimum value for the curve was set at an RV of 8%. The resulting polynomial and
binomial combination are shown in Figure 3.8.
Figure 3.8 Variation of RV% cane at Umfolozi Sugar Mill
0
2
4
6
8
10
12
14
16
0 100 200 300
RV
% C
ane
Day of Year
Weekly Average RV % Cane
6th Order Polynomial
Off Season Binomial
Polynomial R2 = 0.977y = 1E-10x5 - 1E-07x4 + 5E-05x3 - 0.0119x2 + 1.2922x - 44.418

36
3.8 Sucrose Deterioration in the Stockpile
The sugar supply chain is affected at all times by the deterioration of sucrose after
harvesting. It has been found that in order to reduce losses in revenue, the harvest to
crush delay (HTCD) should be reduced to a minimum (Lyne and Meyer, 2005). The
implementation of the stockpile will add an additional 24-hour delay to the HTCD. A
calculation of the sucrose loss that occurs in the stockpile was required to ensure that
the model does not over-estimate the positive economic effect associated with a
stockpile. Lionnet (1986) demonstrated that mathematical equations can be used to
estimate sucrose loss, the rate of which is dependent on temperature. Using this method
and daily temperature data at the mill a daily percentage deterioration during the milling
season was calculated.
Data from the ULOA Weather Station was used to calculate the average daily
temperature in degrees Celsius for Umfolozi. The average temperature for each day of
the year was plotted in Figure 3.9. This data was used as the temperature input in
Lionnet‟s (1986) deterioration calculation. It should be noted that the temperature used
was from a Stephenson Screen temperature gauge which records the ambient
temperature in shade. The actual temperatures experience by the stockpile in direct
sunlight may be far greater. In addition, the deterioration of sucrose is an exothermic
reaction and will thus increase the temperature of the sugarcane (Lionnet, 1986). The
decision to use the Stephenson Screen temperature in calculating sucrose loss was
conservative and actual values for sucrose loss may be far greater.

37
Figure 3.9 Average daily temperature at Umfolozi
The deterioration of sucrose may be assumed to be a chemical process with reactants
and products occurring at a certain rate (Lionnet, 1986). It is therefore possible to apply
the integrated first-order rate law (Equation 3.1) to estimate deterioration (Lionnet,
1986; Zumdahl and Zumdahl, 2000)
( 3.1 )
Where: At
A0
k1
t
=
=
=
=
concentration of sucrose at time t
concentration of sucrose at time zero
first order rate constant
time in hours
Assuming that temperature had a significant effect on the rate of deterioration and based
on data from experimentation and data sets from different countries Lionnet (1986)
obtained an estimate for the first order rate constant. Equation 3.2 was Lionnet‟s (1986)
result of assessing the effect of temperature using the Arrhenius equation.
( 3.2 )
Where: T = Average temperature experience by the sugarcane (K)
0
5
10
15
20
25
30
Jan Feb Mar Apr May Jun Jul Aug Sep Oct Nov Dec
Aver
age
daily
tem
pera
ture
(°
C)
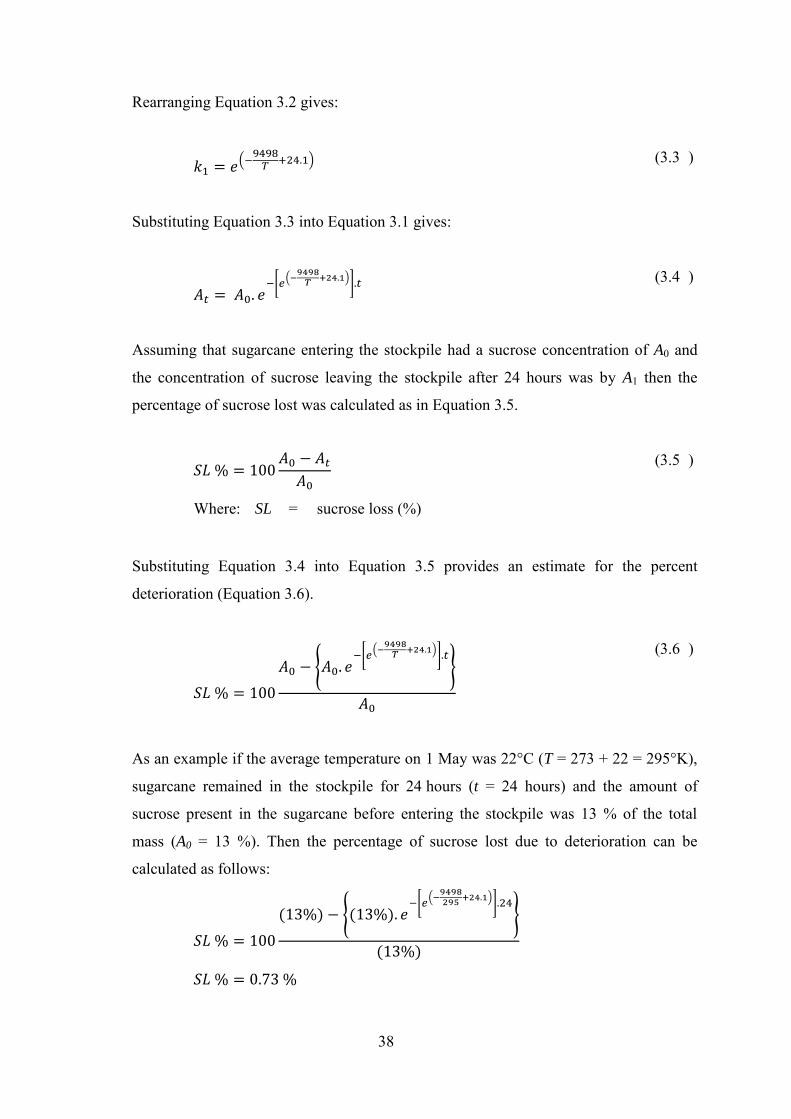
38
Rearranging Equation 3.2 gives:
( 3.3 )
Substituting Equation 3.3 into Equation 3.1 gives:
( 3.4 )
Assuming that sugarcane entering the stockpile had a sucrose concentration of A0 and
the concentration of sucrose leaving the stockpile after 24 hours was by A1 then the
percentage of sucrose lost was calculated as in Equation 3.5.
( 3.5 )
Where: SL = sucrose loss (%)
Substituting Equation 3.4 into Equation 3.5 provides an estimate for the percent
deterioration (Equation 3.6).
( 3.6 )
As an example if the average temperature on 1 May was 22°C (T = 273 + 22 = 295°K),
sugarcane remained in the stockpile for 24 hours (t = 24 hours) and the amount of
sucrose present in the sugarcane before entering the stockpile was 13 % of the total
mass (A0 = 13 %). Then the percentage of sucrose lost due to deterioration can be
calculated as follows:

39
Therefore, 0.73 % of the sucrose present in the sugarcane is lost due to deterioration,
i.e. the percentage of sucrose in the sugarcane after remaining in the stockpile was:
13% – 0.0936%
( 3.7 )
The above method was applied to all sugarcane which passed through the stockpile.
The percentage of sucrose lost varied according to the average temperature of each day
throughout the milling season.
3.9 Capital Investment and Budgeting
The construction of additional tram trucks are the only capital expenditure required to
implement a stockpile at Umfolozi. A stockpile of 3696 tons would require 711 tram
trucks (5.2 ton loading capacity). The mill is currently operating with a surplus of 100
trucks (McGrath, 2010). The mill area would therefore have to invest in an additional
611 trucks. The current cost of a new tram truck is approximately R 18 000. The
stockpile would therefore require an initial investment of R 10 998 000. The rail system
does not require any changes to accommodate the stockpile (Figure 3.3).
Capital budgeting is a procedure for evaluating the effects of management‟s investment
choices on a business‟s profitability, risk, and liquidity (Barry et al., 2000). It helps
managers to identify potential investment options and provides a means of assessment
of the investment. A capital budget of the savings generated by each scenario was
carried out. The capital budget calculates the present value of income generated in the
future. The capital budgeting method accommodates the depreciation of capital over
three years at a rate of 50%, 30% and 20%, respectively. The depreciation of capital was
tax deductable. The present value (PV) of the net cash flow was calculated for each year
in the future. The PV Was then subtracted from the total capital expenditure in order to
determine the number of years it will take for the investment to break even. The inputs
into the capital budget are given in Table 3.5.

40
Table 3.5 Input parameters to the capital budget
Variable Value
Initial Investment R 10 998 000
Depreciation of Capital
Year 1 50%
Year 2 30%
Year 3 20%
Discount Rate 5%
Risk 2%
Tax on revenue 40%
3.10 Simulations
Monte Carlo simulations were carried out to generate results for LOMZI. Monte Carlo
simulations are best suited for simulations where there is uncertainty and a wide range
of inputs in the model (Tijms, 2003). There are a number of methods that can be
followed when running Monte Carlo simulations (Tijms, 2003). In most situations they
follow the following four steps.
1. Define input domain,
2. Generate inputs randomly from the domain,
3. Run the model using the inputs, and
4. Aggregate the results of the model into one result.
In the case of LOMZI, the domain of random inputs was the possible rainfall that could
occur at Umfolozi. Random generators in the model generated typical seasons of
rainfall. For example, some years could be considered drought seasons while others
would be above average rainfall. This information was run through the model and a
group of results was obtained for each setting of independent inputs. For each
simulation a control was also attained by simultaneously running the model with no
stockpile. This ensured that each season was compared to a reference year on year.

41
Three different scenarios were assessed, as described below. The three scenarios were
simulated over 1000 stochastic seasons.
Scenario 1: Assume zero percent deterioration in the stockpile, and maintain the
stockpile throughout the season.
Scenario 2: Assume zero percent deterioration in the stockpile, and maintain a
stockpile only during the summer.
Scenario 3: Assume different degrees of deterioration (from 0 to 1% RV per day) in
the stockpile and maintain the stockpile throughout the season.

42
4. RESULTS AND DISCUSSION
A series of simulations were carried out while varying the inputs to the LOMZI Model.
Each run of the model consisted of 1000 stochastic seasons. The output was aggregated
into a set of graphs that indicate the opportunities around the creation of a stockpile.
4.1 Stockpile Simulations
A sensitivity analysis of the results was carried in line with standard procedures (Saltelli
et al., 2004). Figure 4.1 shows how the average quantity of cane in the stockpile varies
through the milling season and the average number of no-cane stops each month.
During the winter months, May to August, the average amount of cane present in the
stockpile is approximately 2 500 tons, which when including cane from the dry areas is
equivalent to 18.6 hours of stock and relatively close to the 24 hour buffer that is
provided. The cane quantity then drops rapidly to 1 750 tons by mid October or 15.1
hours of stock. This can be attributed to the change in rainfall probabilities as depicted
in Figure 3.5. The average number of no-cane stops with a stockpile present changes
from 1.5 days to 2.2 days between September and October. During spring there is an
increase in the rainfall probability, with more frequent and prolonged rainfall events
decreasing the average daily stockpile of cane. In order to achieve greater stockpile
effectiveness it may be worth considering increasing the capacity of the stockpile to 48
hours during the prolonged rainfall event periods.
Considering the lower utilisation of the stockpile during winter it may be worth
switching the stockpile off. However, it has been shown that the stockpile is more
effective in mitigating one day rainfall events, which are more frequent in winter as
shown in the consecutive day rainfall probability analysis in Figure 3.5.

43
Figure 4.1 Average quantity of cane present in the stockpile (tons) throughout the
season (cane deterioration excluded)
Figure 4.2 illustrates the extent to which the stockpile reduced the length of the milling
season (LOMS). With an increase in the number of wet field days, i.e. days that
harvesting is not possible on the Umfolozi Flats, there is an increase in the benefit of the
stockpile. This can be seen in the widening of the linear lines towards the right of the
graph. At the minimum number of wet field days the stockpile decreases the LOMS by
six days. At the maximum number of wet field days there is a reduction in the LOMS
by 12 days. There will be a rise in mill area profits as a result of a larger proportion of
cane crushed at a peak RV due to the reduced LOMS. A simple rule of thumb could be
Jan Feb Mar Apr May Jun Jul Aug Sep Oct Nov Dec
0
500
1000
1500
2000
2500
3000
3500
Jan
Feb
Mar
Apr
May Jun
Jul
Aug Sep
Oct
Nov Dec Jan
0
0.5
1
1.5
2
2.5
3
3.5
4
4.5
5Q
uant
ity o
f can
e pr
esen
t in
stoc
kpile
(ton
s)
Aver
age
num
ber o
f no-
cane
stop
s per
mon
th
Average number of no-cane stops
Average number of no-cane stops (Stockpile)
Average accumulated stockpile

44
derived from these results, which proposed that a 24 hour stockpile will reduced the
LOMS by one day for every 2.7 wet days in the season.
Figure 4.2 The simulated trend between LOMS, the number of wet field days and
the implementation of a stockpile at Umfolozi Mill (cane deterioration
excluded)
The reduction in LOMS was also reflected in the change in the total length of no-cane
stops. The length of no-cane stops both without a stockpile and with a stockpile present
have been plotted in Figure 4.3. At an average of 52 wet field days, the stockpile
reduced the total length of no-cane stop hours by 52%.
The savings that will occur as a result of implementing the stockpile comprise two main
components: (a) savings as a result of reducing the number of mill stops, and (b)
savings as a result of crushing more cane during the peak RV period. Savings are
classified as purely the difference between the profits generated without a stockpile
235
240
245
250
255
260
265
270
275
280
285
20 30 40 50 60 70 80 90 100
LOM
S (D
ays)
Wet Field Days (Days)
Stockpile OFF
Stockpile ON

45
present and with a stockpile present while assuming all other costs were constant. This
amounted to a total of R 2 560 000. Savings achieved by reducing the number of mill
stops contributed 22% towards the total savings amount, while RV savings contributed
78%.
Figure 4.3 The simulated trend between total number of no-cane stop hours, wet
field days and the implementation of a stockpile at Umfolozi Mill (cane
deterioration excluded)
The savings incurred by reducing the length of the milling season are represented in
Figure 4.4. The stockpile and non-stockpile scenarios as well as the difference between
them is plotted and second order polynomials were fitted to the data, thus allowing
earnings comparisons on a season to season basis. The difference in earnings increases
non-linearly with an increase in the number of wet field days.
0
100
200
300
400
500
600
700
800
900
20 30 40 50 60 70 80 90 100
Tota
l num
ber o
f no-
cane
stop
hou
rs
Number of Wet Field (Days)
Stockpile OFF
Stockpile ON

Figure 4.4 The potential savings materialised when implementing a stockpile against the number of wet field days (cane deterioration
excluded)
R 0
R 1 000 000
R 2 000 000
R 3 000 000
R 4 000 000
R 5 000 000
R 6 000 000
R 592 000 000
R 594 000 000
R 596 000 000
R 598 000 000
R 600 000 000
R 602 000 000
R 604 000 000
R 606 000 000
R 608 000 000
R 610 000 000
0 20 40 60 80 100
RV S
avin
gs
Tota
l ear
ned
per y
ear o
n RV
Wet Field Days
Return on RV
Return on RV (Stockpile)
Diff Return on RV
46

47
Figure 4.5 represents the histogram of total savings data of 1000 simulated seasons. The
mean was chosen to represent the most likely outcome from the model. At mean of
R 2 560 000 the capital investment of the trams, R 10 998 000 (Section 3.9), would be
expected to break even in approximately 5 seasons. The capital budget for this scenario
is depicted in Table 4.1.
If the savings were to increase by 20%, there was a 20% decrease in the number of
seasons that it would take for the investment to break even. However, if there was a
20% decrease in savings the number of seasons to break even increases by 40%. The
capital budget therefore becomes more sensitive as the amount of savings decreases.
This emphasises the vulnerability of the stockpiles‟ ability to repay the capital
expenditure and depicts a decision with a relative high risk attached to it.
Figure 4.5 A histogram of 1000 seasons of total saving due to stockpiling at
Umfolozi (cane deterioration excluded)
0
20
40
60
80
100
120
140
160
180
0
0.02
0.04
0.06
0.08
0.1
0.12
0.14
0.16
0.18
Cou
nt
Prop
ortio
n pe
r bar
Total savings (Rands)
1 σ
(9 y
ears
)
Mod
e (5
yea
rs)
Mea
n (5
yea
rs)
1 σ
(4 y
ears
)

Table 4.1 Capital budget for a saving of R 2 560 000, definitions of the terms used are provided in Appendix A (cane deterioration
excluded)
Step Year 0 1 2 3 4 5 6
1 Investment (-ve) -10998000
2 Depreciation of Capital -5499000 -3299400 -2199600
3 Cost Saving per Year 2560000 2560000 2560000 2560000 2560000 2560000
4 Total Annual Cost Saving
(Real) - 2560000 2560000 2560000 2560000 2560000 2560000
5 Change on Taxable Income - -2939000 -739400 360400 2560000 2560000 2560000
6 Change in Tax (40%) - -1175600 -295760 144160 1024000 1024000 1024000
7 Change in Net Cash Flow -10998000 3735600 2855760 2415840 1536000 1536000 1536000
8 PV of ∆ Net Cash Flows (i =
7%) -10998000 3491215 2494331 1972045 1171807 1095147 1023502
9 Accumulative Net Income -10998000 -7506785 -5012454 -3040409 -1868602 -773455 250047
10 Percentage of Investment
Returned 0% 32% 54% 72% 83% 93% 102%
48

49
Figure 4.6 demonstrates the sensitivity of the lower values of total savings in relation to
repaying the capital investment. Below R 1 000 000 the number of seasons to break
even increases exponentially, therefore, an investment in the tram system will not make
financial sense. The model estimates that in 1000 seasons, 1.4% of the seasons would
generate a saving of less than R 1 000 000.
Figure 4.6 Seasons to break even with change in total savings (cane deterioration
excluded)
4.2 Cane Deterioration
The simulations in Section 4.1 were carried out with the cane deterioration in the
stockpile set at zero. This is unrealistic for cane that is stockpiled outside the mill for
24-hours. When this adjustment was added to the model, there was no advantage
achieved as a result of money saved from the reduction in mill stops and a peak RV
percent cane crush. The difference between the savings generated by the stockpile and
the cost of deterioration demonstrates the detrimental effect that cane deterioration has
on the earnings of a sugar supply chain. With deterioration set to zero the mean total
0
10
20
30
40
50
60
70
Num
ber
of y
ears
to b
reak
eve
n
Total Savings

50
saving generated by the stockpile was R 2 560 000, however, when deterioration was
set to the level determined using Lionnet‟s (1986) mathematical approach and daily
temperature data, the mill area lost an estimated total of R 1 160 000 per annum.
When considering the above values, it was apparent that the implementation of a 24-
hour stockpile adds to the cost of running the mill. Based on Lionnet‟s (1986) findings,
Figure 4.7 was generated to demonstrate the typical effect of deterioration on the total
savings generated by the stockpile. The blue line represents the percentage deterioration
of the original RV % and the green line represents the total savings generated by the
stockpile relative to temperature. For example, at 17 °C there was 0.4 % deterioration of
the original RV %. If the original RV % present in the sugarcane was 13 % (A0) then the
RV % remaining (A1) in the sugarcane after 24 hours at 17 °C would be calculated as
shown in Equation 4.1.
( 4.1 )
If the temperature of the stockpile was maintained at 17 °C throughout the milling
season the stockpile would breakeven and would not result in any savings to the mill
area. This is a highly unlikely scenario as the temperature of the stockpile most certainly
exceeds 17 °C in direct sunlight and with the added effect of respiring sugarcane. It was
apparent that at relatively low ambient temperatures deterioration severely affected the
total amount of savings. These results point to an unviable scenario.

51
Figure 4.7 Total savings sensitivity to the percentage reduction of RV % at varying
temperatures
0.0
0.2
0.4
0.6
0.8
1.0
1.2
1.4
1.6
1.8
2.0Pe
rcen
tage
redu
ctio
n of
RV
%
-R 10 000 000
-R 8 000 000
-R 6 000 000
-R 4 000 000
-R 2 000 000
R 0
R 2 000 000
R 4 000 000
0 5 10 15 20 25 30
Tota
l sav
ings
Temperature (°C)

52
4.3 Discussion
The LOMZI model inadvertently highlights the costs of interactions between the mill
and the fields. The costs are broken down into three sections: (a) the effect of LOMS on
the earnings of the mill area, (b) the cost of deterioration, and (c) the cost of mechanical
mill stops.
Creating a stockpile during the entire season decreased the LOMS by an average of
9 days. The decreased LOMS created a savings of R 1 999 000, when the cane
deterioration inside the stockpile was assumed negligible. The slight change in the
LOMS and the subsequent effect on earnings is worth noting and must be carefully
considered when new technologies or management scenarios are considered.
When a more realistic degree of deterioration was factored into the model, the losses
that were incurred were dramatic. The stockpile no longer saved money, but actually
cost the mill approximately R 1.2 million per annum. Deterioration deems the stockpile
unviable, but also highlights the importance (or possible severity) of any management
decision that would lengthen the harvest to crush delay. This indirect result should
caution stakeholders.

53
5. CONCLUSIONS AND RECOMMENDATIONS FOR FUTURE
RESEARCH
5.1 Conclusions
Sugar milling is extremely sensitive to cane supply consistency and cane quality as
highlighted in the literature review. Rainfall disrupts infield harvesting and increases the
amount of soil that enters a mill. The disruption to harvesting is often severe enough to
cause a mill no-cane stop. An unexpected no-cane stop decreases sugar production
efficiency. Processes that are particularly affected are diffusion, clarification and
crystallisation. The degree of deterioration is also increased due to the longer residence
time of sucrose in the various stages of sugar production. The combined effect is an
increase in the cost of sugar production. In order to reduce the number of no-cane stops
a modelling framework LOMZI was developed.
This research has created a mechanistic tool to drive decision making at the Umfolozi
Sugar Mill. It has documented the development and testing of a stochastic simulation
model, LOMZI. The model has achieved its purpose by providing significant and useful
feedback to the Umfolozi Mill. There have, however, been additional benefits realised
during the development of LOMZI.
The significance of the modelling framework is that LOMZI has, to the author‟s
knowledge, been the first modelling framework to stochastically include the effect of
rainfall patterns on the length of milling season (LOMS). The incorporation of rainfall
patterns sets LOMZI apart from other models in that a more comprehensive simulation
of possible seasons is now possible. It has potentially created a new modelling
framework where more emphasis is placed on environmental factors and risks. The
incorporation of environmental factors such as the change in rainfall patterns may have
a significant effect on the current perception of the optimum LOMS as well as how the
mill operates during the season.
In addition to questioning the LOMS, this study has once again emphasised the
crippling effect of cane deterioration. Inducing a further 24 hour delay as a result of a

54
stockpile in combination with high temperatures brings about a significant increase in
the amount of deterioration. Above an ambient temperature of 17 °C stockpiling
harvested cane outside the mill for 24 hours no longer brought about any financial gain.
Therefore, it was concluded that creating a stockpile of cane outside the mill should be
approached with extreme caution because of the non-linear sensitivity to temperature in
the final outcome.
This study highlights the importance of cane deterioration, LOMS, risk management
and how it relates to the integrated supply chain. It demonstrates how, on a large scale, a
cane supply dynamics model can be developed and successfully tested to reach a
conclusion. In developing LOMZI a framework has been created that could have a
similar application to other milling areas.
5.2 Recommendations for Further Research
LOMZI was successfully implemented at Umfolozi, however, in order for the LOMZI
framework to become more versatile some future adjustments may be required.
Deterioration in the cane quality has been quantified using Lionnet‟s (1986)
method of assessing the effect of temperature by applying the Arrhenius
equation. It can be assumed that there is a high variability in the temperature of
harvested cane from burn to crush. During and after burning the temperature will
be extremely high and therefore may increase the rate of deterioration. After
cooling the rate of deterioration may decrease to an acceptable level. If this is
the case, then an additional 24 hours in the stockpile may be less severe relative
to the deterioration soon after burning. Further research is needed at Umfolozi to
monitor how the temperature of harvested cane varies through the supply chain.
LOMZI did not account for a variable mill crush rate. If the mill is running
behind schedule the crush rate can be increased to maintain the predicted LOMS
and visa versa. By including the variable crush rate in the model a more accurate
prediction of the LOMS may be achieved.

55
The structure that LOMZI developed was rigid and applied only to the Umfolozi
Mill. Some aspects of LOMZI such as the mill mechanical breakdown generator
will be useful in future models and in other regions. A suggestion, therefore, is
that future models in similar fields become more object orientated. This will
allow for easier adaptation and more flexibility.
Additional rainfall stations could be added to the rainfall data using
triangulation. This would result in a more accurate simulation of the rainfall
patterns. A more comprehensive perspective of how rainfall affects the supply
area will help the model deal with rainfall variability. Hence, it would be
possible to model only parts of the cane supply being affected by rainfall.
LOMZI highlights the damaging result of prolonged rainfall events in early
October. Further research in the effect of these rainfall events may show that it
might make more economic sense for the mill to shut down for a long
maintenance during this period and reopen once the weather has stabilised into
summer.
Upon further analysis it was apparent that the current frequency of mechanical
breakdowns experienced at Umfolozi Mill seems more detrimental to the system
than no-cane stops. A model or similar framework could be created to estimate
the financial gains of increasing the maintenance, thus preventing frequent
breakdowns. Once again, the extended LOMS and decline in RV can be
anticipated as a significant loss.
The stockpile in LOMZI was maintained at all times throughout the season.
With effective weather forecasting the stockpile need only be created with the
approach of wet weather. This would decrease the impact that the deterioration
would have in LOMZI, but relies on forecast accuracy and risk management.
56
6. REFERENCES
Anonymous. 1927. Report of the committee on the handling of cane from field to
crusher. South African Sugar Journal, Congress and Exhibition 5(-): 65 - 72.
Barker, B. and S. B. Davis. 2005. Characterisation of Cane Varieties Based on Sugar
Processing Parameters. Proceedings of The South African Sugar Technologists'
Association(79): 76 - 88.
Barnes, A., E. Meyer and E. Schmidt. 2000. Evaluation of Methods to Reduce Harvest-
to-Crush Delays using a Simulation Model. Proceedings of The South African
Sugar Technologists' Association(74): 26 - 28.
Barnes, A. J., E. Meyer, A. C. Hansen, De La Harpe, E. R. and P. W. L. Lyne. 1998.
Simulation Modelling of Sugarcane Harvesting and Transport Delays.
Proceedings of The South African Sugar Technologists' Association(72): 18 - 23.
Barry, P. J., Ellinger, P. N., Hopkin, J. A. and Baker, C. B. 2000. Financial
Management in Agriculture. The Interstate Printers and Publishers, Danville.
Bezuidenhout, CN. 2011. Personal Communication, Sugarcane Modelling Specialist,
Pietermaritzburg, 16 March 2012.
Cuddihy, J. A., W. J. Simoneaux, R. N. Falgout and J. S. Rauh. 2005. Boiler Water
Treatment and Related Costs of Boilder Operation: An Evaluation of Boilers in
the Louisiana Sugar Industry. Journal of the American Society of Sugar Cane
Technologists(25): 17 - 30.
de Geus, A. P. 1992. Modelling to predict or to learn. Eur J Oper Res(59): 1-5.
Don, C. E. and P. Mellet. 1977. Calorific Values of South African Bagasse.
Proceedings of the South African Sugar Technologists' Association(51): 169 -
173.

57
Eggleston, G. and W. Harper. 2006. Determination of sugarcane deterioration at the
factory: Development of a rapid, easy and inexpensive enzymatic method to
measure mannitol. Food Chemistry 98(2): 366-372.
Engelbrecht, G. N., E. van Dyk, P. M. U. Schmitz, W. L. Bean, C. Ndala, C. N.
Bezuidenhout, P. Lyne, E. Dube and R. Giles. 2009. Developing a Quantitative
Supply Chain Analysis Toolbox for the Sugar Industry in South Africa.
CSIR/BE/LQM/IR/2008/0110/B.
Fawcett, T. 2006. An introduction to ROC analysis. Pattern Recognition Letters
(27)861 - 874.
Gaucher, S., P. Y. Le Gal and G. Soler. 2003. Modelling Supply Chain Management in
the Sugar Industry. Proceedings of the South African Sugar Technologists'
Association(77): 542 - 554.
Hatchuel, A. and H. Molet. 1986. Rational modelling in understanding human decision-
making: about two case studies. Eur J Oper Res(24): 178-186.
James, D. R., G. A. Matthesius and P. F. Waldon. 1978. Heat Transfer, Mass Transfer
and Scaling Characteristics in a Long Tube, Climbing Film, Pilot Plant
Evaporator. Proceedings of the South African Sugar Technologists'
Association(52): 64 - 68.
James, E. and J. Caskey. 1963. A Markov chain model for the probability of
precipitation occurrance in intervals of various length. Monthly Weather
Review298 - 301.
Le Gal, P. Y., C. Lejars and S. Auzoux. 2003. MAGI: A Simulation Tool to Address
Can Supply Chain Management. Proceedings of The South African Sugar
Technologists' Association555-560.

58
Le Gal, P. Y., E. Meyer, P. Lyne and O. Calvinho. 2004. Value and Feasibility of
Alternative Cane Supply and Scheduling for a South African Mill Supply Area.
Proceedings of The South African Sugar Technologists' Association81-94.
Lionnet, G. R. E. and D. C. Walthew. 2004. Aspects of the Effects of Silica during Cane
Sugar Processing. Proceedings of The South African Sugar Technologists'
Association(78): 55 - 64.
Lionnet, G. R. E., M. Pillay and B. Thibela. 2005. The Effect of Selected Factors on
Percolation in Pilot Diffusion Columns. Proceedings of The South African Sugar
Technologists' Association(79): 249 - 257.
Lionnet, G. R. E. 1986. Post-harvest deterioration of whole stalk sugarcane.
Proceedings of The South African Sugar Technologists' Association(58): 52 - 57.
Lonsdale, J. E. and J. M. Gosnell. 1976. Growth and Quality of Four Sugarcane
Varieties as Influenced by Age and Season. Proceedings of the South African
Sugar Technologists' Association(50): 82 - 86.
Loubser, R. C. and M. A. Gooch. 2004. DRI - What is it? Proceedings of the South
African Sugar Technologists' Association(78): 403 - 412.
Lyne, P. W. L. and E. Meyer. 2005. Impacts of Harvest to Crush Delay on Grower
Revenue. Proceedings of The South African Sugar Technologists' Association
79428 - 434.
Maclean, A. 1949. A System for the Mechanisation of Cane Harvesting. S.A. Surgar
Journal72 - 78.
McGrath, L. 2010. Personal Communication, UCOSP Cane Supply Manager,
Mtubatuba, South Africa, 01 October 2010.

59
Meadows, D. M. 1996. Raw Juice Flow Control, Screening, Heating and Liming.
Proceedings of the South African Sugar Technologists' Association(70): 272 -
276.
Meyer, E. 2005. Machinery Systems for Sugarcane Production in South Africa. PhD
diss. Mount Edgecombe, South Africa: South African Sugarcane Research
Institute.
Meyer, E., N. Govender and M. St J Clowes. 2002. Trials Comparing Semi-Mechanised
and Chopper Harvesting Methods over Three Seasons in Swaziland.
Proceedings of The South African Sugar Technologists' Association(76): 120 -
134.
Meyer, J. H. and R. van Antwerpen. 2001. Soil degradation as a factor in yield decline
in the South African sugar industry. Proceedings of the South African Sugar
Technologists Association 24(2): 8-15.
Mkhize, S. C. 2003. Clear Juice Turbidity Monitoring for Sugar Quality. Proceedings of
The South African Sugar Technologists' Association(77): 414 - 422.
Moor, B. S. C. 1994. Review of Cane Shredding. Proceedings of The South Afrcian
Sugar Technologists' Association(68): 162-165.
Muchow, R. C., A. J. Higgins, W. T. Andrew and M. A. Haynes. 2000. Towards
improved harvest management using a systems approach. Proceedings of the
2000 Conference of the Australian Society of Sugar Cane Technologists30-37.
Palairet, H. E. H. 1932. Portable Field Tramlines. S.A. Surgar Journal, Congress and
Exhibition62 - 64.
Payne, J. H. 1968. Cane Diffusion - the Displacement Process in Principle and Practice.
Proceedings of the International Sugar Cane Technology(13): 103-121.

60
Peacock, S. D. and P. M. Schorn. 2002. Crystal Recovery Efficiency as an Overall
Measure of Sugar Mill Performance. Proceedings of the South African Sugar
Technologists Association 76544 - 560.
Rama, S., R. A. Dehrmann, H. Zungu and D. G. Sweet. 2006. The Effect of Clay Type
Soil in the Diffuser at Umfolozi Mill. Proceedings of The South African Sugar
Technologists' Association(80): 320 - 326.
Ravno, A. B. and B. S. Purchase. 2005. Dealing with Dextran in the South African
Sugar Industry. Proceedings of The South African Sugar Technologists'
Association(79): 28 - 47.
Reid, M. J. and A. Dunsmore. 1991. The Protection of Boilers from Sugar
Contamination in Feedwater. Proceedings of The South African Sugar
Technologists' Association(65): 208 - 212.
Reid, M. J. and G. R. E. Lionnet. 1989. The Effect of Tops and Trash on Cane Milling
Based on Trials at Maidstone. Proceedings of The South African Sugar
Technologists' Association(63): 3 - 6.
Reid, P. W. 1995. A Comparison of Cane Diffusion and Milling. Proceedings of The
South African Sugar Technologists' Association(69): 196 - 200.
Rein, P. W. 2007. Cane Sugar Engineering. Bartens, Berlin, Germany.
Rein, P. W. 1990. Encrustation and Scaling in Continuous Sugar Vacuum Pans.
Proceedings of The South African Sugar Technologists' Association(64): 204 -
208.
Rein, P. W. and M. G. S. Cox. 1987. Syrup Clarification in Raw Sugar Mills.
Proceedings of The South African Sugar Technologists' Association(61): 22 - 31.
Rein, P. W. and E. T. Woodburn. 1974. Extraction of sugar from cane in the diffusion
process. The Chemical Engineering Journal 7(1): 41-51.

61
Ried, M. J. 2006. Why do We Continue to Burn so Much Coal? Proceedings of The
South Afrcian Sugar Technologists' Association(80): 353 - 363.
Ried, M. J. 1994. A Review of Cane Knifing. Proceedings of The South African Sugar
Technologists' Association(68): 150-161.
Saltelli, A., Tarantola, S. and Campolongo, F. 2004. Sensitivity analysis in practice : a
guide to assessing scientific models. John Wiley, Hoboken, NJ.
Simpson, R. and S. B. Davis. 1998. Investigation into the Filtering Quality of Raw
Sugar. Proceedings of The South African Sugar Technologists' Association(72):
242 - 248.
Smits, J. H. M. and R. L. Blunt. 1976. The Implication of Poor Cane Quality.
Proceedings of The South African Sugar Technologists' Association(-): 227 -
230.
Tijms, H. C. 2003. A first course in stochastic models. Wiley, Chichester.
Walthew, D. C., F. Khan and R. Whitelaw. 1998. Some Factors Affecting the
Concentration of Silica in Cane Juice Evaporators. Proceedings of The South
African Sugar Technologists' Association(72): 223 - 227.
Warner, T. A. 1923. Problems of Cane Transporation. S.A. Sugar Journal, Congress
and Exhibition 4339 - 43.
Williamson, A. 2010. Personal Communication, Umfolozi Sugar Mill Production
Manager, Mtubatuba, South Africa, 2010.
Wynne, A. T. and G. Groom. 2003. Technical Parameters used to Measure and Monitor
Length of Milling Season in the South African Sugar Industry. Proceedings of
The South African Sugar Technologists' Association(77): 66-76.
Zumdahl, S. S. and Zumdahl, S. A. 2000. Chemistry Zumdahl. Houghton Mifflin
Company, Boston, New York.

62
7. APPENDICES
Appendix A. Definition of terms used in the capital budget (Barry et al., 2000)
Term Definition
Investment The initial equity the investor commits to the
project.
Depreciation of Capital An accounting procedure by which the purchase
cost of a depreciable asset, in this case the tram
trucks, in prorated over its projected economic life.
Total Annual Cost Saving (Real)
Yearly savings as a result of the implementation of
the capital investment.
Change on Taxable Income Total savings generated by the investment less
depreciation.
Change in Tax (40%) Tax rate on taxable income.
Change in Net Cash Flow Taxable income less tax.
PV of ∆ Net Cash Flows (i = 7%) Accounts for the timing and magnitude of the
projected cash flows in the future.
Accumulative Net Income
Total income as a result of the investment summed
year on year.
Percentage of Investment
Returned
Accumulated net income divided by initial
investment

63
Appendix B. Inputs to model Variable Value
Number of Simulations 1000
Slowest Daily Crush 2 000 tons
Slowest Crush Cost R 115 000 per day
Season Length Days 254 days
Average Seasonal Crush 1 100 000 tons
Regeneration of Stockpile 0.1
Mill Season Start 08-Apr
Rands Per Ton RV R 4 500 per ton RV
Rands Per Ton Coal R 710 per ton coal
Cost per ton Liquidation Losses R 4 400 per ton sucrose
Capacity of Stockpile 3 711 tons
Possibility of breakdown during any day 64%
Factor for Deterioration 1
Delay From Harvest 24 hr
Percent Deterioration of Stockpile 0.03250 %
Stockpile Switch 08 Apr on
31 Dec off
01 Jan on
31 Jan off

64
Average Mill Close Date 24-Dec
Average Mill Close Date (Stockpile) 16-Dec
Percentage Spilt between Tram and Road
Tram 70%
Road 30%
Mill
Weely Crush 37 000 tons
Daily Crush 5 286 tons
Tram
Last 5 year average weekly delivery 25 978 tons
Last 5 year average daily delivery 3 711 tons
Road
Last 5 year average weekly delivery 11 022 tons
Last 5 year average daily delivery 1 575 tons

65
Appendix C. Example of a line of equations from the model
Variable Equation
DOY 1
Date 2010/01/01
5 <= X < 10 mm =[UmfoloziModel.xlsm]RainfallGenerator!E9
10 <= X < 30 mm =[UmfoloziModel.xlsm]RainfallGenerator!E10
X >=30 mm =[UmfoloziModel.xlsm]RainfallGenerator!E11
Fields Wet 0
Fields Wet Flag =IF(B6,1,0)
Potential Daily Tram Delivery
=IF(B2>=[UmfoloziModel.xlsm]Input!$B$9,[UmfoloziModel.xlsm]Input!$B$28,0)
Rain effected Tram Delivery
=IF(B6,0,B8)
Stockpile 10% per day =MAX(IF([UmfoloziModel.xlsm]Input!$B$17<B2,IF(B2<[UmfoloziModel.xlsm]Input!$B$18,[UmfoloziModel.xlsm]Input!$B$8*B9,0),0),IF([UmfoloziModel.xlsm]Input!$B$19<B2,IF(B2<[UmfoloziModel.xlsm]Input!$B$20,[UmfoloziModel.xlsm]Input!$B$8*B9,0),0))
Accumulated Cane Stockpile
=IF(B10>0,IF(A11<[UmfoloziModel.xlsm]Input!$B$13,SUM(B10,A11),A11),0)
Amount of Stockpile Cane Crushed
=IF(B6,A11,0)
Cane from dry area =IF(B2>=[UmfoloziModel.xlsm]Input!$B$9,[UmfoloziModel.xlsm]Input!$B$31,0)
breakdown =IF(RAND()<[UmfoloziModel.xlsm]Input!$B$21,1,0)
X =IF(B14=1,RAND(),"")
p 0.868918647354255
q 4.79062183921832
min 1
max 24
Hour Breakdown Simulator
=IF(B15<>"",BETAINV(B15,B16,B17,B18,B19),0)
Breakdown Stop Flag =IF(B20>0,1,0)
Breakdown Stop Flag (Stockpile)
=IF(B20>0,1,0)
Inseason Breakdown Stop Flag
=IF(B41>0,B21,0)

66
Inseason Breakdown Stop Flag (Stockpile)
=IF(B42>0,B22,0)
Breakdown Hours =IF(B21>0,B20,0)
Breakdown Hours (Stockpile)
=IF(B22>0,B20,0)
Inseason Breakdown Hours
=IF(B41>0,B25,0)
Inseason Breakdown Hours (Stockpile)
=IF(B42>0,B26,0)
=B9+B13
Mechanical Breakdown Effected Maximum Crush Rate
=[UmfoloziModel.xlsm]Input!$B$25-([UmfoloziModel.xlsm]Input!$B$25*(B25/24))
Min Column Y and Z =MIN(B29:B30)
=[UmfoloziModel.xlsm]Input!$B$7
Cane Remaining =IF(A32<A29,IF(B32>0,A32-A32,0),B32)
In Season Daily Crush 0
, =SUM(B9,B12,B13)
Mechanical Breakdown Effected Maximum Crush Rate (Stockpile)
=[UmfoloziModel.xlsm]Input!$B$25-([UmfoloziModel.xlsm]Input!$B$25*(B26/24))
Min Column AE and AF =MIN(B35:B36)
=[UmfoloziModel.xlsm]Input!$B$7
Cane Remaining (Stockpile)
1100000
In Season Daily Crush (Stockpile)
0
Mill open/closed =IF(B34>0,1,0)
Mill open/closed (Stockpile)
=IF(B40>0,1,0)
Reduced minimum crush rate as a result of mechanical mill stop
=[UmfoloziModel.xlsm]Input!$B$4-([UmfoloziModel.xlsm]Input!$B$4*(B25/24))
Daily Total Crush showing mill no cane stops
=IF(B41>0,IF(B34>=B43,B34,IF(C44<>0,"mill stop!!!",B34)),0)
Reduced minimum crush rate as a result of mechanical mill stop (Stockpile)
=[UmfoloziModel.xlsm]Input!$B$4-([UmfoloziModel.xlsm]Input!$B$4*(B26/24))

67
Daily Total Crush showing mill no cane stops (Stockpile)
=IF(B42>0,IF(B40>=B45,B40,IF(C46<>0,"mill stop!!!",B40)),0)
No. of hours Stop due to No Cane
=IF(B44="mill stop!!!",IF(B41>0,IF(B34<[UmfoloziModel.xlsm]Input!$B$25,(([UmfoloziModel.xlsm]Input!$B$25-B34)/[UmfoloziModel.xlsm]Input!$B$25*24)-B25,0),0),0)
No. of hours Stop due to No Cane (Stockpile)
=IF(B46="mill stop!!!",IF(B42>0,IF(B40<[UmfoloziModel.xlsm]Input!$B$25,(([UmfoloziModel.xlsm]Input!$B$25-B40)/[UmfoloziModel.xlsm]Input!$B$25*24)-B26,0),0),0)
No Cane Mill Stop Flag =IF(B47>0,1,0)
No Cane Mill Stop Flag (Stockpile)
=IF(B48>0,1,0)
Temperature Average (degree C)
25.5 (varies daily)
Percentage Decrease in RV
=100*(1-EXP(-1*(EXP(-9498/(AY3+273.15)+24.1))*Input!$B$15))
Daily RV % Cane 10.42423077
Daily RV % Cane (Stockpile)
=BA3-BA3*(AZ3/100)
Tons RV =(B51/100)*B34
Tons RV (Stockpile) =(B52/100)*B40
Return from RV =B53*[UmfoloziModel.xlsm]Input!$B$10
Return from RV (Stockpile)
=B54*[UmfoloziModel.xlsm]Input!$B$10