issues to watch: 2007 jonathan lash world resources institute december 19, 2006
DESCRIPTION
Issues to Watch: 2007 Jonathan Lash World Resources Institute December 19, 2006. 5 ISSUES TO WATCH. Prospects for Climate Legislation Climate and Energy in the Agriculture Bill Chesapeake Water Quality Initiative New Science and Technology International Process. Congressional Action?. - PowerPoint PPT PresentationTRANSCRIPT

Issues to Watch: 2007
Jonathan Lash World Resources Institute
December 19, 2006
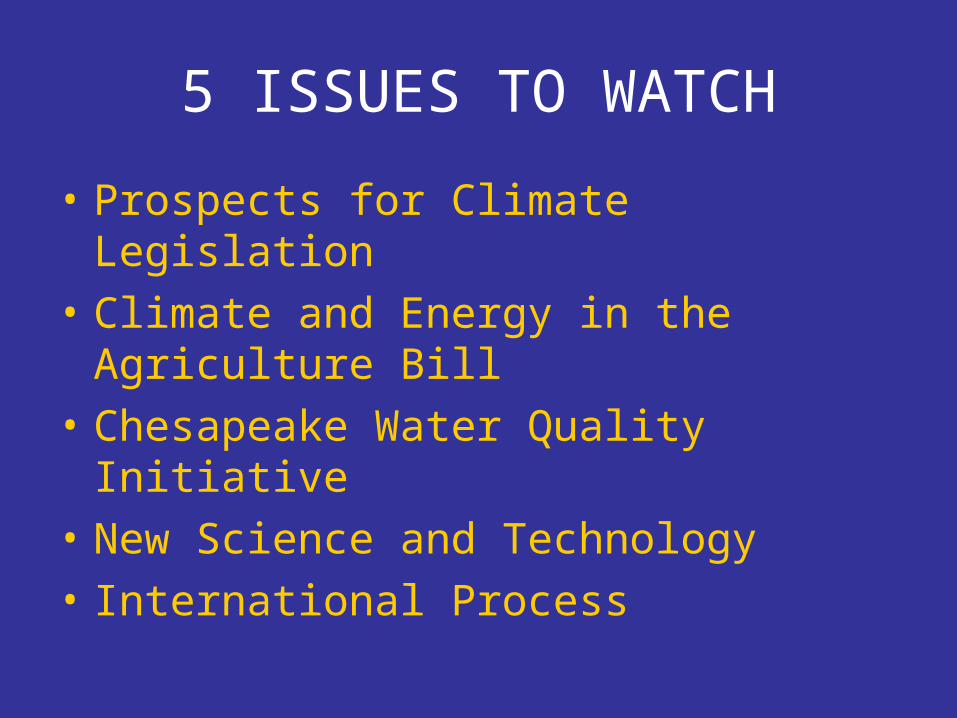
5 ISSUES TO WATCH
• Prospects for Climate Legislation
• Climate and Energy in the Agriculture Bill
• Chesapeake Water Quality Initiative
• New Science and Technology
• International Process

Congressional Action?

Lessons from the 2006 Election:
REPORT: November 17, 2006 A New Energy Future
“Campaign ads highlighted energy issues in a prominent and unprecedented way this election cycle and had a huge impact on the campaigns.”
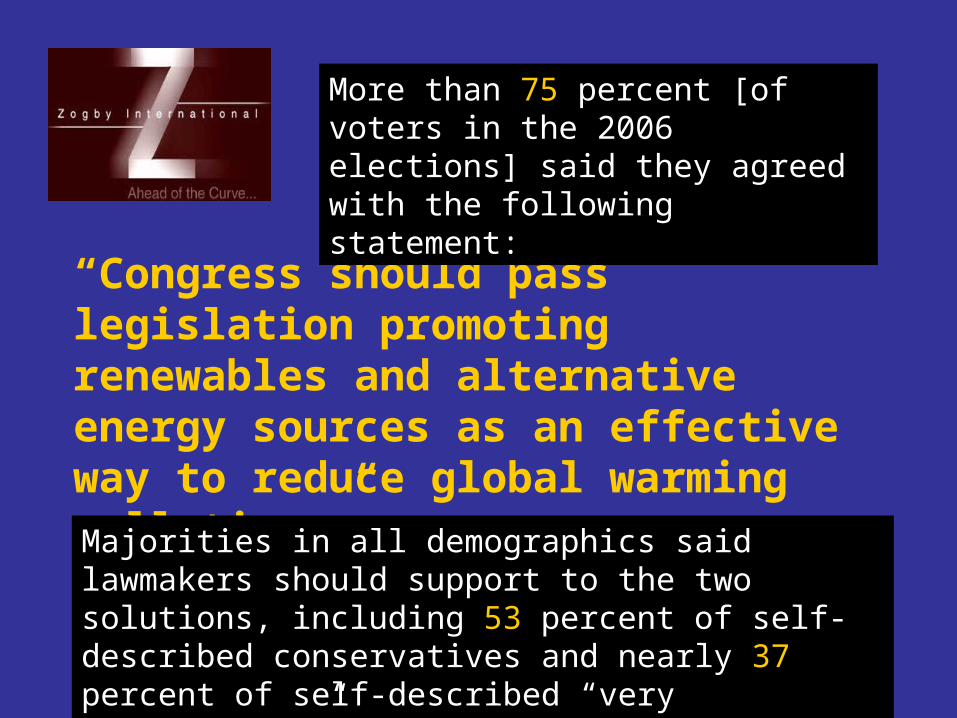
“Congress should pass legislation promoting renewables and alternative energy sources as an effective way to reduce global warming pollution.”
More than 75 percent [of voters in the 2006 elections] said they agreed with the following statement:
Majorities in all demographics said lawmakers should support to the two solutions, including 53 percent of self-described conservatives and nearly 37 percent of self-described “very conservative” voters.

August 28, 2005
Photo Credit: NASA/Jeff Schmaltz, MODIS Land Rapid Response Team
Hurricane Katrina
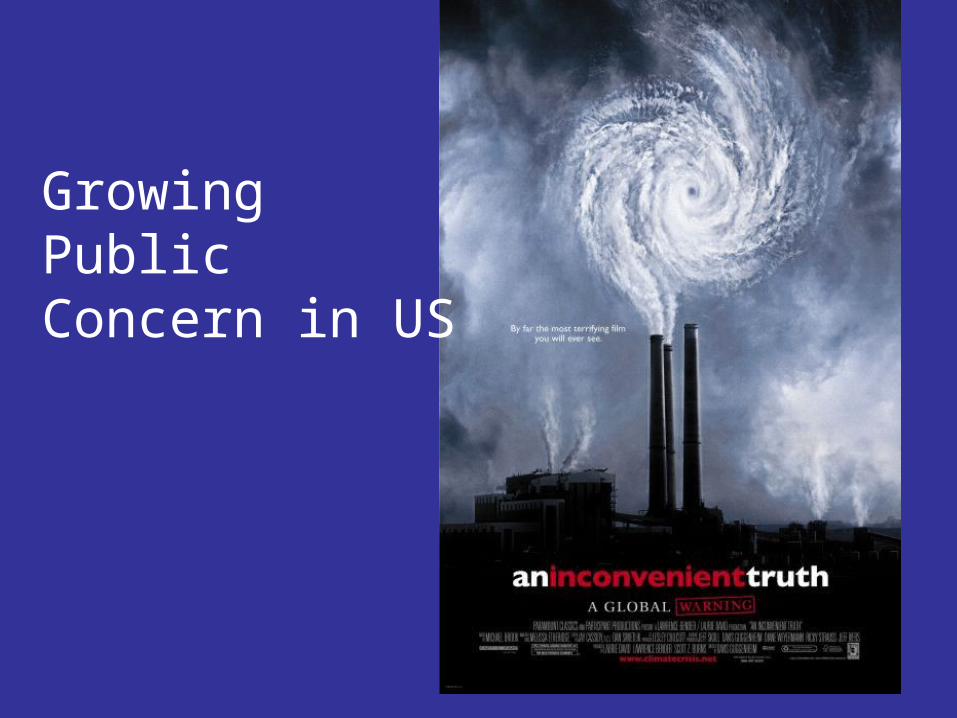
Growing PublicConcern in US

CALIFORNIA• Global Warming Solutions Act
(signed September 27, 2006):
– Caps California’s greenhouse gas emissions at 1990 levels by 2020.
– Requires State Air Resources Board to establish, monitor, and enforce compliance for statewide greenhouse gas emissions reporting program.
– Authorizes state board to adopt market-based compliance mechanisms including cap-and-trade.

• Goal: A regional cap-and-trade program initially covering CO2 emissions from power plants
– Stabilize emissions at base levels through 2014
– Reduce by 10% by 2018• Region statistics:
– 7 states represent 7% US total GHG emissions
1.5% of world GHG emissions ( Australia, rank 15th)
• Other states: – MD (signed; expected to implement
under new governor)– MA (expected to rejoin under new
governor)
Regulating U.S. Emissions in Northeast

50% of electricity sales subject to Renewable Portfolio Standards (RPS) / Renewable Energy (RE) goals
Goals in placeRPS in effect
20 states + D.C. with RPS 3 states w/ goals
Source: database of state incentives for renewable energy (2006)
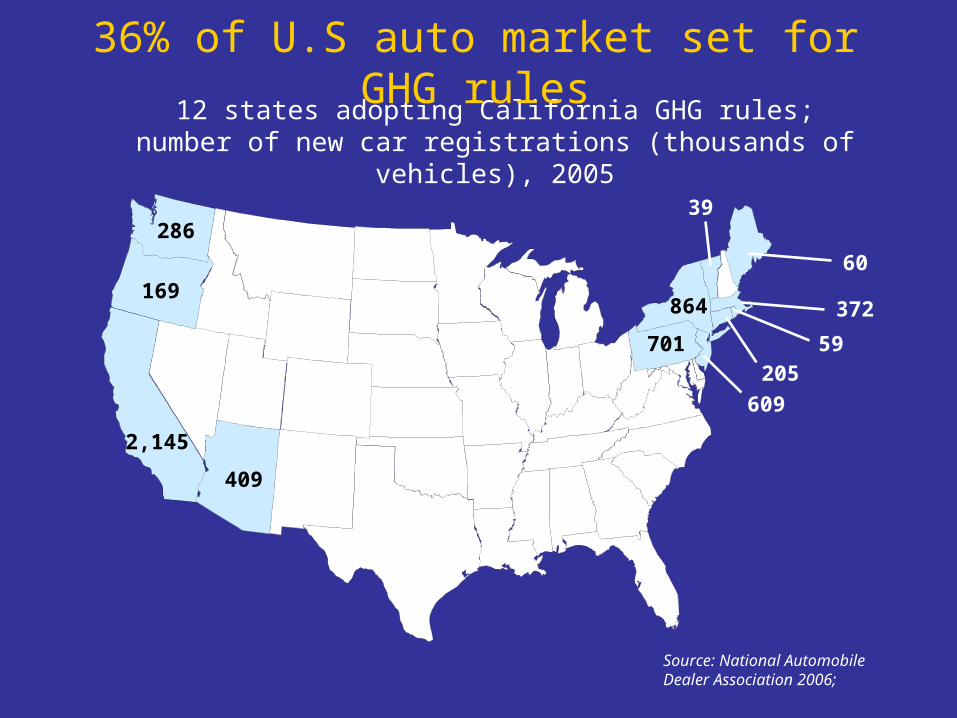
12 states adopting California GHG rules;number of new car registrations (thousands of vehicles), 2005
409
2,145
169
286
701
864
609
20559
372
60
39
Source: National Automobile Dealer Association 2006;
36% of U.S auto market set for GHG rules

Energy Efficiency
Coal-based Synfuels with CCS
Wind power
Reforestation
Mass transit
Tomorrow’s Markets
Carbon Capture & Storage
Adapted from:
Robert Socolow, www.princeton.edu/~cmi
Biofuels
GHG Reducing Products and Services


Andy RubenVice President of Corporate Strategy/Sustainability,Wal-Mart Stores, Inc.
Michael Murray,Director, Legislative Policy,Sempra Energy
Garth EdwardTrading Manager, Environmental Products,Shell Group
Jeff SterbaChairman, President and CEO,PNM Resources
David SlumpGeneral Manager, global marketing, GE Energy,General Electric Co.
Elizabeth A. MolerExecutive V.P., Government and Environmental Affairs &Public Policy,Exelon Corp.
Ruth ShawGroup Executive, Public Policy and President, Duke Nuclear,Duke Energy Corp.

Senate Committee: Environment and Public Works109th Congress
Republicans:
•James Inhofe, Committee Chair (OK)
•John Warner (VA)
•Christopher Bond (MO)
•George Voinovich (OH)
•Lincoln Chafee (RI)
•Lisa Murkowski (AK)
•John Thune (SD)
•Jim DeMint (SC)
•Johnny Isakson (GA)
•David Vitter (LA)
Democrats:
•James Jeffords, Minority leader (VT)
•Max Baucus (MT)
•Joseph Lieberman (CT)
•Barbara Boxer (CA)
•Thomas Carper (DE)
•Hillary Rodham Clinton (NY)
•Frank Lautenberg (NJ)
•Barack Obama (IL)
Incumbent replacements for 110th Congress:
Sheldon Whitehouse (D-RI)
Bernard Sanders (I-VT)- New Committee Chair
- Will not be serving in 110th Congress


CARS and COAL
American Electric Power, Zimmer Coal Plant,
Moscow, Ohio

Global Markets
Can We ReduceGHGs and StillCompete Globally?

In the last 10 years the United States has consumed approximately 72.4 billion barrels of oil. More than 50% of that was imported.
* Based on data from the Energy Information Administration (EIA) Report: Short-Term Energy Outlook, December 12 , 2006 Release

Source: DOE, Office of Energy Efficiency and Renewable Energy
Number of Gas Stations that carry E85

If the entire acreage under corn production in the United States (80 million acres) were turned over to ethanol production, it would only account for one eighth of current gasoline demand.
*Data from World Resources Institute
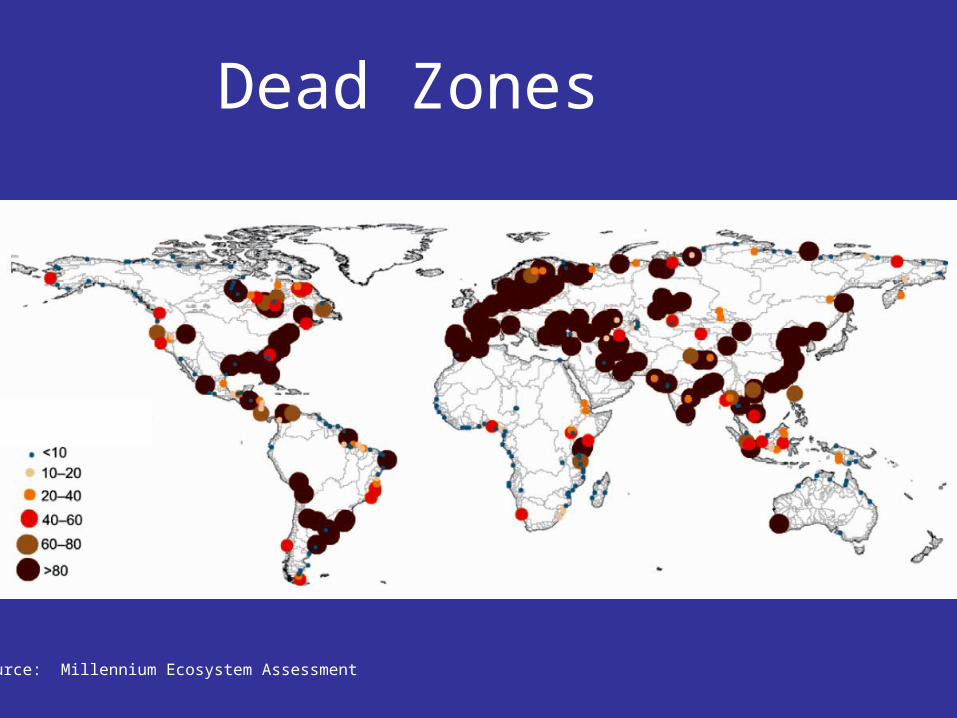
Dead Zones
Source: Millennium Ecosystem Assessment
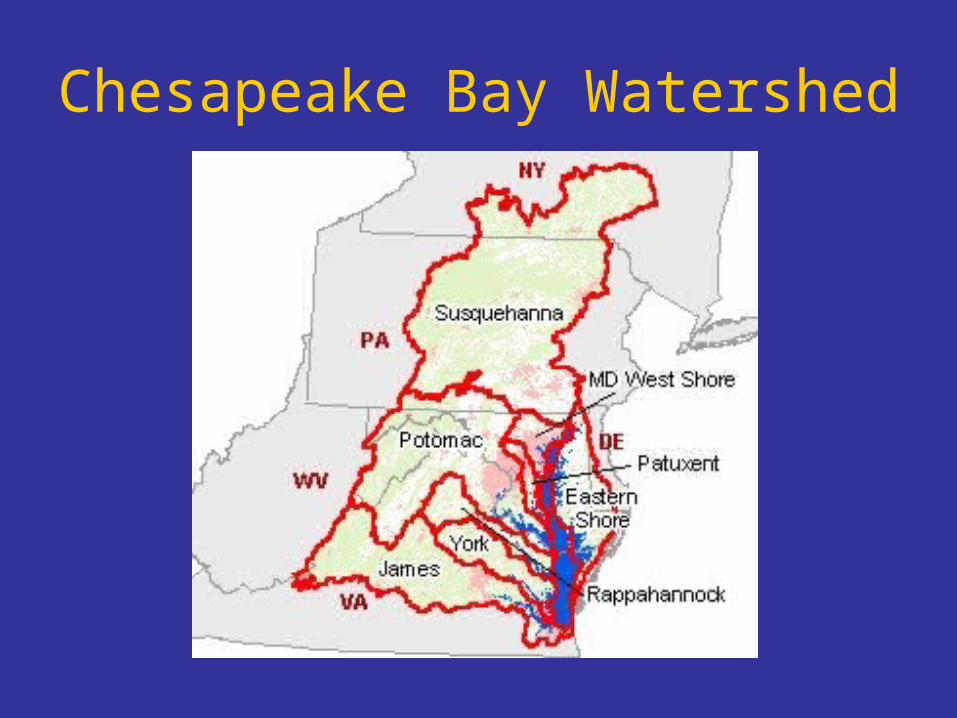
Chesapeake Bay Watershed

No dispute among scientific bodies…
Year Body Statement
2001 Intergovernmental Panel on Climate Change (IPCC)
“There is new and stronger evidence that most of the warming observed over the last 50 years is attributable to human activities.”
2001 U.S. National Academy of Science
“Greenhouse gases are accumulating in Earth's atmosphere as a result of human activities, causing surface air temperatures and subsurface ocean temperatures to rise.”
2003 American Geophysical Union “Human activities are increasingly altering the Earth's climate. … Scientific evidence strongly indicates that natural influences cannot explain the rapid increase in global near-surface temperatures observed during the second half of the 20th century.”
2003 American Meteorological Society “There is now clear evidence that the mean annual temperature at the earth’s surface, average over the entire globe, has been increasing in the past 200 years. There is also clear evidence that the abundance of greenhouse gases in the atmosphere has increased over the same period.”
2004 American Association for the Advancement of Science
no "substantive disagreement in the scientific community" that anthropogenic global warming is happening.
2005 Science academies of Brazil, Canada, China, France, Germany, Great Britain, Italy, Japan, Russia, U.S., India
Joint statement: "There is now strong evidence that significant global warming is occurring… It is likely that most of the warming in recent decades can be attributed to human activities. This warming has already led to changes in the Earth's climate."
2006 U.S. Climate Change Science Program
"clear evidence of human influences on the climate system."

Financial Times – December 2006
AP Photo
A Different Kind ofHot TimesOn theSlopes

Source: Science Magazine, Sep 16, 2005

Risk, for species diversity, wetlands, and coastal zones significantly increases when temperatures rise above 2º C
Hare, 2005; Potsdam Institute for Climate Impact Research

Cellulosic Ethanol Pilot Plant
Thin-film solar cells
Supercapacitor with Nanotechnology

Coal Gasification to Produce SNG
(North Dakota, USA)
(Sou
rce:
Dak
ota
Gas
ifica
tion
Petcoke Gasification to Produce H2(Kansas, USA)
(Sou
rce:
Che
vron
-Tex
aco)
Examples of Pre-CombustionCO2 Capture Systems

Venture capital flows to clean technology companies
0
100
200
300
400
500
600
700
800
900
1,000
1Q/04 2Q/04 3Q/04 4Q/04 1Q/05 2Q/05 3Q/05 4Q/05 Q1/06 Q2/06 Q3/06
Source: C leantech Venture Network
4%
6%
8%
10%
12%
14%
16%
18%
Clean Technology Venture Capital
% Overall Venture Capital

US R&D Expenditures 1981 - 2005
0
500
1000
1500
2000
2500
3000
350019
81
1982
1983
1984
1985
1986
1987
1988
1989
1990
1991
1992
1993
1994
1995
1996
1997
1998
1999
2000
2001
2002
2003
2004
2005
Year
$ M
illi
on
GROUP 1: ENERGY EFFICIENCY
GROUP II: FOSSIL FUELS
II.3 Total CO2 Capture and Storage
GROUP III: RENEWABLE ENERGY SOURCES
GROUP IV: NUCLEAR FISSION and FUSION
GROUP V: HYDROGEN and FUEL CELLS
GROUP VI: OTHER POWER and STORAGE TECHS
GROUP VI: TOTAL OTHER TECH./RESEARCH
Source: IEA R&D database http://www.iea.org/Textbase/stats/rd.asp

The Key is Top 25
S. Arabia
Top 25 in Emissions(80% World GHG Total)
Top 25 in Population Top 25 in GDP
USA, China, (EU25), Russia, India, Japan, Germany, Brazil, UK, Italy, Mexico, France,
Indonesia, Iran, Turkey
(68% World GHG Emissions)
Congo Ukraine, Pakistan
Canada, S.Korea, Australia, S.Africa, Spain, Poland, Argentina
Netherlands, (Taiwan)
Thailand
Bangladesh, Nigeria, Viet Nam, Philippines, Ethiopia, Egypt,
Source: WRI/CAIT

European Climate Exchange Futures and Contracts
Price and Volume

“China overtakes the United States as the world’s biggest emitter before 2010.”
-World Energy Outlook 2006 International Energy Agency

Per Capita Emissions, 2000
