istat feasibility studies for the coverage of public
TRANSCRIPT

ISTAT
FEASIBILITY STUDIES FOR THE COVERAGE OF PUBLIC INSTITUTIONS IN SECTIONS N AND O
Authors
Diego Bellisai1, Annalisa Lucarelli1, Maria Anna Pennucci1 and Fabio Rapiti1
ABSTRACT
1 ISTAT- Servizio Statistiche congiunturali sull’occupazione e sui redditi

Since 2003 Istat has been carrying out feasibility studies in order to extend the quarterly Labour Cost Index (LCI) to the NACE Rev.1. economic activity sections L, M, N and O, as required by the Council Regulation (EC) No 450/2003.
This Final Report concludes the feasibility studies on the public sectors of these sections focussing on sections N (health and social work) and O (other community, social and personal services activities).
Furthermore, in last chapter it includes the final feasibility study on the regular production of complete labour cost indices covering both the public and private sectors of sections L to O.
In particular, the following aspects are considered: the definition of the universe of sections N and O public institutions; the exploration of the available infra-annual administrative sources and of their data quality problems, and the comparison with the Annual Account benchmark data; the analysis of National Accounts quarterly estimation experimental method with a particular attention to overcome its limitations. In addition to this, some preliminary aggregate results, obtained by a combination of the administrative sources, are presented and compared to the quarterly National Accounts estimates.
Finally, the last chapter summarizes all the sources available for both the public and private sectors of sections L to O. It outlines two options for the LCI regular production in these sections, viable respectively in the medium and the long term. A cost-effectiveness analysis of these options is also carried out.

CONTENTS 1. INTRODUCTION 2. LIST OF ALL PUBLIC INSTITUTIONS IN SECTIONS N AND O 3. EXISTING SOURCES FOR SECTIONS N AND O PUBLIC SECTOR
3.1. MINISTRY OF HEALTH: THE ECONOMICAL ACCOUNT 3.2. GENERAL ACCOUNT DEPARTMENT: THE QUARTERLY REPORT ON CASH FLOWS
3.2.1. Data quality problems 3.2.2. A comparison with the Annual Account benchmark data
3.3. GENERAL ACCOUNT DEPARTMENT: THE QUARTERLY SURVEY ON NATIONAL HEALTH SERVICE UNITS 3.4. NATIONAL INSTITUTE OF SOCIAL SECURITY (INPS)
3.4.1. Data quality problems 3.4.2. A comparison with the Annual Account benchmark data
3.5. WHICH SOURCE IS BETTER FOR THE LCI COMPILATION? 4. QUARTERLY NATIONAL ACCOUNTS ESTIMATIONS: A GENERAL LOOK AT THE METHODOLOGY
4.1. TOTAL WAGES, CONTRIBUTIONS AND COMPENSATION OF EMPLOYEES QUARTERLY ESTIMATIONS 4.2. OPEN ISSUES IN EXPERIMENTAL ESTIMATIONS
5. SOME PRELIMINARY AGGREGATE RESULTS ON PUBLIC SECTORS OF N AND O USING THE AVAILABLE SOURCES
5.1. THE INTEGRATION OF THE SOURCES 5.2. COMPARISON WITH THE QUARTERLY NATIONAL ACCOUNTS EXPERIMENTAL ESTIMATIONS
6. THE LCI CONSTRUCTION IN SECTIONS L-O 6.1. THE BACKGROUND 6.2. SUMMARY OF POTENTIALLY USABLE DATA SOURCES
6.2.1. Existing sources at Istat 6.2.2. Other sources, Government surveys and administrative data
6.3. THE OPTIONS 6.3.1. A multi-source direct estimation 6.3.2. A statistical estimation procedure based on “ improved” quarterly National Accounts
7. CONCLUDING REMARKS REFERENCES
TABLES Table 2.1 - Number of public institutions split into institutions included and excluded from ESA95-S.13 sector and their number of employees by economic activity section - Census of Industry and Services 2001 Table 2.2 - Number of public institutions not classified into ESA95-S.13 sector and their number of employees by economic activity section and kind of institution - Census of Industry and Services 2001 Table 3.1 - Compensation of employees from Economical Account and Annual Account - National Health Service units 2003-2005 (millions of euros) Table 3.2 - Number of sections N and O institutions covered by the Quarterly Report on Cash Flows, the Annual Account and by the S.13 list - years 2001-2003 Table 3.3 - Annual Account and Quarterly Report on Cash Flows annual amounts of staff expenditures by institution - years 2001-2003 (millions of euros) Table 3.4 - Annual Account and Quarterly Report on Cash Flows percentage annual changes of staff expenditures by institution - years 2001-2003 Table 3.5 - Sections N and O public institutions covered by the INPS-DM10 source Table 3.6 - National Olympic Committee per capita labour cost and its components - INPS source, I.2001-IV.2004 Table 3.7 - Per capita labour cost and its components from INPS database and Annual Account - Italian Red Cross, years 2001-2003
Table 3.8 - Percentage annual changes of per capita labour cost and its components from INPS database and Annual Account - Italian Red Cross, years 2001-2003 Table 3.9 - Per capita labour cost and its components from INPS database and Annual Account - Park authorities, years 2001-2003 Table 3.10 - Percentage annual changes of per capita labour cost components from INPS database and Annual Account - Park authorities, years 2001-2003 Table 3.11 - Compensation of employees from Economical Account and staff expenditures from Quarterly Report on Cash Flows: levels, quarter-on-quarter and year-on-year changes - National Health Service, years 2003-2004 Table 3.12 - Compensation of employees from INPS database and staff expenditures from Quarterly Report on Cash Flows: levels, quarter-on-quarter and year-on-year changes - Park authorities, years 2001-2004 Table 3.13 - Compensation of employees from INPS database and staff expenditures from Quarterly Report on Cash Flows: levels and quarter-on-quarter changes - National Olympic Committee, year 2001 Table 5.1 - Composition of sections L-O by institutional sector in terms of employees Table 5.2 - Section N per capita compensation of employees estimates from the Economical Account-INPS sources and National Accounts - years 2003-2004 (euros) Table 5.3 - Section O per capita compensation of employees estimates from the Economical Account-INPS sources and National Accounts - years 2003-2004 (euros) Table 6.1 - Incidence of sections L-O on total economy in terms of employment and compensation of employees - year 2004 Table 6.2 - Sources to be used for the LCI construction and their employment coverage by economic activity section and institutional sector
FIGURES Figure 3.1 - Quarter-on-quarter changes of Economical Account compensation of employees and Quarterly Report on Cash Flows staff expenditures - National Health Service, years 2003-2004 Figure 3.2 - Quarter-on-quarter changes of INPS compensation of employees and Quarterly Report on Cash Flows staff expenditures - Park authorities, years 2001-2004 Figure 5.1 - Quarter-on-quarter changes of section N per capita total wages estimates from Economical Account-INPS sources and National Accounts - years 2003-2004 Figure 5.2 - Quarter-on-quarter changes of section N per capita employer’s social contributions estimates from Economical Account-INPS sources and National Accounts - years 2003-2004 Figure 5.3 - Quarter-on-quarter changes of section N per capita compensations of employees estimates from Economical Account-INPS sources and National Accounts - years 2003-2004 Figure 5.4 - Quarter-on-quarter changes of section O per capita total wages estimates from Economical Account-INPS sources and National Accounts - years 2003-2004 Figure 5.5 - Quarter-on-quarter changes of section O per capita employer’s social contributions estimates from Economical Account-INPS sources and National Accounts - years 2003-2004 Figure 5.6 - Quarter-on-quarter changes of section O per capita compensations of employees estimates from Economical Account-INPS sources and National Accounts - years 2003-2004
PROSPECTS Prospect 2.1 - List of public institutions and their number of employees in both ESA95-S.13 sector and NACE Rev. 1.1 section N - December 31st 2000 and 2002 Prospect 2.2 - List of public institutions and their number of employees in both ESA95-S.13 sector and NACE Rev. 1.1 section O - December 31st 2000 and 2002 Prospect 2.3 - Number of public institutions in both ESA95-S.13 sector and NACE Rev. 1.1 sections N and O - December 31st 2000 and 2002 Prospect 4.1 - National Accounts quarterly estimation method for sections L-O total wages and compensation of employees Prospect 6.1 - Additional information on the sources to be used for the LCI construction Prospect 6.2 - Reference indicators used in the National Accounts benchmarking methodology and possible improvements

Authors This paper is the result of joint work. However, chapter 2 has been written by Annalisa
Lucarelli; section 3.1 has been written by Maria Anna Pennucci; section 3.2 has been written by Annalisa Lucarelli; section 3.3 has been written by Diego Bellisai; section 3.4 has been written by Fabio Rapiti; section 3.5 has been jointly written by Diego Bellisai, Annalisa Lucarelli, Maria Anna Pennucci; chapter 4 has been jointly written by Annalisa Lucarelli and Maria Anna Pennucci; chapter 5 has been jointly written by Diego Bellisai, Annalisa Lucarelli, Maria Anna Pennucci; and chapter 6 has been written by Fabio Rapiti.
Acknowledgements The authors would like to sincerely thank Gian Paolo Oneto and Leonello Tronti for their
advice, suggestions and comments, and Aldo Del Santo and Maria Assunta Fugnitto (Istat National Accounts Department), Giovanni Crescenzi, Enza Gagliardi and Cinzia Simeone (Ministry of Economy and Finance) for their cooperation.
1. INTRODUCTION
Since 2003, Istat has been carrying out feasibility studies in order to extend the LCI2 construction to the public institutions of the NACE Rev.1. economic activity sections L to O, with the aim to finalize and test the regular production of quarterly, complete LCI indices covering both the public and private sectors of all those sections.
In particular, the feasibility study on section L was completed in July 2003, that on section M in October 2005, while the one on sections N and O is the object of this Final Report.
Similarly to the LCI-OROS data for the private sector of the NACE Rev.1. sections C-K, which are based on the National Institute of Social Security (INPS) administrative source, Istat has chosen to use infra-annual administrative sources also for the construction of a quarterly LCI in sections L to O public sector. As a matter of fact, according to art. 58 of the Decree by Law 165/2001, the Italian Ministry of Economy and Finance is compelled to collect both short and long-term data on the wages and labour costs of civil servants. The way chosen by the Ministry to comply with this obligation is mainly based on the exploitation of administrative archives. In this respect, Istat plays a user role more than a producer one.
To this end, Istat has been making a significant effort in order to achieve formal and informal agreements with the institutions managing the administrative sources relevant to the LCI purposes. These agreements aim at acquiring and analysing the data, and at establishing a full and continuous cooperation between Istat and the other involved institutions for a regular data transmission. In particular, a partnership agreement between Istat and the General Account Department of the Ministry of Economy and Finance (from now on, GAD), has been signed in 2005. The GAD manages the main sources usable for the LCI purposes (such as the Employees Payrolls Database for sections L and M and the quarterly surveys on Municipalities and Provinces for section L). Furthermore, an informal agreement has been reached with the CINECA consortium (Interuniversity Consortium of North Eastern Italy for Automatic Calculation), which has allowed to acquire data on Universities. Finally, data coming from the well established cooperation with INPS have been exploited also for the coverage of sections N and O public sectors.
This report contains the feasibility study on sections N and O public institutions and supplies some preliminary proposals for the production, in the short and long run, of sections L to O complete LCI indices.
In particular, Chapter 2 defines the lists of sections N and O public institutions, the number of such institutions, and their level of employment. The analysis of the General Census of Industry and Services information on public institutions concludes this chapter.
Chapter 3 explores the available infra-annual administrative sources. An in-depth analysis of these sources, which faces the data quality problems in terms of non sampling errors and makes a comparison with the Annual Account (from now on, AA) benchmark data3, has been
2 The Regulation (EC) No 450/2003 defines the Labour Cost Index (LCI) as the Laspeyres index of labour costs per hour worked.
The fixed-weighted aggregate index is obtained by the combination of elementary economic activity section indexes with weights given by the total annual labour costs. The numerator of the elementary indexes includes wages and salaries and employers' social contributions plus taxes paid by the employer less subsidies received by the employer (see Regulation EC No 1726/1999 for the definition of the abovementioned labour cost components). The hours worked at the denominator are defined by the Council Regulation (EC) No 223/96 of 25 June 1996 on the European system of national and regional accounts in the Community.
3 As described in details in section 2.1 of the Report on section M (Istat 2005) the Annual Account, collected and released by the GAD-Ministry of Economy and Finance, contains all the information on labour cost and employment covering the General Government collective bargaining areas and represents the only benchmark because in Italy there are no other statistical or
carried out. A new source usable for section N LCI construction (the Economical Account) has also been taken into consideration. The last section of this chapter makes a qualitative and quantitative comparison among the various sources available for each public institution, in order to identify the best source for the production of LCI indices.
The National Accounts quarterly estimation experimental method is analysed in Chapter 4, with a particular attention to overcome its limitations.
In Chapter 5 some preliminary aggregate results, obtained by a combination of Economical Account and INPS data for section N, and INPS and Quarterly Report on Cash Flows data for section O, are presented and compared to the quarterly National Accounts (from now on, NA) estimates.
Finally, the Feasibility Study for extending the LCI to cover sections L to O is presented in Chapter 6. It outlines some preliminary proposals for implementing the regular production of complete LCI indices both in the short and the long run.
administrative collection on labour cost and wages. The Labour Cost Survey (LCS) does not yet cover L, M N and O sections.
2. LIST OF ALL PUBLIC INSTITUTIONS IN SECTIONS N AND O
This chapter defines the target populations of sections N and O public sectors and, in particular, presents a list of the public institutions belonging to these sections. Furthermore, still in the framework of the ESA95 General Government Sector (from now on, GGS), the number of institutions belonging to the two sections has been taken into consideration. Finally, the General Census of Industry and Services results regarding public institutions are presented.
The definitions of the target populations have been obtained using the GGS Yearbook updated to the years 2001-2002, produced by Istat Public Institutions Service, and the Istat S.13 list4 currently in force (from July 2005). The number of employees of each S.13 institutional unit has been drawn from the GGS Yearbook5, while its main economic activity section has been taken from the S.13 list.
As far as section N is concerned, the overall number of employees reaches around 714,000 units in 2000 and about 700,000 in 2002 (Prospect 2.1).
Prospect 2.3 provides further information on this section, which also allows to better understand the previous results. Firstly, the S.13 institutional units whose economic activity is classified among those of section N (374 and 379 institutions in the two years) account for 4% of the total number of institutions in S.13 sector. Furthermore, section N public sector mainly includes Units providing health services (around 85% of the overall number of S.13 institutions in this section); a significant share of this section is also represented by the Units for the right to the university study (14%), that account for an almost negligible number of employees (0.4% of the overall number of employees of the S.13 institutions in this section). Finally, the fall in section N employment between the two years (2%) seems due to the different coverage of the section. In the year 2000 all section N institutions but one have been collected. Therefore, the information on the number of employees was almost entirely available. The coverage decreases in 2002, due to the under-coverage of the Units for the right to the university study, although it still remains satisfactory (around 94%). As a consequence, the number of employees for the year 2002 is underestimated.
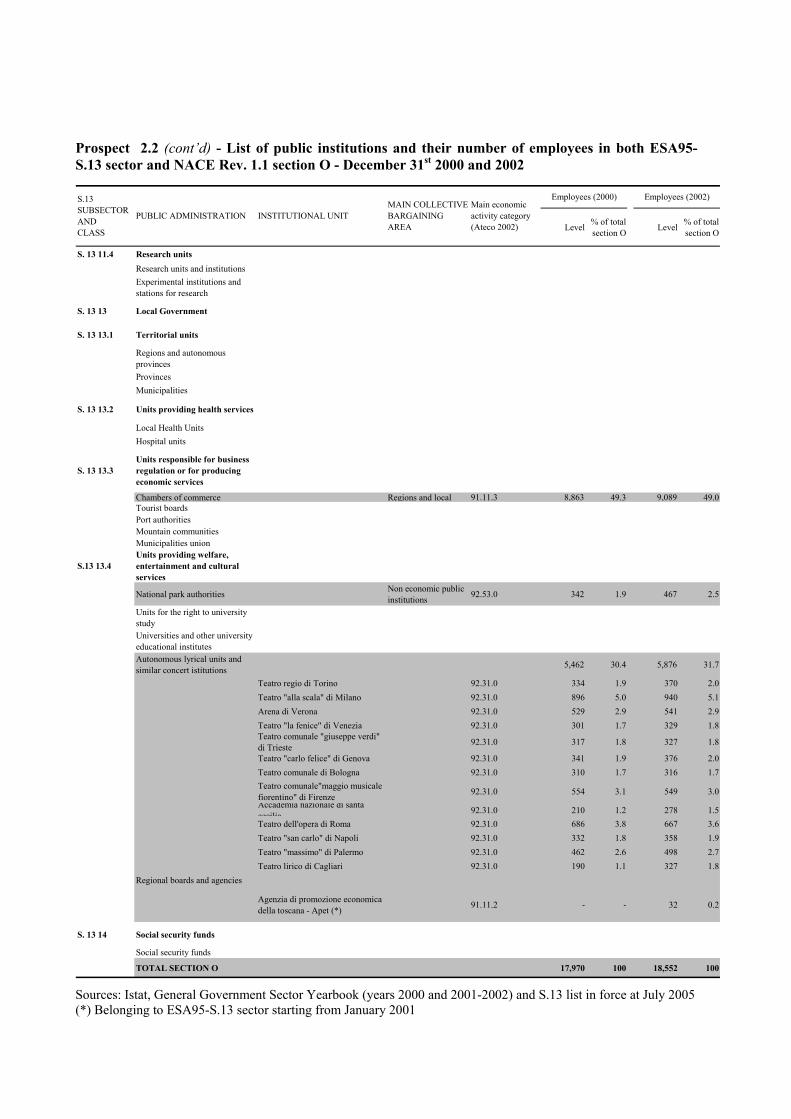
Regarding section O, the employment reaches respectively 17,970 units and 18,552 in the two years (Prospect 2.2). However, it is still an underestimate of the actual number of S.13 employees in this section.
As can be seen in Prospect 2.3, the public units actually collected account for around 75% of all S.13 units classified into section O (189 and 191 respectively in the two years). The units providing welfare and cultural services produce most of the overall undercoverage.
It can be noted that the number of S.13 units classified into section O only represents 2% of the total number of S.13 sector units. Furthermore, section O public units are mostly distributed among Chambers of Commerce (54% of the overall number of S.13 institutions in this section), Units providing welfare and cultural services (26%), Park authorities (10%) and Autonomous lyrical units (7%). However, employment is concentrated only in some kinds of institutions (see again Prospect 2.2), such as the Chambers of Commerce, which account for around one half of total employment, Autonomous lyrical units, which cover around one third of
4 This list provides detailed information on the institutional units, such as their taxpayer number, corporate name, start and end
dates of activity, date of incorporation in S.13, date of exclusion from S.13 and the Ateco 2002 code. It is constantly updated and published yearly in the Italian Official Gazette in the month of July.
5 The number of employees of the GGS Yearbook derives mainly from the Annual Account of the GAD. However, additional sources are used, which are mostly produced by Istat, for the institutions not collected by the Annual Account.

total employment, and Units providing welfare and cultural services, which account for about 16%.
The analysis of sections N and O public institutions universes has been extended to consider also the results of the last Census, which has been recently made available.
Different reasons justify the choice of using the S.13 list instead of the Census in order to define our target populations, although the Census could allow us to obtain more accurate and complete universes, since it takes into account both S.13 and non-S.13 institutions.
First of all, the Census data are available with a great delay, while the S.13 list is continuously updated and published yearly.
Furthermore, the public employment assessed by the two sources is rather similar, since the S.13 list covers almost all of the overall public employment (around 3,100,000 employees out of 3,200,000, Table 2.1).
In addition to this, the public institutions not included into the S.13 sector, due to their small size, are unlikely to be collected by a survey or an administrative archive, especially at an infra-annual level.
Finally, among the reasons which suggest us not to use the Census universe, it is worthwhile noting that the use of the S.13 list allows us to keep in line with the National Accounts. As it will be widely explained in the following sections, NA quarterly estimates should be used, in the short run, as a starting point for the construction of LCI indices.
Focussing on the economic activity sections of interest in this feasibility study, the number of section N public institutions classified into S.13 sector was 376 in 2001 (this number is quite similar to those of the years 2000 and 2002 shown in Prospect 2.3), while the overall number of public institutions is around seven times larger (Table 2.1). The difference in terms of number of institutions has a very small impact on the number of employees: S.13 employees cover approximately 90% of the total section N public employment. Most of the overall difference between the Census and the S.13 list in terms of number of institutions is due to the Institutions for public assistance and welfare (Table 2.2).
Similarly, in section O, one tenth6 of all public institutions are classified into S.13 sector, but they account for 60% of the total employment. In this section, the non-S.13 public institutions are: Professional associations, Consortia and Provincial automobile clubs.
6 The number of S.13 institutions in section O of Table 2.1 (277) is rather different from those shown in the Prospect 2.3 for the
years 2000 and 2002 (respectively 189 and 191). This is due to the fact that the number of S.13 public institutions of the table refers to the S.13 list in force on July 2005, while those presented in the Prospect 2.3 refers to the S.13 lists updated respectively on December 31st 2000 and 2002. Therefore, the differences depend on the institutions which have been classified into S.13 sector after the year 2002. More specifically, around 80 of the 277 units have been classified into S.13 sector during the year 2005.

Prospect 2.1 - List of public institutions and their number of employees in both ESA95-S.13 sector and NACE Rev. 1.1 section N - December 31st 2000 and 2002
Level % of total section N Level % of total
section N
S. 13 11 Central Government
S. 13 11.1 State government and constitutional organs
Ministries and Prime Minister's Office Constitutional organs
S. 13 11.2 Units responsible for business regulation or for producing economic services
Units responsible for business regulationUnits responsible for producing economic servicesIndependent administrative authorities Units with associative structure
S. 13 11.3 Units providing welfare, entertainment and cultural services
Units providing welfare and cultural services
Italian Red Cross - central committee
Non economic public institutions 85.32.0 3,799 0.5 4,003 0.6
National union of italian discharge officers 85.32.0 - - - -
S. 13 11.4 Research units
Research units and institutionsExperimental institutions and stations for research
S. 13 13 Local Government
S. 13 13.1 Territorial units
Regions and autonomous provincesProvincesMunicipalities
S. 13 13.2 Units providing health services 706,739 98.9 693,179 99.0
Local Health Units National health service 85.12.5 447,652 62.7 446,525 63.8Hospital units 259,087 36.3 246,654 35.2
Hospitals National health service 85.11.1 - - - -Scientific institutions providing hospitalization and care
National health service 85.11.2 - - - -
Polyclinics National health service 85.11.4 - - - -
S. 13 13.3 Units responsible for business regulation or for producing economic services
Chambers of commerce Tourist boardsPort authorities Mountain communitiesMunicipalities union
S. 13 13.4 Units providing welfare, entertainment and cultural servicesNational park authorities Units for the right to university study Regions and local units 85.31.0 3,853 0.5 2,964 0.4Universities and other university educational institutesAutonomous lyrical units and similar concert istitutions Regional boards and agencies
S. 13 14 Social security funds
Social security funds
TOTAL SECTION N 714,391 100 700,146 100
S.13 SUBSECTOR AND CLASS
PUBLIC ADMINISTRATION INSTITUTIONAL UNIT MAIN COLLECTIVE BARGAINING AREA
Main economic activity category (Ateco 2002)
Employees (2000) Employees (2002)
Sources: Istat, General Government Sector Yearbook (years 2000 and 2001-2002) and S.13 list in force at July 2005

Prospect 2.2 - List of public institutions and their number of employees in both ESA95-S.13 sector and NACE Rev. 1.1 section O - December 31st 2000 and 2002
Level % of total section O Level % of total
section O
S. 13 11 Central government
S. 13 11.1 State government and constitutional organs Ministries and Prime Minister's Office Constitutional organs
S. 13 11.2Units responsible for business regulation or for producing economic services
Units responsible for business regulation
Agenzia autonoma gestione albo segretari comunali e provinciali (*) 91.12.0 - - 118 0.6
Units responsible for producing economic services 240 1.3 127 0.7
Ente nazionale risi 91.11.2 131 0.7 127 0.7Istituto per studi, ricerche e informazioni sul mercato agricolo - ISMEA
91.11.2 109 0.6 - -
Independent administrative authorities
Units with associative structure 128 0.7 87 0.5
Associazione nazionale comuni italiani -ANCI 91.33.0 29 0.2 - -
Unione nazionali comuni comunità enti montani-UNCEM 91.33.0 5 0.0 - -Unione italiana delle camere di commercio, industria artigianato e agricoltura-UNIONCAMERE
Units ex art. 73 ld 29 91.11.3 94 0.5 87 0.5
Unione delle provincie d'italia - UPI 91.33.0 - - - -
S. 13 11.3Units providing welfare, entertainment and cultural services
2,935 16.3 2,756 14.9
Units providing welfare and cultural services 2,935 16.3 2,756 14.9
Fondazione festival dei due mondi di spoleto 92.31.0 - - - -
Istituto nazionale del dramma antico 92.31.0 - - 3 0.0
Ente teatrale italiano 92.31.0 43 0.2 38 0.2Societa' di cultura "la biennale di venezia" 92.31.0 - - 58 0.3
Accademia della crusca 92.51.0 - - - -Istituto italiano per l'africa e l'oriente - ISIAO 92.51.0 30 0.2 32 0.2
Ente esposizione nazionale quadriennale d'arte di Roma 92.52.0 6 0.0 - -
Istituto nazionale per la storia del movimento di liberazione in italia 92.52.0 - - 6 0.0
La triennale di milano 92.52.0 17 0.1 - -Museo storico della liberazione 92.52.0 - - - -Comitato olimpico nazionale italiano - CONI Units ex art. 73 ld 29 92.62.3 2,828 15.7 2,607 14.1
Unione italiana tiro a segno 92.62.3 - - - -Federazioni sportive italiane 92.62.3 - - - -Lega italiana per la lotta contro i tumori 91.33.0 11 0.1 12 0.1
Employees (2000) Employees (2002)Main economic activity category (Ateco 2002)
MAIN COLLECTIVE BARGAINING AREA
INSTITUTIONAL UNITPUBLIC ADMINISTRATION
S.13 SUBSECTOR AND CLASS
Prospect 2.2 (cont’d) - List of public institutions and their number of employees in both ESA95-S.13 sector and NACE Rev. 1.1 section O - December 31st 2000 and 2002
Level % of total section O Level % of total
section O
S. 13 11.4 Research units Research units and institutionsExperimental institutions and stations for research
S. 13 13 Local Government
S. 13 13.1 Territorial units
Regions and autonomous provincesProvincesMunicipalities
S. 13 13.2 Units providing health services
Local Health UnitsHospital units
S. 13 13.3Units responsible for business regulation or for producing economic services
Chambers of commerce Regions and local 91.11.3 8,863 49.3 9,089 49.0Tourist boardsPort authorities Mountain communitiesMunicipalities union
S.13 13.4Units providing welfare, entertainment and cultural services
National park authorities Non economic public institutions 92.53.0 342 1.9 467 2.5
Units for the right to university study Universities and other university educational institutesAutonomous lyrical units and similar concert istitutions 5,462 30.4 5,876 31.7
Teatro regio di Torino 92.31.0 334 1.9 370 2.0Teatro "alla scala" di Milano 92.31.0 896 5.0 940 5.1Arena di Verona 92.31.0 529 2.9 541 2.9Teatro "la fenice" di Venezia 92.31.0 301 1.7 329 1.8Teatro comunale "giuseppe verdi" di Trieste 92.31.0 317 1.8 327 1.8
Teatro "carlo felice" di Genova 92.31.0 341 1.9 376 2.0Teatro comunale di Bologna 92.31.0 310 1.7 316 1.7Teatro comunale"maggio musicale fiorentino" di Firenze 92.31.0 554 3.1 549 3.0Accademia nazionale di santa cecilia 92.31.0 210 1.2 278 1.5Teatro dell'opera di Roma 92.31.0 686 3.8 667 3.6Teatro "san carlo" di Napoli 92.31.0 332 1.8 358 1.9Teatro "massimo" di Palermo 92.31.0 462 2.6 498 2.7Teatro lirico di Cagliari 92.31.0 190 1.1 327 1.8
Regional boards and agencies
Agenzia di promozione economica della toscana - Apet (*) 91.11.2 - - 32 0.2
S. 13 14 Social security funds
Social security funds
TOTAL SECTION O 17,970 100 18,552 100
S.13 SUBSECTOR AND CLASS
PUBLIC ADMINISTRATION
Employees (2002)
INSTITUTIONAL UNITMAIN COLLECTIVE BARGAINING AREA
Main economic activity category (Ateco 2002)
Employees (2000)
Sources: Istat, General Government Sector Yearbook (years 2000 and 2001-2002) and S.13 list in force at July 2005 (*) Belonging to ESA95-S.13 sector starting from January 2001

Prospect 2.3 - Number of public institutions in both ESA95-S.13 sector and NACE Rev. 1.1 sections N and O - December 31st 2000 and 2002
Total number
Institutions collected
Total number
Institutions collected
Total number
Institutions collected
Total number
Institutions collected
S. 13 11 Central government
S. 13 11.1 State government and constitutional organs 25 24 0 0 0 0 27 27 0 0 0 0
Ministries and Prime Minister's Office 18 18 0 0 0 0 19 19 0 0 0 0
Constitutional organs 7 6 0 0 0 0 8 8 0 0 0 0
S. 13 11.2Units responsible for business regulation or for producing economic services
30 25 0 0 6 5 30 18 0 0 7 3
Units responsible for business regulation 6 5 0 0 0 0 6 5 0 0 1 1
Units responsible for producing economic services 13 11 0 0 2 2 13 11 0 0 2 1
Independent administrative authorities 6 5 0 0 0 0 6 0 0 0 0 0
Units with associative structure 5 4 0 0 4 3 5 2 0 0 4 1
S. 13 11.3Units providing welfare, entertainment and cultural services
58 14 2 1 49 6 58 14 2 1 49 7
Units providing welfare and cultural services 58 14 2 1 49 6 58 14 2 1 49 7
S. 13 11.4 Research units 82 78 0 0 0 0 71 58 0 0 0 0
Research units and institutions 35 35 0 0 0 0 24 24 0 0 0 0Experimental institutions and stations for research 47 43 0 0 0 0 47 34 0 0 0 0
S. 13 13 Local Government
S. 13 13.1 Territorial units 8,222 8,222 0 0 0 0 8,223 8,223 0 0 0 0
Regions and autonomous provinces 22 22 0 0 0 0 22 22 0 0 0 0
Provinces 100 100 0 0 0 0 100 100 0 0 0 0Municipalities 8,100 8,100 0 0 0 0 8,101 8,101 0 0 0 0
S. 13 13.2 Units providing health services 319 319 319 319 0 0 321 316 321 316 0 0
Local Health Units 197 197 197 197 0 0 197 197 197 197 0 0
Hospital units (including Scientific institutions providing hospitalization and care and Polyclinics)
122 122 122 122 0 0 124 119 124 119 0 0
S. 13 13.3Units responsible for business regulation or for producing economic services
598 597 0 0 102 102 738 559 0 0 102 101
Chambers of commerce 102 102 0 0 102 102 102 101 0 0 102 101Tourist boards 120 120 0 0 0 0 121 78 0 0 0 0Port authorities 21 20 0 0 0 0 21 21 0 0 0 0Mountain communities 355 355 0 0 0 0 356 353 0 0 0 0Municipalities union - - - - - - 138 6 0 0 0 0
S.13 13.4Units providing welfare, entertainment and cultural services
195 191 53 53 32 30 236 179 56 38 33 30
National park authorities 19 17 0 0 19 17 19 16 0 0 19 16Units for the right to university study 53 53 53 53 0 0 56 38 56 38 0 0
Universities and other university educational institutes 63 63 0 0 0 0 65 63 0 0 0 0
Autonomous lyrical units and similar concert istitutions 13 13 0 0 13 13 13 13 0 0 13 13
Regional boards and agencies 47 45 0 0 0 0 83 49 0 0 1 1
S. 13 14 Social security funds 27 27 0 0 0 0 28 28 0 0 0 0Social security funds 27 27 0 0 0 0 28 28 0 0 0 0
TOTAL 9,556 9,497 374 373 189 143 9,732 9,422 379 355 191 141
Total number of institutions in S.13
sector (all Nace sections)
Institutions in S.13 sector collected
(all Nace sections)
Institutions in both S.13 sector and section N
Year 2002Year 2000
Institutions in both S.13 sector and section O
S.13 SUBSECTOR ANDCLASS
PUBLIC ADMINISTRATION Total number of
institutions in S.13 sector
(all Nace sections)
Institutions in both S.13 sector and section N
Institutions in both S.13 sector and section O
Institutions in S.13 sector collected
(all Nace sections)
Sources: Istat, General Government Sector Yearbook, years 2000 and 2001-2002

Table 2.1 - Number of public institutions split into institutions included and excluded from ESA95-S.13 sector and their number of employees by economic activity section - Census of Industry and Services 2001
Institutions Employees Institutions Employees Institutions Employees
A- Agriculture, hunting and forestry 2 8,834 119 3,370 121 12,204E - Electricity, gas and water supply - - 257 8,005 257 8,005F - Construction - - 14 997 14 997I - Transport, storage and communication 32 357 129 1,834 161 2,191J - Financial intermediation - - 2 507 2 507K - Real estate, renting and business activities 111 25,795 210 9,237 321 35,032L - Public administration and defence; compulsory social security 8,885 2,236,336 165 2,005 9,050 2,238,341M - Education 66 113,870 201 2,576 267 116,446N - Health and social work 376 699,639 2,367 60,827 2,743 760,466O - Other community, social and personal service activities 277 20,767 2,367 14,169 2,644 34,936Total 9,749 3,105,598 5,831 103,527 15,580 3,209,125
Public institutions classified into S.13 Economic activity section
Public institutions not classified into S.13
Total Public institutions

Table 2.2 - Number of public institutions not classified into ESA95-S.13 sector and their number of employees by economic activity section and kind of institution - Census of Industry and Services 2001
Economic activity section Kind of institution Institutions Employees
A- Agriculture, hunting and forestry 119 3,370 Local government for civic use 10 15 Consortia 106 3,347 Units providing cultural services 2 - Autonomous institute for public housing - Territorial agency for house building
1 8
E - Electricity, gas and water supply 257 8,005 Local government for civic use 2 45 Unit responsible for producing economic services 1 212 Consortia 254 7,748
F - Construction 14 997 Consortia 14 997
I - Transport, storage and communication 129 1,834 Units responsible for business regulation 1 755 Tourist agencies -Provincial tourist boards 101 669 Enterprises 1 78 Consortia 26 332
J - Financial intermediation 2 507 Units responsible for business regulation 2 507
K - Real estate, renting and business activities 210 9,237 Local government for civic use 4 7 Unit responsible for business regulation 1 7 Unit responsible for producing economic services 1 399 Consortia 85 879 Units providing cultural services 6 137 Research units and institutions 3 186 Autonomous institute for public housing - Territorial agency for house building
109 7,599
Other 1 23 L - Public administration and defence; compulsory social security
165 2,005
Local government for civic use 72 49 Unit responsible for business regulation 1 349 Unit responsible for producing economic services 1 133 Tourist agencies -Provincial tourist boards 5 93 Territorial units 7 113 Enterprises 1 2 Central government committee 2 441 Consortia 64 318 Social security funds 1 53 Institutions for public assistance and welfare 1 - Other 10 454
M - Education 201 2,576 Local government for civic use 1 44 Units responsible for producing economic services 1 49 Central government committee 1 40 Consortia 36 464 Units providing cultural services 7 223 Institutions for public assistance and welfare 155 1,756
N - Health and social work 2,367 60,827 Hospital units 2 4,549 Consortia 37 2,292 Units for the right to university study 8 8 Units providing welfare services 1 1 Research units and institutions 1 20 Institutions for public assistance and welfare 2,318 53,957
O - Other community, social and personal service activities
2,367 14,169
Local government for civic use 9 31 Units responsible for business regulation 1 6 Units responsible for producing economic services 4 62 Provincial automobile club 106 879 Central government committee 1 3,200 Professional association 1,808 3,848 Consortia 427 5,980 Park authorities 3 50 Units providing welfare services 1 6 Units providing cultural services 4 59 Institutions for public assistance and welfare 2 38 Other 1 10
Total 5,831 103,527

3. EXISTING SOURCES FOR SECTIONS N AND O PUBLIC SECTOR
3.1. Ministry of Health: the Economical Account The quarterly survey on health units has been introduced following an agreement
between the Ministry of Health and the Ministry of Economy and Finance settled in 2001. The survey covers exhaustively Local Health Units, Hospitals and Scientific Institutions
providing Hospitalization and Care (IRCCS in Italian). The latter units have been collected only starting from 2003. Each unit transmits its data to the Ministry of Health and to the Regions or Autonomous Provinces they belong to.
In particular, quarterly data are collected through the Economical Account form (from now on, EA), which is a balance sheet. Therefore, it includes revenues and expenditures broken down by single item. The only information usable for the LCI purposes is represented by the staff expenditures item.
Data are transmitted using a web-based submission procedure. The National Health Service Information System of the Ministry of Health allows the institutional units to access directly (using a login and a password) to the pages where they can fill in the EA form.
Sufficient timeliness in the data transmission is attained (within 30 days after the end of the reference month). However, data could be revised, since the Information System allows transmitting and/or updating data also after the abovementioned deadline.
Anticipated and consolidated data have also to be transmitted, respectively within the first fifteen days of the month of February of the reference year and the end of the month of May of the subsequent year.
The EA data have been used in the compilation of the NA since 2003. In particular, the staff expenditures item is used to estimate the variable compensation of employees. This variable contributes to obtain NA quarterly estimates on section N total wages and compensations of employees, since it represents the reference indicator to be used in the annual-to-quarterly temporal disaggregation procedure (see Chapter 4).
Table 3.1 shows the comparison between the compensation of employees reconstructed by the NA starting from the EA data and the same variable taken from the AA7. This variable represents the best currently available approximation of the labour cost. It is worthwhile noting that the compensations of employees estimated by the NA and shown in Table 3.1 are the preliminary raw version of those actually used in the annual-to-quarterly temporal disaggregation procedure.
The comparison has been carried out only for the year 2003. This is due to the fact that, on the one hand the AA is not available in the subsequent years (being the 2003 version the more up-to-date). On the other hand, as already mentioned, the EA data have been used in the NA estimates only starting from 2003.
In order to make the two sources comparable as much as possible, the AA compensations of employees have been estimated by adding total wages and employer’s social contributions related to the same institutional units and job positions8 taken into account in EA.
The comparison between the two sources, based on homogeneous variables, is rather satisfactory (the EA overestimate is around 3%). However, a time series is needed to better assess the EA data quality. 7 See footnote 1 on page 5. 8 Employees with an open-ended contract, employees with fixed-term contract, contract workers, staff with work-and-training
contracts, staff with temporary employment contracts.
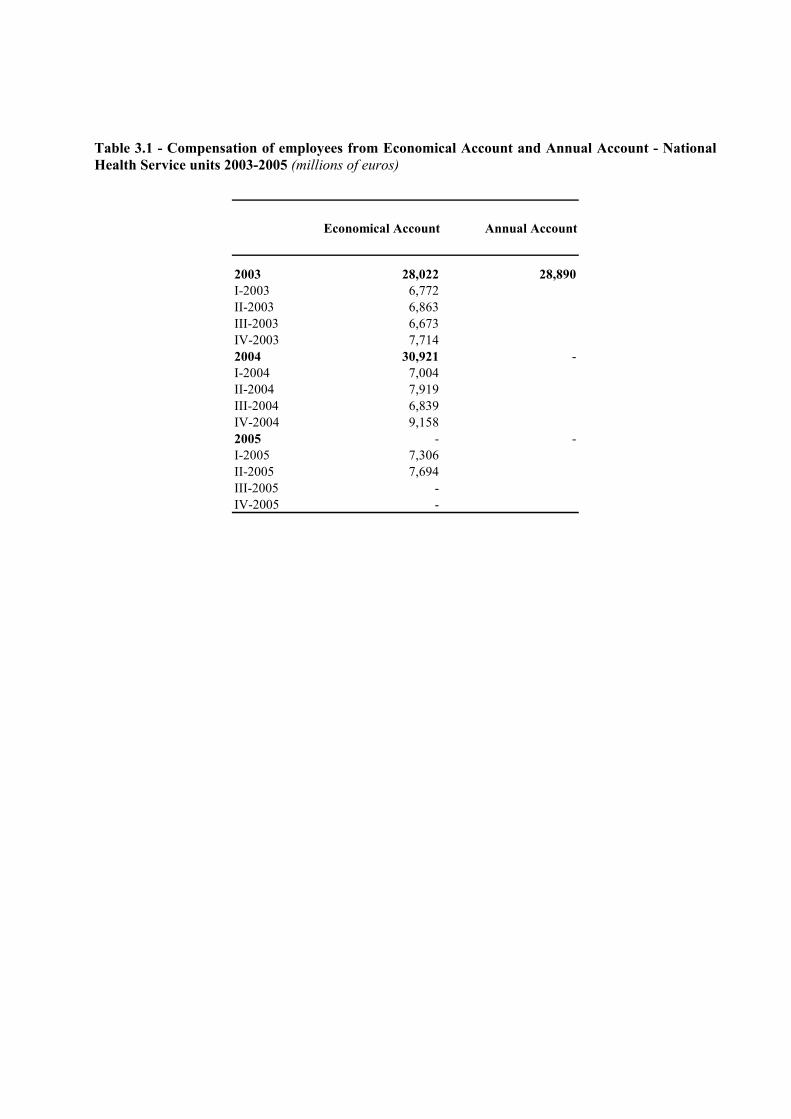
Table 3.1 - Compensation of employees from Economical Account and Annual Account - National Health Service units 2003-2005 (millions of euros)
Economical Account Annual Account
2003 28,022 28,890I-2003 6,772II-2003 6,863III-2003 6,673IV-2003 7,7142004 30,921 -I-2004 7,004II-2004 7,919III-2004 6,839IV-2004 9,1582005 - -I-2005 7,306II-2005 7,694III-2005 -IV-2005 -
3.2. General Account Department: the Quarterly Report on Cash Flows
3.2.1. Data quality problems
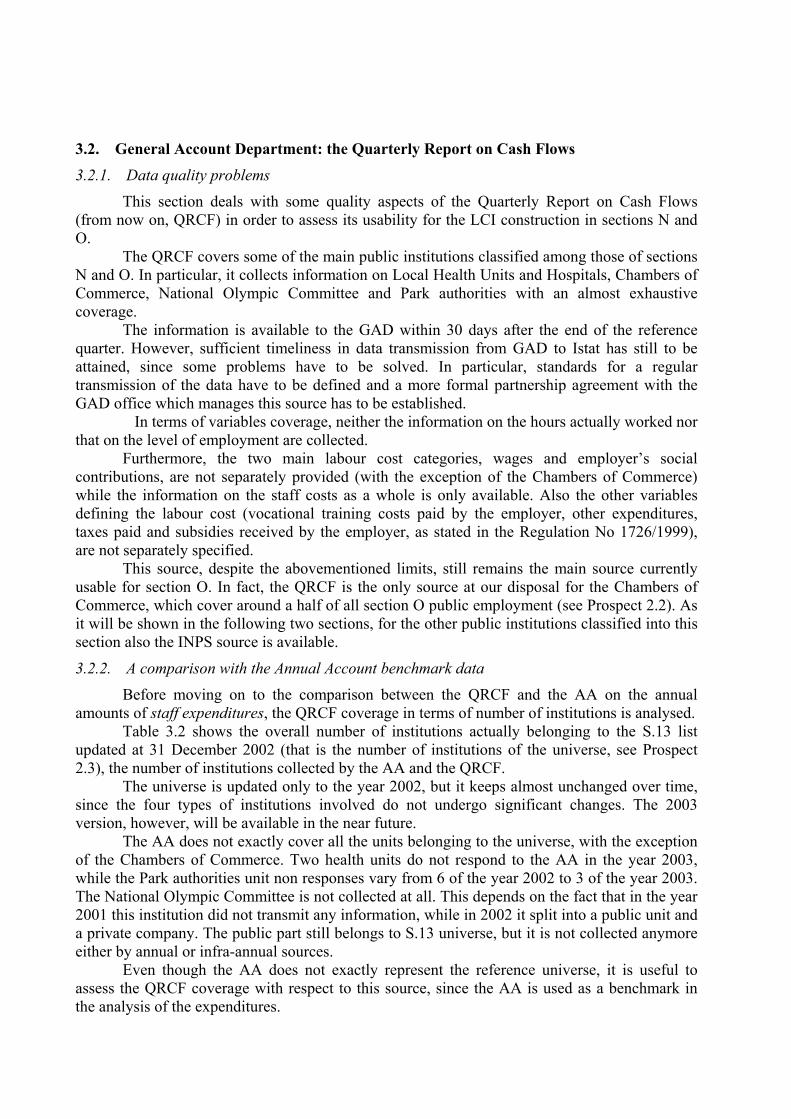
This section deals with some quality aspects of the Quarterly Report on Cash Flows (from now on, QRCF) in order to assess its usability for the LCI construction in sections N and O.
The QRCF covers some of the main public institutions classified among those of sections N and O. In particular, it collects information on Local Health Units and Hospitals, Chambers of Commerce, National Olympic Committee and Park authorities with an almost exhaustive coverage.
The information is available to the GAD within 30 days after the end of the reference quarter. However, sufficient timeliness in data transmission from GAD to Istat has still to be attained, since some problems have to be solved. In particular, standards for a regular transmission of the data have to be defined and a more formal partnership agreement with the GAD office which manages this source has to be established.
In terms of variables coverage, neither the information on the hours actually worked nor that on the level of employment are collected.
Furthermore, the two main labour cost categories, wages and employer’s social contributions, are not separately provided (with the exception of the Chambers of Commerce) while the information on the staff costs as a whole is only available. Also the other variables defining the labour cost (vocational training costs paid by the employer, other expenditures, taxes paid and subsidies received by the employer, as stated in the Regulation No 1726/1999), are not separately specified.
This source, despite the abovementioned limits, still remains the main source currently usable for section O. In fact, the QRCF is the only source at our disposal for the Chambers of Commerce, which cover around a half of all section O public employment (see Prospect 2.2). As it will be shown in the following two sections, for the other public institutions classified into this section also the INPS source is available.
3.2.2. A comparison with the Annual Account benchmark data
Before moving on to the comparison between the QRCF and the AA on the annual amounts of staff expenditures, the QRCF coverage in terms of number of institutions is analysed.
Table 3.2 shows the overall number of institutions actually belonging to the S.13 list updated at 31 December 2002 (that is the number of institutions of the universe, see Prospect 2.3), the number of institutions collected by the AA and the QRCF.
The universe is updated only to the year 2002, but it keeps almost unchanged over time, since the four types of institutions involved do not undergo significant changes. The 2003 version, however, will be available in the near future.
The AA does not exactly cover all the units belonging to the universe, with the exception of the Chambers of Commerce. Two health units do not respond to the AA in the year 2003, while the Park authorities unit non responses vary from 6 of the year 2002 to 3 of the year 2003. The National Olympic Committee is not collected at all. This depends on the fact that in the year 2001 this institution did not transmit any information, while in 2002 it split into a public unit and a private company. The public part still belongs to S.13 universe, but it is not collected anymore either by annual or infra-annual sources.
Even though the AA does not exactly represent the reference universe, it is useful to assess the QRCF coverage with respect to this source, since the AA is used as a benchmark in the analysis of the expenditures.

In particular, the QRCF coverage with respect to the AA is over 95%, both for the Chambers of Commerce and Health units. It is worthwhile noting that the slight overcoverage for the Health units in the year 2003 is due to the fact that the number of units collected by QRCF exceeds that of the AA and is equal to that of the universe. Similarly, for the Park authorities the coverage is also satisfactory, with a slight overcoverage in the year 2002.
Table 3.2 - Number of sections N and O institutions covered by the Quarterly Report on Cash Flows, the Annual Account and by the S.13 list - years 2001-2003
(*) Excluding Scientific Institutions providing Hospitalization and Care (IRCCS in Italian) and Polyclinics
Table 3.3 shows the comparison between the AA and QRCF annual amounts of staff
expenditures. A comparison on per capita values of this variable is not presented, since the QRCF does not provide information on the number of employees.
In order to make the annual expenditures from the two sources comparable as much as possible, these have been measured with reference to the same set of institutions. In particular, for the Chambers of Commerce and Park authorities the expenditures of the number of institutions common to both sources have been considered (that is, 97 for the former and 13 for the latter, see Table 3.2). Regarding the Health units, a less accurate approach has been followed for the lack of information on each single institution. The expenditures have been first divided by the number of institutions collected by each source in the various years and subsequently multiplied by the number of institutions from the S.13 list (that is 295, see Table 3.2).
However, other problems still remain when comparing the two sources. Firstly, nothing ensures that the staff expenditures variable is defined in the same way in
the two sources. In fact, the QRCF does not separately provide the single items included in the variable and its content strongly varies depending on the single institution. The AA staff expenditures have been estimated by adding all the items classified as staff cost, but the AA classification could differ from that adopted by the single institutions collected by the QRCF. For example, the vocational training costs are recorded as staff cost in the AA, while they are registered either as staff expenditures or as purchase of goods and services in the QRCF.
Furthermore, data currently provided by the GAD allow making a comparison only over a period of three years, which is insufficient to fully assess the quality of the QRCF data.
S.13 list
2002 2001 2002 2003 2001 2002 2003 2001 2002 2003
Chambers of Commerce 102 102 102 102 99 99 97 97.1 97.1 95.1
National Health Service 295 295 297 293 290 289 295 98.3 97.3 100.7
Local Health Units 197 - - - 193 191 196 - - -
Hospitals (*) 98 - - - 97 98 99 - - -
National Olympic Committee 1 - - - 1 - - - - -
National Park authorities 19 15 13 16 15 15 15 100.0 115.4 93.8
Institution
QRCF coverage (% of total Annual
Account institutions)Annual Account Quarterly Report on Cash
Flows (QRCF)
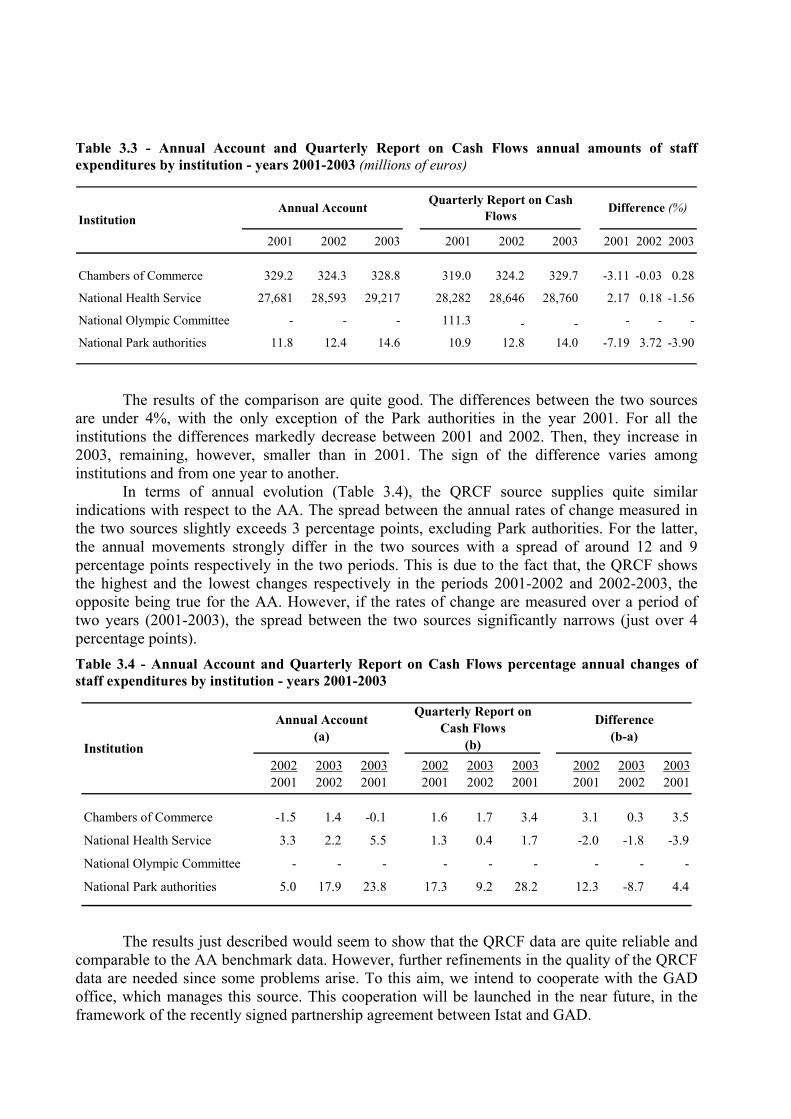
Table 3.3 - Annual Account and Quarterly Report on Cash Flows annual amounts of staff expenditures by institution - years 2001-2003 (millions of euros)
2001 2002 2003 2001 2002 2003 2001 2002 2003
Chambers of Commerce 329.2 324.3 328.8 319.0 324.2 329.7 -3.11 -0.03 0.28
National Health Service 27,681 28,593 29,217 28,282 28,646 28,760 2.17 0.18 -1.56
National Olympic Committee - - - 111.3 - - - - -
National Park authorities 11.8 12.4 14.6 10.9 12.8 14.0 -7.19 3.72 -3.90
Annual Account Difference (%)Institution
Quarterly Report on Cash Flows
The results of the comparison are quite good. The differences between the two sources
are under 4%, with the only exception of the Park authorities in the year 2001. For all the institutions the differences markedly decrease between 2001 and 2002. Then, they increase in 2003, remaining, however, smaller than in 2001. The sign of the difference varies among institutions and from one year to another.
In terms of annual evolution (Table 3.4), the QRCF source supplies quite similar indications with respect to the AA. The spread between the annual rates of change measured in the two sources slightly exceeds 3 percentage points, excluding Park authorities. For the latter, the annual movements strongly differ in the two sources with a spread of around 12 and 9 percentage points respectively in the two periods. This is due to the fact that, the QRCF shows the highest and the lowest changes respectively in the periods 2001-2002 and 2002-2003, the opposite being true for the AA. However, if the rates of change are measured over a period of two years (2001-2003), the spread between the two sources significantly narrows (just over 4 percentage points). Table 3.4 - Annual Account and Quarterly Report on Cash Flows percentage annual changes of staff expenditures by institution - years 2001-2003
The results just described would seem to show that the QRCF data are quite reliable and
comparable to the AA benchmark data. However, further refinements in the quality of the QRCF data are needed since some problems arise. To this aim, we intend to cooperate with the GAD office, which manages this source. This cooperation will be launched in the near future, in the framework of the recently signed partnership agreement between Istat and GAD.
20022001
20032002
20032001
20022001
20032002
20032001
20022001
20032002
20032001
Chambers of Commerce -1.5 1.4 -0.1 1.6 1.7 3.4 3.1 0.3 3.5
National Health Service 3.3 2.2 5.5 1.3 0.4 1.7 -2.0 -1.8 -3.9
National Olympic Committee - - - - - - - - -
National Park authorities 5.0 17.9 23.8 17.3 9.2 28.2 12.3 -8.7 4.4
Institution
Annual Account(a)
Difference(b-a)
Quarterly Report on Cash Flows
(b)

3.3. General Account Department: the Quarterly Survey on National Health Service units In the following paragraph, we intend to describe some features of this source, face its
data quality problems and give some up-to-date information on its situation. The Quarterly Survey on National Health Service units (from now on, QSNHS) is carried
out by the GAD and it has been launched in the first quarter of 2005. The GAD office which manages the survey is the same responsible for the Employees Payrolls Database (EPD). Within the framework of the recently signed agreement between GAD and Istat, a close and fruitful collaboration started with the previously mentioned office which, however, still needs time to settle down.
As far as the coverage in terms of institutional units is concerned, the survey takes into account all the National Health Service units: 197 Local Health Units, 99 Hospitals and 12 Scientific Institutions providing hospitalization and care (IRCCS in Italian).
Regarding the timeliness of data transmission, the institutional units involved in the survey are bound to communicate the data within 30 days after the end of the reference quarter (indeed, data are collected monthly but transmitted on a quarterly basis). The data transmission is performed through a web-based submission method, by which the National Health Service Information System of the Ministry of Health allows the institutional units to directly access its web pages, where each unit can fill in the questionnaire and transmit the data. Subsequently this information is uploaded from the NHS Information System into the GAD Information System, following the agreement between the Ministry of Economy and Finance and the Ministry of Health.
Up to now, this upload procedure has not yet been performed, so that also the first theoretically available data, which refer to the months of January, February and March 2005, are not yet available. As a consequence, we are not able to show any preliminary results from this source, but the scarce information we have is not really good. The unit non-response seems quite high, ranging between 40% and 75% depending on the month.
Furthermore, Istat and GAD still have to establish the transmission standards of the data, which would imply an additional delay in the first data transmission from GAD to Istat. We expect to receive the first provisional data within the end of March 2006.
As far as the variable content of the transmitted data is concerned, the QSNHS requires information separately on fixed costs and related arrears, additional costs and related arrears and employer's social contributions, as well as on expenditures for fixed-term contracts employees, employees with work and training contracts, Socially Useful Workers and staff with temporary employment contracts. Besides giving separated information on wages and social contributions, the QSNHS also provides data on the number of employees at the end of the reference month (except employees with work and training contracts, Socially Useful Workers and staff with temporary employment contracts), which, together with the number of days of absence (another variable present in the record layout of the QSNHS), could provide indirect information on the hours actually worked9. This survey, thus, potentially represents an excellent source for the LCI 9 Adapting, for example, the “method by component” to obtain infra-annual estimates. On the basis of this method, the
contractual hours are the benchmark; then the hours components which are not worked (paid or not) are subtracted, while the overtime is added. The method can be summarized as follows:
Haw = Hcon - (Habs+Hhol) - Dpart + Hext where Haw are the hours actually worked; Hcon represents the total amount of hours theoretically workable (contractual hours) considering employees as all full-timers and it is obtained from the per capita hours workable by contract multiplied by the annual average employment; Habs represents the number of hours actually not worked because of vacations or illness, strikes, leaves (paid or not), etc., and it is obtained by multiplying the days of absence by the hours workable per day; Hhol is

purposes, although it must be noted that some of the variables required by the Regulation are not collected (vocational training costs, other expenditures, taxes, subsidies). Moreover, we would like to remark that information is provided by job position, which represents an “added value” useful to satisfy needs of information more detailed than those required for the LCI construction.
the number of hours of holidays occurred during the working time in the reference period, and it is obtained by multiplying the days of holiday by the hours workable per day; Dpart is the number of hours missed for part-time employment, and it is obtained as the difference between full-time workable hours and the hours worked by part-timers; Hext is paid overtime, obtained by dividing the expenditures for overtime by the hourly rate of extra work.
3.4. National Institute of Social Security (INPS)
3.4.1. Data quality problems
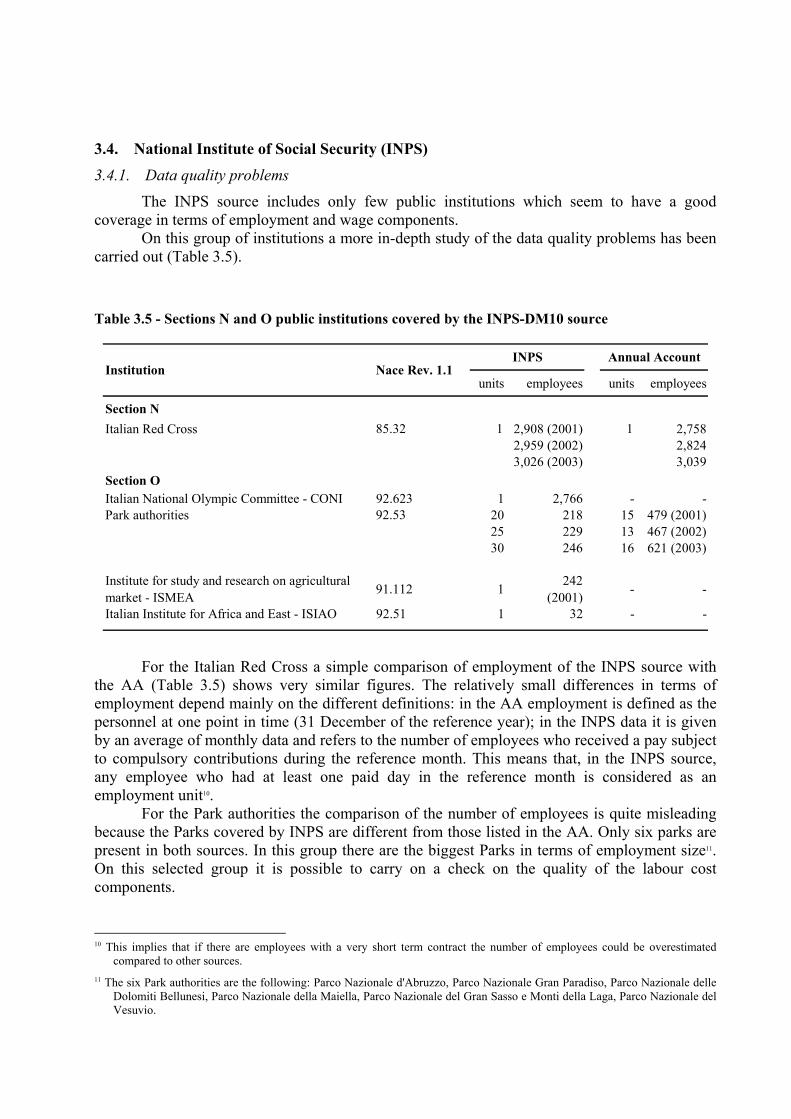
The INPS source includes only few public institutions which seem to have a good coverage in terms of employment and wage components.
On this group of institutions a more in-depth study of the data quality problems has been carried out (Table 3.5).
Table 3.5 - Sections N and O public institutions covered by the INPS-DM10 source
units employees units employees
Section NItalian Red Cross 85.32 1 2,908 (2001) 1 2,758
2,959 (2002) 2,824 3,026 (2003) 3,039
Section OItalian National Olympic Committee - CONI 92.623 1 2,766 - -Park authorities 92.53 20 218 15 479 (2001)
25 229 13 467 (2002)30 246 16 621 (2003)
Institute for study and research on agricultural market - ISMEA 91.112 1 242
(2001) - -
Italian Institute for Africa and East - ISIAO 92.51 1 32 - -
Annual Account Institution Nace Rev. 1.1
INPS
For the Italian Red Cross a simple comparison of employment of the INPS source with
the AA (Table 3.5) shows very similar figures. The relatively small differences in terms of employment depend mainly on the different definitions: in the AA employment is defined as the personnel at one point in time (31 December of the reference year); in the INPS data it is given by an average of monthly data and refers to the number of employees who received a pay subject to compulsory contributions during the reference month. This means that, in the INPS source, any employee who had at least one paid day in the reference month is considered as an employment unit10.
For the Park authorities the comparison of the number of employees is quite misleading because the Parks covered by INPS are different from those listed in the AA. Only six parks are present in both sources. In this group there are the biggest Parks in terms of employment size11. On this selected group it is possible to carry on a check on the quality of the labour cost components.
10 This implies that if there are employees with a very short term contract the number of employees could be overestimated
compared to other sources. 11 The six Park authorities are the following: Parco Nazionale d'Abruzzo, Parco Nazionale Gran Paradiso, Parco Nazionale delle
Dolomiti Bellunesi, Parco Nazionale della Maiella, Parco Nazionale del Gran Sasso e Monti della Laga, Parco Nazionale del Vesuvio.

With respect to the previous report two new institutions classified in section O have been singled out from the INPS data: Institute for study and research on agricultural market (ISMEA in Italian) and Italian Institute for Africa and the East (ISIAO in Italian). For them, as well for the National Olympic Committee (CONI in Italian), there are no benchmark sources available. Thus, only a general check of the quality of the variables has been carried out. This check is based on the analysis of the quarterly time series (Q1.2001-Q4.2004) of employment, per capita wages, per capita labour cost and contributive rate. For CONI, those time series show no anomalies and rather acceptable levels, trends and seasonality (Table 3.6). Also for ISMEA and ISIAO the same analysis of quarterly time series shows good results.
Table 3.6 - National Olympic Committee per capita labour cost and its components - INPS source, I.2001-IV.2004
Number of employees
Total wages
(euros )
Employer's social
contributions (euros )
Labour cost
(euros )
Contributive rate
I-2001 2,776 2,275 654 2,929 28.8 II-2001 2,835 2,407 692 3,099 28.8 III-2001 2,704 2,003 577 2,580 28.8 IV-2001 2,751 2,452 711 3,164 29.0 I-2002 2,707 2,639 760 3,399 28.8 II-2002 2,715 2,195 641 2,836 29.2 III-2002 2,683 2,351 686 3,037 29.2 IV-2002 2,620 2,657 773 3,430 29.1 I-2003 2,619 2,720 806 3,526 29.6 II-2003 2,633 3,068 909 3,977 29.6 III-2003 2,521 2,147 637 2,783 29.6 IV-2003 2,426 2,640 783 3,423 29.7 I-2004 2,382 2,856 853 3,709 29.9 II-2004 2,397 2,404 717 3,120 29.8 III-2004 2,315 2,476 738 3,214 29.8 IV-2004 2,241 2,894 858 3,752 29.6
3.4.2. A comparison with the Annual Account benchmark data
For the six abovementioned Park authorities and the Italian Red Cross it is possible to carry out a more precise comparison for years 2001-2003 using the AA data as benchmark.
For the Red Cross the number of employees in the INPS source is higher in 2001 and 2002 compared with the benchmark, while it is slightly lower in 2003 (Table 3.7). As it has already been noted, a different definition of employment may explain a large share of those differences. The per capita labour cost is always much higher in the INPS source than in the AA, reaching a difference of around 10% in 2003. Both wages and contributions are higher in INPS data than in the AA in the three years. These differences in the levels of the variables are not really worrying provided they remain stable over time.
The comparison of annual changes of per capita labour cost components (Table 3.8) shows good results. The total labour cost is lower in 2002 by almost the same percentage (5% in AA and 4.9% in INPS) and also in 2003 the growth has quite the same size (22.1% in AA and

24.9% in INPS). Also the annual changes of per capita wages give roughly the same good results, while for contributions the comparison is slightly less satisfactory.
Table 3.7 - Per capita labour cost and its components from INPS database and Annual Account - Italian Red Cross, years 2001-2003
2001 2002 2003 2001 2002 2003 2001 2002 2003
Number of employees 2,758 2,824 3,039 2,908 2,959 3,026 5.4 4.8 -0.4Total wages (euros) 1,974 1,875 2,289 2,107 2,031 2,537 6.7 8.3 10.8Employer's social contributions (euros) 439 417 509 475 424 531 8.3 1.8 4.3Contributive rate 22.2 22.2 22.2 22.6 20.9 20.9Labour cost (euros) 2,412 2,292 2,798 2,582 2,456 3,067 7.0 7.1 9.6
Difference (%)INPS databaseAnnual Account
Table 3.8 - Percentage annual changes of per capita labour cost and its components from INPS database and Annual Account - Italian Red Cross, years 2001-2003
The comparison for the six Park authorities (Table 3.9 and 3.10) is less straightforward.
The number of employees covered by the AA is much larger than that by the INPS database (more than twice in 2003). This could depend on the fact that INPS data do not cover employees with fixed-term contracts. On the other hand the AA benchmark data could have some problem (i.e., they could not include wages for fixed-term employees). The comparison on the labour cost components shows always higher per capita levels in the INPS data, since these refer only to the open-ended contract employees whose wages are generally higher. Furthermore, the percentage differences strongly vary from year to year. It is not surprising that also the annual changes have very different patterns.
20032001
20022001
20032002
20032001
20022001
20032002
20032001
20022001
20032002
Number of employees 10.2 2.4 7.6 4.1 1.8 2.2 -6.1 -0.6 -5.4Total wages 16.0 -5.0 22.1 20.4 -3.6 24.9 4.4 1.4 2.8Employer's social contributions 16.0 -5.0 22.1 11.7 -10.7 25.0 -4.3 -5.7 2.9Labour cost 16.0 -5.0 22.1 18.8 -4.9 24.9 2.8 0.1 2.8
INPS database(b)
Difference(b-a)
Annual Account(a)

Table 3.9 - Per capita labour cost and its components from INPS database and Annual Account - Park authorities, years 2001-2003
2001 2002 2003 2001 2002 2003 2001 2002 2003
Number of employees 235 178 295 129 136 141 -44.9 -23.4 -52.2Total wages (euros) 1,745 2,012 1,641 2,250 2,129 2,230 28.9 5.8 35.9Employer's social contributions (euros) 593 482 473 816 777 717 37.4 61.2 51.6Contributive rate 34 24 29 36 36 32Labour cost (euros) 2,339 2,494 2,114 3,066 2,906 2,947 31.1 16.5 39.4
Difference (%)INPS databaseAnnual Account
Table 3.10 - Percentage annual changes of per capita labour cost components from INPS database and Annual Account - Park authorities, years 2001-2003
20032001
20022001
20032002
20032001
20022001
20032002
20032001
20022001
20032002
Number of employees 25.5 -24.3 65.7 8.9 5.3 3.4 -16.6 29.6 -62.3Total wages -6.0 15.3 -18.4 -0.9 -5.4 4.7 5.1 -20.7 23.2Employer's social contributions -20.3 -18.8 -1.9 -12.1 -4.7 -7.7 8.2 14.0 -5.8Labour cost -9.6 6.6 -15.2 -3.9 -5.2 1.4 5.7 -11.9 16.6
INPS database(b)
Difference(b-a)
Annual Account(a)
3.5. Which source is better for the LCI compilation? In the following, we gather the information available for each public institution of the two
sections in order to make a cost-benefit evaluation of the different sources and compare them from a quantitative point of view.
As far as section N is concerned, the available sources regard the National Health Service (from now on, NHS) units and the Italian Red Cross Central Committee. For the latter only the INPS data are available, while for the former we have the EA, the QRCF and the QSNHS.
The QSNHS gives information separately on fixed costs, additional costs and employer’s social contributions and on the level of employment, broken down by job position. Unfortunately, this source is still at an experimental stage and the first preliminary data will be available in the next months. In any case it has started collecting data only from the first quarter of 2005.
The EA and the QRCF have very similar features. They do not provide separate information on the two LCI main components nor on the level of employment. However, the EA has the advantage with respect to the QRCF of being already in use by the NA for the quarterly estimates on section N (see section 3.1). Hence, the transmission of the basic data from the Ministry of Health is well established, and the actual data flows are timely and punctual. This allows the NA to compute the variable compensation of employees, necessary to the annual-to-quarterly temporal disaggregation procedure, and produce the estimates within 60 days after the end of the reference quarter.
Even though the two sources are not strictly comparable, since the EA includes also the Scientific Institutions providing Hospitalization and Care and different registration criteria are used (accrual for the EA and cash for the QRCF), we will however try to examine the overall patterns in order to make some preliminary considerations. It must be stressed that the variables we will compare are the staff expenditures of the QRCF and the compensations of employees estimated by the NA starting from the EA (i.e., the preliminary raw version of those actually used in the annual-to-quarterly temporal disaggregation procedure, see section 3.1).
The annual amounts of the variables under comparison are rather similar and the QRCF levels exceed those of the EA (of around 2% and 1% in the two years as can be deduced from Table 3.11). This could be due to the fact that the staff expenditures variable includes additional items with respect to compensations of employees.
In terms of quarterly amounts, the QRCF figures are larger than those of the EA in the first two quarters of both years, the opposite being true in the second two quarters. A possible explanation could appeal to the two different criteria of recording the payments between the two sources. Moreover, in the last quarters of both years the discrepancies are almost negligible (around 1%).
The EA quarter-on-quarter changes are in absolute value smaller than those of the QRCF (see also Figure 3.1). This may depend on the fact that, on the basis of the accrual registration criterion, arrears are attributed to the months they refer to and are thus redistributed over a longer period. However, the sign of the changes is the same throughout all the quarters of the two years under investigation. The apparent similarity in the general evolution is simply caused by the payment of the year-end bonus recorded by both sources in the month of December. As far as the EA is concerned, a larger change in the second quarter 2004 with respect to that of the same quarter of 2003 could depend on the renewal of the national labour contract in the National Health Service area. This is less apparent in analysing the QRCF data for the same period.
In the near future, we plan to search for possible explanations to the differences between the patterns above described in collaboration with the GAD office which manages the QRCF and

the NA Department. In the meantime, for the abovementioned advantages, we decided to use the EA data to produce some preliminary aggregate results on section N.
Table 3.11 - Compensation of employees from Economical Account and staff expenditures from Quarterly Report on Cash Flows: levels, quarter-on-quarter and year-on-year changes - National Health Service, years 2003-2004
Level(millions of euros)
Quarter-on-quarter change
(%)
Year-on-year change
(%)
Level(millions of euros)
Quarter-on-quarter change
(%)
Year-on-year change
(%)
2003 28,022 28,760I-2003 6,772 7,089II-2003 6,863 1.3 7,957 12.2III-2003 6,673 -2.8 6,070 -23.7IV-2003 7,714 15.6 7,644 25.92004 30,921 31,375I-2004 7,004 -9.2 3.4 7,352 -3.8 3.7II-2004 7,919 13.1 15.4 8,714 18.5 9.5III-2004 6,839 -13.6 2.5 6,311 -27.6 4.0IV-2004 9,158 33.9 18.7 8,998 42.6 17.7
Compensation of employeesEconomical Account
Staff expenditures Quarterly Report on Cash Flows
Figure 3.1 - Quarter-on-quarter changes of Economical Account compensation of employees and Quarterly Report on Cash Flows staff expenditures - National Health Service, years 2003-2004
-30
-20
-10
0
10
20
30
40
50
II-2003 III-2003 IV-2003 I-2004 II-2004 III-2004 IV-2004
Economical Account Quarterly Report on Cash Flows

As far as the section O institutions are concerned, the situation is somewhat more composite. The sources currently available cover the Chambers of Commerce, the Park authorities, the Italian National Olympic Committee, the Institute for study and research on the agricultural market and the Italian Institute for Africa and the East. The first three institutions are covered by the QRCF source and all but the Chambers of Commerce by the INPS one.
With respect to the QRCF, the INPS source provides a larger amount of information, since it separately provides the two main labour cost components, as well as the average monthly number of employees. These features make it more suitable to be used for the compilation of the LCI. Moreover, the transmission of the basic data is well established, timely and punctual, since they are used for the OROS-LCI. Finally, the information of the INPS database is also broken down by job position.
In the following, a comparison between the two sources on the common institutions (i.e., Park authorities and the National Olympic Committee) is made. Also in this case the variables under comparison are not homogeneous, the QRCF one representing staff expenditures, and the INPS one corresponding to the compensation of employees, which is obtained from the sum of wages and contributions.
For the first institutions, the INPS source includes only six parks for all the years. Therefore, for the sake of a correct comparison, QRCF data have been reduced to the same set of units.
As shown in Table 3.12, the differences among the quarterly levels are always very large, which cannot be simply explained by appealing to the different content of the variables under comparison. Indeed, as already pointed out in section 3.4, the annual INPS data on compensation of employees and personnel strongly differ from the analogous ones in the AA, and also give rise to rather different per capita values.
Also the quarterly evolution of the two sources (Figure3.2) is quite different, both in value and in sign. The only similarities can be found in the evolution from the second quarter 2003 to the second quarter 2004, although the percentage changes have rather different values. Furthermore, the largest departures between the two rates of change can be observed in the fourth quarters of all years.
Since no apparent inconsistencies show in the INPS data for the Park units, and given their positive characteristics for the LCI purposes, we have chosen to use them in our preliminary estimates on section O.
As far as the National Olympic Committee is concerned, only data related to year 2001 are available from the QRCF.
In terms of annual amounts, the two sources do not markedly differ, and the QRCF values are higher by around 15% (as can be deduced from Table 3.13). This was expected since the staff expenditures variable includes additional items with respect to compensation of employees.
The quarterly evolution of the QRCF shows that this source’s quality is extremely poor. From the second quarter onwards, a dramatic fall can be observed, which has no known explanation and is offset in the fourth quarter. On the contrary, INPS data have a much more stable evolution, which makes it more reliable.

Table 3.12 - Compensation of employees from INPS database and staff expenditures from Quarterly Report on Cash Flows: levels, quarter-on-quarter and year-on-year changes - Park authorities, years 2001-2004
Level(thousands of euros)
Quarter-on-quarter change
(%)
Year-on-year change
(%)
Level(thousands of euros)
Quarter-on-quarter change
(%)
Year-on-year change
(% )
2001 4,761 9,234I-2001 889 1,912II-2001 1,285 44.5 2,350 22.9III-2001 1,132 -12.0 2,588 10.1IV-2001 1,455 28.6 2,383 -7.92002 4,753 9,357I-2002 1,227 -15.7 37.9 2,343 -1.7 22.5II-2002 1,093 -10.9 -15.0 2,184 -6.8 -7.1III-2002 1,091 -0.2 -3.6 1,894 -13.3 -26.8IV-2002 1,342 23.0 -7.8 2,936 55.0 23.22003 4,984 12,841I-2003 1,079 -19.6 -12.1 3,217 9.6 -38.2II-2003 1,116 3.5 2.2 3,387 5.3 55.1III-2003 966 -13.5 -11.5 2,366 -30.1 24.9IV-2003 1,823 88.7 35.8 3,871 63.6 31.82004 5,417 12,565I-2004 1,336 -26.7 23.9 2,676 -30.9 84.8II-2004 1,332 -0.3 19.3 2,460 -8.1 -27.4III-2004 1,252 -6.0 29.6 2,383 -3.1 0.7IV-2004 1,497 19.6 -17.9 5,046 111.7 30.4
Compensation of employeesINPS database
Staff expenditures Quarterly Report on Cash Flows

Figure 3.2 - Quarter-on-quarter changes of INPS compensation of employees and Quarterly Report on Cash Flows staff expenditures - Park authorities, years 2001-2004
Table 3.13 - Compensation of employees from INPS database and staff expenditures from Quarterly Report on Cash Flows: levels and quarter-on-quarter changes - National Olympic Committee, year 2001
-40
-20
0
20
40
60
80
100
120
II-2001
III-2001
IV-2001
I-2002
II-2002
III-2002
IV-2002
I-2003
II-2003
III-2003
IV-2003
I-2004
II-2004
III-2004
IV-2004
INPS database Quarterly Report on Cash Flows
Level(thousands of euros)
Quarter-on-quarter change
(%)
Level(thousands of euros)
Quarter-on-quarter change
(%)
2001 97,789 111,266I-2001 24,397 28,922II-2001 26,356 8.0 18,892 -34.7III-2001 20,924 -20.6 6,468 -65.8IV-2001 26,112 24.8 56,985 781.1
Compensation of employees INPS database
Staff expenditures Quarterly Report on Cash Flows

4. QUARTERLY NATIONAL ACCOUNTS ESTIMATIONS: A GENERAL LOOK AT THE METHODOLOGY
Istat has a long tradition in producing quarterly National Accounts aggregates which are estimated since the mid ’80s. At the moment, quarterly estimations for employment (in full-time equivalents), total wages and compensation of employees are produced for six aggregate economic activities with a delay of seventy days after the end of the reference quarter. An aggregate estimation is produced for sections L, M, N and O altogether. Some experimental estimates for the four separate sections are nonetheless available. In the present and the next paragraph we discuss the provisional methodology used to produce the section M estimate. In particular, in this paragraph a general presentation of the benchmarking and annual-to-quarterly temporal disaggregation procedure used by Istat is given.
National Accounts quarterly aggregates are estimated mainly by means of mathematical and/or statistical methods, which use additional information called reference indicators (for example, a proxy of the interest variable observed at a quarterly level). These methods are divided into two sub-sets, depending on the number of stages required to carry out the quarterly estimates and comply with the annual constraints12: optimal methods when just one stage is involved and methods of adjustment when they are two. Methods producing quarterly estimates using only the annual constraints are used when additional information is not available.
Istat has chosen the Chow and Lin (Chow and Lin, 1971) optimal method in the Italian version of Barbone, Bodo and Visco (BBV, 1981) when reference indicators are available, otherwise - although rarely - the Denton method is used.
Before applying the BBV procedure an annual preliminary statistical analysis of the data is carried out, in order to assess their ability to explain the phenomenon under analysis. Moreover, the seasonality is studied using the Tramo-Seats package. The preliminary analysis suggested by the BBV is based on the assumption that there is a linear relationship between the series to be interpolated from annual to quarterly (indicated) and the quarterly series (indicator) and that this relation also applies to the annual level. The preliminary analysis involves two stages: a first stage in which the annual graph of the ratio between indicated and indicator is studied in order to discover any anomalies. A second stage in which the parameters of an annual linear regression model, with the indicated as the dependent variable, are estimated and tests are carried out to verify the data fitting goodness of the model. When the results of the tests are satisfactory and the indicator succeeds in explaining the trend of the annual data, it is assumed that this indicator can also approximate the quarterly series to be estimated.
4.1. Total wages, contributions and compensation of employees quarterly estimations
Quarterly National Accounts estimates of total wages and compensation of employees in sections L-O are still based on an experimental approach, which produces provisional results. In particular, the reference indicators used for sections L-O quarterly estimates derive from the quarterly estimates of the GGS, which are obtained by adding Central and Local Government estimates (see Prospect 4.1). More specifically, estimates regarding the State (excluding the Armed Forces and Police Corps) are used as an approximation for the Central Government ones, whereas estimates for Regions, Municipalities and Provinces, Universities, National Health Services (Local Health Units, Hospitals and Scientific Admission and Care Institutes) approximate those for Local government.
12 The annual constraints are based on the annual National Accounts estimates.
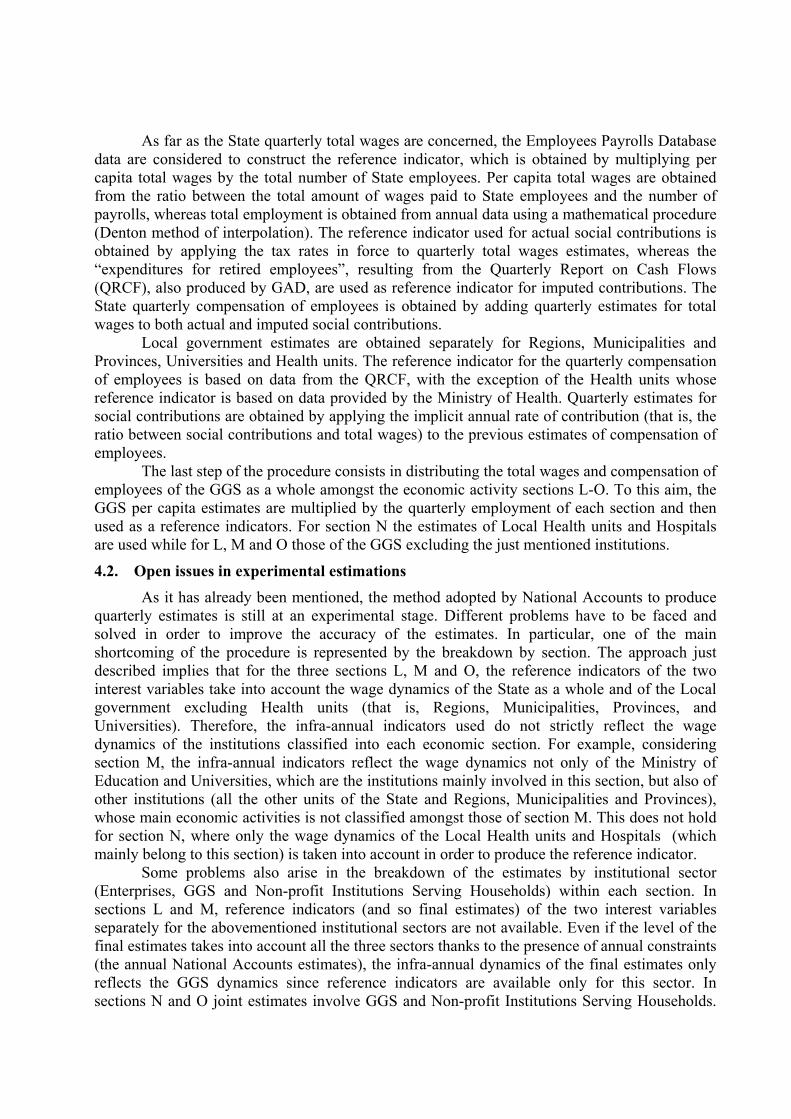
As far as the State quarterly total wages are concerned, the Employees Payrolls Database data are considered to construct the reference indicator, which is obtained by multiplying per capita total wages by the total number of State employees. Per capita total wages are obtained from the ratio between the total amount of wages paid to State employees and the number of payrolls, whereas total employment is obtained from annual data using a mathematical procedure (Denton method of interpolation). The reference indicator used for actual social contributions is obtained by applying the tax rates in force to quarterly total wages estimates, whereas the “expenditures for retired employees”, resulting from the Quarterly Report on Cash Flows (QRCF), also produced by GAD, are used as reference indicator for imputed contributions. The State quarterly compensation of employees is obtained by adding quarterly estimates for total wages to both actual and imputed social contributions.
Local government estimates are obtained separately for Regions, Municipalities and Provinces, Universities and Health units. The reference indicator for the quarterly compensation of employees is based on data from the QRCF, with the exception of the Health units whose reference indicator is based on data provided by the Ministry of Health. Quarterly estimates for social contributions are obtained by applying the implicit annual rate of contribution (that is, the ratio between social contributions and total wages) to the previous estimates of compensation of employees.
The last step of the procedure consists in distributing the total wages and compensation of employees of the GGS as a whole amongst the economic activity sections L-O. To this aim, the GGS per capita estimates are multiplied by the quarterly employment of each section and then used as a reference indicators. For section N the estimates of Local Health units and Hospitals are used while for L, M and O those of the GGS excluding the just mentioned institutions.
4.2. Open issues in experimental estimations As it has already been mentioned, the method adopted by National Accounts to produce
quarterly estimates is still at an experimental stage. Different problems have to be faced and solved in order to improve the accuracy of the estimates. In particular, one of the main shortcoming of the procedure is represented by the breakdown by section. The approach just described implies that for the three sections L, M and O, the reference indicators of the two interest variables take into account the wage dynamics of the State as a whole and of the Local government excluding Health units (that is, Regions, Municipalities, Provinces, and Universities). Therefore, the infra-annual indicators used do not strictly reflect the wage dynamics of the institutions classified into each economic section. For example, considering section M, the infra-annual indicators reflect the wage dynamics not only of the Ministry of Education and Universities, which are the institutions mainly involved in this section, but also of other institutions (all the other units of the State and Regions, Municipalities and Provinces), whose main economic activities is not classified amongst those of section M. This does not hold for section N, where only the wage dynamics of the Local Health units and Hospitals (which mainly belong to this section) is taken into account in order to produce the reference indicator.
Some problems also arise in the breakdown of the estimates by institutional sector (Enterprises, GGS and Non-profit Institutions Serving Households) within each section. In sections L and M, reference indicators (and so final estimates) of the two interest variables separately for the abovementioned institutional sectors are not available. Even if the level of the final estimates takes into account all the three sectors thanks to the presence of annual constraints (the annual National Accounts estimates), the infra-annual dynamics of the final estimates only reflects the GGS dynamics since reference indicators are available only for this sector. In sections N and O joint estimates involve GGS and Non-profit Institutions Serving Households.

As a consequence, reference indicators and final estimates separately for the private sector are also available.
Prospect 4.1 - National Accounts quarterly estimation method for sections L-O total wages and compensation of employees
Series to be estimated Reference indicators Source of the reference indicators
Registration criterion
Estimation method
CENTRAL GOVERNMENT State (excluding Armed Forces and Police Corps)
Quarterly total wages (a)
per capita quarterly total wages x
total employees
Employees Payroll Database Accrual BBV
Actual quarterly contributions (b)
tax rates in force x
(a) Internal Accrual BBV
Imputed quarterly contributions
(c) “expenditures for retired employees”
Quarterly Report on Cash Flows
Cash BBV
Quarterly income (d) (a)+(b)+(c)
LOCAL GOVERNMENT (Regions, Municipalities and Provinces, Health units, Universities)
Quarterly income (e) “expenditures for employees”
Quarterly Report on Cash Flows
Cash BBV
Quarterly social contributions (f)
annual rate x
(e) Internal Cash
Quarterly total wages (g) (e)-(f)
GENERAL GOVERNMENT SECTOR Quarterly total wages (a)+(g) BBV
Quarterly income (d)+(e) BBV ECONOMIC ACTIVITY SECTIONS
L (general government, defence and social security funds); M (education); O (other public, personal social services)
Quarterly income
per capita quarterly income of the General Government
(excluding Local Health Units and Hospitals) x
quarterly employment of the section
BBV
Quarterly total wages
per capita quarterly total wages of the General Government
(excluding Local Health Units and Hospitals) x
quarterly employment of the section
BBV
N (health care and social assistance)
Quarterly income
per capita quarterly income of Local Health Units and Hospitals
x quarterly employment of the section
BBV
Quarterly total wages
per capita quarterly total wages of Local Health Units and Hospitals
x quarterly employment of the section
BBV

5. SOME PRELIMINARY AGGREGATE RESULTS ON PUBLIC SECTORS OF N AND O USING THE AVAILABLE SOURCES
In the previous chapter the best source to be used for the LCI construction in each public institution of the two economic activity sections has been identified.
A source covering all the institutions of each section does not exist. Thus, in order to obtain the whole sections LCI, different sources have to be combined.
In particular, the EA and INPS data will be used for section N, while the INPS source will be combined with the QRCF for section O.
In the following, we will first show how to obtain per capita values of the interest variables from the sources, and then make a comparison between our preliminary aggregate results and the NA quarterly experimental estimates.
5.1. The integration of the sources The exercise that we are proposing concerns quarterly estimates of per capita total wages
and compensations of employees separately for the two sections. The compensation of employees defined in this report strongly resembles the one
calculated by the NA and can be seen as the best available approximation of the labour cost. In fact, the previously identified sources do not allow us to define the labour cost precisely as stated in the Regulation. On the one hand, the INPS database and the EA do not collect some expenditure items such as vocational training costs, other expenditures, taxes and subsidies. On the other hand, the only variable from the QRCF (staff expenditures) includes additional items not required by the Regulation.
The years taken into consideration are 2003 and 2004, which are the two years common to the different sources.
As far as section N is concerned, the overall estimates have been obtained by combining the information on NHS units (from EA) and on the Italian Red Cross (from INPS), which account for 99.6% of all section N in terms of employment. The aggregation criterion is represented by a weighted average with structural weights taken from the AA 2003 and given by the percentage shares of the two kinds of institutions in terms of the interest variables (wages, contributions and compensations of employees).
In particular, for the Italian Red Cross the INPS data on per capita total wages and contributions have been directly used, while for the NHS units the interest variables have been estimated as follows.
The quarterly amount of compensation of employees collected by the EA has been used as a starting point for the estimation of the labour cost components. The contributions have been obtained by applying the ratio between contributions and compensations of employees derived from the AA 2003 to the EA compensations of employees. Total wages are simply given by the difference between compensations of employees and contributions.
Regarding the quarterly employment, this is provided neither by the EA nor by other infra-annual sources. Therefore, the starting point has been given by the AA levels of employment and the quarterly evolution has been interpolated by equally distributing the overall annual changes among the different quarters.
For section O a similar approach has been followed. The overall estimates have been obtained by combining the information on Chambers of Commerce (from QRCF) and National Park authorities, the National Olympic Committee, the Institute for study and research on the

agricultural market and the Italian Institute for Africa and the East (from INPS), which account for around 67% of the whole section employment. The aggregation criterion is once again given by a weighted average with structural weights taken from both the AA and the General Government Sector Yearbook. The weighting structure refers to the year 2002, for which the two structural sources cover all of the abovementioned institutions, and it is given by the percentage shares of the different institutions in terms of employment.
For the Chambers of Commerce, the quarterly compensations of employees have been computed by applying the ratio between them and staff expenditures, taken from the AA, to the QRCF staff expenditures. Contributions, total wages and the number of employees have been derived by using the procedures just described for the NHS units.
For the other section O institutions, the INPS data have been directly used without any processing.
5.2. Comparison with the quarterly National Accounts experimental estimations In the following, we will perform some comparisons between the results of our exercise
and the quarterly NA experimental estimations. Before analysing the data, it could be useful to make some key observations in order to
provide possible explanations of the differences found between the NA and our results. To this aim, Table 5.1 shows the composition of sections L-O by institutional sector (S.13
Public institutions, Enterprises, non-S.13 Public institutions and Non-profit Institutions) derived from the General Census of Industry and Services 2001.
It is worth reminding that our estimates refer only to S.13 Public institutions (see Chapter 2), while NA ones refer to all the institutional sectors13.
In section N, the S.13 institutions cover a half of the overall employment. Therefore, our estimates are representative of a significant part of the overall section.
In section O, the S.13 institutions account only for around 6%, whereas the enterprises cover the largest share of the overall employment (around 80%). We will show that our estimates are not representative of the whole section O in terms of per capita wage variables.
As shown in Table 5.2, section N per capita total wages obtained from our exercise (based on EA and INPS data) are systematically higher than the NA ones (on average around 13% and 16% respectively in the two years), the opposite being true for the employer’s social contributions (on average around 11% and 8% respectively in the two years). This could be due to the fact that, on the one hand in the public sector of section N per capita total wages are higher than in the private sector (which accounts for around 30% of the overall section). On the other hand, the NA estimates include some additional contributions paid to the Social Security Institute for Civil Servants (INPDAP), which are not taken into consideration in our estimates.
As regards compensation of employees, the differences observed for wages and contributions combine to produce a positive difference (which varies from 4.4% to 13.6%) in all quarters, except for the fourth quarter 2003 (where there shows a small underestimate, 2.5%).
13 Section L-O National Accounts quarterly estimates are obtained by means of an annual-to-quarterly temporal disaggregation procedure, which uses the annual National Accounts estimates as constraint and quarterly reference indicators in order to interpolate the infra-annual evolution. The level of the final estimates takes into account all the sectors (S.13 Public institutions, Enterprises, non-S.13 Public institutions and Non-profit Institutions), thanks to the presence of annual constraints. Regarding the infra-annual evolution, in sections N and O it reflects that of both S.13 sector and Enterprises, since two separate reference indicators are available respectively for S.13 sector and Enterprises. In sections L and M, the infra-annual evolution only reflects that of the S.13 sector, since no reference indicators are available for the private sector (see Chapter 4 for a detailed description).
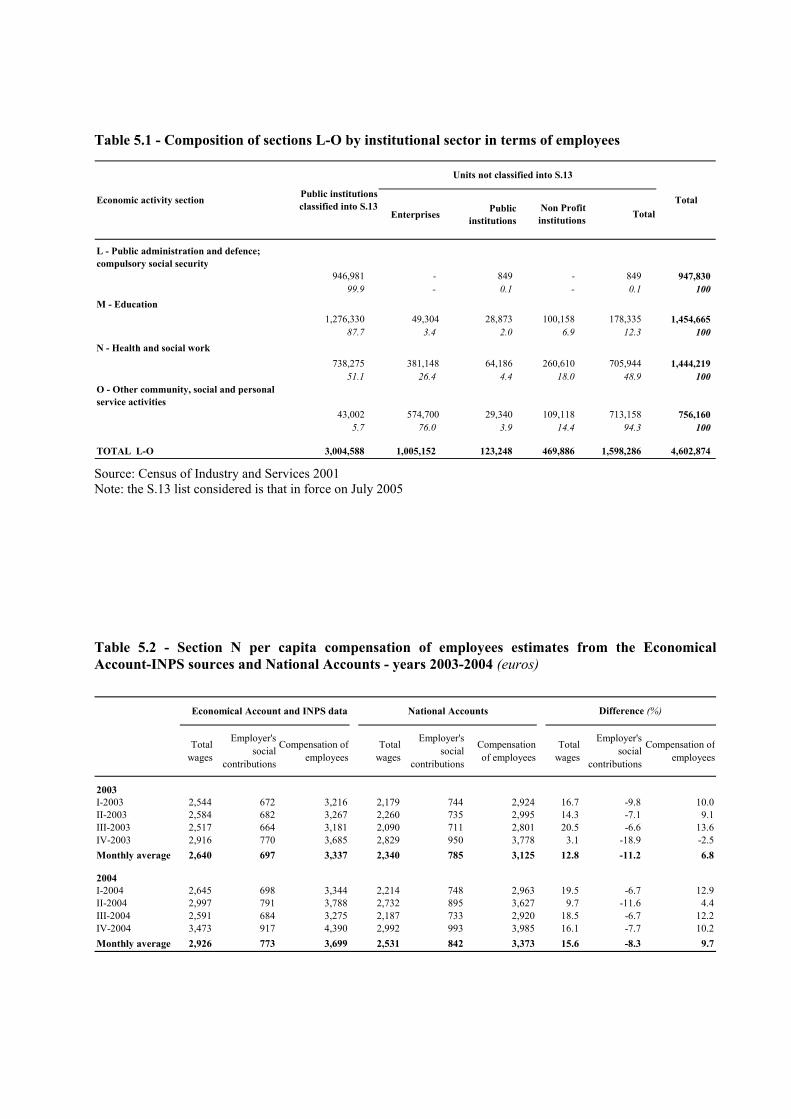
Table 5.1 - Composition of sections L-O by institutional sector in terms of employees
Enterprises Public institutions
L - Public administration and defence; compulsory social security
946,981 - 849 - 849 947,830 99.9 - 0.1 - 0.1 100
M - Education1,276,330 49,304 28,873 100,158 178,335 1,454,665
87.7 3.4 2.0 6.9 12.3 100 N - Health and social work
738,275 381,148 64,186 260,610 705,944 1,444,219 51.1 26.4 4.4 18.0 48.9 100
O - Other community, social and personal service activities
43,002 574,700 29,340 109,118 713,158 756,160 5.7 76.0 3.9 14.4 94.3 100
TOTAL L-O 3,004,588 1,005,152 123,248 469,886 1,598,286 4,602,874
Economic activity section TotalNon Profit institutions
Units not classified into S.13
Total
Public institutions classified into S.13
Source: Census of Industry and Services 2001 Note: the S.13 list considered is that in force on July 2005
Table 5.2 - Section N per capita compensation of employees estimates from the Economical Account-INPS sources and National Accounts - years 2003-2004 (euros)
Total wages
Employer's social
contributions
Compensation of employees
Total wages
Employer's social
contributions
Compensation of employees
Total wages
Employer's social
contributions
Compensation of employees
2003I-2003 2,544 672 3,216 2,179 744 2,924 16.7 -9.8 10.0II-2003 2,584 682 3,267 2,260 735 2,995 14.3 -7.1 9.1III-2003 2,517 664 3,181 2,090 711 2,801 20.5 -6.6 13.6IV-2003 2,916 770 3,685 2,829 950 3,778 3.1 -18.9 -2.5Monthly average 2,640 697 3,337 2,340 785 3,125 12.8 -11.2 6.8
2004I-2004 2,645 698 3,344 2,214 748 2,963 19.5 -6.7 12.9II-2004 2,997 791 3,788 2,732 895 3,627 9.7 -11.6 4.4III-2004 2,591 684 3,275 2,187 733 2,920 18.5 -6.7 12.2IV-2004 3,473 917 4,390 2,992 993 3,985 16.1 -7.7 10.2Monthly average 2,926 773 3,699 2,531 842 3,373 15.6 -8.3 9.7
Difference (%)Economical Account and INPS data National Accounts

The quarterly evolutions of the two labour cost components (Figures 5.1-5.3) look rather similar, but the NA quarterly changes are higher in absolute value. The similar evolution could be due to the fact that both estimates use the EA data. In particular, they are used as reference indicators in the NA annual-to-quarterly temporal disaggregation procedure for the S.13 sector of section N. The different level of the quarterly changes could depend on the fact that the NA estimates also contain the private sector, which has a larger variability. From both sources the marked changes in the fourth quarters (due to the payment of the year-end bonus) can be observed, as well as the changes in the second quarter 2004 (related to the contract renewal in the Health public sector).
Figure 5.1 - Quarter-on-quarter changes of section N per capita total wages estimates from Economical Account-INPS sources and National Accounts - years 2003-2004
-30
-20
-10
0
10
20
30
40
II-2003 III-2003 IV-2003 I-2004 II-2004 III-2004 IV-2004
0 0 .5 1 1 .5 2 2 .5 3 3 .5 4 4 .5
Economical Account and INPS data
Quarterly National Accounts
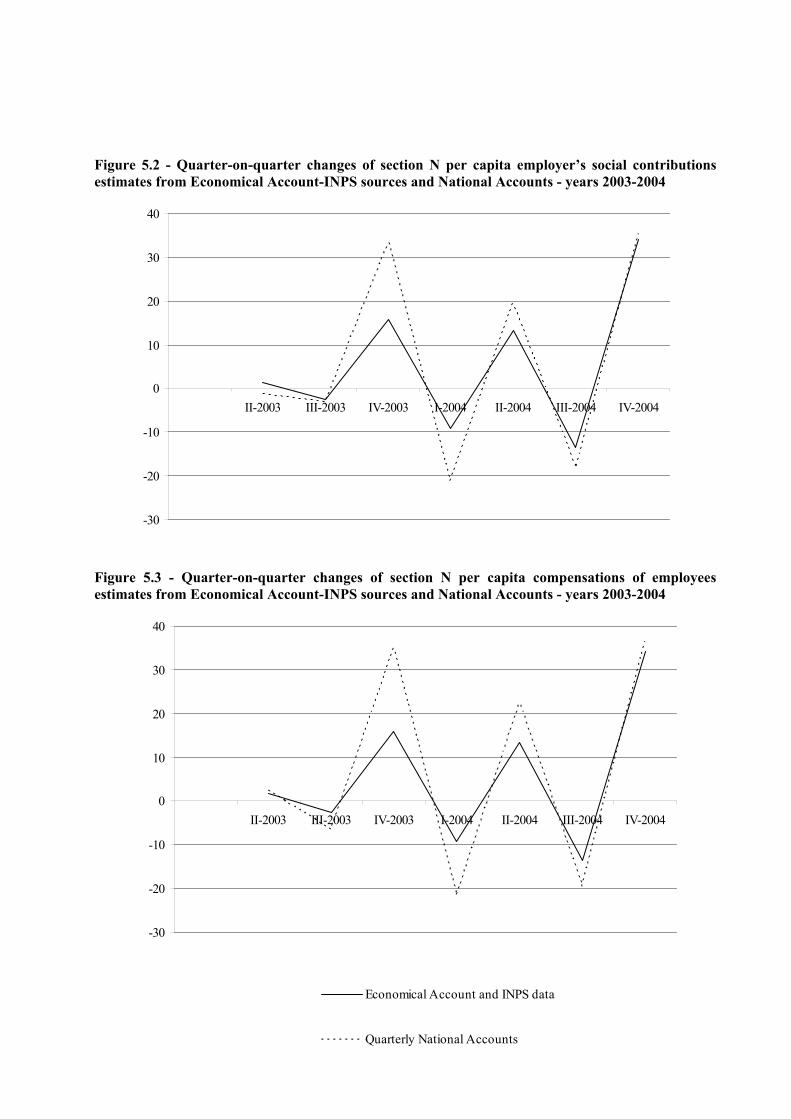
Figure 5.2 - Quarter-on-quarter changes of section N per capita employer’s social contributions estimates from Economical Account-INPS sources and National Accounts - years 2003-2004
-30
-20
-10
0
10
20
30
40
II-2003 III-2003 IV-2003 I-2004 II-2004 III-2004 IV-2004
Figure 5.3 - Quarter-on-quarter changes of section N per capita compensations of employees estimates from Economical Account-INPS sources and National Accounts - years 2003-2004
-30
-20
-10
0
10
20
30
40
II-2003 III-2003 IV-2003 I-2004 II-2004 III-2004 IV-2004
0 0 .5 1 1 .5 2 2 .5 3 3 .5 4 4 .5
Economical Account and INPS data
Quarterly National Accounts

As far as section O is concerned, Table 5.3 shows how per capita compensations of employees, obtained from our exercise and referring only to S.13 institutions, do not represent the whole section O (an overestimate of around 20% with respect to the NA can be observed).
However, the quarterly evolution of all wage components (Figures 5.4-5.6) is fairly similar, especially in 2003. It is reasonable to suppose that the quarterly evolution of section O private sector (taken into account in NA estimates) does not strongly differ from the public sector one, but the private sector would seem to affect the size of NA quarterly changes.
Table 5.3 - Section O per capita compensation of employees estimates from the Economical Account-INPS sources and National Accounts - years 2003-2004 (euros)
Total wages
Employer's social
contributions
Compensation of employees
Total wages
Employer's social
contributions
Compensation of employees
Total wages
Employer's social
contributions
Compensation of employees
2003I-2003 2,034 560 2,594 1,462 486 1,948 39.2 15.1 33.2II-2003 2,256 620 2,876 1,878 567 2,445 20.1 9.3 17.6III-2003 1,928 529 2,456 1,534 529 2,063 25.7 -0.1 19.1IV-2003 2,446 673 3,119 2,041 673 2,714 19.9 -0.1 14.9Monthly average 2,170 596 2,766 1,729 564 2,293 25.5 5.7 20.6
2004I-2004 2,287 632 2,919 1,543 535 2,077 48.2 18.2 40.5II-2004 2,280 626 2,906 1,939 594 2,533 17.5 5.5 14.7III-2004 2,070 571 2,641 1,540 522 2,062 34.5 9.4 28.1IV-2004 2,551 701 3,253 2,103 685 2,788 21.3 2.4 16.7Monthly average 2,296 633 2,929 1,782 584 2,366 28.9 8.3 23.8
Difference (%)Quarterly Report on Cash Flows and INPS data National Accounts

Figure 5.4 - Quarter-on-quarter changes of section O per capita total wages estimates from Economical Account-INPS sources and National Accounts - years 2003-2004
-30
-20
-10
0
10
20
30
40
II-2003 III-2003 IV-2003 I-2004 II-2004 III-2004 IV-2004
Figure 5.5 - Quarter-on-quarter changes of section O per capita employer’s social contributions estimates from Economical Account-INPS sources and National Accounts - years 2003-2004
-30
-20
-10
0
10
20
30
40
II-2003 III-2003 IV-2003 I-2004 II-2004 III-2004 IV-2004
0 1 2 3 4 5Quarterly Report on Cash Flows and INPS data
Quarterly National Accounts

Figure 5.6 - Quarter-on-quarter changes of section O per capita compensations of employees estimates from Economical Account-INPS sources and National Accounts - years 2003-2004
-30
-20
-10
0
10
20
30
40
II-2003 III-2003 IV-2003 I-2004 II-2004 III-2004 IV-2004
0 1 2 3 4 5Quarterly Report on Cash Flows and INPS data
Quarterly National Accounts

6. THE LCI CONSTRUCTION IN SECTIONS L-O
6.1. The Background
This chapter summarises the results of different feasibility studies carried out in the last three years and makes an assessment of the different options for obtaining complete labour cost indices for sections L-O.
In Italy, the contribution to the national economy of these sections is really relevant in terms of number of employees (26.7%) and it is even higher in terms of compensation of employees (30.6%). Section L has the largest share, followed by M and N (Table 6.1). Furthermore, the structure of the labour cost of these economic activity sections does not really differ from that of sections C to K.
Table 6.1 - Incidence of sections L-O on total economy in terms of employment and compensation of employees - year 2004
Source: National Accounts
6.2. Summary of potentially usable data sources 6.2.1. Existing sources at Istat
− Business registers: at the moment, with reference to the private sectors, while all firms are covered by the ASIA Business Register, for the private institutions a complete and up-to-date Register does not yet exist. For the latter units the 2001 Census is the only currently usable Register. A complete Register of Public Institutions does not yet exist too. However, there exists a “S.13 Istat list”14 which refers to years 2001-2004 and contains many detailed information on the institutional units (taxpayer identification number, corporate name, start and end of activity dates, etc.), but no information on employment or any monetary variable. Obviously non-S.13 public institutions are not covered. On the other hand, according to the EU Business Register Regulation, only from 2007 it will become compulsory to include L.
14 This list is constantly updated and published yearly in the Italian Official Gazette in the month of July.
employees (thousands of units ) % level
(millions of euros) %
L 1,316.7 7.6 57,902.0 10.3M 1,458.4 8.5 51,910.6 9.2N 1,079.4 6.3 43,691.2 7.8O 715.7 4.2 20,319.5 3.6Total sections L-O 4,570.2 26.5 173,823.4 30.9
Total economy (A -Q) 17,231.0 100.0 562,075.0 100.0
Employees (full time equivalent unit) Compensations of employees

− Labour Cost Survey, Structural Earning Survey and other structural surveys:
there are no structural statistical data collections on wages and labour cost which cover sections L-O, and the progress in this field is very slow, given the shortage of financial resources and the Istat policy of reducing the burden on respondents. The EU Regulations require the extension of the LCS to section L and to statistical units with less than 10 employees only starting from the year 2008. For the LCS 2004 Istat had a derogation which allowed it not to cover sections M-O. Istat will perform the SES survey covering, for the first time, also sections L-O (but without covering the units with less than 10 employees) with reference to 2006 data15. Some structural data covering only private firms (not private institutions) are already available on the basis of national annual surveys (SCI-PMI) used also to comply with the SBS Regulation. The absence of data on hours actually worked in the public sector units is particularly worrying.
− Short term sources for L-O:
in Italy, there do not exist short term data collections in sections L-O for statistical purposes. The only short term statistical source is the Istat Collective Agreed Wages Index (CAWI) based on national labour agreements, which releases monthly estimations on the evolution of wages of manual and non-manual employees. No short term information is collected on hours actually worked.
− Annual and quarterly National Accounts: annual National Accounts estimations on employment (in full-time equivalent units), total wages and compensations of employees are available for the four sections considered. Recently, also annual series on hours actually worked (only up to 2003) have been made available. The estimations for section L refer by definition only to public institutions. M, N and O estimations refer to all institutional sectors (private and public) but it is not possible to break the results down into these sectors. National Accounts produce quarterly estimations for the abovementioned variables (excluding hours worked) for 22 branches of economic activities16. One of these aggregate economic activities is given by sections L-P altogether. Some experimental estimates for the four separate sections are nonetheless available.
6.2.2. Other sources, Government surveys and administrative data
− INPS DM10 administrative database: the INPS database contains detailed information on wages, other labour cost components and employment. No information on hours worked is available. This database is currently used in the OROS survey for producing LCI in sections C-K. The INPS data cover also the private units in sections M-O. On the other hand, the great majority of public units remit the payment of the social contributions for their employees to other Social Securities Institutes. Only a small
15 Istat for this scope intend to use mainly administrative data. 16 For the main branches data are available with a delay of 70 days after the end of the reference quarter, while for the others
(mainly for subsections of D, G and H together, and I) the quarterly estimations are released in the month of March simultaneously with the release of the annual National Accounts data.
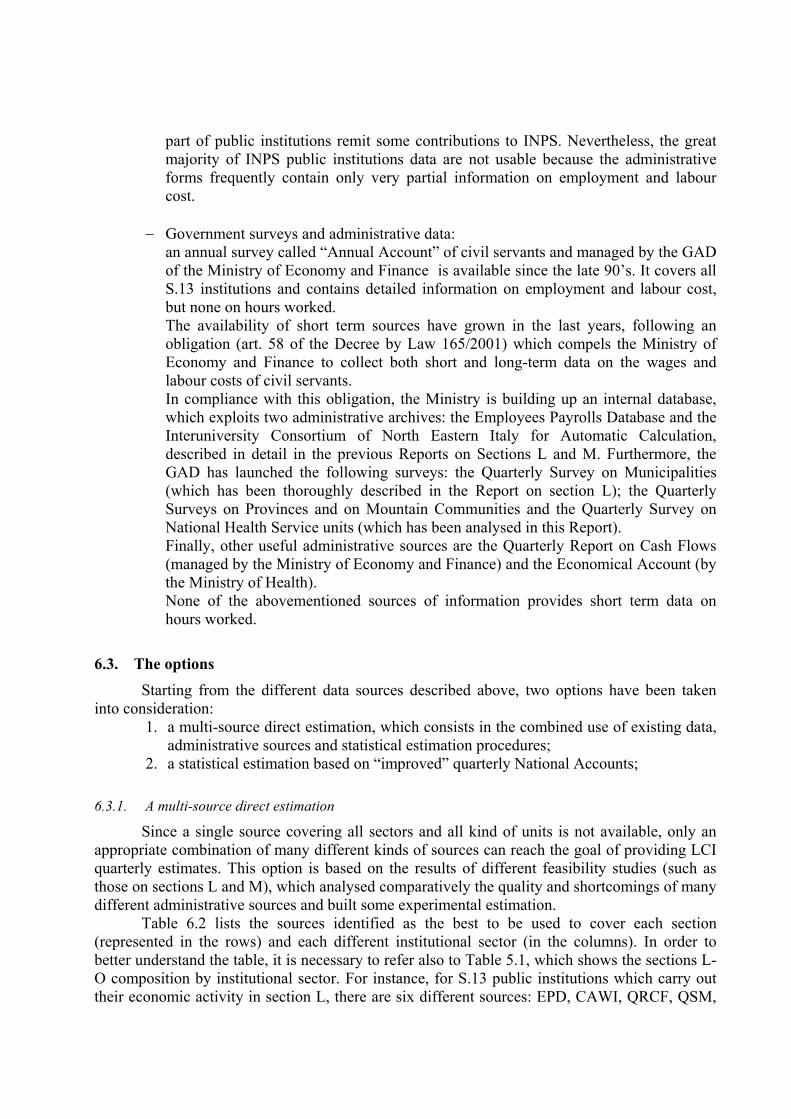
part of public institutions remit some contributions to INPS. Nevertheless, the great majority of INPS public institutions data are not usable because the administrative forms frequently contain only very partial information on employment and labour cost.
− Government surveys and administrative data:
an annual survey called “Annual Account” of civil servants and managed by the GAD of the Ministry of Economy and Finance is available since the late 90’s. It covers all S.13 institutions and contains detailed information on employment and labour cost, but none on hours worked. The availability of short term sources have grown in the last years, following an obligation (art. 58 of the Decree by Law 165/2001) which compels the Ministry of Economy and Finance to collect both short and long-term data on the wages and labour costs of civil servants. In compliance with this obligation, the Ministry is building up an internal database, which exploits two administrative archives: the Employees Payrolls Database and the Interuniversity Consortium of North Eastern Italy for Automatic Calculation, described in detail in the previous Reports on Sections L and M. Furthermore, the GAD has launched the following surveys: the Quarterly Survey on Municipalities (which has been thoroughly described in the Report on section L); the Quarterly Surveys on Provinces and on Mountain Communities and the Quarterly Survey on National Health Service units (which has been analysed in this Report). Finally, other useful administrative sources are the Quarterly Report on Cash Flows (managed by the Ministry of Economy and Finance) and the Economical Account (by the Ministry of Health). None of the abovementioned sources of information provides short term data on hours worked.
6.3. The options Starting from the different data sources described above, two options have been taken
into consideration: 1. a multi-source direct estimation, which consists in the combined use of existing data,
administrative sources and statistical estimation procedures; 2. a statistical estimation based on “improved” quarterly National Accounts;
6.3.1. A multi-source direct estimation
Since a single source covering all sectors and all kind of units is not available, only an appropriate combination of many different kinds of sources can reach the goal of providing LCI quarterly estimates. This option is based on the results of different feasibility studies (such as those on sections L and M), which analysed comparatively the quality and shortcomings of many different administrative sources and built some experimental estimation.
Table 6.2 lists the sources identified as the best to be used to cover each section (represented in the rows) and each different institutional sector (in the columns). In order to better understand the table, it is necessary to refer also to Table 5.1, which shows the sections L-O composition by institutional sector. For instance, for S.13 public institutions which carry out their economic activity in section L, there are six different sources: EPD, CAWI, QRCF, QSM,

QSP and QSMC (the meaning of the acronyms and other information on the sources are shown in Prospect 6.1). Table 6.2 - Sources to be used for the LCI construction and their employment coverage by economic activity section and institutional sector
L - Public administration and defence; compulsory social security
EPD (31%)CAWI (21%)QRCF(7.4%)QSM(34%)QSP(4%)
QSMC(0.6%)
(*) - 99
M - Education EPD (87%)CINECA (9%) (*) INPS (87%) 90
N - Health and social work EA/QSNHS (99.0%)INPS (0.6%) INPS (20%) INPS (74%) 85
O - Other community, social and personal service activities
QRCF(43%)INPS (15%) INPS (20%) INPS (67%) 66
Public institutions classified into S.13
Total coverage
Kind of unit
Economic activity section Public institutions not classified into S.13
Enterprises and Non Profit institutions
(*) The public institutions not classified into S.13 represent the lowest share in all sections (respectively 0.1%, 2%, 4.4% and 3.9% of sections L, M, N and O total employment), see Table 5.1
Prospect 6.1 - Additional information on the sources to be used for the LCI construction
Acronym Name Public Administrations managing the sources Implementation time
EA Economical Account Ministry of Health 3 monthsEPD Employees Payrolls Database General Account Department-Ministry of Economy and Finance 1 year and a halfCAWI Collective Agreed Wage Index Istat available
CINECA Interuniversity Consortiumof North Eastern Italy for Automatic Calculation Ministry of Education, University and Research 1 year
INPS OROS-INPS DM10 Database INPS-Istat 6 monthsQRCF Quarterly Report on Cash Flows General Account Department-Ministry of Economy and Finance 6 monthsQSM Quarterly Survey on Municipalities General Account Department-Ministry of Economy and Finance 1 yearQSP Quarterly Survey on Provinces General Account Department-Ministry of Economy and Finance 1 yearQSMC Quarterly Survey on Mountain Communities General Account Department-Ministry of Economy and Finance 1 yearQSNHS Quarterly Survey on National Health Service General Account Department-Ministry of Economy and Finance 1 year

Every source covers a specific group of units and the percentage coverage of each source with respect to the total population of the cell is represented by the figures in brackets. Summing up
the percentages coverage in each cell, it is possible to see the total coverage by section and institutional sector. For example, for section L S.13 public institutions the overall coverage is
99%. In this section, since there are almost no non-S.13 institutions and, by definition, no enterprises nor non profit institutions, the total coverage is also equal to 99%. The total coverage
is very high also for sections M (90%) and N (85%). Only in section O it does not reach 70%. As far as the S.13 public institutions are concerned, the combination of the sources for the
LCI estimation varies according to the different sections. In section L, among the six previously mentioned sources, the EPD is the main one, since
it covers around 30% of this section’s employment. The main advantage of this source is that it separately provides monthly information on fixed wages components, allowances, employer’s social contributions and employee’s social contributions broken down by job position. Furthermore, it also provides the monthly number of payrolls (i.e., the number of employees who have received the salary in each month) which can be used as an approximation of the actual number of employees. However, it does not cover the additional wage components paid on an irregular basis (e.g., overtime expenditures) and no information on hours worked is given. Data are available starting from 1999 and their quality constantly improves with time. The institutions belonging to this section not covered by this source are: some Police Corps units, all the Armed forces units, the Social Security Funds, Regions, Municipalities, Provinces, Mountain Communities and other minor institutions.
The CAWI can be used to cover the first two kinds of institutions, (which account for around 20% of the whole section L employment). However, it totally excludes the personnel with fixed-term contracts of these institutions and it does not provide infra-annual information on employment and on additional wage components paid on an irregular basis.
The QRCF can be used to cover Social Security Funds, Regions and other minor institutions (which account for about 7% of section L employment). Unfortunately, for these institutions it does not provide separate information on total wages and contributions but only on the staff expenditures as a whole. More importantly, it does not collect employment at all.
For Municipalities, Provinces and Mountain Communities the GAD has recently launched three similar quarterly statistical surveys which, for their characteristics, could potentially represent excellent sources for the LCI purposes. The information collected separately provides all the labour cost components (fixed and additional costs, related arrears and social contributions), regards all personnel (open-ended and fixed-term contracts) and also includes employment. Even though hours actually worked are not collected, the information on days of absence, together with that on employment, could help to get their estimation. Unfortunately, the data of these surveys are available, respectively, only starting from 2000, 2003 and 2004.
Regarding section M, the two administrative sources for the public sector (EPD for School and CINECA for University) have an overall good quality but some problems arise for the EPD. Indeed, its data do not cover the short and occasional collaboration teachers of the School area, since the related expenditures are directly managed by each school.
Finally, in sections N and O the EA (for the National Health Service units) and the QRCF (for the Chambers of Commerce) combine with the INPS data. The EA data have the main advantage of being used from the National Accounts, since 2002, as reference indicator in the annual-to-quarterly temporal disaggregation procedure of section N compensations of employees. Therefore, the data flow is well established, timely and punctual. However, it provides aggregate information only on the staff expenditures variable.
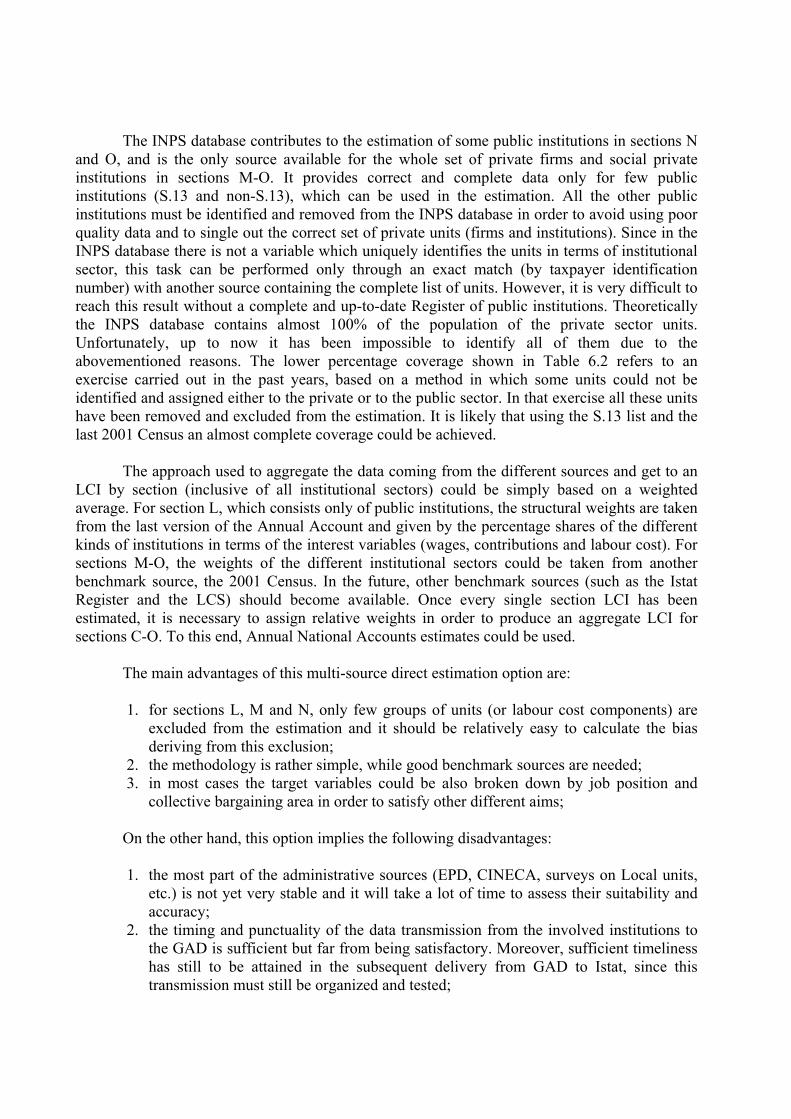
The INPS database contributes to the estimation of some public institutions in sections N and O, and is the only source available for the whole set of private firms and social private institutions in sections M-O. It provides correct and complete data only for few public institutions (S.13 and non-S.13), which can be used in the estimation. All the other public institutions must be identified and removed from the INPS database in order to avoid using poor quality data and to single out the correct set of private units (firms and institutions). Since in the INPS database there is not a variable which uniquely identifies the units in terms of institutional sector, this task can be performed only through an exact match (by taxpayer identification number) with another source containing the complete list of units. However, it is very difficult to reach this result without a complete and up-to-date Register of public institutions. Theoretically the INPS database contains almost 100% of the population of the private sector units. Unfortunately, up to now it has been impossible to identify all of them due to the abovementioned reasons. The lower percentage coverage shown in Table 6.2 refers to an exercise carried out in the past years, based on a method in which some units could not be identified and assigned either to the private or to the public sector. In that exercise all these units have been removed and excluded from the estimation. It is likely that using the S.13 list and the last 2001 Census an almost complete coverage could be achieved.
The approach used to aggregate the data coming from the different sources and get to an LCI by section (inclusive of all institutional sectors) could be simply based on a weighted average. For section L, which consists only of public institutions, the structural weights are taken from the last version of the Annual Account and given by the percentage shares of the different kinds of institutions in terms of the interest variables (wages, contributions and labour cost). For sections M-O, the weights of the different institutional sectors could be taken from another benchmark source, the 2001 Census. In the future, other benchmark sources (such as the Istat Register and the LCS) should become available. Once every single section LCI has been estimated, it is necessary to assign relative weights in order to produce an aggregate LCI for sections C-O. To this end, Annual National Accounts estimates could be used.
The main advantages of this multi-source direct estimation option are: 1. for sections L, M and N, only few groups of units (or labour cost components) are
excluded from the estimation and it should be relatively easy to calculate the bias deriving from this exclusion;
2. the methodology is rather simple, while good benchmark sources are needed; 3. in most cases the target variables could be also broken down by job position and
collective bargaining area in order to satisfy other different aims; On the other hand, this option implies the following disadvantages: 1. the most part of the administrative sources (EPD, CINECA, surveys on Local units,
etc.) is not yet very stable and it will take a lot of time to assess their suitability and accuracy;
2. the timing and punctuality of the data transmission from the involved institutions to the GAD is sufficient but far from being satisfactory. Moreover, sufficient timeliness has still to be attained in the subsequent delivery from GAD to Istat, since this transmission must still be organized and tested;

3. the use of administrative data implies a weaker control on the data production process by Istat;
4. back data are not available; 5. data on hours worked are not available.
The latest problem arises from a general shortage of quarterly data and, at the moment,
can be solved only recurring to a separate indirect estimation procedure. This means that the multi-source option may estimate directly only the numerator of the hourly LCI. This is the reason why the problem of estimating the hours worked deserves a separate analysis. The only possible approach is to use the procedure currently experimented to estimate hours worked for C-K sections LCI. This consists in two steps: first, per capita hours worked are indirectly estimated through a “benchmarking technique”. Second, per capita hours worked are multiplied by the number of job positions in order to obtain an amount of hours worked referred to the number of job positions taken into account in the numerator (that is the overall amount of labour cost). For almost all the abovementioned administrative sources the number of employees is available.
The “benchmarking technique” is an annual-to-quarterly temporal disaggregation, which is based on short term reference indicators and uses the Fernandez method. The annual per capita National Accounts estimations (total hours worked divided by total jobs positions) for sections L-O updated to 2003 can be used as benchmark. The quarterly per capita hours worked from the new Continuous Labour Force Survey (LFS) can be used as reference indicators. These estimations substitute the previous ones deriving from the old LFS data, which had many shortcomings and presented a biased seasonality. The new series of hours worked are available from the first quarter of 2004, while backward estimates up to the first quarter 1993 should become soon available. This could allow setting up more quickly the hours worked estimation procedure.
6.3.2. A statistical estimation procedure based on “ improved” quarterly National Accounts
A quarterly LCI with good accuracy and timeliness could be obtained using the quarterly National Accounts estimations of total wages and compensations of employees as a starting point. These data could be firstly “improved” and secondly “adapted”, when necessary, to the target of producing the LCI.
In the following, we shortly describe first the basic methodology used for the quarterly National Accounts, the improvements which can be made to the reference indicators and, finally, the adjustments necessary to adapt the data to the LCI.
At the moment, the EU Regulations require the production and delivery of quarterly National Accounts aggregates for the two abovementioned variables only for six economic branches of activity (A6). One of them is given by the “other service activities” aggregate (L to Q NACE sections). In the last years, Istat has been experimenting separate estimations for the four sections L, M, N and O, which compose the largest part of the aggregate. The methodology is based on the temporal disaggregation of National Accounts annual data, broken down at quarterly level using short term reference indicators: the disaggregation is performed using the Chow-Lin method in the Italian version of Barbone, Bodo and Visco (1981)17.
17 The methodology has been described in detail in the previous Reports on sections L and M.

While the basic methodology is very sound and does not need any change to improve the accuracy of the estimates, it seems appropriate to use new, better and much more disaggregated data as reference indicators.
The indicators currently used in the quarterly National Accounts benchmarking procedure are shown in Prospect 6.2.
Prospect 6.2 - Reference indicators used in the National Accounts benchmarking methodology and possible improvements
Currently used reference indicators Possible improved reference indicators
Section Public sector Private sector (firms
and institutions) Public sector Private sector
(firms and institutions)
L
EPD-wages (for State as a whole) QRCF-compensations (excluding Health units)
-
EPD-wages (State excluding School) EPD-compensations (State excluding School) QSM-wages (for Municipalities) QSM-compensations (for Municipalities) QSP-wages (for Provinces) QSP-compensations (for Provinces) QSMC-wages (for Mountain Communities) QSMC-compensations (for Mountain Communities)
-
M
EPD-wages (for State as a whole) QRCF-compensations (for Local government excluding Health units)
None
EPD-wages (only School) EPD-compensations (only School) CINECA-wages (Universities) CINECA-compensations (Universities)
INPS-wages INPS-labour cost
N
EA-compensations (National Health Service )
CAWI (applied only to firms)
QSNHS-wages (National Health Service ) QSNHS-compensations (National Health Service )
INPS-wages INPS-labour cost
O
EPD-wages (for State as a whole) QRCF-compensations (excluding Health units)
CAWI (applied only to firms)
QRCF-compensations (for Chambers of Commerce) INPS-wages (for the other institutions) INPS-labour cost (for the other institutions)
INPS-wages INPS-labour cost
The approach used at present implies that, for the three sections L, M and O, the
reference indicators are exactly the same and are based on the EPD wages (for the State as a whole) and the QRCF compensations of employees (for the Local government excluding Health units). Therefore, the infra-annual indicators used do not correctly reflect the short-term wage evolution of the institutions classified into each economic section. For example, considering section M, the infra-annual indicators reflect the wage evolution not only of School and Universities, which are the institutions mainly involved in this section, but also of other institutions (all the other units of the State and Regions, Municipalities and Provinces), whose main economic activities are not classified in section M. The same holds for section L, where the reference indicators reflect also the infra-annual movement of School and Universities.
For section N, only the wage evolution of the Local Health units and Hospitals (which mainly belong to this section) is taken into account as reference indicator.
Many problems also arise in the breakdown of the estimates by institutional sector (public and private) within each section. In section M the infra-annual movement of the final estimates only reflects that of the public sector, since the evolution of the public units (EPD and QRCF indicators) is extended to all units (public and private institutions and firms). However, the level

of the estimates takes into account both the private and the public sector, thanks to the presence of annual constraints (the National Accounts estimates). In sections N and O the evolution of the public sector is attributed also to private institutions, whereas for the firms a separate wage indicator is given by the CAWI.
Many innovations and improvements in the indicators can be proposed (see the last two columns of the Prospect).
In section L it could be possible to use for both variables only the EPD data excluding School. Furthermore, the QRCF data on Municipalities, Provinces and Mountain Communities could be effectively replaced by the new GAD quarterly surveys (QSM, QSP, QSMC).
In section M, we may adopt reference indicators based only on the EPD data for School and CINECA data for University. Moreover, a separate reference indicator for the private sector of section M could be based on INPS data.
For sections N and O private sectors, the CAWI could be replaced by a better indicator based on the INPS data, whose evolution can also be extended to the private institutions (which at the moment are considered as public institutions). In terms of variables, a significant improvement involves the contributions, whose estimates could be based on the actual other labour cost instead of the legal rate. As far as the public sectors are concerned, the QSNHS could replace the EA in section N, whereas in section O the QRCF data could be combined with the INPS ones, in order to obtain more proper indicators.
After improving the National Accounts reference indicators some final adjustments could
be needed to improve the coherence in the recording criteria of the different sources. Indeed, the EPD, the CINECA, and the INPS sources follow a cash criterion, while the QSNHS an accrual one.
No problems should arise for the different definition between compensation of employees (which is the National Accounts interest variable) and labour cost, since the former are the best available approximation of the latter. The total labour cost, as stated in the Regulation, should also include the vocational training cost paid by the employer and other expenditures (recruitment costs and working clothes provided by the employer), but these components are negligible and no infra-annual data are available.
To summarize, a realistic approach could consist in using the National Accounts
estimation method as it is (the BBV annual-to-quarterly temporal disaggregation procedure), in developing the phase of construction of new and better infra-annual indicators, and in using the new resulting estimates as a starting point for the LCI construction. Even though the National Accounts estimates would be “improved”, they would still consist in quarterly amounts instead of hourly indicators. On the other hand, full-time equivalent unit estimates are available.
The main advantages of “improved” quarterly National Accounts option are: 1. it is based on a sound and well-established methodology; 2. the transmission of the basic data, currently used as reference indicators, is timely
and punctual; 3. the implementation could be gradual, introducing the new reference indicators step
by step; 4. back data are available or, in most of cases, they could be estimated.

On the other hand, the only disadvantage is that the estimates are available only at the section level, without any further breakdown. However, in order to solve this problem with the aim of obtaining separate estimates for the public and the private sectors of sections M-O, it could be possible to use the new sources presently under investigation.

7. CONCLUDING REMARKS
This report includes the feasibility study on the public sector of sections N and O and the final feasibility study for the construction of complete LCI indices covering the public and private sectors of sections L-O.
As far as the study on the public sectors of sections N and O is concerned, we have explored the administrative sources currently available (the Economical Account, the Quarterly Report on Cash Flows and the INPS database), evaluating their quality. Although the comparison with the benchmark source showed that the accuracy of some of these sources is not yet satisfactory and sufficient timeliness in data transmission is still far from being attained, we tried to use them for the production of experimental aggregate estimates of quarterly per capita compensations of employees. We have also followed the development of another non-administrative source for section N (the Quarterly Survey on National Health Service), which meets the LCI requirements but is still in the early stages.
This feasibility study, together with those previously carried out on sections L and M, has contributed to identify and analyse all the infra-annual sources usable for the LCI purposes. This represents an important added value, given the Italian structural lack of information on labour cost and wages in the sections under examination. The Annual Account, collected and released by the GAD of the Ministry of Economy and Finance and used as a benchmark in our studies, is the only structural source covering the public sectors of sections L-O.
Furthermore, we have started a fruitful collaboration with the institutions managing these sources (mainly the GAD offices). This cooperation represents a priority to which Istat has committed itself in the last two years. Its goals are to improve the data quality and speed up the data transmission, making Istat an active partner in data production. The cooperation has already given some promising results, but it will take up time to achieve a full and consolidated integration, due to different institutional missions and approaches.
Finally, another important result of these studies consists in achieving a more detailed knowledge of the National Accounts quarterly estimation method for sections L-O and of the sources used.
Thus, thanks to the results of these feasibility studies, we are able to formulate two possible scenarios for the construction of complete LCI indices covering sections L-O.
In the medium term (no sooner than a year and a half), a statistical estimation based on “improved” quarterly National Accounts represents the only feasible option. In this scenario, the National Accounts annual-to-quarterly temporal disaggregation procedure is used as it is, while the currently used reference indicators are replaced by better and more appropriate ones, taken from the new sources analysed in these studies.
In the medium term it is also possible to carry out a quarterly estimate on hours actually worked. We plan to use an annual-to-quarterly temporal disaggregation procedure, where the annual benchmark will be given by the National Accounts annual estimates and the reference indicators will be drawn from the Continuous Labour Force Survey data.
In a long run perspective (at least two-three years), a multi-source direct estimation could fully exploit the new sources to directly produce quarterly LCI estimates and not only reference indicators. It should also be possible to exploit all the information available, even broken down by job position and collective bargaining area, so to satisfy also other needs of information. In this scenario the hours worked could be indirectly obtained in the same way as in the previous one.

The options proposed are not mutually exclusive but partially overlap. The full realization of a safe and timely capture of all new sources and the indirect estimation of the hours worked are intermediate steps to be developed in both options.
The operative proposal emerging from the feasibility studies consists in launching a close collaboration with the National Accounts department in order to implement the medium term option. However, the feasibility of a regular LCI production in sections L to O crucially depends on the priority that will be assigned to this project in the allocation of human resources.

REFERENCES
Antolini F., Casanova R., Stoppiello S., “Istituzioni delle Amministrazioni Pubbliche - Anni 1991-1996”, ISTAT, Rome.
Baldassarini A., Birardi D., (2006), “I conti economici trimestrali: un approccio alla stima
dell’input di lavoro”, Contributi ISTAT, 2006, in press. Baldassarini A., Riccioni S., (2000), “La ricostruzione delle stime trimestrali
dell’occupazione e dei redditi da lavoro dipendente”, proceedings of the Workshop “La Nuova Contabilità Nazionale”, ISTAT, Rome, January 2000.
Barbone, L., Bodo, G., Visco, I. (1981), “Costi e profitti nell’industria in senso stretto:
un’analisi su serie trimestrali, 1970-1980”, Bollettino della Banca d’Italia, 36, 465-510 Bellisai D., Falorsi P.D., Lucarelli A., Pennucci M.A., Tronti L.G., (2004), “Indagine
pilota sulle retribuzioni di fatto nel pubblico impiego”, Contributi Istat, n.22/2004, Rome.
Chow, G. C., Lin, A. L. (1971), “Best Linear Unbiased Interpolation, Distribution, and Extrapolation of Time Series by Related Series”, The Review of Economics and Statistics, 53, 372-375
Collesi D., (2002), “La spesa pubblica per funzioni: il quadro metodologico ed alcuni
risultati”, taken from the document ISCONA “Finanza pubblica e Contabilità Nazionale”, by Malizia R., Rome, November 2002.
Di Fonzo T., (1987), "La stima indiretta di serie economiche trimestrali", Padua. Italian Official Gazette - Serie generale - n. 132, 1997, “Legge 5 agosto 1978, n. 468, art.
30. Circolare esplicativa per la compilazione del prospetto contenente gli elementi revisionali e i dati periodici della gestione di cassa delle Università”.
INPDAP (2004),“I Trattamenti pensionistici INPDAP, Capitolo 5”, taken from the
document “Rapporto annuale sullo stato sociale 2003”, Rome. INPDAP (2004), http://www.inpdap.it/ ISTAT (2005), “Quarterly labour cost index in public education”. Report to Eurostat
contract no 200332200003, October 2005 ISTAT (2005b), “Tecniche di disaggregazione temporale per i conti economici
trimestrali: avanzamenti metodologici e prospettive future”, proceedings of the Workshop Rome, November, 2005.
ISTAT (2003), “Twips Pilot Survey On Total Wages In The Public Sector”. Report to
Eurostat contract no 200144401005, July 2003

ISTAT (2003b), “Implementation of Labour Cost Index: Report N° 3, Estimating the European Labour Cost Index for sectors M, N, O.” Report to Eurostat contract n 200132200008.
ISTAT, (2001-2002), “Statistiche delle Amministrazioni Pubbliche”, ISTAT yearbook,
Rome, 2005. ISTAT (2002), “ATECO 2002 derived from NACE Rev. 1.1.”, ISTAT, Rome, 2002
(www.istat.it). ISTAT, (2000), “Statistiche delle Amministrazioni Pubbliche”, ISTAT yearbook, Rome,
2003. Mattonetti M. L., (2000), “La ricostruzione delle stime trimestrali della attività delle
Amministrazioni Pubbliche”, proceedings of the Workshop “La Nuova Contabilità Nazionale”, ISTAT, Rome, January 2000.
Ministry of Finance and Economic Affairs – General Accounts Department, (2002),
“Annual Account”, Rome, December 2003 (www.tesoro.it). Ministry of Finance and Economic Affairs – General Accounts Department, (2002),
“Annual Account”, Rome, December 2004 (www.tesoro.it). Ministry of Finance and Economic Affairs – General Accounts Department, (2003),
“Annual Account”, Rome, December 2005 (www.tesoro.it). Ministry of Finance and Economic Affairs, (2004), “Relazione sulla stima del fabbisogno
di cassa e situazione di cassa per l’anno 2004 e situazione di cassa al 31 marzo 2004”, Rome. Ministry of Finance and Economic Affairs, (2005), “Relazione sulla stima del fabbisogno
di cassa per l'anno 2005 e situazione di cassa al 31 dicembre 2004 (29/4/2005)”, Rome. Ministry of Finance and Economic Affairs – General Accounts Department, (2005),
“Circolare n. 9 del 4 marzo 2005. Rilevazioni previste dal titolo V del decreto legislativo 30 marzo 2001, n. 165 – Il conto annuale e la relazione allegata sulla gestione Anno 2004 – Il monitoraggio della spesa del personale Anno 2005” Rome, 2005.
Picozzi L., (2000), “La nuova contabilità nazionale italiana: i risultati della revisione”,
proceedings of the Workshop “La Nuova Contabilità Nazionale”, ISTAT, Rome, January 2000. Savio G., (2000), “Principali fattori innovativi e sviluppi futuri della contabilità nazionale
trimestrale in Italia”, proceedings of the Workshop “La Nuova Contabilità Nazionale”, ISTAT, Rome, January 2000.