it capability maturity framework introduction to it-cmf ......it capability maturity framework...
TRANSCRIPT

IT Capability Maturity Framework
Introduction to IT-CMF
Financial Critical Capabilities (CCs)
©2012 David Consulting Group
Michael Harris
President & CEO
Tier 2 Accredited IT-CMF Associate
David Consulting Group
ITFMA April 2012
©2011 David Consulting Group
Executive Summary
• IT-CMF is a powerful new tool which we
recommend
• It focuses on the business value of IT
• It allows users to understand how their IT
organization is performing
• Aims to move IT from a business necessity to a
business changer
©2011 David Consulting Group
The Business Value of IT
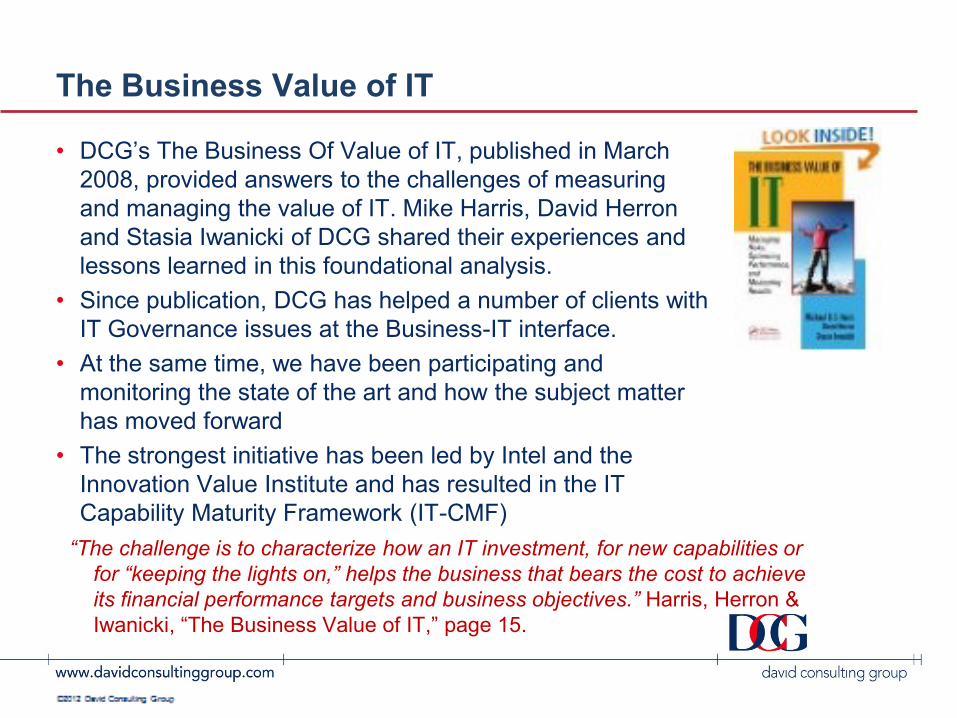
• DCG’s The Business Of Value of IT, published in March
2008, provided answers to the challenges of measuring
and managing the value of IT. Mike Harris, David Herron
and Stasia Iwanicki of DCG shared their experiences and
lessons learned in this foundational analysis.
• Since publication, DCG has helped a number of clients with
IT Governance issues at the Business-IT interface.
• At the same time, we have been participating and
monitoring the state of the art and how the subject matter
has moved forward
• The strongest initiative has been led by Intel and the
Innovation Value Institute and has resulted in the IT
Capability Maturity Framework (IT-CMF)
“The challenge is to characterize how an IT investment, for new capabilities or
for “keeping the lights on,” helps the business that bears the cost to achieve
its financial performance targets and business objectives.” Harris, Herron &
Iwanicki, “The Business Value of IT,” page 15.
©2011 David Consulting Group
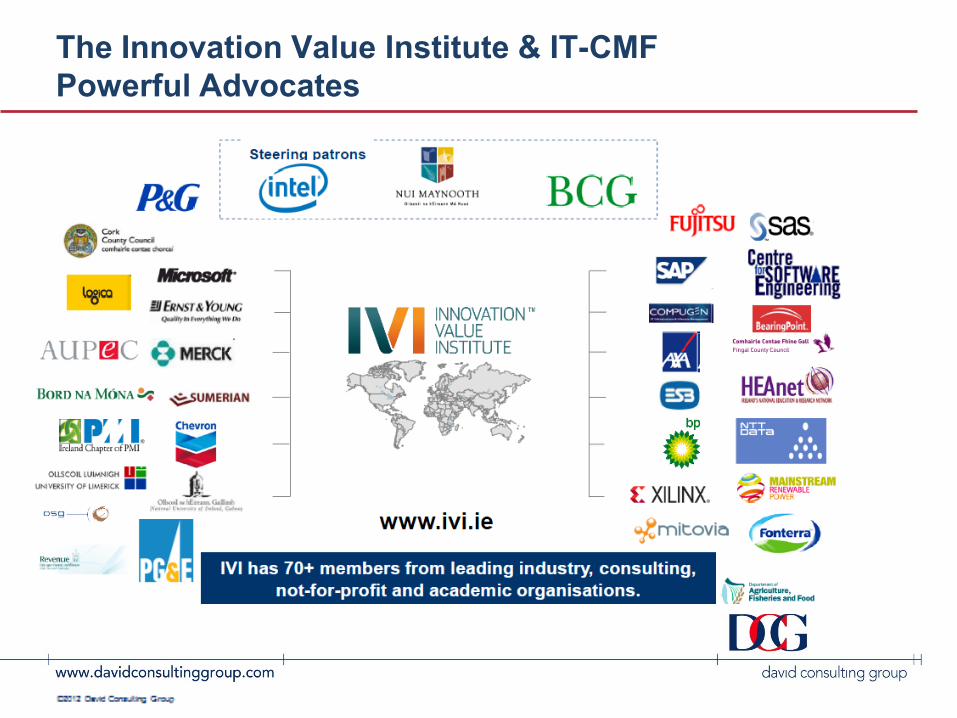
The Innovation Value Institute & IT-CMF
Powerful Advocates

©2011 David Consulting Group
Why another framework?
In short, the other frameworks have strengths (DCG is an SEI Partner for
CMMI) but identifying and enhancing business value is not one of them
Source:
©2011 David Consulting Group
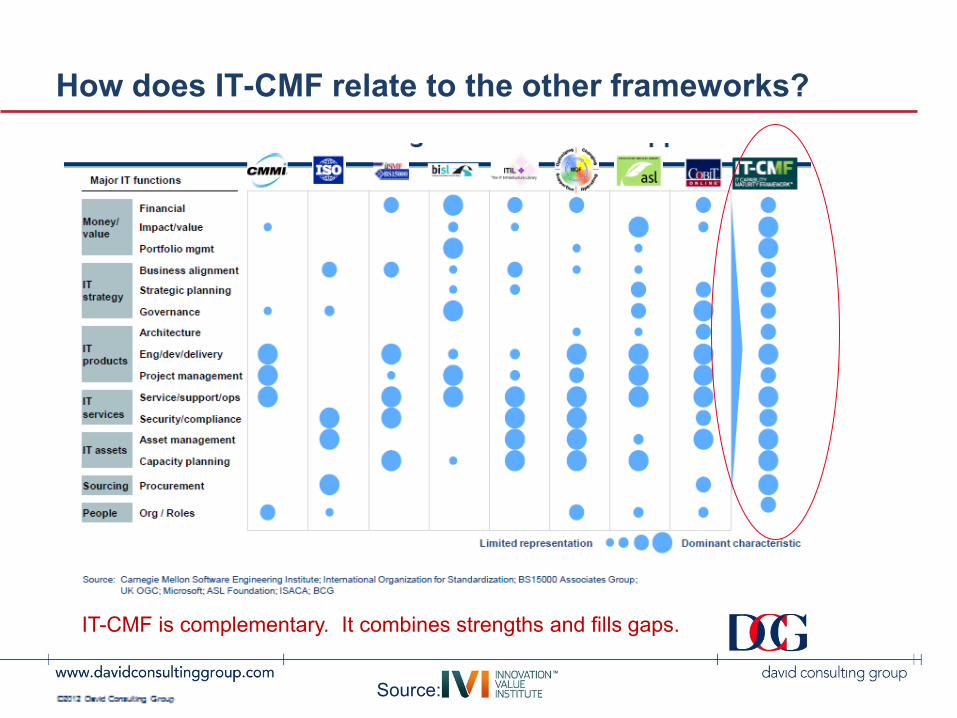
How does IT-CMF relate to the other frameworks?
IT-CMF is complementary. It combines strengths and fills gaps.
Source:
©2011 David Consulting Group
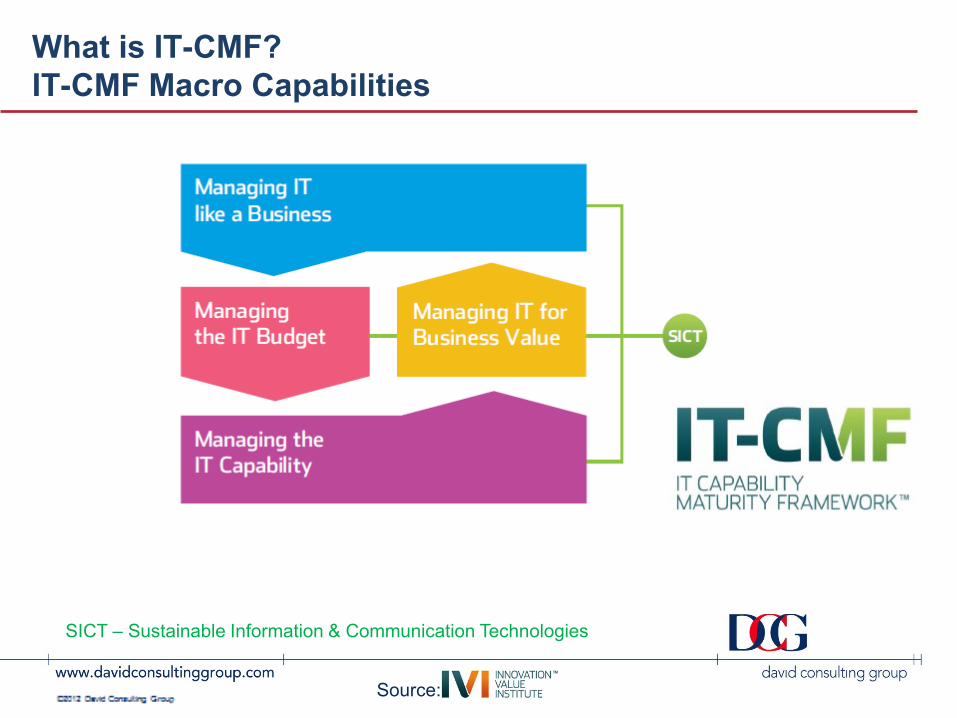
What is IT-CMF?
IT-CMF Macro Capabilities
SICT – Sustainable Information & Communication Technologies
Source:
©2011 David Consulting Group
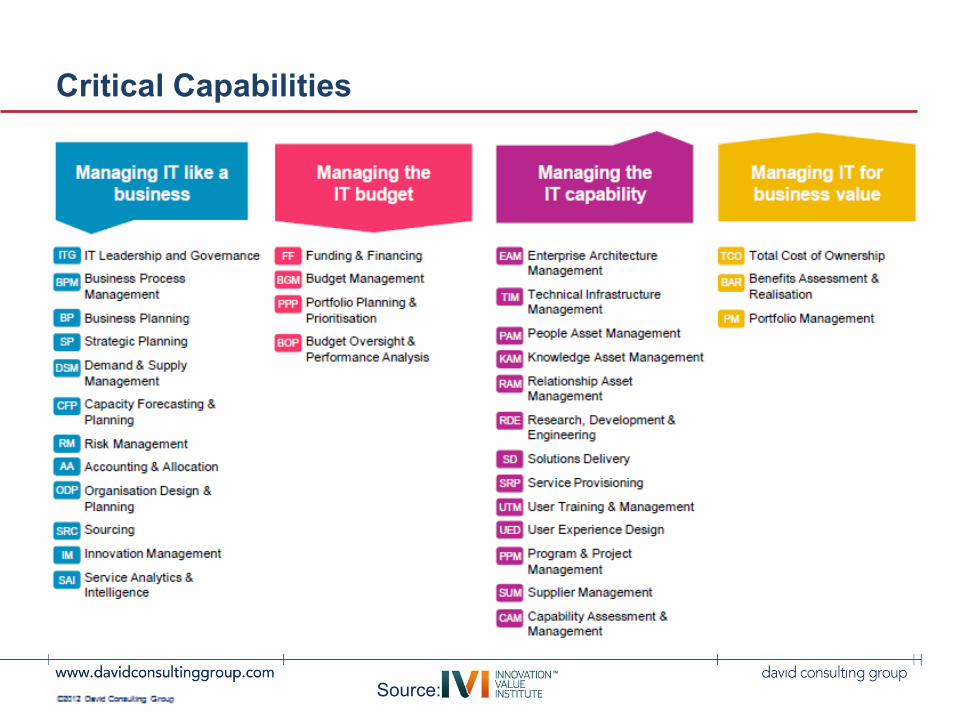
Critical Capabilities
Source:

©2011 David Consulting Group
IT-CMF – A journey (not a certificate) of small steps
Source:

©2011 David Consulting Group
Typical Output of an Executive Assessment
Source:
This is only one view many more are available from the IVI toolset
©2011 David Consulting Group
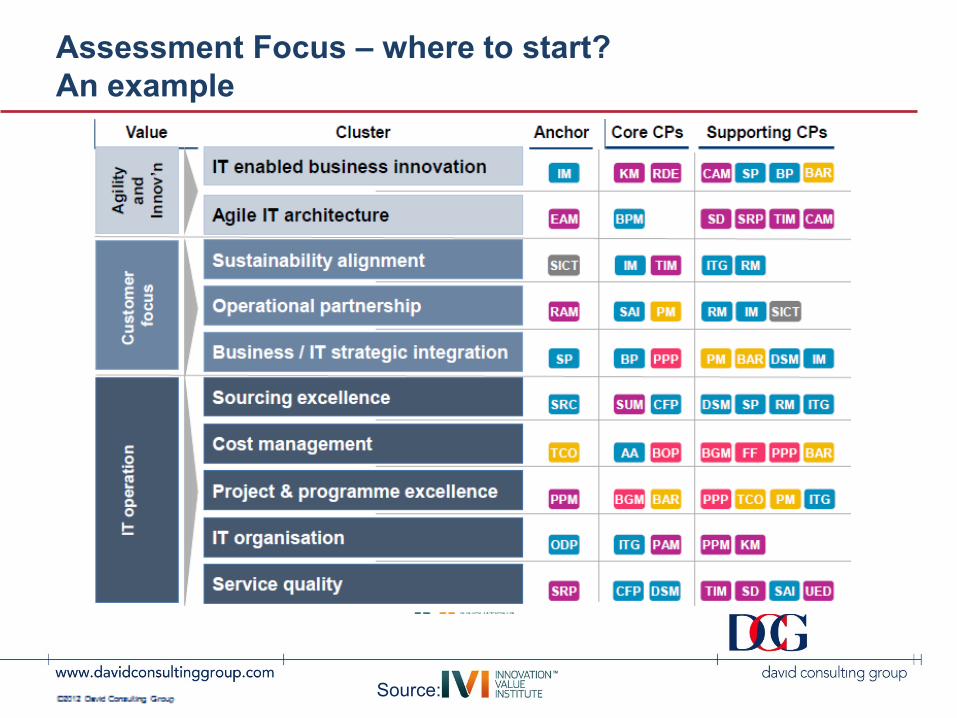
Assessment Focus – where to start?
An example
Source:

©2011 David Consulting Group
IT-CMF Maturity Levels
Maturity
Levels
Managing IT
like a
Business
Managing the
IT Budget
Managing the
IT Capability
Managing IT
for Business
Value
Initial Unmanaged Unmanaged Unmanaged Unmanaged
Basic Cost center Predictable
Performance
Technology
Supplier
Total cost of
ownership
Intermediate Service center Systemic cost
reduction
Technology
Expert
ROI and
business case
Advanced Investment
center
Expanded
funding
options
Strategic
business
partner
Options &
portfolio
management
Optimizing Value Center Budget
amplification
Corporate
core
competency
Optimized
value
Source:

©2011 David Consulting Group
Managing the IT Budget
Maturity Indicators
Source:
“… the IT budgets of
some organizations
are a complete
mystery to the
businesses that pay
for them and may
not be delivering
commensurate
value.” Harris,
Herron & Iwanicki,
“The Business Value
of IT,” page 15.

©2011 David Consulting Group
Critical Capabilities – Financial
Source:

©2011 David Consulting Group
Overview of Funding & Budgeting Process Flow
Strategic
Planning
Business
Planning
Funding
level
Funding &
Financing
Portfolio Planning
& Prioritisation
Target spending
by portfolio
Budget
Management
TCO
Accounting &
Allocation
Budget Oversight
& Performance
Analysis
Capacity
Forecasting And
Planning
Capex/Opex
budget
Performance
vs. budget
Planned spend
by Portfolio
Cost accounting model
Charge back model
Variance analysis
IT intensity vs. Benchmark
Funding and Budgeting CC
Other CC
Variance analysis
IT Leadership &
Governance
Financing
guidelines
Cost Data and budget
refinements
Updates
Cost information
Note: Simplified picture, additional dependencies exists
After budget cycle During budget cycle Before budget cycle
©2011 David Consulting Group
“Master Deck” for a Critical Capability
• Overview and definitions
• Insights
• Internal and external differentiation
• Maturity profile
• Illustrative examples

©2011 David Consulting Group
Overview of Total Cost of Ownership
Definition Total Cost of Ownership tracks, compares, and controls direct and indirect costs associated with IT assets (infrastructure and systems) in order to maximise value. Accurate understanding of current and future TCO over the full IT asset lifecycle leads to more informed budgeting and portfolio management decisions.
• Cost calculation (Acquisition, Operating,
Control, End of life decision making)
• A normalised approach to IT asset cost
comparison
• IT planning using TCO
• Communicating use and benefit of TCO
• Refinement of IT spending plan (based
on calculated TCO) (BGM)
• Allocation/chargeback of direct and
indirect costs (AA)
What’s in scope What’s out of scope

©2011 David Consulting Group
Category Capability
building block Description
Model &
Tools
Scope Covered
Cost drivers (e.g. direct, indirect) and list of assets (infrastructure components,
enterprise applications, etc) being tracked, as well as the frequency with which
models are refreshed based on actual costs realised. Costs include for example
acquisition, operating, control and end of life decision making costs.
Tools and
Methods
Sophistication
Sophistication of tools used to track TCO and coordination capabilities with finance
department systems
Reliability
The reliability with which TCO is able to be tracked, and the costs for differing IT
assets compared, over the entire lifecycle within an organisation. Most reliable
would include optimal set of cost drivers per asset class (normalised to enable
comparison), and coverage of full range of assets
Impact
Impact on Cost Use of TCO to set appropriate cost structure to support business objectives
Impact on
Strategic
Planning
Depth and scope of the impact that TCO management has on investment /
retirement decisions, portfolio planning, and evaluation of business cases
Alignment
Communication Communication of TCO to key business, IT, and Finance stakeholders
Business
Alignment
The extent to which key IT and business stakeholders are involved in TCO
decisions and the impact of this involvement on how IT is perceived
Description of categories and underlying capability
building blocks for Total Cost of Ownership
Draft Update at April 2012
©2011 David Consulting Group
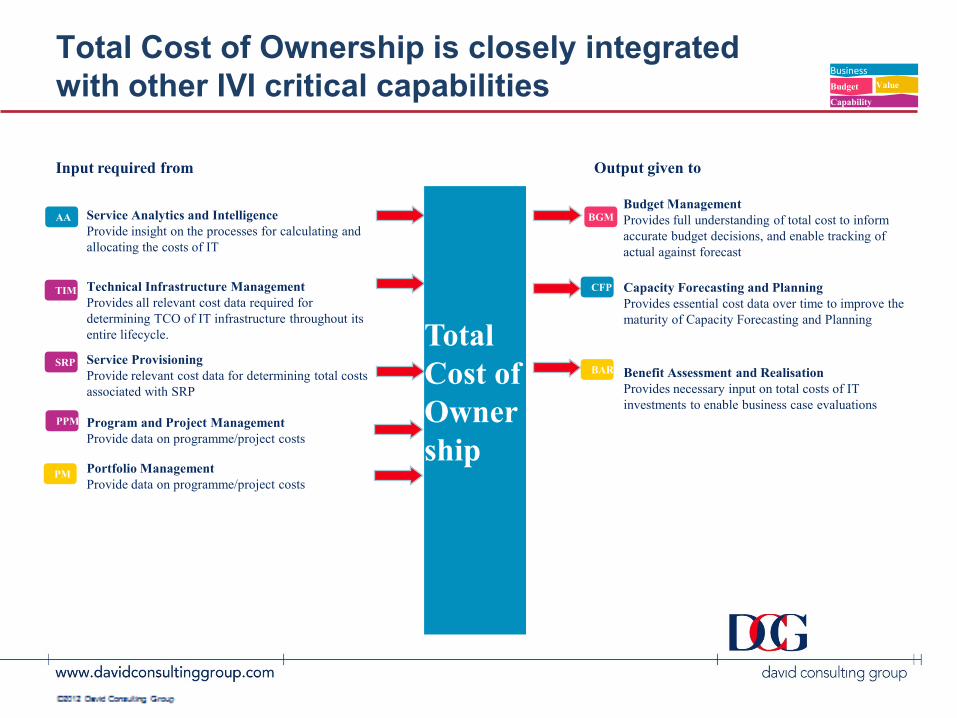
Total Cost of Ownership is closely integrated
with other IVI critical capabilities
Budget Management
Provides full understanding of total cost to inform
accurate budget decisions, and enable tracking of
actual against forecast
Capacity Forecasting and Planning
Provides essential cost data over time to improve the
maturity of Capacity Forecasting and Planning
Service Analytics and Intelligence
Provide insight on the processes for calculating and
allocating the costs of IT
Technical Infrastructure Management
Provides all relevant cost data required for
determining TCO of IT infrastructure throughout its
entire lifecycle.
Output given to Output given to Input required from Input required from
Business
Capability
Budget Value
BGM
TIM
AA
CFP
Total
Cost of
Owner
ship
BAR Benefit Assessment and Realisation
Provides necessary input on total costs of IT
investments to enable business case evaluations
Portfolio Management
Provide data on programme/project costs
Program and Project Management
Provide data on programme/project costs
Service Provisioning
Provide relevant cost data for determining total costs
associated with SRP
SRP
PPM
PM
©2011 David Consulting Group
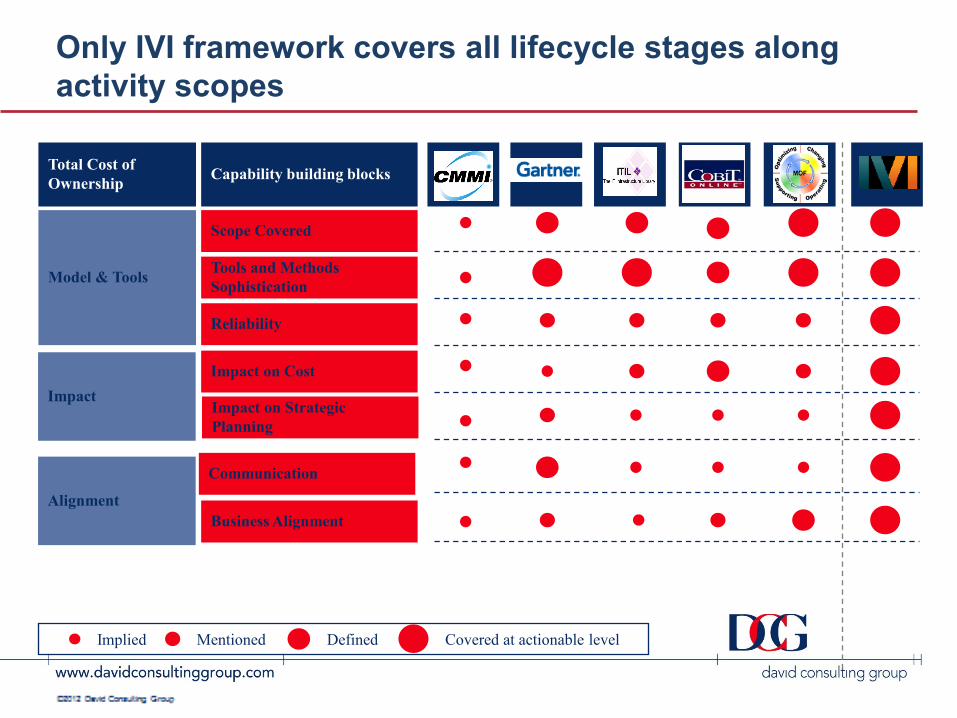
Total Cost of
Ownership
Scope Covered
Tools and Methods
Sophistication
Reliability
Impact on Cost
Impact on Strategic
Planning
Model & Tools
Impact
Capability building blocks
Only IVI framework covers all lifecycle stages along
activity scopes
Add
logo
Add
logo
Add
logo
Add
logo
Implied Covered at actionable level Mentioned Defined
Alignment
Communication
Business Alignment
©2011 David Consulting Group
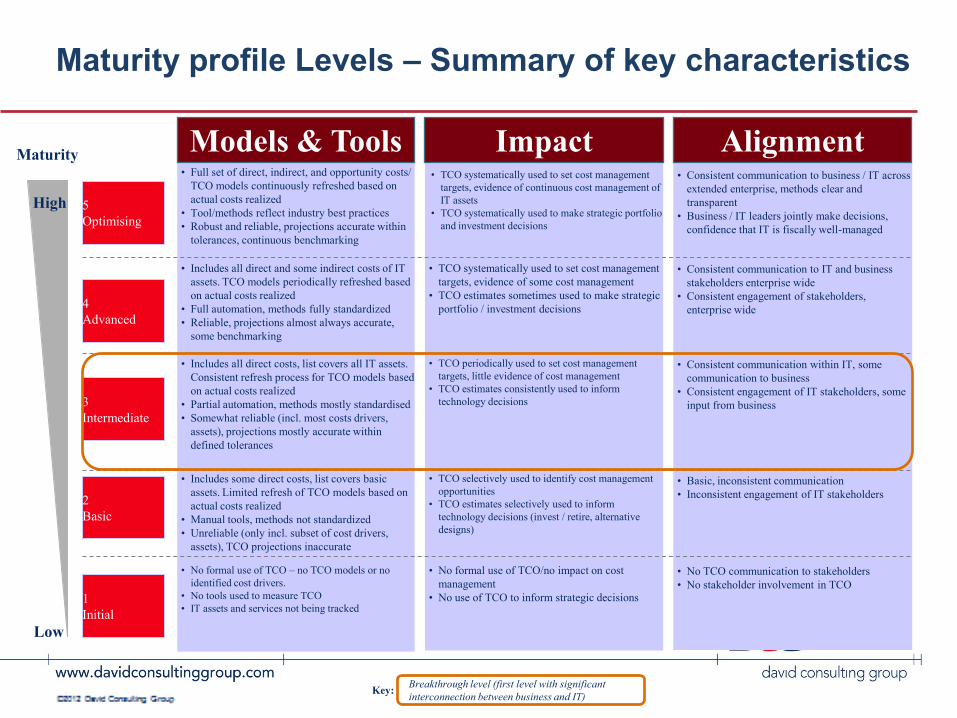
Models & Tools
Impact Alignment
Maturity profile Levels – Summary of key characteristics
• Full set of direct, indirect, and opportunity costs/
TCO models continuously refreshed based on
actual costs realized
• Tool/methods reflect industry best practices
• Robust and reliable, projections accurate within
tolerances, continuous benchmarking
• TCO systematically used to set cost management
targets, evidence of continuous cost management of
IT assets
• TCO systematically used to make strategic portfolio
and investment decisions
• Consistent communication to business / IT across
extended enterprise, methods clear and
transparent
• Business / IT leaders jointly make decisions,
confidence that IT is fiscally well-managed
Breakthrough level (first level with significant
interconnection between business and IT) Key:
Maturity
High
Low
• Includes all direct and some indirect costs of IT
assets. TCO models periodically refreshed based
on actual costs realized
• Full automation, methods fully standardized
• Reliable, projections almost always accurate,
some benchmarking
• TCO systematically used to set cost management
targets, evidence of some cost management
• TCO estimates sometimes used to make strategic
portfolio / investment decisions
• Consistent communication to IT and business
stakeholders enterprise wide
• Consistent engagement of stakeholders,
enterprise wide
• Includes all direct costs, list covers all IT assets.
Consistent refresh process for TCO models based
on actual costs realized
• Partial automation, methods mostly standardised
• Somewhat reliable (incl. most costs drivers,
assets), projections mostly accurate within
defined tolerances
• TCO periodically used to set cost management
targets, little evidence of cost management
• TCO estimates consistently used to inform
technology decisions
• Consistent communication within IT, some
communication to business
• Consistent engagement of IT stakeholders, some
input from business
• Includes some direct costs, list covers basic
assets. Limited refresh of TCO models based on
actual costs realized
• Manual tools, methods not standardized
• Unreliable (only incl. subset of cost drivers,
assets), TCO projections inaccurate
• TCO selectively used to identify cost management
opportunities
• TCO estimates selectively used to inform
technology decisions (invest / retire, alternative
designs)
• Basic, inconsistent communication
• Inconsistent engagement of IT stakeholders
• No formal use of TCO – no TCO models or no
identified cost drivers.
• No tools used to measure TCO
• IT assets and services not being tracked
• No formal use of TCO/no impact on cost
management
• No use of TCO to inform strategic decisions
• No TCO communication to stakeholders
• No stakeholder involvement in TCO
4
Advanced
3
Intermediate
2
Basic
5
Optimising
1
Initial
©2011 David Consulting Group
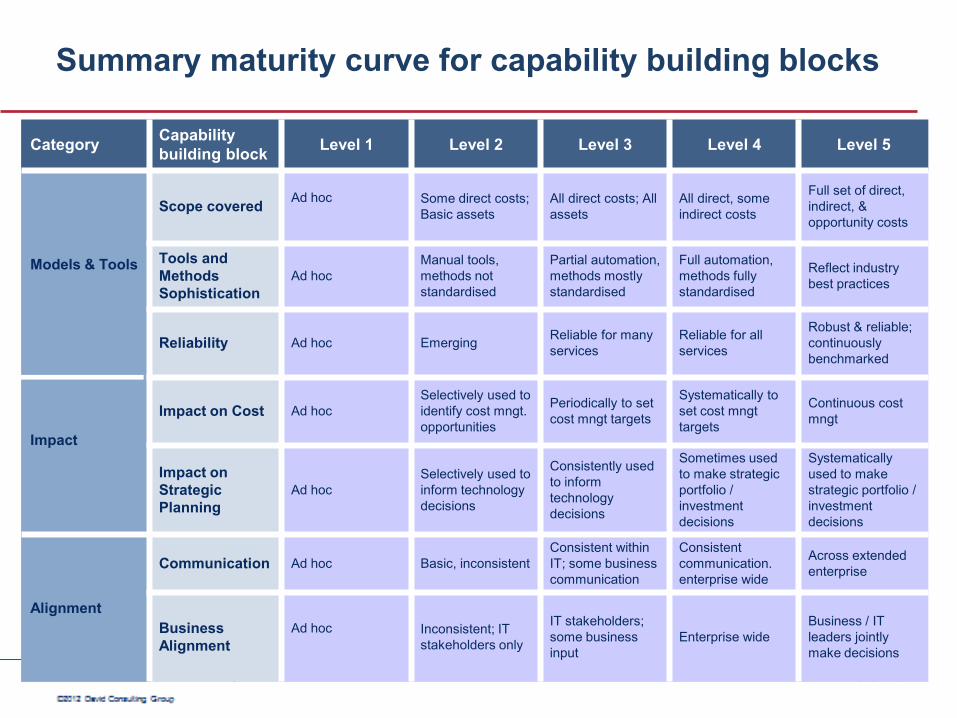
Summary maturity curve for capability building blocks
Category Capability
building block Level 1 Level 2 Level 3 Level 4 Level 5
Models & Tools
Impact
Scope covered Ad hoc
Some direct costs;
Basic assets
All direct costs; All
assets
All direct, some
indirect costs
Full set of direct,
indirect, &
opportunity costs
Tools and
Methods
Sophistication
Ad hoc
Manual tools,
methods not
standardised
Partial automation,
methods mostly
standardised
Full automation,
methods fully
standardised
Reflect industry
best practices
Reliability Ad hoc Emerging Reliable for many
services
Reliable for all
services
Robust & reliable;
continuously
benchmarked
Impact on Cost Ad hoc
Selectively used to
identify cost mngt.
opportunities
Periodically to set
cost mngt targets
Systematically to
set cost mngt
targets
Continuous cost
mngt
Impact on
Strategic
Planning
Ad hoc
Selectively used to
inform technology
decisions
Consistently used
to inform
technology
decisions
Sometimes used
to make strategic
portfolio /
investment
decisions
Systematically
used to make
strategic portfolio /
investment
decisions
Alignment
Communication Ad hoc Basic, inconsistent
Consistent within
IT; some business
communication
Consistent
communication.
enterprise wide
Across extended
enterprise
Business
Alignment
Ad hoc
Inconsistent; IT
stakeholders only
IT stakeholders;
some business
input
Enterprise wide
Business / IT
leaders jointly
make decisions

©2011 David Consulting Group
4
Advanced
3
Intermediate
2
Basic
5
Optimising
1
Initial
Summary of key practices, outcomes, and key metrics
• TCO includes all direct, indirect and opportunity
costs
• Models refreshed continuously based on actual
costs
• Tools and methods standardised and reflect
industry standards
• Business and IT jointly make TCO decisions for
all projects and investments
• TCO sets appropriate cost structures that
optimises overall unit costs
• High degree of confidence that IT is fiscally
well managed
• Systematic usage of TCO to make strategic
investment decisions
• Share (%) of projects that exceed TCO
forecast tolerances
• Rate of cost reduction % by project and area
• TCO includes all direct costs, some indirect
costs and all assets
• TCO Models refreshed consistently
• TCO tools and methods standardised
• Communicate benefits enterprise wide
• Projected TCO accurate within defined
tolerances and benchmarked against industry
standards
• TCO shows cost reduction over time
• Improved engagement of stakeholders
enterprise wide
• % of direct and indirect cost coverage
• % cost reduction per year by project
• Frequency of TCO model review
• Historical tracking of TCO projections vs.
actual
• TCO calculated for selected projects
• TCO covers most direct costs and basic assets
• Models seldom updated based on actual costs
• Tools and methods not standardised
• TCO selectively used in investment decisions
• TCO tracking reliability improved
• TCO projections are sometimes inaccurate
• % of projects which use TCO
• % direct costs tracked
• % of projects which exceed TCO
projections
• No formal use of TCO
• No expected formal outcomes • No metrics
Maturity
High
Low
Key metrics Key metrics Key practices Key practices Outcome Outcome
• TCO consistently used for investment
decisions
• Projected TCO usually accurate within
defined tolerances
• TCO used for cost reduction targets but no
evidence of historical trends
• Improved engagement of IT and some
business stakeholders
• TCO calculated for all projects
• TCO covers all direct costs and all IT assets
• Models periodically refreshed based on actual
costs
• Partially automated TCO tools
• Communicate TCO to IT and some business
stakeholders
©2011 David Consulting Group
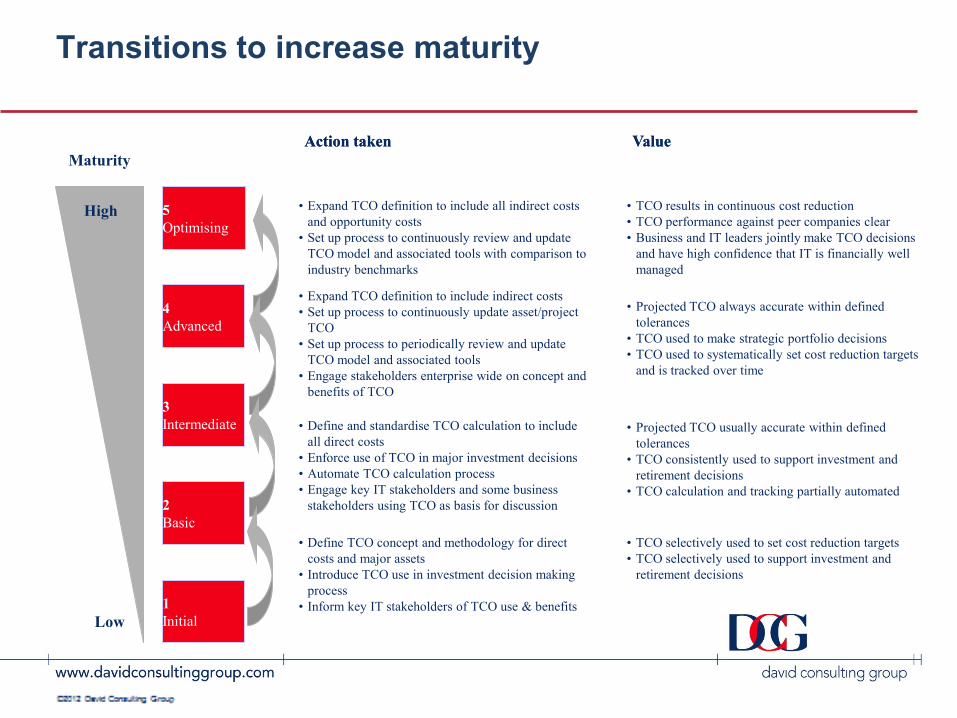
Transitions to increase maturity
• Expand TCO definition to include all indirect costs
and opportunity costs
• Set up process to continuously review and update
TCO model and associated tools with comparison to
industry benchmarks
• TCO results in continuous cost reduction
• TCO performance against peer companies clear
• Business and IT leaders jointly make TCO decisions
and have high confidence that IT is financially well
managed
• Expand TCO definition to include indirect costs
• Set up process to continuously update asset/project
TCO
• Set up process to periodically review and update
TCO model and associated tools
• Engage stakeholders enterprise wide on concept and
benefits of TCO
• Projected TCO always accurate within defined
tolerances
• TCO used to make strategic portfolio decisions
• TCO used to systematically set cost reduction targets
and is tracked over time
• Define and standardise TCO calculation to include
all direct costs
• Enforce use of TCO in major investment decisions
• Automate TCO calculation process
• Engage key IT stakeholders and some business
stakeholders using TCO as basis for discussion
• Projected TCO usually accurate within defined
tolerances
• TCO consistently used to support investment and
retirement decisions
• TCO calculation and tracking partially automated
• Define TCO concept and methodology for direct
costs and major assets
• Introduce TCO use in investment decision making
process
• Inform key IT stakeholders of TCO use & benefits
• TCO selectively used to set cost reduction targets
• TCO selectively used to support investment and
retirement decisions
Maturity
High
Low
Action taken Action taken Value Value
4
Advanced
3
Intermediate
2
Basic
5
Optimising
1
Initial
©2011 David Consulting Group
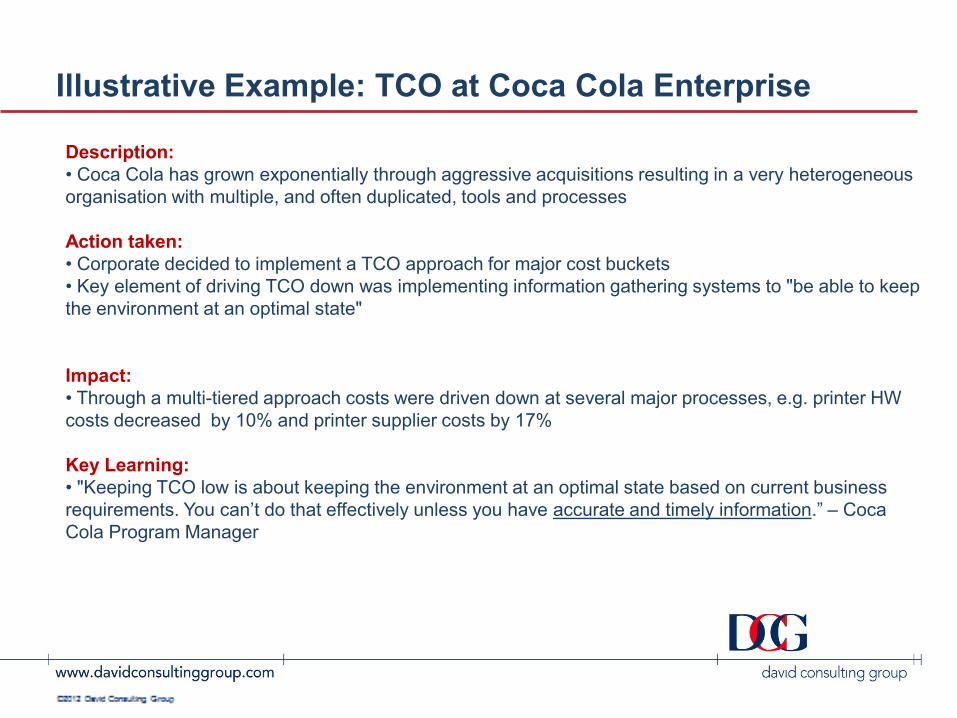
Illustrative Example: TCO at Coca Cola Enterprise
Description:
• Coca Cola has grown exponentially through aggressive acquisitions resulting in a very heterogeneous
organisation with multiple, and often duplicated, tools and processes
Action taken:
• Corporate decided to implement a TCO approach for major cost buckets
• Key element of driving TCO down was implementing information gathering systems to "be able to keep
the environment at an optimal state"
Impact:
• Through a multi-tiered approach costs were driven down at several major processes, e.g. printer HW
costs decreased by 10% and printer supplier costs by 17%
Key Learning:
• "Keeping TCO low is about keeping the environment at an optimal state based on current business
requirements. You can’t do that effectively unless you have accurate and timely information.” – Coca
Cola Program Manager
©2011 David Consulting Group
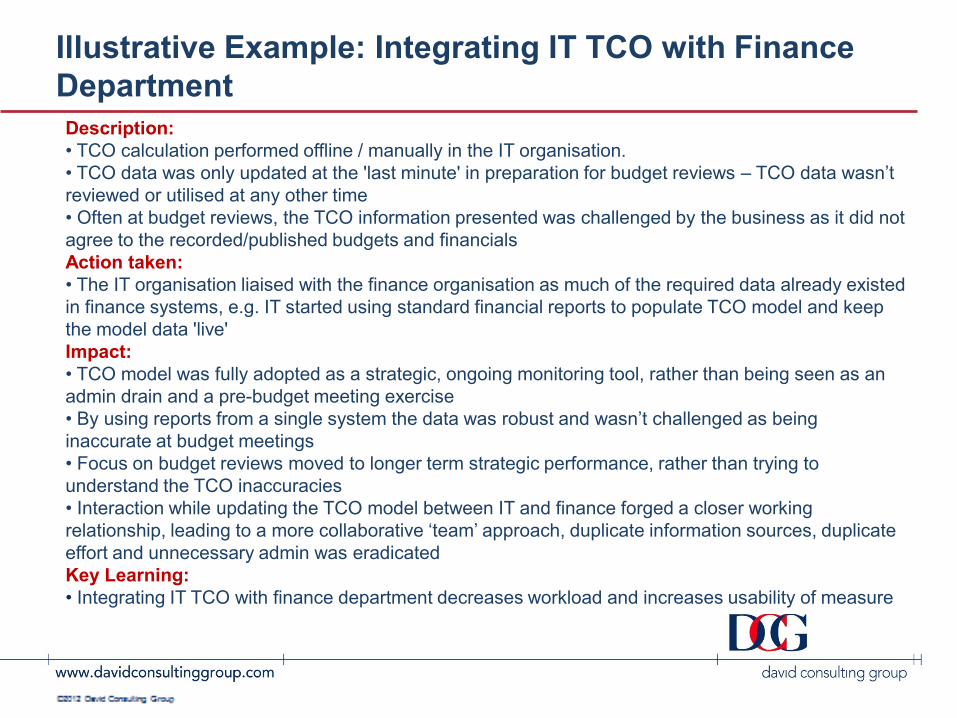
Illustrative Example: Integrating IT TCO with Finance
Department
Description:
• TCO calculation performed offline / manually in the IT organisation.
• TCO data was only updated at the 'last minute' in preparation for budget reviews – TCO data wasn’t
reviewed or utilised at any other time
• Often at budget reviews, the TCO information presented was challenged by the business as it did not
agree to the recorded/published budgets and financials
Action taken:
• The IT organisation liaised with the finance organisation as much of the required data already existed
in finance systems, e.g. IT started using standard financial reports to populate TCO model and keep
the model data 'live'
Impact:
• TCO model was fully adopted as a strategic, ongoing monitoring tool, rather than being seen as an
admin drain and a pre-budget meeting exercise
• By using reports from a single system the data was robust and wasn’t challenged as being
inaccurate at budget meetings
• Focus on budget reviews moved to longer term strategic performance, rather than trying to
understand the TCO inaccuracies
• Interaction while updating the TCO model between IT and finance forged a closer working
relationship, leading to a more collaborative ‘team’ approach, duplicate information sources, duplicate
effort and unnecessary admin was eradicated
Key Learning:
• Integrating IT TCO with finance department decreases workload and increases usability of measure
©2011 David Consulting Group
Next Steps?
• Assess your current status with an Executive
Assessment
– Review status against other companies
• Decide what are the most important and urgent
CCs for you
– not everyone process needs to be at the highest level
– you decide not the model
• Assess your capability in those CCs
• Determine and deliver improvement activities
• Repeat regularly
©2011 David Consulting Group
Questions?
Mike Harris
+1.610.644.2856