italian epea 1997 - cbd.int · the first italian epea for waste and wastewater ... susanna...
TRANSCRIPT
NATIONAL ACCOUNTS
Income distribution, sector and satellite accounts
The first Italian EPEA for waste and wastewater management
Carolina Ardi, Federico Falcitelli,
Roma, March 2003

The first Italian EPEA for waste and wastewater management
Istat – National Accounts
TABLE OF CONTENTS
1. OUTLINE OF THE REPORT 3
2. SUMMARY PRESENTATION OF THE RESULTS 3
2.1. CONCEPTUAL AND METHODOLOGICAL FRAMEWORK 3 2.2. COVERAGE 4
2.2.1. ENVIRONMENTAL DOMAINS OR CEPA CLASSES COVERED 4 2.2.2. CATEGORIES OF STATISTICAL UNITS COVERED 5 2.2.3. NATIONAL EXPENDITURE COMPONENTS COVERED 6
2.3. THE SET OF TABLES PRODUCED 6 2.4. MAIN INPUTS 7
3. METHODOLOGY 7
3.1. OVERVIEW OF THE WORK AND KEY STEPS 7 3.2. METHODOLOGICAL REMARKS 11
4. TABLES 19
5. THE WAY FORWARD 35
6. REFERENCES 37
The project was coordinated by Federico Falcitelli. The different paragraphs were authored as follows: §§ 1, 2, 3.1 and 5 by Federico Falcitelli(*); § 3.2 by Carolina Ardi(*). The Tables of § 4 have been compiled by Carolina Ardi and Federico Falcitelli.
The authors wish to thank:
- Luisa Picozzi and Alfonsina Caricchia – Directors of the National Accounts Directorate – and Raffaele Malizia – Head of the Income distribution, sector and satellite accounts Unit – for supporting the project;
- Cesare Costantino – Head of the Environmental Accounting Unit – for managing the project and for his continuous support and helpful suggestions;
- Federica Battellini, Aldo Del Santo, Nadia Di Veroli, Cecilia Jonalasi, Susanna Mantegazza, Sandra Maresca, Livia Mastrantonio, Federico Nusperli, Claudio Pascarella, Augusto Puggioni, Massimo Ricci – national accountants – and Giampiero Siesto and Alessandro Zeli – economic statisticians – for their co-operative effort for the provision of Istat basic data.
Special thanks to:
- Aldo Del Santo, who helped the authors in building up the production account of General Government specialised producers and in analysing the related national accounts transactions.
- Augusto Puggioni, who gave a substantial support for building up the production account of specialised corporations;
- Angelica Tudini – environmental accountant – for her substantial contribution to the collection and analysis of the Istat basic data;
Financial assistance was provided by the Commission of the European Communities, which is here gratefully acknowledged.

The first Italian EPEA for waste and wastewater management
Istat – National Accounts 3
1. Outline of the report
The present report contains the output of the operation undertaken by Istat under the grant agreement N. 200141200027.
This output is a first implementation of the Environmental Protection Expenditure Account (EPEA) for Italy as far as the waste and wastewater management domains are concerned. The EPEA has been implemented by exploiting existing data sources, mainly national accounts data, for the reference year 1997.
Paragraph 2 gives a summary presentation of the outcome of the pilot application (framework, coverage, tables produced, etc.), while the methodology (overview of the work, data sources, estimation methods, key assumptions, etc.) is described in Paragraph 3.
The accounting tables implemented are included in paragraph 4.
Concluding remarks are reported in Paragraph 5, which gives an overview of the possible future developments envisaged following the pilot application described here.
2. Summary presentation of the results
2.1. Conceptual and methodological framework
The conceptual framework underlying the Italian EPEA is the European EPEA as described in the SERIEE manual (Eurostat, 1994) and in the so called “EPEA Compilation Guide” (Eurostat, 2002a). The concepts and definitions, the classifications and the accounting tables adopted for the Italian EPEA are those described in these publications, with a delimitation in the scope as specified in paragraph 2.2.
The accounting tables implemented (see § 4) reflect the “worked examples” included in the excel sheets attached to the EPEA Compilation Guide (Eurostat, 2002b).
In fact, from a methodological point of view, the Italian EPEA follows the operational guidelines included in the EPEA Compilation Guide; in particular, the Italian accounting tables have been developed according to the compilation sequence known as the “magic formula” (Eurostat, 2002a, § 3.1.3), i.e. (see figure 1):
− starting from the analysis of the production and the supply of the Environmental Protection (EP) services and the investment needed for this production (Table B),
− then making a supply-use table (Table B1) in order to determine the national expenditure for EP (Table A)
− finally analysing the financing of EP and calculating its net cost (Table C and C1).
Operational solutions to a number of methodological issues have been found in the EPEA Compilation Guide (Eurostat, 2002a), as well as in the related worked examples (Eurostat, 2002b) and in the EPEA pilot applications (Eurostat, 2002c). Examples are

The first Italian EPEA for waste and wastewater management
Istat – National Accounts 4
how to account for the negative net operating surplus of specialised market producers belonging to the General Government sector and the connected “implicit subsidies”.
Figure 1 - The set of EPEA Tables according to the “magic formula”
Source: EPEA Compilation Guide, § 3.1.3 - page 18 (Eurostat, 2002a)
2.2. Coverage
The coverage of the Italian EPEA is described in the next paragraphs in terms of:
− CEPA classes covered,
− categories of statistical units covered,
− components of the national expenditure covered.
2.2.1. Environmental domains or CEPA classes covered
The Italian EPEA covers the following CEPA classes:
2. Wastewater management
3. Waste management, excluding the collection of refuse in litter-bins in public place as well as outdoor sweeping and watering of streets, paths, car parks.

The first Italian EPEA for waste and wastewater management
Istat – National Accounts 5
In the context of the present application the content of the two classes covered is the same as the one defined in the context of CEPA2000 (Eurostat, 2002a, Annex 1)1, except for the exclusion of street cleaning etc. from the waste management domain, as specified above.
2.2.2. Categories of statistical units covered
On the side of the supply of EP services the application covers mainly specialised producers belonging to the General Government (GG) and corporation sectors, classified under the division 90 (2-digits) of the NACE Rev. 1 (simply NACE90 division from now on). In particular the specialised producers covered are classified under the following national sub-categories (5-digits) of the NACE90 division (Istat, 1991):
90.00.1 – Collection and treatment of waste,
90.00.2 – Wastewater management and treatment.
In practice the scope of the Italian EPEA includes the Local Government units (LG) which are responsible for the provision of the wastewater and waste management services (i.e. municipalities) and private enterprises specialised in the production of the same kind of EP services.
Also ancillary producers of EP services belonging to the corporation sector are covered on the supply side.
The production of EP services by secondary producers (like e.g. producers belonging to the division 37 - Recycling of NACE Rev. 1) is excluded as well as the ancillary production carried out by households for own use.
Administration activities and possible financing flows carried out by Central Government (CG) units or by Local Government units other than municipalities are also excluded.
Finally, in Italy there are no Non-Profit Institutions Serving Households (NPISHs) classified under the NACE90 division.
The use side of the analysis encompasses the uses of the EP services covered on the supply side. These uses take the form of:
− final consumption of households and intermediate consumption of corporations and GG units other than characteristic producers, in the case of market EP output;
− intermediate consumption of EP services by specialised producers belonging to GG sector (market output);
1 CEPA2000 does not introduce any change to CEPA1994 included in the SERIEE manual as far as the wastewater and the waste management domains are concerned (see Eurostat, 2002a, Annex 1).

The first Italian EPEA for waste and wastewater management
Istat – National Accounts 6
− collective consumption in the case of non-market output of EP services.
2.2.3. National expenditure components covered
According to the SERIEE framework the national expenditure for EP includes the following components (see Eurostat, 1994, § 2072; Eurostat 2002a, e.g. § 5.2):
1. Uses of EP services, except by specialised producers (final consumption, intermediate consumption, GFCF - Gross Foxed Capital Formation),
2. Capital formation for environmental protection (including net acquisition of land),
3. Uses of connected and adapted products, except by specialised producers (final consumption, intermediate consumption, GFCF),
4. Specific transfers for environmental protection.
In the Italian EPEA the components listed above are covered as follows:
1. Uses of EP services, includes final and intermediate consumption of EP services produced by specialised producers belonging to the corporation and GG sectors and by ancillary producers belonging to the corporation sector (see § 2.2.2). GFCF does not apply to the use of wastewater and waste management services (see, e.g., Eurostat, 1994, § 2182).
2. Capital formation for environmental protection (including net acquisition of land) includes the whole GFCF realised by the specialised producers covered and only the end-of-pipe investments in the case of ancillary producers;
3. Uses of connected and adapted products are not covered;
4. Specific transfers for environmental protection are included only with reference to the “implicit subsidies” which offset the negative value of the net operating surplus of specialised market producers belonging to the GG sector (see, e.g., Eurostat, 2002a, page 82).
2.3. The set of tables produced
For both environmental domains covered (i.e. CEPA classes 2 and 3) the five EPEA tables have been produced: Table A, Table B, Table B1, Table C, Table C1. A third set of the five tables has been calculated as the sum of the wastewater and waste management tables.
The “shape” of the accounting tables is slightly simplified according to the basic information available; this simplification is based mainly on the worked examples of the EPEA Compilation Guide and does not affect the consistence with the EPEA tables included in the SERIEE manual.
In paragraph 4 the accounting tables produced are reported according to the compilation sequence, i.e. Table B, Table B1, Table A, Table C and Table C1.

The first Italian EPEA for waste and wastewater management
Istat – National Accounts 7
2.4. Main inputs
The most part of the information used for building the Italian EPEA consists of national accounts data related to the NACE90 division (e.g. production and generation of income account, Input-Output Table, time series of GFCF, etc.). Additional information derived from business statistics are used in particular for calculating the EP output and the investments of specialised and ancillary producers belonging to the corporation sector.
It should be noted that all the national accounts figures used as input for the EPEA tables maintain their original accounting treatment.
3. Methodology
3.1. Overview of the work and key steps
The aim of this paragraph is to provide a general outlook of the activities implemented for building the Italian EPEA and to point out the key steps of the methodology applied.
As summarised in Figure 2, once basic data had been selected, three main steps were carried out in order to process the data. The overall work carried out for building the Italian EPEA was developed as follows:
1. Collection and analysis of basic data - Result: selection of basic data to be processed
2. Processing the basic data selected - Result: production of the EPEA accounting tables
2.1. First step: production of the main aggregates concerning the supply and uses of EP services and the GFCF of ancillary producers, to be entered in Tables B, B1 and A
2.2. Second step: production of the figures concerning the GFCF of specialised producers to be accounted for in Tables B and A and completion of the figures concerning the supply and uses of EP services to be entered in Tables B, B1 and A
2.3. Final step: full implementation of the EPEA tables starting from figures accounted for in Tables B, B1 and A during the previous steps.
Collection and analysis of basic data The activities concerning at the collection and analysis of basic data, in order to select the information actually exploitable for implementing the EPEA tables, took the most part of the work. The result of these activities was the selection of the data to be processed for the EPEA implementation and their organisation in primary data bases.
As shown in Figure 2 the selected basic data encompass mainly National Accounts data together with some information coming from business statistics.

The first Italian EPEA for waste and wastewater management
Istat – National Accounts 8
Figure 2 - Overview of the working steps leading to the Italian EPEA for wastewater and waste management domains
FINAL STEP
SECOND STEP
Consumption of fixed capital and net
operating surplus of specialised producers of corporation sector
FIRST STEP
BASIC DATA
SE-LECTED
Business statistics:
1997 Intermediate
census of industries:
questionnaire on EP
investments and current
expenditures by env. domain
Business statistics:annual survey on
business economic accounts: variable on current exp. for
waste disposal, wastewater
treatment and air pollution
abatement; EP end-of-pipe invest.
(SBS regulation)
Business statistics: annual survey on
business economic accounts: data on
NACE90 corporations by
national sub-categories (5 digits)
National accounts:
production and generation of
income account of NACE90 division (2 digits) by
institutional sector
National accounts: full-time
equivalent employment
by institutional
sector and by national sub-categories (5
digits)
National accounts: purchases of EP
services provided by GG specialised
producers, subdivided by env. domain and
purchaser sector (these data are based on basic information
concerning taxes, fees, etc. paid for
waste and wastewater management services)
National accounts:
Input-Output Table:
NACE90 division (2
digits)
National accounts:
time series of GFCF of NACE90
division (2 digits) by
institutional sector
National accounts: time series of Net capital stock and
consumption of fixed capital of Section O
of NACE Rev.1
Capital formation and intermediate consumption
Financing by producers
Uses SupplyTable B Table B1 Table A Table C Table C1
EP GFCF and output (and uses)
of ancillary producers of
corporation sector
EP output and production costs of
specialised producers of corporation sector
(excluding consumption of fixed
capital)
Uses of EP services
provided by specialised
producers of GG sector
EP output and production
costs of specialised
producers of GG sector
Uses of EP services provided by specialised
producers of corporation sector
GFCF of specialised producers
Net capital stock of
specialised producers

The first Italian EPEA for waste and wastewater management
Istat – National Accounts 9
The 1997 has been chosen as the reference year of the Italian EPEA due to the fact that this is the only year for which data on ancillary EP activities carried out by corporations are available (production costs and end-of-pipe investments); these data have been collected through an ad hoc questionnaire submitted to corporations in the context of the last Intermediate Census on Industries and Services, carried out in 1998.
At the stage of the selection of basic data a number of hypotheses on how to process the selected information have been made. The methodology actually applied for implementing the EPEA tables has been identified after making various simulations.
The basic ideas underlying the processing stage are described hereafter, while more details are given in paragraph 3.2.
Data processing - First step The ancillary EP output (together with the corresponding uses) and the end-of-pipe investments of corporations needed for this output – to be entered first in Table B – were calculated on the basis of the aforementioned data provided by the last Intermediate Census of Industries and Services together with data coming from the annual survey on business economic accounts (see the two first blocks at the bottom of Figure 2).
The most part of the basic information used for the Italian EPEA concerns the supply and uses of EP services produced by specialised producers belonging to the NACE90 division.
The starting point was the production and generation of income account of the NACE90 division (fourth block at the bottom of Figure 2). This account is regularly produced for each institutional sector (GG market producers, GG non-market producers, corporations) with reference to the NACE90 division as a whole (2-digits), i.e. the three national sub-categories of the NACE90 (5-digits):
90.00.1 – Collection and treatment of waste,
90.00.2 – Wastewater management and treatment,
90.00.3 – Sanitation and similar activities2,
are not singled out.
The basic idea of the Italian approach was to break down by national sub-category (5-digits) the production and generation of income account of the NACE90 division (2-digits). Such an operation led to the estimation of the output and the production costs of the GG and corporation units classified under the three different national sub-categories of the NACE90 division: the results obtained for the categories 90.00.1 and 90.00.2
2 This sub-category includes: refuse in litter-bins in public place; outdoor sweeping and watering of streets, paths, car parks; snow and ice cleaning on highways, airport runways, including spreading of salt or sand, etc.; maintenance of cemeteries.

The first Italian EPEA for waste and wastewater management
Istat – National Accounts 10
entered the upper part of Table B, respectively for the waste and wastewater management sub-accounts; the results obtained for the 90.00.3 category were excluded from the scope of the Italian EPEA.
Two different processes were applied in order to break down by national sub-category (5-digits) the production and generation of income account of the NACE90 division (2-digits).
For the corporation sector the annual survey on business economic accounts provides data on business production costs broken down by national sub-category (third block at the bottom of Figure 2). First of all these data were used to estimate the value added of the corporation sector in each national sub-category of the NACE90 division. Then the production and generation of income account of the NACE90 division (corporation sector) was broken down proportionally to the value added estimated for each sub-category (5-digits), maintaining the cost structure of the NACE90 division as a whole as revealed by the said account (corporation sector).
For the GG sector first the output of waste and wastewater EP services was estimated. This estimate was based on the national accounts data on purchases of EP services provided by GG specialised producers and the data on full-time equivalent employment broken down by institutional sector and national sub-category (sixth and seventh block at the bottom of Figure 2); data on VAT of the NACE90 division derived from the Input-Output Table were taken into account in order to calculate the GG output at basic prices starting from the purchases of EP services (eight block at the bottom of Figure 2). The production and generation of income account of the NACE90 division (GG sector) was then broken down proportionally to the value of the EP output estimated for each sub-category (5-digits), maintaining the cost structures of the NACE90 division as a whole with specific reference to GG market producers and GG non-market producers.
At the first step only the uses of EP services produced by GG specialised producers were quantified. They were calculated at purchasers' price on the basis of the national accounts data on purchases of EP services. These data are the same as those used – together with information on full-time equivalent employment and VAT (see above) – for estimating the EP output at basic price provided by GG specialised producers.
Data processing - Second step The second step was devoted to complete the picture of the uses of EP services and to break down by national sub-category a number of national accounts data, such as e.g. GFCF, that are currently available in an aggregated form (NACE division or section). This break down was made on the basis of the estimates made at the first step.
At the second step the picture of the uses of EP services (to be entered in Tables B1 and A) was completed with the calculation of the uses of EP services produced by the specialised producers belonging to the corporation sector. This calculation was made mainly on the basis of the Input-Output Table (IOT) which provides data on the final and intermediate uses of the output generated by the NACE90 division as a whole. At this step the “intra-industry” consumption of EP services provided by the IOT (i.e. the intermediate auto-consumption of the NACE90 division) was used for estimating the intermediate consumption of EP services produced by the specialised producers

The first Italian EPEA for waste and wastewater management
Istat – National Accounts 11
belonging to the corporation sector and purchased by the General Government specialised producers.
The national accounts data on GFCF of the NACE90 division are originally broken down by institutional sector (GG and corporation). These data were further broken down on the basis of the distribution of the value added by institutional sector and national sub-category calculated at the first step, in order to calculate the GFCF of specialised producers to be entered in Tables B and A.
The distribution of the EP output by institutional sector and national sub-category calculated at the first step was used for breaking down national accounts data on net capital stock in order to estimate the value of the net capital stock of specialised producers for the different national sub-categories. These estimates were used for calculating the following figures: the Consumption of Fixed Capital (CFC) of corporations to be accounted for in Table B; the Net Operating Surplus (NOS) of corporations to be entered in Tables B and C1; the interest on fixed capital of specialised producers to be entered in Table C1.
Data processing - Final step The previous steps led to the estimation of the most part of the figures to be accounted for in the EPEA tables and in particular in Tables B, B1 and A. Therefore the third step was devoted to complete the implementation of the tables, mainly Tables C and C1, by applying the accounting rules of the EPEA and exploiting the figures accounted for in Tables B, B1 and A.
3.2. Methodological remarks
This paragraph gives more details on the methodology and the assumptions underlying the Italian EPEA. Methodological aspects are here described with reference to the three main steps summarised in paragraph 3.1.
Data processing - First step
Ancillary EP output (and uses) and the associated end-of-pipe investments of corporations.
The Intermediate Census on Industries and Services, carried out by Istat in 1998, collected data on current EP ancillary expenditures and end-of-pipe investments for 1997, broken down by environmental domain; these data refer only to corporations with 20 employees or more.
The annual survey on business economic accounts provides data for the whole corporation sector3 on total end-of-pipe investments (i.e. not broken down by environmental domain) from 1998. The same survey provides data on total current
3 Except for divisions 01, 02 and 05 of NACE Rev. 1.

The first Italian EPEA for waste and wastewater management
Istat – National Accounts 12
ancillary expenditures for “waste disposal, wastewater treatment and air pollution abatement” from the middle of the '90s.
All these data were used in order to estimate the ancillary EP output and end-of-pipe investments carried out by the corporation sector in the wastewater and waste management domains. To this purpose the Intermediate Census data were integrated with estimates on EP output and end-of-pipe investments of corporations with less than 20 employees. These estimates were calculated as follows.
As far as the end-of-pipe investments are concerned, an average ratio was calculated between the investments made by corporations with less than 20 employees and the investments made by corporations with 20 employees or more; this ratio was calculated on the basis of the available time series. The estimate of end-of-pipe investments made in 1997 by corporations with less than 20 employees was obtained by applying the average ratio to the 1997 investments of corporations with 20 employees or more (collected through the Intermediate Census). In this way an estimate of the total end-of-pipe investments carried out by all the corporations was obtained. This estimate was then broken down by environmental domain according to the distribution of EP investments provided by the Intermediate Census data for corporations with 20 employees or more.
A similar procedure was applied for current ancillary expenditures.
Breaking down by national sub-category (5-digits) the production and generation of income account of the NACE90 division (2-digits).
The Production and Generation of Income account (PGI account from now on) of the NACE90 division (2-digits) is regularly broken down by institutional sector (GG market producers, GG non-market producers, corporations). For each institutional sector the following data are available:
− Compensation of employees
− Consumption of Fixed Capital (CFC)
− Net Operating Surplus (NOS)
− Net taxes (other taxes on production less other subsidies on production)
− Value added
− Intermediate consumption
− Output at basic price.
For the corporation sector the PGI account provides the Gross Operating Surplus as a whole, i.e. no separated estimates for CFC and NOS are originally available.
As anticipated above (see § 3.1) the Italian classification of economic activities breaks down the division 90 of NACE Rev.1 into the following national sub-categories:
90.00.1 – Collection and treatment of waste,
90.00.2 – Wastewater management and treatment,
90.00.3 – Sanitation and similar activities.

The first Italian EPEA for waste and wastewater management
Istat – National Accounts 13
The basic idea of the Italian approach was to break down by national sub-category (5-digits) the PGI account of the NACE90 division (2-digits). Such an operation led to the estimation of the output and the production costs of the GG and corporation units classified under the three different national sub-categories of the NACE90 division: the results obtained for the categories 90.00.1 and 90.00.2 entered the upper part of Table B, respectively for the waste and wastewater management sub-accounts; the results obtained fort the 90.00.3 category are excluded from the scope of the Italian EPEA.
It was assumed that the estimated output for the 90.00.1 and 90.00.2 categories was entirely an EP output.
Two different processes were applied in order to break down by national sub-category (5-digits) the PGI account of the NACE90 division (2-digits): one for the corporation sector and another one for the General Government sector.
Corporation sector
The annual survey on business economic accounts provides data on business production costs broken down by national sub-category (5-digits). These data were used to estimate the value added of the NACE90 corporation sector by national sub-category. From these estimates a percentage distribution by national sub-category of the total value added of corporations was derived. This percentage distribution was used for breaking down by national sub-category the total value added of the NACE90 division (corporation sector) provided by the PGI account. The other figures of this account were broken down proportionally to the amount of the value added estimated for each national sub-category; the assumption was made that for the corporation sector the cost structure of each of the three activities included in the NACE90 division was the same as the one of the division as a whole.
General Government sector
In the national accounts the GG output of waste management services is classified as market output, while the GG output of wastewater management services is classified as non-market output. This classification resulted from an analysis of different types of national accounts data concerning the NACE90 division. In particular the following data were taken into consideration:
− time series of full-time equivalent employment broken down by institutional sector and national sub-category,
− basic data used for the General Government sector account with particular reference to the receipts of municipalities that are the counterpart of the provision of waste and wastewater management services.
The analysis of such data also showed that the GG non-market output resulting from the PGI account of the NACE90 division concerned only the activities classified under the 90.00.2 sub-category (Wastewater management and treatment), while the GG market output provided by the same account concerned the activities related to the categories 90.00.1 (Collection and treatment of waste) and 90.00.3 (Sanitation and similar activities).
The first Italian EPEA for waste and wastewater management
Istat – National Accounts 14
For EPEA purposes all this information was exploited as follows:
Wastewater management account The PGI account for the GG non-market producers was entirely included in the production table of the wastewater management account (upper part of Table B).
The receipts (excluding VAT - see below “uses of EP services provided by GG specialised producers”) of GG that are the counterpart of the provision of wastewater management services correspond to the market part of the total output and were then accounted for in Table B as sales (partial payments)4; the non-market part of the total output was calculated by difference.
Waste management account The output of the GG market producers given by the PGI account of the NACE90 division relates to both the category 90.00.1 (Collection and treatment of waste) and the category 90.00.3 (Sanitation and similar activities).
The waste management part of the total output is given by the receipts (excluding VAT - see below “uses of EP services provided by GG specialised producers”) that are the counterpart of the provision of waste management services; information on these receipts comes from the basic data used for the GG sector account. The remaining part of the total output is attributed to sanitation and similar activities.
The PGI account of GG market producers of the NACE90 division is then broken down proportionally to the estimated output of the two kinds of activities undertaken; this implies that the cost structure of the GG market producers of the whole NACE90 division applies of each of the two sub-categories of activities.
The waste management part of the PGI account of GG market producers enters the production table of the waste management account (upper part of Table B).
Uses of EP services provided by GG specialised producers.
The basic data on the receipts related to the purchases of wastewater and waste EP services provided by GG are originally broken down by purchaser sector (households and corporations). These data are accounted for in national accounts as the counterpart for the acquisition of EP services: this counterpart is a market price in the case of waste management services and is a non-market price (partial payments) in the case of wastewater management services. To EPEA purposes these data give directly the value at purchasers' price of the uses of the market EP output provided by GG specialised producers and purchased by households and corporations; they were used, therefore, without any further elaboration.
The Input-Output Table (IOT) provides data on the VAT paid by the specialised producers of the NACE90 division as a whole. In order to estimate the VAT paid by the purchasers of the EP services produced within the NACE90 division it was assumed that the VAT cost of specialised producers was fully charged to the final users, also in
4 See, e.g., Eurostat 2002a, § 5.1.3.

The first Italian EPEA for waste and wastewater management
Istat – National Accounts 15
the case of non-market services (i.e. wastewater management services). The total VAT provided by the IOT was broken down by national sub-category proportionally to the purchases of services provided by the GG specialised producers of the NACE90 division.
This process led to an estimate of the VAT on purchases of the market output of wastewater and waste management services.
In Table B the EP market output is recorded at basic price. Therefore the estimated VAT had to be excluded from the purchases of EP services in order to obtain the sales of EP output to be entered in Table B (see above “breaking down by national sub-category … – GG sector”). In Table B1 the estimated VAT was accounted for within the supply side in order to balance the uses which were recorded at purchasers' price, i.e. including VAT.
For EPEA purposes all this information was used as follows:
Wastewater management account The basic data on the receipts from the purchases of wastewater EP services produced by GG gave the value at purchasers' price of the uses of households and corporations. These uses concerned in particular the market part of the total output of wastewater services (partial payments). These uses entered directly Table B1 (use side) and Table A.
The purchases of EP services less the VAT gave the value at basic price of the market part of the EP output (to be entered in Table B).
The non-market part of the total EP output of GG specialised producers was obtained by difference (to be entered in Table B) and was accounted for as collective consumption on the use side (Table B1 and Table A).
Waste management account The basic data on the receipts from the purchases of waste EP services provided by GG specialised producers gave the value of the uses of households and corporations. These uses entered directly Table B1 (use side) and Table A.
The purchases of EP services less the VAT gave the value at basic price of the market EP output (to be entered in Table B).
Data processing - Second step
Uses of EP services produced by specialised producers of the corporation sector.
At the end of the first step the following main results were obtained:
Supply of EP services
− The production account of specialised producers belonging to the GG and corporation sectors, for wastewater and waste management domains
Use of EP services
− Households and corporation uses of EP services produced by specialised producers belonging to GG, for wastewater and waste management domains.

The first Italian EPEA for waste and wastewater management
Istat – National Accounts 16
In order to complete the picture of the uses of EP services, at the second step the uses of EP services produced by specialised producers belonging to the corporation sector were calculated. The calculation was based on the production account of specialised corporations (calculated during the first step) and on the IOT.
The comparison between the national accounts data on purchases of EP services and the IOT data concerning the uses of the output of the NACE90 division shows that the households purchases of EP services and the collective consumption of non-market EP output5 practically equal to the final consumption of the whole NACE90 division resulting from the IOT. Furthermore the IOT shows that there are no GFCF and exports among the final uses of the output of the NACE90 division.
This information allowed us to assume that the EP output of specialised corporations was entirely used as Intermediate Consumption (IC).
The IOT shows that within the IC of the output of the whole NACE90 division a substantial amount concerns the IC of the same NACE90 division, i.e. the intra-industry use6. With particular reference to the wastewater and waste management activities, this intra-industry use can be considered as related to the purchase of wastewater and waste services from subcontractors.
On the basis of all this information, the corporation EP output of wastewater and waste management services (estimated at the first step) was accounted for, on the use side, as IC; it was distributed between the IC of non characteristic producers (corporations) and specialised producers (sub-contracting) proportionally to the distribution derived from the IOT. As far as the IC of specialised producers was concerned, it was assumed that corporations did not subcontract and then the estimated IC of EP services purchased by specialised producers was attributed in particular to the GG specialised producers.
GFCF of specialised producers.
National accounts basic data provide time series on GFCF of the whole NACE90 division, broken down by institutional sector, namely corporations and GG.
These data were further broken down by national sub-category (90.00.1 – Collection and treatment of waste, 90.00.2 – Wastewater management and treatment, 90.00.3 – Sanitation and similar activities) according to the value of the output that had been estimated at the first step by breaking down the PGI account of the NACE90 division by national sub-category.
5 The part of the wastewater management output which is not offset by the partial payments of households and corporations is accounted for as collective consumption (see above “Data processing - First step. Uses of EP services produced by specialised producers of the corporation sector”). 6 In 1997 this intra-industry IC represents around the 15% of the total uses of the output of the NACE90 division and around the 26% of the total IC of the same output.

The first Italian EPEA for waste and wastewater management
Istat – National Accounts 17
The results obtained for the 90.00.1 and 90.00.2 categories are accounted for in Tables B and A as GFCF of specialised producers, respectively in waste and wastewater management sub-accounts.
Net capital stock of specialised producers.
National accounts basic data provide time series on net capital stock, broken down by NACE section.
First an estimate of the net capital stock of the whole NACE90 division was made; afterwards this estimate was further broken down by national sub-category (90.00.1 – Collection and treatment of waste, 90.00.2 – Wastewater management and treatment, 90.00.3 – Sanitation and similar activities).
The first estimate was made by assuming that over the time the share of the net capital stock of the division 90 in the net capital stock of the whole section O was the same as the share of the investments of the division 90 in the total investments of the section O7. In practice an average ratio between the investments of the division 90 and the investments of the section O was calculated over several years; then this average ratio was applied to the net capital stock of the section O in 1997 in order to estimate the net capital stock of the NACE90 division.
The estimated value of the net capital stock of the NACE90 division was then broken down by national sub-category according to the value of the output that had been estimated at the first step by breaking down the PGI account of the NACE90 division by national sub-category.
The results obtained for the 90.00.1 and 90.00.2 categories were regarded as the net capital stock of the specialised producers, respectively, in the waste and wastewater management domains.
These estimates of net capital stock of specialised producers were used successively for different accounting purposes:
− to estimate the CFC and the NOS of specialised producers of the corporation sector (see below), both to be entered in the upper part of Table B, the NOS also to be accounted for in Table C1;
− to estimate the interest on fixed capital to be accounted for in Table C1 (see below).
CFC and NOS of specialised producers of the corporation sector.
For the corporation sector the PGI account of the NACE90 division provides the Gross Operating Surplus as a whole, i.e. without giving the values of CFC and NOS.
Once having broken down the PGI account by national sub-category (first step) and estimated the net capital stock of specialised producers (second step), the CFC of
7 Division 90 is included in Section O of the NACE Rev. 1.

The first Italian EPEA for waste and wastewater management
Istat – National Accounts 18
specialised corporations which provide wastewater and waste management services was calculated on the basis of the ratio between the CFC and the net capital stock of the GG specialised producers which provide EP market output; the assumption was made that the ratio CFC/net capital stock of GG specialised market producers applied also to specialised corporations.
The NOS was calculated by difference between the Gross Operating Surplus and the estimated value of the CFC.
Both aggregates entered the upper part of Table B; the NOS was also accounted for in Table C1.
Data processing - Final step This step was devoted to the full implementation of the EPEA tables and was based on the figures calculated during the previous steps.
These figures allowed us to fully implement Tables B, B1 and A, according to the “magic formula” (Eurostat, 2002a, § 3.1.3).
Table C was built-up on the basis of Table A, assuming that the different sectors (i.e. specialised producers, ancillary producers, users) mainly financed their EP expenditures themselves. The only exception concerned the “implicit subsidies” which – in Table B of the waste management sub-account – offset the negative NOS of the specialised market producers belonging to the General Government sector. These implicit subsidies were to be accounted for in Table A (under the specific transfers) and in Table C, broken down by beneficiary. In order to do that the amount of the implicit subsidies of the GG market producers in the waste domain was distributed between the users (corporations and households) proportionally to their use (Eurostat, 2002a, 2002b).
The information needed for implementing Table C1 was not completely available. Nevertheless Table C1 was implemented to the extent possible. It was built up on the basis of the previous tables (Table C, B, B1) with the only exception of the figure concerning interest on fixed capital of the specialised producers. This figure was calculated by applying a standard market rate to the estimated values of the net capital stock of specialised producers (see above). The rate was taken from the EPEA Compilation Guide (Eurostat, 2002a).
The first Italian EPEA for waste and wastewater management
Istat – National Accounts 19
4. Tables
The Tables reported hereafter present the Italian 1997 EPEA for the wastewater and waste management domains.
For 1997 the following Tables are provided8:
Wastewater management account
• Table B: Production of characteristic services
• Table B1: Supply and use table for characteristic services
• Table A: National expenditure by components and by Users/Beneficiaries
• Table C: Financing of national expenditure for environmental protection
• Table C1: Environment-related financial burden
Waste management account
• Table B: Production of characteristic services
• Table B1: Supply and use table for characteristic services
• Table A: National expenditure by components and by Users/Beneficiaries
• Table C: Financing of national expenditure for environmental protection
• Table C1: Environment-related financial burden
Wastewater and Waste management account
• Table B: Production of characteristic services
• Table B1: Supply and use table for characteristic services
• Table A: National expenditure by components and by Users/Beneficiaries
• Table C: Financing of national expenditure for environmental protection
• Table C1: Environment-related financial burden.
8 In the Tables the following symbols are used:
"-" the transaction does not exist or is equal to zero;
"…." the transaction exists but no data are available;
" " (blank) the transaction is not recorded, according to EPEA rules, in order to avoid double counting.

The Italian EPEA for wastewater and waste managementYear 1997
(million eurolire - current prices)
Table B: Production of characteristic services
Wastewater management
Intermediate consumption 609,9 382,3 .... 992,3 of which EP services 28,0 - .... 28,0Compensation of employees 396,6 177,1 .... 573,7Net taxes 1,0 4,2 .... 5,2Gross operating surplus 216,4 131,1 .... 347,5 of which
Consumption of fixed capital 216,4 41,7 .... 258,1Net operating surplus - 89,3 - 89,3
Output 1.224,0 694,6 200,2 2.118,9 of which EP services 1.224,0 694,6 200,2 2.118,9 non market 631,6 - 200,2 831,9 market 592,4 694,6 - 1.287,0Sales 592,4 694,6 - 1.287,0Implicit subsidies - - - - GFCF and land 96,2 422,8 182,5 701,4Capital grants received .... .... .... .... (*) Only ancillary producers. Only Corporations. Row "GFCF and land" includes only end-of-pipe investments.
Characteristic producers
General Government
Non specialised
producers (*)
Total
Corporations
Specialised producers
Istat – National Accounts 20

The Italian EPEA for wastewater and waste managementYear 1997
(million eurolire - current prices)
Table B1: Supply and use table for characteristic services
Wastewater management Non market Market Ancillary Total
USESFinal consumption 631,6 574,3 - 1.205,9Intermediate consumption - 769,0 200,2 969,2 of which specialised producers - 28,0 - 28,0Capital formation - - - -
Total uses 631,6 1.343,3 200,2 2.175,2
SUPPLYCorporations - 694,6 200,2 894,9General Government 631,6 592,4 - 1.224,0VAT - 56,3 - 56,3
Total supply 631,6 1.343,3 200,2 2.175,2
Environmental protection services
Istat – National Accounts 21
The Italian EPEA for wastewater and waste managementYear 1997
(million eurolire - current prices)
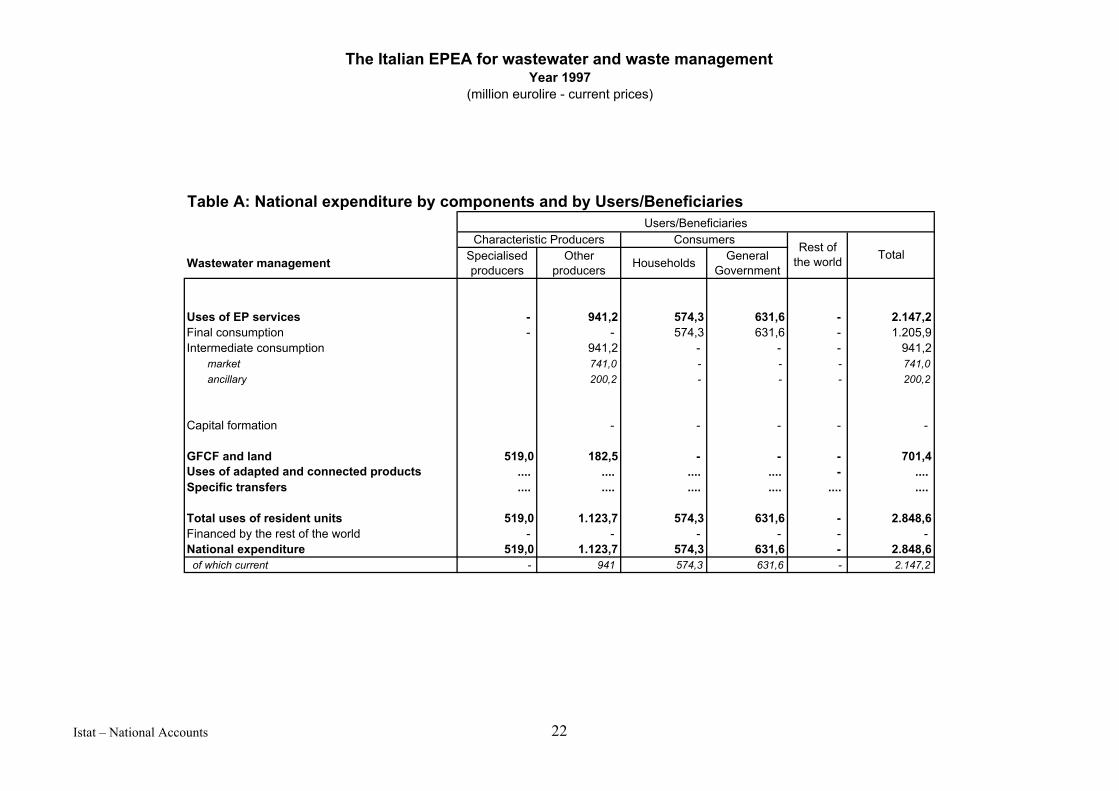
Table A: National expenditure by components and by Users/Beneficiaries
Wastewater management Specialised producers
Other producers Households General
Government
Uses of EP services - 941,2 574,3 631,6 - 2.147,2Final consumption - - 574,3 631,6 - 1.205,9Intermediate consumption 941,2 - - - 941,2 market 741,0 - - - 741,0 ancillary 200,2 - - - 200,2
Capital formation - - - - -
GFCF and land 519,0 182,5 - - - 701,4Uses of adapted and connected products .... .... .... .... - .... Specific transfers .... .... .... .... .... ....
Total uses of resident units 519,0 1.123,7 574,3 631,6 - 2.848,6Financed by the rest of the world - - - - - - National expenditure 519,0 1.123,7 574,3 631,6 - 2.848,6 of which current - 941 574,3 631,6 - 2.147,2
Users/BeneficiariesCharacteristic Producers Consumers Rest of
the world Total
Istat – National Accounts 22
The Italian EPEA for wastewater and waste managementYear 1997
(million eurolire - current prices)
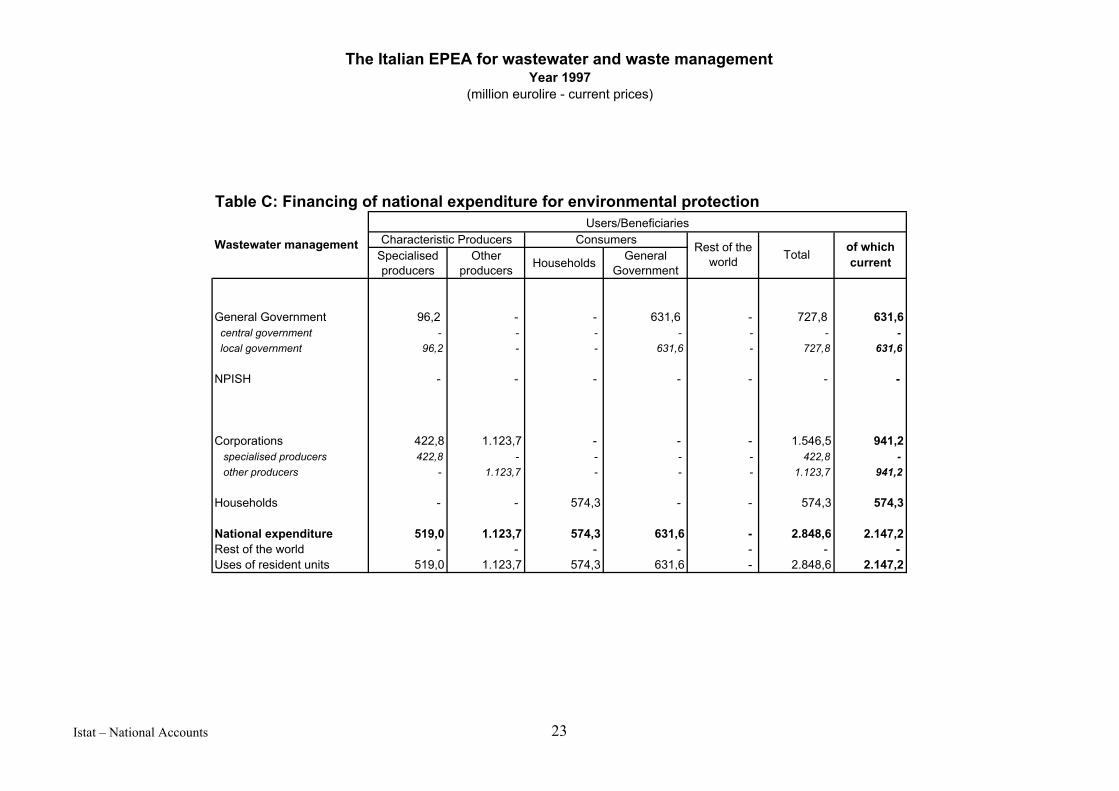
Table C: Financing of national expenditure for environmental protection
Specialised producers
Other producers Households General
Government
General Government 96,2 - - 631,6 - 727,8 631,6 central government - - - - - - - local government 96,2 - - 631,6 - 727,8 631,6
NPISH - - - - - - -
Corporations 422,8 1.123,7 - - - 1.546,5 941,2 specialised producers 422,8 - - - - 422,8 - other producers - 1.123,7 - - - 1.123,7 941,2
Households - - 574,3 - - 574,3 574,3
National expenditure 519,0 1.123,7 574,3 631,6 - 2.848,6 2.147,2Rest of the world - - - - - - - Uses of resident units 519,0 1.123,7 574,3 631,6 - 2.848,6 2.147,2
Characteristic Producers Consumers Rest of the world
Users/Beneficiaries
Total of which current
Wastewater management
Istat – National Accounts 23

The Italian EPEA for wastewater and waste managementYear 1997
(million eurolire - current prices)
Table C1: Environment-related financial burden
Wastewater managementSpecialised producers
Other producers
Financing of current national expenditure - 941,2 574,3 631,6 2.147,2
Interest on fixed capital 131,8 .... .... 232,3 364,1 Any other profit - .... .... - .... Net operating surplus 89,3 - - - 89,3
Non-deductible VAT on current expenditure - - - -56,3 -56,3 Taxes on production - - - -5,2 -5,2
Net cost of environmental protection 42,5 941,2 574,3 802,4 2.360,4
Environmental taxes .... .... .... .... -
Total environmental related burden 42,5 941,2 574,3 802,4 2.360,4
TotalCorporations
Sectors
General Government
Households, including NPISHs
Istat – National Accounts 24

The Italian EPEA for wastewater and waste managementYear 1997
(million eurolire - current prices)
Table B: Production of characteristic services
Waste management
Intermediate consumption 2.770,6 2.636,2 .... 5.406,8 of which EP services 1.131,3 - .... 1.131,3Compensation of employees 488,2 1.220,9 .... 1.709,0Net taxes - 28,9 .... 28,9Gross operating surplus 77,0 903,6 .... 980,6 of which
Consumption of fixed capital 200,3 287,6 .... 487,9Net operating surplus -123,4 616,0 - 492,7
Output 3.335,8 4.789,6 124,6 8.250,0 of which EP services 3.335,8 4.789,6 124,6 8.250,0 non market - - 124,6 124,6 market 3.335,8 4.789,6 - 8.125,4Sales 3.335,8 4.789,6 - 8.125,4Implicit subsidies 123,4 - - 123,4GFCF and land 88,7 2.915,3 63,8 3.067,8Capital grants received .... .... .... .... (*) Only ancillary producers. Only Corporations. Row "GFCF and land" includes only end-of-pipe investments.
CorporationsGeneral Government
Characteristic producers
Non specialised
producers (*)
TotalSpecialised producers
Istat – National Accounts 25

The Italian EPEA for wastewater and waste managementYear 1997
(million eurolire - current prices)
Table B1: Supply and use table for characteristic services
Waste management Non market Market Ancillary Total
USESFinal consumption - 3.292,9 - 3.292,9Intermediate consumption - 5.515,3 124,6 5.639,9 of which specialised producers - 1.131,3 - 1.131,3Capital formation - - - -
Total uses - 8.808,2 124,6 8.932,8
SUPPLYCorporations - 4.789,6 124,6 4.914,3General Government - 3.335,8 - 3.335,8VAT - 322,8 - 322,8Taxes on products other than VAT - 360,0 - 360,0
Total supply - 8.808,2 124,6 8.932,8
Environmental protection services
Istat – National Accounts 26
The Italian EPEA for wastewater and waste managementYear 1997
(million eurolire - current prices)
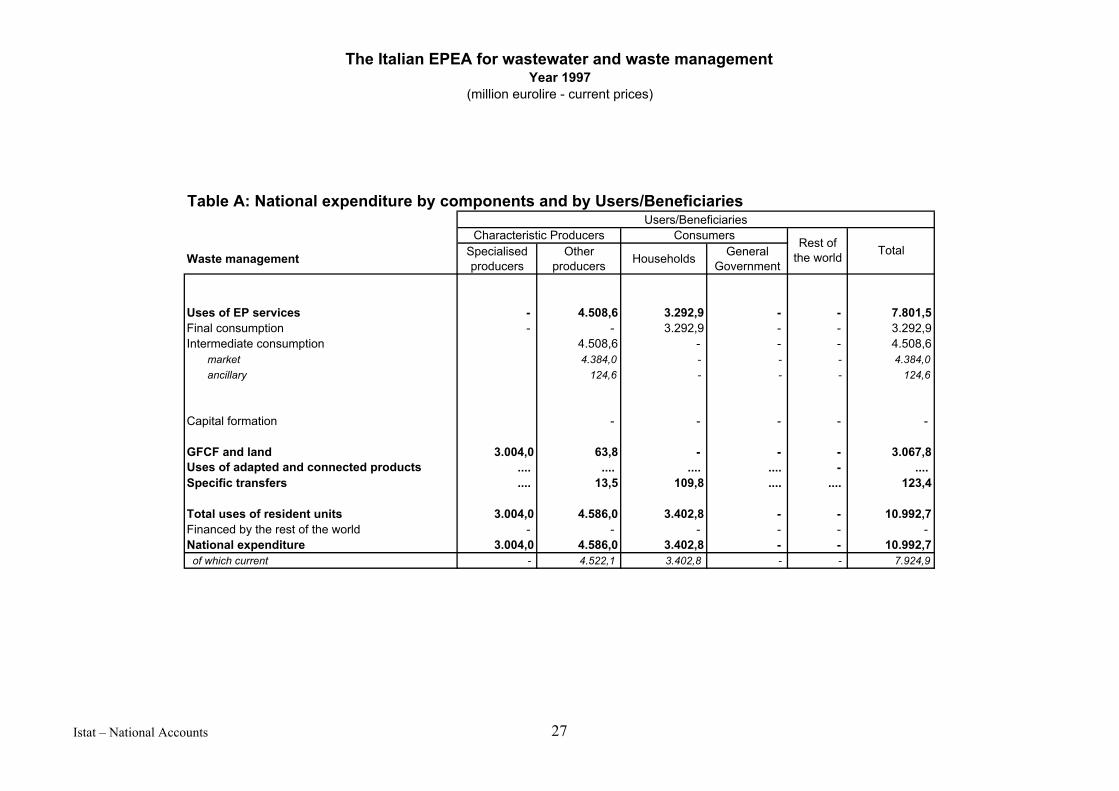
Table A: National expenditure by components and by Users/Beneficiaries
Waste management Specialised producers
Other producers Households General
Government
Uses of EP services - 4.508,6 3.292,9 - - 7.801,5Final consumption - - 3.292,9 - - 3.292,9Intermediate consumption 4.508,6 - - - 4.508,6 market 4.384,0 - - - 4.384,0 ancillary 124,6 - - - 124,6
Capital formation - - - - -
GFCF and land 3.004,0 63,8 - - - 3.067,8Uses of adapted and connected products .... .... .... .... - .... Specific transfers .... 13,5 109,8 .... .... 123,4
Total uses of resident units 3.004,0 4.586,0 3.402,8 - - 10.992,7Financed by the rest of the world - - - - - - National expenditure 3.004,0 4.586,0 3.402,8 - - 10.992,7 of which current - 4.522,1 3.402,8 - - 7.924,9
Rest of the world Total
Characteristic ProducersUsers/Beneficiaries
Consumers
Istat – National Accounts 27

The Italian EPEA for wastewater and waste managementYear 1997
(million eurolire - current prices)
Table C: Financing of national expenditure for environmental protection
Specialised producers
Other producers Households General
Government
General Government 88,7 13,5 109,8 - - 212,0 123,4 central government - - - - - - - local government 88,7 13,5 109,8 - - 212,0 123,4
NPISH - - - - - - -
Corporations 2.915,3 4.572,4 - - - 7.487,7 4.508,6 specialised producers 2.915,3 - - - - 2.915,3 - other producers - 4.572,4 - - - 4.572,4 4.508,6
Households - - 3.292,9 - - 3.292,9 3.292,9
National expenditure 3.004,0 4.586,0 3.402,8 - - 10.992,7 7.924,9Rest of the world - - - - - - - Uses of resident units 3.004,0 4.586,0 3.402,8 - - 10.992,7 7.924,9
of which current
Characteristic Producers Consumers Rest of the world Total
Users/Beneficiaries
Waste management
Istat – National Accounts 28

The Italian EPEA for wastewater and waste managementYear 1997
(million eurolire - current prices)
Table C1: Environment-related financial burden
Waste managementSpecialised producers
Other producers
Financing of current national expenditure - 4.508,6 3.292,9 123,4 7.924,9
Interest on fixed capital 909,0 .... .... 633,1 1.542,1 Any other profit - .... .... - .... Net operating surplus 616,0 - - -123,4 492,7
Non-deductible VAT on current expenditure - - - -322,8 -322,8 Taxes on production - - - -28,9 -28,9
Net cost of environmental protection 293,0 4.508,6 3.292,9 528,1 8.622,6
Environmental taxes .... .... .... .... -
Total environmental related burden 293,0 4.508,6 3.292,9 528,1 8.622,6
TotalCorporations Households, including NPISHs
Sectors
General Government
Istat – National Accounts 29

The Italian EPEA for wastewater and waste managementYear 1997
(million eurolire - current prices)
Table B: Production of characteristic services
Wastewater and waste management
Intermediate consumption 3.380,6 3.018,5 .... 6.399,1 of which EP services 1.159,3 - .... 1.159,3Compensation of employees 884,8 1.397,9 .... 2.282,8Net taxes 1,0 33,1 .... 34,1Gross operating surplus 293,3 1.034,7 .... 1.328,1 of which
Consumption of fixed capital 416,7 329,3 .... 746,0Net operating surplus -123,4 705,4 - 582,0
Output 4.559,8 5.484,3 324,9 10.368,9 of which EP services 4.559,8 5.484,3 324,9 10.368,9 non market 631,6 - 324,9 956,5 market 3.928,1 5.484,3 - 9.412,4Sales 3.928,1 5.484,3 - 9.412,4Implicit subsidies 123,4 - - 123,4GFCF and land 184,8 3.338,1 246,3 3.769,2Capital grants received .... .... .... .... (*) Only ancillary producers. Only Corporations. Row "GFCF and land" includes only end-of-pipe investments.
Specialised producers
General Government
Characteristic producers
Non specialised
producers (*)
Total
Corporations
Istat – National Accounts 30

The Italian EPEA for wastewater and waste managementYear 1997
(million eurolire - current prices)
Table B1: Supply and use table for characteristic services
Wastewater and waste management Non market Market Ancillary Total
USESFinal consumption 631,6 3.867,2 - 4.498,9Intermediate consumption - 6.284,3 324,9 6.609,1 of which specialised producers - 1.159,3 - 1.159,3Capital formation - - - -
Total uses 631,6 10.151,5 324,9 11.108,0
SUPPLYCorporations - 5.484,3 324,9 5.809,2General Government 631,6 3.928,1 - 4.559,8VAT - 379,1 - 379,1Taxes on products other than VAT - 360,0 - 360,0
Total supply 631,6 10.151,5 324,9 11.108,0
Environmental protection services
Istat – National Accounts 31
The Italian EPEA for wastewater and waste managementYear 1997
(million eurolire - current prices)
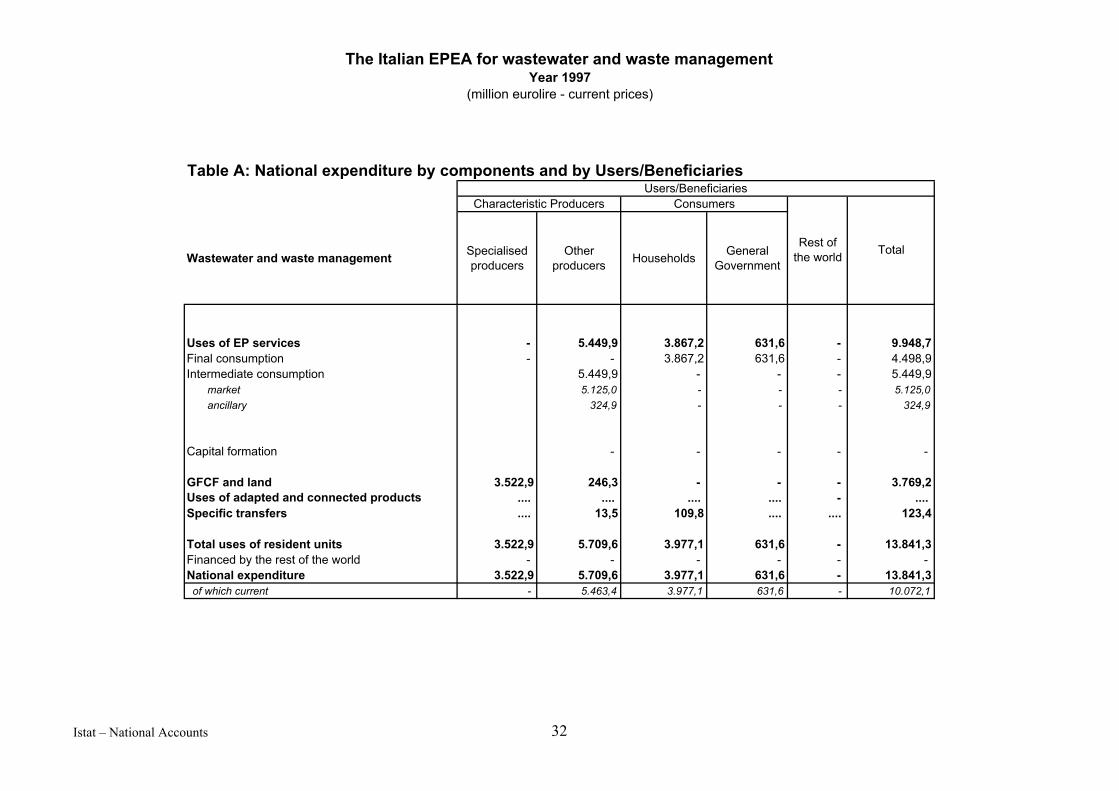
Table A: National expenditure by components and by Users/Beneficiaries
Wastewater and waste management Specialised producers
Other producers Households General
Government
Uses of EP services - 5.449,9 3.867,2 631,6 - 9.948,7Final consumption - - 3.867,2 631,6 - 4.498,9Intermediate consumption 5.449,9 - - - 5.449,9 market 5.125,0 - - - 5.125,0 ancillary 324,9 - - - 324,9
Capital formation - - - - -
GFCF and land 3.522,9 246,3 - - - 3.769,2Uses of adapted and connected products .... .... .... .... - .... Specific transfers .... 13,5 109,8 .... .... 123,4
Total uses of resident units 3.522,9 5.709,6 3.977,1 631,6 - 13.841,3Financed by the rest of the world - - - - - - National expenditure 3.522,9 5.709,6 3.977,1 631,6 - 13.841,3 of which current - 5.463,4 3.977,1 631,6 - 10.072,1
Users/BeneficiariesCharacteristic Producers Consumers
Rest of the world Total
Istat – National Accounts 32
The Italian EPEA for wastewater and waste managementYear 1997
(million eurolire - current prices)
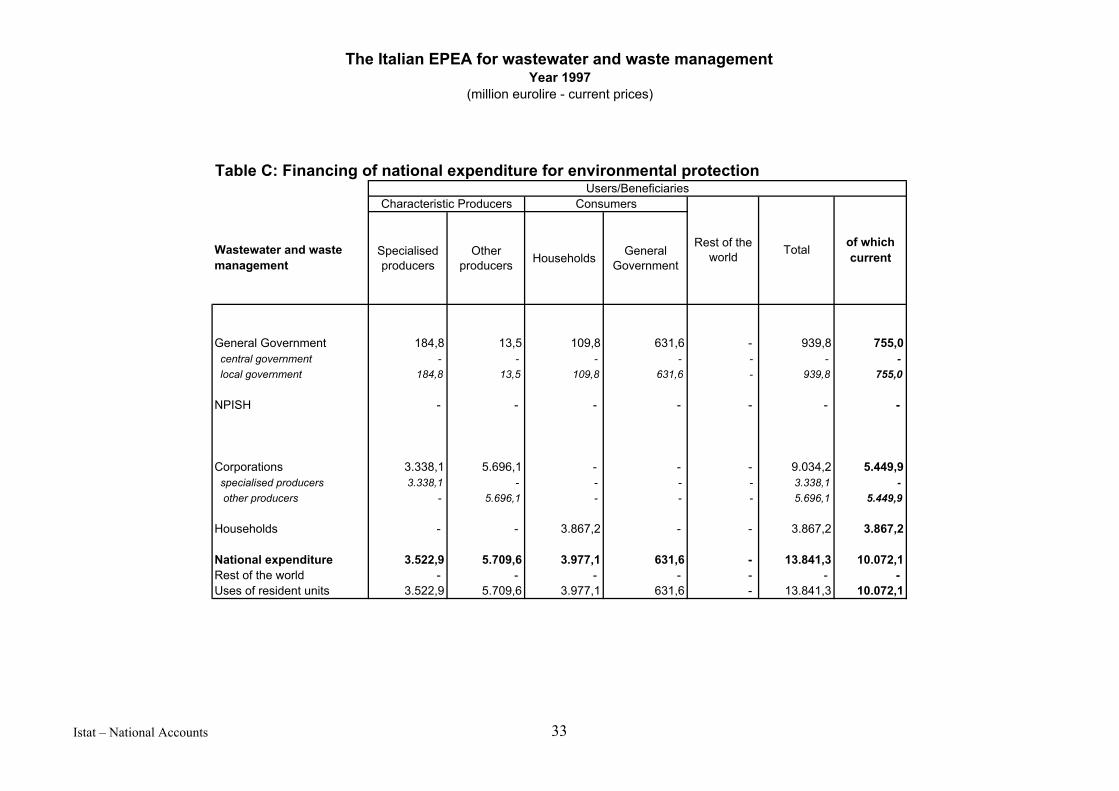
Table C: Financing of national expenditure for environmental protection
Specialised producers
Other producers Households General
Government
General Government 184,8 13,5 109,8 631,6 - 939,8 755,0 central government - - - - - - - local government 184,8 13,5 109,8 631,6 - 939,8 755,0
NPISH - - - - - - -
Corporations 3.338,1 5.696,1 - - - 9.034,2 5.449,9 specialised producers 3.338,1 - - - - 3.338,1 - other producers - 5.696,1 - - - 5.696,1 5.449,9
Households - - 3.867,2 - - 3.867,2 3.867,2
National expenditure 3.522,9 5.709,6 3.977,1 631,6 - 13.841,3 10.072,1Rest of the world - - - - - - - Uses of resident units 3.522,9 5.709,6 3.977,1 631,6 - 13.841,3 10.072,1
of which current
Characteristic Producers Consumers
Rest of the world Total
Users/Beneficiaries
Wastewater and waste management
Istat – National Accounts 33

The Italian EPEA for wastewater and waste managementYear 1997
(million eurolire - current prices)
Table C1: Environment-related financial burden
Wastewater and waste managementSpecialised producers
Other producers
Financing of current national expenditure - 5.449,9 3.867,2 755,0 10.072,1
Interest on fixed capital 1.040,8 .... .... 865,4 1.906,2 Any other profit - .... .... - .... Net operating surplus 705,4 - - -123,4 582,0
Non-deductible VAT on current expenditure - - - -379,1 -379,1 Taxes on production -34,1 -34,1
Net cost of environmental protection 335,5 5.449,9 3.867,2 1.330,5 10.983,0
Environmental taxes .... .... .... .... -
Total environmental related burden 335,5 5.449,9 3.867,2 1.330,5 10.983,0
TotalCorporations Households, including NPISHs
General Government
Sectors
Istat – National Accounts 34

The first Italian EPEA for waste and wastewater management
Istat – National Accounts 35
5. The way forward
The EPEA statistical process and related products The first Italian EPEA described here represents the basis for further developments in the next future. These developments mainly concern:
− the “EPEA statistical process” (Eurostat, 2002a, ch.6) and
− the products that can be realised.
The first application of the EPEA for Italy allowed us to understand how to develop a permanent statistical process leading to a regular production of the EPEA for the wastewater and waste management domains. Such process can be developed thanks to the fact that the methodology applied exploits mainly basic information produced on a regular basis. Only in the case of data on ancillary EP activities and investments collected through the last Intermediate Census on Industries and Services (see § 3) the information used in the pilot application was “una-tantum”; nevertheless, further information is supposed to be available in the next future (see below “Improving basic data”).
In the short-medium run the development of a regular statistical process will lead to a number of possible results, such as:
− the improvement of the estimations produced with the first Italian EPEA,
− the production of a first time series of the EPEA for the wastewater and waste management domains.
As a side-effect, the development of a regular EPEA statistical process is supposed to have also a positive impact on some related national accounts data, helping their improvement.
Improving basic data
In the next few years, availability of basic data is supposed to improve substantially, mainly thanks to:
− the implementation of the NACE Rev.1.1,
− the regular collection of information on EP current expenditures and investments of corporations, through the annual surveys on business accounts.
The NACE Rev.1.1 breaks down the division 90 into three classes (4-digits):
− collection and treatment of sewage;
− collection and treatment of other waste;
− sanitation, remediation and similar activities.
This break down is very close to the national sub-division (5-digits) of the NACE 90 division, currently used in Italy. As described above (§ 3), a key step of the methodology applied for the Italian EPEA was aimed at breaking down by national sub-

The first Italian EPEA for waste and wastewater management
Istat – National Accounts 36
category the PGI account originally available for the division 90 as a whole (2-digits); this breaking down process was made by means of other statistical information available at level of national sub-category (5-digits). The implementation of the NACE Rev.1.1 is supposed to substantially simplify the production of the EPEA for the wastewater and waste management domains and to improve the quality of the estimations.
From the reference year 2001 the annual surveys on business economic accounts9 will include a set of questions specifically devoted to EP current expenditures and investments. These questions are very close to those submitted to corporations through the last Intermediate Census on Industries and Services; also integrated investments will be covered by the annual surveys. This information, once available, will allow us:
− to produce on a regular basis the EPEA part concerning the ancillary producers,
− to enlarge the scope in terms of variables covered (including integrated investments),
− to improve the quality of the estimations.
Linking expenditure and physical data Integrating monetary and physical data is one of the main features of satellite accounts and is a key issue in the EPEA data use, e.g. for assessing the application of the “polluter pays principle” (Eurostat, 1994, §§ 1039-1041).
As far as the Italian EPEA is concerned, the basic information currently available is supposed to allow linking EPEA monetary data and physical data on environmental pressures in the field of waste management. Further analysis is needed, however.
Extension of the scope Further studies are necessary in order to extend the scope of the EPEA for the wastewater and waste management sectors. The following should be covered in particular:
− secondary producers (e.g. belonging to NACE 37 division),
− the uses of adapted and connected products.
In the future the construction of the EPEA should also be extended to the other CEPA classes.
In general, the expected improvement of basic information (see above) will allow the extension of the scope of the Italian EPEA, in terms of some key-variables (e.g. integrated investments of ancillary producers).
9 Two separated surveys are carried out yearly, one for SMEs and one for large companies.

The first Italian EPEA for waste and wastewater management
Istat – National Accounts 37
6. References
Eurostat (1994), SERIEE – 1994 Version, Luxembourg.
Eurostat (2002a), SERIEE Environmental Protection Expenditure Accounts – Compilation Guide, Luxembourg.
Eurostat (2002b), Worked examples for 2002 SERIEE Compilation Guide, http://europa.eu.int/comm/eurostat, Luxembourg.
Eurostat (2002c), Environmental Protection Expenditure Accounts - Results of pilot applications, Luxembourg.
Istat (1991), Classificazione delle attività economiche, Metodi e Norme, Serie C - n. 11, Roma.