italy - encyclopedia britannica · endum that prime minister matteo renzi billed ... emilia-romagna...
TRANSCRIPT

DemographyPopulation (2016): 60,815,000.Density (2016): persons per sq mi 522.7,persons per sq km 201.8.
Sex distribution (2015): male 48.21%;female 51.79%.
Population projection: (2020) 60,754,000;(2030) 60,102,000.
Major cities/urban agglomerations(20163/2011): Rome 2,864,731(3,298,000); Milan 1,345,851(2,909,000); Naples 974,074 (2,373,000);Turin 890,529 (1,613,000); Palermo 674,435 (915,000); Genoa586,655; Bologna 386,663; Florence 382,808; Bari 326,344; Catania314,555; Venice 263,352; Verona 258,765; Messina 238,439; Padua
210,401; Trieste 204,420; Taranto 201,100; Brescia 196,480; Parma 192,836; Prato 191,150; Modena184,973; Reggio di Calabria 183,035; Perugia 166,134; Livorno 159,219; Ravenna 159,116.
Households. Average household size (2012) 2.3; composition of households (2001): 1 person 24.9%, 2persons 27.1%, 3 persons 21.6%, 4 persons 19.0%, 5 or more persons 7.4%. Family households (2001):21,810,676, of which couple with children 41.5%, single family 24.9%, couple without children 20.8%,mother with children 7.3%, father with children 1.6%.
Immigration (20083): resident foreigners 3,432,651.
On Dec. 4, 2016, Italy held a constitutional refer-endum that Prime Minister Matteo Renzi billedas an attempt to streamline the workings of gov-
ernment. Italy had had more than 60 governments sinceWorld War II, and Renzi’s proposed amendments wouldhave created a stronger and more stable central govern-ment but at the expense of the country’s regions. Renzipromised to resign if voters turned down his proposal, andthey did so overwhelmingly. Nearly 60% rejected the mea-sure, and the result was welcomed by the leading opposi-tion parties, the populist Five Star Movement and theanti-immigrant Northern League. As promised, Renzisubmitted his resignation, but he rejected calls for a snapelection. On December 12, Paolo Gentiloni replacedRenzi as prime minister.
Urban-rural (2014):
Italy
Official name: Repubblica Italiana (ItalianRepublic).
Form of government: republic with two legisla-tive houses (Senate [3221]; Chamber ofDeputies [630]).
Head of state: President Sergio Mattarella.Head of government: Prime Minister Paolo
Gentiloni.Capital: Rome.Official language: Italian.2Official religion: none.Monetary unit: euro (>); valuation (Sept. 1,2016) 1 U.S.$ = >0.89; 1 £ = >1.19.
Area and populationarea4 population area4 population
Regions 20163 Regions 20163
Provinces Capitals sq mi sq km estimate Provinces Capitals sq mi sq km estimate
Abruzzo (Abruzzi) L’Aquila 4,156 10,763 1,326,513Chieti Chieti 999 2,587 390,962L’Aquila L’Aquila 1,944 5,034 303,239Pescara Pescara 473 1,225 321,973Teramo Teramo 752 1,948 310,339
Basilicata Potenza 3,859 9,995 573,694Matera Matera 1,331 3,447 200,597Potenza Potenza 2,527 6,545 373,097
Calabria Catanzaro 5,823 15,081 1,970,521Catanzaro Catanzaro 924 2,392 363,057Cosenza Cosenza 2,568 6,650 714,400Crotone Crotone 662 1,716 174,712Reggio di Calabria Reggio di Calabria 1,229 3,183 555,836Vibo Valentia Vibo Valentia 440 1,139 162,516
Campania Naples 5,247 13,590 5,850,850Avellino Avellino 1,078 2,792 425,325Benevento Benevento 800 2,071 280,707Caserta Caserta 1,019 2,639 924,414Napoli Naples 452 1,171 3,113,898Salerno Salerno 1,900 4,922 1,106,506
Emilia-Romagna Bologna 8,539 22,117 4,448,146Bologna Bologna 1,429 3,702 1,005,831Ferrara Ferrara 1,016 2,632 351,436Forlì-Cesena Forlì 969 2,510 394,601Modena Modena 1,039 2,690 701,642Parma Parma 1,332 3,449 447,779Piacenza Piacenza 1,000 2,589 286,997Ravenna Ravenna 718 1,859 391,525Reggio nell’Emilia Reggio nell’Emilia 885 2,292 532,872Rimini Rimini 154 400 335,463
Lazio Rome 6,655 17,236 5,888,472Frosinone Frosinone 1,251 3,239 495,026Latina Latina 869 2,251 574,226Rieti Rieti 1,061 2,749 158,467Roma Rome 2,066 5,352 4,340,474Viterbo Viterbo 1,395 3,612 320,279
Liguria Genoa 2,093 5,422 1,571,053Genova Genoa 709 1,836 854,099Imperia Imperia 446 1,155 215,244La Spezia La Spezia 341 882 221,003Savona Savona 596 1,545 280,707
Lombardy Milan 9,213 23,863 10,008,349Bergamo Bergamo 1,051 2,722 1,108,298Brescia Brescia 1,846 4,782 1,264,105Como Como 497 1,288 599,654Cremona Cremona 684 1,771 360,444Lecco Lecco 315 816 339,254Lodi Lodi 302 783 229,413Mantova Mantova 903 2,339 412,868Milano Milan 610 1,579 3,208,509Monza and Brianza … 156 405 866,076Pavia Pavia 1,145 2,965 547,926Sondrio Sondrio 1,240 3,212 181,712Varese Varese 463 1,199 890,090
Marche Ancona 3,743 9,694 1,543,752Ancona Ancona 749 1,940 476,192Ascoli Piceno Ascoli Piceno 474 1,227 210,066Fermo … 332 860 175,625Macerata Macerata 1,071 2,774 320,308Pesaro e Urbino Pesaro 1,117 2,892 361,561
© 2017 Encyclopædia Britannica, Inc.
World DataE N C Y C L O P Æ D I A
Britannica
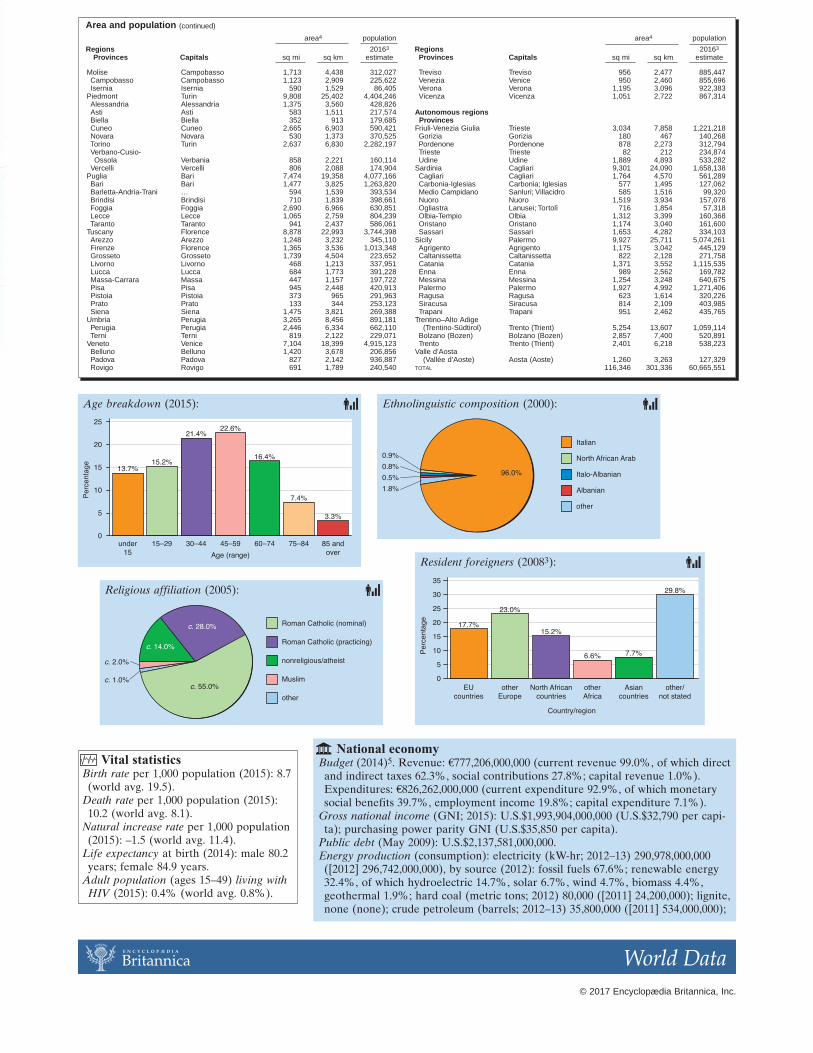
National economyBudget (2014)5. Revenue: >777,206,000,000 (current revenue 99.0%, of which direct
and indirect taxes 62.3%, social contributions 27.8%; capital revenue 1.0%).Expenditures: >826,262,000,000 (current expenditure 92.9%, of which monetarysocial benefits 39.7%, employment income 19.8%; capital expenditure 7.1%).
Gross national income (GNI; 2015): U.S.$1,993,904,000,000 (U.S.$32,790 per capi-ta); purchasing power parity GNI (U.S.$35,850 per capita).
Public debt (May 2009): U.S.$2,137,581,000,000.Energy production (consumption): electricity (kW-hr; 2012–13) 290,978,000,000
([2012] 296,742,000,000), by source (2012): fossil fuels 67.6%; renewable energy32.4%, of which hydroelectric 14.7%, solar 6.7%, wind 4.7%, biomass 4.4%,geothermal 1.9%; hard coal (metric tons; 2012) 80,000 ([2011] 24,200,000); lignite,none (none); crude petroleum (barrels; 2012–13) 35,800,000 ([2011] 534,000,000);
Vital statisticsBirth rate per 1,000 population (2015): 8.7
(world avg. 19.5).Death rate per 1,000 population (2015):10.2 (world avg. 8.1).
Natural increase rate per 1,000 population(2015): –1.5 (world avg. 11.4).
Life expectancy at birth (2014): male 80.2years; female 84.9 years.
Adult population (ages 15–49) living withHIV (2015): 0.4% (world avg. 0.8%).
Age breakdown (2015): Ethnolinguistic composition (2000):
Religious affiliation (2005):
Resident foreigners (20083):
Area and population (continued)
area4 population area4 population
Regions 20163 Regions 20163
Provinces Capitals sq mi sq km estimate Provinces Capitals sq mi sq km estimate
Molise Campobasso 1,713 4,438 312,027Campobasso Campobasso 1,123 2,909 225,622Isernia Isernia 590 1,529 86,405
Piedmont Turin 9,808 25,402 4,404,246Alessandria Alessandria 1,375 3,560 428,826Asti Asti 583 1,511 217,574Biella Biella 352 913 179,685Cuneo Cuneo 2,665 6,903 590,421Novara Novara 530 1,373 370,525Torino Turin 2,637 6,830 2,282,197Verbano-Cusio-Ossola Verbania 858 2,221 160,114
Vercelli Vercelli 806 2,088 174,904Puglia Bari 7,474 19,358 4,077,166Bari Bari 1,477 3,825 1,263,820Barletta-Andria-Trani … 594 1,539 393,534Brindisi Brindisi 710 1,839 398,661Foggia Foggia 2,690 6,966 630,851Lecce Lecce 1,065 2,759 804,239Taranto Taranto 941 2,437 586,061
Tuscany Florence 8,878 22,993 3,744,398Arezzo Arezzo 1,248 3,232 345,110Firenze Florence 1,365 3,536 1,013,348Grosseto Grosseto 1,739 4,504 223,652Livorno Livorno 468 1,213 337,951Lucca Lucca 684 1,773 391,228Massa-Carrara Massa 447 1,157 197,722Pisa Pisa 945 2,448 420,913Pistoia Pistoia 373 965 291,963Prato Prato 133 344 253,123Siena Siena 1,475 3,821 269,388
Umbria Perugia 3,265 8,456 891,181Perugia Perugia 2,446 6,334 662,110Terni Terni 819 2,122 229,071
Veneto Venice 7,104 18,399 4,915,123Belluno Belluno 1,420 3,678 206,856Padova Padova 827 2,142 936,887Rovigo Rovigo 691 1,789 240,540
Treviso Treviso 956 2,477 885,447Venezia Venice 950 2,460 855,696Verona Verona 1,195 3,096 922,383Vicenza Vicenza 1,051 2,722 867,314
Autonomous regionsProvinces
Friuli-Venezia Giulia Trieste 3,034 7,858 1,221,218Gorizia Gorizia 180 467 140,268Pordenone Pordenone 878 2,273 312,794Trieste Trieste 82 212 234,874Udine Udine 1,889 4,893 533,282
Sardinia Cagliari 9,301 24,090 1,658,138Cagliari Cagliari 1,764 4,570 561,289Carbonia-Iglesias Carbonia; Iglesias 577 1,495 127,062Medio Campidano Sanluri; Villacidro 585 1,516 99,320Nuoro Nuoro 1,519 3,934 157,078Ogliastra Lanusei; Tortolì 716 1,854 57,318Olbia-Tempio Olbia 1,312 3,399 160,368Oristano Oristano 1,174 3,040 161,600Sassari Sassari 1,653 4,282 334,103
Sicily Palermo 9,927 25,711 5,074,261Agrigento Agrigento 1,175 3,042 445,129Caltanissetta Caltanissetta 822 2,128 271,758Catania Catania 1,371 3,552 1,115,535Enna Enna 989 2,562 169,782Messina Messina 1,254 3,248 640,675Palermo Palermo 1,927 4,992 1,271,406Ragusa Ragusa 623 1,614 320,226Siracusa Siracusa 814 2,109 403,985Trapani Trapani 951 2,462 435,765
Trentino–Alto Adige(Trentino-Südtirol) Trento (Trient) 5,254 13,607 1,059,114
Bolzano (Bozen) Bolzano (Bozen) 2,857 7,400 520,891Trento Trento (Trient) 2,401 6,218 538,223
Valle d’Aosta(Vallée d’Aoste) Aosta (Aoste) 1,260 3,263 127,329
TOTAL 116,346 301,336 60,665,551
© 2017 Encyclopædia Britannica, Inc.
World DataE N C Y C L O P Æ D I A
Britannica

National economy (continued)petroleum products (metric tons; 2012) 84,850,000 ([2011]57,582,000); natural gas (cu m; 2014) 7,149,000,000(61,910,000,000).
Production (metric tons except as noted). Agriculture, forestry,fishing (2013): grapes 8,010,364, wheat 7,312,025, tomatoes4,932,463, olives 2,940,545, apples 2,216,963, sugar beets2,159,381, oranges 1,708,337, peaches and nectarines1,401,795, potatoes 1,272,211, mushrooms and truffles792,000, pears 743,029, tangerines, mandarins, clementines,and satsumas 650,465, pumpkins, squash, and gourds 530,000; livestock (number of live animals; 2014) 8,676,100 pigs,7,166,020 sheep, 6,125,423 cattle, 500,000 beehives; roundwood (2014) 7,744,470 cu m, of which fuelwood 70%; fisheries pro-duction (2014) 343,374 (from aquaculture 47%). Mining and quarrying (2014): feldspar 4,700,000 (world rank: 2); limestone24,706,000; pozzolana 4,000,000; gypsum 2,994,000; alabaster 2,912,000; marble and travertine 2,819,000; granite 1,160,000.Manufacturing (value added in U.S.$’000,000; 2009): fabricated metal products 36,442; food products 24,675; general pur-pose machinery 21,087; paints, soaps, pharmaceuticals 17,600; transportation equipment 17,071; special purpose machinery16,322; bricks, cement, and ceramics 11,571; glass products 9,668; electrical equipment 9,096; textiles 8,957; furniture 7,986;base metals 7,702; wearing apparel 7,691; precision and scientific equipment 6,304; footwear and leather products 6,072.
Population economically active (2015): total 26,450,000; partic-ipation rates (2014): age 15 and above, male 58.7%; female40.1%; unemployed (2014) 12.7%, of which youth (ages15–24) 42.7%.
Land use as % of total land area (2011): in temporary crops14.5%, left fallow 1.9%, in permanent crops 8.6%, in pas-ture 15.7%, forest area 31.4%.
Foreign trade11, 12, 13
Imports (2013): >359,454,000,000 (chemicals and artificialfibres 15.4%, metals and metal products 9.8%, computersand electrical apparatus 9.8%, crude petroleum 9.7%, trans-port equipment 8.2%, food, beverages, and tobacco 7.8%). Major import sources:
Exports (2013): >389,854,000,000 (machinery and apparatus18.4%, metals and metal products 11.7%, chemicals andartificial fibres 11.6%, wearing apparel 11.5%, transportequipment 9.5%, computers and electrical apparatus 8.3%). Major export destinations:
Education and healthLiteracy (2015): total population age 15 and over literate,99.2%; males literate 99.4%; females literate 99.0%.
Health (2011): physicians 248,723 (1 per 239 persons); hos-pital beds 207,947 (1 per 286 persons); infant mortalityrate per 1,000 live births (2012) 3.2; undernourished pop-ulation (2006–08) less than 5% of total population.
Transport and communicationsTransport. Railroads (2012): route length (2015) 10,403mi, 16,742 km; passenger-km 46,759,000,000; metricton-km cargo 20,244,000,000. Roads: total length(2015) 111,240 mi, 179,024 km (paved 100%); passen-ger-km (2006) 795,700,000,00014; metric ton-km cargo(2007) 179,411,000,000. Vehicles (20113): passengercars 35,871,854; trucks and buses 4,655,314.
1Includes 7 nonelective seats (5 presidential appointees and 2 former presidents serv-ing ex officio). 2In addition, German is locally official in the region of Trentino–AltoAdige and French is locally official in the region of Valle d’Aosta. 3January 1. 4Regionareas are based on an end-of-2002 survey; province areas are based on an older surveyand therefore may not sum to the region area. 5According to the general governmentbudget; for Italy this is the central government budget and some of the local govern-ment budget. 6Does not include 3,113,000 job seekers. 7Taxes less subsidies. 8Detaildoes not add to total given because of rounding. 9End of year. 10Yearly average.11Imports c.i.f.; exports f.o.b. 12Includes San Marino and Vatican City. 13Provisional.14Passenger cars 693,000,000,000; buses 102,700,000,000. 15Subscribers.
Internet resources for further information:• National Institute of Statistics www.istat.it/en• Bank of Italy www.bancaditalia.it
MilitaryTotal active duty personnel (November 2015): 174,500
(army 58.6%, navy 17.4%, air force 24.0%); para-military 182,350; U.S. military forces 11,360. Militaryexpenditure as percentage of GDP (2015): 1.2%; percapita expenditure U.S.$348.
Financial aggregates2006 2007 2008 2009 2010 2011
Exchange rate, > per9:U.S. dollar 0.76 0.68 0.72 0.69 0.75 0.77£ 1.49 1.36 1.05 1.12 1.17 1.19SDR 1.14 1.07 1.11 1.09 1.15 1.19
Interest and pricesCentral bank discount (%) … … … … … …Govt. bond yield (%) 4.05 4.49 4.68 4.31 4.04 5.42Share prices10
(2005 = 100) 115.7 127.0 88.1 63.0 66.9 61.1
Communications units unitsnumber per 1,000 number per 1,000
Medium date in ’000s persons Medium date in ’000s persons
TelephonesCellular 2015 92,52015 1,51315
Landline 2015 20,236 331
Internet users 2009 29,236 488Broadband 2015 14,54915 23815
Structure of gross domestic product and labour force2013
in value % of total labour % of labour>’000,000 value force6 force6
Agriculture, forestry, fishing 33,699 2.1 883,500 3.6Mining and quarrying 5,145 0.3 23,700 0.1Manufacturing 216,520 13.4 3,990,100 16.4Construction 76,390 4.7 1,614,600 6.6Public utilities 40,954 2.5 282,800 1.2Transportation andcommunications 138,533 8.6 1,695,900 7.0
Trade, hotels 213,810 13.2 4,969,900 20.4Finance, real estate 422,871 26.1 3,689,400 15.2Public administration, defense 101,746 6.3 1,300,300 5.3
Services 207,134 12.8 5,853,900 24.2Other 162,1017 10.07 … …TOTAL 1,618,9048 100.0 24,304,100 100.0
© 2017 Encyclopædia Britannica, Inc.
World DataE N C Y C L O P Æ D I A
Britannica