italy eu-27 eu-27 cotton and products annual annual report gain publications... · ·...
TRANSCRIPT
Required Report - public distribution
Date: 5/12/2009
GAIN Report Number: GR9003
Italy EU-27
EU-27 COTTON AND PRODUCTS ANNUAL
Annual Report
Approved By:
Prepared By:
Stamatis Sekliziotis
Report Highlights:
Cotton acreage and production in Europe (mainly in Greece, Spain & Bulgaria) shows a downward trend since the implementation of CAP Reform in 2006. Total land use utilized for cotton has gradually changed to other irrigated agricultural uses, mostly corn, durum & soft wheat, energy plants and forage crops. EU’s cotton lint imports & exports, utilization and stocks show significant decline since MY 2007/2008. Mill use is also reduced and is projected sharply down in 2009/2010 with a number of spinning plants closing down. Drop of consumption of yarn, textiles, cloth and apparel is directly connected to lack of credit and the weak spending capacity. Economic recession has also resulted in shopping habit changes of European consumers who buy less. Weakening of demand since late 2007, in most EU member states, have depressed prices and required numerous businesses in the cotton products chain, to either change their marketing plans or close. High production cost coefficients in the EU are not compared to those in China, Far East and Eastern Europe. A few signs of recovery are reported in consumption trends during the second quarter of 2009, but it is too early to be seen.
Executive Summary:
This report presents the outlook for Cotton and Products in the EU-27. The data in this report is based on the

views of Foreign Agricultural Analysts in the EU and is not official USDA data.
This report was only possible through the assistance, input and knowledge of:
Sabine Lieberz, FAS Bonn
Sandro Perini, FAS Rome
Elena Mouzakiti, FAS Athens
Mila Boshnakova, FAS Sophia
Marta Guerrero, FAS Madrid
Xavier Audran, FAS Paris
Steve Knight, FAS London
In this report, "Cotton and Products" include only Cotton Lint and Value-added products (cotton yarn and fabric).
Commodities:
Cotton
Production:
Area and Production
Cotton in EU-27 is cultivated only in Greece, Spain and about 700 hectares in Bulgaria. Portugal no
longer grows cotton.
The cotton acreage in Europe is currently estimated at 303,000 Ha for the 2009 planting season
compared to 333,000 Ha a year earlier. Certainly a decline is observed due to the decoupling of cotton
payments implemented in 2006 under the new CAP reform. Starting in 2006, the EU has declared the
decoupled payment as a non-trade-distorting (green box) support, while the area payment is declared to
be a less trade-distorting (blue box) support. Greece, the largest cotton producer in the EU, expect to
plant at most only 250,000 Ha in 2009, down 11% from 2008 and 30% from 2005. In Spain a 15%
acreage decline is observed since 2007. For Bulgaria a 55% drop of cotton acreage is reported since
2005.
Attached PSD for Cotton (EU-27) is subject to further changes in early summer 2009 after the end of
sowing season. Reports from the field talk about late sowings and delays in germination, while sharp
increase of temperatures has killed young plants (known as “melting of young plants”). The scale of this
damage cannot currently be quantified, but certainly does not apply on a national scale. Planting season
normally starts at the end of April and continues through mid May, provided that fields are not wet. This
season, heavy & frequent rains have been experienced and fields are very wet. Some re-plantings may
be necessary later in May if wet fields persist. Final acreage harvested is closely correlated to the final
area planted (including replanting) and weather conditions during sowing and germination. Wet

conditions coupled with bad seed and cultivation practices will certainly affect harvested acreage, yields
and quality.
Cotton lint amounts in attached PSD are expressed in bales (480 lbs), one bale = 226.8 kg of lint. For
Greece, the following rates are used when conversions are made:
Cotton Lint yield = 34% (national weighted average) of total Seed Cotton delivered to ginneries (it is
calculated by the GOG Min Ag based on yields reported by 85 ginneries around the country)
Cottonseed yield = 55% (national weighted average) of total Seed Cotton delivered to above ginneries
The remaining 11% is moisture and wastes
For Spain: the rates are reported at 32%, 54% and 14% respectively.
Cotton is cultivated on some of the best agricultural land. Main competing crops are cereals, particularly
durum and soft wheat. Corn, sunflower and forage crops are also competing with cotton in a number of
regions. Over 95% of cotton production is irrigated. In Greece there are approximately 70,000 farmers
involved in cotton farming concentrated in Thessaly, Central Macedonia, Viotia and Thrace. Andalucía
accounts for over 90% of Spanish cotton production with about 8,000 farmers involved.
Cotton lint production shows a drop by 26.5 percent in the past three years at a European level. Under
the single payment system for cotton agreed to in 2006 under the new CAP, farmers are not required to
deliver product to ginners. As a result, yields have declined. Farmers decided to reduce variable costs
such as seed, fuel, fertilizers, irrigation, and pesticides. In Greece, 30 percent of the available land in
2008 was planted to cotton only for the subsidy and a similar phenomenon is expected in 2009.
The decoupling of cotton payments since 2006 has resulted in a decline of cotton plantings in Spain and
Greece as the crop payment set for cotton was not high enough to make cotton cultivation profitable.
Farmer Prices
Table 1: Raw cotton prices paid to farmers
Spain* Market Year
2007/2008 2008/2009 2009/2010
Price (Euros/ 100kg)
32.73 29.50 -
Greece* Market Year
2007/2008 2008/2009 2009/2010
Price (Euros/ 100kg) (for seed
cotton delivered to the gin)
38.00–44.00 According to quality grade
26.00-36.00 According to quality grade
-
* Industry & Farm Coop sources
Organic Cotton Production
The first cultivation of organic cotton in Europe begun in 1993 in the Greek region of Thrace, supervised
by
“Thrace Cotton Ginning Mills” which was the first plant certified under the International Environmental M
anagement System ISO 14000. The cultivation was conducted in accordance with Regulation 2078/92 o
f the
European Union. Style makers in the EU and the United States, being the leaders in innovation are
welcoming eco-friendly materials.
A new trend is experienced since 2005 when such fashion shows started taking place. Spinners report t
hat the demand for organic fibres, although still scarce and expensive, can grow, but with not only few d
enim
millers around the world feeling that such investments in organic cotton are now “ill-timed”.
Reportedly, a yield of over 2,000 kg/Ha and a good price for organic cotton which should be in the
neighborhood of 0.47-0.49 €/kg (seed cotton basis) are key factors which make organic cotton farming
to stay viable. Currently only a few hectares (about 200-250 Ha) are cultivated with organic cotton in
Europe. Following the new CAP Reform effective since January 2006 enough number of cotton farmers
would gradually, but steadily, shift to organic product if properly informed, trained and certified. An
additional support of 600 Euros/Ha is paid to cotton organic farmers.
A few acres of brown cotton are also cultivated in Thrace- Greece on experimental basis (about 25 Ha)
under the supervision of GOG National Foundation of Ag Research (NAGREF) yielding about 1,800
Kg/Ha. Raw brown cotton farm gate price is reported between 0.53–0.55 Euros/kg.
Consumption:
Trade & Consumption
The Economy
Currently, Europe is suffering a deep and widespread recession affecting all sectors of the economy including the fibre and textile sectors, except probably the food sector due to its immunity. It is estimated that unemployment in the 16 countries that use the euro currency will rise to a postwar record of 11.5 percent by the end of 2010. Since January 2009 exports of high valued European goods are plummeting while business and consumer confidence hit the bottom. If EU Commission’s expectations expressed in early May 2009 for lower inflation and lower interest rates become true for the euro-zone in the next quarters and through 2010, such a development may help support the economy by giving people more money to spend. However, the main hope for growth is EU’s export pick-up in 2010 as household demand and business spending is expected to remain weak and prolonged.
According to EU’s economy Official Joaquin Almunia, recent surveys for euro-zone and German confidence "appear to confirm that Europe’s economy is no longer in free fall and is expected to start bottoming out in the middle of this year as the fiscal stimulus measures, the bank rescue plans and the monetary easing are expected to start bearing fruit in the next quarters."

EU-27 cotton production represents only 2 percent of global output world lint consumption. Demand from European mills continues to be depressed. The ongoing global recession has greatly affected the demand for clothing and thereby of cotton.
Cotton Lint Consumption & Trade
(HS Codes: 5201, 5202 & 5203)
EU trade in cotton is completely free, with no import duties or import quotas and no export subsidies are paid. The EU is a net importer of cotton. In the international market for ginned cotton, EU-27 is considered as a small trading country accounting for around 2.5 percent of world imports in 2007 (5.8% in 2007), with China, Thailand, Turkey, S. Korea, Mexico & Taiwan being the main import markets. Beside the negative trade balance, the EU has increased its self-sufficiency rate from 25 percent in 1990 -92 to 52 percent in 2000-02 and to 90 percent in 2007-08, but dropped again to 82 percent in 2008/09 marketing season due to reduced domestic cotton production. Lack of EU-27’s self-sufficiency in cotton lint was the argument of European cotton farmers who resisted the new CAP reform for the cotton sector as implemented since 2006.
Cotton lint transactions in MY2008/09 have considerably delayed due to reduced demand, with April’s ex-factory European price fluctuating between 0.52 – 0.53 $ US/lb according to quality grade (prices reported are on lint basis for Greek cotton). These price levels are considered competitive compared to lower price levels in February and March 2009 of 0.45-0.47 $ US/lb. Market studies predictions for an increase of stocks and for a global reduction of consumption by 1.2% compared to last year, do not seem - for the time being - to apply for the EU-27 where lint imports, exports, consumption and stocks all show a much higher significant drop. In MYs 2008/09, 09/10, 10/11 it is expected that EU lint usage will be covered from existing stocks and just necessary but reduced imports.
Reportedly, some transactions started taking place in late April 2009 for EU cotton lint. Traditional buyers of EU cotton, mainly EU’s neighbors Turkey and Egypt, have purchased the first amounts from Greece of 5,000 MT and 2,000 MT respectively. EU member countries are the leading export markets for Turkish cotton yarn and fabric, while Turkey is the leading export market of EU’s cotton lint (see also GAIN Annual Report No TU9017 on Turkey’s Cotton and Products). Turkey’s lower output and high demand for cotton will result to a desirable reduction of Greece’s stocks which in April 2009 are estimated at over 80,000 MT (353,000 Bales 480 lb).
In CY2008, EU-27 has imported 43,165 MT of lint valued at 33.8 million USD compared to 46,008 MT in CY2007, a drop by 6.5%. Main suppliers of cotton lint are Turkey, U.S., Kazakhstan, Pakistan and Uzbekistan (detailed trade matrices by “quantity and value” are available in Global Trade Atlas, at: http://www.gtis.com/gta/ ). About 20% of EU-27 imports are destined to Italy, followed by France 10% and Germany with 9.5%.
EU-27 lint exports for the same period were 11,832 MT valued at 23.7 million USD, compared to 19,309 MT a year earlier. Main buyers are Turkey and Egypt.
Cotton trade developments in 2009 and 2010 will certainly depend on the global economic situation and its stabilization progress, with very few sources in the industry being optimistic that 2009 will be the start of a visible turnaround. Greek ginners express a restrained optimism, owing to a traditional and constant demand from Turkey and Egypt in the past 15 years.
Cotton Yarn & Fabrics consumption and Trade
(HS Codes: 5204, 5205, 5206, and 5207 & HS Codes: 5208 – 5212)
Most sources talk for Europe’s cotton consumption down by 6% in 2009 due to lower economic growth and tightening credit availability to mills. Recession affected all European member states in the course of MY2008/2009, hit by the global slowdown as of late 2008. Productivity growth indicators vary from state to state. In most MS growth rates seem to loose two thirds of their value.

Under the impact of the global recession, demand for clothing in EU countries has dramatically slowed down in the past few months also adversely affecting export based apparel industries in Asia and Far East. European retailers drastically slashed orders, while a significant shrinkage of retail sales in Europe is observed. The falling of growth indicators has correspondingly negative ramifications for employment, consumption and finances.
The primary element worrying the European industry regards access to credit which affects all firms in the chain. The most critical issues facing the industry relate to the current credit policies, with an increase in the spread requested by banks on credit to businesses, and a demand for greater guarantees in providing credit.
An equally significant negative element is fear generated through the supply chain. Retail trade association sources report that recession has “terrified” European Consumers resulting to a “negative psychology” witch plays key role in spending. Small companies are the hardest hit as demand for clothes and accessories falls. Europe’s clothing retailers report a 10-30% drop of sales depending on the market (for Greece a constant drop estimated between 30-35% is reported since late 2008), believe hat decline in consumption is connected to psychology as the main cause, with consumer’s weak purchasing power equally following. It is crucial that “fear” throughout the chain has affected designers, wholesale buyers, investors, spinners and dyers. The big concerns remain to be lack of orders, lack of credit from the bottom to the top of the business chain and uncertainty. From the side of the consumer, fear and cost are the concerns.
Clothing consumption is reported to develop especially bad in the EU since January 2009, according to several surveys. Rising unemployment is depressing retail sales in largest Member States.
In CY 2008, EU-27 has purchased 211.7 million M2 (260.64 million M2 in 2007) of cotton fabrics valued at 252.9 million USD. The largest proportion has originated in China, Pakistan, India and Turkey followed by Indonesia and Thailand (detailed trade matrices by “quantity and value” are available in Global Trade Atlas, at: http://www.gtis.com/gta/ ). EU -27 exports for the same year are at 63.3 million M2 (67.8 million M2 in 2007) valued at 276.2 million USD (242.0 million USD in 2007). Amount wise, imported cotton fabrics into EU-27 in 2008 exceed exports by 334.5% but value wise EU-27 exports exceed imports by 9.2%. Compared to a year earlier, EU-27 imports in 2008 showed a drop by 18.6% and exports by 6.6%.
After China, the EU-27 is the world’s second largest exporter of textile products with 33.7 billion Euros worth of products exported in 2007 (all kinds of, mostly high quality textiles, clothing of high fashion design products). Barriers to European exports and growing counterfeiting in foreign markets are damaging EU textile industry. Over 25% of the clothes bought in Italy are fakes, according to reports published by consumers associations.
EU relevant legislation is implemented by customs authorities to combat counterfeit. An EU regulation (No 1383/2003) that entered into force on 1 July 2004 (see IP/03/1059), as implemented by regulations No 1891/2004/EC and No 1172/2007, are designed to improve the detection of counterfeit goods.
European Union produce less than 5% of world’s cotton yarn supplies, almost equivalent to the amount produced in Turkey, only. EU Member states with yarn production are Italy, Germany, Austria, Belgium, Denmark, Finland, France, Ireland, Netherlands and Greece. Operation costs differ from country to country with the key ones being capital, power costs, and labor costs. Massive and cheaper yarn product purchases from China and Far East coupled with lack of credit and high operational costs in Europe have resulted in closing down of a number of EU spinning plants. In CY 2008, EU-27 has purchased 34,360 MT of cotton yarns valued at 81.0 million USD, slightly less compared to 34,696 MT of a year earlier valued at 126.48 million USD. EU-27 yarn exports are limited to about 2,900 MT/annum in the past three years with a downward trend. Main origins are India, Turkey, Pakistan Uzbekistan, Syria & Egypt

(detailed trade matrices by “quantity and value” are available in Global Trade Atlas, at: http://www.gtis.com/gta/ )
Sales information of U.S. Pima Cotton lint and Products in the EU and to certain member states (i.e. pima cotton-rich towels) and of Cotton cloth ranges, are provided by CCI, in: http://www.cottonusa.org/events/Europe.cfm?sn.ItemNumber=1069
Major European Markets
Germany
There is no domestic raw cotton production in Germany. The country, therefore, depends on imported cotton and cotton products for its textile and apparel industry.
Tough competition from low cost producing countries has forced Germany's textile and apparel industry to move production facilities to countries in Eastern Europe and Asia. Cotton spinning and weaving companies have also followed this relocation trend, albeit with a certain time lag. These factors have led to a decline in domestic use and an overall decrease in raw cotton imports. The profitability of the domestic textile sector is mostly limited to niche markets and technical uses.
In MY 2007/08, German imports of raw cotton totaled 60,529 MT, about 17,000 MT or 22 percent less than the previous season. The top two suppliers of raw cotton to the German market in MY 2007/08 were Kazakhstan and Uzbekistan, with 18 percent and 17 percent of the market share, respectively. They were followed by Greece, Israel, and Sudan with 8.4, 8.1, and 7.7 percent market share. The United States ranked sixth with 4,133 MT and a market share of 6.8 percent.
Although raw cotton imports to Germany are decreasing, it is still important for the U.S. cotton sector to maintain its presence in this valuable market. Marketing efforts should be targeted to consumers and retail establishments to highlight the use of U.S. cotton in finished products rather than promoting raw cotton use in the declining spinning and weaving sectors.
The value of total turnover of the German textile industry (includes yarn and fabric, excludes apparel) amounted to 11.1 billion Euro (U.S. $ 7.5 billion) in CY 2008, a drop of 5 percent compared to CY 2007. The turnover of apparels amounted to 8 billion Euro (U.S. $ 5.45 billion), a drop of 4 percent. Data for the export share of the turnover in 2008 is not yet available. In 2007, 44 percent of textile turnover and 39 percent of apparel turnover were generated through exports.
The current financial crisis has hit the German textile industry hard. This affects domestic demand and exports. After years of continuing increases, exports of textiles and apparel have been declining since August 2008. In the first two months of 2009, orders have plummeted further. The German textile industry reports that it has received 30 percent lower orders in January and February of 2009 than in the same period of 2008, for the apparel industry orders have declined by 37 percent.
Despite a decreasing expenditure in clothing, Germany is the largest apparel market in Europe. It is also the largest European Union importer and represents the biggest mail-order market in the EU with 46.3 per cent focused on apparel.
Vertical chains are replacing independent small enterprises and competition continues to come from foreign retailers. Classical distinctions between industry and trade are no longer as clear-cut as they previously were. Factory outlet centres and shop-in-shop systems are becoming increasingly powerful and undermining the traditional role of specialised retail traders. An increasing volume of textiles is being sold by discounters, drugstores, supermarkets and retail chains such as coffee-shops who are now offering a wide range of other items including clothing and apparel. Similar developments are reported in other EU Member states in a smaller scale.
For Germany’s Trade shows visit:
http://www.biztradeshows.com/germany/germany-tradeshows.mp?industry=textiles-fabrics
France
Spending fell nearly 15% from a year earlier. France is the second-largest trading nation in the EU in textiles and apparel (after Germany).
Due to uncompetitive cost of production, the French textile industry has been steadily declining for the past decade. Altogether, the French textile sector gather 730 companies, employs 58,000 workers for total sales (2007 figures) of 9.9 billion €.
The yarn and fabric sector gathers 294 companies, 50 percent fewer than in 2000, for sales of 3.6 billion €. The economic slowdown of 2008/2009 is likely to deeply impact the sector, with textile sales down by more than 18 % in the last quarter of 2008. Yarn and fabric production were even further down, by more than 25 percent. Initial data show an even sharper decline for the first quarter of 2009.
According to textile experts, only the smallest and most flexible yarn and fabric companies, who can respond quickly to small sized orders, or the one who produce technical fabric for specific uses (military fabric, chemical protecting fabric, etc…) can survive in France. The largest French yarn and fabric companies are Albany International, Hexcel Reinforcement, Michel Thierry SA and DMC Tissues.
Showing the demise of the French yarn industry, French imports of raw cotton were 40 percent down in 2008 from 2007, and 80 percent down from their 2005 level. The bulk of French cotton imports continue to come from Kazakhstan, Tajikistan and Uzbekistan.
According to survey reports French consumers are becoming more receptive to American fashions and styles. U.S. exports of raw cotton to France are almost negligible. U.S. fashion, mostly sportswear and casual wear, remains very popular in France. Most U.S. textile brands are selling well. However, most items sold under U.S. owned brands are manufactured in low production-cost countries such as Mexico and Latin America, Asia (mainly China) and Eastern Europe. No information is available on the share of U.S. cotton, yarns and fabric used to manufacture those clothing items.
The main French and European Textile Trade shows are:
Première Vision : 60 000 visitors : www.premierevision.fr
Texworld: 15,500 visitors, www.texworld.messefrankfurt.com
Lingerie: 450 brands www.lingerie-paris.com
Mode City : 18 500 visitors http://www.mode-city.com/
Tissu premier : 10 000 visitors www.tissu-premier.com
Intersélection : 9 000 visitors www.interselection.net
Expofil : 200 exhibitors, 7000 visitors www.expofil.com
UK:
A £8.8 billion value clothing market has been the engine of the UK clothing market over the past decade. Growth has slowed down significantly over the past year and there have been several casualties among the smaller operators as costs rise and debt levels became unsustainable. Retailers experience a sharp drop in comparable retail sales reporting their first losses in five years. Also, consumers' attitudes change drastically and competition is increasing as mainstream retailers increase their use of outlets and online channels to dispose of marked down stock at bargain prices. Most reports conclude that this is dampening growth through the UK’s traditional value clothing sector.

Personal consumption expenditure in UK (year over a year %) is reported at 1.5%, 1.5%, -0.5%, -2.0%, and -1.0% for the I, II, III, IV 2008 Quarters and in 1
st Quarter of 2009 respectively. Expenditure on non
durable goods reported at -1.5%, -2.5%, -6.0%, -10% and -8.0% for the same quarters, compared to those of 2007.
Although the UK remains a very large consumer market, with an abundance of retail brands selling apparel and home textiles, few upstream textile manufacturers remain. In the face of competition from lower cost countries (lower labor costs, lower overheads and access to cheaper raw materials), especially in Asia, the UK’s textile industry has largely moved overseas.
With regards retail textile sales, it is interesting to note that while these had been tracking down in line with the financial downturn, official UK Government data for March 2009 showed the sales volume for textile, clothing and footwear rise by 8.4 per cent as compared to a year earlier which must be related to a slight improvement in personal consumption expenditure observed after the forth quarter in 2008. Whether this is a reverse in trend or not, yet has to be seen.
For UK’s Embroidery, Textile and Apparel shows, visit:
http://embroidery.embroiderersguild.com/whatson.php (from May 2009 – November 2009)
www.clotheshowlive.com (NEC Birmingham UK, 2-9 December 2009)
http://www.ite-exhibitions.com/fashion/ (Fashion, Clothing and Textile events)
http://www.texere.u-net.dk/exhibs.html (including more events in other European countries)
http://www.bvents.com/events.aspx?se=1&con=united-kingdom&can=textile-industry
(Yarn & Clothing Exhibitions and Apparel accessories in UK and other countries data base of events)
Italy
The slowing down, which had started to appear at the end of 2007 in the Italian textile/fashion sector, has been gradually worsening during 2008, especially after September, coinciding with the world economic crisis. The value of total turnover of the Italian textile industry (including yarns and fabric, excluding apparel) totaled in 2008 11.9 billion Euros, or 5.3 percent lower than in 2007. Exports of yarns totaled in 2008 some 865 million Euros (-18%), while imports were 801 million (-12%). As a result of the above trends, the trade surplus for yarns has been negligible, and there are expectations for a trade deficit in the near future. Exports of fabrics in 2008 were 5.5 billion Euros (-8%) and imports 1.9 billion (-7%). Italy therefore remained in 2008 a net exporter by over 3.5 billion Euros, but well below the 4.5 billion reported in 2004. Preliminary reports from the first months of 2009 indicate a further drop of the textile demand, from both the domestic and export market.
For Fashion Shows and Textile Exhibitions in Italy, visit:
http://www.bvents.com/events.aspx?se=1&con=italy&can=fashion
(Also, additional information on shows & events is provided by product)
Policy:
Agricultural Policy
Implementation procedure of new CAP Reform for the cotton sector
For Spain, in 2009/2010, a new scheme will replace the current support arrangement which was
annulled by the European Court of Justice. Subsequently, the crop specific payment for cotton has risen
from 1,039 Euros/ha (for a National Guaranteed Area of 70,000 ha) to 1,400 Euros/ha (for a National
Guaranteed Area –NGA- of 48,000 ha). In response to this increased aid, a recovery of acreage planted
to cotton is probable. The expansion of area cultivated could exceed the NGA, resulting in a reduction in
the coupled payment. For MY 2009/2010 water availability is guaranteed. From MY 2009/2010 it is
required to deliver cotton to a ginning plant. Due to these factors, yields are expected to increase, along
with production. Following annulment of the previous cotton scheme, for MY 2009/2010 the budget for
Spain’s cotton crop remains unchanged. The coupled aid has increased in value, but less acreage can
benefit from this payment. The budget under Article 69 payment remains the same, although the value
of this payment for farmers will depend on total cotton acreage.
For Greece, the area guaranteed is set at 250,000 Hectares according to EU Regulation No 637/2008.
The budget for Greece’s cotton is reduced by only 0.5 percent for the MY 2009/2010 compared to a year
earlier but guaranteed acreage is reduced by 32.5 percent. Article 69 payments to ginners do not apply
for Greece.
EU relevant regulation requires cotton farmers to use exclusively certified cotton seed for planting (EU
Regulation No 1782/2003 as amended by EU Regulation No 637/2008 to be implemented in the
MY2009/2010). GOG Ministry of agriculture does not always comply with EU regulations and recently
has published a Ministerial decision allowing farmers to use only 10 kg/Ha of certified seed instead of 15
kg/Ha required in the 2008 planting season. Min Ag and farmer sources report that the decision is made
in the framework of GOG’s measures to reduce input costs but has raised strong protests from the side
of certified seed traders complaining for further reduction of their sales. The measure became the cause
of using huge amounts of non certified cotton seed by farmers, of known cotton varieties (mostly of US
and Australian rights) to supplement the planting seed amount needed per area unit. Reportedly, certain
Ginners and Greek Coops illegally resell these seed varieties (with the approval of GOG Min Ag) acting
against the interests of seed importers.
The same GOG Min Ag Ministerial Decision (in Article 5) for the 2009/2010 cotton season, sets the
average cotton yield production per cultivation zone reduced by -30%. According to trade sources, such
actions violate the relevant EU Regulation according to which “the amount of the single payment is set at
805, 6 Euro/Ha for a national threshold acreage set at 250,000 Ha, while farmers become eligible of the
payment provided that they have harvested cotton equal or higher to the average yield per area unit set
for their cultivation zone (municipality)”. The average production per zone is a number that represents all
farmers (good and bad) and also all fields in a certain region (either a fertile zone or not). Thus,
decreasing this average by 30% it is not useful because the average yields per zone are already very
low and will not force the farmer to grow the crop properly. Moreover, the lower the yield the higher the
possibilities for non professional cotton farmers in getting access to the EU subsidies. In Greece,
professional farmers, using high quality seed and modern management practices can get up to 4,000 –
4,500 Kg/Ha of seed cotton, in some regions over 5,000 Kg/Ha with excellent quality grading.

The Tables 2 & 3 below summarize the EU policy for cotton for the periods 2008/2009 and 2009/2010 in
the framework of the EU CAP relevant regulations cited.
Table 2: Cotton policy (Spain)
Concept MY 2008/2009 MY 2009/2010
National Guaranteed area (ha) 70.000 48.000
Coupled payment 1,039 €/Ha. 1,400 €/Ha.
Budget for coupled payment 72,730,000 € 67,200,000 €
Budget for Article 69 aid 13,430,000 € 13,430,000 €
National envelope for ginners restructuring process and machinery contractors
- 6,134,000 €
Table 3: Cotton policy (Greece)
Concept MY 2008/2009 MY 2009/2010
National Guaranteed area (ha) 370,000 250,000
Coupled payment 594 €/Ha for 300,000 and 342.85€/Ha on 70,000 Ha
805.0 €/Ha
Budget for coupled payment 202,200,00 € 201,250,000 €
Budget for Article 69 aid NA NA
National envelope for ginners restructuring process and machinery contractors
NA
Restructuring process
In April 2009, the EU Commission has approved a proposal for a Council regulation amending EU
Regulation No 637/2008 as regards the national restructuring programs for the cotton sector. The
proposal will offer the possibility to Member States to present their restructuring programs for a period of
8 years (2010-2017).
For Spain, in the past and before the cotton coupled payment system was enforced, acreage cultivated
to cotton resulted to an output of over 300,000 tons (seed cotton basis). Following the reform, production
levels declined by 80%. In the framework of the restructuring proposal it is expected that ginning
capacity will also decline in order to adapt to lower production levels. If the regulation regarding
restructuring process is implemented before harvest (October 2009), within the MY 2009/2010 23
ginning plants are expected to close. The abandoned factories could benefit from 6 million Euros per
year over a period of 8 years. A remaining 123,000 Euros per year would be granted to cotton
machinery contractors within the

8-year period.
Table 4: Number of ginners in Spain
Market Year Total Working Temporally Closed
Dismantled under restructuring process
2006/2007 28 28 - -
2007/2008 28 24 4
2008/2009 28 20 8
2009/2010* 5 23
*Industry estimates
Table 5: Number of ginners in Greece
Market Year Total Working Temporally Closed
Dismantled under restructuring process
2006/2007 75 65 10 NA
2007/2008 75 60 15 NA
2008/2009 75 60 15 NA
2009/2010* 70 55 15 NA
*Source: Trade and Ginning industry
For Greece, currently there are no similar restructuring funds for ginners. According to the new EU
Proposal for the sector, it is expected that an amount of 4 million Euros will be paid between 2010 and
2013. The number of ginning plants involved in cotton ginning differs each year, depending on prevailing
conditions in the market. Under the old CAP, the number of enterprises which received subsidies for
cotton ginning for the 2002 - 2003 period stood at about 60, including certain unions of agricultural
cooperatives who own cotton gin factories.
Cotton ginning plants are located close to their suppliers, due to the sensitive nature of raw material and
cost of transport. Most cotton ginning plants are concentrated in Macedonia & Thrace (34, 6%),
Thessaly (29, 6%) and in Mainland Greece (25, 9%).
The supply of ginned cotton is fragmented, since even the largest enterprises cover only a small part of
domestic production. Most production units are involved in intense export activity, selling their products
to foreign markets. Some of the largest enterprises belong to Greek spinning and textile groups,
undertaking to supply them with raw materials or even have vertically integrated production activity
themselves. Most of ginning plant complexes are in the vegetable oil and feed meal business as well.
There are cases in Greece where a group of 15 and of 5 ginneries belong to one firm which also happen
to own spinning mills and vegetable fat and feed meal production units. Due to lower cotton output,
ginning plants operate for a shorter period, in some cases for only one month while spinners have
reduced operation time by 30% and others to only 4 days/week.

Under the new proposal for restructuring it is reported that ginning plants temporarily closed in the period
2005 - 2006 in the EU, can establish rights for financial support.
For Further reading (on restructuring) visit:
http://www.europarl.europa.eu/sides/getDoc.do?type=REPORT&reference=A6-2009-
0200&language=EN
The future of the Crop under the new CAP and after 2013
According to ginners and trade enterprises directly connected to cotton production, it is strongly believed
that the CAP reform that entered into force on 1 January 2006 led to a drastic fall in cotton production in
Greece and Spain that has seriously jeopardized the sector's survival, resulting in the immediate
restructuring and re-orientation of the industry. Greek farmer population growing cotton from 77,000 in
2003 dropped down to 50,000 today.
There are two schools of thought in Greece on the future of the cotton Crop and more or less similar
thoughts are reported from Spain as well.
The one side is against cotton crop production, considering it as totally unnecessary for Europe, costly,
high water & chemical consuming crop and using fertile lands which could be used by alternative crops
(for food, feed and/or bioethanol production). With this side are the environmental groups, part of the
farming community and grower unions who are not interested on cotton production but mainly on EU
cotton subsidies.
On the opposite side are the ginners, spinners, lint exporters, labor unions, animal feed producers, and a
large percent of good cotton growers who prefer to continue with high yields and well demanded quality
cotton lint production. Others, who support the crop, are enterprises relevant to cotton, like agricultural
Input suppliers (seeds, chemicals, machinery, etc). Considering the ideal climatic conditions around the
Mediterranean basin, Ag Economists and businesses believe that European cotton and byproducts can
basically continue to be a profitable activity, provided that cotton quality will be connected to price. Same
sources emphasize that under a quality vs. price system, no administrative measures will be needed,
less and better varieties will be utilized, high quality inputs will be used and better crop management
methods will have to be practiced, while cotton lint yield can easily reach 38 percent. Cotton ginners in
Greece are desperately looking for a homogeneous raw product to process.
As a consequence, cotton lint and marketing support can be held in EU soil but cloth making can be
transferred to Balkan countries such as Albania, FYROM, Bulgaria, and other new or candidate EU
member states, since high quality of raw material coupled with lower labor cost can help for competitive
end product making.
Tariffs, regulations and customs
The EU has a harmonized trade system. Common Customs Tariff (CCT) is applicable to goods from
non-EU countries. Most duties are ad valorem (%), based on the GATT Valuation Code (approximate
CIF value). Before shipping any goods to Europe, a written customs duty ruling from the local customs
service should be obtained. These rulings are called European Binding Tariff Information (EBTI). Getting
an EBTI is free and will prevent any conflict over customs or excise duty.
By the expiration of the Multi Fiber Agreement on January 1, 2005, quotas were eliminated on textile
exports from low labour-cost countries. Thus, for consignments of textiles and apparel imported into the
EU certificates of origin is not any more a requirement.
Import duty ranges from 6.9 per cent to 13.8 per cent depending on the type of product. An import
turnover tax, similar to the Value Added Tax levied on domestically produced goods, of 19 per cent
applies.
For further information on import duties visit:
http://ec.europa.eu/taxation_customs/dds/tarhome_en.htm
Industry standards:
Compliance with EU regulations and standards is strongly recommended. The latest standards can be
found on the EU website: http://europa.eu/index_en.htm.
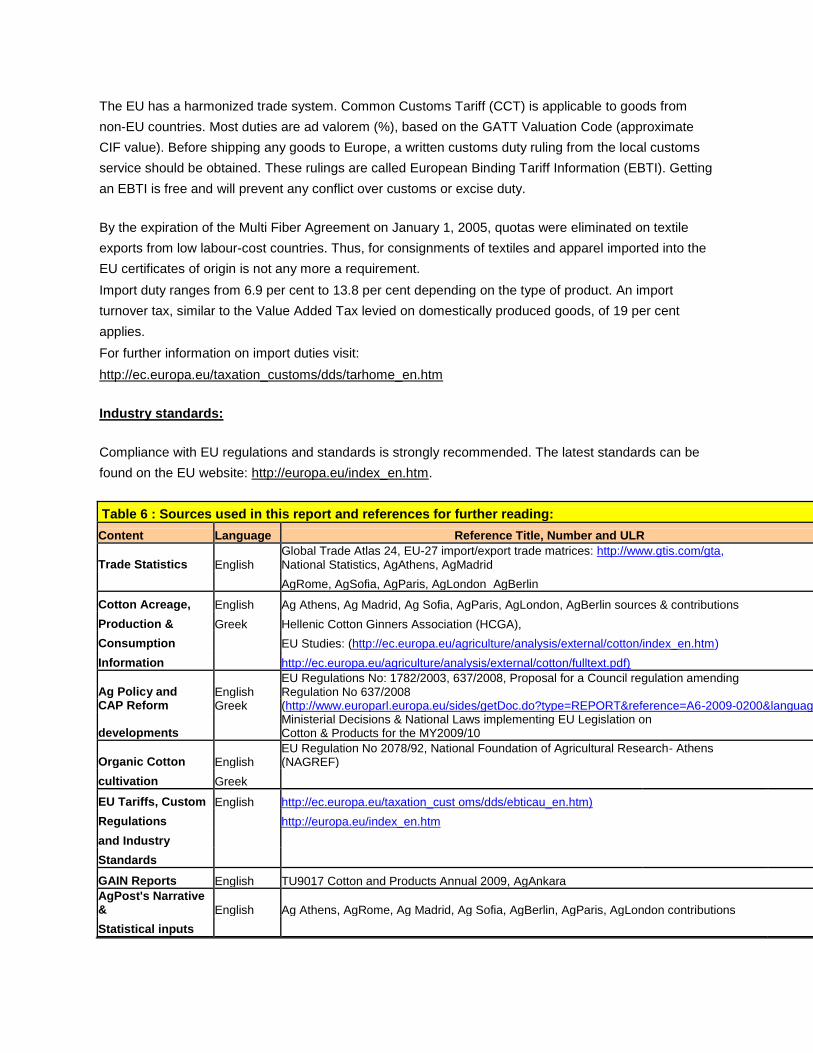
Table 6 : Sources used in this report and references for further reading:
Content Language Reference Title, Number and ULR
Trade Statistics English Global Trade Atlas 24, EU-27 import/export trade matrices: http://www.gtis.com/gta, National Statistics, AgAthens, AgMadrid
AgRome, AgSofia, AgParis, AgLondon AgBerlin
Cotton Acreage, English Ag Athens, Ag Madrid, Ag Sofia, AgParis, AgLondon, AgBerlin sources & contributions
Production & Greek Hellenic Cotton Ginners Association (HCGA),
Consumption EU Studies: (http://ec.europa.eu/agriculture/analysis/external/cotton/index_en.htm)
Information http://ec.europa.eu/agriculture/analysis/external/cotton/fulltext.pdf)
Ag Policy and English EU Regulations No: 1782/2003, 637/2008, Proposal for a Council regulation amending Regulation No 637/2008
CAP Reform Greek (http://www.europarl.europa.eu/sides/getDoc.do?type=REPORT&reference=A6-2009-0200&language=EN)
developments Ministerial Decisions & National Laws implementing EU Legislation on Cotton & Products for the MY2009/10
Organic Cotton English EU Regulation No 2078/92, National Foundation of Agricultural Research- Athens (NAGREF)
cultivation Greek
EU Tariffs, Custom English http://ec.europa.eu/taxation_cust oms/dds/ebticau_en.htm)
Regulations http://europa.eu/index_en.htm
and Industry
Standards
GAIN Reports English TU9017 Cotton and Products Annual 2009, AgAnkara AgPost's Narrative & English Ag Athens, AgRome, Ag Madrid, Ag Sofia, AgBerlin, AgParis, AgLondon contributions
Statistical inputs
EU Cotton websites Greek http://www.agrotypos.gr/
http://www.cotton-net.gr/
Lint, Yarn & Cotton Fabrics Greek
(Greek Spinning & Textile Industry) : http://www.thrakika.gr/en/news/eu/ http://www.fibre2fashion.com/ http://www.unctad.org/ http://www.cottonusa.org/
Industry English Cotton and Product updates and articles
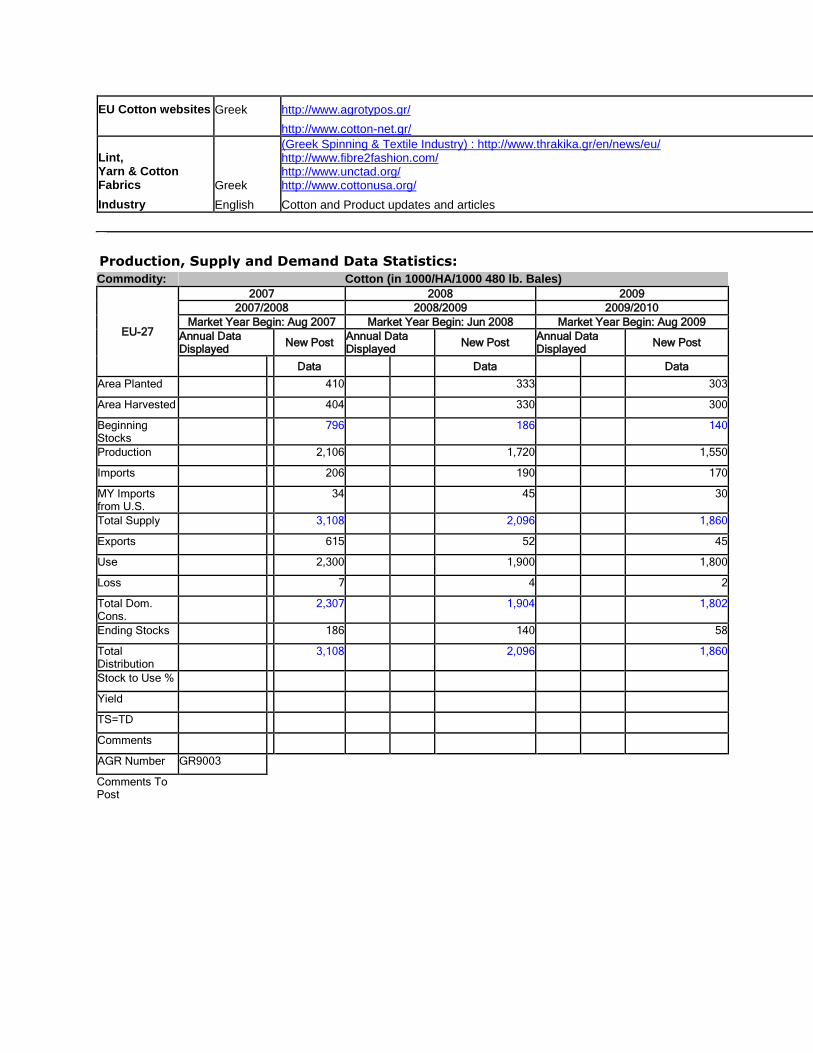
Production, Supply and Demand Data Statistics:
Commodity: Cotton (in 1000/HA/1000 480 lb. Bales)
EU-27
2007 2008 2009 2007/2008 2008/2009 2009/2010
Market Year Begin: Aug 2007 Market Year Begin: Jun 2008 Market Year Begin: Aug 2009 Annual Data Displayed New Post Annual Data
Displayed New Post Annual Data Displayed New Post
Data Data Data Area Planted 410 333 303
Area Harvested 404 330 300
Beginning Stocks 796 186 140
Production 2,106 1,720 1,550
Imports 206 190 170
MY Imports from U.S. 34 45 30
Total Supply 3,108 2,096 1,860
Exports 615 52 45
Use 2,300 1,900 1,800
Loss 7 4 2
Total Dom. Cons. 2,307 1,904 1,802
Ending Stocks 186 140 58
Total Distribution 3,108 2,096 1,860
Stock to Use % Yield TS=TD Comments AGR Number GR9003 Comments To Post