italy in the world - italian - companies world · saladini, stefania spingola, pjero stanojevic...
TRANSCRIPT


ITALY IN THE WORLDECONOMYREPORT 2016-2017SUMMARY
The Report was prepared by a working group of the ICE’s Office for Strategic Planning and Management Control.
General Coordinator Riccardo Landi
Research Coordinator Lelio Iapadre
Editorial CommitteeFabrizio Onida (Chair), Simona Camerano, Giancarlo Corò, Luca De Benedictis, Vincenzo De Luca, Sergio De Nardis, Silvia Fabiani, Giorgia Giovannetti, Anna Giunti, Lelio Iapadre, Alessandra Lanza, Stefano Menghinello, Roberto Monducci, Marco Simoni, Lucia Tajoli, Alessandro Terzulli and Francesco Tilli
The text was prepared by:Cristina Castelli, Raffaele Di Pietro, Giulio Giangaspero, Gabriele Iannotta, Antonio Lembo, Rita Anabella Maroni, Elena Mazzeo, Marco Saladini, Stefania Spingola, Pjero Stanojevic and, for Chapter 7, Mariaconcetta Giorgi, Fabio Giorgio and Andrea Scano (Ministry for Economic Development), Paola Chiappetta, Davide Colombo, Marco Leone, Giulio Mignacca, Federico Mozzi and Lucia Pasqualini (Ministry for Foreign Affairs and International Cooperation), Rita Arcese, Pamela Clavoni and Giulia Pavese (Conference of Regions and Autonomous Provinces), Alessandro Melini (Cassa Depositi e Prestiti), Fabiola Carosini and Veronica Quinto (Simest), and Ivano Gioia and Stefano Gorissen (Sace)
Executive SummaryGiorgia Giovannetti and Lelio Iapadre. Translation from Italian by Daniel Harry Dichter
ContributorsMariarosaria Agostino, Teresa Barp, Marco Bellandi, Carlo Boselli, Sara Calligaris, Serena Maria Campanelli, Rita Cappariello, Maria Serena Causo, Rossana Ciraolo, Claudio Colacurcio, Nicola D. Coniglio, Stefano Costa, Marco De Angelis, Gabi Dei Ottati, Massimo Del Gatto, Silvia Fabiani, Stefano Federico, Alberto Felettigh, Luciano Fratocchi, Anna Giunta, Maria Giuffrida, Fadi Hassan, Donatella Iaricci, Raffaele Lagravinese, Alessandra Lanza, Giovanni Mastronardi, Stefano Menghinello, Stefano Micossi, Mirella Morrone, Marco Mutinelli, Alessandra Nurra, Gianmarco I.P. Ottaviano, Dejan Pejcic, Fabio Pizzino, Alberto Franco Pozzolo, Renan Sacilotto, Sergio Salamone, Federico Salusti, Domenico Scalera, Fabiano Schivardi, Fabio Sforzi, Lorenzo Soriani, Davide Suverato, Lucia Tajoli, Gianluigi Toschi, Francesco Trivieri, Adele Vendetti, Claudio Vicarelli, Gianfranco Viesti, Davide Vurchio and Davide Zurlo
Thanks are also offered to the following for their collaboration:Silvio Bevilacqua, Fabrizio Bubola, Rosa Buonocore, Fabrizio Camastra, Pier Alberto Cucino, Giorgia Evangelisti, Giuseppe Federico, Vincenzo Lioi, Rita Marinelli, Roberta Mosca, Dalila Parisi, Alessia Proietti, Pietro Turco and Paolo Sannini
Data-processing assistanceFrancesco Salierno, RetItalia Internazionale S.p.A.
In the Report reference is also made to the data published in the Istat-ICE Statistical Yearbook Commercio estero e attività internazionali delle imprese - Edizione 2017.
The production of the Report was made possible by the contribution of the National Institute for Statistics (Istat) and the Bank of Italy.
The Report was drafted on the basis of data available at 1 July 2017.
The opinions expressed in the Report are attributable to the authors and do not necessarily reflect those of the institutions with which they are affiliated.
ISBN 978-88-98597-11-6ISSN 22826858
The Report and updated statistics are available at www.ice.gov.it
Printed in August 2017 atMarchesi Grafiche Editoriali – Via Flaminia 995/99700189 Rome, ItalyTel: [+39] 06 332161www.marchesigrafiche.it

Report 2016 -17: Summary | Italy in the world economy 3
1. The global economic picture 5
2. Italy: an overview 12
3. Regions and main countries 15
4. Sectors 18
5. The territorial base 22
6. Firms 25
Focus: Digital commerce and the fourth industrial revolution 29
7. Policies for internationalization 32
Concluding remarks 34
STATISTICAL TABLES
WORLD AND EUROPEAN UNION
1.1 World trade and foreign direct investment 38
1.2 Regional shares of world merchandise exports 38
1.3 Regional shares of world merchandise imports 39
1.4 Top ten world merchandise exporters 40
1.5 Top ten world merchandise importers 41
1.6 Inward foreign direct investment: main recipient countries 42
1.7 Outward foreign direct investment: main investor countries 43
ITALY
2.1 Italy’s balance of payments 44
2.2 Italy’s trade in goods and services 45
2.3 Constant-market-shares analysis of Italy’s share of world exports 46
FROM INDUSTRIAL DISTRICTS TOTHE DIGITAL ECONOMY: ITALIAN FIRMS AND THE TRANSFORMATIONOF THE INTERNATIONAL MARKETS
CONTENTs
4 Report 2016 -17: Summary | Italy in the world economy
2.4 Italy’s foreign trade by region and main countries 47
2.5 Size of markets and Italian exports’ market shares 48
2.6 Top ten destination countries of Italian exports’ 49
2.7 Top ten countries of origin of Italian imports 49
2.8 Merchandise exports and imports by sector: values 50
2.9 Merchandise exports and imports by sector: volumes and prices 51
2.10 Italy’s market shares of merchandise exports by sector 52
2.11 Merchandise exports of the Italian regions 53
2.12 Internationalization of Italian firms 542.13 Percentage distribution of workers and sales revenues of Italian firms’ foreign affiliates by geographical region of investment and size class (number of workers) of the investor 542.14 Public support for internationalization: overview of promotional and financial services 55

Report 2016 -17: Summary | Italy in the world economy 5
FROM INDUsTRIAL DIsTRICTs TO THE DIGITAL ECONOMY: ITALIAN FIRMs AND THE TRANsFORMATION OF THE INTERNATIONAL MARKETs
The world economic recovery gathers strenght, led by the emerging economies
1. The global economic pictureInternational trade and investment
After a sharp slowdown in the early part of 2016, the world economy is showing more vibrant signs of recovery in 2017, with the International Monetary Fund (IMF) forecasting global GDP growth of 3.5 percent for the current year, although many factors of uncertainty persist in connection with developments on the economic policy front and tensions in international relations.
The emerging economies continue to be the chief engine of global growth. Their positive growth gap, which had narrowed considerably during the “great crisis” that began in 2008, has started to widen again in recent months. 2017 has brought signs of strengthening recovery in the United States and Japan, as well as in nearly all the main emerging and developing regions. An exception is China, where the rate of growth in economic activity, driven increasingly by domestic demand, though still rapid (6.6 percent forecast for 2017), is slowing. Another is the Middle East, where the prolonged slump of oil prices and mounting political instability are taking a toll. Brazil and Russia, instead, are pulling out of a long recession, while in India and Sub-Saharan Africa growth is gaining pace.
Chart 1 - Dollar prices of traded commodities and of advanced economies’ exports of manufacturesIndices, 2007=100
(1) Estimates and forecasts.
50
60
70
80
90
100
110
120
130
140
150
160
170
2007 2008 2009 2010 2011 2012 2013 2014 2015 2016(1) 2017(1) 2018(1)
Grafico 1.4 - Prezzi in dollari delle materie prime e delle esportazioni di manufatti delle economie avanzate Indici 2006=100
Energy Food and beverages Metals Manufactures
Fonte: elaborazioni Ice su dati Fmi
(1) Stime e previsioni.
Source: Based on IMF data

6 Report 2016 -17: Summary | Italy in the world economy
Commodity prices, which had fallen steeply in the last five years, are on the rise. This confirms the strengthening of the global recovery and improves the prospects for commodity-exporting countries. But while the rise in oil prices has derived at least in part from the production cutback decided by OPEC and other oil-producing countries, that in the prices of other commodities reflects the recovery of demand.
Chart 2 - Nominal effective exchange ratesIndices, 2007=100
40
60
80
100
120
140
160
2007 2008 2009 2010 2011 2012 2013 2014 2015 2016
Grafico 1.3 - Tassi di cambio effettivi nominali Indici 2007=100
Brazil China Euro Area Japan
Russian Federation United Kingdom United States
Source: Based on IMF data
Renminbi
U.S. dollar
Yen
Euro
Poundsterling
Real
Russianrouble
Source: Based on IMF data
In 2016 the euro, the dollar, after the US elections in November, and the yen, in the second half of the year, strengthened slightly in nominal effective terms. The pound sterling depreciated, instead, against both the euro and the dollar following the Brexit referendum.
In the absence of excessive balance-of-payments disequilibria, the recovery of the world economy, though modest, is expected to stimulate an acceleration in world trade to 3.8 percent growth in 2017, after the pronounced slowdown recorded in the past few years. This would still be weaker, however, than the trade growth rate that had characterized the most intense period of globalization, before the onset of the great crisis. The expansion of international production networks, which had supported the multiplication of trade in intermediate goods and services in the preceding decades,1 appears in fact to have run its course. In addition, trade liberalization policies have lost momentum; indeed, there are signs of a possible return to various forms of protectionism.
1 The box by C. Castelli and A. Maroni, Gli scambi internazionali di beni intermedi, in Chapter 1, underscores that intermediate products account for about half of world trade and shows that China’s role has changed in recent years, with a shift toward positions more upstream in global value chains.
Commodity prices are rising after a steep five-year decline
World trade is also recovering, but its growth is slower than in the past, especially in Asia, where production is geared more to serving swiftly expanding domestic demand

Report 2016 -17: Summary | Italy in the world economy 7
Chart 3 - World output and tradePercentage changes in volume
0
1
2
3
4
5
6
7
8
1991-2000 2001-2006 2007-2012 2013 2014 2015 2016(1) 2017(1) 2018(1)
Grafico 1.4 - Produzione e commercio mondiali Variazioni percentuali in volume
Gross domestic product (at market exchange rates) Trade in goods and services
Gross domestic product (average 2013-2016) Trade in goods and services (average 2013-2016)
(1) Stime e previsioni.
Fonte: elaborazioni Ice su dati Fmi
(1) Estimates and forecasts.
Source: Based on IMF data
The slowdown in trade is concentrated in the main Asian countries, China first and foremost, and appears to reveal a change in their development models,2 with production increasingly oriented toward domestic markets rendered more dynamic by the rise of a broad middle class. Moreover, as their industrial systems have grown increasingly complex, these countries are now better positioned to produce final and intermediate goods, as well as services, close to their outlet markets.
While trade volumes grew slightly for all the geo-economic regions, the dollar value of exports increased for the European Union and remained basically stable in the other regions, except for the decline recorded in largely commodity-exporting regions such as the Middle East and Africa. Imports grew slightly in both volume and value only in the European Union. In Asia and North America, an increase in volumes was coupled with a decline in values.
2 See the box by G. Giangaspero and E. Mazzeo, L’evoluzione recente delle importazioni cinesi, in Chapter 1, which demonstrates that a significant change in recent years concerns the gradual shifting of China’s development model from growth driven primarily by investment and exports to growth supported by consumption and by demand for services, i.e. by less trade-intensive components of demand.

8 Report 2016 -17: Summary | Italy in the world economy
Chart 4 - Merchandise exports and imports by region in 2016Percentage changes on 2015
-16
-14
-12
-10
-8
-6
-4
-2
0
2
4
European Union Africa Asia Middle East North America South and CentralAmerica
Grafico 1.7 - Esportazioni e importazioni di merci per area geografica nel 2016 Variazioni percentuali rispetto all'anno precedente
Exports - value in dollars Exports - volumeImports - value in dollars Imports - volumeAverage value of world exports and imports
Average volume of world exports and imports
Source: Based on WTO dataSource: Based on WTO data
Chart 5 - Inward foreign direct investmentFlows, billions of dollars
0
500
1,000
1.500
2,000
2,500
2004 2005 2006 2007 2008 2009 2010 2011 2012 2013 2014 2015 2016
Grafico 1.11 - Investimenti diretti esteri in entrata Flussi, valori in miliardi di dollari
Inward FDI Developed economies Developing economies Transition economies
Fonte: elaborazioni Ice su dati Unctad Source: Based on UNCTAD data
Report 2016 -17: Summary | Italy in the world economy 9
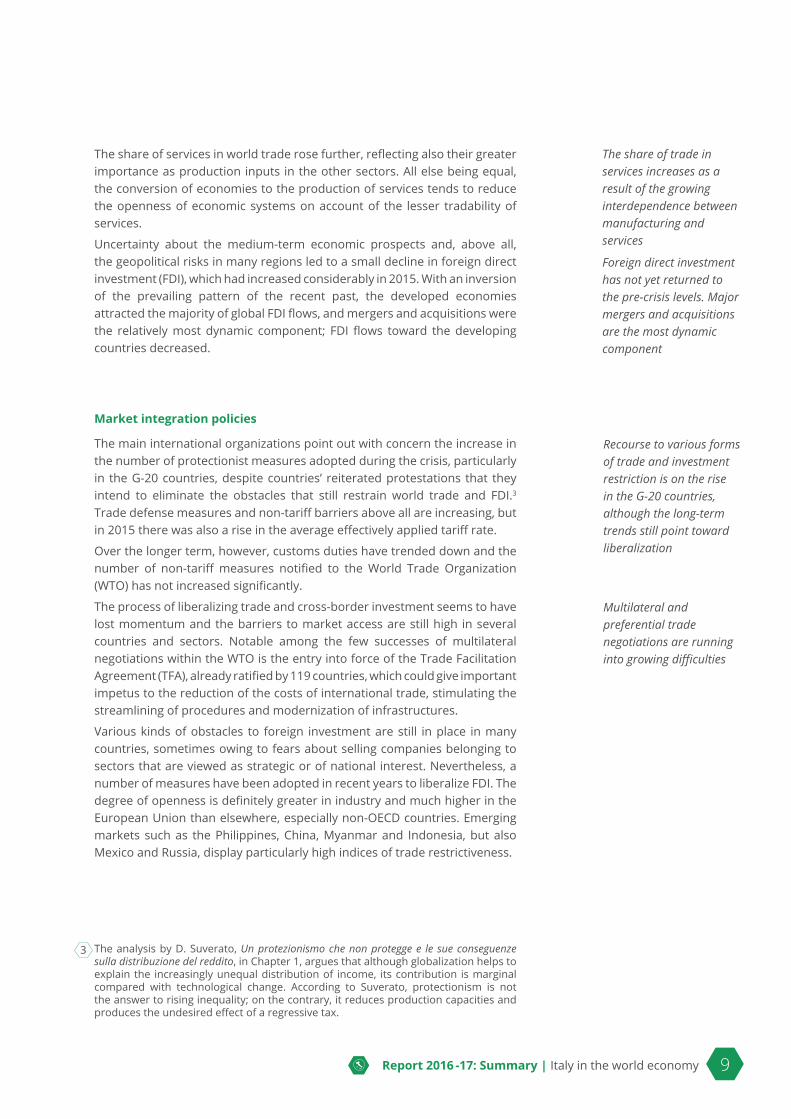
The share of services in world trade rose further, reflecting also their greater importance as production inputs in the other sectors. All else being equal, the conversion of economies to the production of services tends to reduce the openness of economic systems on account of the lesser tradability of services.
Uncertainty about the medium-term economic prospects and, above all, the geopolitical risks in many regions led to a small decline in foreign direct investment (FDI), which had increased considerably in 2015. With an inversion of the prevailing pattern of the recent past, the developed economies attracted the majority of global FDI flows, and mergers and acquisitions were the relatively most dynamic component; FDI flows toward the developing countries decreased.
Market integration policies
The main international organizations point out with concern the increase in the number of protectionist measures adopted during the crisis, particularly in the G-20 countries, despite countries’ reiterated protestations that they intend to eliminate the obstacles that still restrain world trade and FDI.3 Trade defense measures and non-tariff barriers above all are increasing, but in 2015 there was also a rise in the average effectively applied tariff rate.
Over the longer term, however, customs duties have trended down and the number of non-tariff measures notified to the World Trade Organization (WTO) has not increased significantly.
The process of liberalizing trade and cross-border investment seems to have lost momentum and the barriers to market access are still high in several countries and sectors. Notable among the few successes of multilateral negotiations within the WTO is the entry into force of the Trade Facilitation Agreement (TFA), already ratified by 119 countries, which could give important impetus to the reduction of the costs of international trade, stimulating the streamlining of procedures and modernization of infrastructures.
Various kinds of obstacles to foreign investment are still in place in many countries, sometimes owing to fears about selling companies belonging to sectors that are viewed as strategic or of national interest. Nevertheless, a number of measures have been adopted in recent years to liberalize FDI. The degree of openness is definitely greater in industry and much higher in the European Union than elsewhere, especially non-OECD countries. Emerging markets such as the Philippines, China, Myanmar and Indonesia, but also Mexico and Russia, display particularly high indices of trade restrictiveness.
3 The analysis by D. Suverato, Un protezionismo che non protegge e le sue conseguenze sulla distribuzione del reddito, in Chapter 1, argues that although globalization helps to explain the increasingly unequal distribution of income, its contribution is marginal compared with technological change. According to Suverato, protectionism is not the answer to rising inequality; on the contrary, it reduces production capacities and produces the undesired effect of a regressive tax.
The share of trade in services increases as a result of the growing interdependence between manufacturing and services
Foreign direct investment has not yet returned to the pre-crisis levels. Major mergers and acquisitions are the most dynamic component
Recourse to various forms of trade and investment restriction is on the rise in the G-20 countries, although the long-term trends still point toward liberalization
Multilateral and preferential trade negotiations are running into growing difficulties
10 Report 2016 -17: Summary | Italy in the world economy
Seeking an alternative path for promoting trade liberalization in view of the stalemate in the WTO, many countries have undertaken negotiations for plurilateral agreements, accords limited to the signatory countries to which other countries may subscribe. In this context, the first tariff reductions envisaged by the Information Technology Agreement (ITA II) entered into force in 2016, and negotiations are proceeding on the Trade in Services Agreement (TISA) and Environmental Goods Agreement (EGA). The TISA’s aim is to agree on measures that go beyond what is provided for by the General Agreement on Trade in Services (GATS) while remaining compatible with that multilateral agreement, using the contents of the most ambitious preferential agreements as a benchmark.
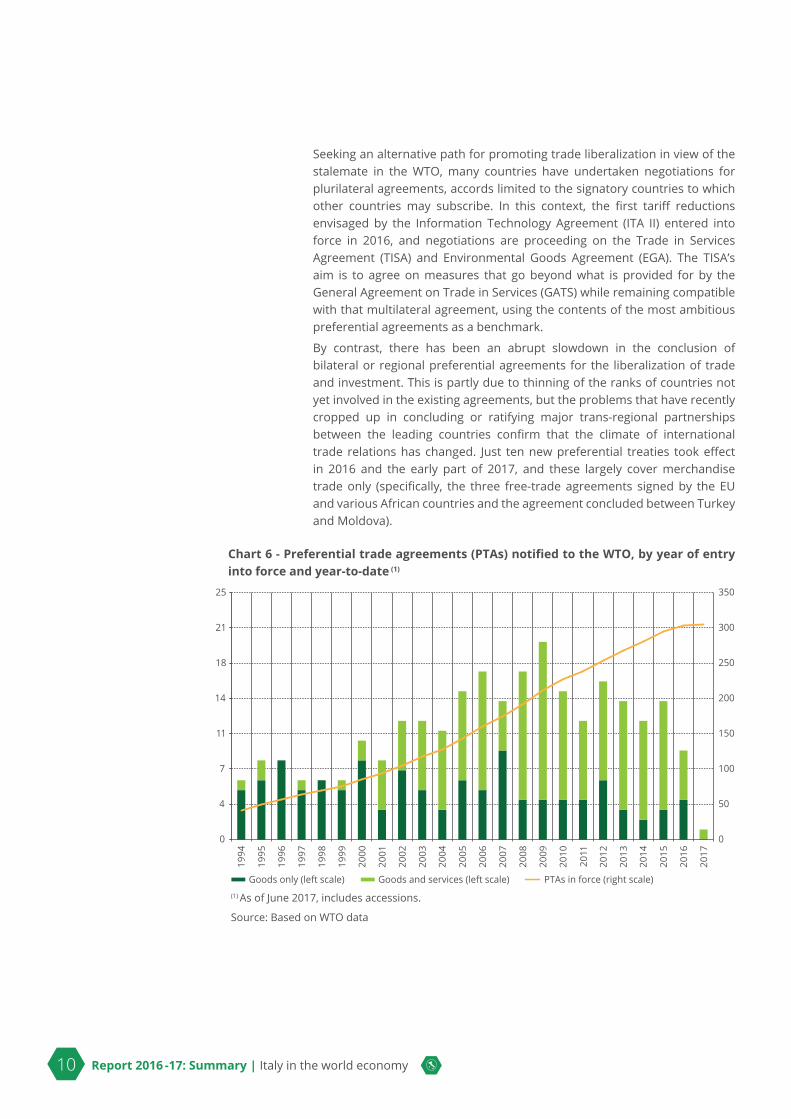
By contrast, there has been an abrupt slowdown in the conclusion of bilateral or regional preferential agreements for the liberalization of trade and investment. This is partly due to thinning of the ranks of countries not yet involved in the existing agreements, but the problems that have recently cropped up in concluding or ratifying major trans-regional partnerships between the leading countries confirm that the climate of international trade relations has changed. Just ten new preferential treaties took effect in 2016 and the early part of 2017, and these largely cover merchandise trade only (specifically, the three free-trade agreements signed by the EU and various African countries and the agreement concluded between Turkey and Moldova).
Chart 6 - Preferential trade agreements (PTAs) notified to the WTO, by year of entry into force and year-to-date (1)
0
50
100
150
200
250
300
350
0
4
7
11
14
18
21
25
1994
1995
1996
1997
1998
1999
2000
2001
2002
2003
2004
2005
2006
2007
2008
2009
2010
2011
2012
2013
2014
2015
2016
2017
Grafico 1.28 - Accordi commerciali preferenziali attivi, notificati all'Omc, per anno di entrata in vigore e cumulati (1)
Goods only (left scale) Goods and services (left scale) PTAs in force (right scale)
Fonte: elaborazioni Ice su dati Omc
(1) Aggiornamento al 15 giugno 2017, incluse accessioni
(1) As of June 2017, includes accessions.
Source: Based on WTO data
Report 2016 -17: Summary | Italy in the world economy 11
The European Union
European economic and political integration is going through a phase of severe difficulty precisely at the time of the sixtieth anniversary of the Treaty of Rome, which launched that process. Weak growth and the unresolved problems of the European institutions are fueling increasing disaffection in wide swaths of public opinion and the spread of dangerous nationalistic tendencies.
Among the consequences of this climate is the United Kingdom’s decision to leave the European Union, the implementation of which requires lengthy negotiations whose outcome are uncertain. Should no agreement be found, Brexit would imply the application to bilateral trade between the United Kingdom and the EU of the tariffs already applied to third countries on a multilateral basis. Owing to the difference in sectoral specialization, the average tariff level would be relatively higher for the goods exported by the EU and would hit the motor vehicle sector especially hard.4
Spurred by the Brexit shock, the European Union’s member countries and common institutions are seeking new paths to relaunch the process of integration, capitalizing on the benefits already obtained by the Single Market and trying to come to grips with the problems that have emerged in their distribution among countries and social groups.5
The effective degree of regionalization of trade within the European Union has increased somewhat in the past few years. The highest indices of intensity are found in intermediate goods, which underscores the mainly regional rather than global dimension of the international production networks established between EU countries, and in particular with the EU’s new members in central and eastern Europe. The importance of these links is corroborated indirectly by the fact that these indices are lower when they are calculated only for the euro-area member countries.
Counter to the trend seen at global level, in 2016 the European Union continued to develop its external trade strategy, concluding nine new preferential agreements. Talks with main Asian countries, among others, are intensifying, and the agreement with Canada (CETA) is in course of ratification. However, the prospects of relations with the United States are highly uncertain.6
4 See the contribution by Rita Cappariello, Brexit: una stima dei costi tariffari per i paesi dell’Unione Europea in un nuovo regime di regolamentazione degli scambi commerciali con il Regno Unito, in Chapter 1.
5 The contribution by S. Micossi, Trent’anni di mercato interno europeo, in Chapter 1, reviews the results of the program of completing the European Single Market and the problems that remain to be solved.
6 The study by C. Colacurcio and A. Lanza, Il made in Italy davanti al neo-protezionismo americano, in Chapter 1, estimates that a return to protectionism would cost Italian firms €1.9 billion (more than 5 percent of 2016 exports to US market), imposing a particularly severe penalty on the food products sector (nearly €600 million less of exports).
The process of European integration is in crisis, despite the major successes achieved in its 60-year history

12 Report 2016 -17: Summary | Italy in the world economy
2. Italy: an overviewThe Italian economy’s recovery has gradually gained traction with the support of a moderate upturn in consumption and investment. The data for the first quarter of 2017 were better than forecast and GDP growth this year is expected to be close to 1 per cent.
But the expansion in Italy is not on a par with the euro-area average, and the ground that needs to be recovered in order to return to pre-crisis levels of activity remains very substantial. The loss of production capacity due to the prolonged contraction of domestic demand has set the economy on a structurally lower growth path, although even before the crisis its growth was below potential.
Among the factors that can sustain productivity growth through selection of the best firms, one of the most important is international economic integration. The Italian economy’s external openness, which had declined under the impact of the crisis, has begun to grow again in recent years, but it is still lower than that of the other main euro-area countries, especially as regards the share of inward and outward foreign direct investment.
The external current account surplus widened considerably in the past few years, reaching 2.6 percent of GDP in 2016. Consequently, the net external debtor position that the Italian economy had accumulated earlier has contracted and is now equal to about 15 per cent of GDP. These developments were abetted not only by the fall in commodity prices and by the weakness of domestic demand, which braked the growth of imports, but also by the recovery in exports, 7 which, in contrast with the past decade, kept pace with foreign demand.
Chart 7 - Italy’s current account balance and international investment positionAs a percentage of GDP
-30
-25
-20
-15
-10
-5
0
5
10
15
20
-4
-3
-2
-1
0
1
2
3
2007 2008 2009 2010 2011 2012 2013 2014 2015 2016
Grafico 2.5 - Saldo di conto corrente e posizione patrimoniale sull’estero dell’Italia In percentuale del prodotto interno lordo
Current account balance (left scale) International investment position (right scale)
Fonte: elaborazioni Ice su dati Banca d’Italia e Istat
Sources: Based on Bank of Italy and ISTAT data
7 See the analysis by S. Fabiani, S. Federico and A. Felettigh, L’aggiustamento dei conti con l’estero: fattori ciclici e il conto corrente dell’Italia, in Chapter 2.
The Italian economy is recovering thanks to domestic demand, but it is still far from the pre-crisis levels of activity
The external current account surplus increased, benefiting from the drop in commodity prices

Report 2016 -17: Summary | Italy in the world economy 13
Imports of goods and services, which in 2015 had responded briskly to the start of the economic recovery, slowed in 2016 to grow 2.9 per cent in volume, although the capital goods component remained highly dynamic. Reflecting the deceleration in world trade, exports also slowed, growing by 2.4 per cent in 2016. In recent years, Italian export growth has underperformed the euro-area average.
For 2017, Istat projects a stronger pick-up in imports of goods and services than in exports, forecasting their growth at 4.4 and 3.5 per cent, respectively.
Better results emerge when the focus is confined to exports of goods alone in volume terms, which in the last five years tended to expand more rapidly than the potential demand for them in outlet markets. However, potential demand for Italian merchandise exports grew less than world trade, showing that the geographical distribution of Italian exports remains tilted toward relatively slow-growing markets.
Measured in current prices, Italian exports’ world market share grew in 2016, consolidating the mild recovery under way for a number of years. The chief contributory factor has been the shift in world demand toward typical “made in Italy” export products, reversing a trend that had penalized Italian exports in the 2000s.8 This favorable effect of the product composition of demand reflects the loss in share of commodities, due to the fall in their prices, and the increase in demand for personal care and household consumer goods, ascribable in part to the expansion of the middle class in some emerging countries.
Chart 8 - Italian merchandise exports’ competitiveness and world market sharesPercentage shares and indices, 1999=100
90
92
94
96
98
100
102
104
0.0 0.2 0.4 0.6 0.8 1.0 1.2 1.4 1.6 1.8 2.0 2.2 2.4 2.6 2.8 3.0 3.2 3.4 3.6
2007 2008 2009 2010 2011 2012 2013 2014 2015 2016
Grafico 2.8 - Competitività e quote di mercato delle esportazioni italiane di merci Quote in percentuale e indici in base 1999=100
Share at constant prices (base year 2010, left scale)
Share at current prices (left scale)
Competitiveness (reciprocal of the competitiveness indicator based on producer prices of manufactures,1999=100, right scale). A positive (negative) change indicates an increase (decrease) in competitiveness.
Fonte: elaborazioni Ice su dati Banca d'Italia e Omc Sources: Based on Bank of Italy and WTO data
8 See the analysis by R. Di Pietro, Le quote di mercato delle esportazioni italiane: un’analisi constant-market shares, in Chapter 2.
Exports of goods and services continue to grow in volume less than the euro-area average
Italian goods exports’ world market share at current prices increased in recent years, thanks to the shift in foreign demand toward typical “made in Italy” product sectors

14 Report 2016 -17: Summary | Italy in the world economy
Chart 9 - Italian exports’ market shares and dynamic of world demand by sector
Textiles andwearing apparel
Leather andrelated products
Coke and refined petroleum
products
Chemicalsubstances andproducts
Basic metalsand fabricatedmetal products
Computer, electronic and
optical productsMachinery and equipment
n.e.c.
Motor vehicles, trailers and semi-trailers
Pharmaceutical products andpreparations
Food products, beverages and tobacco
Electrical equipment
Other transport equipment
Furniture
3,1
0.8
Wood, paper, printing
Rubber andplastic productsProducts of agriculture,
fishing and forestry
Mining products-11
-9
-7
-5
3
-1
1
3
5
7
-1 1 3 5 7 9 11
La dimensione della bolla rappresenta il peso del settore sulle esportazioni mondiali nel periodo 2010-16. Bolle verdi (grigie) indicano settori in cui la quota di mercato dell'Italia è cresciuta (diminuita) tra il 2010 e il 2016. Le linee tratteggiate rappresentano le variabili indicate nei due assi per il totale dei settori.
Fonte: elaborazioni Ice su dati Istituti nazionali di statistica
Grafico 9 - Quote di mercato delle esportazioni italiane e dinamica della domanda mondiale per settori
Italian exports' market shares(average 2010-2016)
Aver
age
annu
al c
hang
e of
wor
ld e
xpor
ts in
cur
rent
dol
lars
be
twee
n 20
10 a
nd 2
016
The circles are sized in proportion to the sector’s average share of global exports in the period 2010-16.Green (grey) circles identify sectors in which Italy’s share increased (decreased) between 2010 and 2016.The broken lines represent the variables shown in the axes for all sectors.
Sources: Based on national statistical institutes data
In 2016 the appreciation of the euro caused a moderate erosion of the margins of competitiveness that Italian products had gained from 2009 onward. The euro prices of exports diminished somewhat, prolonging a trend under way for a number of years. The decline was more accentuated for manufactures sold outside the euro area, partly offsetting the loss of competitiveness due to the strengthening of the euro.
The reduction in export prices was more pronounced for intermediate goods, curbing their growth in value, which is 2016 was less than that in exports of final consumer and capital goods.
Report 2016 -17: Summary | Italy in the world economy 15
3. Regions and main countriesItaly’s trade balances improved in 2016 with nearly all the main regions, particularly with the regions of Europe. The fall in commodity prices, which have been declining since 2011, led to a sharp drop in the value of Italian imports from commodity-producing countries and regions, such as Russia, North Africa, the Middle East, Latin America, Central Asia and Australia, but lower commodity prices also adversely affected Italian exports because of the commodity producers’ diminished purchasing capacity. In 2016 Italian imports from the United States, China and other East Asian countries also declined.
Exports grew in 2016, above all to the European Union (3.1 percent), the United States (2.6 percent), China (6.4 percent) and Japan (9.6 percent); in these markets, Italian exports’ share increased with respect to both world and euro-area exports. Within the European Union, Italy gained share almost everywhere, the chief exceptions being Romania and Slovenia, where Italian exports’ share nevertheless remains conspicuously high.
The first few months of 2017 saw a broad-based acceleration in Italian merchandise trade, especially with non-EU countries. Large increases were recorded for exports to China (27.4 percent in the period January-May), Russia (24 percent), Japan (12.6 percent), India (10.2 percent) and the United States (9.4 percent), but the recovery also involved all of South-East Asia, Latina America and Sub-Saharan Africa. As for imports, the sharpest increases were in those from commodity-producing regions like the Middle East (62.8 percent) and North Africa (32.2 percent); the growth in imports from India (27.1 percent), Turkey (25.4 percent) and Russia (16.2 percent) also exceeded the average.
For the European Union, the updated data refer only to January-April and show increases exceeding the global average in purchases from Spain (12.9 percent), the Netherlands (11.1 percent) and Austria (10.2 percent). Exports expanded most markedly to Poland (12.7 percent), Spain (11.1 percent) and Romania (8.9 percent).
The geographic orientation of Italian exports is represented concisely by a map showing their shares in the different markets. A first thing that strikes the eye is the importance of distance, which underlies the differing incidence on bilateral trade of transport costs and various access barriers for the most remote markets. In general, Italy’s export shares are higher than average in the European Union, where they benefit from the absence of customs barriers, but they attain even higher levels in the Mediterranean markets (the Balkans and North Africa), where, geographical proximity being equal, Italy’s dominant position is assisted by a variety of factors, including the delay of some of these countries in entering the multilateral trading system. Lastly, it is to be noted that in several cases (Argentina, Australia and Brazil) the strength of cultural and economic links engendered by the presence of large communities of Italian descent compensates in part for greater geographical distance.
Foreign trade accelerated in the early months of 2017, especially with non-EU countries
Distance still exerts a considerable influence on the geographical distribution of Italian exports

16 Report 2016 -17: Summary | Italy in the world economy
Chart 10 - Italian exports’ market shares in the main markets (2016)Percentage shares
Grafico 3.1 - Quote di mercato delle esportazioni italiane nei principali mercati (2016)
Keyover 8.0%
from 4.0% to 8.0% from 1.8% to 3.9% up to 1.8%n.a.
Average share: 2.9%
Sources: Based on IMF-DOTS data and, for Taiwan, Taiwan Directorate General of Customs data
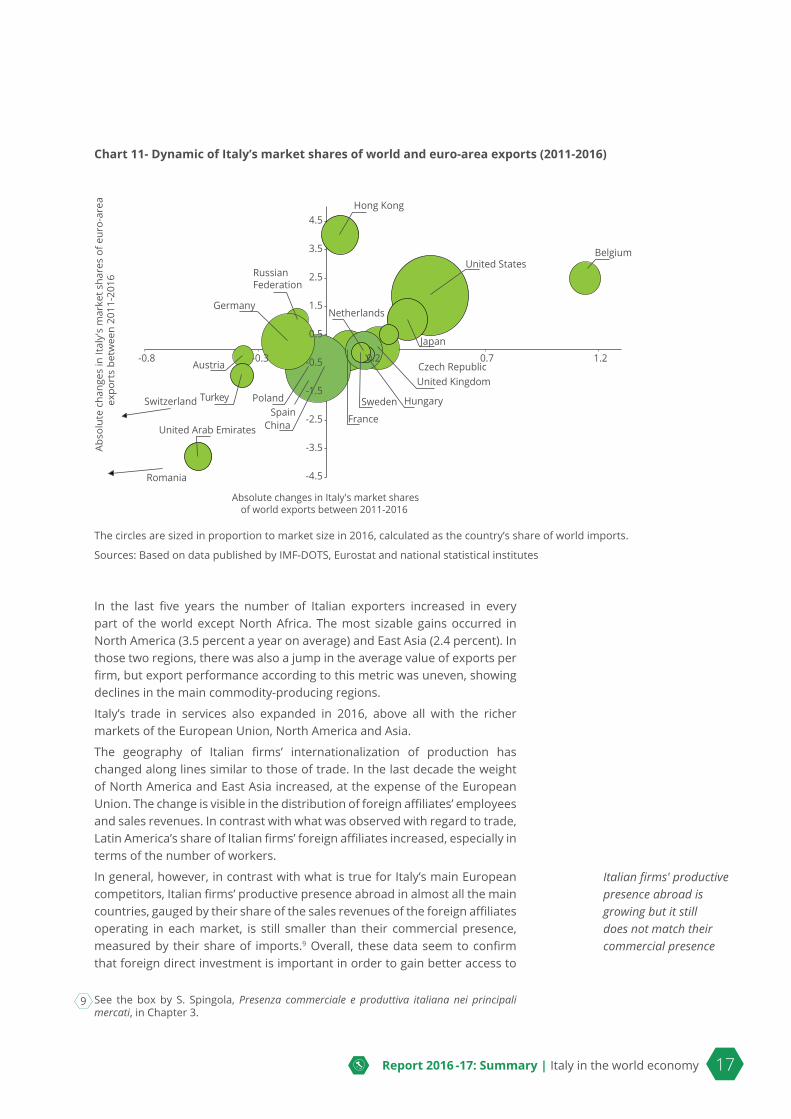
As remarked above, Italian exports’ market shares have revived in recent years after a long period of decline. Taking the five years 2011-16, the main markets can be divided into three groups. In the first, which includes the United States, Japan, Hong Kong and a number of European Union countries, Italian exports gained or maintained their share with respect to both world and euro-area exports. In the second group, which includes Germany and Russia, among others, Italian exports decreased with respect to world exports but increased in relation to euro-area exports. The third group consists of critical markets, including China, Spain and the United Arab Emirates, where Italian exports lost ground according to both yardsticks.
In recent years Italian exports’ achieved their most significant competitive successes in the United States, Japan, Hong Kong and several EU countries
Report 2016 -17: Summary | Italy in the world economy 17
Chart 11- Dynamic of Italy’s market shares of world and euro-area exports (2011-2016)
Turkey
-4.5
-3.5
-2.5
0.5
1.5
2.5
3.5
4.5
-0.5
-1.5
-0.8 -0.3 0.7 1.2
RussianFederation
France
United Kingdom
Spain
BelgiumUnited States
Poland
China
Netherlands
Austria
Japan
Germany
Hong Kong
United Arab Emirates
Czech Republic
HungarySwedenSwitzerland
Romania
Abso
lute
cha
nges
in It
aly'
s m
arke
t sha
res
of e
uro-
area
expo
rts
betw
een
2011
-201
6
Grafico 3.3 - Quote italiane: andamento rispetto alle esportazioni del mondo e dell'Area dell'euro (periodo 2011-16)
Absolute changes in Italy's market sharesof world exports between 2011-2016
La dimensione della bolla rappresenta la dimensione del mercato nel 2016, calcolata come quota del paese sulle importazioni mondiali. Fonte: elaborazioni Ice su dati Fmi-Dots, Eurostat e Istituti nazionali di statistica
0.2
The circles are sized in proportion to market size in 2016, calculated as the country’s share of world imports.
Sources: Based on data published by IMF-DOTS, Eurostat and national statistical institutes
In the last five years the number of Italian exporters increased in every part of the world except North Africa. The most sizable gains occurred in North America (3.5 percent a year on average) and East Asia (2.4 percent). In those two regions, there was also a jump in the average value of exports per firm, but export performance according to this metric was uneven, showing declines in the main commodity-producing regions.
Italy’s trade in services also expanded in 2016, above all with the richer markets of the European Union, North America and Asia.
The geography of Italian firms’ internationalization of production has changed along lines similar to those of trade. In the last decade the weight of North America and East Asia increased, at the expense of the European Union. The change is visible in the distribution of foreign affiliates’ employees and sales revenues. In contrast with what was observed with regard to trade, Latin America’s share of Italian firms’ foreign affiliates increased, especially in terms of the number of workers.
In general, however, in contrast with what is true for Italy’s main European competitors, Italian firms’ productive presence abroad in almost all the main countries, gauged by their share of the sales revenues of the foreign affiliates operating in each market, is still smaller than their commercial presence, measured by their share of imports.9 Overall, these data seem to confirm that foreign direct investment is important in order to gain better access to
9 See the box by S. Spingola, Presenza commerciale e produttiva italiana nei principali mercati, in Chapter 3.
Italian firms' productive presence abroad is growing but it still does not match their commercial presence
18 Report 2016 -17: Summary | Italy in the world economy
markets in the advanced countries, especially those that are geographically distant.
The presence of foreign multinationals in Italy is less extensive than in the other main European countries, but it has grown moderately in recent years in terms of both employment and sales revenues. The most significant increases in the last ten years involved the affiliates of multinationals based in East Asia and the Middle East.
4. SectorsThe growth in Italy’s trade surplus in 2016 derived exclusively from the reduction in the deficit on commodities. The large manufacturing surplus was about the same as in the previous year. The deterioration in the balances on petroleum derivatives, machinery and equipment and especially motor vehicles, were offset by improvements in food products, chemical products, basic metals and other transport equipment.
Imports were up most sharply for motor vehicles (19.4 percent in value), machinery and equipment (7.1 percent) and furnishings and furniture, confirming the trends of the previous five years.
In 2016 the most dynamic export sectors in terms of value were pharmaceuticals (up 6.8 percent), transport equipment (5.4 percent) and food and agricultural products (4 percent). As with imports, these results were in line with consolidated trends. On the other hand, exports in volume terms fell in all the main sectors of Italian specialization, including machinery and equipment, fashion goods, and furniture and furnishings.
In the first four months of 2017 Italy’s foreign trade registered a much brisker acceleration than in the same period of the previous year. The upturn in commodity prices translated into major increases in the value of imports of products of the extractive industries (up 50 percent, with a peak of 79 percent for crude oil), but it was also felt in manufacturing sectors that make intensive use of primary inputs – for example, oil refining (51 percent) and basic metal and fabricated metal products (12.7 percent). In addition, imports of motor vehicles continued to show robust growth (13.8 percent).
On the export side, the largest percentage increases concerned sectors, like refined petroleum products (up 63 percent), in which the rise in prices had a large impact. Among manufacturing activities, higher-than-average growth rates were recorded for motor vehicles (17.7 percent), pharmaceuticals (13.8 percent) and chemical products (9.5 percent).
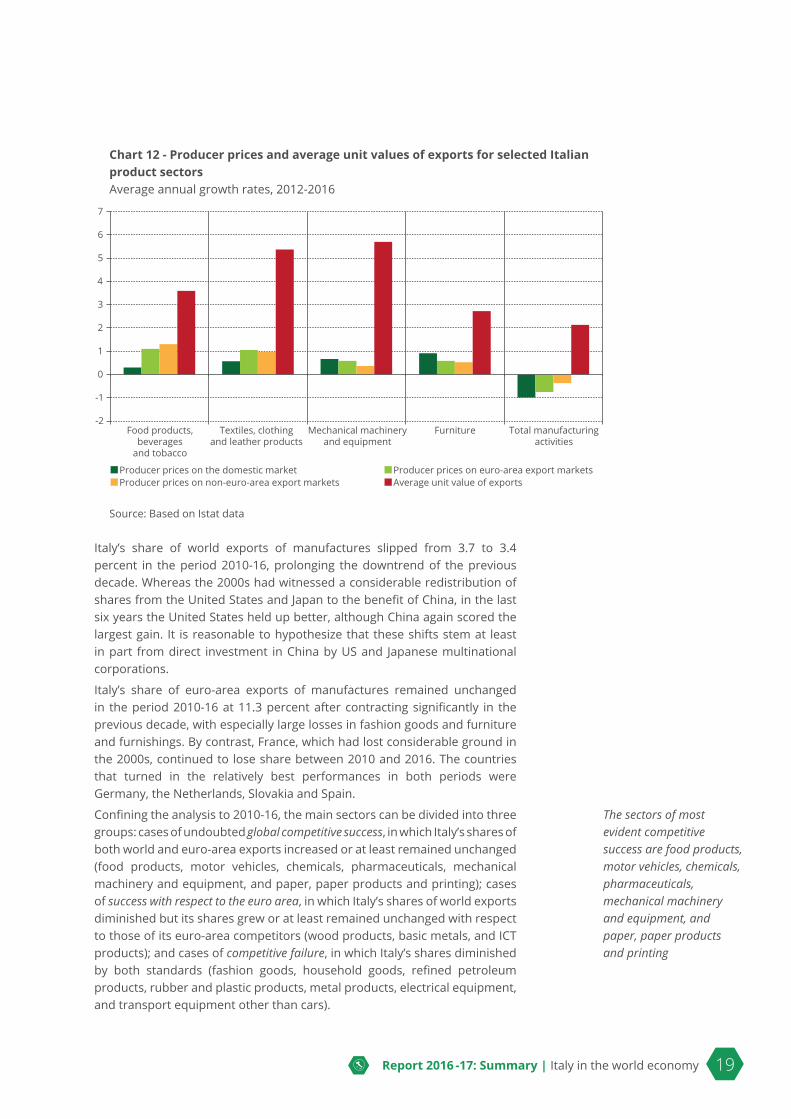
In the main branches of manufacturing, in 2016 export prices again rose more slowly than unit values, confirming a well-established pattern. With all due caution in view of the diversity of the statistical methods used to construct the indices, it can be hypothesized that this gap, especially evident in the leading “made in Italy” sectors, reflects a qualitative improvement in the mix of exported goods, with a shift toward higher-end products. An additional factor may have been the processes of competitive selection, which drive out the least productive exporting firms, often situated in low-unit-value product segments, or encourage the offshoring of low-value activities.
The early part of 2017 has witnessed a rebound of trade in commodities and continued robust growth of trade in motor vehicles
The unit values of exports continue to outpace prices, signaling the qualitative improvement of the products exported
Report 2016 -17: Summary | Italy in the world economy 19
Chart 12 - Producer prices and average unit values of exports for selected Italian product sectorsAverage annual growth rates, 2012-2016
-2
-1
0
1
2
3
4
5
6
7
Food products,beverages
and tobacco
Textiles, clothingand leather products
Mechanical machineryand equipment
Furniture Total manufacturingactivities
Grafico 12 - Prezzi alla produzione e valori medi unitari delle esportazioni per alcuni settori del made in Italy Tassi di crescita medi annui 2012-2016
Producer prices on the domestic market Producer prices on euro-area export marketsProducer prices on non-euro-area export markets Average unit value of exports
Fonte: elaborazioni Ice su dati Istat
Source: Based on Istat data
Italy’s share of world exports of manufactures slipped from 3.7 to 3.4 percent in the period 2010-16, prolonging the downtrend of the previous decade. Whereas the 2000s had witnessed a considerable redistribution of shares from the United States and Japan to the benefit of China, in the last six years the United States held up better, although China again scored the largest gain. It is reasonable to hypothesize that these shifts stem at least in part from direct investment in China by US and Japanese multinational corporations.
Italy’s share of euro-area exports of manufactures remained unchanged in the period 2010-16 at 11.3 percent after contracting significantly in the previous decade, with especially large losses in fashion goods and furniture and furnishings. By contrast, France, which had lost considerable ground in the 2000s, continued to lose share between 2010 and 2016. The countries that turned in the relatively best performances in both periods were Germany, the Netherlands, Slovakia and Spain.
Confining the analysis to 2010-16, the main sectors can be divided into three groups: cases of undoubted global competitive success, in which Italy’s shares of both world and euro-area exports increased or at least remained unchanged (food products, motor vehicles, chemicals, pharmaceuticals, mechanical machinery and equipment, and paper, paper products and printing); cases of success with respect to the euro area, in which Italy’s shares of world exports diminished but its shares grew or at least remained unchanged with respect to those of its euro-area competitors (wood products, basic metals, and ICT products); and cases of competitive failure, in which Italy’s shares diminished by both standards (fashion goods, household goods, refined petroleum products, rubber and plastic products, metal products, electrical equipment, and transport equipment other than cars).
The sectors of most evident competitive success are food products, motor vehicles, chemicals, pharmaceuticals, mechanical machinery and equipment, and paper, paper products and printing

20 Report 2016 -17: Summary | Italy in the world economy
Chart 13 - Italy’s market shares of world and euro-area exports by manufacturing sectorAbsolute changes in percentage shares at current prices, 2010-2016
Grafico 4.2 - Quote dell’Italia sulle esportazioni del mondo e dell’Area dell’euro per i settori manifatturieriVariazioni assolute delle quote percentuali a prezzi correnti tra il 2010 e il 2016
Abso
lute
cha
nges
in It
aly'
s m
arke
t sha
res
of e
uro-
area
exp
orts
Wood and wood products (0.8)
Paper and paper products;printing (1.6)
Food products, beverages andtobacco (6.8)
Pharmaceutical, medicinal andbotanical products (4.2)
Mechanical machinery andequipment (10.8)
Chemical substances andproducts (9.3)
Glass, ceramics and other non-metallic mineral products
for construction (1.4) Computers,electronic and
optical apparatus (8.0)
Rubber and plastic products (3.0)Furniture (1.1)
Electrical equipment (5.7)
Textiles, clothing andaccessories (6.8)
Other transport equipment (4.2)
Coke and refined petroleumproducts (5.6)
Motor vehicles, trailers and semitrailers (9.9)
Basic metals and metalproducts (10.4)
Absolute changes in Italy's market shares of world exports
Il valore a margine dell’etichetta indica il peso percentuale medio del settore sulle esportazioni mondiali (2010-2016).
Fonte: elaborazioni Ice su dati Eurostat e istituti nazionali di statistica
-2.0 -1.5 -1.0 -0.5 00 0.5 1.0
1.5
1.0
0.5
00
-0.5
-1.0
-1.5
-2.0
-2.5
-3.0
-3.5
The value near the label indicates the sector’s average share of world exports in the period 2010-2016.
Sources: Based on data published by Eurostat and national statistical insitutes
Taken as a whole, these changes portray an evolution of Italian exports’ model of international specialization, in which the traditional comparative advantages in personal care and household consumer goods weaken, while niches of specialization emerge in more technology-intensive sectors, among which the mechanical machinery and equipment industry continues to play a leading role.
The pharmaceutical sector warrants special attention. In recent years, it has recorded higher-than-average growth in world demand. In a setting of rapidly expanding trade, Italy’s traditional deficit on trade in these products has contracted very substantially and its shares of both world and euro-area exports have tended to grow. The sector is dominated by multinational corporations, which account for a very large share of trade. In many cases their affiliates in Italy import pharmaceuticals from other group companies and re-export them after further processing, including final packaging, giving rise to an important source of demand for the machinery and equipment sector. More in general, a significant part of the Italian pharmaceutical industry’s production is for third parties.10
Turning to services, the last four years have seen a strong expansion in Italy’s foreign trade in business services, most notably financial and ICT services, as well as in the travel sector (for tourism and business).
10 See the box by R. Di Pietro, La farmaceutica italiana negli scambi internazionali, in Chapter 4.

Report 2016 -17: Summary | Italy in the world economy 21
Italy’s share of exports of services has contracted severely in the last twenty years, falling from 14.5 to 7.1 percent of euro-area service exports and being overtaken by Spain (9 per cent). French exports recorded a smaller decline in share (from 18 to 14 percent), while Germany’s share of euro-area service exports rose from 17 to 19 percent in the 2000s and maintained that level subsequently. Among the countries that progressed in the period 2008-14 were Ireland and Luxembourg, where the headquarters of major service corporations are located thanks in part to the attraction of tax incentives. In greater detail, Italy’s losses of share involved nearly all the main sectors, including travel, transport, professional and management consulting services, commerce-related technical services and other business services. The main exceptions are the dynamic sector of research and development services and, to a lesser extent, financial services.11
In the period 2010-16, the distribution by sector of Italian firms’ foreign affiliates in terms of employees shifted somewhat to the benefit of manufacturing. Within manufacturing, transport equipment, food products, mechanical machinery and equipment, and pharmaceuticals gained ground, at the expense of electrical equipment and electronics, rubber products and plastics.
From the standpoint, instead, of foreign corporations’ Italian affiliates, the relatively most dynamic sector in terms of employees was services, especially ICT services and other professional services. Within manufacturing, the share of the traditional “made in Italy” segments grew.
11 See the box by P. Stanojevic, Le quote di mercato delle esportazioni italiane nei servizi: la dinamica nell’Area dell’euro, in Chapter 4.
Italian exports have lost share in business services
22 Report 2016 -17: Summary | Italy in the world economy
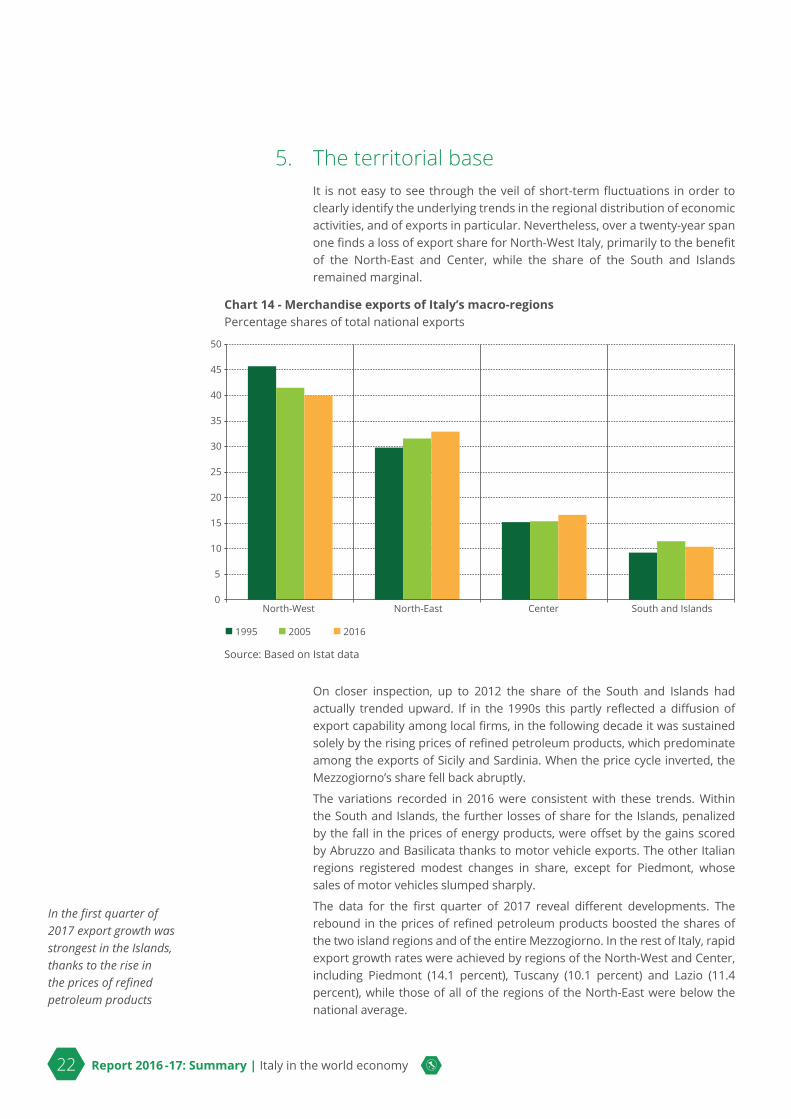
5. The territorial baseIt is not easy to see through the veil of short-term fluctuations in order to clearly identify the underlying trends in the regional distribution of economic activities, and of exports in particular. Nevertheless, over a twenty-year span one finds a loss of export share for North-West Italy, primarily to the benefit of the North-East and Center, while the share of the South and Islands remained marginal.
Chart 14 - Merchandise exports of Italy’s macro-regionsPercentage shares of total national exports
0
5
10
15
20
25
30
35
40
45
50
North-West North-East Center South and Islands
Grafico 5.1 - Esportazioni di merci delle ripartizioni territoriali italiane Quote percentuali sul totale delle esportazioni nazionali
Fonte: elaborazioni Ice su dati Istat
n 1995 n 2005 n 2016
Source: Based on Istat data
On closer inspection, up to 2012 the share of the South and Islands had actually trended upward. If in the 1990s this partly reflected a diffusion of export capability among local firms, in the following decade it was sustained solely by the rising prices of refined petroleum products, which predominate among the exports of Sicily and Sardinia. When the price cycle inverted, the Mezzogiorno’s share fell back abruptly.
The variations recorded in 2016 were consistent with these trends. Within the South and Islands, the further losses of share for the Islands, penalized by the fall in the prices of energy products, were offset by the gains scored by Abruzzo and Basilicata thanks to motor vehicle exports. The other Italian regions registered modest changes in share, except for Piedmont, whose sales of motor vehicles slumped sharply.
The data for the first quarter of 2017 reveal different developments. The rebound in the prices of refined petroleum products boosted the shares of the two island regions and of the entire Mezzogiorno. In the rest of Italy, rapid export growth rates were achieved by regions of the North-West and Center, including Piedmont (14.1 percent), Tuscany (10.1 percent) and Lazio (11.4 percent), while those of all of the regions of the North-East were below the national average.
In the first quarter of 2017 export growth was strongest in the Islands, thanks to the rise in the prices of refined petroleum products
Report 2016 -17: Summary | Italy in the world economy 23
North-West Italy’s service exports also lost share in the last five years, to the benefit of all the other parts of the country. The regions of Lombardy and Lazio, in whose capitals the main producers are located, continue to account for more than half of the flows. North-West Italy is the only macro-region where business services predominate among service exports. In the rest of the country, and above all in the South and Islands, tourism ranks first.
The main indicators of international openness have risen in all of Italy’s macro-regions in the past few years except for the South and Islands, penalized, again, by the drop in the prices of refined petroleum products, but at regional level the disparities remain very substantial.
Nevertheless the South and Islands was the only macro-region where the number of exporting firms grew in 2016. The gain of 0.8 percent continued a long-standing trend toward the diffusion of export capability among enterprises based in the Mezzogiorno.
Extending the analysis to the regions of five European countries (France, Germany, Italy, Spain and the United Kingdom), the first thing that strikes the eye is the high degree of concentration of exports, with three German regions well ahead of all the others. However, no clear correlation is discernible, in the years of the great crisis, between the size of these flows and their growth rates. It is possible, instead, to observe a positive correlation between regions’ export propensity, measured by the value of goods exports per inhabitant, and their development, measured by per capita GDP, excluding several important regions whose high income derives mainly from specializing in services.12
In the past several years, and particularly in 2016, the Italian regions displayed a growing variability in their export growth rates. Among the factors that can impinge on these disparities is the differing degree of concentration of the phenomenon observed, which can be measured in terms of the number of exporting firms, of products exported or of outlet markets. In general, regions with smaller economies (like most of those of the South and Islands) have more highly concentrated export structures, especially as regards the number of firms and products, and this renders them more vulnerable to exogenous shocks.13
The relations between international integration and local development may not be adequately captured using the administrative regions as statistical units of analysis. The mesh of local production systems that help to determine national economies’ models of specialization and position in the global context is more fine-grained and requires appropriate theoretical models and analytic instruments to capture the heterogeneity of the territorial units.
Giacomo Becattini, the distinguished Italian economist who passed away at the beginning of this year, gave fundamental impetus to studies on these topics, identifying industrial districts of small and medium-sized enterprises as the chief engine of Italian economic growth in the second half of the last century.14 At the center of his reflections, which had profound international
12 See the analysis by G. Mastronardi, E. Mazzeo and G. Viesti, L’integrazione internazionale delle regioni dei principali paesi europei, in Chapter 5.
13 See the analysis by M.S. Causo and A. Vendetti, Concentrazione e diversificazione delle esportazioni regionali, in Chapter 5.
14 See the contribution by M. Bellandi, G. Dei Ottati and F. Sforzi, Giacomo Becattini e il made in Italy distrettuale, in Chapter 5.
There are still large disparities in the Italian regions’ degree of international openness
24 Report 2016 -17: Summary | Italy in the world economy
influence, are the deep roots of sustainable and open local development based on diffuse entrepreneurial aptitudes and manufacturing competencies, derived from ancient craft traditions and sustained by a local environment characterized by mutual trust and a shared sense of responsibility for the destiny of the community but devoid of identity-stamped hostility to international integration. For decades these industrial districts were the spontaneous breeding ground of “made in Italy” products, by which we mean not only a set of differentiated personal care and household final consumer goods of high quality, but also intermediate and capital goods necessary for their production. From the industrial districts emerged many of the larger firms that currently constitute the most vital and competitive part of Italy’s industrial system. Exposed to the challenges of globalization, some districts entered a crisis, while others transformed themselves, concentrating more on the upstream phases of manufacturing processes or on the downstream phases crucial for success on international markets. Meanwhile, mechanisms of territorial agglomeration similar but not identical to those at work in the industrial districts have arisen in some urban systems, which exploit the external economies made possible by the concentration of skilled workers, diversified firms and research centers.
Another theoretical approach, originally devised to study development gaps between countries but applicable also to local development, focuses on the relationship between the degree of complexity of the products in which a territory specializes and its economic growth. In the years preceding the great crisis, it was evident that the Italian provinces characterized by a basket of more sophisticated export products tended to grow faster than the others. In addition, a process of convergence in the degree of complexity of provincial models of export specialization was under way. The great crisis of the past years appears to have interrupted both of these processes, posing anew the question of territorial disparities of development.15
As already remarked with regard to exports, in the past decade North-West Italy, and the region of Piedmont in particular, also lost share in terms of the number of workers employed in the foreign affiliates of Italian firms, to the benefit of all the other macro-regions. At regional level, the largest increments in share were recorded by Lombardy, which bucked the trend in its macro-region, Emilia-Romagna and Lazio.
Considering, instead, foreign firms’ affiliates in Italy, the only macro-region to display a greater aggregate capacity to attract foreign investment was the North-East, especially the regions of Emilia-Romagna and Veneto. In the rest of Italy, increases in share, measured by the number of workers, were recorded for Marche, Tuscany and Liguria.
The South and Islands’ share remained marginal for both outward and inward foreign direct investment, confirming the interdependence that exists between territorial gaps in level of development and those in degree of international openness.
15 See the contribution by N. Coniglio, R. Lagravinese and D. Vurchio, Complessità dell’export provinciale e performance economica, in Chapter 5.
Industrial districts are undergoing transformation as they strive to insert themselves better into international production chains

Report 2016 -17: Summary | Italy in the world economy 25
6. FirmsThe number of firms operating on foreign markets (the extensive margin of exports) grew more slowly in 2016, rising by 0.3 percent to approach 216,000. The increase in the value of exports derived mainly from the intensive margin (average foreign sales per exporting firm), which grew to more than €1.9 million, with larger companies in the lead.
Chart 15 - Extensive and intensive margin of exportsNumber of exporting firms, average value of exports in thousands of euros
1,400
1,500
1,600
1,700
1,800
1,900
2,000
185,000
190,000
195,000
200,000
205,000
210,000
215,000
220,000
2007 2008 2009 2010 2011 2012 2013 2014 2015 2016(1)
Grafico 6.1 Margine estensivo e intensivo delle esportazioni. Numero di operatori commerciali all’esportazione, valori medi esportati in migliaia di euro
Exporting firms (left scale) Average value of exports per firm (right scale)
Fonte: elaborazioni Ice su dati Istat
(1) Dati provvisori.
(1) Provisional data.
Source: Based on Istat data
The number of exporting firms is fueled, from below, in the smallest size class, by newcomers to foreign markets, driven by the need to find alternative outlets because of the weakness of domestic demand. However, many of these new exporters fail to consolidate their presence abroad. In the larger size classes, the process of competitive selection proceeds.
In a comparison of the main euro-area countries based on 2014 data, Italy’s anomaly stands out most clearly in the case of large firms (250 or more workers), which account for a much smaller share of both the number of exporting firms and the value of exports than in France, Germany or Spain. At the opposite extreme, export-oriented micro-firms (up to 9 workers), though legion, have a very modest impact on the value of exports. Small and medium-sized enterprises, instead, play an important role, accounting for nearly half of Italy’s exports compared with barely a fifth in Germany and a quarter in France.
The diversification of outlet markets that had marked the previous five years came to a halt in 2016: the average number of foreign markets per exporter did not surpass the peak reached in 2015 (5.85), and for the first time since 2010 the share of firms exporting to only one market rose (to 43 percent). A comparison with the other major euro-area countries shows that in 2014 the
The number of exporting firms continues to grow, though more slowly than in the past
The diversification of outlet markets comes to a halt
26 Report 2016 -17: Summary | Italy in the world economy
percentage of firms operating in 20 or more markets was higher in Italy, but their contribution to the total value of exports was relatively modest.
The increase in the Italian economy’s external openness is also reflected in the percentage of exporting firms among all active firms, which rose from 4.2 percent in 2008 to 4.6 percent in 2015. Compared with companies that only do business on the domestic market, exporters are generally larger, have higher levels of productivity, are more skilled-labor intensive and have a higher ratio of capital invested per worker. This difference tends to grow with firm size, but it is pronounced even among micro-firms.
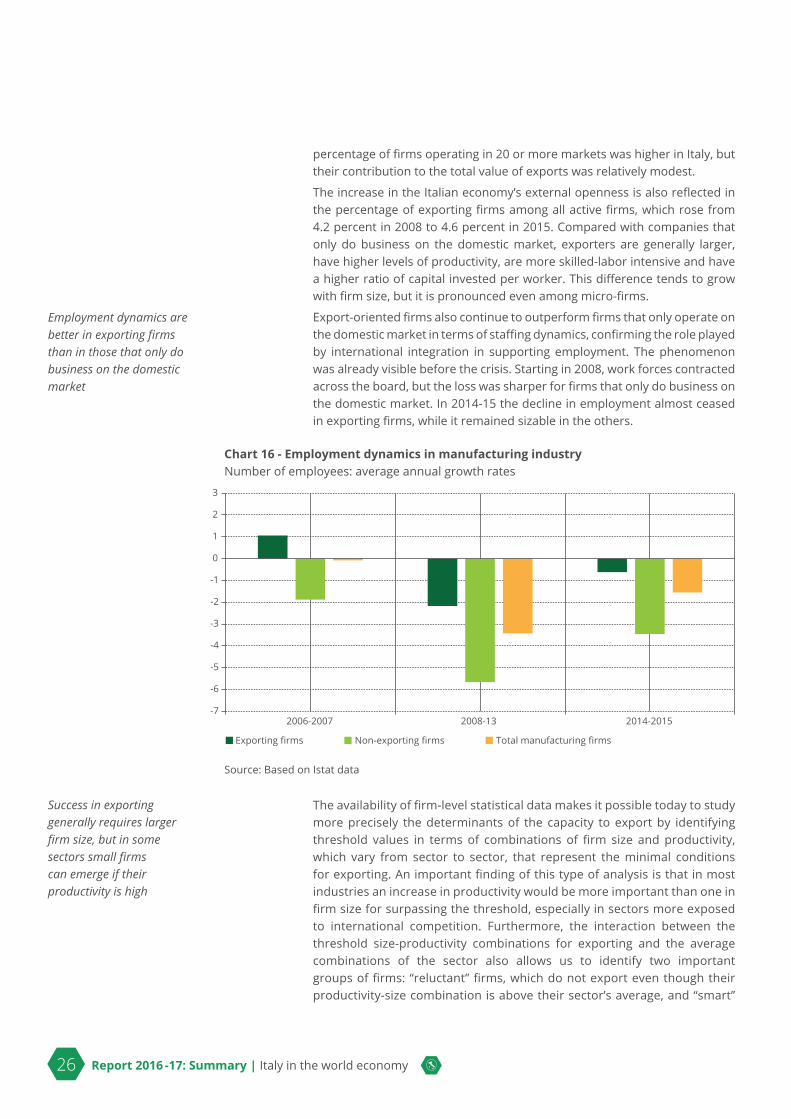
Export-oriented firms also continue to outperform firms that only operate on the domestic market in terms of staffing dynamics, confirming the role played by international integration in supporting employment. The phenomenon was already visible before the crisis. Starting in 2008, work forces contracted across the board, but the loss was sharper for firms that only do business on the domestic market. In 2014-15 the decline in employment almost ceased in exporting firms, while it remained sizable in the others.
Chart 16 - Employment dynamics in manufacturing industryNumber of employees: average annual growth rates
-7
-6
-5
-4
-3
-2
-1
0
1
2
3
2006-2007 2008-13 2014-2015
Grafico 16 - Dinamica dell’occupazione nell’industria manifatturieraNumero di addetti: tassi di crescita medi annui
Exporting firms Non-exporting firms Total manufacturing firms
Fonte: elaborazione Ice su dati Istat
Source: Based on Istat data
The availability of firm-level statistical data makes it possible today to study more precisely the determinants of the capacity to export by identifying threshold values in terms of combinations of firm size and productivity, which vary from sector to sector, that represent the minimal conditions for exporting. An important finding of this type of analysis is that in most industries an increase in productivity would be more important than one in firm size for surpassing the threshold, especially in sectors more exposed to international competition. Furthermore, the interaction between the threshold size-productivity combinations for exporting and the average combinations of the sector also allows us to identify two important groups of firms: “reluctant” firms, which do not export even though their productivity-size combination is above their sector’s average, and “smart”
Employment dynamics are better in exporting firms than in those that only do business on the domestic market
Success in exporting generally requires larger firm size, but in some sectors small firms can emerge if their productivity is high

Report 2016 -17: Summary | Italy in the world economy 27
firms, which succeed in exporting even though their combination is below their sector’s average.16
During the global crisis, the fall in demand and production translated into a general decline in productivity and a concomitant increase in the number of firms with below-average productivity, notably among non-exporting firms. This gap can be interpreted as a sign of poor allocation of productive resources, which are not smoothly transferred from less efficient firms to more efficient ones that have better access to credit and a greater propensity to invest in research and development and process innovation.17
Exporting firms also tend to have better characteristics than those operating only in the domestic market from the standpoint of financial structure, that is to say their financial statements show better indices of profitability, financial soundness and liquidity. These differences had been wiped out by the initial impact of the great crisis, with the collapse of foreign demand, but they reappeared in the second wave of recession, dominated by the fall in domestic demand. All else being equal, moreover, firms’ economic and financial indicators tend to improve with the degree of geographical diversification of their exports.18
Italian firms’ affiliates abroad contracted in recent years in terms of their number, staffing and sales. But this was chiefly due to the transfer to foreign control of several Italian multinationals rather than to an actual retreat of Italian companies from the internationalization of production. Indeed, over the entire span of the crisis Italian firms displayed a greater ability than in previous recessions to defend and in some cases expand their productive presence abroad.
The capacity to develop production in affiliates abroad is highly concentrated among large companies, although it has gradually spread among smaller firms as well. Large companies’ affiliates abroad booked 89 percent of the sales revenues of Italian firms’ foreign affiliates in 2016 and had 78 percent of their aggregate number of workers at the end of the year.
Geographical distance strongly influences the internationalization of production: the overwhelming majority of the foreign affiliates of Italian SMEs focus on Europe, while only large corporations show a considerable propensity to invest in more distant regions, a sign of their greater ability to elaborate complex strategies of internationalization aimed not only at cost savings but also at obtaining better access to markets.
Corroborating this is the fact that whereas large firms’ foreign affiliates are relatively more important in research-intensive and scale-economy sectors, those of smaller firms are found mainly in the traditional “made in Italy” sectors.
16 See the analysis by S. Costa, F. Sallusti, C. Vicarelli and D. Zurlo, Sopra la soglia (dell’export) l’impresa campa: vincoli strutturali e barriere all’export, in Chapter 6.
17 See the analysis by S. Calligaris, M. Del Gatto, F. Hassan, G.I.P. Ottaviano and F. Schivardi, Imprese esportatrici, produttività e misallocazione, in Chapter 6.
18 See the analysis by C. Boselli, Le condizioni economico-finanziarie delle imprese esportatrici, in Chapter 6.
The capacity to produce abroad is highly concentrated in large companies
28 Report 2016 -17: Summary | Italy in the world economy
It must not be forgotten, however, that the internationalization of production is not limited to investment in foreign businesses, but can also take less demanding forms, based on relations of collaboration with partners abroad, that are more accessible to smaller companies. The international production networks that are woven in this way involve suppliers of intermediate inputs and producers of final goods in different roles, giving rise to so-called global value chains. A sample survey of firms in the main European countries shows that while producers of final goods are predominant in Germany, suppliers of intermediate inputs are more important in France and Italy. Furthermore, a comparison of firms located in different Italian regions finds that the participation of firms based in the South and Islands in global value chains is marginal.19 In the years of the great crisis, participating in these networks had beneficial effects on firms’ productivity; the intensity of these effects appears to be positively related to the extent of firms’ involvement in international activities (imports, exports or production abroad) and to their position in the value chain. Producers of final goods reaped greater advantages than those achieved by their suppliers of inputs. Firms based in the South and Islands that succeeded in becoming part of these networks gained a significant benefit, reducing their productivity gap with respect to firms in the rest of Italy.
19 See the analysis by M. Agostino, A. Giunta, D. Scalera and F. Trivieri, Partecipazione e posizionamento delle imprese italiane nelle catene globali del valore: nuova evidenza (2009-2014), in Chapter 6.
Smaller firms as well gain major advantages by participating in international production networks
Report 2016 -17: Summary | Italy in the world economy 29
Focus: Digital commerce and the fourth industrial revolutionThe digitalization of productive activities is emerging more and more forcefully as the principal transformation taking place in the technological paradigms of economic and social life. The advances in artificial intelligence, in robotics, in additive manufacturing, in the Internet of things, tend to dissolve the boundaries between the traditional economy and the digital economy and spur ever greater integration between manufacturing and services (the “fourth industrial revolution”). Important consequences derive from this in the organization of markets, with already visible tensions in the distribution of costs and benefits among individuals, firms, social groups and countries.
The digital dematerialization of many transactions goes in the direction of completing the globalization of markets, making borders, distance and the location of activities less important. Expanding firms’ scale of production no longer necessarily requires a major investment in physical capital. Smaller firms, too, find important opportunities for growth in the “long tail” of market niches opened up by the digital platform economy. The competitive structure of markets is being rocked by the new forms of intermediation made possible by digital technologies. More in general, the social networks in which the activities of citizens and institutions are organized have greater scope for expansion.
In the last twenty years, the percentage of the world population with access to digital infrastructures has grown tenfold, and it is evident that a number of emerging countries are rapidly converging toward participation rates similar to those of the advanced countries. However, significant disparities persist across and within countries and among households and firms.
In a period of relative stagnation of international trade, electronic commerce is rapidly expanding, with an estimated growth rate of 17 per cent per year between 2013 and 2015. The development of digital platforms is changing the structure of retail distribution, attracting a growing number of consumers.
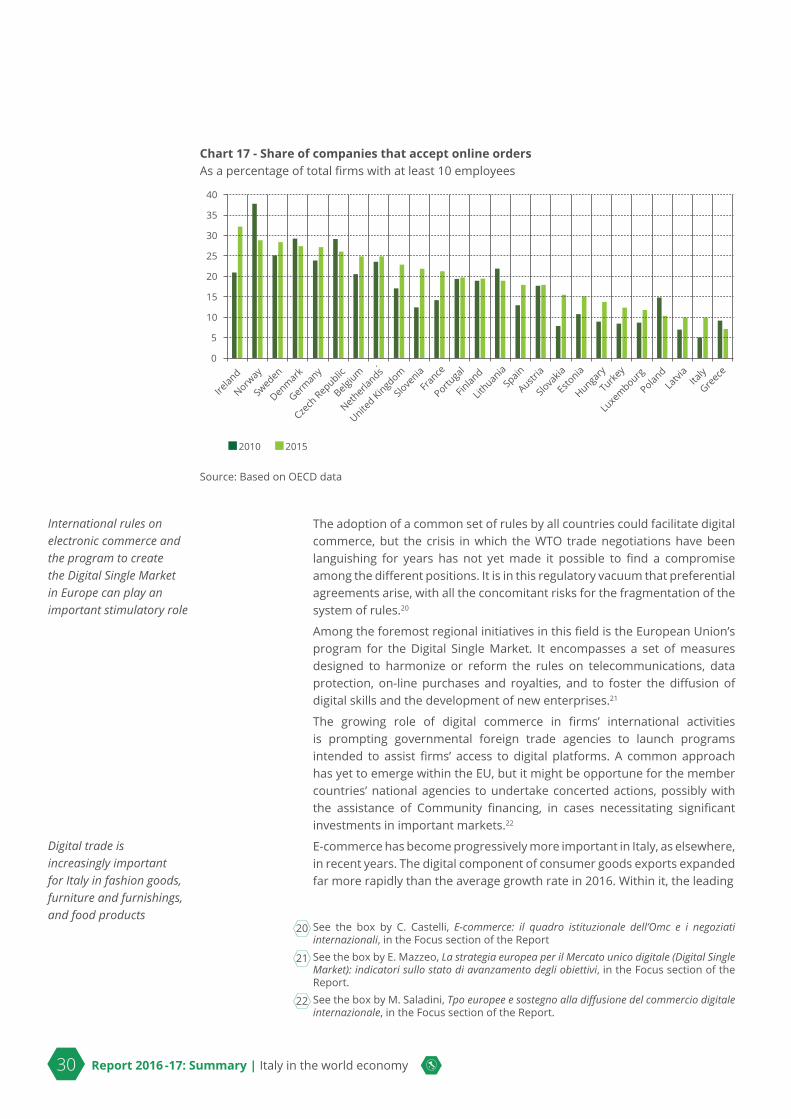
Although it has made significant progress in recent years, Italy still lags behind in most of the indicators of the digital economy, particularly those bearing on households’ and firms’ access to the network.
The digital revolution is transforming modes of production and market structures, creating formidable challenges and opportunities
Italy still lags behind in the digitalization of economic activities
30 Report 2016 -17: Summary | Italy in the world economy
Chart 17 - Share of companies that accept online orders As a percentage of total firms with at least 10 employees
0
5
10
15
20
25
30
35
40
Grafico 3 Quota di imprese che accettano ordini on-line In percentuale sul totale delle imprese con almeno 10 addetti
2010 2015
Fonte: elaborazioni su dati Ocse
Turkey
Finland
Denmark
Netherla
nds
Norway
United Kingd
om
Sweden
Estonia
Germany
France
Belgium
Austria
Czech
Republic
Ireland
Slova
kiaLa
tvia
Spain
Hungary
Slove
nia
Lithuania
Poland
Portuga
l
Greece
Italy
Luxe
mbourg
Source: Based on OECD data
The adoption of a common set of rules by all countries could facilitate digital commerce, but the crisis in which the WTO trade negotiations have been languishing for years has not yet made it possible to find a compromise among the different positions. It is in this regulatory vacuum that preferential agreements arise, with all the concomitant risks for the fragmentation of the system of rules.20
Among the foremost regional initiatives in this field is the European Union’s program for the Digital Single Market. It encompasses a set of measures designed to harmonize or reform the rules on telecommunications, data protection, on-line purchases and royalties, and to foster the diffusion of digital skills and the development of new enterprises.21
The growing role of digital commerce in firms’ international activities is prompting governmental foreign trade agencies to launch programs intended to assist firms’ access to digital platforms. A common approach has yet to emerge within the EU, but it might be opportune for the member countries’ national agencies to undertake concerted actions, possibly with the assistance of Community financing, in cases necessitating significant investments in important markets.22
E-commerce has become progressively more important in Italy, as elsewhere, in recent years. The digital component of consumer goods exports expanded far more rapidly than the average growth rate in 2016. Within it, the leading
20 See the box by C. Castelli, E-commerce: il quadro istituzionale dell’Omc e i negoziati internazionali, in the Focus section of the Report
21 See the box by E. Mazzeo, La strategia europea per il Mercato unico digitale (Digital Single Market): indicatori sullo stato di avanzamento degli obiettivi, in the Focus section of the Report.
22 See the box by M. Saladini, Tpo europee e sostegno alla diffusione del commercio digitale internazionale, in the Focus section of the Report.
International rules on electronic commerce and the program to create the Digital Single Market in Europe can play an important stimulatory role
Digital trade is increasingly important for Italy in fashion goods, furniture and furnishings, and food products
Report 2016 -17: Summary | Italy in the world economy 31
sector was fashion goods, followed by food products, and furniture and furnishings. In this field firms have developed complex strategies that involve choosing from among different communication, commercial and logistical channels and payment systems, taking account of the customs and legal problems present in the different markets.23
By lowering access costs, the introduction of digital -commerce technologies enables smaller firms to enter international markets more easily. The use of these technologies is important for promoting access to foreign markets, but this positive relation is more readily apparent in firms that have other favorable characteristics, including the availability of resources and competencies that are up to the standards of international competition.24
Digitalization is not limited to marketing and distribution, but pervades ever more intensely the entire value chain. The technologies of the “fourth industrial revolution” are rapidly changing the paradigm of manufacturing by dematerializing processes and increasing the service content of industrial products. Digitalization of manufacturing makes it possible to reduce delivery times and enhance the personalization of products, with beneficial effects on international competitiveness. The firms of the “made in Italy” sectors, including the smaller ones, are increasingly adopting digital manufacturing methods, although they have to recover ground in the technologies connected with the Internet of things.25
These changes can also affect the location of production activities among the various countries. The expected benefits from adopting additive manufacturing techniques, particularly 3D printing, can be traced to a number of factors that affect multinational corporations’ location strategies. They suggest that such technologies may influence firms to re-shore operations and internalize previously outsourced activities.26
23 See the analysis by M. Giuffrida and L. Tajoli, Le esportazioni digitali italiane, in the Focus section of the Report.
24 See the analysis by A. Nurra and S. Salamone, Profilo digitale e propensione all’esportazione delle microimprese, in the Focus section of the Report.
25 See the analysis by D. Pejcic and G. Toschi, Digitalizzazione dei processi produttivi ed export: quale legame?, in the Focus section of the Report.
26 See the analysis by L. Fratocchi, Le tecnologie produttive additive come fattore abilitante del rimpatrio delle produzioni: alcune prime considerazioni , in the Focus section of the Report.
The “fourth industrial revolution” can improve firms’ competitiveness, opening up new opportunities for SMEs alongside other firms

32 Report 2016 -17: Summary | Italy in the world economy
7. Policies for internationalizationIn 2016 the public system of support for internationalization directly assisted more than 87,000 Italian entities – primarily firms producing goods or services, but also associations, territorial organizations and consulting firms of various kinds, which redistributed the technical assistance they received among an even wider spectrum of users.
The number of direct users diminished by more than 17,000 compared with 2015; the main increases involved the Ministry for Economic Development, ICE and Simest; the number of firms served by the Chambers of Commerce fell significantly, while the size of the customer base of both Sace and Cassa Depositi e Prestiti (CDP) remained basically unchanged.
During the year there was a further increase in spending for promotional services, above all by the Ministry for Economic Development (MSE) and the ICE – Italian Trade Agency (hereafter ICE), whose expenditure rose respectively from €6 million to €26 million and from €110 million to €134 million. Spending on promotional activities by the regions and autonomous provinces fell from €106 million to €81 million, while that by the Chambers of Commerce declined from €40 million to €32 million.
Regarding financial services, in 2016 the number of Sace’s customer firms decreased by 254 to 23,190, while gross premiums grew to €601 million and insurance commitments jumped from €9.8 billion to €13.2 billion. CDP distributed its investments in support of transactions with foreign counterparties among a smaller number of customer firms. The amount of its equity investments practically quadrupled to €4.9 billion and the value of the transactions assisted grew to more than €7.8 billion. Accordingly, the average value per transaction rose sharply, while the percentage stakes taken by CDP in new investments were larger than in the previous year. As for Simest, the growth in its number of customer firms from 110 to 379 was accompanied by a less sharp but nonetheless considerable rise both in the amount of own funds invested, to €536 million, and the value of transactions assisted, to more than €6 billion.
Last year saw a reconfirmation of the public commitment for the Plan for the Extraordinary Promotion of “Made in Italy” Products and to Attract Investment, which flanks the programs already in place on an ordinary basis. The Plan’s objectives are to increase the number of firms, especially SMEs, that operate in the global market, expand Italy’s shares of international trade, enhance the value of the “made in Italy” brand in the world, and support initiatives to attract foreign investment to Italy.27 Among the extraordinary projects financed by the Plan, the ongoing “Roadshow for Internationalization”, launched in 2014, proceeded successfully.28
The organizational strengthening of SMEs, whose structure is often inadequate to the challenges encountered in international markets, not just because of their size but, more importantly, because they lack specific professional competencies, was addressed again in 2016 through the
27 For details on the Plan's lines of activity and its results, see the box Il piano straordinario per la promozione del made in Italy e l'attrazione degli investimenti: i primi risultati, in Chapter 7.
28 See the box 2017, il Roadshow diventa smart, in Chapter 7.
The public commitment in support of firms’ internationalization strengthened further

Report 2016 -17: Summary | Italy in the world economy 33
disbursement of vouchers for internationalization that can be used to purchase temporary export management services at a discount. Support for the adoption of innovative commercial penetration strategies is also delivered through programs to promote e-commerce and via agreements with large-scale distributors, to overcome the absence of quality Italian products on retailers’ shelves.29
A key role continues to be played by institutionally-led business missions focused on countries that are especially promising in view of their complementarity with Italy’s productive economy and the overall level of bilateral relations, as well as for their growth rates in recent years. The targets selected for missions also include countries that had been relatively inaccessible for years but have now returned to the global markets thanks to geopolitical developments. Business missions were conducted in South Korea, Iran, Tunisia, Argentina, Cuba, Brazil and Pakistan in 2016, and in Oman, Australia and India in the first six months of 2017.
In October 2016, on the occasion of its fifth meeting, the Guidance Committee for International Italy, comprising institutions and private entities involved in policies for internationalization, drew a balance of the first six months of implementation of the Extraordinary Plan and updated the priorities for promotional action in terms of markets, sectors and forms of intervention in the light of geopolitical conditions, demand dynamics and the position of Italian firms. The strategy for 2017 calls for stepped-up support for the digital economy, actions in keeping with the government’s “Industry 4.0” plan, the “Roadshow for Internationalization and to Attract Investment”, training and advisory projects for firms, communication initiatives and promotion of “made in Italy” products in large-scale distributors, and measures to fight Italian-sounding product names.
Concerning the activity of the ICE specifically, in addition to the above-mentioned growth in spending on promotional initiatives to a record high level, there was an increase in the provision of assistance services (though the related revenues remained unchanged), information services and, notably, training services. The effort to attract foreign investment expanded significantly with further sectoral diversification and the inauguration of dedicated desks in important financial centers abroad. The Ministry for Economic Development refinanced the Plan for Southern Exports, which was extended to other regions in the light of the positive results for the firms that participated in its activities in the first three years.
According to preliminary studies conducted by the ICE and Istat, the firms served by the ICE increased their sales abroad by 5 percent between 2014 and 2016, compared with a 10 percent decrease in those of a control sample of firms of similar size and sectoral characteristics.
29 See the box Azioni di promozione dell’Ice-Agenzia con la grande distribuzione organizzata nel mondo, in Chapter 7.
Coordination improves among the actors involved in policies for internationalization, and the role of institutionally-led business missions remains crucial
The ICE strengthened all its business service activities, whose impact on exports appears to be positive
34 Report 2016 -17: Summary | Italy in the world economy
Concluding remarksThe world economic recovery is gathering strength, driven mainly by the acceleration in growth in the emerging and developing regions.
World trade also appears to be gaining pace, after years of seeing its expansion curbed by the transition in China and other Asian countries from an export-led development model to one based on domestic demand.
These positive signals are, however, exposed to the numerous factors of uncertainty in international relations, notably the risk that the congeries of economic problems and social imbalances accentuated by the global crisis that erupted in 2008 may breathe new life into nationalist and protectionist tendencies that would sap the foundation of the recovery.
The danger is especially evident in Europe, where the process of integration initiated sixty years ago with the Treaty of Rome appears to have lost that capacity to forge consensus that had permitted its progressive deepening and its enlargement to a growing number of countries.
In some respects, the situation is paradoxical: the search for national solutions to the challenges posed by the major environmental, demographic and technological challenges of our time has gained credibility precisely during a phase when its illusory nature should be more obvious. The idea that when problems transcend national borders, recourse to supranational institutions does not mean a surrender of power to technocratic bureaucracies but, on the contrary, is the only effective way to exercise popular sovereignty is struggling to make headway.
The economic and social benefits of international integration are especially evident in a country like Italy, which has built an original development path on that foundation, turning to account, in open markets, the local identity of its industrial districts, as we have learned from the teachings of Giacomo Becattini.
The last great recession would have been even more severe if many Italian firms had not found opportunities abroad to compensate for the fall in domestic demand. And now, when domestic consumption and investment are finally supporting a recovery that is gaining traction, the performance of employment is still better in exporting firms – including those most deeply engaged in international value chains – than in firms active only within Italy.
After a long phase of decline, in the past few years Italian exports’ world market shares have recouped some ground, assisted by shifts in the composition of world demand favorable to “made in Italy” products. At the same time, Italian industry’s model of specialization has partly changed, bringing out comparative advantages in sectors others than the traditional ones. The best firms, tempered by the selection engendered by globalization and the crisis, have become bigger and achieved significant competitive successes both in exports and in participation in international value chains.
However, important segments of the Italian economy are still excluded from the positive feedback loop between innovation and internationalization that underlies the growth of the best firms. And the crisis has hit them hard.
On the whole, the international openness of the Italian economy is still not on a par with that of other European countries of comparable size, particularly
Report 2016 -17: Summary | Italy in the world economy 35
as regards the ability to attract foreign direct investment. An expanded presence in Italy of multinationals could bring important benefits, owing not only to the direct impact of their investments but also to the possible consequent diffusion of technological and organizational competencies.
At the same time, Italian firms’ direct investment abroad is still below potential, particularly in advanced countries, where such a presence would be especially useful to augment their market power.
Focusing on exports, it is well known that in order to sustain the greater costs of access to foreign markets, firms must have adequate productivity and size. In some sectors, the importance of scale economies makes it necessary for firms to grow beyond a certain size threshold, while in others the decisive constraint concerns factor productivity, which depends crucially on the quality of human resources.
Small firms that have adequate characteristics in terms of managerial expertise and workers’ skill sets, can therefore, like other companies, identify paths of competitive success and growth on international markets.
These opportunities are multiplying rapidly in the new technological and economic landscape created by the digitalization of commerce and productive activities. On the one hand, the “fourth industrial revolution” has brought to completion the process of unification of global markets that has already unleashed powerful thrusts toward oligopolistic concentration. On the other, by drastically lowering the physical-capital-intensity of production processes, the digital economy enables small enterprises as well to strike out on new paths of access to ever larger markets.
These transformations also pose major challenges for the public system of support for internationalization. It is no longer sufficient to assist the companies already present on foreign markets by endeavoring to promote an expansion in their exports and production abroad with the traditional instruments of real and financial support. Nor is it sufficient to engage in the commendable effort to increase the number of exporting firms by disseminating in Italy’s local production systems the competencies necessary to enter foreign markets. Nor is it sufficient to intensify the efforts to attract foreign talent and capital to Italy, thereby narrowing the gap that still separates us from the other main European countries.
It is necessary to rethink all these lines of intervention – and the other instruments of industrial policies – in order to adapt them to the new digital paradigm, to the profound changes taking shape in production methods and commercial structures. The evidence suggests that the crucial factor will remain the quality of human resources, which by implication involves the social mechanisms for the creation and diffusion of knowledge, on which firms’ productivity and innovative capacity depend.
The processes in question can function far more effectively if they unfold in contexts exposed to external competition. For this reason, too, it is necessary to continue working with dedication to foster the further international openness of the Italian economy. It is a question of supporting the action of the European Commission for the success of the international trade negotiations while mobilizing every possible instrument of industrial policy that can serve to promote the international activities of Italian firms.

36 Report 2016 -17: Summary | Italy in the world economy
Report 2016 -17: Summary | Italy in the world economy 37
STATISTICALTABLES
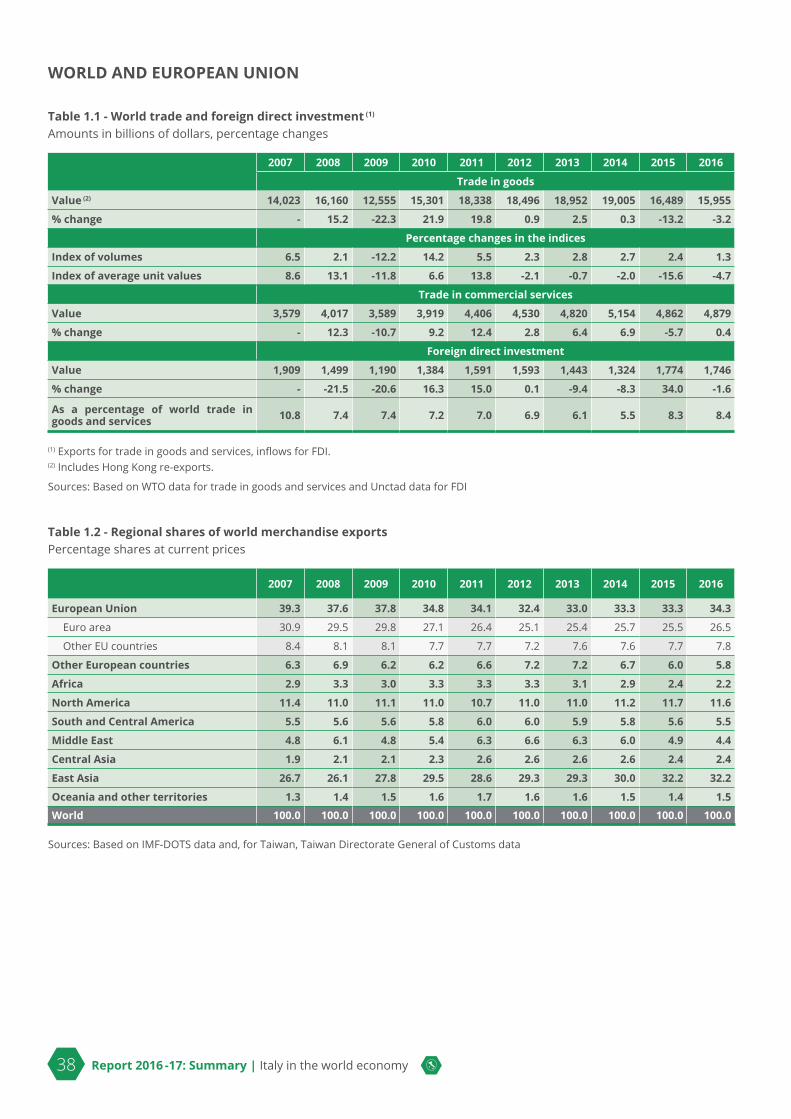
38 Report 2016 -17: Summary | Italy in the world economy
Table 1.1 - World trade and foreign direct investment (1)
Amounts in billions of dollars, percentage changes
2007 2008 2009 2010 2011 2012 2013 2014 2015 2016
Trade in goods
Value (2) 14,023 16,160 12,555 15,301 18,338 18,496 18,952 19,005 16,489 15,955
% change - 15.2 -22.3 21.9 19.8 0.9 2.5 0.3 -13.2 -3.2
Percentage changes in the indices
Index of volumes 6.5 2.1 -12.2 14.2 5.5 2.3 2.8 2.7 2.4 1.3
Index of average unit values 8.6 13.1 -11.8 6.6 13.8 -2.1 -0.7 -2.0 -15.6 -4.7
Trade in commercial services
Value 3,579 4,017 3,589 3,919 4,406 4,530 4,820 5,154 4,862 4,879
% change - 12.3 -10.7 9.2 12.4 2.8 6.4 6.9 -5.7 0.4
Foreign direct investment
Value 1,909 1,499 1,190 1,384 1,591 1,593 1,443 1,324 1,774 1,746
% change - -21.5 -20.6 16.3 15.0 0.1 -9.4 -8.3 34.0 -1.6
As a percentage of world trade in goods and services 10.8 7.4 7.4 7.2 7.0 6.9 6.1 5.5 8.3 8.4
(1) Exports for trade in goods and services, inflows for FDI.(2) Includes Hong Kong re-exports.
Sources: Based on WTO data for trade in goods and services and Unctad data for FDI
Table 1.2 - Regional shares of world merchandise exportsPercentage shares at current prices
2007 2008 2009 2010 2011 2012 2013 2014 2015 2016
European Union 39.3 37.6 37.8 34.8 34.1 32.4 33.0 33.3 33.3 34.3
Euro area 30.9 29.5 29.8 27.1 26.4 25.1 25.4 25.7 25.5 26.5
Other EU countries 8.4 8.1 8.1 7.7 7.7 7.2 7.6 7.6 7.7 7.8
Other European countries 6.3 6.9 6.2 6.2 6.6 7.2 7.2 6.7 6.0 5.8
Africa 2.9 3.3 3.0 3.3 3.3 3.3 3.1 2.9 2.4 2.2
North America 11.4 11.0 11.1 11.0 10.7 11.0 11.0 11.2 11.7 11.6
South and Central America 5.5 5.6 5.6 5.8 6.0 6.0 5.9 5.8 5.6 5.5
Middle East 4.8 6.1 4.8 5.4 6.3 6.6 6.3 6.0 4.9 4.4
Central Asia 1.9 2.1 2.1 2.3 2.6 2.6 2.6 2.6 2.4 2.4
East Asia 26.7 26.1 27.8 29.5 28.6 29.3 29.3 30.0 32.2 32.2
Oceania and other territories 1.3 1.4 1.5 1.6 1.7 1.6 1.6 1.5 1.4 1.5
World 100.0 100.0 100.0 100.0 100.0 100.0 100.0 100.0 100.0 100.0
Sources: Based on IMF-DOTS data and, for Taiwan, Taiwan Directorate General of Customs data
WORLD AND EUROPEAN UNION

Report 2016 -17: Summary | Italy in the world economy 39
Table 1.3 - Regional shares of world merchandise importsPercentage shares at current prices
2007 2008 2009 2010 2011 2012 2013 2014 2015 2016
European Union 39.9 38.7 37.8 35.2 34.6 32.2 32.1 32.5 32.2 33.0
Euro area 29.9 29.1 28.6 26.4 26.0 23.9 23.9 24.1 23.6 24.1
Other EU countries 10.0 9.6 9.2 8.7 8.6 8.3 8.1 8.4 8.6 8.9
Other European countries 5.4 5.8 5.2 5.4 5.8 6.2 6.3 5.7 5.2 5.3
Africa 2.6 2.9 3.3 3.2 3.1 3.2 3.4 3.4 3.4 3.1
North America 17.1 15.9 15.4 15.6 14.7 15.0 14.8 15.1 16.3 16.3
South and Central America 5.3 5.6 5.4 5.8 5.9 6.2 6.2 6.2 6.3 5.8
Middle East 3.3 3.7 4.2 3.9 3.8 4.2 4.5 4.6 5.1 4.9
Central Asia 2.5 2.9 3.0 3.2 3.5 3.7 3.6 3.5 3.4 3.3
East Asia 22.3 23.0 23.9 26.2 26.8 27.5 27.5 27.4 26.4 26.5
Oceania and other territories 1.5 1.5 1.6 1.6 1.7 1.8 1.6 1.6 1.6 1.6World 100.0 100.0 100.0 100.0 100.0 100.0 100.0 100.0 100.0 100.0
Sources: Based on IMF-DOTS data and, for Taiwan, Taiwan Directorate General of Customs data

40 Report 2016 -17: Summary | Italy in the world economy
Table 1.4 - Top ten world merchandise exportersAmounts in billions of current dollars and percentage changes on previous year
RankCountry
Value % change % share
2011 2015 2016 2015 2016 2012-16(1) 2016 2011 2015 2016
1 1 1 China 2,273 2,098 2.2 -7.7 10.4 13.8 13.2
2 2 2 United States 1,503 1,455 2.0 -3.2 8.1 9.1 9.1
3 3 3 Germany 1,327 1,340 2.0 1.0 8.0 8.0 8.4
4 4 4 Japan 625 645 1.6 3.2 4.5 3.8 4.0
5 5 5 Netherlands 570 570 1.7 0.0 3.6 3.5 3.6
9 7 6 Hong Kong 511 517 2.3 1.2 2.5 3.1 3.2
6 8 7 France 506 501 1.8 -0.9 3.3 3.1 3.1
7 6 8 South Korea 527 495 1.9 -5.9 3.0 3.2 3.1
8 10 9 Italy 457 462 1.9 0.9 2.9 2.8 2.9
10 9 10 United Kingdom 460 409 1.7 -11.0 2.8 2.8 2.6
Sum of top 10 countries 8,758 8,491 2.0 -3.0 49.3 53.1 53.2
World 16,489 15,955 1.7 -3.2 100.0 100.0 100.0
(1) Average annual growth rate, starting from 2011.
Source: Based on WTO data
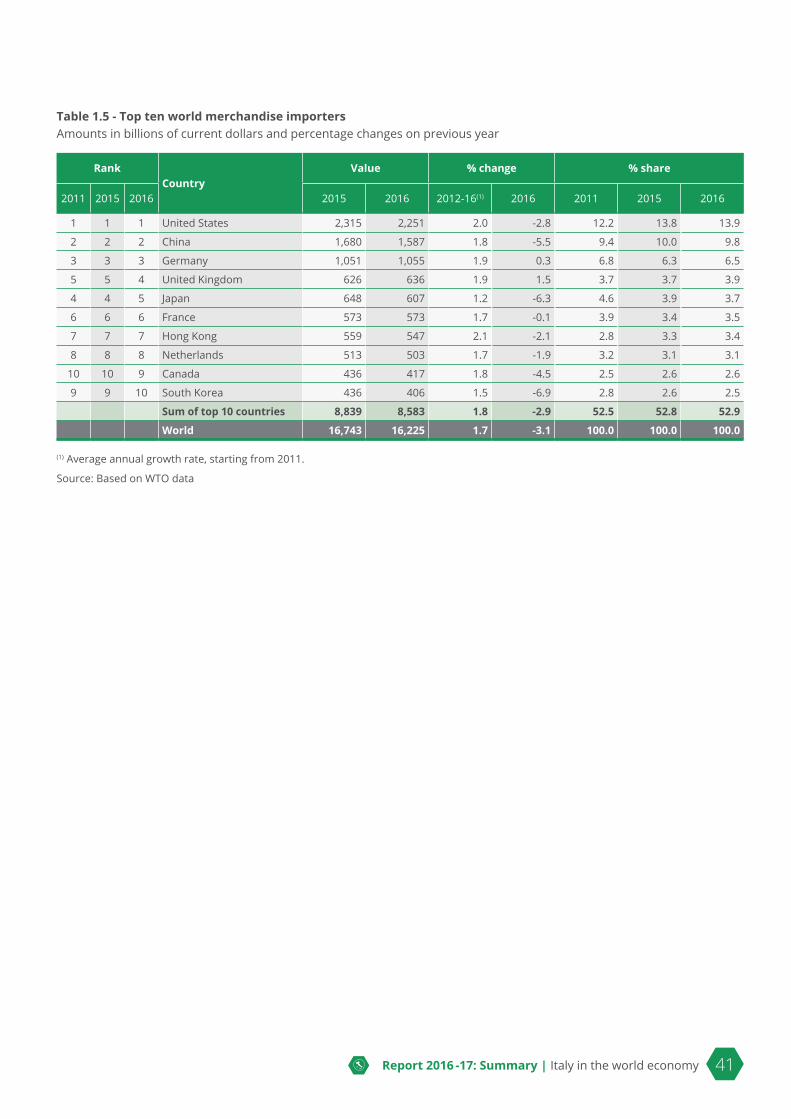
Report 2016 -17: Summary | Italy in the world economy 41
Table 1.5 - Top ten world merchandise importersAmounts in billions of current dollars and percentage changes on previous year
RankCountry
Value % change % share
2011 2015 2016 2015 2016 2012-16(1) 2016 2011 2015 2016
1 1 1 United States 2,315 2,251 2.0 -2.8 12.2 13.8 13.9
2 2 2 China 1,680 1,587 1.8 -5.5 9.4 10.0 9.8
3 3 3 Germany 1,051 1,055 1.9 0.3 6.8 6.3 6.5
5 5 4 United Kingdom 626 636 1.9 1.5 3.7 3.7 3.9
4 4 5 Japan 648 607 1.2 -6.3 4.6 3.9 3.7
6 6 6 France 573 573 1.7 -0.1 3.9 3.4 3.5
7 7 7 Hong Kong 559 547 2.1 -2.1 2.8 3.3 3.4
8 8 8 Netherlands 513 503 1.7 -1.9 3.2 3.1 3.1
10 10 9 Canada 436 417 1.8 -4.5 2.5 2.6 2.6
9 9 10 South Korea 436 406 1.5 -6.9 2.8 2.6 2.5
Sum of top 10 countries 8,839 8,583 1.8 -2.9 52.5 52.8 52.9
World 16,743 16,225 1.7 -3.1 100.0 100.0 100.0
(1) Average annual growth rate, starting from 2011.
Source: Based on WTO data
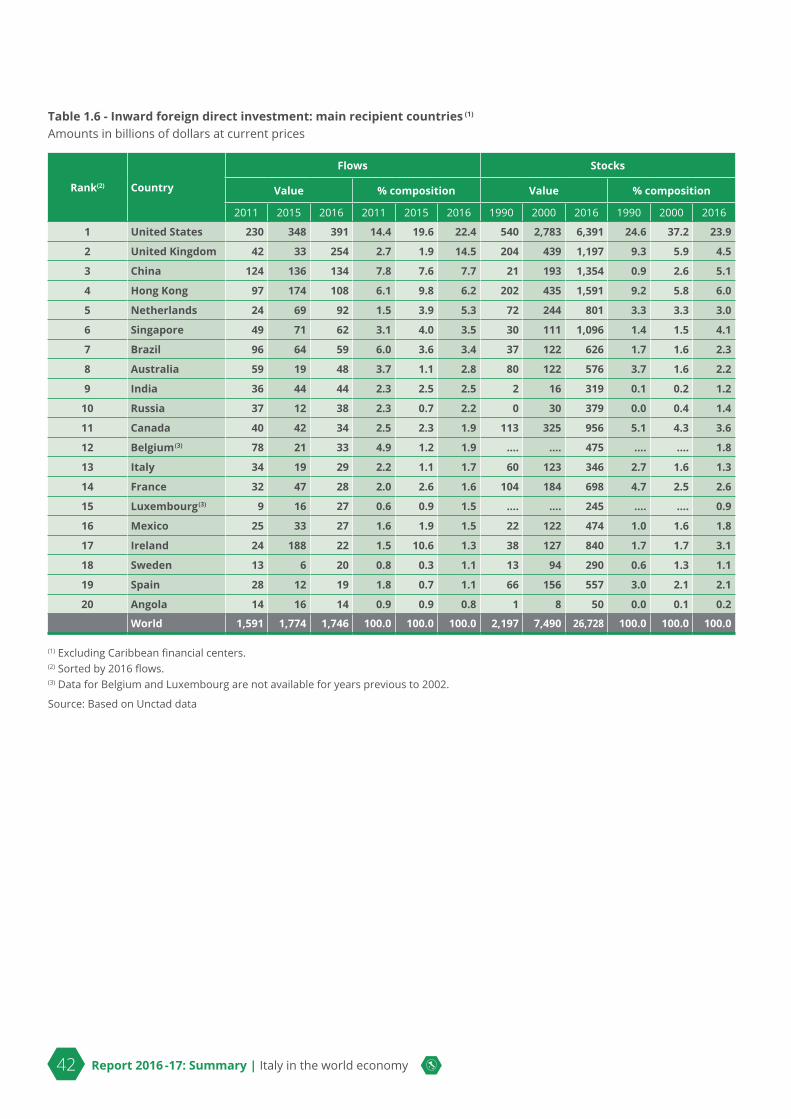
42 Report 2016 -17: Summary | Italy in the world economy
Table 1.6 - Inward foreign direct investment: main recipient countries (1)
Amounts in billions of dollars at current prices
Rank(2) Country
Flows Stocks
Value % composition Value % composition
2011 2015 2016 2011 2015 2016 1990 2000 2016 1990 2000 2016
1 United States 230 348 391 14.4 19.6 22.4 540 2,783 6,391 24.6 37.2 23.9
2 United Kingdom 42 33 254 2.7 1.9 14.5 204 439 1,197 9.3 5.9 4.5
3 China 124 136 134 7.8 7.6 7.7 21 193 1,354 0.9 2.6 5.1
4 Hong Kong 97 174 108 6.1 9.8 6.2 202 435 1,591 9.2 5.8 6.0
5 Netherlands 24 69 92 1.5 3.9 5.3 72 244 801 3.3 3.3 3.0
6 Singapore 49 71 62 3.1 4.0 3.5 30 111 1,096 1.4 1.5 4.1
7 Brazil 96 64 59 6.0 3.6 3.4 37 122 626 1.7 1.6 2.3
8 Australia 59 19 48 3.7 1.1 2.8 80 122 576 3.7 1.6 2.2
9 India 36 44 44 2.3 2.5 2.5 2 16 319 0.1 0.2 1.2
10 Russia 37 12 38 2.3 0.7 2.2 0 30 379 0.0 0.4 1.4
11 Canada 40 42 34 2.5 2.3 1.9 113 325 956 5.1 4.3 3.6
12 Belgium (3) 78 21 33 4.9 1.2 1.9 .... .... 475 .... .... 1.8
13 Italy 34 19 29 2.2 1.1 1.7 60 123 346 2.7 1.6 1.3
14 France 32 47 28 2.0 2.6 1.6 104 184 698 4.7 2.5 2.6
15 Luxembourg (3) 9 16 27 0.6 0.9 1.5 .... .... 245 .... .... 0.9
16 Mexico 25 33 27 1.6 1.9 1.5 22 122 474 1.0 1.6 1.8
17 Ireland 24 188 22 1.5 10.6 1.3 38 127 840 1.7 1.7 3.1
18 Sweden 13 6 20 0.8 0.3 1.1 13 94 290 0.6 1.3 1.1
19 Spain 28 12 19 1.8 0.7 1.1 66 156 557 3.0 2.1 2.1
20 Angola 14 16 14 0.9 0.9 0.8 1 8 50 0.0 0.1 0.2
World 1,591 1,774 1,746 100.0 100.0 100.0 2,197 7,490 26,728 100.0 100.0 100.0
(1) Excluding Caribbean financial centers.(2) Sorted by 2016 flows.(3) Data for Belgium and Luxembourg are not available for years previous to 2002.
Source: Based on Unctad data
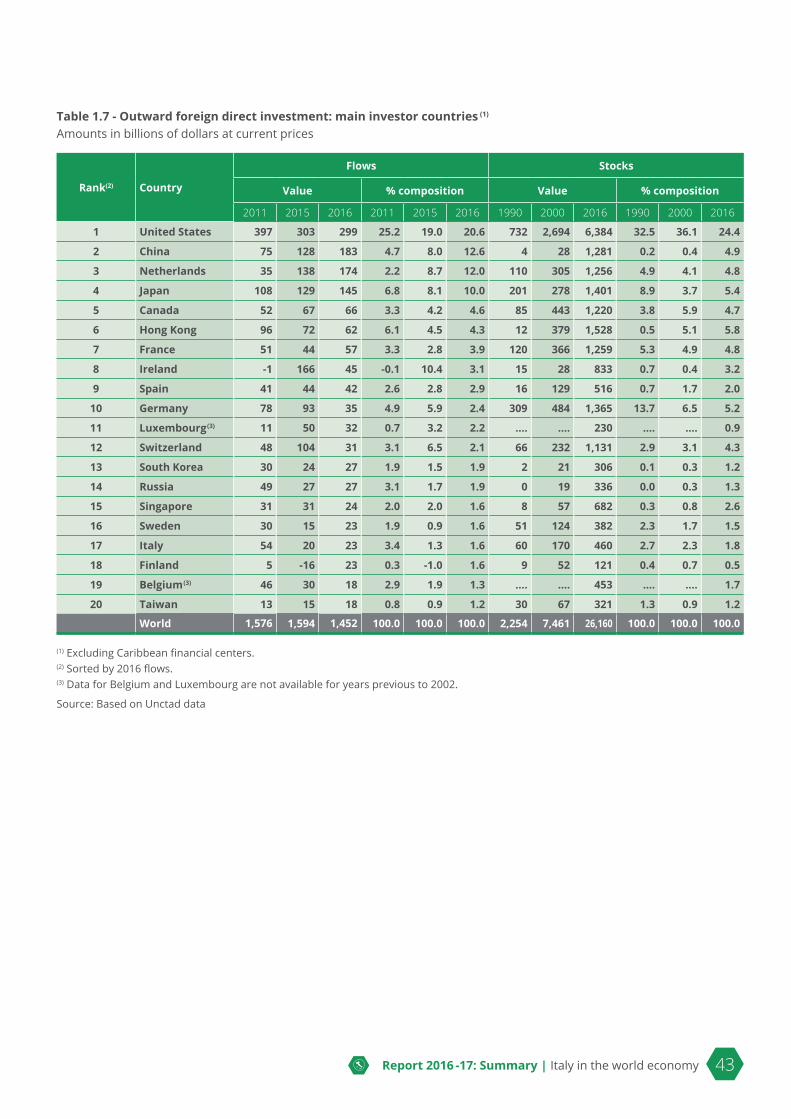
Report 2016 -17: Summary | Italy in the world economy 43
Table 1.7 - Outward foreign direct investment: main investor countries (1)
Amounts in billions of dollars at current prices
Rank(2) Country
Flows Stocks
Value % composition Value % composition
2011 2015 2016 2011 2015 2016 1990 2000 2016 1990 2000 2016
1 United States 397 303 299 25.2 19.0 20.6 732 2,694 6,384 32.5 36.1 24.4
2 China 75 128 183 4.7 8.0 12.6 4 28 1,281 0.2 0.4 4.9
3 Netherlands 35 138 174 2.2 8.7 12.0 110 305 1,256 4.9 4.1 4.8
4 Japan 108 129 145 6.8 8.1 10.0 201 278 1,401 8.9 3.7 5.4
5 Canada 52 67 66 3.3 4.2 4.6 85 443 1,220 3.8 5.9 4.7
6 Hong Kong 96 72 62 6.1 4.5 4.3 12 379 1,528 0.5 5.1 5.8
7 France 51 44 57 3.3 2.8 3.9 120 366 1,259 5.3 4.9 4.8
8 Ireland -1 166 45 -0.1 10.4 3.1 15 28 833 0.7 0.4 3.2
9 Spain 41 44 42 2.6 2.8 2.9 16 129 516 0.7 1.7 2.0
10 Germany 78 93 35 4.9 5.9 2.4 309 484 1,365 13.7 6.5 5.2
11 Luxembourg (3) 11 50 32 0.7 3.2 2.2 .... .... 230 .... .... 0.9
12 Switzerland 48 104 31 3.1 6.5 2.1 66 232 1,131 2.9 3.1 4.3
13 South Korea 30 24 27 1.9 1.5 1.9 2 21 306 0.1 0.3 1.2
14 Russia 49 27 27 3.1 1.7 1.9 0 19 336 0.0 0.3 1.3
15 Singapore 31 31 24 2.0 2.0 1.6 8 57 682 0.3 0.8 2.6
16 Sweden 30 15 23 1.9 0.9 1.6 51 124 382 2.3 1.7 1.5
17 Italy 54 20 23 3.4 1.3 1.6 60 170 460 2.7 2.3 1.8
18 Finland 5 -16 23 0.3 -1.0 1.6 9 52 121 0.4 0.7 0.5
19 Belgium (3) 46 30 18 2.9 1.9 1.3 .... .... 453 .... .... 1.7
20 Taiwan 13 15 18 0.8 0.9 1.2 30 67 321 1.3 0.9 1.2
World 1,576 1,594 1,452 100.0 100.0 100.0 2,254 7,461 26,160 100.0 100.0 100.0
(1) Excluding Caribbean financial centers.(2) Sorted by 2016 flows.(3) Data for Belgium and Luxembourg are not available for years previous to 2002.
Source: Based on Unctad data

44 Report 2016 -17: Summary | Italy in the world economy
ITALY
Table 2.1 - Italy’s balance of paymentsMillions of euros
2012 2013 2014 2015 2016
Current account -5,822 15,406 30,482 23,734 42,755
Capital account 3,959 -369 3,036 2,609 -2,117
Financial account -10,166 12,753 43,818 27,440 63,851
Direct investment 5,293 650 2,331 2,691 -5,569
Abroad 5,241 15,288 15,259 14,397 19,462
In Italy -52 14,638 12,928 11,706 25,032
Portfolio investment -24,384 -13,190 -3,551 89,492 153,937
Assets -59,972 22,030 94,152 112,020 78,727
Liabilities -35,589 35,220 97,704 22,528 -75,210
Other investment 1,625 20,731 49,573 -68,639 -86,505
Assets 32,901 -25,038 17,508 -21,351 6,342
Liabilities 31,276 -45,769 -32,065 47,288 92,847
Financial derivatives 5,839 3,035 -3,581 3,362 3,163
Change in reserve assets 1,461 1,528 -953 535 -1,175
Errors and omissions -8,303 -2,283 10,300 1,097 23,213
Current account
2012 2013 2014 2015 2016
Goods (FOB-FOB) 16,829 36,099 47,407 50,728 59,931
Services -123 443 -1,017 -2,750 -3,187
Transport -8,223 -7,934 -8,286 -8,406 -8,306
Foreign travel 11,543 12,755 12,528 13,544 13,813
Other services -3,443 -4,377 -5,259 -7,888 -8,695
Primary income -3,012 -3,035 -46 -9,217 2,772
Labor income 3,677 2,988 3,579 4,284 4,314
Investment income -9,704 -9,332 -7,523 -15,667 -4,246
Other 3,015 3,309 3,898 2,166 2,705
Secondary income -19,516 -18,101 -15,861 -15,028 -16,761
Public administrations -13,597 -15,405 -13,692 -11,715 -14,019
Other sectors -5,918 -2,697 -2,170 -3,313 -2,742
of which: workers' remittances -6,347 -5,059 -4,729 -4,608 -4,428
Current account -5,822 15,406 30,482 23,734 42,755
Source: Based on Bank of Italy data
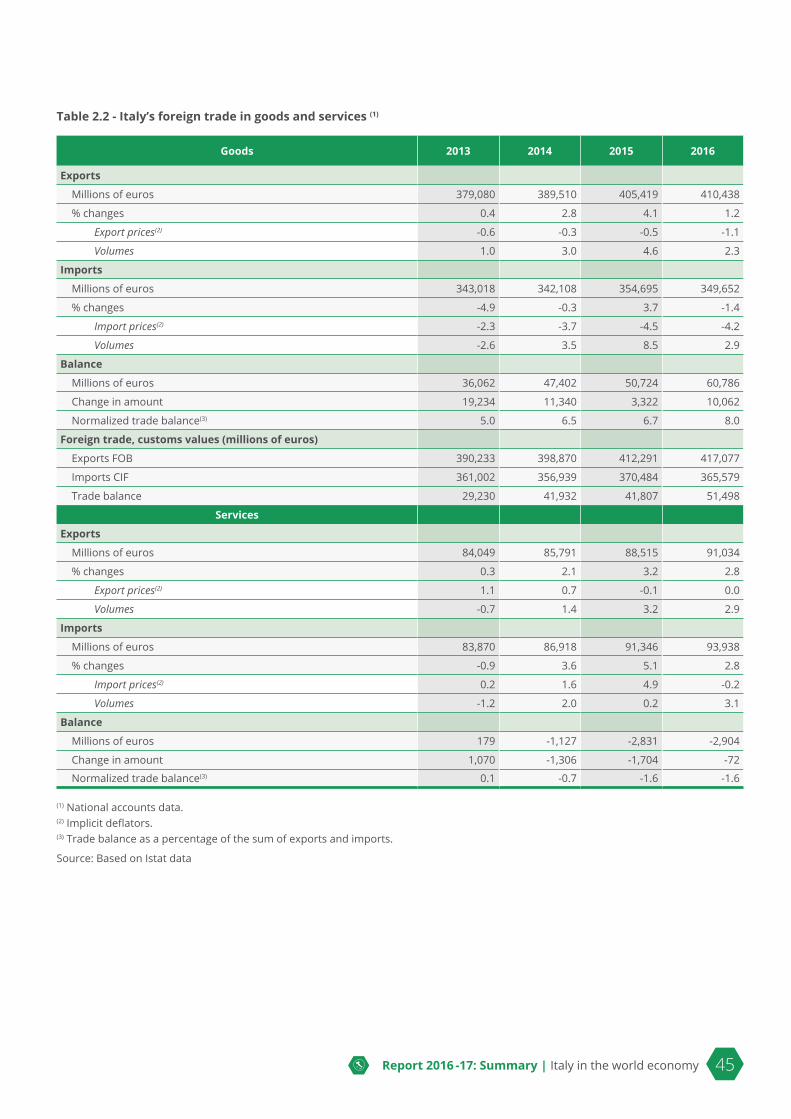
Report 2016 -17: Summary | Italy in the world economy 45
Table 2.2 - Italy’s foreign trade in goods and services (1)
Goods 2013 2014 2015 2016
Exports
Millions of euros 379,080 389,510 405,419 410,438
% changes 0.4 2.8 4.1 1.2
Export prices(2) -0.6 -0.3 -0.5 -1.1
Volumes 1.0 3.0 4.6 2.3
Imports
Millions of euros 343,018 342,108 354,695 349,652
% changes -4.9 -0.3 3.7 -1.4
Import prices(2) -2.3 -3.7 -4.5 -4.2
Volumes -2.6 3.5 8.5 2.9
Balance
Millions of euros 36,062 47,402 50,724 60,786
Change in amount 19,234 11,340 3,322 10,062
Normalized trade balance(3) 5.0 6.5 6.7 8.0
Foreign trade, customs values (millions of euros)
Exports FOB 390,233 398,870 412,291 417,077
Imports CIF 361,002 356,939 370,484 365,579
Trade balance 29,230 41,932 41,807 51,498
Services
Exports
Millions of euros 84,049 85,791 88,515 91,034
% changes 0.3 2.1 3.2 2.8
Export prices(2) 1.1 0.7 -0.1 0.0
Volumes -0.7 1.4 3.2 2.9
Imports
Millions of euros 83,870 86,918 91,346 93,938
% changes -0.9 3.6 5.1 2.8
Import prices(2) 0.2 1.6 4.9 -0.2
Volumes -1.2 2.0 0.2 3.1
Balance
Millions of euros 179 -1,127 -2,831 -2,904
Change in amount 1,070 -1,306 -1,704 -72
Normalized trade balance(3) 0.1 -0.7 -1.6 -1.6
(1) National accounts data.(2) Implicit deflators.(3) Trade balance as a percentage of the sum of exports and imports.
Source: Based on Istat data

46 Report 2016 -17: Summary | Italy in the world economy
Table 2.3 A - Constant-market-shares analysis of Italy’s share of world imports (1) (2)
1999 2010 2011 2012 2013 2014 2015 2016 2010-2016
Market share 3.82 2.78 2.75 2.64 2.67 2.75 2.79 2.90
change - -1.04 -0.03 -0.11 0.03 0.08 0.04 0.11 0.12
Competitiveness effect -0.55 0.00 0.01 -0.02 -0.01 -0.06 0.02 -0.05
Structure effect -0.55 -0.03 -0.11 0.05 0.08 0.12 0.11 0.22
sectoral -0.56 -0.05 -0.03 0.04 0.07 0.16 0.07 0.26
geographic -0.11 -0.01 -0.08 0.01 0.04 0.00 0.04 0.00
interaction 0.11 0.04 0.01 0.00 -0.03 -0.04 -0.01 -0.04
Adaptation effect 0.06 -0.01 -0.01 -0.01 0.00 -0.01 -0.02 -0.06
Table 2.3 B - Constant-market-shares analysis of Italy’s share of world imports from the euro area (1) (2)
1999 2010 2011 2012 2013 2014 2015 2016 2010-2016
Market share 12.29 10.56 10.58 10.68 10.63 10.74 10.75 10.89
change - -1.74 0.02 0.09 -0.05 0.11 0.02 0.14 0.33
Competitiveness effect -0.82 -0.05 0.13 -0.08 0.04 -0.02 0.09 0.12
Structure effect -1.07 0.08 0.05 0.05 0.14 0.10 0.08 0.51
sectoral -1.09 0.02 -0.04 0.09 0.07 0.10 0.09 0.33
geographic 0.27 0.04 0.07 -0.01 -0.02 0.01 -0.01 0.09
interaction -0.25 0.02 0.02 -0.04 0.09 -0.01 0.00 0.10
Adaptation effect 0.15 -0.01 -0.09 -0.01 -0.07 -0.07 -0.04 -0.29
(1) In place of the world, the analysis uses an aggregate consisting of the imports of 48 countries: the 28 European Union countries plus Argentina, Australia, Brazil, Canada, China, Hong Kong, India, Indonesia, Japan, Malaysia, Mexico, Philippines, Russia, Singapore, South Korea, United States, Switzerland, Taiwan, Thailand and Turkey. In 2016, these countries accounted for about 94 percent of total world imports.(2) The competitiveness effect is the weighted average of the changes in the elementary shares: it can be considered to reflect the changes in relative prices and in the other determinants of competitive success. The structure effect depends on the degree of conformity between the geographical and sectoral specialization of the country whose share is analyzed and the changes in the composition of demand in the market in question, while the adaptation effect measures flexibility with respect to such changes.
Sources: Based on data published by Eurostat and national statistical institutes
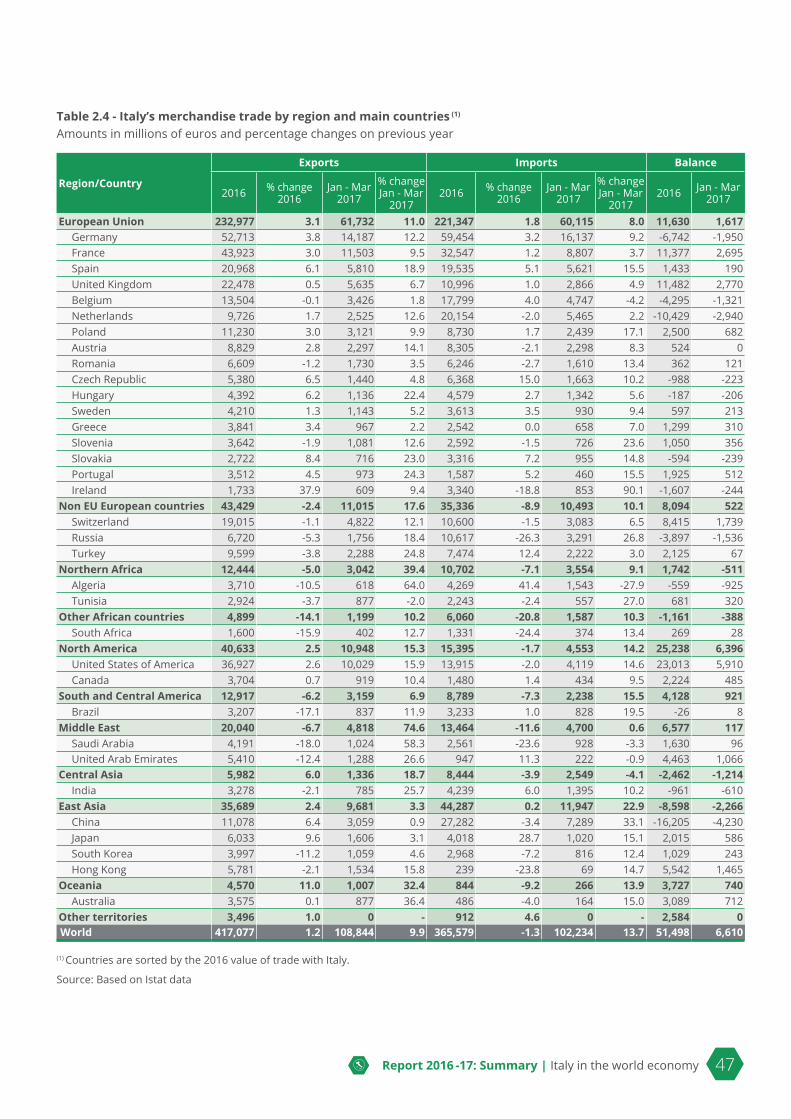
Report 2016 -17: Summary | Italy in the world economy 47
Table 2.4 - Italy’s merchandise trade by region and main countries (1)
Amounts in millions of euros and percentage changes on previous year
Region/Country
Exports Imports Balance
2016 % change2016
Jan - Mar 2017
% changeJan - Mar
20172016 % change
2016Jan - Mar
2017
% changeJan - Mar
20172016 Jan - Mar
2017
European Union 232,977 3.1 61,732 11.0 221,347 1.8 60,115 8.0 11,630 1,617Germany 52,713 3.8 14,187 12.2 59,454 3.2 16,137 9.2 -6,742 -1,950France 43,923 3.0 11,503 9.5 32,547 1.2 8,807 3.7 11,377 2,695Spain 20,968 6.1 5,810 18.9 19,535 5.1 5,621 15.5 1,433 190United Kingdom 22,478 0.5 5,635 6.7 10,996 1.0 2,866 4.9 11,482 2,770Belgium 13,504 -0.1 3,426 1.8 17,799 4.0 4,747 -4.2 -4,295 -1,321Netherlands 9,726 1.7 2,525 12.6 20,154 -2.0 5,465 2.2 -10,429 -2,940Poland 11,230 3.0 3,121 9.9 8,730 1.7 2,439 17.1 2,500 682Austria 8,829 2.8 2,297 14.1 8,305 -2.1 2,298 8.3 524 0Romania 6,609 -1.2 1,730 3.5 6,246 -2.7 1,610 13.4 362 121Czech Republic 5,380 6.5 1,440 4.8 6,368 15.0 1,663 10.2 -988 -223Hungary 4,392 6.2 1,136 22.4 4,579 2.7 1,342 5.6 -187 -206Sweden 4,210 1.3 1,143 5.2 3,613 3.5 930 9.4 597 213Greece 3,841 3.4 967 2.2 2,542 0.0 658 7.0 1,299 310Slovenia 3,642 -1.9 1,081 12.6 2,592 -1.5 726 23.6 1,050 356Slovakia 2,722 8.4 716 23.0 3,316 7.2 955 14.8 -594 -239Portugal 3,512 4.5 973 24.3 1,587 5.2 460 15.5 1,925 512Ireland 1,733 37.9 609 9.4 3,340 -18.8 853 90.1 -1,607 -244
Non EU European countries 43,429 -2.4 11,015 17.6 35,336 -8.9 10,493 10.1 8,094 522Switzerland 19,015 -1.1 4,822 12.1 10,600 -1.5 3,083 6.5 8,415 1,739Russia 6,720 -5.3 1,756 18.4 10,617 -26.3 3,291 26.8 -3,897 -1,536Turkey 9,599 -3.8 2,288 24.8 7,474 12.4 2,222 3.0 2,125 67
Northern Africa 12,444 -5.0 3,042 39.4 10,702 -7.1 3,554 9.1 1,742 -511Algeria 3,710 -10.5 618 64.0 4,269 41.4 1,543 -27.9 -559 -925Tunisia 2,924 -3.7 877 -2.0 2,243 -2.4 557 27.0 681 320
Other African countries 4,899 -14.1 1,199 10.2 6,060 -20.8 1,587 10.3 -1,161 -388South Africa 1,600 -15.9 402 12.7 1,331 -24.4 374 13.4 269 28
North America 40,633 2.5 10,948 15.3 15,395 -1.7 4,553 14.2 25,238 6,396United States of America 36,927 2.6 10,029 15.9 13,915 -2.0 4,119 14.6 23,013 5,910Canada 3,704 0.7 919 10.4 1,480 1.4 434 9.5 2,224 485
South and Central America 12,917 -6.2 3,159 6.9 8,789 -7.3 2,238 15.5 4,128 921Brazil 3,207 -17.1 837 11.9 3,233 1.0 828 19.5 -26 8
Middle East 20,040 -6.7 4,818 74.6 13,464 -11.6 4,700 0.6 6,577 117Saudi Arabia 4,191 -18.0 1,024 58.3 2,561 -23.6 928 -3.3 1,630 96United Arab Emirates 5,410 -12.4 1,288 26.6 947 11.3 222 -0.9 4,463 1,066
Central Asia 5,982 6.0 1,336 18.7 8,444 -3.9 2,549 -4.1 -2,462 -1,214India 3,278 -2.1 785 25.7 4,239 6.0 1,395 10.2 -961 -610
East Asia 35,689 2.4 9,681 3.3 44,287 0.2 11,947 22.9 -8,598 -2,266China 11,078 6.4 3,059 0.9 27,282 -3.4 7,289 33.1 -16,205 -4,230Japan 6,033 9.6 1,606 3.1 4,018 28.7 1,020 15.1 2,015 586South Korea 3,997 -11.2 1,059 4.6 2,968 -7.2 816 12.4 1,029 243Hong Kong 5,781 -2.1 1,534 15.8 239 -23.8 69 14.7 5,542 1,465
Oceania 4,570 11.0 1,007 32.4 844 -9.2 266 13.9 3,727 740Australia 3,575 0.1 877 36.4 486 -4.0 164 15.0 3,089 712
Other territories 3,496 1.0 0 - 912 4.6 0 - 2,584 0World 417,077 1.2 108,844 9.9 365,579 -1.3 102,234 13.7 51,498 6,610
(1) Countries are sorted by the 2016 value of trade with Italy.
Source: Based on Istat data

48 Report 2016 -17: Summary | Italy in the world economy
Table 2.5 - Size of markets and Italian exports’ market sharesPercentages at current prices
Region/CountryMarket’s size(1) Italy's share of world exports(2) Italy's share of euro-area
exports(3)
2000 2010 2015 2016 2000 2010 2015 2016 2000 2010 2015 2016European Union 37.8 34.6 31.6 32.4 6.0 4.9 4.7 4.9 11.3 9.8 9.6 9.7
Germany 7.5 6.8 6.3 6.5 7.5 5.7 5.4 5.6 14.8 11.9 11.9 12.2France 5.1 4.0 3.5 3.5 9.5 8.3 8.1 8.4 16.0 14.1 13.7 14.0Spain 2.3 2.1 1.9 1.9 9.7 8.1 7.2 7.7 16.0 15.5 14.1 14.4United Kingdom 5.2 3.8 3.8 3.9 4.9 4.0 3.9 3.9 9.5 8.9 8.1 8.2Belgium 2.7 2.5 2.3 2.3 4.0 3.1 4.2 4.2 6.8 5.3 7.8 7.8Netherlands 3.3 3.3 3.1 3.1 2.8 2.0 2.0 2.1 6.8 5.8 5.5 5.6Poland 0.7 1.2 1.2 1.2 7.8 6.2 5.8 5.8 12.6 10.6 9.7 9.6Austria 1.1 1.0 0.9 1.0 8.0 7.1 6.4 6.5 11.1 9.9 9.5 9.5Romania 0.2 0.4 0.4 0.5 20.3 11.8 10.6 10.0 33.2 22.8 19.4 17.8Czech Republic 0.5 0.8 0.9 0.9 5.0 4.0 4.2 4.4 7.0 6.3 6.8 6.9Hungary 0.5 0.6 0.6 0.6 7.2 4.9 5.0 5.2 10.9 9.1 8.6 8.9Sweden 1.1 1.0 0.8 0.9 3.3 3.3 3.5 3.5 6.5 6.3 6.3 6.2Greece 0.5 0.4 0.3 0.3 15.2 12.1 8.7 8.7 28.8 25.0 20.8 20.9Slovenia 0.2 0.2 0.2 0.2 19.7 17.9 13.9 12.9 27.3 28.3 25.6 24.4Slovakia 0.2 0.4 0.4 0.5 5.5 4.2 3.8 4.2 11.5 10.3 8.7 9.2Portugal 0.6 0.5 0.4 0.4 7.9 6.0 5.5 5.7 11.0 8.9 8.4 8.5Ireland 0.8 0.4 0.5 0.5 3.4 1.9 1.9 2.7 13.6 6.9 6.7 8.7
Non EU European countries 3.6 5.3 5.1 5.3 6.8 6.2 6.0 5.9 14.0 14.6 15.3 14.7Switzerland 1.2 1.1 1.5 1.7 8.4 9.1 8.5 8.1 13.5 17.0 16.9 16.2Russia 0.5 1.4 1.1 1.1 5.3 4.7 4.3 4.2 13.7 11.7 12.4 12.0Turkey 0.8 1.2 1.2 1.2 8.5 6.3 5.8 6.0 18.1 16.6 16.2 15.9
Northern Africa 0.7 1.1 1.1 1.1 11.0 10.2 7.8 7.5 21.1 23.7 19.6 18.7Algeria 0.1 0.3 0.3 0.3 8.9 10.0 9.6 8.6 14.7 20.1 20.6 20.3Tunisia 0.1 0.1 0.1 0.1 21.0 21.4 17.7 17.4 27.6 32.7 30.6 30.3
Other African countries 1.2 2.0 2.2 1.9 3.5 1.9 1.7 1.7 11.1 9.0 8.9 8.7South Africa 0.4 0.6 0.5 0.5 3.2 1.9 2.3 2.2 11.1 8.4 9.5 8.8
North America 22.5 15.5 16.2 16.2 1.9 1.4 1.7 1.8 15.5 11.3 12.8 13.3United States of America 18.6 12.8 13.5 13.5 2.1 1.5 1.9 2.0 15.4 11.1 12.7 13.2Canada 3.8 2.7 2.7 2.6 0.9 0.8 1.0 1.0 17.3 12.8 13.8 14.1
South and Central America 6.0 5.8 6.3 5.8 2.6 1.7 1.5 1.6 19.2 14.0 13.6 13.4Brazil 0.9 1.2 1.1 0.9 3.8 2.7 2.6 2.4 17.1 14.5 13.3 12.1
Middle East 2.3 3.9 5.1 4.9 5.2 3.7 3.1 3.2 18.6 18.5 17.8 17.5Saudi Arabia 0.5 0.7 1.0 0.8 4.4 3.6 3.5 3.5 18.3 14.5 16.8 16.5United Arab Emirates 0.4 1.2 1.7 1.7 4.7 2.9 2.9 2.7 19.6 17.4 17.2 15.7
Central Asia 1.3 3.1 3.4 3.3 1.9 1.5 1.1 1.2 12.0 14.6 12.6 13.3India 0.8 2.3 2.4 2.2 2.0 1.3 1.0 1.0 11.1 12.3 11.2 10.6
East Asia 23.1 27.1 27.5 27.6 1.1 0.8 0.9 0.9 13.5 10.4 10.9 10.7China 3.4 9.0 9.7 9.8 1.0 0.9 0.8 0.9 11.5 9.0 7.9 8.0Japan 5.7 4.5 3.9 3.7 1.2 0.8 1.0 1.2 12.6 11.5 12.1 13.0South Korea 2.4 2.8 2.6 2.5 1.2 0.8 1.2 1.1 13.8 10.9 11.9 11.2Hong Kong 3.2 2.8 3.1 3.2 1.6 1.0 1.0 1.1 21.9 17.9 24.6 23.1
Oceania 1.4 1.6 1.6 1.6 2.5 1.9 1.9 2.2 17.6 13.0 14.2 15.2Australia 1.1 1.3 1.3 1.2 2.8 2.0 2.1 2.2 19.1 13.4 15.6 14.8
Other territories 0.1 0.1 0.1 0.1 - - - - - - - -World 100.0 100.0 100.0 100.0 3.8 3.0 2.8 2.9 12.5 11.1 11.1 11.1
(1) Imports of each market as a percentage of world imports.(2) Exports of Italy as a percentage of world exports to each market.(3) Exports of Italy as a percentage of euro-area’s exports to each market.
Sources: Based on IMF-DOTS, Eurostat data and, for Taiwan, Taiwan Directorate General of Customs data

Report 2016 -17: Summary | Italy in the world economy 49
Table 2.6 - Top ten destination countries of Italian exportsAmounts in millions of euros and percent
Countries 2016 % change2016
% share
2011 2016
1 Germany (1) 52,713 3.8 13.1 12.6
2 France (2) 43,923 3.0 11.6 10.5
3 United States of America (3) 36,927 2.6 6.1 8.9
4 United Kingdom (4) 22,478 0.5 4.7 5.4
5 Spain (5) 20,968 6.1 5.3 5.0
6 Switzerland (6) 19,015 -1.1 5.5 4.6
7 Belgium (7) 13,504 -0.1 2.6 3.2
8 Poland (8) 11,230 3.0 2.5 2.7
9 China (9) 11,078 6.4 2.7 2.7
10 Netherlands (11) 9,726 1.7 2.4 2.3
Sum of top 10 Countries 241,562 2.7 56.4 57.9
World 417,077 1.2 100.0 100.0
The number in parentheses indicates the country’s position in the 2015 ranking.
Source: Based on Istat data
Table 2.7 - Top ten countries of origin of Italian importsAmounts in millions of euros and percent
Countries 2016 % change2016
% share
2011 2016
1 Germany (1) 59,454 3.2 15.5 16.3
2 France (2) 32,547 1.2 8.4 8.9
3 China (3) 27,282 -3.4 7.4 7.5
4 Netherlands (4) 20,154 -2.0 5.2 5.5
5 Spain (5) 19,535 5.1 4.5 5.3
6 Belgium (6) 17,799 4.0 3.6 4.9
7 United States of America (8) 13,915 -2.0 3.2 3.8
8 United Kingdom (9) 10,996 1.0 2.7 3.0
9 Russia (7) 10,617 -26.3 4.2 2.9
10 Switzerland (10) 10,600 -1.5 2.8 2.9
Sum of top 10 Countries 222,900 -0.7 57.7 61.0
World 365,579 -1.3 100.0 100.0
The number in parentheses indicates the country’s position in the 2015 ranking.
Source: Based on Istat data

50 Report 2016 -17: Summary | Italy in the world economy
Table 2.8 - Merchandise exports and imports by sector: valuesMillions of euros and percentage changes on previous year
Exports Imports Balance
2016 %change2016
Jan-Mar 2017
% changeJan-Mar
20172016 %change
2016Jan-Mar
2017
% changeJan-Mar
20172016 Jan-Mar
2017
Products of agriculture, fishing and forestry 6,818 3.0 1,976 7.7 13,765 0.1 3,683 4.6 -6,947 -1,707
Mining products 1,011 -12.8 312 34.1 30,750 -22.3 10,294 55.3 -29,739 -9,982
Crude oil and natural gas 241 -29.2 110 42.6 27,519 -23.7 9,234 56.7 -27,278 -9,124
Manufacturing products 400,009 1.2 104,029 9.7 309,534 1.5 84,379 9.6 90,475 19,651
Food products, beverages and tobacco 31,545 4.2 7,690 8.0 29,139 0.0 7,404 6.8 2,406 286
Textiles, apparel, leather products and accessories 48,631 1.2 12,845 5.9 30,522 0.3 8,199 2.3 18,109 4,646
Textile articles 9,861 0.0 2,409 3.5 6,845 1.7 1,871 2.2 3,016 538
Wearing apparel 19,499 2.3 5,110 5.3 13,666 0.9 3,562 3.4 5,834 1,549
Leather and leather products (excluding apparel) 19,271 0.8 5,326 7.6 10,012 -1.3 2,766 0.9 9,260 2,560
Footwear 9,173 2.4 2,610 5.2 5,372 3.3 1,545 -0.9 3,801 1,065
Wood and wood and cork products (excluding furniture) 1,724 3.6 449 8.9 3,233 1.8 826 0.9 -1,509 -377
Paper and paper products; printing 6,632 -0.5 1,669 3.1 6,547 -3.8 1,695 -0.5 84 -26
Coke and refined petroleum products 10,020 -19.0 3,388 64.7 6,623 -9.6 2,264 55.6 3,397 1,125
Chemical substances and products 27,524 1.8 7,411 11.6 34,585 -1.9 9,630 7.6 -7,061 -2,219
Pharmaceutical, medicinal and botanical products 21,282 6.8 5,807 13.0 22,863 3.2 6,540 11.0 -1,581 -733
Rubber and plastic products 15,102 2.3 4,021 7.0 9,649 1.8 2,585 5.2 5,452 1,436
Glass, ceramics, non-metallic materials for construction 10,196 1.9 2,505 5.2 3,703 4.0 967 3.5 6,493 1,538
Basic metal products and fabricated metal products 43,768 0.1 11,549 10.7 35,737 -6.1 10,559 14.3 8,031 990
Iron and steel products 25,023 0.8 6,723 12.8 27,902 -7.9 8,489 16.5 -2,879 -1,766
Fabricated metal products 18,745 -0.8 4,826 7.9 7,835 0.8 2,070 6.1 10,910 2,756
Computers, electronic and optical apparatus 13,625 -0.5 3,326 5.6 25,283 -2.2 6,322 8.9 -11,658 -2,996
Electrical apparatus 21,984 0.2 5,725 10.4 15,616 0.9 4,097 5.9 6,368 1,629
Machinery and equipment n.e.c. 75,951 0.2 18,825 7.5 27,943 7.1 7,185 6.6 48,008 11,640
Transport equipment 47,537 5.4 12,692 9.8 45,047 14.4 12,735 15.8 2,490 -43
Motor vehicles and trailers 34,198 4.1 9,404 15.8 38,904 19.4 11,269 19.3 -4,707 -1,866
Other transport equipment 13,339 9.0 3,288 -4.4 6,142 -9.7 1,466 -5.5 7,197 1,822
Furniture 9,255 0.5 2,308 4.9 2,030 5.6 554 3.1 7,226 1,754
Other products of manufacturing 15,233 0.8 3,819 7.1 11,013 1.6 2,819 7.4 4,220 1,001
Jewellery 6,230 -4.6 1,542 10.4 2,680 -0.7 635 5.7 3,551 907
Other products 9,239 0.6 2,526 9.7 11,530 -5.8 3,878 9.6 -2,291 -1,351
Total 417,077 1.2 108,844 9.9 365,579 -1.3 102,234 13.7 51,498 6,610
Source: Based on Istat data

Report 2016 -17: Summary | Italy in the world economy 51
Table 2.9 - Merchandise exports and imports by sector: volumes and prices - 2016Percentage changes on previous year; indices, 2010=100
Exports Imports
Volumes Avg. unit values Prices(1) Volumes Avg. unit
values Prices(2)
% change Indices %
change Indices % change Indices %
change Indices % change Indices %
change Indices
Products of agriculture, fishing and forestry 3.8 101.6 -0.7 119.5 .... .... 4.6 103.0 -4.4 120.1 .... ....
Mining products -7.6 88.9 -5.6 97.6 -0.1 100.8 2.2 79.1 -23.9 65.9 -13.5 80.0
Manufacturing products 1.2 106.4 .... 116.5 -1.2 103.1 2.3 100.1 -0.8 108.6 -1.4 100.8
Food products, beverages and tobacco 4.2 117.3 .... 121.3 -0.5 110.6 0.1 102.0 -0.1 112.8 -2.0 109.6
Textiles, apparel, leather products and accessories -2.1 98.0 3.4 132.9 0.4 108.8 0.3 91.2 0.1 128.9 0.0 110.6
Textile articles -1.6 90.0 1.7 122.1 -0.1 111.3 1.6 91.5 0.1 123.7 -0.8 110.9
Wearing apparel -2.6 99.8 5.1 130.2 0.9 107.1 1.5 94.0 -0.7 120.6 0.8 108.0
Leather and leather products (excluding apparel) -1.5 102.9 2.3 140.3 0.0 108.5 -2.4 88.3 1.2 144.4 -0.5 114.6
Footwear -1.4 93.5 3.9 141.5 0.8 108.5 0.6 92.4 2.6 135.9 1.5 114.2
Wood and wood and cork products (excluding furniture) 1.4 105.3 2.1 117.2 -0.4 106.2 2.0 86.4 -0.2 110.7 0.0 106.6
Paper and paper products; printing 0.5 111.2 -1.0 103.7 -0.2 103.7 0.2 99.4 -4.1 99.4 -3.0 98.6
Coke and refined petroleum products -1.4 79.2 -17.9 85.5 -11.6 86.7 8.4 108.3 -16.6 71.5 -5.8 104.6
Chemical substances and products 4.2 109.4 -2.3 111.4 -1.9 105.6 2.3 100.5 -4.1 107.1 -2.9 99.9
Pharmaceutical, medicinal and botanical products 5.8 150.1 1.0 101.5 0.6 103.7 2.5 114.0 0.7 115.6 -2.3 93.9
Rubber and plastic products 2.7 102.5 -0.4 119.2 -1.4 106.4 2.3 109.9 -0.5 111.6 -1.9 100.8
Glass, ceramics, non-metallic materials for construcion 1.3 104.0 0.6 115.4 0.2 103.3 2.1 90.4 1.9 119.0 0.9 104.4
Basic metal products and fabricated metal products 3.0 109.3 -2.9 101.8 -2.2 95.5 0.9 105.6 -7.0 93.7 -5.4 92.3
Iron and steel products 6.9 118.9 -5.7 90.2 -4.3 88.3 0.7 108.0 -8.5 87.8 -6.6 89.9
Fabricated metal products -2.1 95.2 1.2 123.0 0.0 103.2 0.4 93.5 0.4 125.5 -0.2 103.1
Computers, electronic and optical apparatus -3.8 97.4 3.4 120.6 1.3 108.6 -7.3 76.8 5.5 97.2 -0.5 92.2
Electrical apparatus -0.4 105.1 0.6 107.9 -0.1 104.3 -0.2 97.3 1.1 120.7 -0.2 104.7
Machinery and equipment n.e.c. -2.3 97.1 2.5 130.2 0.6 104.3 5.8 103.3 1.3 120.7 0.2 104.8
Transport equipment 4.1 121.5 1.3 113.4 -2.2 97.3 9.7 99.0 4.3 120.0 1.6 97.7
Motor vehicles and trailers 2.0 134.8 2.0 112.1 -3.4 96.1 15.1 110.5 3.8 114.3 1.6 96.9
Other transport equipment 9.3 94.5 -0.3 118.8 0.3 99.9 -15.9 54.6 7.4 158.3 1.8 109.0
Furniture -0.8 102.3 1.4 116.6 0.6 105.5 6.5 107.4 -0.8 105.8 0.5 106.5
Other products of manufacturing -0.3 107.9 1.1 126.5 1.8 108.8 1.7 100.4 -0.2 123.8 1.3 108.7
Total 1.2 106.3 -0.1 116.3 -1.1 103.1 3.1 98.0 -4.3 101.5 -3.3 97.2
(1) Producer prices of products sold on foreign markets.(2) Import prices in industry.
Source: Based on Istat data
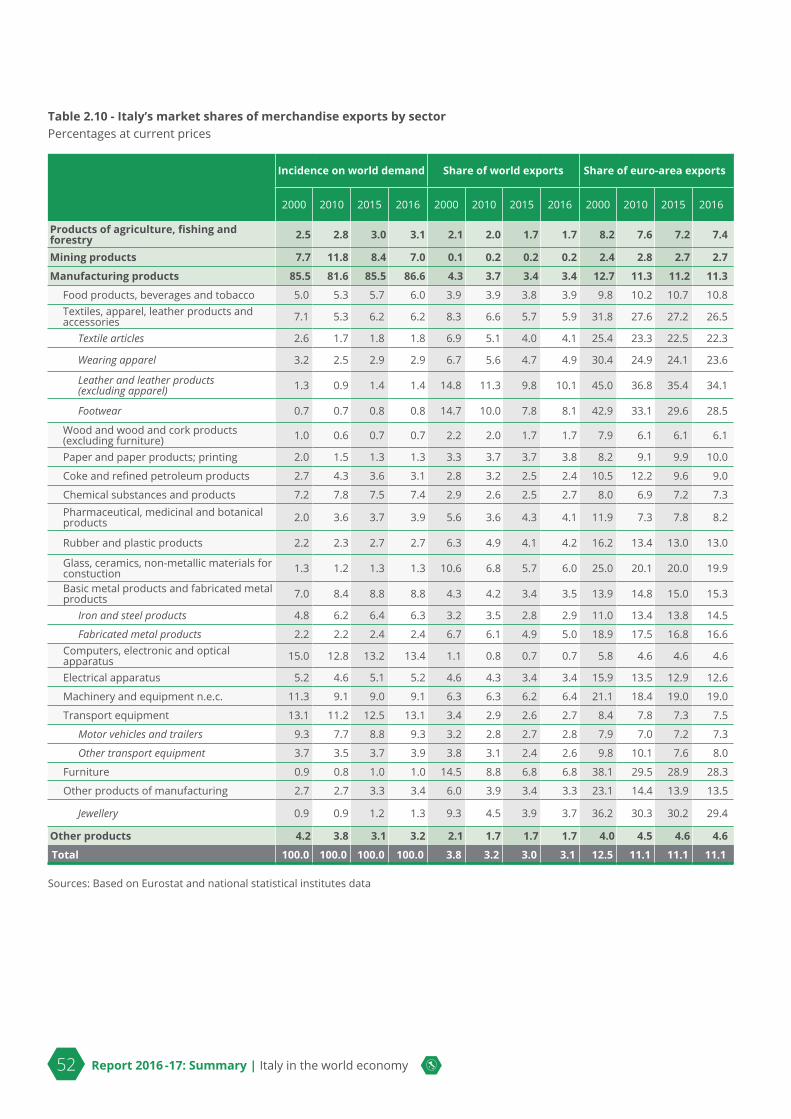
52 Report 2016 -17: Summary | Italy in the world economy
Table 2.10 - Italy’s market shares of merchandise exports by sectorPercentages at current prices
Incidence on world demand Share of world exports Share of euro-area exports
2000 2010 2015 2016 2000 2010 2015 2016 2000 2010 2015 2016
Products of agriculture, fishing and forestry 2.5 2.8 3.0 3.1 2.1 2.0 1.7 1.7 8.2 7.6 7.2 7.4
Mining products 7.7 11.8 8.4 7.0 0.1 0.2 0.2 0.2 2.4 2.8 2.7 2.7
Manufacturing products 85.5 81.6 85.5 86.6 4.3 3.7 3.4 3.4 12.7 11.3 11.2 11.3
Food products, beverages and tobacco 5.0 5.3 5.7 6.0 3.9 3.9 3.8 3.9 9.8 10.2 10.7 10.8Textiles, apparel, leather products and accessories 7.1 5.3 6.2 6.2 8.3 6.6 5.7 5.9 31.8 27.6 27.2 26.5
Textile articles 2.6 1.7 1.8 1.8 6.9 5.1 4.0 4.1 25.4 23.3 22.5 22.3
Wearing apparel 3.2 2.5 2.9 2.9 6.7 5.6 4.7 4.9 30.4 24.9 24.1 23.6
Leather and leather products (excluding apparel) 1.3 0.9 1.4 1.4 14.8 11.3 9.8 10.1 45.0 36.8 35.4 34.1
Footwear 0.7 0.7 0.8 0.8 14.7 10.0 7.8 8.1 42.9 33.1 29.6 28.5
Wood and wood and cork products (excluding furniture) 1.0 0.6 0.7 0.7 2.2 2.0 1.7 1.7 7.9 6.1 6.1 6.1
Paper and paper products; printing 2.0 1.5 1.3 1.3 3.3 3.7 3.7 3.8 8.2 9.1 9.9 10.0
Coke and refined petroleum products 2.7 4.3 3.6 3.1 2.8 3.2 2.5 2.4 10.5 12.2 9.6 9.0
Chemical substances and products 7.2 7.8 7.5 7.4 2.9 2.6 2.5 2.7 8.0 6.9 7.2 7.3Pharmaceutical, medicinal and botanical products 2.0 3.6 3.7 3.9 5.6 3.6 4.3 4.1 11.9 7.3 7.8 8.2
Rubber and plastic products 2.2 2.3 2.7 2.7 6.3 4.9 4.1 4.2 16.2 13.4 13.0 13.0
Glass, ceramics, non-metallic materials for constuction 1.3 1.2 1.3 1.3 10.6 6.8 5.7 6.0 25.0 20.1 20.0 19.9
Basic metal products and fabricated metal products 7.0 8.4 8.8 8.8 4.3 4.2 3.4 3.5 13.9 14.8 15.0 15.3
Iron and steel products 4.8 6.2 6.4 6.3 3.2 3.5 2.8 2.9 11.0 13.4 13.8 14.5
Fabricated metal products 2.2 2.2 2.4 2.4 6.7 6.1 4.9 5.0 18.9 17.5 16.8 16.6Computers, electronic and optical apparatus 15.0 12.8 13.2 13.4 1.1 0.8 0.7 0.7 5.8 4.6 4.6 4.6
Electrical apparatus 5.2 4.6 5.1 5.2 4.6 4.3 3.4 3.4 15.9 13.5 12.9 12.6
Machinery and equipment n.e.c. 11.3 9.1 9.0 9.1 6.3 6.3 6.2 6.4 21.1 18.4 19.0 19.0
Transport equipment 13.1 11.2 12.5 13.1 3.4 2.9 2.6 2.7 8.4 7.8 7.3 7.5
Motor vehicles and trailers 9.3 7.7 8.8 9.3 3.2 2.8 2.7 2.8 7.9 7.0 7.2 7.3
Other transport equipment 3.7 3.5 3.7 3.9 3.8 3.1 2.4 2.6 9.8 10.1 7.6 8.0
Furniture 0.9 0.8 1.0 1.0 14.5 8.8 6.8 6.8 38.1 29.5 28.9 28.3
Other products of manufacturing 2.7 2.7 3.3 3.4 6.0 3.9 3.4 3.3 23.1 14.4 13.9 13.5
Jewellery 0.9 0.9 1.2 1.3 9.3 4.5 3.9 3.7 36.2 30.3 30.2 29.4
Other products 4.2 3.8 3.1 3.2 2.1 1.7 1.7 1.7 4.0 4.5 4.6 4.6
Total 100.0 100.0 100.0 100.0 3.8 3.2 3.0 3.1 12.5 11.1 11.1 11.1
Sources: Based on Eurostat and national statistical institutes data

Report 2016 -17: Summary | Italy in the world economy 53
Table 2.11 - Merchandise exports of the Italian regions Amounts in millions of euros, percentage changes on year-earlier period and composition
2016 Jan. - Mar. 2017 Share of Italian exports (%)
Value
% change
Value
% change 2000 2005 2008 2008 2014 2016 Jan-Mar
2016Jan-Mar
2017
North-West 164,526 0.0 42,861 10.7 41.3 41.5 40.9 40.6 40.4 40.0 39.6 40.0
Piedmont 44,424 -3.0 11,763 14.1 11.5 10.9 10.5 10.9 11.2 10.8 10.5 11.0
Valle d'Aosta 571 -5.6 160 25.8 0.2 0.2 0.2 0.2 0.1 0.1 0.1 0.1
Lombardy 112,199 0.8 29,099 8.6 28.3 29.0 28.7 27.8 27.4 27.3 27.4 27.1
Liguria 7,332 7.7 1,839 23.1 1.3 1.4 1.4 1.8 1.7 1.8 1.5 1.7
North-East 135,444 1.8 35,201 8.2 31.0 31.6 32.3 32.2 32.7 32.9 33.3 32.8Trentino-Alto Adige 7,820 0.2 2,060 7.7 1.7 1.8 1.7 1.8 1.9 1.9 2.0 1.9
Veneto 58,246 1.3 14,852 7.1 14.4 13.8 13.8 13.9 14.1 14.2 14.2 13.8
Friuli-Venezia Giulia 13,240 6.3 3,699 9.7 3.4 3.3 3.7 3.1 3.1 3.2 3.4 3.4
Emilia Romagna 56,138 1.5 14,591 8.9 11.5 12.7 13.1 13.4 13.6 13.6 13.7 13.6
Center 68,519 2.1 17,762 8.7 16.7 15.4 14.9 16.9 16.5 16.7 16.7 16.6Tuscany 33,229 0.6 8,380 10.1 8.3 7.4 7.0 8.1 8.1 8.1 7.8 7.8
Umbria 3,655 0.3 983 7.1 0.9 1.0 0.9 0.9 0.9 0.9 0.9 0.9
Marche 12,016 5.6 2,928 1.0 2.9 3.2 2.9 3.2 2.8 2.9 3.0 2.7
Lazio 19,619 3.0 5,471 11.4 4.6 3.8 4.0 4.7 4.7 4.8 5.0 5.1
South and Islands 42,812 1.1 11,431 12.7 11.0 11.5 12.0 10.3 10.4 10.4 10.4 10.7Abruzzo 8,166 9.7 2,057 1.2 2.0 2.1 2.1 1.8 1.8 2.0 2.1 1.9
Molise 526 7.0 98 -53.4 0.2 0.2 0.2 0.1 0.1 0.1 0.2 0.1
Campania 9,996 2.9 2,442 2.9 3.0 2.6 2.6 2.4 2.4 2.4 2.4 2.3
Puglia 7,914 -2.2 2,038 8.9 2.3 2.3 2.1 2.1 2.0 1.9 1.9 1.9
Basilicata 4,515 53.5 1,014 -10.5 0.4 0.4 0.5 0.3 0.7 1.1 1.2 0.9
Calabria 414 10.4 104 21.9 0.1 0.1 0.1 0.1 0.1 0.1 0.1 0.1
Sicily 7,073 -17.3 2,307 37.6 2.1 2.5 2.8 2.5 2.1 1.7 1.7 2.2
Sardinia 4,209 -10.9 1,371 79.0 0.9 1.3 1.6 1.2 1.2 1.0 0.8 1.3
Total regions 411,300 1.0 107,255 9.7 100.0 100.0 100.0 100.0 100.0 100.0 100.0 100.0Unallocable data 5,776 10.5 1,589 21.0Total 417,077 1.2 108,844 9.9
Source: Based on Istat data

54 Report 2016 -17: Summary | Italy in the world economy
Table 2.12 - Internationalization of Italian firmsAmounts in millions of euros
2007 2008 2009 2010 2011 2012 2013 2014 2015 2016 (1)
No. of exporting firms 204,619 205,643 194,255 205,708 207,352 209,090 211,249 213,010 215,170 215,708
% change -1.1 0.5 -5.5 5.9 0.8 0.8 1.0 0.8 1.0 0.3
Exports(2) 359,981 364,275 286,281 331,348 368,504 381,442 380,876 389,335 402,357 406,409
% change 9.5 1.2 -21.4 15.7 11.2 3.5 -0.1 2.2 3.3 1.0
No. of foreign affiliates 24,398 25,467 26,008 26,921 27,938 28,234 28,738 29,073 28,589 28,034
% change 7.2 4.4 2.1 3.5 3.8 1.1 1.8 1.2 -1.7 -1.9
No. of workers in foreign affiliates 1,515,228 1,588,253 1,476,138 1,502,694 1,532,945 1,525,096 1,502,300 1,490,963 1,484,784 1,458,035
% change 12.0 4.8 -7.1 1.8 2.0 -0.5 -1.5 -0.8 -0.4 -1.8
Sales revenues of foreign affiliates 470,427 509,208 475,230 513,847 556,407 563,448 548,909 531,689 526,673 516,930
% change 15.0 8.2 -6.7 8.1 8.3 1.3 -2.6 -3.1 -0.9 -1.8
(1) Istat data are provisional; Ice - Reprint and Politecnico of Milan data are preliminary calculations.(2) Exports in this table differ from those in other tables because this table only takes account of the exports of identified exporting firms.
Sources: Based on Istat and Ice - Reprint, Politecnico of Milan data
Table 2.13 - Percentage distribution of the workers and sales revenues of Italian firms’ foreign affiliates by geographical region of investment and size class (number of workers) of the investorPercentages, data at 31.12.2016 (1)
Workers Sales revenues
1-49 50-249 ≥250 TotalShare of the area
(%)1-49 50-249 ≥250 Total
Share of the area
(%)European Union 12.8 19.0 68.2 100.0 42.5 3.7 10.7 85.7 100.0 50.0
Other European countries 12.5 20.2 67.3 100.0 9.6 4.3 5.6 90.2 100.0 6.9
Northern Africa 4.9 3.4 91.7 100.0 3.3 0.4 0.1 99.4 100.0 3.1
Other African countries 6.0 12.6 81.4 100.0 2.1 0.1 0.1 99.8 100.0 3.4
North America 3.1 8.0 88.9 100.0 9.0 5.2 13.3 81.4 100.0 10.1
South and Central America 6.2 8.9 84.9 100.0 16.3 1.5 1.5 97.0 100.0 14.3
Middles East 1.1 3.2 95.8 100.0 1.0 0.7 0.9 98.5 100.0 1.1
Central Asia 0.5 1.1 98.3 100.0 2.3 1.2 2.2 96.6 100.0 1.6
East Asia 4.0 7.1 88.9 100.0 13.0 2.0 8.9 89.1 100.0 8.1
Oceania 2.5 8.5 88.9 100.0 0.8 0.2 3.0 96.8 100.0 1.5
Total 8.8 13.6 77.6 100.0 100.0 3.0 8.0 89.0 100.0 100.0
(1) Preliminary estimates.Sources: Based on Istat and Ice - Reprint, Politecnico of Milan data

Report 2016 -17: Summary | Italy in the world economy 55
Table 2.14 - Public support for internationalization: overview of promotional and financial servicesAmounts in millions of euros
2014 2015 2016 2014 2015 2016 2014 2015 2016
Promotional services
User firms Funds spent (1) Users’ contribution to costs
Ministry for Economic Development (2) 158 130 1,912 10 6 26 8 5 6
Regions (3) - - - 80 106 81 - - -
ICE (4) 22,535 37,889 38,948 65 110 134 13 14 13
Chambers of Commerce (5) 58,355 43,033 22,627 69 40 32 - - -
Financial services
Customer firms New underwritings Gross premiums
Sace 23,547 23,414 23,190 10,937 9,750 13,174 390 560 601
Customer firms Own funds invested Amount of assisted transactions (6)
Cassa Depositi e Prestiti (7) (8) 25 27 21 1,101 1,389 4,949 2,536 3,075 7,752
Simest 344 269 379 497 514 536 2,530 5,282 6,024
(1) For ICE and the Ministry for Economic Development, includes users’ contribution to costs and incentives disbursed to firms on behalf of third parties.
(2) Support programs directly managed on behalf of associations, Italian Chambers of Commerce abroad, consortia, organizations, entities and institutions and vouchers provided for by Decree Law 133 of 2014.
(3) Funds spent equal to the sum of regional budget funds, European funds and private contributions (where applicable).(4) Funds and users for promotion and training. Including foreign users. (5) Companies participating in promotional activites and participants in training activities. A portion of the funds spent by the Chambers of
Commerce derives from regional budgets. Funds spent in 2015 refers to 96 Chambers of Commerce out of 104. Users in 2016 refers to 70 Chambers out of 98. Funds spent in 2016 refer to 84 Chambers out of 98.
(6) The amount of assisted transactions refers to the total amount financed for CDP, invested for Simest.(7) Number of transactions financed . Customer firms may have concluded more than one contract.(8) All the operations carried out by CDP were conducted in synergy with Sace. Accordingly, although they provided different resources and
instruments, the value of the transactions carried out and the number of customers served by CDP are included in Sace’s transactions and customers.
Sources: Ministry for Economic Development, regional governments, ICE, Unioncamere, Cassa Depositi e Prestiti, Sace and Simest

Publishing and printing
Marchesi Grafiche Editoriali Via Flaminia 995/997 - 00189 Roma
tel. [+39] 06 332161 www.marchesigrafiche.it