italy: selected issues - imf.org · accounts data for real exports of goods and services including...
TRANSCRIPT
© 2007 International Monetary Fund February 2007
IMF Country Report No. 07/65
Italy: Selected Issues
This Selected Issues paper for Italy was prepared by a staff team of the International Monetary Fund as background documentation for the periodic consultation with the member country. It is based on the information available at the time it was completed on January 16, 2007. The views expressed in this document are those of the staff team and do not necessarily reflect the views of the government of Italy or the Executive Board of the IMF. The policy of publication of staff reports and other documents by the IMF allows for the deletion of market-sensitive information.
To assist the IMF in evaluating the publication policy, reader comments are invited and may be sent by e-mail to [email protected].
Copies of this report are available to the public from
International Monetary Fund ● Publication Services 700 19th Street, N.W. ● Washington, D.C. 20431
Telephone: (202) 623 7430 ● Telefax: (202) 623 7201 E-mail: [email protected] ● Internet: http://www.imf.org
Price: $18.00 a copy
International Monetary Fund
Washington, D.C.


INTERNATIONAL MONETARY FUND
ITALY
Selected Issues
Prepared by Paulo Drummond, Bogdan Lissovolik, Iryna Ivaschenko (all EUR), and Annalisa Fedelino (FAD)
Approved by European Department
January 17, 2007
Contents Page I. Italy: How Large is the External Competitiveness Gap? .......................................................3 A. Constant Market Share Analysis.....................................................................................3 B. Aggregate Measures of Competitiveness........................................................................5 C. Macro Model-based and/or Econometric Estimates of Equilibrium Exchange Rate ...10 D. Conclusion ....................................................................................................................13 Figures 1. Export Share in World Market...............................................................................................4 2. Manufacturing Unit Labor Cost.............................................................................................6 3. ULC-based Real Effective Exchange Rate ............................................................................6 4. Export margins.......................................................................................................................7 5. Relative Export Prices, ..........................................................................................................8 6. Ratios of Wage Costs to Value Added, .................................................................................8 7. PPP Exchange Rate Ratio and GDP per Capita, 1998, 2005.................................................9 8. Market Exchange Rate Compared to the PPP Exchange Rate, 1980–2005 ........................10 9. Real Equilibrium Exchange Rate, 1980–2006.....................................................................12 Tables 1. CMS Analysis of Export Changes .........................................................................................5 2. Italian Unit Labor Costs, Total Economy, 1998–2005..........................................................5 References................................................................................................................................14 II. Public Spending in Italy: A Crescendo ...............................................................................18 A. Anatomy of Italy’s Deficit Slippages ...........................................................................20 B. Taking Stock of Italy’s Spending: Stylized Facts .........................................................23 C. Empirical Analysis of Determinants of Spending.........................................................27 D. Conclusions...................................................................................................................32
2
Table 1. Cumulative Underprojection Bias in Spending, 2001–05 ...................................................23 References................................................................................................................................34 III. Public Enterprises and Fiscal Risks in Italy ......................................................................35 A. Background ...................................................................................................................35 B. The Current Institutional Setup.....................................................................................37 C. Assessing Fiscal Risks ..................................................................................................40 D. Conclusions and Policy Implications............................................................................45 Figure 1. Comparative Selected Indicators on SOEs ..........................................................................39 Tables 1. Major Public Enterprises, as of end-December 2005 ..........................................................38 2. Budget Transfers to Selected PEs, 2001–05........................................................................40 Boxes 1. Italy’s Privatization Process.................................................................................................36 2. Criteria for Assessing Fiscal Risks of Public Enterprises ...................................................41 References................................................................................................................................47 IV. Financial Intermediation and Growth in Italy ...................................................................48 A. Financial Development and Growth: Theory and Evidence.........................................48 B. What about Italy ? .........................................................................................................53 C. Policy Implications........................................................................................................57 Figures 1. Size of the Financial Sector .................................................................................................50 2. Stock and Corporate Bond Market Capitalization,..............................................................51 3. The Relative Importance of Loans and Securities (Average, 2000-04) ..............................52 4. Italy’s Innovation Performance is Poor ...............................................................................54 5. Italy’s Venture Capital is Underdeveloped..........................................................................55 6. Market Regulation Indices, 2005.........................................................................................59 Boxes 1. Segmentation of Listed Companies on Borsa Italiana.........................................................58 References................................................................................................................................62

3
I. ITALY : HOW LARGE IS THE EXTERNAL COMPETITIVENESS GAP?1
1. Italy’s persistent loss of market share and weak export growth in recent years have raised concerns about its external competitiveness. Broad-based measures of competitiveness which include non-price indicators (such as business efficiency) also suggest Italy’s competitive position is weak and has deteriorated sharply. For example, in the World Economic Forum’s global competitiveness ranking for 2006, Italy was placed 42nd out of 125, while under the International Institute for Management’s methodology, the Italian economy ranked 56th out of 60 countries in the 2006 listing, dropping some thirty places since the late 1990s.
2. A number of analysts have associated the loss of export markets with a range of structural factors. These include the unfavorable specialization of the Italian economy (Felettigh et al, 2005) in relatively slow-growing sectors of world demand, with rapid changes hampered by low levels of R&D investment, human capital, and competition (Faini and Sapir, 2005); comparatively weak inward FDI, with low and decreasing shares in high technology industries (Mariotti et al., 2002); and insufficient competition in domestic markets which provide inputs and services to export sectors (Isae 2005; and Allegra et al., 2004). These structural factors have been accompanied by a marked slowdown of productivity growth (Bassanetti et al, 2006; and Bassanetti and Zolino, 2004), with an ensuing deterioration in cost competitiveness, which seems to be at the core of Italy’s weak export performance.
A. Constant Market Share Analysis
3. Italy’s exports have been falling behind. Based on the UN’s COMTRADE database, the Italian share of the world export market, in value terms, has declined by about 20 percent since the mid-1990s (Figure 1). In volume terms, based on national
1 Prepared by Paulo Drummond (EUR), [email protected].
Objective: To apply a range of methods to assess Italy’s competitiveness gap versus other euro-area members.
Results: All indicators point to a clear erosion of competitiveness in recent years, with related market share losses. Nonetheless, the estimated competitiveness gap, while appreciable, still remains quantitatively contained (up to 8 percent).
Policy implications: Reforms that boost productivity and promote wage moderation are key to restoring competitiveness.

4
accounts data for real exports of goods and services including cross border intra-euro area trade, Italy’s market share declined some 38 percent since 1993, compared to a fall of some 2 percent for the euro area as a whole. In the more recent period (2000–05), real export growth (goods) averaged about 1 percent compared to overall growth in the Italian export market of some 6 percent per year according to World Economic Outlook (WEO) data.
4. Constant market share analysis can pinpoint the causes of export market growth. It entails decomposing the change in Italian exports between any two periods into four effects:
• The global market growth effect. This indicates the part of export growth that is due to the expansion of overall world trade. The magnitude of this effect shows the potential growth of Italian exports when its share of world export market is kept constant.
• The commodity composition effect. This is the weighted sum of values of exports of different commodities. The weights are the deviations of the growth rates of individual commodity exports from the growth rate of aggregate world exports. For instance, the commodity composition effect would be negative if Italy had concentrated its exports on commodities with relatively slow global growth.
• The market distribution effect. This measures the change in exports due to market distribution and depends on trade policy and income growth of the countries that are recipients of Italian exports. In general, this effect would be positive if Italian exports had gone to countries where demand growth was faster than the global average.
• The competitiveness effect. This residual term can be used to measure export competitiveness, the gain or loss in export growth that cannot be attributed to global growth, growth of trade partners or growth in demand for the products in which Italy specializes.
Figure 1. Export Share in World Market(In percent)
3.0
3.5
4.0
4.5
5.0
5.5
6.0
1994 1995 1996 1997 1998 1999 2000 2001 2002 2003 200426
28
30
32
34
Italy
Euro Area (rhs)
5
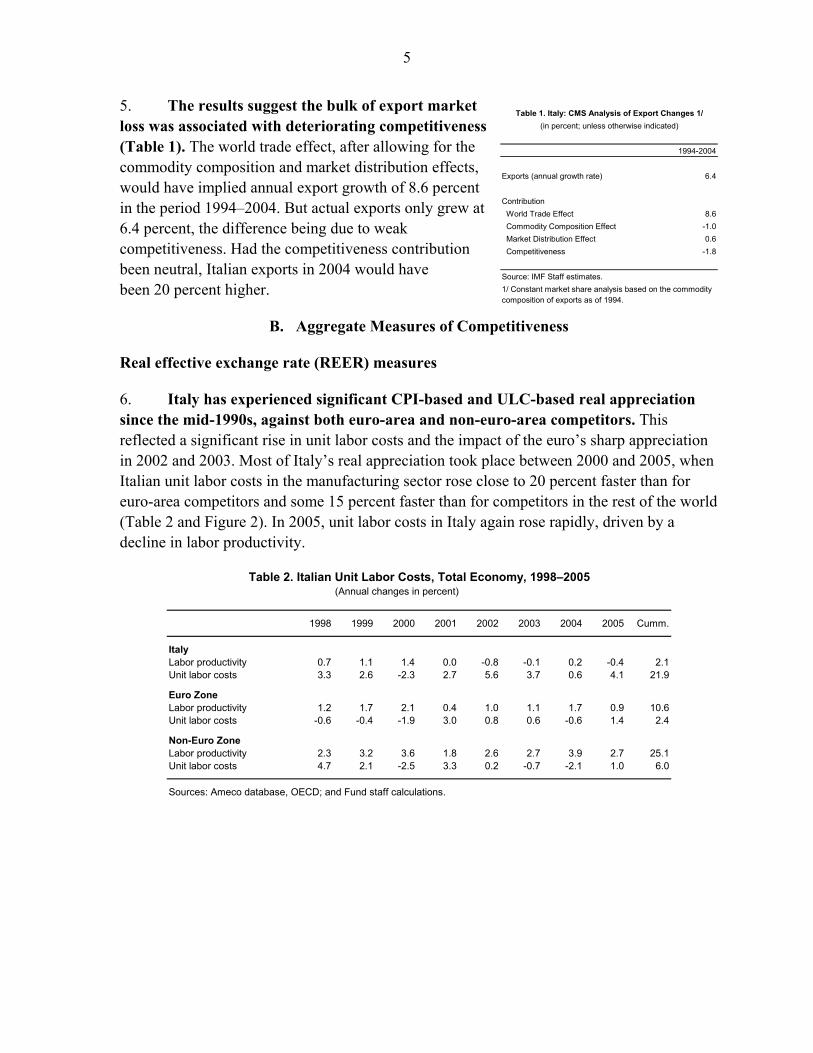
5. The results suggest the bulk of export market loss was associated with deteriorating competitiveness (Table 1). The world trade effect, after allowing for the commodity composition and market distribution effects, would have implied annual export growth of 8.6 percent in the period 1994–2004. But actual exports only grew at 6.4 percent, the difference being due to weak competitiveness. Had the competitiveness contribution been neutral, Italian exports in 2004 would have been 20 percent higher.
B. Aggregate Measures of Competitiveness
Real effective exchange rate (REER) measures
6. Italy has experienced significant CPI-based and ULC-based real appreciation since the mid-1990s, against both euro-area and non-euro-area competitors. This reflected a significant rise in unit labor costs and the impact of the euro’s sharp appreciation in 2002 and 2003. Most of Italy’s real appreciation took place between 2000 and 2005, when Italian unit labor costs in the manufacturing sector rose close to 20 percent faster than for euro-area competitors and some 15 percent faster than for competitors in the rest of the world (Table 2 and Figure 2). In 2005, unit labor costs in Italy again rose rapidly, driven by a decline in labor productivity.
1998 1999 2000 2001 2002 2003 2004 2005 Cumm.
ItalyLabor productivity 0.7 1.1 1.4 0.0 -0.8 -0.1 0.2 -0.4 2.1Unit labor costs 3.3 2.6 -2.3 2.7 5.6 3.7 0.6 4.1 21.9
Euro ZoneLabor productivity 1.2 1.7 2.1 0.4 1.0 1.1 1.7 0.9 10.6Unit labor costs -0.6 -0.4 -1.9 3.0 0.8 0.6 -0.6 1.4 2.4
Non-Euro ZoneLabor productivity 2.3 3.2 3.6 1.8 2.6 2.7 3.9 2.7 25.1Unit labor costs 4.7 2.1 -2.5 3.3 0.2 -0.7 -2.1 1.0 6.0
Sources: Ameco database, OECD; and Fund staff calculations.
(Annual changes in percent)Table 2. Italian Unit Labor Costs, Total Economy, 1998–2005
1994-2004
Exports (annual growth rate) 6.4
Contribution World Trade Effect 8.6 Commodity Composition Effect -1.0 Market Distribution Effect 0.6 Competitiveness -1.8
Source: IMF Staff estimates.1/ Constant market share analysis based on the commoditycomposition of exports as of 1994.
Table 1. Italy: CMS Analysis of Export Changes 1/(in percent; unless otherwise indicated)

6
Figure 2. Manufacturing Unit Labor Cost
80
90
100
110
120
130
1995 1996 1997 1998 1999 2000 2001 2002 2003 2004 2005
Inde
x 19
95=1
00
80
90
100
110
120
130
ItalyEuro AreaGermanyFrance
Source: OECD, Analytical Database .
7. While REER analysis is useful to assess changes in competitiveness, it provides only limited insight into the level of competitiveness. For a start, assessing the level requires determining an equilibrium base period. For Italy, the late 1990s are generally considered “benchmark” years—based on current account and export developments. From 1998 until the end of 2005, Italy’s unit labor cost-based real effective exchange rate has appreciated by some 20 percent (Figure 3). However, changes in the quality and composition of production, entry into the euro area, and the margin of uncertainty about determining an equilibrium base period, preclude definitive statements about Italy’s current competitiveness gap on the basis of this approach. Another caveat is that comparator countries are weighted by actual trade shares, with possibly too little weight on actual and potential third country competitors.
Figure 3. ULC-based Real Effective Exchange Rate
90
105
120
135
1997 1998 1999 2000 2001 2002 2003 2004 2005 2006
Inde
x 20
00=1
00
90
105
120
135
ItalyEuro AreaFranceGermanySpain
Source: IMF, International Financial Statistics .

7
Profit share indicators
8. Manufacturing profitability can shed light on competitiveness. The ratio of wage costs per employee to value added (in current prices) per person in manufacturing provides a measure of relative profit shares in the tradables-intensive sector of the economy. Alternatively, export margins can be derived by dividing the deflator of exports of goods by the unit labor cost in manufacturing. These measures improve on ULC-based REERs by taking into account variations across countries in the price of tradables output/exports, in addition to cost considerations (Lipschitz and McDonald, 1991), though caveats apply.
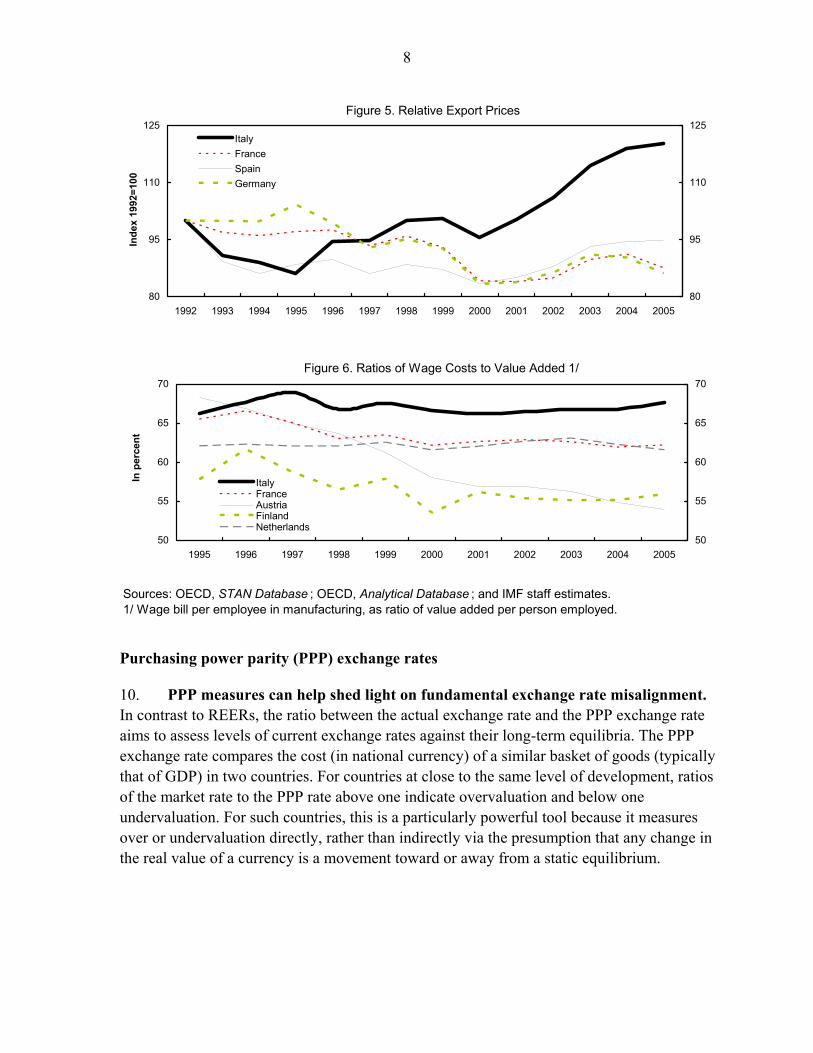
9. Italian exporters seem to have maintained profit margins. To the extent that comparisons of the levels of export margins across countries are meaningful (that is, production technologies are similar), 2005 data suggests that Italian firms have managed to maintain margins despite the deterioration in competitiveness (Figure 4), and they have done so by fully passing on to export prices the increases in unit labor costs (Figure 5).2 The deterioration in relative export prices for Italy corresponds with the deteriorating competitiveness and declining market shares. At the same time, the ratio of wage cost per employee to value added suggests no cost advantage for Italy relative to other euro area competitors (Figure 6).
Figure 4. Export Margins
80
90
100
110
120
1995 1996 1997 1998 1999 2000 2001 2002 2003 2004 2005
Inde
x 19
95=1
00
80
90
100
110
120
ItalySpainGermanyEuro Area
2 IMF Country Report No. 05/401.
8
Figure 5. Relative Export Prices
80
95
110
125
1992 1993 1994 1995 1996 1997 1998 1999 2000 2001 2002 2003 2004 2005
Inde
x 19
92=1
00
80
95
110
125ItalyFranceSpainGermany
Figure 6. Ratios of Wage Costs to Value Added 1/
50
55
60
65
70
1995 1996 1997 1998 1999 2000 2001 2002 2003 2004 2005
In p
erce
nt
50
55
60
65
70
ItalyFranceAustriaFinlandNetherlands
Sources: OECD, STAN Database ; OECD, Analytical Database ; and IMF staff estimates.1/ Wage bill per employee in manufacturing, as ratio of value added per person employed.
Purchasing power parity (PPP) exchange rates
10. PPP measures can help shed light on fundamental exchange rate misalignment. In contrast to REERs, the ratio between the actual exchange rate and the PPP exchange rate aims to assess levels of current exchange rates against their long-term equilibria. The PPP exchange rate compares the cost (in national currency) of a similar basket of goods (typically that of GDP) in two countries. For countries at close to the same level of development, ratios of the market rate to the PPP rate above one indicate overvaluation and below one undervaluation. For such countries, this is a particularly powerful tool because it measures over or undervaluation directly, rather than indirectly via the presumption that any change in the real value of a currency is a movement toward or away from a static equilibrium.

9
Figure 7. PPP Exchange Rate Ratio and GDP per Capita, 1998; 2005 in bold 1/
Sources: OECD; IMF, World Economic Outlook; and IMF staff estimates.1/ The slopes of the illustrative regression lines resulted from panel estimation on data for 1980–2001 for the EMU countries and for 1993–2001 for the CEC countries. Regression 1 assumes no fixed-country effects; regression 2 assumes fixed-country effects. For both, the estimator was OLS on first differences.2/ Both relative to the euro area. A higher ratio indicates a more appreciated market rate.3/ Euro area average = 100.
Y axis: Market exchange rate relative to PPP exchange rate 2/ 3/X axis: GDP per capita ratio 3/
Spain
Portugal
Netherlands
Italy
Ireland
Greece
Germany
France
Finland
BelgiumAustria
Austria
Belgium
Finland
France
Germany
Greece
Italy
Netherlands
Spain
70
75
80
85
90
95
100
105
110
115
120
70 75 80 85 90 95 100 105 110 115 120
11. PPP analysis suggest that Italy’s exchange rate is not currently misaligned, but has appreciated significantly. At end-2005, the actual PPP exchange ratio was 97 percent of that of the euro area, compared to 77 percent in 1995 and 91 percent in 1998. Using the PPP exchange rate ratio consistent with countries’ GDP per capita as a norm, the actual Italian PPP exchange rate ratio was the only one among large euro-area countries to deteriorate, as the ratio of the market rate to the PPP rate in these countries declined while in Italy it increased (Figure 7). Such appreciation also occurred in other Southern European Countries (Portugal, Spain and Greece), at varying rates, but in these countries it largely reflected a catch-up in terms of relative income, a process Italy is not subject to (Figure 8).

10
Figure 8. Market Exchange Rate Compared to the PPP Exchange Rate, 1980–2005 1/
Sources: IMF, World Economic Outlook ; and IMF staff calculations.1/ The market exchange rate as a ratio of the PPP exchange rate (relative to euro area). A higher ratio indicates a more appreciated market rate.
0.6
0.8
1.0
1.2
1980 1985 1990 1995 2000 20050.6
0.8
1.0
1.2
Italy Austria
Belgium Netherlands
Germany France
0.4
0.6
0.8
1.0
1.2
1980 1985 1990 1995 2000 20050.4
0.6
0.8
1.0
1.2
Italy GreeceIreland PortugalSpain
C. Macro Model-based and/or Econometric Estimates of Equilibrium Exchange Rate
Current-account based estimates
12. Reducing Italy’s current account deficit to its norm would require a real depreciation of some 7 percent. Using the methodology in IMF (2006),3 the macro approach which compares the underlying external current account with a norm or target, we derive the underlying current account by adjusting the actual current account for “transitory” elements, including the cyclical position. The norm is derived from medium-term savings and investment balances or from current account positions needed to achieve a certain net
3 “Methodology for CGER Exchange Rate Assessments” (http://www.imf.org/external/np/pp/eng/2006/110806.pdf).

11
foreign asset position. The gap between the underlying current account and the norm is then mapped into a gap between the actual and equilibrium exchange rate. In the case of Italy, applying the coefficient estimates from panel regressions for the period 1973–2004 yields a mid-point estimate of the current account norm of 0.5 percent of GDP at end-2005 (compared to the actual underlying current account deficit of 2 percent of GDP in 2005), which maps into a mid-point estimate of overvaluation of 7½ percent.
13. Stabilizing Italy’s external indebtedness would require a similar real depreciation. Given the theoretical and practical difficulties associated with estimating current account norms, one can also look at the improvement in competitiveness (as measured by the REER) required to achieve a current account balance that would stabilize net external liabilities around current levels. The estimated midpoint REER overvaluation is close to 6 percent (within a range of 5 to 8 percent) assuming a real effective exchange rate elasticity of the trade balance in the range of 0.2 to 0.15 (derived from estimates of elasticities of export and import in Isard and Faruqee (1998), and taking into account Italy’s degree of openness).
Real exchange rate equilibrium based estimates
14. Equilibrium REER-based estimates suggest an overvaluation of about 8 percent. Equilibrium REERs are another tool to assess exchange rate misalignment (and can help address the underestimation in current account models). Using the methodology in IMF, 20064 the equilibrium exchange rate can be derived from reduced-form panel cointegration regressions, relating the real effective exchange rate to a set of underlying fundamentals (Figure 9).5 Both the productivity differential (a lower productivity growth in the tradables sector (than in the non-tradables sector) and lower terms of trade helped push the equilibrium real exchange rate down since the early 1990s. The real exchange rate overvaluation for Italy as of end-2005 is estimated at 8 percent for the 2005 fundamentals. Despite the usual shortcomings of such studies (large estimation errors and the fact that results are contingent on the assumptions of particular models), the current model estimates seem to be in line with earlier estimates of the equilibrium real exchange rate for Italy carried out following euro adoption, which also found only a slight deviation from equilibrium at the time of euro adoption, with most estimates in the range of 1 to 4 percent undervaluation at that time (Alberola et al., 1999; Couharde and Mazier, 2001).
4 Idem. 5 Lagged net foreign assets to trade, productivity of tradables versus nontradables relative to trading partners, commodity terms of trade, government consumption to GDP ratio, and an index of trade restriction.
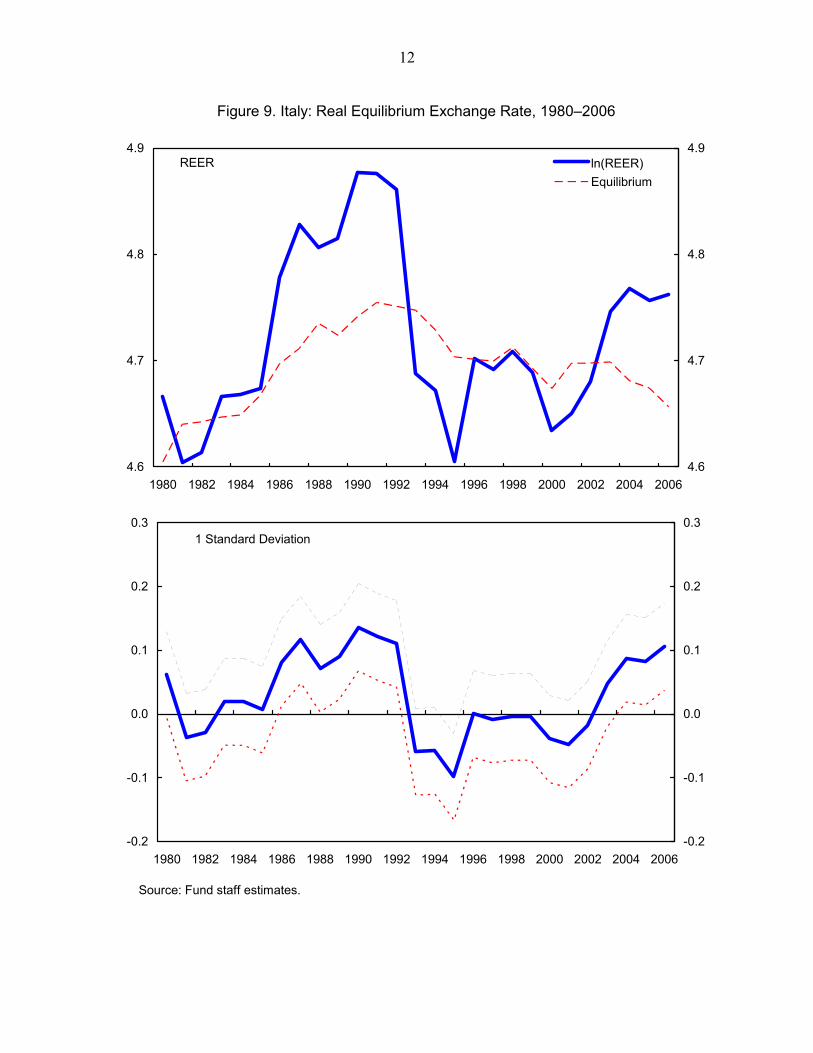
12
Figure 9. Italy: Real Equilibrium Exchange Rate, 1980–2006
Source: Fund staff estimates.
REER
4.6
4.7
4.8
4.9
1980 1982 1984 1986 1988 1990 1992 1994 1996 1998 2000 2002 2004 20064.6
4.7
4.8
4.9ln(REER)Equilibrium
1 Standard Deviation
-0.2
-0.1
0.0
0.1
0.2
0.3
1980 1982 1984 1986 1988 1990 1992 1994 1996 1998 2000 2002 2004 2006-0.2
-0.1
0.0
0.1
0.2
0.3

13
D. Conclusion
15. Italy’s persistent loss of market share and weak export growth since the mid-1990s coincided with deteriorating cost competitiveness. Constant market share analysis suggests that annual export growth since the mid-1990s was some 1.8 percentage points lower than it would have been in the absence of a competitiveness gap.
16. A range of indicators suggests an appreciable, albeit not large, competitiveness gap versus other euro-area members. Italy’s unit labor cost-based real effective exchange rate has appreciated by some 20 percent since 1998, generally considered a benchmark year. Complementary methodologies to estimate the real exchange rate misalignment at end-2005, including a current account (macroeconomic balance) approach, a reduced-form equilibrium real exchange rate approach using determinants drawn from cross-country panel data analyses (net foreign assets relative to exports, terms of trade, labor productivity, and government consumption), and an external sustainability approach, suggest a competitiveness gap in the range of 5 to 8 percent.
Benchmark RER-ULC Wage costs/hange rate Profit Fundamental Macro Balance NFAyear compared to value added in ratio 3/ margins Equilibrium Approach Stabilizing
1/ benchmark yr 2/ manufacturing actual actual/norm 4/ (2005) Exchange rate 5/ 6/ 7/
Italy 1998 17.5 67.6 96.9 100-125 108.0 8.2 7.5 5-7
Sources: National authorities; Eurostat; OECD; and IMF staff estimates.
1/ The benchmark year is when the exchange rate was considered to be appropriately valuedconsidering factors including the size of the current account deficit, export growth, and GDP growth.
3/ Ratio between the market exchange rate and the PPP exchange rate (both relative to euro area).4/ Norm is the PPP exchange rate ratio consistent with a country's GDP per capita.5/ ERER Approach, using 2005 fundamentals. 6/ Assumes an implicit trade elasticity of 0.18, reflecting Italy's degree of openess.7/ As of end-2005.
2/ ULC-RER, unit-labor-cost-based real exchange rate.
Summary Exchange Rate Assessment, 2005 (in percent, unless otherwise noted)
17. The unwinding of the competitiveness gap will require reforms that boost productivity growth and continued wage moderation, as well as an adjustment by export firms in Italy, with a reorientation of the model of specialization toward more dynamic sectors, a process that may have already started in response to the measured loss of competitiveness.
14
REFERENCES Alberola, Enrique, Susana G. Cervero, Humberto Lopez, and Angel Ubide, 1999, Global
Equilibrium Exchange Rates: Euro, Dollar, “ins,” “outs,” and Other Major Currencies in a Panel Cointegration Framework.
Allard, C., M. Catalan, L. Everaert, and S. Sgherri, 2005, Explaining Differences in External
Sector Performance Among Large Euro Area Countries, IMF Country Report No. 05/401 (Washington: International Monetary Fund).
Allegra, E., M. Forini, M. Grillo, and L. Magnani, 2004, Antitrust Policy and National
Growth: Some Evidence from Italy, Giornale degli Economisti e Annali di Economia, Vol. 63, pp. 69–86.
Arese-Visconti, Giovanni, 2002, Tassi di Cambio Reali: Teoria ed Evidenza Empirica,
Working Paper No. 2002/11 (Firenze: Universitá degli Studi di Firenze). Basile, Roberto, and Cristina Pensa, 2004, How Intense is Competition in International
Markets of Traditional Goods? The Case of Italian Exporters, Working Paper No. 45, (Rome: Istituto di Studi e Analisi Economica).
Basile, Roberto, Sergio de Nardis, and Alessandro Girardi, 2006, Pricing to Market of Italian
Exporting Firms, Working Paper No. 70 (Rome: Istituto di Studi e Analisi Economica).
Bassanetti, A., M. Iommi, C. Jona-Lasinio, and F. Zollino, 2004, La Crescita dell’Economia
Italiana Negli Anni Novanta tra Ritardo Tecnologico e Rallentamento della Produttivitá, Numero 539 (Roma: Banca d’Italia).
Bassanetti, A., and F. Zollino, 2004, Produttivita’ Totale dei Fattori, Nuove Technologie e
Concorrenza Internazionale: Evidenze Settoriali in Italia (Roma: Banca d’Italia). Bassanetti, A., Jörg Döpki, Roberto Torrini, and Roberta Zizza, 2006, Capital, Labour, and
Productivity: What role do they play in the potential GPD weakness of France, Germany, and Italy? Discussion Paper Series No. 1: Economic Studies No. 09/2006 (Frankfurt: Deutsche Bundesbank).
Bugamelli, Matteo, and Roberto Tedeschi, 2005, Le Strategie di Prezzo delle Imprese
Esportatrici Italiane, Numero 563 (Roma: Banca d’Italia). ———, 2006, Pricing-to-Market and Market Structure (Rome: Bank of Italy, Research
Department).
15
Bulír, Aleš, and Kateřina Šmídková, 2005, “Exchange rates in the new EU accession
countries: What have we learned from the forerunners?,” Economic Systems, pp. 163–86.
Coudert, Virginie, and Cécile Couharde, 2006, Real Equilibrium Exchange Rate in European
Union New Members and Candidate Countries, 3rd Euroframe Conference on Economic Policy Issues in the European Union. Towards an Enlarging European Monetary Union: Challenges for New and Old Member States.
Couharde, C., and J. Mazier, 2001, “The Equilibrium Exchange Rates of European
Currencies and the Transition to Euro,” Applied Economics, pp. 1795–1801. De Broeck, M., and T. Sløck, 2001, Interpreting Real Exchange Rate Movements in
Transition Countries, IMF Working Paper 01/56 (Washington: International Monetary Fund).
Doroodian, K., Chulho Jung, and Ahmet Yucel, 2002, “Estimating the equilibrium real
exchange rate: the case of Turkey,” Applied Economics (Athens: Ohio University). Edwards, Sebastian, 1988, The Determination of Equilibrium Real Exchange Rate, UCLA
Working Paper No. 508 (University of California at Los Angeles and National Bureau of Economic Research).
European Central Bank, 2005, The New EU Member States Convergence and Stability. Faini, R., and A. Sapir, 2005, “Un modello obsoleto? Crescita e specializzazione,
dell’economia Italiana,” (Mimeo: Università di Roma Tor Vergata). Felettigh, A., Remy Lecat, Bertrand Pluyaud, and Roberto Tedeschi, 2005, Market Shares
and Trade Specialisation of France, Germany, and Italy, in Convergence or Divergence in Europe? Growth and Business Cycles in France, Germany and Italy.
Feyzioğlu, Tarhan, 1997, Estimating the Equilibrium Real Exchange Rate: An Application to
Finland, IMF Working Paper No. WP/97/109. Halpern, László, and Charles Wyplosz, 1995, Equilibrium Real Exchange Rates in
Transition, Discussion Paper Series No. 1145 (London: Center for Economic Policy Research).
———, 1996, Real Exchange Rates and Exchange Rate Policy in Hungary, Discussion
Paper Series No. 1366 (London: Center for Economic Policy Research).

16
Hofman, David, Francisco Nadal De Simone, and Mark Walsh, 2005, ‘The External
Competitiveness of the Dutch Economy: A Short Note on Evidence from both Aggregate and Disaggregate Data,’ Selected Issues, Country Report No. 05/225, (Washington: International Monetary Fund).
IMF, 2006, Methodology for CGER Exchange Rate Assessments,
(http://www.imf.org/external/np/pp/eng/2006/110806.pdf) ISAE, 2005, Crescita e Struttura Produttiva del’Italia (Rome: Istituto di Studi e Analisi Economica). Isard, Peter, and Hamid Faruqee, 1998, Exchange Rate Assessment Extension of the
Macroeconomic Balance Approach, Occasional Paper No. 167 (Washington: International Monetary Fund).
———, G. Russell Kincaid, and Martin Fetherston, 2001, Methodology for Current Account
and Exchange Rate Assessments, Occasional Paper No. 209 (Washington: International Monetary Fund).
Mariotti, S., F. Onica, and L. Piscitello, 2002, “Foreign Ownership and Firm Performance in
Italy,” The Internationalisation of Asset Ownership in Europe, eds. H. Huizinga and L.Jonung (Cambridge: University Press).
Mongardini, Joannes, 1998, Estimating Egypt’s Equilibrium Real Exchange Rate, IMF
Working Paper No. WP/98/5. Nardis, Sergio de, 2005, Cresicita e Struttura Produttiva Dell’Italia: un Confronto con i
Principali Paesi Industriali (Rome: Istituto di Studi e Analisi Economica). Neary, J. Peter, 2006, Measuring Competitiveness, Working Paper No. 06/209 (Washington:
International Monetary Fund). Pain, Nigel, Annabelle Mourougane, Frank Sédillot, and Laurence Le Fouler, 1999, The New
OECD International Trade Model, OECD Working Paper No. 440. Sgherri, Silvia, 2006, “Regaining Competitiveness: A Challenge “Made in Italy,” Selected
Issues (Washington: International Monetary Fund). Task Force of the Monetary Policy Committee, 2005, Competitiveness and the Export
Performance of the Euro Area, Occasional Paper Series No. 30 (Frankfurt: European Central Bank)

17
Terra, Maria Cristina, and Frederico Estrella Carneiro Valladares, 2003, Real Exchange Rate
Misalignments, Ensaios Econômicos, No. 493 (Brasilia: Escola de Pós Graduação em Economia da Fundação Getulio Vargas).
18
II. PUBLIC SPENDING IN ITALY: A CRESCENDO6
Objective. To examine the determinants of the increase in Italy’s primary spending ratio over the past decade, including from a cross-country perspective.
Results. While Italy was subject to “exogenous” spending pressures, some of which can be inferred from EU-wide trends, its record of persistent slippages indicates country-specific policy shortcomings and missed opportunities.
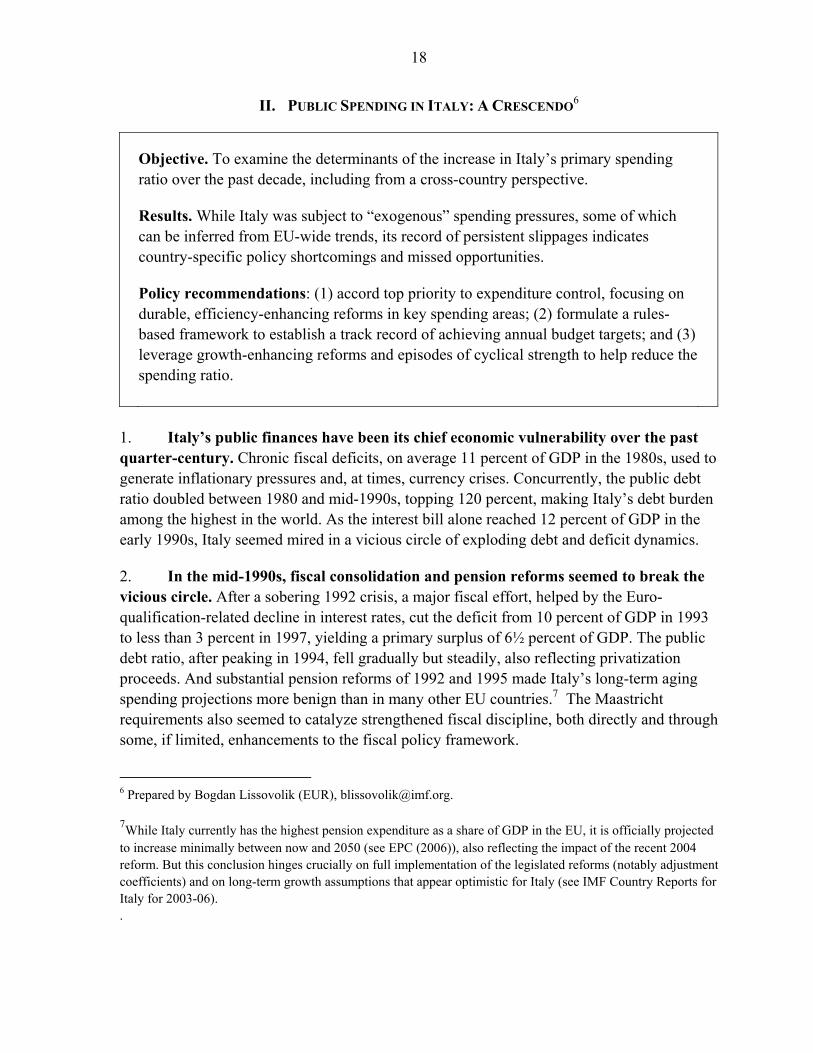
Policy recommendations: (1) accord top priority to expenditure control, focusing on durable, efficiency-enhancing reforms in key spending areas; (2) formulate a rules-based framework to establish a track record of achieving annual budget targets; and (3) leverage growth-enhancing reforms and episodes of cyclical strength to help reduce the spending ratio.
1. Italy’s public finances have been its chief economic vulnerability over the past quarter-century. Chronic fiscal deficits, on average 11 percent of GDP in the 1980s, used to generate inflationary pressures and, at times, currency crises. Concurrently, the public debt ratio doubled between 1980 and mid-1990s, topping 120 percent, making Italy’s debt burden among the highest in the world. As the interest bill alone reached 12 percent of GDP in the early 1990s, Italy seemed mired in a vicious circle of exploding debt and deficit dynamics.
2. In the mid-1990s, fiscal consolidation and pension reforms seemed to break the vicious circle. After a sobering 1992 crisis, a major fiscal effort, helped by the Euro-qualification-related decline in interest rates, cut the deficit from 10 percent of GDP in 1993 to less than 3 percent in 1997, yielding a primary surplus of 6½ percent of GDP. The public debt ratio, after peaking in 1994, fell gradually but steadily, also reflecting privatization proceeds. And substantial pension reforms of 1992 and 1995 made Italy’s long-term aging spending projections more benign than in many other EU countries.7 The Maastricht requirements also seemed to catalyze strengthened fiscal discipline, both directly and through some, if limited, enhancements to the fiscal policy framework.
6 Prepared by Bogdan Lissovolik (EUR), [email protected].
7While Italy currently has the highest pension expenditure as a share of GDP in the EU, it is officially projected to increase minimally between now and 2050 (see EPC (2006)), also reflecting the impact of the recent 2004 reform. But this conclusion hinges crucially on full implementation of the legislated reforms (notably adjustment coefficients) and on long-term growth assumptions that appear optimistic for Italy (see IMF Country Reports for Italy for 2003-06). .

19
Italy: Fiscal Developments, 1980–2005
-14
-12
-10
-8
-6
-4
-2
01980 1982 1984 1986 1988 1990 1992 1994 1996 1998 2000 2002 2004
perc
ent o
f GD
P
overall fiscal balance
60
70
80
90
100
110
120
130
1980 1982 1984 1986 1988 1990 1992 1994 1996 1998 2000 2002 2004
perc
ent o
f GD
P
public debt
3. But this consolidation was rolled back by underlying spending pressures. After bottoming out at under 1 percent of GDP in 2000, due in part to one-off factors, the deficit breached the key 3 percent limit the following year, and topped 4 percent in 2005, causing the decline in the public debt to reverse, while the primary surplus fell sharply. From an

20
accounting perspective, the deficit was driven mainly by primary spending, whose growth in Italy outpaced that of other large euro area countries.
Change in Primary Spending 2000-2005
0
1
2
3
4pe
rcen
t of G
DP Italy
GermanySpainFrance
A. Anatomy of Italy’s Deficit Slippages
4. Italy’s absolute and comparative performance under the EU’s Stability and Growth Pact (SGP) slipped progressively. While initially the original SGP’s 2003 difficulties occurred against the background of deficits run by Germany and France, Italy’s more favorable fiscal position at the time proved illusory, as its first-reported deficits had been systematically underestimated, and partly achieved via one-offs. Thus, while the first breach of the 3 percent threshold in Italy became apparent in 2005, it was only then revealed that the country had violated the ceiling back in 2001, earlier than Germany and France. By 2005, with the reduced scope for one-offs as major tax amnesties expired, even Italy’s first-reported deficits exceeded those of its key comparators.
Overall Balance in Large Euro-area Countries
-5
-4
-3
-2
-1
02001 2002 2003 2004 2005
perc
ent o
f GD
P
GermanyFranceItaly-firstItaly-final
Maastricht ceiling
5. Much of the EU-wide analysis of the SGP’s problems centered on growth shortfalls relative to forecasts. The authorities of noncompliant countries claimed they had fulfilled original budget plans and that the shortfalls in headline fiscal outcomes were caused by unexpected growth slowdowns (though the EC, based on its readings of structural

21
balances, argued the opposite (see Jonung and Larch (2005)). These authors provided evidence to bridge the two views, concluding that the cyclically adjusted balance may fall short of the targeted ratio even if expenditure plans are fully implemented (in levels), because of the effect of the lower potential growth on the denominator of the spending ratio. Such growth-related considerations played an important role in the design of the SGP’s 2005 reform.
6. But growth shortfalls played only a subordinate role in Italy’s failure to meet its own deficit targets. Assuming a budget balance elasticity to real growth of one-half, less than half of the average headline deficit shortfall of 2.4 percentage points relative to the annual budget targets in 2001–05 was related to the overly optimistic (real) growth projections.8 This proportion shrinks to one-third if account is made for various “exogenous” factors that improved the deficit ratios (within-year measures, nominal GDP revisions, and interest rate changes). And while the relative role of growth appears to have been increasing more recently, especially in 2005, this would only hold only if these latest deficit outcomes are confirmed as final—something that has not happened in Italy since the 1990s.9
7. Revenue targets for 2001-05 were largely met. Surprisingly, neither revenue levels nor its growth rates were substantially lower than projected (except in 2002), despite considerable (real) growth shortfalls. Three reasons accounted for these outturns:
• the revenue base for short-term projections seems “understated,” as receipts were generally adjusted upward ex-post, partly due to new information; in addition, some subsequent statistical reclassifications tended to raise both revenues and expenditures;
• various tax amnesties (mostly included in capital revenues) led to better total revenue performance, with current revenue performing less well (but if these revenues are adjusted for the growth shortfall, even these slippages are eliminated);
• inflation was somewhat underprojected in 2001–03.
8 The calculation aims to skirt the frequently revised estimates of the output gap. In any case, the results should not be affected significantly as long as the elasticity to real (actual or potential) growth remains around ½, which is consistent with the figure agreed by the authorities with the European Commission.
9 See Balassone et al. (2006) for an analysis of ex-post revisions in Italy and EU-wide.

22
Italy: Budget Targets and Outcomes in 2001–05 (in percent unless otherwise indicated)
-0.5
0.0
0.5
1.0
1.5
2.0
2.5
3.0
3.5
2001 2002 2003 2004 2005
GDP growth rate in budget
Actual growth rate
550
575
600
625
650
2001 2002 2003 2004 2005
billi
ons
of e
uro
Nominal revenue actual level
Nominal revenue targeted level
-4.5
-4.0
-3.5
-3.0
-2.5
-2.0
-1.5
-1.0
-0.5
0.02001 2002 2003 2004 2005
in p
erce
nt o
f GD
P
Budget's overall balance targetFinal overall balance outturn
0
1
2
3
4
5
6
7
8
2001 2002 2003 2004 2005
Primary current spending growthTargeted primary current spending growth
0.0
0.2
0.4
0.6
0.8
1.0
2001 2002 2003 2004 2005
fract
ion
Deficits due to growth shortfall
Non-growth deficit slippage
0
1
2
3
4
5
6
7
8
2001 2002 2003 2004 2005
Nominal revenue actual growthNominal revenue targeted growth

23
8. But expenditure consistently overshot. Italy’s recent budgets have largely and systematically underprojected spending in levels and growth rates. These slippages basically account for the estimated non-growth-related fiscal balance shortfall.
• Total spending in 2001-05 was 3½ percent higher than the nominal budget target (Table 1), and average annual growth of total spending was 1.6 percentage points higher than budgeted. Current primary spending accounted for the bulk of the overruns.
• This underprojection was spread over most spending categories for 2001-05, with the exception of the interest bill (systematically overprojected) and of social spending (no apparent bias in the projections).
• The downward biases in the projections have been strongest in capital spending, “goods and services,” and “other” current primary spending. The underprojection bias on wage spending was also significant, albeit not as large in percentage terms.
Percentage Growth
Percentage Point Deviation from Level
Total spending 8.1 3.5Total current primary spending 7.2 4.6 wages 6.9 3.2 goods and services 18.4 12.0 other current primary 23.1 18.6 social spending 0.8 -0.6Interest bill -18.4 -5.3Capital spending 21.7 5.6
Table 1. Italy: Cumulative Underprojection Bias in Spending, 2001–05
9. The expenditure-based nature of the slippages likely indicates fundamental problems with spending control, rather than merely with forecasting. First, the deviations occurred in discretionary spending – where recent policy efforts to curb expenditure tended to concentrate, while projections in other areas, including revenues, appeared to be surprisingly conservative. Second, in Italy, spending-based slippages are structural by definition, since the cyclical component in Italy’s public spending is negligible due to low unemployment benefits. In any case, Italy clearly did not fit a general EU pattern whereby deficits were missed but spending plans were fully implemented in nominal terms.
B. Taking Stock of Italy’s Spending: Stylized Facts
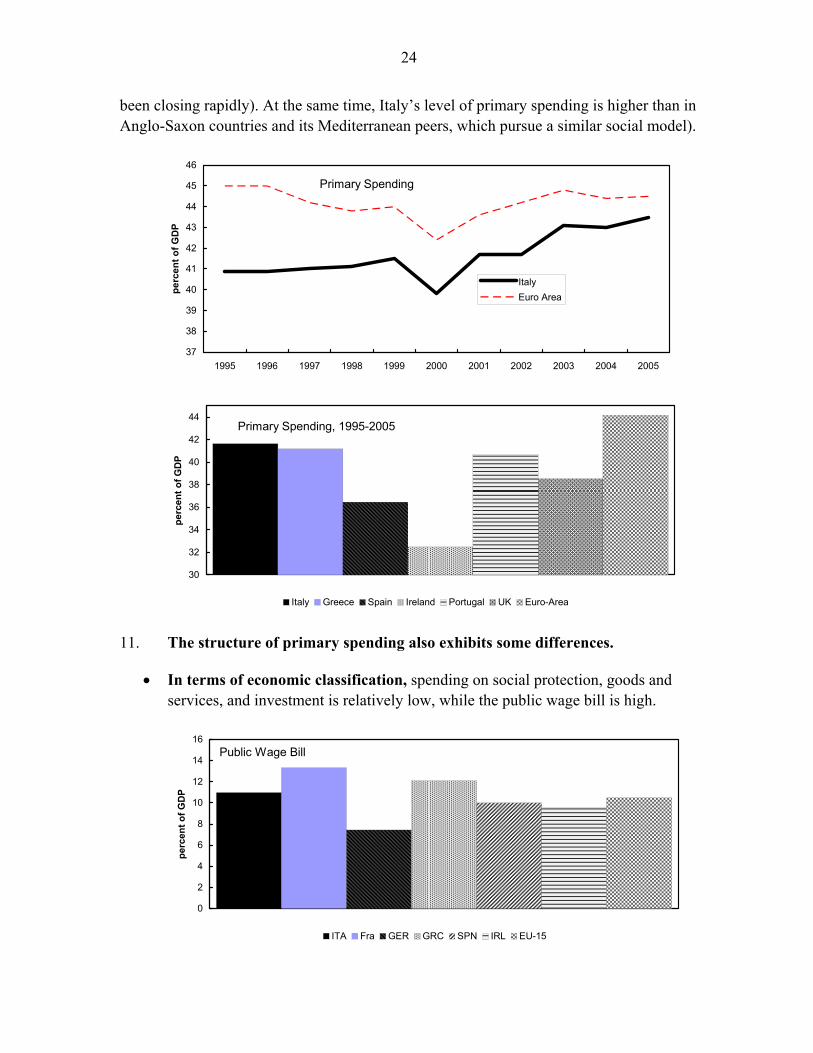
10. The level and overall structure of Italy’s public spending differs moderately from that of most other EU countries. With the high interest bill reflecting the debt burden, primary spending in Italy has been lower than in the euro-area on average (but the gap has
24
been closing rapidly). At the same time, Italy’s level of primary spending is higher than in Anglo-Saxon countries and its Mediterranean peers, which pursue a similar social model).
Primary Spending
37
38
39
40
41
42
43
44
45
46
1995 1996 1997 1998 1999 2000 2001 2002 2003 2004 2005
perc
ent o
f GD
P
ItalyEuro Area
Primary Spending, 1995-2005
30
32
34
36
38
40
42
44
perc
ent o
f GD
P
Italy Greece Spain Ireland Portugal UK Euro-Area
11. The structure of primary spending also exhibits some differences.
• In terms of economic classification, spending on social protection, goods and services, and investment is relatively low, while the public wage bill is high.
Public Wage Bill
0
2
4
6
8
10
12
14
16
perc
ent o
f GD
P
ITA Fra GER GRC SPN IRL EU-15
25
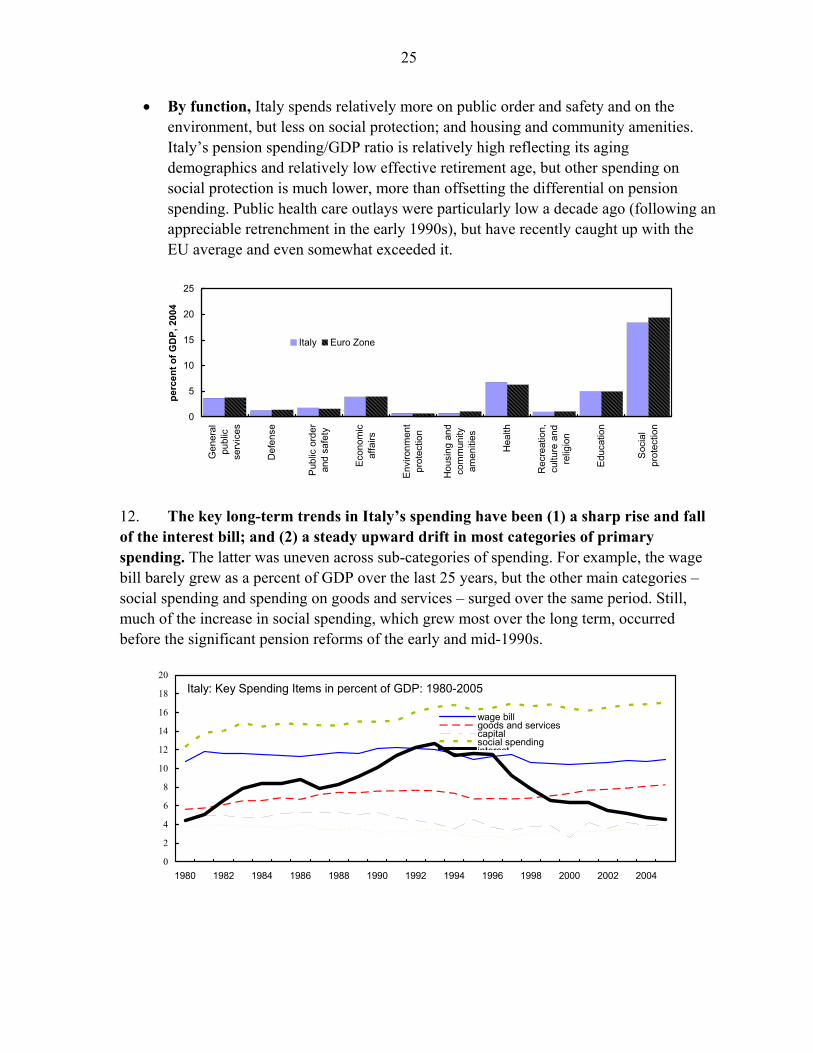
• By function, Italy spends relatively more on public order and safety and on the environment, but less on social protection; and housing and community amenities. Italy’s pension spending/GDP ratio is relatively high reflecting its aging demographics and relatively low effective retirement age, but other spending on social protection is much lower, more than offsetting the differential on pension spending. Public health care outlays were particularly low a decade ago (following an appreciable retrenchment in the early 1990s), but have recently caught up with the EU average and even somewhat exceeded it.
0
5
10
15
20
25
Gen
eral
publ
icse
rvic
es
Def
ense
Pub
lic o
rder
and
safe
ty
Eco
nom
icaf
fairs
Env
ironm
ent
prot
ectio
n
Hou
sing
and
com
mun
ityam
eniti
es
Hea
lth
Rec
reat
ion,
cultu
re a
ndre
ligio
n
Edu
catio
n
Soc
ial
prot
ectio
n
perc
ent o
f GD
P, 2
004
Italy Euro Zone
12. The key long-term trends in Italy’s spending have been (1) a sharp rise and fall of the interest bill; and (2) a steady upward drift in most categories of primary spending. The latter was uneven across sub-categories of spending. For example, the wage bill barely grew as a percent of GDP over the last 25 years, but the other main categories – social spending and spending on goods and services – surged over the same period. Still, much of the increase in social spending, which grew most over the long term, occurred before the significant pension reforms of the early and mid-1990s.
Italy: Key Spending Items in percent of GDP: 1980-2005
0
2
4
6
8
10
12
14
16
18
20
1980 1982 1984 1986 1988 1990 1992 1994 1996 1998 2000 2002 2004
wage billgoods and servicescapitalsocial spendinginterest
26
Key Primary Spending Items in Terms of GDP (1980=100)
95
105
115
125
135
145
155
1980 1982 1984 1986 1988 1990 1992 1994 1996 1998 2000 2002 2004
wage bill
goods andservicessocialspending
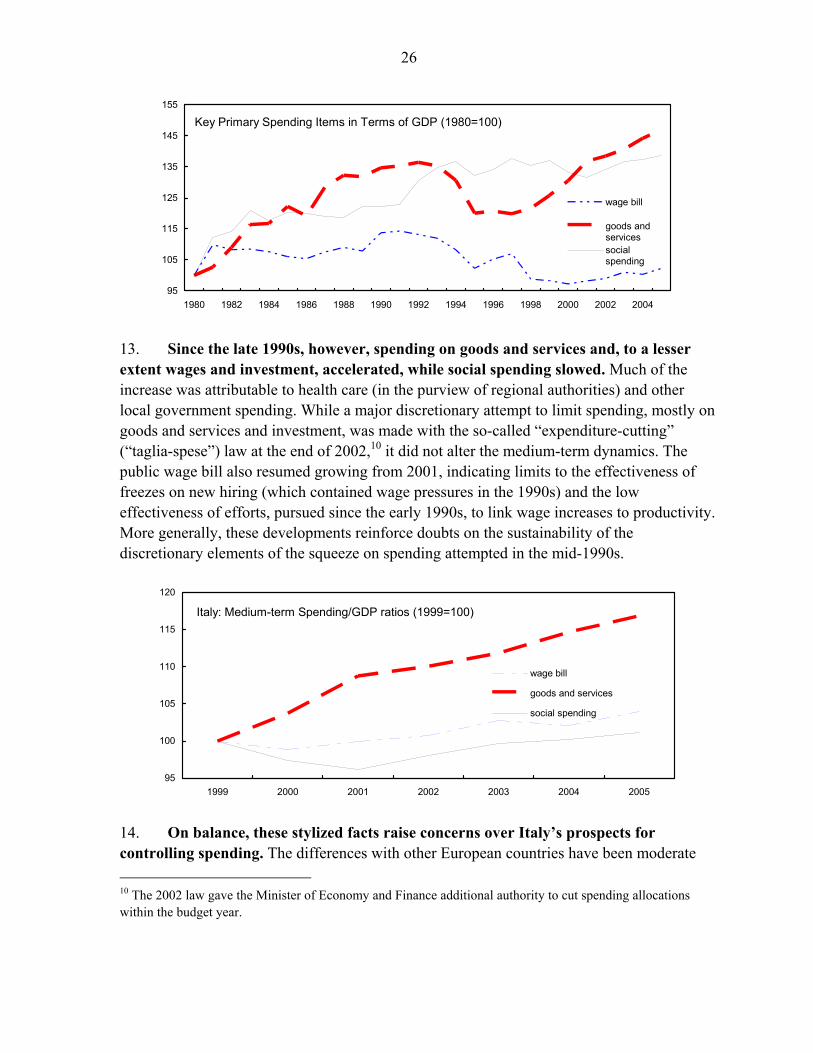
13. Since the late 1990s, however, spending on goods and services and, to a lesser extent wages and investment, accelerated, while social spending slowed. Much of the increase was attributable to health care (in the purview of regional authorities) and other local government spending. While a major discretionary attempt to limit spending, mostly on goods and services and investment, was made with the so-called “expenditure-cutting” (“taglia-spese”) law at the end of 2002,10 it did not alter the medium-term dynamics. The public wage bill also resumed growing from 2001, indicating limits to the effectiveness of freezes on new hiring (which contained wage pressures in the 1990s) and the low effectiveness of efforts, pursued since the early 1990s, to link wage increases to productivity. More generally, these developments reinforce doubts on the sustainability of the discretionary elements of the squeeze on spending attempted in the mid-1990s.
Italy: Medium-term Spending/GDP ratios (1999=100)
95
100
105
110
115
120
1999 2000 2001 2002 2003 2004 2005
wage bill
goods and services
social spending
14. On balance, these stylized facts raise concerns over Italy’s prospects for controlling spending. The differences with other European countries have been moderate 10 The 2002 law gave the Minister of Economy and Finance additional authority to cut spending allocations within the budget year.

27
(indicating limited scope for fiscal savings, from this aggregated perspective, without efficiency-enhancing reforms), and recent trends have been toward converging to this structure (i.e., relatively slow growth of the wage bill but acceleration in goods and services). The largest difference with other countries––low aggregate spending on social protection (particularly on unemployment benefits)––has been linked to the traditional role of the family as an alternative provider of the social safety net in Italy (see Bibbee and Golio (2002)), but the persistence of this factor cannot be taken for granted and may imply an upward adjustment for Italy’s spending. From the time series perspective, the sharp fall in the interest bill offered a unique opportunity to adjust, but was used instead for other spending.
C. Empirical Analysis of Determinants of Spending
Broad Approach and Data
15. The literature on public spending focuses on a variety of economic, political, and demographic factors. For aggregate spending, much of the debate has centered on national political economy determinants,11 though several factors have tended to weaken their applicability recently in the EU (especially the Maastricht criteria). Various economic factors are also believed to drive aggregate public expenditure outcomes, such as (1) past and actual inflation via indexation; (2) economic growth/cycle; (3) convergence of public spending across countries and over time; 12 (4) per capita output, real or evaluated at PPP (the latter reflecting the theory that demand for public services increases with wealth). Demographic factors also play a role, especially in the rapidly-aging industrialized countries.
16. The economic and other determinants would vary substantially between current and capital spending. Thus, while the theoretical literature on the determinants of aggregate spending is quite broad-based, the causes of public infrastructure spending are generally believed to be economic in nature, and Turrini (2004) provides a reasonably concise framework for testing these empirically in an EU-wide panel. Thus, it may be useful to investigate the determinants of capital and current primary spending separately.
17. The econometrics are based on annual panel data, although some times series properties have been studied.13 The number of relevant countries is too small for purely
11 See Alesina et al. (1999) and Milesi-Ferretti et al. (2002) and references therein. 12 The observed convergence was linked to diminishing returns to government activity on the production side (see Barro (1990)), falling marginal utility from government spending on the demand side, as well as globalization’s impact on the equalization in tax burdens. 13 Data have been taken from a variety of sources. For cross-country regressions, these have been Eurostat and OECD. For Italy, the main source is the official statistical agency ISTAT, which publishes data on economic and functional classification of expenditure. Two such updated aggregate time series of public spending data are
(continued…)
28
cross-country exercises, while the availability of a consistent time series is also severely restricted. And the period of interest would generally be from the mid-1990s, in order to abstract from the significant changes in the underlying economic parameters that were entailed by the accession to (or qualification for) the euro area.
Cross-country Analysis
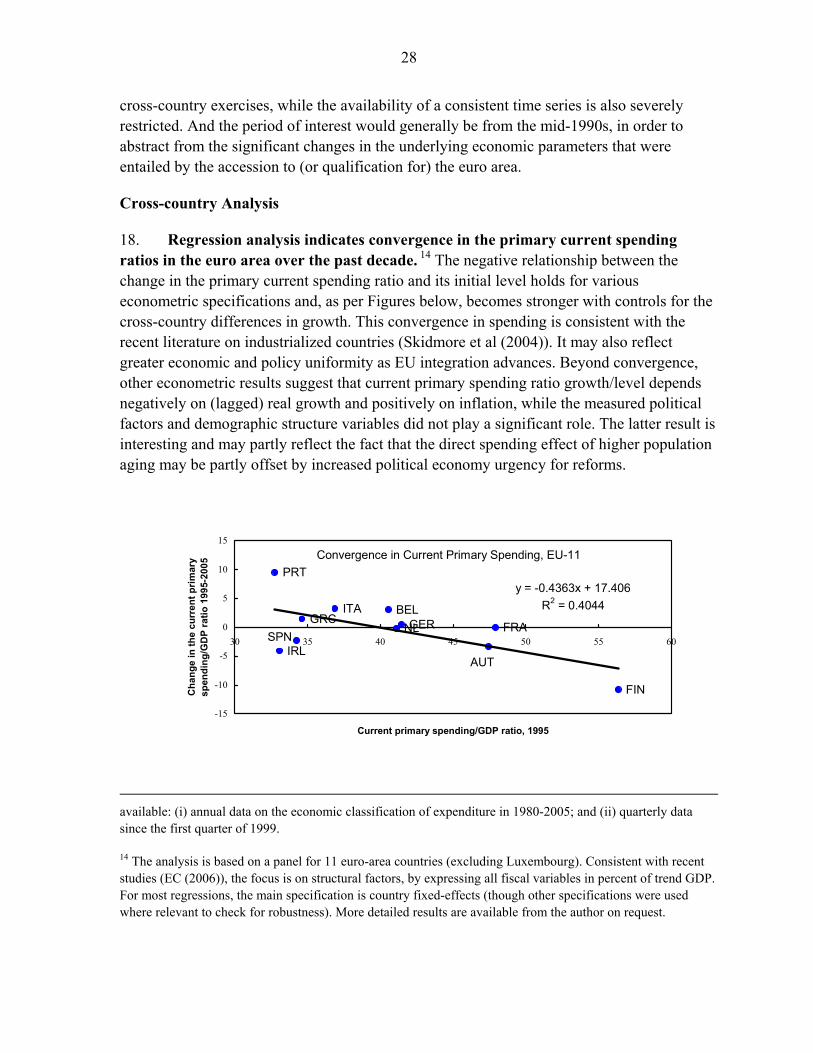
18. Regression analysis indicates convergence in the primary current spending ratios in the euro area over the past decade. 14 The negative relationship between the change in the primary current spending ratio and its initial level holds for various econometric specifications and, as per Figures below, becomes stronger with controls for the cross-country differences in growth. This convergence in spending is consistent with the recent literature on industrialized countries (Skidmore et al (2004)). It may also reflect greater economic and policy uniformity as EU integration advances. Beyond convergence, other econometric results suggest that current primary spending ratio growth/level depends negatively on (lagged) real growth and positively on inflation, while the measured political factors and demographic structure variables did not play a significant role. The latter result is interesting and may partly reflect the fact that the direct spending effect of higher population aging may be partly offset by increased political economy urgency for reforms.
Convergence in Current Primary Spending, EU-11
BELGERGRC
SPNFRA
IRL
ITANL
AUT
PRT
FIN
y = -0.4363x + 17.406R2 = 0.4044
-15
-10
-5
0
5
10
15
30 35 40 45 50 55 60
Current primary spending/GDP ratio, 1995
Cha
nge
in th
e cu
rren
t prim
ary
spen
ding
/GD
P ra
tio 1
995-
2005
available: (i) annual data on the economic classification of expenditure in 1980-2005; and (ii) quarterly data since the first quarter of 1999.
14 The analysis is based on a panel for 11 euro-area countries (excluding Luxembourg). Consistent with recent studies (EC (2006)), the focus is on structural factors, by expressing all fiscal variables in percent of trend GDP. For most regressions, the main specification is country fixed-effects (though other specifications were used where relevant to check for robustness). More detailed results are available from the author on request.
29
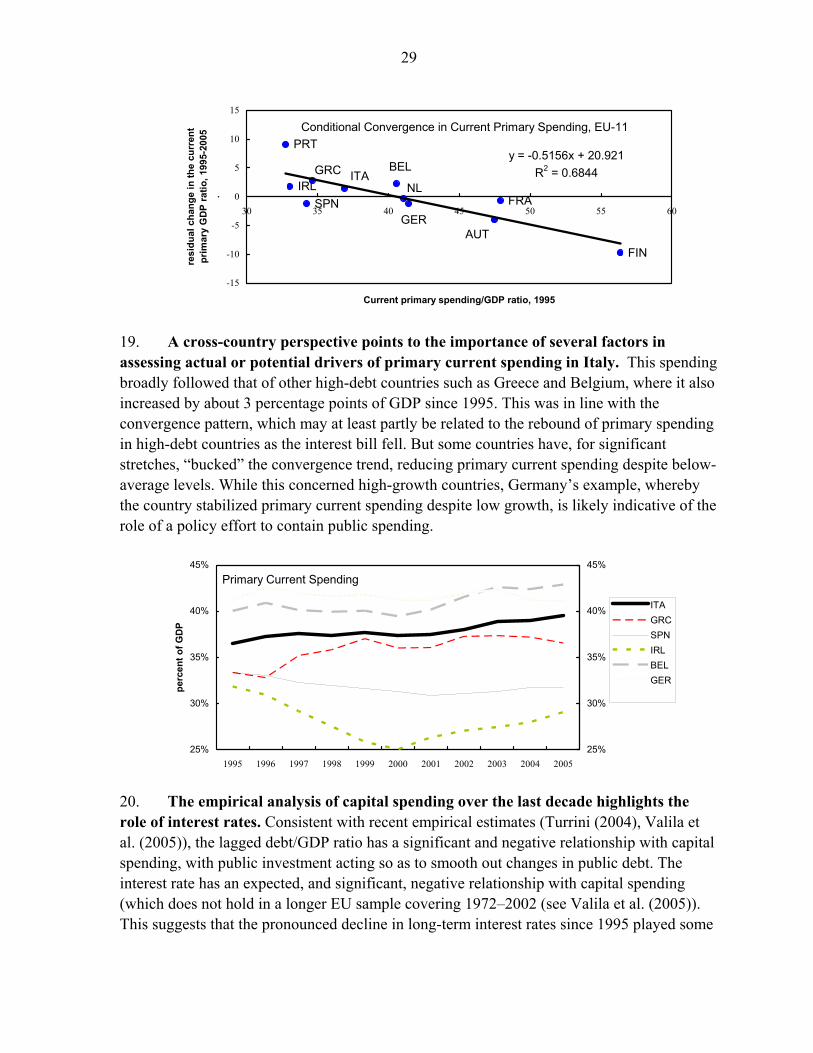
Conditional Convergence in Current Primary Spending, EU-11
FIN
PRT
AUT
NLITA
IRLFRASPN
GRC
GER
BELy = -0.5156x + 20.921
R2 = 0.6844
-15
-10
-5
0
5
10
15
30 35 40 45 50 55 60
Current primary spending/GDP ratio, 1995
resi
dual
cha
nge
in th
e cu
rren
t pr
imar
y G
DP
ratio
, 199
5-20
05
.
19. A cross-country perspective points to the importance of several factors in assessing actual or potential drivers of primary current spending in Italy. This spending broadly followed that of other high-debt countries such as Greece and Belgium, where it also increased by about 3 percentage points of GDP since 1995. This was in line with the convergence pattern, which may at least partly be related to the rebound of primary spending in high-debt countries as the interest bill fell. But some countries have, for significant stretches, “bucked” the convergence trend, reducing primary current spending despite below-average levels. While this concerned high-growth countries, Germany’s example, whereby the country stabilized primary current spending despite low growth, is likely indicative of the role of a policy effort to contain public spending.
Primary Current Spending
25%
30%
35%
40%
45%
1995 1996 1997 1998 1999 2000 2001 2002 2003 2004 2005
perc
ent o
f GD
P
25%
30%
35%
40%
45%
ITAGRCSPNIRLBELGER
20. The empirical analysis of capital spending over the last decade highlights the role of interest rates. Consistent with recent empirical estimates (Turrini (2004), Valila et al. (2005)), the lagged debt/GDP ratio has a significant and negative relationship with capital spending, with public investment acting so as to smooth out changes in public debt. The interest rate has an expected, and significant, negative relationship with capital spending (which does not hold in a longer EU sample covering 1972–2002 (see Valila et al. (2005)). This suggests that the pronounced decline in long-term interest rates since 1995 played some

30
role in facilitating investment spending, while for earlier periods cost-of-capital considerations possibly had a lesser role to play.
21. These empirical results seem consistent with different stylized country experiences. Gross fixed capital formation tended to rise in countries that most benefited from the decline in interest rates, such as Italy and Greece, in contrast to more “stable” countries like Germany. However, both Italy and Greece, whose economies had been subject to significant discretionary fiscal efforts to stay within the 3 percent threshold, experienced pronounced brief slumps in public investment spending.
Public Gross Fixed Capital Formation
0
1
2
3
4
5
1995 1996 1997 1998 1999 2000 2001 2002 2003 2004 2005
perc
ent o
f GD
P
ITAGERGRC
Time Series Analysis15
22. Spending is negatively correlated with real GDP growth and positively with inflation. As expected, there is co-movement between annual changes in the ratios of the main categories of spending to GDP, which is slightly lower for wages, possibly due to the idiosyncrasies of the bargaining process. This co-movement however does not hold for intra-year (quarterly) data in 1999–2006, based on a simple pair-wise regression with seasonal dummies. But the inverse relationship of the ratios with real growth and positive with inflation holds both for annual and quarterly data, indirectly pointing to the possible role of these in driving expenditures, subject to the caveats of reverse causality.
23. The elasticity of expenditure to nominal GDP has on average been higher than unity, and rising most recently for primary spending. Regressions of total expenditure 15 The analysis of the Italy-only time series is constrained by data availability. Since published updated annual and quarterly series contain some 25-30 observations, at best these allow to check very simple statistical properties and bivariate relationships. In addition, given that Italy’s prospects of EMU accession marked a structural break, the main period of interest would be post-1995.
31
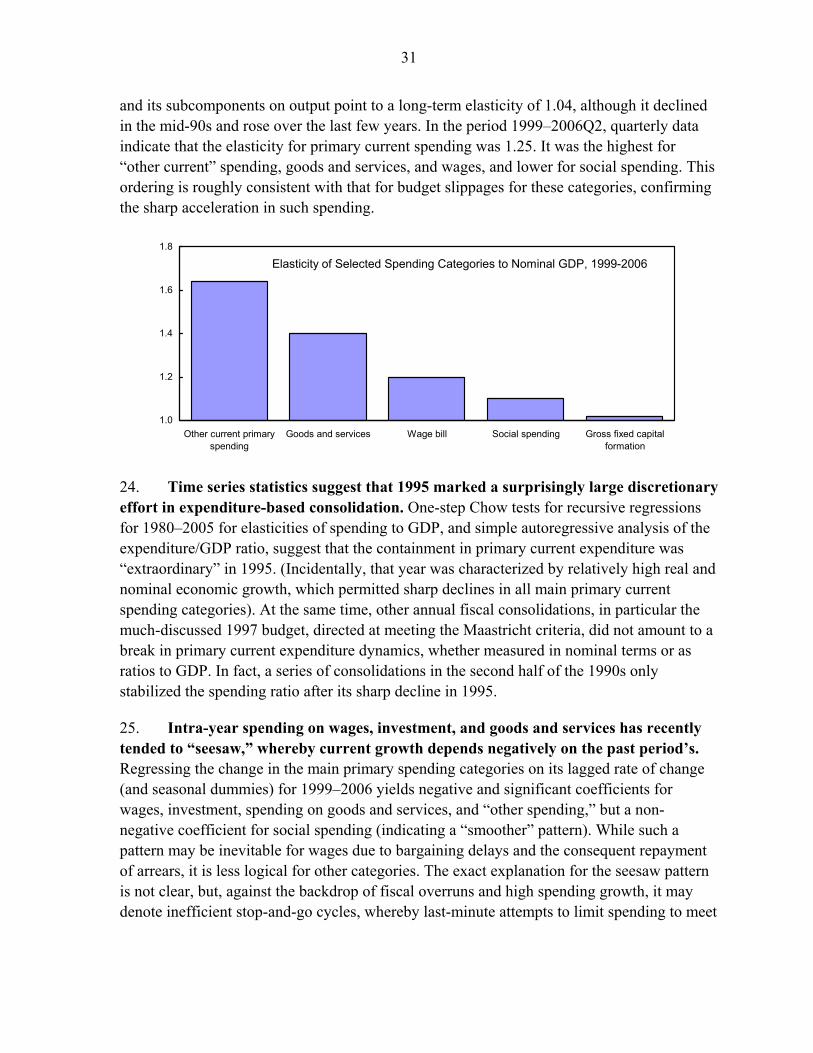
and its subcomponents on output point to a long-term elasticity of 1.04, although it declined in the mid-90s and rose over the last few years. In the period 1999–2006Q2, quarterly data indicate that the elasticity for primary current spending was 1.25. It was the highest for “other current” spending, goods and services, and wages, and lower for social spending. This ordering is roughly consistent with that for budget slippages for these categories, confirming the sharp acceleration in such spending.
Elasticity of Selected Spending Categories to Nominal GDP, 1999-2006
1.0
1.2
1.4
1.6
1.8
Other current primaryspending
Goods and services Wage bill Social spending Gross fixed capitalformation
24. Time series statistics suggest that 1995 marked a surprisingly large discretionary effort in expenditure-based consolidation. One-step Chow tests for recursive regressions for 1980–2005 for elasticities of spending to GDP, and simple autoregressive analysis of the expenditure/GDP ratio, suggest that the containment in primary current expenditure was “extraordinary” in 1995. (Incidentally, that year was characterized by relatively high real and nominal economic growth, which permitted sharp declines in all main primary current spending categories). At the same time, other annual fiscal consolidations, in particular the much-discussed 1997 budget, directed at meeting the Maastricht criteria, did not amount to a break in primary current expenditure dynamics, whether measured in nominal terms or as ratios to GDP. In fact, a series of consolidations in the second half of the 1990s only stabilized the spending ratio after its sharp decline in 1995.
25. Intra-year spending on wages, investment, and goods and services has recently tended to “seesaw,” whereby current growth depends negatively on the past period’s. Regressing the change in the main primary spending categories on its lagged rate of change (and seasonal dummies) for 1999–2006 yields negative and significant coefficients for wages, investment, spending on goods and services, and “other spending,” but a non-negative coefficient for social spending (indicating a “smoother” pattern). While such a pattern may be inevitable for wages due to bargaining delays and the consequent repayment of arrears, it is less logical for other categories. The exact explanation for the seesaw pattern is not clear, but, against the backdrop of fiscal overruns and high spending growth, it may denote inefficient stop-and-go cycles, whereby last-minute attempts to limit spending to meet

32
aggregate targets are followed by costly rebounds. There is some evidence that overruns on some public investment projects may have been partly affected by these factors.
D. Conclusions
26. Part of Italy’s recent higher public spending was due to underlying, “exogenous” factors. These stemmed from a spending rebound after the “austerity” of the 1990s and convergence of primary spending to the higher EU-wide level. Regressions also suggest that low growth and above-average inflation complicated the task of curbing current primary spending, while the medium-term decline in interest rates has cut the cost of capital, fostering public fixed capital formation. The results should however be interpreted with caution given the small number of observations and the low power of many empirical tests.
27. But the spending surge also reflected policy weaknesses and lack of fundamental reforms. Obviously, the rebound of spending and its observed convergence also reflected policy choices, though disentangling these formally would be difficult (the measured political economy factors do not prove significant, probably due to data limitations). In any case, Italy’s expenditure targets were substantially exceeded in nominal terms and growth rates, while overruns occurred in areas where fundamental reforms have yet to take hold. Against this background, the relative stabilization of Italy’s pension-based social spending (which has been reformed), points to the key role of fundamental reforms in stabilizing spending.
28. There is no scope for further aggregate expenditure increases in Italy. Pension spending and the wage bill are already higher than those of the euro-area, while health care spending has caught up. Future age-related spending pressures on the debt ratio may exceed official projections, especially if growth rates continue to surprise on the downside. Italy’s traditionally low unemployment benefits may also be subject to upward pressures, partly if there is further euro-area-wide convergence of spending. Capital spending will likely be high due to intra-Italy regional differences and substantial public infrastructure needs. Thus, given the medium-term objective of a small overall budget surplus and Italy’s already-high fiscal burden, there is no alternative to expenditure-based adjustment. Absent effective curbs on spending, adjustment will likely take the form of “speed bumps,” in the form of financial tensions and possibly crises.
29. Expenditure reforms are thus needed to generate resources for productive spending and fiscal consolidation. In particular, these should:
• Maximize performance of public spending in terms of micro-efficiency, as there is evidence that in Italy the outcome efficiency of spending could be improved, particularly in education (see Afonso and St. Aubyn (2005)) and public infrastructure (Fedelino (2006)).
33
• Ensure a rule-based approach to expenditure management, which should smooth spending patterns over time and avoid cost overruns, thus helping reduce longer-term spending pressures. In this regard, EC (2006) explicitly links more effective spending restraint to the presence of fiscal rules.
• Establish a track record of at least meeting expenditure targets in nominal terms, which would go a long way toward attaining the targeted deficit ratios. Beyond the spending reforms, reform of budget procedures and greater transparency in the projections would help.
• The strong effect of growth on the spending ratio suggests that episodes of cyclical strength be seized upon for adjustment, as expenditure cuts in high-growth environments seem to be the most effective and durable. But broad structural reforms to achieve durable improvement in growth (which include spillovers from expenditure rationalization) would be even more important for this link to operate fully.

34
REFERENCES
Afonso A. and M. St. Aubyn (2005) “Assessing Education and health Efficiency in OECD Countries Using Alternative Input Measures.” pp. 361-389 in “Public Expenditure,” Banca d’Italia, 2005.
Alesina, A., N. Roubini, and G. Cohen, 1999, Political Cycles and the Macroeconomy (Cambridge, Massachusetts: MIT Press).
Balassone F., Franco D. and S. Zotteri (2006) “EMU fiscal indicators: a misleading compass?” Empirica, 2006, vol. 33, issue 2, pages 63-87.
Barro R. (1990) “Government Spending in a Simple Model of Endogenous Growth,” Journal of Political Economy, 98, pp 102-25.
Bibbee A. and A. Golio (2002) “Public Spending in Italy: Policies to Enhance its Effectiveness,” OECD Economics Department Working paper, No 324, March.
EC (2006) “Public Finances in the EMU,” EUROPEAN ECONOMY. No. 3. 2006. Office for Official Publications of the EC. Luxembourg.
ECB (2006) “The Importance of Public Expenditure Reforms for Economic Growth and Stability,” European Central Bank monthly bulletin, March, pp 61-73.
EPC (2006) Report by the Economic Policy Committee and the European Commission on the impact of ageing populations on public spending (February), http://ec.europa.eu/economy_finance/epc/documents/2006/ageingreport_en.pdf.
Fedelino A. (2006) “Infrastructure Investment and PPPs,” IMF Selected Issues, 06/59, pp 86-98.
Jonung L. and M. Larch (2005) “Improving Fiscal Policy in the EU: the Case for Independent Forecasts,” Economic Policy, September, pp. 1-33.
Milesi-Ferretti, G. M., R. Perotti, and M. Rostagno, 2002, “Electoral Systems and Public Spending,” Quarterly Journal of Economics, Vol. 117, No. 4, pp. 607-57.
Skidmore M., Toya H., and D. Merriman (2004) "Convergence in Government Spending: Theory and Cross-Country Evidence" . Kyklos, Vol. 57, No. 4, pp. 587-620, November.
Turrini A. (2004) “Public Investment and the EU fiscal framework,” European Commission, Directorate General for Economic Affairs, Economic Papers, 202.
Valila T. and A. Mehrotra (2005) “Evolution and Determinants of Public Investment in Europe,” European Investment Bank, Economic and Financial Report 2005/01.

35
III. PUBLIC ENTERPRISES AND FISCAL RISKS IN ITALY16
Objectives. This chapter reviews recent developments in the public enterprise (PE) sector in Italy and examines the fiscal risks posed by two large public companies (the road company, ANAS, and the railway group, FS) based on the framework in IMF (2005). Results. The PE sector has been considerably reduced following the corporatization and large-scale privatizations in the 1990s, and public companies are subject to corporate law. However, ANAS and FS do not measure up well against the criteria for assessing their fiscal risks, and they have indeed been a drain on public resources. Policy implications. Reforms are needed to: (i) ensure timely, reliable, and transparent monitoring and reporting of PEs’ operations; (ii) improve PE governance; (iii) put “problematic” PEs (especially ANAS and FS) on a sound financial footing. These measures would help fiscal sustainability, reduce PEs’ reliance on government support, and improve Italy’s growth potential more generally.
A. Background
1. The Italian PE sector today is much diminished from its leviathan size in the early 1990s. Covering virtually all sectors of economic activity, the state was then present in “typical” industrial and service sectors, where its share was about 45 percent; 12 of the top 20 nonfinancial firms by net sales were state-owned (Goldstein, 2003). Unlike most Western countries, the Italian state also permeated the financial sector, with 90 percent of total investment lending being intermediated by public credit institutions, and 80 percent of total deposits being held in public banks (Megginson and Scannapieco, 2006, and Ministry of Economy and Finance, 2006). The state’s three main holding companies (IRI, EFIM, and ENI) were among the largest employers in the country, with some 500,000 workers.
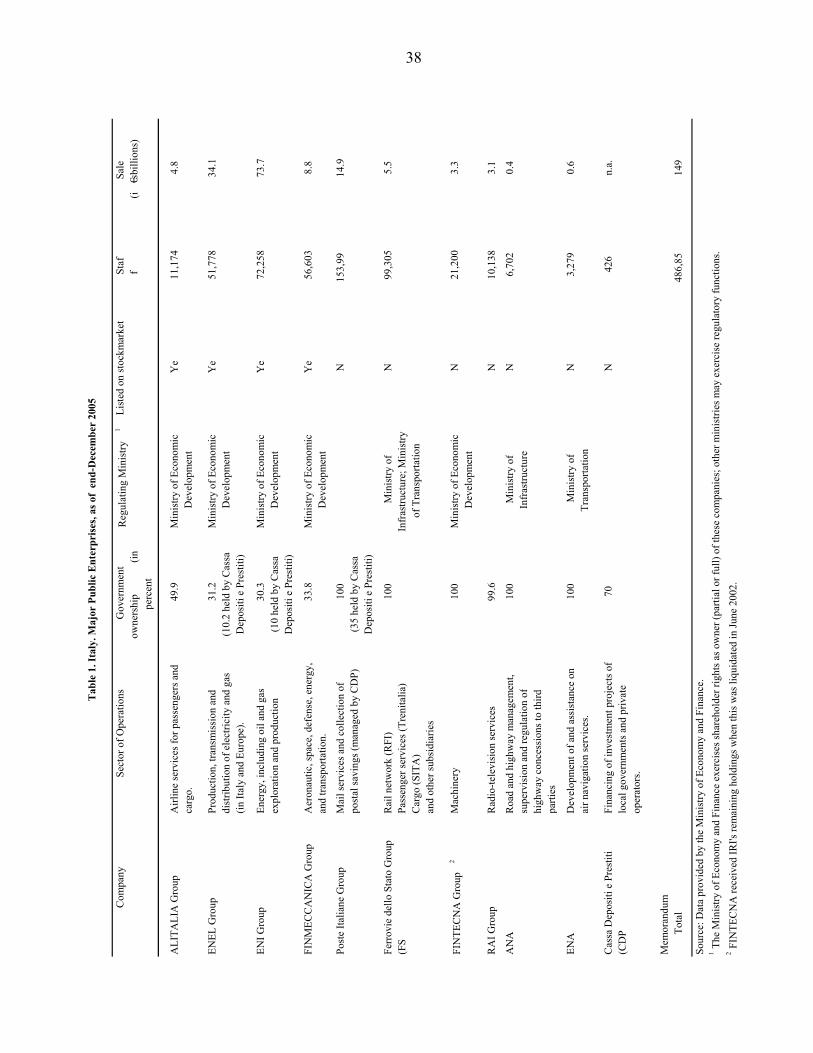
2. The state’s holdings have now shrunk to fewer than 30 companies, as a result of major privatizations (Box 1). Four companies are listed (Table 1) and are performing well, with the exception of the airline company, Alitalia. Their market value was estimated at €32 billion at end-October 2006 (just above 2 percent of GDP). The unlisted companies operate in various sectors, with the Ministry of Economy and Finance (MEF) acting as sole or
16 Prepared by Annalisa Fedelino (FAD), [email protected].

36
Box 1. Italy’s Privatization Process
The rationale: unsustainable finances. Throughout the 1980s, the Italian PEs had become progressively inefficient and mired with financial problems. Lack of competition had inhibited incentives to respond to market forces and adopt new technologies. Political interference had made the PE management structure complex and opaque, with their administration assigned to the Ministry of State Holdings. The pursuit of non-economic goals, including preserving jobs, sustaining investment, and rescuing ailing firms, along with government imposition of low pricing policies to contain inflation, had resulted in large inefficiencies, losses, and unsustainable debt. In this environment, following budget deficits averaging some 10 percent of GDP throughout most of the 1980s and with the public debt soaring to over 120 percent of GDP, continued government support to PEs was simply not feasible.
The way out: reforming the PE sector. The time was ripe for a large-scale rationalization of the PE sector (public banks had been corporatized as per the 1990 “Amato” Law). A major privatization wave started in the early 1990s, supported by a number of institutional changes:
• A 1992 framework document (Libro Verde sulle Partecipazioni dello Stato) identified four general goals for a privatization program: (i) improve corporate efficiency: (ii) increase the degree of market penetration and competition; (iii) promote financial market development: and (iv) increase government revenue and reduce public debt.
• All nonfinancial enterprises were corporatized and subject to private law (Law 359 of August 1992). The major holding groups IRI, ENEL, and ENI were transformed into joint-stock companies whose shares were transferred to the Treasury.
• The Ministry of State Holdings was abolished in 1993, and responsibility for the privatization program was vested in the (current) Ministry of Economy and Finance.
• A dedicated privatization commission (composed of the Treasury Director and four external experts) was established in July 1993, to advise on the privatization process.
• Law 474 of July 1994 identified public share offerings as the preferred divestiture mechanism; advised that independent regulatory authorities be established prior to the privatization of public utilities (whose framework was laid out in Law 281 of 1995); and allowed the government to protect public interests in selective cases through some ownership restrictions.
• A dedicated Debt Retirement Fund was created in 1993, to channel privatization proceeds for amortization and debt buy-backs on the secondary market.
The results: state divestment among the largest in OECD countries. The first operation took place in December 1993 (later than in other OECD countries), starting a vast privatization program which saw 75 major deals concluded by end-2005, for a total of US$125 billion. This process was only second to Japan’s privatizations in nominal terms, and among the largest as a share of GDP. These privatizations led to a complete disengagement of the state from the banking and insurance sectors, and a significant reduction of the state’s presence in energy and defense. Source: MEF (2006), Megginson and Scannapieco (2006), and Goldstein (2003).

37
majority shareholder. According to MEF (2006), its current portfolio includes holdings in: (i) strategic sectors (energy and defense); (ii) companies less amenable to privatization due to the nature of their business; (iii) companies that are not attractive to the market because of their “deep financial and economic crisis”—the road company, ANAS, and the railway group, Ferrovie dello Stato (FS), are explicitly singled out; and (iv) companies that could be privatized but are still subject to restructuring or whose regulatory framework needs further clarification.
3. Despite its significant downsizing in the last decade, Italy’s PE sector remains larger than in comparator European countries. According to OECD (2005), Italian PEs still account for a large share of the economy, are present in many economic sectors, and represent a large share of employment (Figure 1).17
B. The Current Institutional Setup
4. The major privatization drive of the 1990s helped shape the current institutional framework. The Ministry of Economy and Finance exercises shareholder’s rights, appoints the Board of Directors, and approves annual budgets. Sector ministries regulate the sectors of PE operations (Table 1), for example by determining pricing policies where applicable. On this basis, Italy follows a dual model of state ownership (OECD, 2005).18
5. Corporatized PEs are subject to the same requirements as private companies under corporate law. As PEs’ sole shareholder, the state is not directly responsible for their liabilities in case of default. A 2003 reform of corporate law limits a company’s insolvency to its assets. PEs can borrow autonomously, and usually do so without recurring to state guarantees; according to available information, their borrowing terms are broadly similar to those of private companies. When applicable, they transfer dividends to the government.19
17 While not covered in this paper, there is also a large number of local PEs. Goldstein (2003) mentions some 1,300 local utilities engaged in the provision of energy, water, transport, and sanitation services; their shareholders are mainly municipalities, which in turn purchase their services—an arrangement prone to inefficiencies and subject to conflicts of interest. Confindustria (2004) notes that while some of these companies’ shares have been divested, the retention of controlling by local governments stakes has prevented “real” privatization.
18 The OECD has categorized the state “ownership function” in three broad groups: (i) in the decentralized model, sector ministries are responsible for PEs operating in their sector; (ii) in the dual model, two ministries share the ownership responsibility, but one “common” ministry ensures overall policy coordination, typically the Ministry of Finance (for example, in New Zealand and, partly, in the U.K.); and (iii) in the centralized model, the ownership function is strongly concentrated in one ministry or agency (in France and Spain)
19 Dividends have averaged about € 3 billion over the last few years (0.2 percent of 2006 GDP).
38
Tab
le 1
. Ita
ly. M
ajor
Pub
lic E
nter
pris
es, a
s of
end-
Dec
embe
r 20
05
Com
pany
Se
ctor
of O
pera
tions
Gov
ernm
ent
owne
rshi
p
(in
pe
rcen
t
Reg
ulat
ing
Min
istry
1
List
ed o
n st
ockm
arke
tSt
aff
Sale
s
(i€
billi
ons)
ALI
TALI
A G
roup
A
irlin
e se
rvic
es fo
r pas
seng
ers a
nd
carg
o.
49.9
Min
istry
of E
cono
mic
D
evel
opm
ent
Ye
11,1
744.
8
ENEL
Gro
up
Prod
uctio
n, tr
ansm
issi
on a
nd
dist
ribut
ion
of e
lect
ricity
and
gas
(in
Ital
y an
d Eu
rope
).
31.2
(10.
2 he
ld b
y C
assa
D
epos
iti e
Pre
stiti
)
Min
istry
of E
cono
mic
D
evel
opm
ent
Ye
51,7
7834
.1
ENI G
roup
En
ergy
, inc
ludi
ng o
il an
d ga
s ex
plor
atio
n an
d pr
oduc
tion
30.3
(10
held
by
Cas
sa
Dep
ositi
e P
rest
iti)
Min
istry
of E
cono
mic
D
evel
opm
ent
Ye
72,2
5873
.7
FIN
MEC
CA
NIC
A G
roup
A
eron
autic
, spa
ce, d
efen
se, e
nerg
y,
and
trans
porta
tion.
33.8
Min
istry
of E
cono
mic
D
evel
opm
ent
Ye
56,6
038.
8
Post
e Ita
liane
Gro
up
Mai
l ser
vice
s and
col
lect
ion
of
post
al sa
ving
s (m
anag
ed b
y C
DP)
100
(35
held
by
Cas
sa
Dep
ositi
e P
rest
iti)
N15
3,99
14.9
Ferr
ovie
del
lo S
tato
Gro
up
(FS
Rai
l net
wor
k (R
FI)
Pass
enge
r ser
vice
s (Tr
enita
lia)
C
argo
(SIT
A)
and
othe
r sub
sidi
arie
s
100
Min
istry
of
Infr
astru
ctur
e; M
inis
try
of T
rans
porta
tion
N99
,305
5.5
FIN
TEC
NA
Gro
up 2
M
achi
nery
10
0M
inis
try o
f Eco
nom
ic
Dev
elop
men
tN
21,2
003.
3
RA
I Gro
up
Rad
io-te
levi
sion
serv
ices
99.6
N10
,138
3.1
AN
AR
oad
and
high
way
man
agem
ent,
supe
rvis
ion
and
regu
latio
n of
hi
ghw
ay c
once
ssio
ns to
third
pa
rties
100
Min
istry
of
Infr
astru
ctur
eN
6,70
20.
4
ENA
Dev
elop
men
t of a
nd a
ssis
tanc
e on
ai
r nav
igat
ion
serv
ices
.10
0M
inis
try o
f Tr
ansp
orta
tion
N3,
279
0.6
Cas
sa D
epos
iti e
Pre
stiti
(C
DP
Fina
ncin
g of
inve
stm
ent p
roje
cts o
f lo
cal g
over
nmen
ts a
nd p
rivat
e op
erat
ors.
70N
426
n.a.
Mem
oran
dum
T
otal
48
6,85
149
Sour
ce: D
ata
prov
ided
by
the
Min
istry
of E
cono
my
and
Fina
nce.
1 The
Min
istry
of E
cono
my
and
Fina
nce
exer
cise
s sha
reho
lder
righ
ts a
s ow
ner (
parti
al o
r ful
l) of
thes
e co
mpa
nies
; oth
er m
inis
tries
may
exe
rcis
e re
gula
tory
func
tions
.2 F
INTE
CN
A re
ceiv
ed IR
I's re
mai
ning
hol
ding
s whe
n th
is w
as li
quid
ated
in Ju
ne 2
002.

39
Figure 1. Italy: Comparative Selected Indicators on SOEs 1
Source: “Corporate Governance of State-Owned Enterprises: A Survey of OECD Countries.”1 These indicators are covered in the OECD International Regulation Database, based on information provided and vetted by national administrations of OECD member countries. However, partial coverage and incomplete information make comparisons subject to caveats. 2 Compared to size of the economy. OECD normalized the data so that the indicators have a scale of zero to six. 3 Indicates pervasiveness of state ownership across business sector, measured as the proportion of sectors in which the state has an equity stake in at least one firm.
Italian SOEs still account for a large, although declining, share of the economy...
0 0.5
1 1.5
2 2.5
3 3.5
4 4.5
5
U Spai German Ital Franc
1998 2003
Size of 2
… due to their presence in many economic sectors
0
1
2
3
4
5
6
U German Spai Franc Ital
19982003
Scope of 2
3
While the number of SOEs is lower than in comparator
0 20 40 60 80
100 120
Ital German Spai Franc U
Number of SOEs
…SOEs still represent a large share of employment
0
1
2
3
4
5
6
Spai U Ital Franc
SOE employees (in percent total employment)
SOEs assets are large in value terms...
0 50
100 150 200 250 300 350 400 450
Spai U Ital Franc
Asset value of (in 2003 PPP $ billion)
.. and as a share of GDP
0
5
10
15
20
25
30
Spai U Franc Ital
Asset value of (as a share of GDP)

40
6. There is no consolidated information on the PE sector as a whole. Italy’s presentation of budget data is consistent with ESA 95, which requires consolidation of all general government activity on an accrual basis. According to the Maastricht reporting rules, PEs operations are included in the general government’s fiscal accounts if the ratio of their own revenue to operating costs is below 50 percent. On this basis, among the largest PEs, ANAS’ operations are included in the fiscal accounts.
7. State transfers to PEs are fully included in budget documents and reflected in the government accounts. A few PEs receive the bulk of state transfers; some have also benefited from capital injections (Table 2).20
Table 2. Budget Transfers to Selected PEs, 2001-2005
2001 2002 2003 2004 2005
(In millions of euros)
ANAS (road services) ... ... 2,270 1,479 1,164Capital increases ... ... 1,820 1,029 714Payments for public services ... ... 450 450 450
Ferrovie dello Stato (railway services) 6,899 7,342 6,127 5,780 6,232Capital increases 3,615 4,078 3,934 2,665 3,006Payments for public services (RFI, network) 1,478 1,453 382 1,304 1,289Payments for public services (Trenitalia, passengers) 1,806 1,811 1,811 1,811 1,937
Poste Italiane (post) 1,259 766 709 698 663Capital increases 517 ... ... ... ...Payments for public services 742 766 709 698 663
(In percent of GDP)
Total 0.5 0.6 0.7 0.6 0.6Capital increases 0.3 0.3 0.4 0.3 0.3Payments for public services 0.2 0.3 0.3 0.3 0.3
Source: Data provided by the Ministry of Economy and Finance; and staff calculations.
C. Assessing Fiscal Risks
8. PEs may pose fiscal risks to the government. While the reforms of the past decade have significantly reduced the size and scope of the Italian PE sector and improved governance and transparency, two PEs face considerable financial difficulties: the road company, ANAS, and the railway group, Ferrovie dello Stato. This section looks more closely at these two companies, pointing out the fiscal risks they may pose based on the framework developed in IMF (2005) (Box 2).
20 Capital injections are classified as financial transactions below the line (not affecting the deficit) according to Maastricht-based criteria. In the case of capital increases of FS during 2001–03, Eurostat mandated their reclassification as part of capital transfers above the line in 2004, as they were interpreted as de facto transfers to cover this company’s losses.
41
Box 2. Criteria for Assessing Fiscal Risks of Public Enterprises
IMF (2005) identified five broad sets of criteria to gauge whether PEs may pose fiscal risks to the government. I. Managerial independence • Pricing policy: whether prices are in line with international benchmarks for traded goods
and services; cover costs (for nontraded goods); and in regulated sectors, whether the tariff setting regime is compatible with the long-term sustainability of the PE.
• Employment policy: whether this is independent of civil service laws, and the government intervenes in wage setting and hiring.
II. Relations with the government • Subsidies and transfers: whether the government provides direct or indirect subsidies
and/or explicit or implicit loan guarantees which go beyond those given to private enterprises; and whether PE make any special transfers to the government
• Quasi-fiscal activities: whether PEs perform uncompensated functions or absorb costs which are not directly related to their business objective and/or substitute for government spending.
• Regulatory and tax regime: whether PEs are subject to the same regulations and taxes as private firms.
III. Governance structure • Periodic outside audits: whether these are carried out by a reputable private accounting
firm applying international standards and are published.
• Publication of comprehensive annual reports: whether annual reports are published, and what type of information they include.
• Shareholders’ rights: whether minority shareholders’ rights are protected.
IV. Financial conditions and sustainability • Market access: whether PEs can borrow without a government loan guarantee.
• Less-than-full leveraging: whether PEs’ debt-to-asset ratio is comparable to industry averages.
• Profitability: whether PEs perform compared to relevant industry.
• Record of past investments: whether past investments had an appropriate average rate of return.
V. Other risk factors • Vulnerability: whether PEs have sizeable contingent liabilities relative to their operating
balance.
• Importance: whether PEs are large in some significant dimension (for example, debt service, employment, customer base).

42
The road company (ANAS)
9. ANAS is responsible for the operation and maintenance of Italy’s road network either directly or through concession agreements. In addition to some 20,000 km of roads, ANAS operates directly some 1,200 km of highways (all are operated as “no toll”); an additional 5,500 km are operated through concessions with private operators, over which ANAS “exercises control.”21 This practice, whereby ANAS has acted both as operator and regulator of highway concessions, has been criticized for its inherent conflict of interest. The 2007 budget law aims to rectify this, with provisions about the separation of these functions.
10. The recent transformation of ANAS into a joint stock company has so far not resulted in improved financial performance. This 2003 reform was intended to pave the way for commercialization, eventually also resulting in a reclassification of ANAS outside the general government accounts. However, the ratio of own-market-revenues to operating costs (estimated at below 10 percent in 2005) has remained well below Eurostat’s 50 percent threshold. In the absence of tolls, ANAS’ revenue base is limited to fees from services related to the road network (telecommunications, service stations, and the like).
11. ANAS’ financial position deteriorated in 2005. According to preliminary accounts, the company recorded operating losses of about €500 million, pointing to continued financial difficulties. Losses in the first half of 2006 are estimated at about €200 million.
12. To tackle ANAS’ financial problems, a new business plan was adopted in 2006 aiming to reach operating balance by 2008. This plan is being supported by the introduction of new accounting and monitoring systems.
Managerial independence 13. On pricing policy, ANAS does not enjoy managerial independence. No tolls are levied on ANAS roads. Instead, ANAS receives payments from the government for road maintenance services; set at cost recovery levels before ANAS’ transformation into a joint stock company, transfers have been based on market considerations since 2003. ANAS is also responsible for granting concessions for activities performed by private parties on or nearby the roadway (for road access, advertising billboard, cable road crossings, and similar). ANAS sets fees on these services, subject to the approval of the Ministry of Infrastructure.
21 There are currently 24 concessionaires, of which Autostrade SpA is by far the largest, operating 16 key highways (or km 3,500 out of a total of km 4,800). Tariffs are set by the government to guarantee the “amortization of the initial investment and maintenance costs.”
43
These prices do not reflect marginal nor cost-recovery considerations. Prices are indexed to the CPI, and still broadly follow a structure decided in the 1960s.
14. In principle, ANAS sets its employment policy. Its personnel policy is independent of civil service laws, and the government does not intervene in wage-setting and hiring. However, the current size of ANAS’ workforce, at some 6,000 (of which more than 1,000 in the Southern region of Calabria, which has a population of about 2 million and a limited road network) denotes that employment has been subject to social considerations in the past.
Relations with government 15. ANAS relies heavily on government support. Transfers are needed to meet its investment needs and to cover its operating losses. The Court of Auditors (2005) notes that in 2004 ANAS relied on state and EU transfers for about 90 percent of its financing needs.
16. Reliance on government transfers creates a reciprocal risk for ANAS. This was particularly so in the context of the 2006 budget, which originally foresaw sharp cuts to ANAS’ capital transfers to effect fiscal adjustment. By mid-2006, the company reached a critical stage where ongoing work could not be continued, and a supplementary budget allocation was needed to replenish ANAS’ coffers.
Financial conditions and sustainability 17. ANAS is far from being financially sustainable. Its debt to equity ratio in 2005 was 5.6; the EBITDA (earnings before interest, tax, depreciation, and amortization) was set at -€98 million in the original 2004 budget, but turned out to be -€196 million, mostly driven by overruns in personnel costs (by about €110 million). As revenue broadly materialized as budgeted, maintenance costs had to be curtailed by €20 million (Court of Auditors, 2005).
Transparency and governance 18. ANAS is subject to outside audits and prepares annual reports, but availability of timely information is poor. There is a long delay in the release of annual reports (which are not published on any government website). The 2005 Annual Report has not been finalized yet, as allegations about misuse of funds are still being addressed with the MEF.
The railway group (FS)
19. The FS group includes a large number of companies. The main ones include: the Rete Ferroviaria Italiana (RFI), operating the railway infrastructure; Trenitalia, which is responsible for managing passenger transport on long distance routes, metropolitan and regional traffic, and freight transport; and Treni Alta Velocitá (TAV), a special purpose company for the design and construction of the high-speed railway lines.

44
20. FS has been running losses. In 2004, the group recorded a loss of €125 million, from a small profit in 2003. This was mainly driven by the cuts in government transfers effected in July 2004. With RFI and TAV recording no profit, Trenitalia recorded net losses of € 325 million. Net losses reportedly continued to increase in 2005, to €465 million (0.03 percent of GDP), driven by rising labor costs due to new labor contracts (despite a net reduction of some 1,700 employees). On the revenue side, if tariffs had not been frozen since 2001 (see below), FS estimates that accounts would have broadly balanced; and if tariffs were set at European averages, the group would have closed the year with some €500 million profits.
21. TAV possibly poses the largest risk to the government.22 The 2007 budget is witness to that, when an "eleventh-hour" provision transferred TAV debt from FS to the government (with a deficit increase of about 0.9 percent of GDP).23 The rationale was to free future TAV cashflow receipts from debt servicing costs. But the future may hold even bigger surprises: TAV investment needs are significant—the cost of completing the Turin-Milan-Naples link is estimated at €32 billion, of which less than half has been secured to date. If “true” private financing cannot be reliably secured (and past experience would suggest caution), there is a risk that the government may eventually have to finance future (and costly) investments.
Managerial independence 22. On pricing policy, FS does not enjoy managerial independence. Track access charges are set by administrative decree of the Ministry for Transportation, reflecting only management operational costs (while maintenance costs are covered by government transfers). Passenger tariffs on “long-haul” trips are subject to a price cap set by a government committee; these have been frozen at their 2001 level (representing ⅓ and ½ of fares applied in the U.K, and France and Germany, respectively). Some tariffs increases are being planned for 2007, but these alone would not be sufficient to restore profitability.24 22 Created as a joint venture with private majority in 1991, TAV reverted to the state (as part of FS) in 1998, due to concerns about uncertain costs and future revenue. In 2003, a special purpose vehicle (ISPA) was created to finance TAV operations. ISPA issued some €13 billion in bonds, which were onlent to RFI to finance TAV. This imitative was short-lived, however, as in May 2005 Eurostat decided that debt contracted by ISPA and onlent to TAV represented government debt (ISPA was found not to be carrying any risk, due to a state guarantee on RFI debt service). ISPA therefore lost its main raison d’etre and was eventually unwound at end-2005, and TAV debt was assumed by the FS group.
23 The operation was recorded as a capital transfer to RFI above the line, which allowed RFI to extinguish its debt; there was no change in the stock of government of debt, as TAV bonds had been reclassified as government debt in May 2005, due to the Eurostat decision.
24 It is estimated that each percentage point increase in the tariff would generate some €10-15 million.

45
Tariffs on commuter trains and shorter distances are set by local authorities through “service contracts.” Freight tariffs are based on market prices.
23. On employment policy, FS partially enjoys managerial independence. Wage policy is subject to “collective labor contracts.” FS had a workforce of some 97,000 at end-2005 (Table 1).
Relations with government
24. FS relies on government support. As for ANAS, dependence on government transfers also makes the government a source of risk for FS. The Court of Auditors (2006) notes that “five years after the FS restructuring, there has been no significant improvement in the company’s management, whose financial results have been on a negative trend.”
Financial conditions and sustainability 25. If its revenue base is not strengthened, FS may be reclassified as part of the public administration. Regardless of the accounting treatment of FS operations, the company’s financial difficulties pose a clear and present fiscal risk to the government.
D. Conclusions and Policy Implications
26. ANAS and FS’s shaky finances pose fiscal risks to the government. Even if the government, as these companies’ sole shareholder, is by law not responsible for their liabilities in case of default, these companies may be considered “too big to fail.” They are also draining public finances, due to their operating losses.
27. Reliance on government support also poses a risk to these companies, as shown by the deep (and in the event, untenable) cuts in their transfers envisaged in the 2006 budget. Securing stable sources of own market revenue would alleviate these companies’ difficulties as well as mitigate possible risk to the government, as their shareholder.
28. At a minimum, fiscal risk posed by PEs should be monitored and reported:
• PEs operations should be systematically monitored by government. The 2003 ROSC report recommended preparing quarterly reports on developments in the finances of public sector entities outside the general government in which the state maintains a stake.
• Reports on all PE operations should be published and be easily accessible to the public. While audited annual reports exist, they cannot be easily located on government websites. A timely, detailed and transparent report on the performance of these enterprises would promote accountability and allow a public assessment of these companies’ prospects and associated fiscal risks.

46
29. Activities of a public nature should be carried out transparently and receive appropriate budgetary allocations. The TAV saga is a case in point: if projects of a public nature are not amenable to being undertaken by the private sector, their funding should be provided for in the budget. Cuts and “stop-and-go” allocations do not improve the financial viability of these projects, nor provide a sustainable relief to public finances.
30. Reforms are needed to improve PE governance and put them on a sound financial footing. Improvements in the governance of PEs would lead to a more transparent allocation of resources and a more effective supervision and management of enterprises; and would contribute to improving the competitive process in activities open to the private sector. Improving PEs’ financial performance would also remove a significant source of fiscal pressure on the government budget.
31. Reforming PEs is critical for the wider economy, not just for the sustainability of public finances. It is not simply a matter of improving transparency and mitigating/removing fiscal risks and their potential impact on the budget. Better managed and performing PEs will have a wider impact on the economy at large (Confindustria, 2004). Continued liberalization, promotion of competition, implementation of simple and transparent rules will allow economic agents to operate more efficiently—a long-term process that would also help foster Italy’s growth and competitiveness.

47
REFERENCES
Bortolotti B. and V. Milella, 2006, “Privatization in Western Europe: Stylized Facts, Outcomes and Open Issues,” Fondazione ENI Enrico Mattei, Nota di Lavoro 124.2006, http://www.feem.it/Feem/Pub/Publications/WPapers/default.htm
Confindustria, 2004, “Indagine Conoscitiva sul Processo di Privatizzazione in Italia”,
testimony at the Budget Commission of the Chamber of Deputies, May, Rome, http://www.confindustria.it/comunica/audpar.nsf/All/12AD2203039E8A35C1256EA50042A5B5?openDocument&MenuID=28774E98783D5002C1256EFB00356A6F
Court of Auditors, 2006, “La gestione finanziaria 2003-2004 delle Ferrovie dello Stato” in
Newsletter N. 25/2006 ” http://www.corteconti.it/Cittadini-/La-newslet/L-archivio2/Newsletter.doc
Court of Auditors, 2005, “Relazione della Corte dei Conti al Parlamento su ANAS SpA per
l’esercizio 2004” Atti Parlamentari, Camera dei Deputati, Documento XV, N. 371, Rome (December), http://www.corteconti.it/Ricerca-e-1/Gli-Atti-d/Controllo-/Documenti/Sezione-de/Anno-2005/Documenti/allegati-d70/anas.doc_cvt.htm
Goldstein A., 2003, “Privatization in Italy 1993-2002: Goals, Institutions, Outcomes, and
Outstanding Issues” CESIFO Working Paper No. 912, pp. 1-43 (Germany, April), available at http://www.cesifo.de/pls/guestci/download/CESifo%20Working%20Papers%202003/CESifo%20Working%20Papers%20April%202003/cesifo_wp912.pdf.
Ministry of Economy and Finance (MEF), 2006, “Documento di Programmazione
Economico-Finanziaria 2007-2011,” (Rome, July) http://www.mef.gov.it/web/docu_indici/DPEF/index.asp
International Monetary Fund, 2005, “Public Investment and Fiscal Policy—Lessons from the
Pilot Country Studies,” http://www.imf.org/external/np/pp/eng/2005/040105a.pdf International Monetary Fund, 2003, “Italy: Report on the Observance of Standards and
Codes—Fiscal Transparency Module” Country Report No. 02/231 http://www.imf.org/external/pubs/cat/longres.cfm?sk=16137.0
Megginson, W. and D. Scannapieco, 2006, “The Financial and Economic Lessons of Italy’s
Privatization Program” Journal of Applied Corporate Finance, Volume 18 Number 3, pp. 56-65.
Organization for Economic Cooperation and Development, 2005, “Corporate Governance of
State-Owned Enterprises: A Survey of OECD Countries” (Paris).

48
IV. FINANCIAL INTERMEDIATION AND GROWTH IN ITALY25
Objectives: To examine whether greater financial market development can spur growth by surveying theoretical and empirical evidence and analyzing the effect of external bond and equity financing on productivity and profitability of Italian firms.
Results: That Italy’s growth prospects would benefit if its financial system moves beyond its currently bank-dominated structure, developing alternative sources of financing.
Policy implications: promote bank competition; reduce listing costs; strengthen and streamline corporate governance, accounting, and disclosure requirements for all corporations, especially groups; further enhance minority shareholder protection; discipline takeovers and insider dealing; level the playing field for companies; reduce the overall administrative burden of doing business, enhance investor protection, including through underwriter regulations and more disclosure in prospectuses, and creditor protection, including through bankruptcy code. Development of the private pension pillar and further public divestment could also help.
A. Financial Development and Growth: Theory and Evidence
1. The association between financial development and growth is well-documented, although the macro evidence is more nuanced at higher per capita income levels. A vast literature suggesting positive correlations between finance and growth dates as far back as Schumpeter (1911). More recent waves of cross-country empirical studies, starting from King and Levine (1993), indicate that financial development helps boost long-term growth26. Moreover, within-country, industry and firm level evidence links financial development with higher productivity and growth (see Bernstein and Nadiri, 1993, Rajan and Zingales, 1998, Guiso et al, 2004a). However, Favara (2003) challenges the robustness of this result at higher income per capita levels. This may suggest that other factors, such as structure and sophistication of financial intermediation, may be at play in advanced countries.
2. Financial intermediaries may play a key role in boosting innovation and productivity. The theoretical literature clearly establishes the ability of the financial system
25 Prepared by Iryna Ivaschenko (EUR), [email protected]. The author is grateful to the Bank of Italy, in particular, Andrea Generale for assistance with obtaining the data, and seminar participants at the Bank of Italy for helpful comments.
26 For a recent review of literature see, for example, Levine (2004) and Levine (2005).
49
to allocate funds to highest return projects (i.e., Greenwood and Jovanovic, 1990; Bencivenga and Smith, 1991, and Saint-Paul, 1992), and select more promising innovators (King and Levine, 1993a, 1993b). However, there is little direct empirical evidence on this issue. Beck et al. (2000) find a positive association between financial development and total factor productivity (TFP) growth, while Wurgler (2000) and Alfranca and Galindo (2003) find that financial development and reforms have a positive effect on the allocation of investment funds. In addition, sectors most dependent on external (to the firm) finance are found to grow faster in countries with more advanced financial systems (OECD, 2006 and references therein), and such sectors tend to be the most knowledge-intensive. The degree of financial development also affects country’s competitiveness (Rajan and Zingales, 2003).
3. Recent studies suggest that financial structure is an important determinant of country’s flexibility and ability to seize growth opportunities.27 In particular, IMF (2006) finds that industrial countries with financial systems dominated by a relationship-based (as opposed to arm’s length-based) lending are less able to change its productive structure to take advantage of growth opportunities, including from globalization.28 The effect is particularly pronounced in countries traditionally specialized in industries with low productivity growth, such as Italy. At the same time, a more arm’s-length financial system allows domestic industries to adapt better to a changing global environment by encouraging investment in new areas and by new firms. In addition, a greater degree of arm’s-length specialization is found to mitigate the impediments to growth stemming from the “low-growth” initial industry specialization. Studies also show a connection between stock market growth (or number of IPOs) and real growth (see Franzosi et. al 2003.)
4. In particular, more arm’s-length financial systems seem more efficient in fostering innovation and hence growth. A specific aspect of the relationship between financial systems and growth relates to the ability of entrepreneurs to develop new ideas, often through setting up a new company. Given the high-risk nature of such start-ups, the market for high-risk capital, in particular, venture capital and other less formal sources of finance, plays a key role in the financing of innovation (OECD, 2006). Thus, arm’s-length
27 Although the literature finds no optimal growth-enhancing structure of financial intermediation, these results should be interpreted with caution (Demirguc-Kunt and Levine, 2001). Macro studies rely on a wide range of countries at different stages of development, which may obscure the finer structural points that become salient for developed economies. In addition, aggregate indicators of financial structure may not be sufficiently country-specific to accurately gauge national realities. 28 It is important to recognize that the distinction between more or less arm’s-length-based financial systems is slightly different from the more conventional distinction drawn in the literature between bank-based and market-based financial systems. The arm’s-length definition would take into account the degree of arm’s length content within the banking system, such as the degree of competition between banks and the availability of public information.

50
lending becomes especially important for knowledge-intensive industries that are critical for growth.29
5. In addition to direct lending channels, capital markets foster growth in other ways:
• Multiple layers of financing provide a safety valve (Greenspan, 2000) as better diversified financial systems are more capable of providing an adequate degree of intermediation even if one of the components fails. An example is when U.S. banks seized up in 1990 as a consequence of a collapse in the real estate prices, the capital markets were able to substitute for the loss of bank intermediation.
• The corporate bond market provides competition for the banking sector, forcing
innovation and new services, increasing efficiency, better risk-sharing, and, ultimately, lower prices for consumers (Goodfriend, 2005).
• Long-term, local currency corporate bonds can hedge future retirement, pension, life
insurance and entitlement commitments (given monetary stability), while generally short-term bank deposits provide a poor hedge against such needs (Goodfriend, 2005; Sundaresan, 2005).
Source: World Bank, Financial Structure Database (January 2006 update).1/ Total loans to private sector and securities market capitalization.
Figure 1. Size of the Financial Sector 1/ (In percent of GDP)
0
100
200
300
400
500
Gre
ece
Aust
ria
Nor
way
Italy
Finl
and
Ger
man
y
Irela
nd
Fran
ce
Japa
n
Portu
gal
Can
ada
Spai
n
Kore
a
Swed
en
Belg
ium
Aust
ralia UK
Net
herla
nds
Den
mar
k
US
Aver
age
0
100
200
300
400
500
1990 2004
29 For example, Benfratello et al (2006) show that although bank lending in Italy is associated with more investment in innovation, banks tend to favor one type of innovation, shying away from more risky, less collateralized types of innovation activities, typically performed by newer firms.
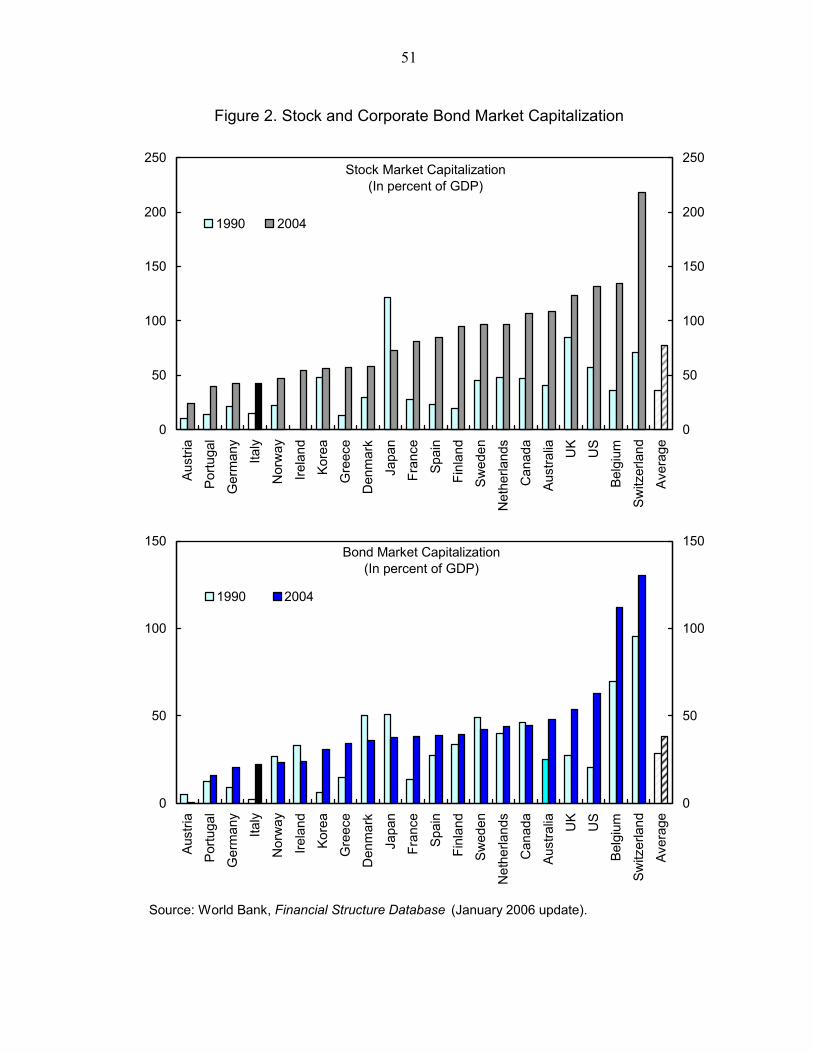
51
Figure 2. Stock and Corporate Bond Market Capitalization
Source: World Bank, Financial Structure Database (January 2006 update).
Stock Market Capitalization (In percent of GDP)
0
50
100
150
200
250
Aust
ria
Portu
gal
Ger
man
y
Italy
Nor
way
Irela
nd
Kore
a
Gre
ece
Den
mar
k
Japa
n
Fran
ce
Spai
n
Finl
and
Swed
en
Net
herla
nds
Can
ada
Aust
ralia UK
US
Belg
ium
Switz
erla
nd
Aver
age
0
50
100
150
200
250
1990 2004
Bond Market Capitalization (In percent of GDP)
0
50
100
150
Aust
ria
Portu
gal
Ger
man
y
Italy
Nor
way
Irela
nd
Kore
a
Gre
ece
Den
mar
k
Japa
n
Fran
ce
Spai
n
Finl
and
Swed
en
Net
herla
nds
Can
ada
Aust
ralia UK
US
Belg
ium
Switz
erla
nd
Aver
age
0
50
100
150
1990 2004

52
Figure 3. The Relative Importance of Loans and Securities(Average 2000–04)
Source: World Bank, Financial Structure Database (January 2006 update).
0% 20% 40% 60% 80% 100%
US
UK
Sweden
Spain
Portugal
Norway
Netherlands
Korea
Japan
Italy
Ireland
Greece
Germany
France
Finland
Denmark
Canada
Belgium
Austria
Australia
Bank loans Loans from non-banks FIs Bonds Shares
53
B. What about Italy?
6. In Italy, the share of external corporate funding—in particular, non-bank—remains low. Internal funding, which so many small firms still rely upon in Italy (Bianco, et. al. 1996), may be an optimal response of the Italian corporate system to inefficiencies in corporate governance, contract enforcement, legal procedures, but it may not be best for growth. Internal financing is usually more important for countries in the early stages of development (Sundaresan, 2005). At the later stages, when firms need more financing to grow, banks are usually the first to provide information-intensive external funding. As the economy develops, the need for external financing increases, especially in faster-growing sectors. At this point, firms with good reputations can lower their cost of capital and access lenders directly with corporate bond funding30. For lower-grade and newer firms, the high-yield bond market offers a less costly venue to raise funds with less collateral and covenant requirements31.
7. Against this background, Italy’s financial sector has expanded significantly, but capital markets remain relatively small (Figures 1-3). The banking sector remains a core source of funding, accounting for a lion’s share of total system’s financial assets. Stock market capitalization as a share of GDP almost tripled and corporate bond market doubled between 1990 and 2004 (from low bases), but both markets remain below OECD averages. Banks constitute a major source of external finance for the private sector, accounting for about half of all financial sources, above the average. At the same time, due to the rapid bond market expansion, this form of funding has gained importance over recent years, reaching almost 23 percent, above the OECD average.32 Securities markets benefited significantly from the introduction of the Euro (Nierop, 2005), which resulted in lower issuance costs due to the elimination of the currency risk and a widening of the investor base. The recent efforts by the Italian Stock Exchange to adopt best industry standards such as streamlining bond listing procedures and unifying trading platforms for stocks and bonds also helped (Borsa Italiana, 2005), with the first asset-backed securities being issued in 2004.
30 Firms with access to bond financing still rely on bank loans because of other services. 31 This happens usually in good times, when investor appetite for risk is high. However, in bad times, lower-rated firms tend to be priced out of the bond market (Chan-Lau and Ivaschenko, 2003) and need to rely on bank financing. 32 Italian households are also less reliant on capital markets for financing, having smaller holdings of quoted shares than their euro-area counterparts.
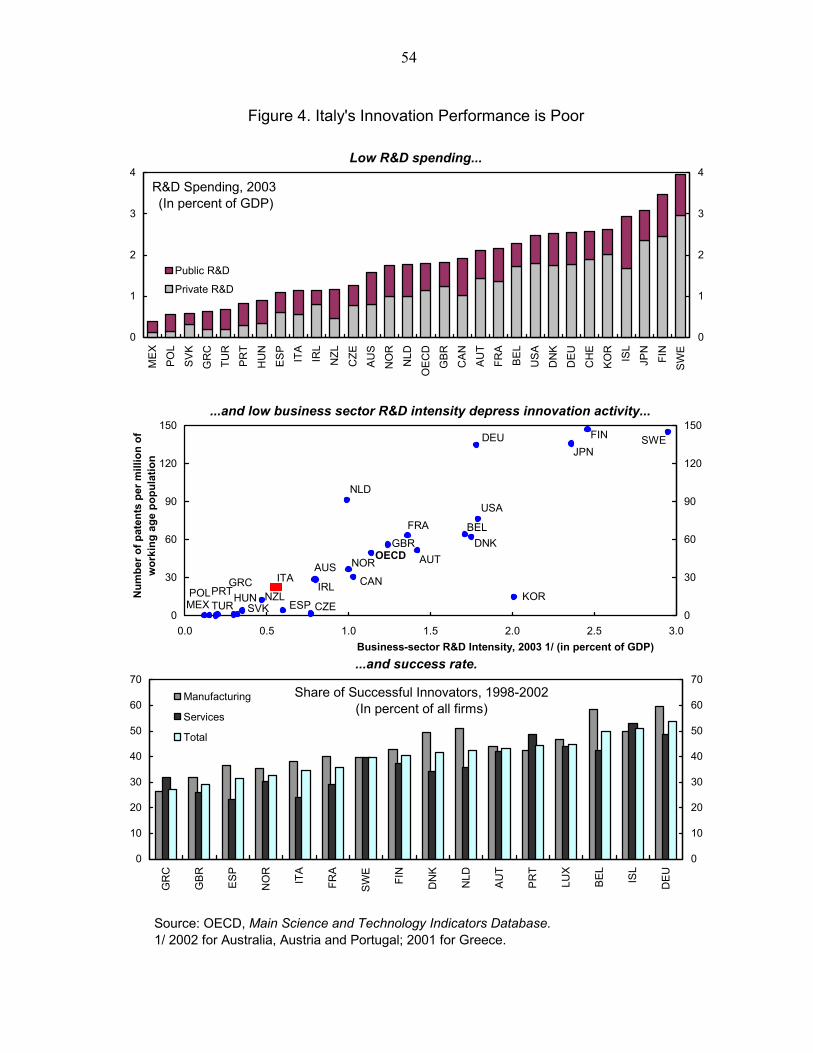
54
Figure 4. Italy's Innovation Performance is Poor
Source: OECD, Main Science and Technology Indicators Database.1/ 2002 for Australia, Austria and Portugal; 2001 for Greece.
R&D Spending, 2003 (In percent of GDP)
0
1
2
3
4
ME
X
PO
L
SV
K
GR
C
TUR
PR
T
HU
N
ES
P
ITA
IRL
NZL
CZE
AU
S
NO
R
NLD
OE
CD
GB
R
CA
N
AU
T
FRA
BE
L
US
A
DN
K
DE
U
CH
E
KO
R
ISL
JPN
FIN
SW
E
0
1
2
3
4Low R&D spending...
Public R&D
Private R&D
AUSAUT
BEL
CAN
CZE
DEU
DNK
ESP
FIN
FRA
GBR
GRCHUN
IRLITA
JPN
KORMEX
NLD
NOR
NZLPOLPRTSVK
SWE
TUR
USA
OECD
0
30
60
90
120
150
0.0 0.5 1.0 1.5 2.0 2.5 3.00
30
60
90
120
150...and low business sector R&D intensity depress innovation activity...
Num
ber o
f pat
ents
per
mill
ion
of
wor
king
age
pop
ulat
ion
Share of Successful Innovators, 1998-2002 (In percent of all firms)
0
10
20
30
40
50
60
70
GR
C
GB
R
ES
P
NO
R
ITA
FRA
SW
E
FIN
DN
K
NLD
AU
T
PR
T
LUX
BE
L
ISL
DE
U
0
10
20
30
40
50
60
70...and success rate.
Manufacturing
Services
Total
Business-sector R&D Intensity, 2003 1/ (in percent of GDP)

55
Figure 5. Italy's Venture Capital is Underdeveloped
Source: OECD, Venture capital database, 2003.
Sources of Venture Capital Funds, 1999-2002 (In percent)
0% 10% 20% 30% 40% 50% 60% 70% 80% 90% 100%
SVKNORBELCAN
ISLCHEPRTKORPOLJPN
GRCIRL
SWEFRAESPHUNNLDDEUDNKITA
USAGBRCZEAUTFINNZLAUS
Banks and insurance companies Pension funds Corporate investors Other
Venture Capital Investment Flows, 2000-03 (In percent of GDP)
0.0
0.1
0.2
0.3
0.4
0.5
0.6S
VK
JPN
HU
N
GR
C
PO
L
CZE
AU
T
CH
E
PR
T
ITA
NZL
DE
U
IRL
BE
L
FRA
DN
K
NO
R
ES
P
AU
S
OE
CD
FIN
NLD
GB
R
SW
E
KO
R
CA
N
US
A
ISL
0.0
0.1
0.2
0.3
0.4
0.5
0.6
Expansion
Early stage

56
8. Italy’s currently low innovative potential also indicates benefits from developing alternative sources of financing. The link between innovation and growth is well-established (OECD, 2003), and Italian scores are low (and declining) in a number of indicators in this area (Figure 4). While the Italian industrial structure, with specialization in mature, medium and low-tech products and with a prevalence of small firms, is an obstacle to the diffusion of new technologies, in particular information communications technology (ICT) (Fabiani et al, 2005), its bank-dominated financial structure may not be optimal for innovation as well. Italian banks tend to support only lower-risk, better collateralized innovative activities, which may not be those generating the most growth (Guiso et al., 2004 a, b). In addition, venture capital—an important source of innovation financing in other countries—is underdeveloped, and is catering more to larger, more established firms with high levels of bank debt rather than to smaller, typically more dynamic, start-ups (Figure 5)33
9. Econometric analysis of Italian micro data supports the idea that alternative sources of financing are associated with higher productivity and growth. 34 In particular, it shows that:
• Debt financing has a positive marginal effect on firm’s future investment, revenues, and productivity, while the effect of total leverage on productivity is negative (consistent with Schiantarelli and Sembenelli, 1997). The positive effect of bond leverage is consistent with the theory that financial pressure forces managers to make choices that improve firm’s performance (Jensen and Meckling, 1986).
• Bond leverage is especially important in high-growth and tech-heavy sectors and for smaller firms. This suggests that bond markets more eagerly provide financing for knowledge-heavy and fast-growing companies that usually have high financing needs, are riskier and have less tangible collateral than mature firms specializing in traditional products.
• Bond debt mitigates somewhat the (generally negative) effect of concentrated ownership.35 In particular, its effect on productivity is stronger for firms that belong to an industrial group. In addition, higher bond leverage increases firm’s chances to leave the group, although the causality here is not entirely clear due to the lack of data. It could be that bond financing allows firms to split off by providing alternative funding beyond
33 See Del Colle et al (2006). 34 Panel data estimation using Italian firm balance sheet data from Centrali dei Bilanci and base model by Campello (2006). See forthcoming Working Paper for details on methodology, estimation, and results. 35 In Italy, most firms belong to pyramidal groups, with high ownership concentration (see Bianco et. al, 1994, 1996).

57
the group’s internal financing, or that firms that are ready to restructure and leave the group are more likely to tap the bond market.
• Diversification of bank lenders has positive effects on firm’s future growth. Firms that borrow from multiple banks have higher productivity and growth rates. This result is consistent with the previous result about the positive effect of bond debt. In this situation, relationship lending approaches arm’s length lending, especially as the number of banks increases (see Ueda, 2004, and Bris and Welch, 2005)
• For listed firms, equity and debt financing are strongly correlated with higher productivity and growth. This finding is consistent with survey evidence (Paleari et al, 2005) and suggests that Italian firms list to gain access to new funding—which eases financial constraints and hence enhances performance36—rather than for balance sheet rebalancing purposes. Moreover, listed firms are more likely to operate in high growth sectors, with high capital requirements and leverage.
These results support the hypothesis that deepening corporate and stock markets and strengthening competition in the banking sector could boost Italy’s growth performance by making it more competitive, support industry structure changes, and help diversify away from traditional, low-growth sectors.
C. Policy Implications
10. Accordingly, policies that create the conditions for market-driven development of alternative financing venues should be pursued. These, according to country studies and business surveys, could include the following measures:
Removing impediments to stock market development37, in particular, reducing costs of listing—estimated in 2002 at 3.5 to 7 percent of total capital raised, compared to about 0.5 percent cost of listing on NASDAQ38. In this regard, considerable progress has been made by Borsa Italiana, including by differentiating listing and disclosure requirements by firm’s size (Box 1). Additional measures include further enhancing investor protection, including through underwriter regulations and more evaluation disclosure in prospectuses; improving transparency of takeovers and disciplining insider dealing.
36 See Fazzari, Hubbard, and Petersen (1987) and many follow-ups for an empirical investigation of investment and financing constraints. 37 Klapper, Laeven and Rajan (2004) show that regulation aimed at a better development of financial markets has a beneficial effect on entry of new firms, especially in industries with high R&D intensity or industries with greater capital needs. 38 See Beretti et al. (2002), www.nasdaq.com.

58
Temporary tax breaks for firms going public are also shown to spur stock market development without a negative impact on the budget due to higher taxation base (Guidici and Paleari, 2003).
Box 1. Segmentation of Listed Companies on Borsa Italiana
Borsa Italiana allows companies to list three different segments, according to their size and ambitions for raising capital. Listing requirements, and hence costs of listing vary across segments:
Mercato Expandi, for small firms, with less than €100 million in revenues. Created in December 2003, Mercato Expandi has offered small-sized companies the opportunity of listing, using a €1million market capital minimum for entry level. This segment is characterized by less costly listing requirements, with regards to disclosure, initial float, and third party requirements.
Standard, for medium-sized companies, with revenues between €100 million and €1 billion. This segment also includes so called STARS segment—a market for small and medium enterprises, which voluntary subject themselves to more stringent listing requirements, applied to all large companies (see below).
Blue Chip, for large companies, with more than €1 billion in turnover. Theses companies are subject to all standard transparency, disclosure, governance, and liquidity requirements, in line with international standards.
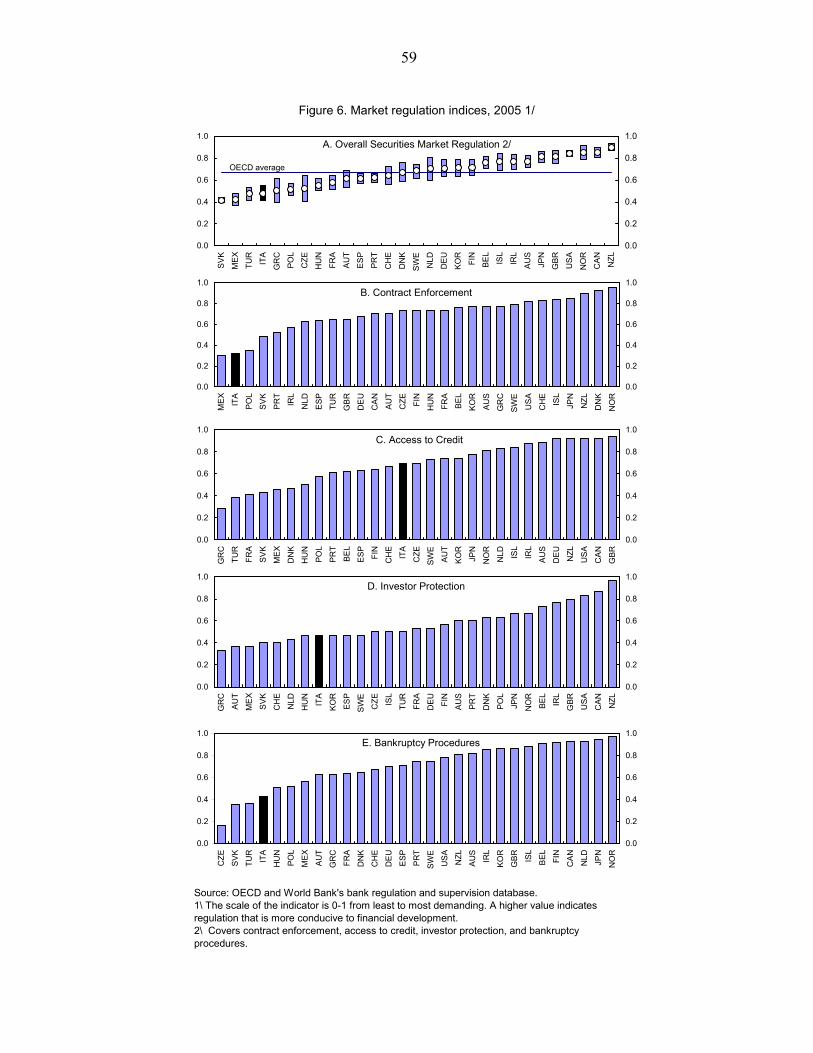
59
Figure 6. Market regulation indices, 2005 1/
Source: OECD and World Bank's bank regulation and supervision database.1\ The scale of the indicator is 0-1 from least to most demanding. A higher value indicates regulation that is more conducive to financial development.2\ Covers contract enforcement, access to credit, investor protection, and bankruptcy procedures.
A. Overall Securities Market Regulation 2/
0.0
0.2
0.4
0.6
0.8
1.0
SV
K
ME
X
TUR
ITA
GR
C
PO
L
CZE
HU
N
FRA
AU
T
ES
P
PR
T
CH
E
DN
K
SW
E
NLD
DE
U
KO
R
FIN
BE
L
ISL
IRL
AU
S
JPN
GB
R
US
A
NO
R
CA
N
NZL
0.0
0.2
0.4
0.6
0.8
1.0
OECD average
B. Contract Enforcement
0.0
0.2
0.4
0.6
0.8
1.0
ME
X
ITA
PO
L
SV
K
PR
T
IRL
NLD
ES
P
TUR
GB
R
DE
U
CA
N
AU
T
CZE FI
N
HU
N
FRA
BE
L
KO
R
AU
S
GR
C
SW
E
US
A
CH
E
ISL
JPN
NZL
DN
K
NO
R
0.0
0.2
0.4
0.6
0.8
1.0
C. Access to Credit
0.0
0.2
0.4
0.6
0.8
1.0
GR
C
TUR
FRA
SV
K
ME
X
DN
K
HU
N
PO
L
PR
T
BE
L
ES
P
FIN
CH
E
ITA
CZE
SW
E
AU
T
KO
R
JPN
NO
R
NLD IS
L
IRL
AU
S
DE
U
NZL
US
A
CA
N
GB
R
0.0
0.2
0.4
0.6
0.8
1.0
D. Investor Protection
0.0
0.2
0.4
0.6
0.8
1.0
GR
C
AU
T
ME
X
SV
K
CH
E
NLD
HU
N
ITA
KO
R
ES
P
SW
E
CZE IS
L
TUR
FRA
DE
U
FIN
AU
S
PR
T
DN
K
PO
L
JPN
NO
R
BE
L
IRL
GB
R
US
A
CA
N
NZL
0.0
0.2
0.4
0.6
0.8
1.0
E. Bankruptcy Procedures
0.0
0.2
0.4
0.6
0.8
1.0
CZE
SV
K
TUR
ITA
HU
N
PO
L
ME
X
AU
T
GR
C
FRA
DN
K
CH
E
DE
U
ES
P
PR
T
SW
E
US
A
NZL
AU
S
IRL
KO
R
GB
R
ISL
BE
L
FIN
CA
N
NLD JPN
NO
R
0.0
0.2
0.4
0.6
0.8
1.0

60
• Boosting the development of the corporate bond market. Italy’s legal, regulatory and institutional framework is, overall, adequate.39 However, progress on a number of fronts would be beneficial: simplifying legal frameworks; boosting investor protection and regulatory frameworks that promote self-regulation (i.e. stock exchanges); promoting efficient and transparent primary and secondary markets;40 broadening the investor base, including through the promotion of private pension funds; encouraging market mechanisms for credit risk transfer; and increasing pre-trade and post-trade transparency.41 In this respect, the recent initiatives taken the Italian stock exchange, Borsa Italiana, to transfer bond trading to the same platform used for equities, provision of information, and differentiating listing requirements with respect to firm’s size are all designed to boost listing activity and are in accordance with international practices.
• Enhancing the effectiveness of corporate governance, accounting, and disclosure requirements, especially for groups. In some areas, Italy has one of the most advanced regulations, including requirements on financial reporting and disclosure, rotation of the external auditors, and the composition of company boards.42 In addition, the 2005 Savings Law, drafted party as a response to the Parmalat and Cirio corporate governance scandals, significantly enhanced investor protection.43 Nevertheless, there is scope to improve the effectiveness of existing regulations, especially since the prevalence of pyramidal groups, high concentration of ownership, and low foreign penetration in the Italian corporate landscape is found to lessen the protection potential built into the legal and regulatory frameworks. 44 This corporate structure has developed largely in response to Italy’s many legal, fiscal, disclosure, and investor protection loopholes, and is exploited for the purposes of limiting liability of a controlling entity; avoiding disclosure; and, by fragmenting capital, for evading taxes and obtaining financial incentives
39 See Italy—IMF Country Report No. 06/112, March 2006.
40 Examples include the initiative by the U.S. Securities and Exchange Commission with Trade Reporting and Compliance Engine. 41 Examples include GOVPX, the 24-hour source of real time U.S. treasury market prices and data. Pre-trade transparency relates to information about prices and volume opportunities in the markets, such as bid and offer prices and quantities and effective consolidation mechanisms of this information across various dealers. Post-trade transparency relates to the price and volume of all individual transaction that have already taken place. 42 See Italy—IMF Country Report No. 05/44, February 2005.
43 In particular, the Law included new rules on minority shareholder rights and corporate governance rules of listed companies, and on marketing and issuance of corporate bonds and procedures aimed at reducing potential conflict of interests within the financial industry. It also boosted powers of the securities regulator, Consob. See Italy: Selected Issues—IMF Country Report No 05/41, for details. 44 See Bianco et. al (1994, 1996) and Italy: Selected Issues—IMF Country Report No 05/41.

61
pertaining to small companies. They also put the interests of minority shareholders at risk.45
• Improving the business environment is paramount to spurring growth and competition. Italy fares poorly on a number of indicators in this area (Figure 6). Particular measures include: level the playing field for companies, in particular in terms of ownership opportunities; reduce the overall administrative burden of doing business; and boost creditor protection, including through the bankruptcy code. Class action legislation currently considered is also a welcome step.
• Further boosting efficiency of the banking system, including by increasing contestability. There has been appreciable progress on this front in the last year, boosted by an encouraging attitude on the part of the Bank of Italy. In fact, more mergers took place last year than in previous five.
11. Moreover, it is important to act on a broad range of issues, exploiting spillovers between measures and markets. Examples include (but are not limited to): positive effects on the stock market development from strengthening the governance and accounting rules for groups (Dalle Vedove et al, 2005); a higher likelihood of firms to go public if they have venture capitalists, private equity investors or banks among their shareholders (Franzosi and Pellizzoni, 2003); and the boost to banking competition stemming from the corporate bond market development. Developing the private pension pillar and further public divestment could also be helpful, in particular by boosting investor the base for equities and corporate bonds.
45 Stulz (2005) also finds that countries with worse corporate governance are characterized with smaller fraction of widely-held firms.
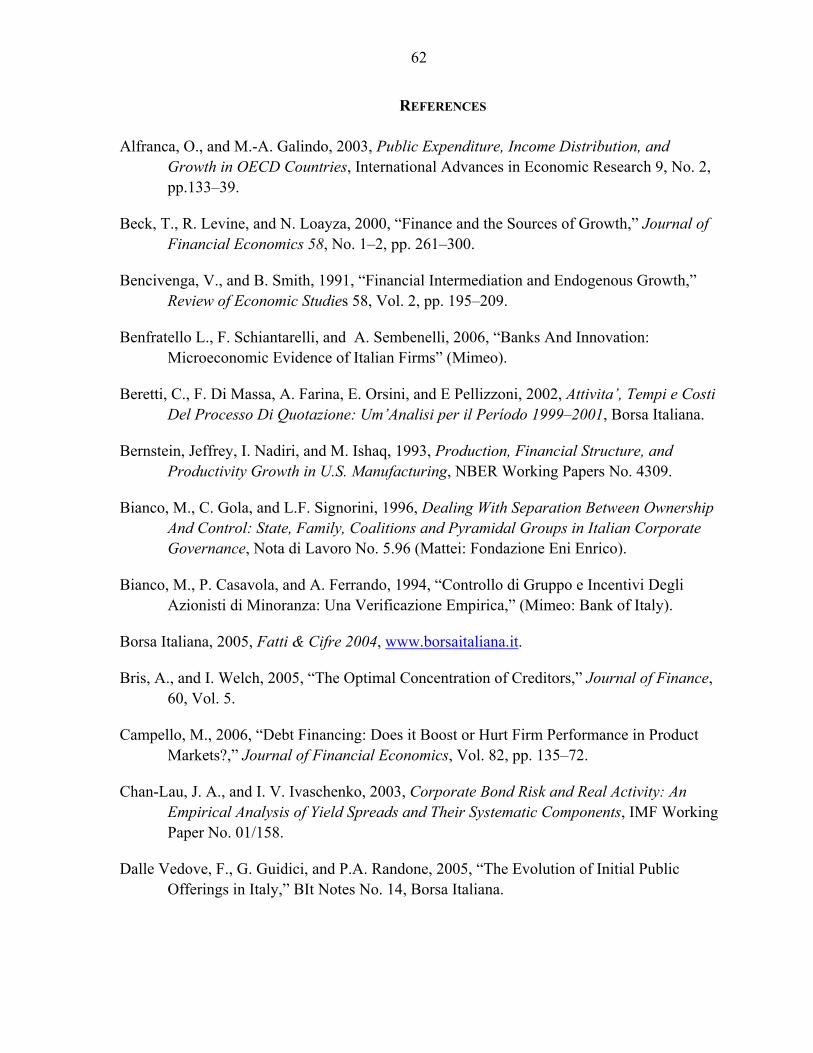
62
REFERENCES Alfranca, O., and M.-A. Galindo, 2003, Public Expenditure, Income Distribution, and
Growth in OECD Countries, International Advances in Economic Research 9, No. 2, pp.133–39.
Beck, T., R. Levine, and N. Loayza, 2000, “Finance and the Sources of Growth,” Journal of Financial Economics 58, No. 1–2, pp. 261–300.
Bencivenga, V., and B. Smith, 1991, “Financial Intermediation and Endogenous Growth,” Review of Economic Studies 58, Vol. 2, pp. 195–209.
Benfratello L., F. Schiantarelli, and A. Sembenelli, 2006, “Banks And Innovation: Microeconomic Evidence of Italian Firms” (Mimeo).
Beretti, C., F. Di Massa, A. Farina, E. Orsini, and E Pellizzoni, 2002, Attivita’, Tempi e Costi Del Processo Di Quotazione: Um’Analisi per il Período 1999–2001, Borsa Italiana.
Bernstein, Jeffrey, I. Nadiri, and M. Ishaq, 1993, Production, Financial Structure, and Productivity Growth in U.S. Manufacturing, NBER Working Papers No. 4309.
Bianco, M., C. Gola, and L.F. Signorini, 1996, Dealing With Separation Between Ownership And Control: State, Family, Coalitions and Pyramidal Groups in Italian Corporate Governance, Nota di Lavoro No. 5.96 (Mattei: Fondazione Eni Enrico).
Bianco, M., P. Casavola, and A. Ferrando, 1994, “Controllo di Gruppo e Incentivi Degli Azionisti di Minoranza: Una Verificazione Empirica,” (Mimeo: Bank of Italy).
Borsa Italiana, 2005, Fatti & Cifre 2004, www.borsaitaliana.it.
Bris, A., and I. Welch, 2005, “The Optimal Concentration of Creditors,” Journal of Finance, 60, Vol. 5.
Campello, M., 2006, “Debt Financing: Does it Boost or Hurt Firm Performance in Product Markets?,” Journal of Financial Economics, Vol. 82, pp. 135–72.
Chan-Lau, J. A., and I. V. Ivaschenko, 2003, Corporate Bond Risk and Real Activity: An Empirical Analysis of Yield Spreads and Their Systematic Components, IMF Working Paper No. 01/158.
Dalle Vedove, F., G. Guidici, and P.A. Randone, 2005, “The Evolution of Initial Public Offerings in Italy,” BIt Notes No. 14, Borsa Italiana.

63
Del Colle, D.M, P. Russo, and A. Generale, 2006, “The Causes and Consequences of Venture Capital Financing. Ad Analysis Based on a Sample of Italian Firms,” Temi di discussione del Servizio Studi, No. 584, (Bank of Italy).
Demirguc-Kunt, A., and R. Levine, 2001, “Bank-Based and Market-Based Financial Systems: Cross-Country Comparisons,” Financial structure and economic growth: A cross-country comparison of banks, markets, and development; eds. Demirguc-Kunt, A., and R. Levine, pp. 81–140; (Cambridge and London: MIT Press).
Favarra, G., 2003, An Empirical Reassessment of the Relationship Between Finance and Growth, IMF Working Paper No. 03/123 (Washington: International Monetary Fund).
Fabiani, S., F. Schivardi, and S. Trento, 2005, “ICT Adoption in Italian Manufacturing; Firm-Level Evidence,” Industrial and Corporate Change, 14, No. 2, pp. 225–49.
Fazzari, S., G. Hubbard, and B. Petersen, 1987, Financing Constrains and Corporate Investment, NBER Working Paper No. 2387.
Franzosi, A., and E. Pelizzoni, 2003, “La Quotazione in Borsa: Attitude e Comportamenti Dele Imprese Italiane,” BIt Notes, No. 7 (Borsa Italiana).
Goodfriend, M., 2005, Why A Corporate Bond Market: Growth and Direct Finance, BIS Paper No. 26, (Hong Kong: Bank of International Settlements).
Greenspan , A., 2000, “Global Challenges: Remarks at the Financial Crisis Conference,” (New York: Council on Foreign Relations).
Greenwood, J., and B. Jovanovic, 1990, “Financial Development, Growth, and The Distribution of Income,” Journal of Political Economy, 98, pp. 1076–107.
Guidici, G., and S. Paleari, 2003, “Should Firms Going Public Enjoy Tax Benefits: An Analysis of The Italian Experience In The 1990s,” European Financial Management.
Guiso, L., P. Sapienza, and L. Zingales, 2004, “Does Local Financial Development Matter?,” Quarterly Journal of Economics, 119, Vol. 3, pp. 929–69.
_______, 2004, “The Cost of Banking Regulation, Proceedings, Federal Reserve Bank of Chicago,” pp. 125–64.
IMF, 2006, The World Economic Outlook, September (Washington: International Monetary Fund).
Ivaschenko, I. V., “Financial Intermediation and Growth in Italy: The More the Better?,” IMF Working Paper (forthcoming).

64
Jensen, M., and W. Meckling, 1986, “Theory Of The Firm: Managerial Behavior, Agency Costs, and Ownership Structure,” Organizational Economics, Jossey-Bass Management Series, eds. Barney, J., W. Ouchi, and G. William, pp. 214–75.
King, R., and R. Levine, 1993, “Finance and growth: Schumpeter Might Be Right,” Quarterly Journal of Economic, CVIII, pp. 717–38.
———, 1993, “Finance, Entrepreneurship And Growth: Theory and Evidence,” Journal of Monetary Economics, 32, pp. 513–42.
Klapper, L., L. Laeven, and R. Rajan, 2004, Business Environment and Firm Entry: Evidence from International Data, CERP Working Paper No. 4366.
Levine, R., N. Loayza, and T. Beck, 2000, “Financial Intermediation and Growth: Causality and Causes,” Journal of Monetary Economics, 46 (1), pp. 31–77.
———, T. Beck, and V. Maksimovic, 2000, Financial Structure and Economic Development: Firm, Industry, And Country Evidence, World Bank Policy Research Working Paper No. 2423.
———, 2004, Finance and Growth: Theory and Evidence, NBER Working Paper No. 10766.
———, 2005, “Industry Growth and Capital Allocation: Does Having a Market- or Bank-Based System Matter?,” Governance: An International Perspective, Vol. 2; pp. 538–71.
Nierop, E., 2005, Developing Corporate Bond Markets: A European Legal Perspective, BIS Paper No. 26 (Hong Kong: Bank of International Settlements).
OECD, 2003, “The Sources of Economic Growth in OECD Countries” (Paris: OECD).
OECD, 2006, “Economic Policy Reforms: Going for Growth,” (Paris: OECD).
Paleari, S., E. Pellizzoni, and S. Vismara, 2005, “A Comparative Study of Initial Public Offerings in Italy and in the United Kingdom,” BIt Notes No. 15 (Borsa Italiana).
Rajan, R, and L. Zingales, 2003, “The Great Reversals: The Politics of Financial Development in the Twentieth Century,” Journal of Financial Economics, No. 69, Vol. 1, pp. 5–50.
Saint-Paul, G., 1992, Technological Choice, Financial Markets, and Economic Development, European Economic Review, 36, Vol. 4, pp. 763–81.
65
Schiantarelli, F., and A. Sembenelli, 1997, The Maturity Structure of Debt: Determinants and Effects on Firm’s Performance, Evidence From the United Kingdom and Italy, World Bank Working Paper No. 1699.
Schumpeter, J.A., 1911, “Theorie Der Wirtschaftlichen Entwicklung,” Becker M., and T. Knudsen, 2002, Schumpeter 1911: Farsighted Visions on Economic Development, American Journal of Economics and Sociology, Vol. 61 (2), pp. 387-437
Stulz, R., 2005, The Limits of Financial Globalization, Journal of Finance, No. 60, pp. 1595–638.
Sundaresan, S., 2005, “Developing Multiple Layers of Financial Intermediation: The Complementary Roles of Corporate Bond Markets and Banks,” BIS Papers No 26 (Hong Kong: Bank of International Settlements).
Ueda, M., 2004, “Banks Versus Venture Capital: Project Evaluation, Screening, and Expropriation,” Journal of Finance, 59, Vol. 2.
Wurgler, J., 2000, “Financial Markets and the Allocation of Capital,” Journal of Financial Economics, 58, No. 1–2, pp. 187–214.