itp forest products: reducing voc press emissions from ... · reducing voc press emissions from...
TRANSCRIPT

FINAL PROJECT REPORT
REDUCING VOC PRESS EMISSIONS FROM ORIENTED STRAND BOARD (OSB) MANUFACTURING
(DE-FC07-97IDI3546)
Principle Investigator Dr. Gary D. McGinnis
Former Address The Institute of Wood Research
Michigan Technological University Current Address
Illinois State University 310 Hovey Hall
Campus Box 4040 Normal, Illinois 61790-4040
309-438-3006 309-438-7912 (fax) [email protected]
December 31, 2001
1

I-BACKGROUND INFORMATION
A-Project Objective: The objective is to develop a manufacturing process for oriented strand board (OSB), which will reduce VOC’s emitted from the press vents, without major changes of other properties. The research is a laboratory and bench-scale investigation of a system to concentrate and destroy volatile organic compounds (VOCs), including hazardous air pollutants, formed from the drying of wood and the manufacture of wood board products (e.g., particle board and oriented strandboard). The approach involved developing chemical systems to destroy VOCs in the air stream before they are released to the environment. The research program lasted three years with Michigan Technological University being the primary recipient of the financial assistance. The ultimate objective of this research was to develop a pilot-scale demonstration of the technology with sufficient data to provide for the design of an industrial system. No commercialization activities were included in this project. The following tasks, milestones and schedule for the project is given below:
Milestones and Schedule
1 - Determine the effect of operating parameters on Anticipated Duration: August VOC/HAP formation in the presence of chemical 1998 through September 1999 additives.
2 - Evaluation of the chemical/physical alterations Anticipated Duration; Augustof specific VOCs/HAPs that have been effected 1999 through May 2000 by the chemical additive process. 3 - Development and operation of a pilot-scale Anticipated Duration: Octoberchemical additive treatment system for on-site 1999 through May 2000 evaluation of the effects of chemical additives in treating VOC/HAP emissions generated in the production of OSB.
II-CONTRIBUTORS
Gary D. McGinnis, Ph.D. Associate Vice President, Illinois State University, Normal, IL 61790
Laura S. Williams Graduate Student, Institute of Wood Research, Michigan Technological University, Houghton, MI 49931
Amy E. Monte, Research Assistant, Institute of Wood Research, Michigan Technological University, Houghton, MI 49931
2

Jagdish Rughani Research Assistant, Institute of Wood Research, Michigan Technological University, Houghton, MI 49931
Brett A. Niemi Assistant Research Scientist, Institute of Wood Research, Michigan Technological University, Houghton, MI 49931
Thomas M. Flicker Graduate Research Assistant, Department of Chemistry, Michigan Technological University, 1400 Townsend Dr., Houghton, MI 49931
III-RESULTS
The main part of this report comes from several papers presented at national conferences and published as proceedings (See section V). These results are based on the work of investigators who have been funded by the State of Michigan and or partially or completely funded by the Department of Energy. This report describes the results from the laboratory phase of the study. Most of the information for this report comes from the papers listed in the back of this report; some of the results and conclusions were modified and expanded in this report because of new information that was obtained after the papers were completed. This pilot plant phase of this project was not completed because the principal investigators moved from Michigan Technological University to another university. Michigan Technological University would not allow the equipment or funds to be transferred.
A-ABSTRACT Current regulations require industry to meet air emission standards with regard to particulates, volatile organic compounds (VOCs), hazardous air pollutants (HAPs) and other gases. One of many industries that will be affected by the new regulations is the wood composites industry. This industry generates VOCs, HAPs, and particulates mainly during the drying and pressing of wood. Current air treatment technologies for the industry are expensive to install and operate. As regulations become more stringent, treatment technologies will need to become more efficient and cost effective. The overall objective of this study is to evaluate the use of process conditions and chemical additives to reduce VOC/HAPs in air emitted from presses and dryers during the production of oriented strand board (OSB). The initial results indicated that the most promising results could be obtained by using chemical additives to treat the VOCs in the air stream, after they were formed or released from the wood. Addition of chemical additives directly in the wood was not as effective in reducing the level of VOCs and had a detrimental effect on the final product quality. The major VOC/HAPs produced from heating southern pine flakes include methanol, acetone, acetic acid, hexanal, a-pinene, b-pinene, 3-carene, and limonene. The chemical additives initially used for this study were a series of acids, bases, oxidizing agents and nucleophiles. The chemical additives that were found to be most effective included aluminum sulfate, ferric chloride anhydrous, hydroxylamine hydrochloride, iron, maleic anhydride, sodium hydroxide and urea. These additives were added to a solid inert support media. The contaminated air stream was then passed through the treated solid support and analyzed to determine specific and total VOC/HAP removal. The results from this study indicated that treatment additives could substantially reduce the pollutants. All of the additives were effective in reducing one or more of the major contaminants
3
produced from heating the wood. Of the seven additives tested, ferric chloride exhibited the greatest reduction for methanol, acetone, acetic acid, hexanal, and limonene. Hydroxylamine hydrochloride exhibited the greatest reduction for a-pinene, b-pinene, and 3-carene. Elemental iron was also an effective treatment for VOC/HAPs.
B. IntroductionCurrent regulations require industry to meet air emission standards with regards to particulate matter (PM), volatile organic compounds (VOCs) and hazardous air pollutants (HAPs). Most experts believe that future regulations will require more extensive removal of these contaminants from industrial air streams. The Clean Air Act and federal programs such as: the 1990 amendments to the Clean Air Act, Prevention of Significant Air Quality Deterioration, New Source Performance Standards, New Source Review, 1994 amendment on particulates, along with future regulations on greenhouse gases require more extensive removal of particulates, volatile organic compounds (VOCs), and other gases, from industrial air waste streams One industry that will be affected by the new regulations is the wood composites industry. Currently a typical plant can emit from 160 to 960 tons/year of VOCs and 40 to 200 tons/year PM from the dryers and 8 to 60 tons/year VOCs and 15 to 45 tons/year PM from the presses 1. Several operations in wood composite production, such as drying and pressing of wood particles, generate VOCs, HAPs and PM, which enter the plant air effluent. Many studies have been conducted to determine the components of wood processing plant effluent air streams. Studies of oriented strandboard (OSB) plant air streams have shown that they are composed of, but not limited to: tars, resins, fatty acids, acetic acid, acetone, formaldehyde, hexanal, methanol and phenol 2,3,4,5, which are emitted from the wood or added resins. Ingram et al. 6 found in pilot scale studies, that 0.02 to 3.0 pounds of organic compounds per ton of southern pine were produced during kiln drying process; the three major components released from the wood were a-pinene, b-pinene and limonene. The air stream contains VOCs, HAPs and PM as defined by the EPA in The Plain English Guide to the Clean Air Act 7. For the purpose of this study, the term ‘VOC/HAP’ is used to include VOCs, HAPs and PM produced from the heating of wood flakes in the laboratory apparatus as described in the Methods and Materials section. The actual composition of air emissions varies depending on the species of wood and the specific processing conditions: moisture content, particle size, temperature, pressure, storage time of the raw material, and types of resins and additives such as waxes and primers. Extractives, biological reactions, and thermal and chemical decomposition are sources of VOC/HAPs in wood. From these processes, many different types of VOC/HAPs are produced from wood. A compilation of the VOC/HAPs found in kiln drying of 6 and the pressing of southern pine flakes using phenol-formaldehyde as the resin 8 for oriented strandboard is listed in Table 1. Studies of press emissions identified 60 compounds, while Table 1 includes the top 24 compounds from that study 8 along with compounds identified in the kiln drying study 6. Banerjee et al. 9 conducted a moisture loss study of the release of VOCs from wood during the drying process. They found that VOCs were principally produced after most of the water was removed from the wood; this is due to the water’s evaporative cooling of the wood chip. This “lag” between water removal from the chips and VOCs release offers potential for VOC reduction during drying 9. They also suggest that only a portion of the potential VOCs available for release are lost during drying. A study 10 of the effects of particle size, temperature and flow rate on VOC emissions (from softwood flakes) was conducted. It was found that emissions increased with decreasing particle size, which means that removal of fines reduces emissions. This emission decrease is due to the fines drying out quickly and experiencing higher temperatures 10. The authors also found an
4

increase in VOCs at 160�C 10. This was believed to be due to a-pinene having a boiling point of 156�C. Therefore, they concluded that keeping temperatures below 160�C should lead to lower VOC emissions. It was also found that increasing flow rate increases VOC emissions 10. This was attributed to surface drying. Su et al. 11 ran a study investigating particle size, temperature and moisture content using hardwood and found similar results as Banerjee et al. 9,10. There are many treatment technologies available for the control of VOC/HAPs; including thermal oxidation, biofiltration, and carbon adsorption 12,13. These technologies can be used independently or in combination. In many instances, initial treatment technologies are also necessary to remove particulates and condensibles, which reduce the efficiency of the VOC/HAP treatment systems by interfering with flow, coating surfaces and causing valves to stick 12. These technologies include electrostatic precipitators, fabric filters, cyclone collectors and rotary bed protectors. Investment and operating costs of these technologies are high and dependent on many variables, such as, waste stream flow rates, pollutant concentrations, maintenance and monitoring requirements, and energy costs. There has also been strong emphasis by regulatory agencies on pollution prevention of waste, as opposed to end-of-pipe pollution control. The Pollution Prevention Act of 1990 requires that, whenever possible, pollution should be prevented or reduced at the source before other methods, such as recycling and treatment are conducted. Although these technologies do meet current regulation requirements, the potential for more stringent emission limits and increased cost in the future are a major concern for many wood product-based companies. Also of concern is the production of NOx from high temperature incineration processes. Therefore, more efficient and economical methods are needed that do not produce high levels of NOx. It is the objective of this project to identify chemical compounds that could potentially minimize/reduce VOC emissions from wood composite plants and increase the efficiency of the primary treatment technologies in use. This objective was directed toward the development of chemical treatment systems, which would reduce VOCs in air emitted from presses and dryers during the oriented strand board (OSB) manufacturing process.
C. Methods and MaterialsPreliminary Studies. The experimental design for the first stage of this study is shown in Figure 1. All gas lines inside the oven were ¼” Teflon tubing connected with Swageloc fittings. The sample and treatment chambers and the end caps were constructed of 6”x 2” galvanized steel pipe with threaded ends. The chambers and ends were lined with Teflon sheeting to reduce reactions with the metal surface of the chamber. Solid treatments were dissolved in water or methanol and poured over beads and allowed to dry. Volatile additives were injected directly into the system immediately after the VOC solution and allowed to equilibrate with the model VOC vapors. The line from the valve to the GC was 1/8” stainless steel tubing. The oven was heated to 120oC, and 10ml of the sample VOC solution (furfural, alpha-pinene, beta-pinene, 3carene and limonene) was injected into the sample chamber and allowed to equilibrate with the aid of the re-circulation pump for 5 minutes. Samples were then taken as described in (10). An additive chamber was filled with clean glass beads and installed in the system. At least four samples were averaged and the mean used for a control. The additive chamber was then filled with chemically treated beads and minimums of four samples were again taken with the model air stream. These results were compared to that of the control, and trends were observed. After each group of tests, the chambers were removed, and cleaned. Analysis was conducted with a HP 6890 GC. The GC was equipped with a Flame ionization detector (FID); gas sampling valve and a DB-5 capillary column (0.32 mm id x 30m, 0.25 mm film). The column temperature was programmed to start at 40oC for 2 min and was ramped at 7oC/min to 125oC.
5

Reactor Setup. The apparatus set-up for this procedure is diagramed in Figure 2. Three ovens and a GC (Gas Chromatograph) were connected in series. Oven #1 contained the wood flake chamber, oven #2 contained the treatment and retention chambers, and oven #3 contained the recirculation pump. All gas lines were ¼ inch stainless tubing connected with Swageloc� fittings, except the connections to the recirculation pump, which were Teflon� . Each oven was set to a different temperature. Oven #1 was kept at a temperature of 120�C. This enabled the VOC/HAPs to be released from the wood but was not high enough to burn the wood. The source of VOC/HAPs for this study was Southern Pine OSB wood flakes. The wood flakes were sieved to remove particulate smaller than 1/16 of an inch per the findings of Banerjee et al. 9. The wood flakes were dried to a moisture content less than 2%. Although some VOC/HAPs are lost during drying, there are still VOC/HAPs present in the wood, which will be lost during pressing. Having a constant moisture content helped keep a constant VOC/HAP. Banerjee et al. 9
findings support the drying of the southern pine chips to 2% moisture content for this study. The wood flakes were contained in a pressure tight stainless steel chamber with two shelves. Each shelf held approximately 50 g of wood flakes. The wood was heated for 2-3 hours before the VOC/HAPs were sampled. Breathing Grade Compressed Air was used to push the VOC/HAPs from the chamber into Oven #2 and #3. Oven #2 was heated to 120�C or 140�C depending on the chemical treatment being used. This was done to keep the chemical additive in a solid state. The treatment chamber contained either glass beads as a control or a chemical additive as a treatment. The chemical additives used for this experiment are listed in Table 3 along with the amount, oven temperature and media used. For chemical additives with lower boiling points glass beads were coated and packed in the chamber. Two empty chambers were also installed in Oven #2 to provide space for a larger VOC/HAP sample. The sample and treatment chambers and the end caps were constructed of 6-inch long x 2inch diameter galvanized steel pipe with threaded ends. The chambers and ends were lined with Teflon� sheeting to reduce reactions with the metal surface of the chamber. Oven #3 was heated to 70�C and contained the re-circulating pump. The pump (PFD1, Norton ASTI, Nanterre, France) was a pneumatically operated Teflon� pump. Compressed nitrogen (30 psi) was used to run the pump. The pump circulated the VOC/HAP sample though a treatment chamber at a rate of ~10 L/min for 1 to 3 minutes depending on the additive being used. All of the additives were circulated for 1 minute except urea, which was circulated for 2 minutes and sodium hydroxide, which was circulated for 3 minutes. Finally, the treated sample was pushed out of the sampling chambers to the GC using Breathing Grade Compressed Air at a rate of ~200 ml/min. Analysis for reactor2. Analysis was conducted with an HP 6890 GC. The GC was equipped with an FID (Flame Ionization Detector), gas sampling valve, and a DB-5 capillary column (0.32-mm id x 30 m, 0.25-mm film) Cross-linked 5% PH ME Siloxane (Hewlett Packard part no. 19091J413). The column temperature was programmed to start at 40�C for 1 min and was ramped at 10�C/min to 210�C ending with a 3-minute hold. The run took 21 minutes; samples were taken approximately every half-hour. The treatment chamber was alternated between control and additive chambers every two samples. At least four samples were taken with both chambers; results were averaged and the means used to determine VOC/HAP reduction. The samples analyzed by the GC-FID were to identify quantitative changes in the VOC/HAPs level due to treatment. Initial peak identification was accomplished by pumping vapors from different compounds into the GC-FID. These samples were then analyzed using the same column and method as that used for the wood VOC/HAP samples. The peak identification was confirmed using a different column and the same compound vapors and wood VOC/HAP samples. The second column was a DB-1 capillary column (0.25-mm id x 30 m, 1-mm film, J&W Scientific catalog no. 1221033).
6

Solid Phase Micro extraction (SPME) fibers (Supelco, Belle Fonte, PA, USA) were also used for identification of the major components of the VOC/HAPs. The same generation system for the VOC/HAPs (Figure 2) was used but the sample collection was accomplished using SPME fibers. Studies have determined the best SPME for a selection of analyte analysis14. The study found that Carboxen/ Polydimethylsiloxane (PDMS) and Divinylbenzene (DVB)/Carboxen fibers were best for analytes expected in the study. Due to availability, the two SPME fiber assemblies used for the study included: (1) a Polydimethylsiloxane (PDMS) fiber assembly, with a 30-mm stationary phase; and (2) a Carboxen/Polydimethylsiloxane/Divinylbenzene (CAR/PDMS/DVB) fiber assembly, with an 85-mm solid phase. The SPME was exposed to the VOC/HAPs from the system. A control (wood in chamber, glass beads as treatment) sample was run. Following the period of adsorption, each of the fibers was immediately analyzed on a HP5890 Series II GC equipped with a mass selective detector (Hewlett Packard) (GC-MS). The GC used a DB5-MS (0.25-mm id x 30 m, 0.5-mm film) diphenyl-dimethyl polysiloxane phase capillary column (J&W Scientific) with the scan generator set to scan m/z range of 35-400 AMU. Qualitative assessments were made with Hewlett Packard Chemstations software and NIFT/EPA/NIH75 mass spectral database, with a 0.70 value used as the lower limit for a qualitative compound matching. The PDMS fibers were analyzed with an injector set to 260�C and a detector temperature of 310�C. The initial oven temperature was 40�C and was ramped immediately at 10�C per minute too 300�C and held at 300�C. The run took 35 minutes. Analyses of the CAR/PDMS/DVB fibers employed all of the following parameters listed above, with the exception of the injector temperature of 280�C.
D. Results & Discussion
The initial study was conducted using a model air stream containing the following five compounds: furfural, alpha pinene, beta pinene, 3-carene and limonene. These compounds were selected because they are all present in high concentrations in air emissions from composite manufacturing, and would be more difficult to treat with chemical reagents. Furfural is formed by a thermal reaction of xylan and pentoses in wood. The mono-terpenes (alpha pinene, beta pinene, 3-carene and limonene) are extractives found in high concentrations in southern pine, or formed in the wood during processing. A list of some of the volatile compounds identified in the air emissions from OSB manufacturing is given in Table 1. These chemicals have a variety of functional groups attached to the molecule (acids, alcohols, aldehydes, and ketones). The exceptional is the mono-terpenes which does not contain any polar functional groups. This lack of a functional group makes it generally more stable to thermal , chemical and most biological processes. The results from the reaction of the model gas stream and the selected chemical additives using the reactor shown in Figure 1 is given in Table 2. Overall the acids had less effect on furfural than sodium hydroxide, urea and hydrogen peroxide, in contrast, the mono-terpenes were found to be susceptible to destruction by the acidic treatment compounds. The next step in this study was to use a larger system and replace the model air stream compounds with actual vapors coming off heated southern pine flakes and aspen which are used in OSB manufacturing. Although the acidic compounds had the largest effect on the mono-terpenes in the model system it is important to determine if the same results occur with the complicated mixture formed from heating wood. The second phase studies were done with the reactor shown in Figure 2. The additives, amount, oven temperatures and media used to support the chemicals are given in Table 3.
7

GC-FID Analysis. The initial identification of the compounds was based on retention time using GC-FID analysis (Table 4). Reproducibility of the VOC/HAP samples from the same wood source was determined. This was accomplished using the apparatus described in Figure 2 and a single day’s data. A full day of samples from the same wood source was run. The data for these samples can be found graphically in Figure 3. The longevity of the wood source, as a source of VOC/HAPs, was also determined from this study. Figure 3 was run to demonstrate that the wood used in the system would provide consistent, continuous VOC/HAPs for the duration of a daily experiment. It can be seen that the first two samples do not fit with the rest of the data. Other runs also exhibited changes during the first two samples. It was concluded that these first two samples were not at equilibrium. Therefore, for sampling purposes and data analysis, the first two samples were not used. For the rest of the data, there is no general trend of rise or fall in the peaks of the VOC/HAPs. Based on this preliminary data it was concluded that the system could be used for this study. Seven additives were tested for their ability to reduce VOC/HAPs from a wood products air stream. Wood was run in the apparatus described in Figure 2 along with a control and additive treatment. From these experiments it was found that there are 6 to 8 major compounds. The 8 compounds were identified (Table 4) as methanol, acetone, acetic acid, hexanal, a-pinene, b-pinene, 3-carene, and limonene. Each additive and control was run four times; averages were calculated and the percent reduction of VOC/HAPs due to the treatment was determined. This data is compiled in Table 5. The additives with the greatest percent reduction are ferric chloride, aluminum sulfate and hydroxylamine hydrochloride.
Percent reduction gives an idea of the relative amount a compound’s concentration was reduced but does not indicate which additive had the greatest effect on the VOC/HAP concentration. Since concentration changes from wood sample to wood sample (day to day), it is important to compare not only percent reduction, but also reduction of area count. This data can be found in Table 6. From this data it can be seen the ferric chloride and hydroxylamine hydrochloride have the greatest VOC/HAP concentration reduction. Of the seven additives tested, ferric chloride exhibited the greatest area reduction for the methanol, acetone, acetic acid, hexanal, and limonene. Hydroxylamine hydrochloride exhibited the greatest area reduction for the a-pinene, b-pinene, and 3-carene. Iron was also an effective treatment for VOC/HAPs. The three additives identified as being the best at VOC/HAP reduction are ferric chloride, hydroxylamine hydrochloride and iron. An actual chromatograph and average data for ferric chloride can be seen in Figures 4 and 5. These figures show that ferric chloride is effective at reducing all of the target compounds. The additive hydroxylamine hydrochloride, seen in Figures 6 and 7, appears to be best at reducing a-pinene and b-pinene. It also appears to increase the limonene peak. This could be due to the reduction/conversion of a-pinene and b-pinene and will be part of the continued investigation of this study. Iron is also an effective treatment for VOC/HAPs (Figures 8and 9). Other additives are effective at reducing one specific compound, for example aluminum sulfate’s reduction of a-pinene (Table 6) GC-MS Identification of the VOC/HAPs SPME fibers were used to determine the compounds that make up the VOC/HAP air stream. The compounds identified from the VOC/HAP air stream and control treatment chamber are found in Table 7. The two SPME fibers used were PDMS and CAR/PDMS/DVB. Table 7 also lists fifteen compounds identified in this study that were also identified in other studies 6,8. These compounds are: 2-n-amylfuran, benzaldehyde, borneol, bornyl acetate, D-carvone, 6,6-dimethyl-bicyclo[3.1.1]heptan-3-ol, 2-ethylhexanol, fenchyl alcohol, hexanoic acid, limonene, octanol, a-pinene, b-pinene, a-terpineol and verbenone.
8
Future studies with SPME fibers will include compound identification after additive treatment. This will help identify what processes are contributing to the VOC/HAP reduction.
E. ConclusionThis study has identified additives that reduce the VOC/HAPs from a laboratory air stream. The data indicates that the additives are chemically destroying the VOC/HAPs. Therefore, future studies will investigate the mechanisms of VOC/HAP reduction and the possible production of other contaminants. From this study it was found that treatment additives placed in the VOC/HAP contaminated air stream can reduce the concentration of pollutants. The major components of Southern Pine VOC/HAPs produced in the laboratory setting and identified using the GC/FID were methanol, acetone, acetic acid, hexanal, a-pinene, b-pinene, 3-carene, and limonene. Of the seven additives tested, ferric chloride exhibited the greatest area reduction for the methanol, acetone, acetic acid, hexanal, and limonene. Hydroxylamine hydrochloride exhibited the greatest area reduction for the a-pinene, b-pinene, and 3-carene. Iron was also an effective treatment for VOC/HAPs. SPME fibers in combination with GC-MS were used to identify VOC/HAP compounds produced in the laboratory setting. The compounds common to this and other studies include: 2-n-amylfuran, benzaldehyde, borneol, bornyl acetate, D-carvone, 6,6-dimethyl-bicyclo[3.1.1]heptan-3-ol, 2-ethylhexanol, fenchyl alcohol, hexanoic acid, limonene, octanol, a-pinene, b-pinene, a-terpineol and verbenone. .
IV-Acknowledgments This project was funded by the U.S. Department of Energy (DOE) project DE-FC07-96ID13440 and in part by U.S. DOE project DE-FC07-97ID13546. Also a thank you to Agenda 2020 and DOE (E-21582) for financial support on this work.
V. PAPERS PRESENTED AND PUBLISHED
1999. Development of a Novel On-Line GC Sampling Method for Industrial Effluents. Air and Waste Management Association Annual Meeting. St. Louis, MO, June 21-24. (Abstract and manuscript accepted, In Press.)1999. Pollution Prevention Technology for the Forest Products Industry. Air and Waste Management Association Annual Meeting. St. Louis, MO, June 21-24. (Abstract and manuscript accepted, In Press.)1999. Reducing Volatile Organic Compound (VOC) Press Emissions from Oriented Strand Board (OSB) Manufacturing. TAPPI Environmental Conference. Nashville, TN. (Abstract and manuscript accepted, In Press.)1998. Development of an On-Line Gas Chromatographic Analysis for Volatile Organic Compounds in the Forest Products Industry, Proceeding from the Society for Industrial Microbiology, Bioremediation for Industry Meeting, West Bend, IN, March 8-11.1997. Coupled Physical/Chemical and Biofiltration Technologies to Reduce Air Emissions from Forest Products Industries, Proceeding from the Midwest Meeting of the National Council for Air and Stream Improvement (NCASI), Green Bay, WI.1999. Developing of a “Second Generation Bifiltration System”, International Congress of Environmental Microbiology. Bogotá Columbia, June 1999 (Invited Speaker)1999. A Treatment Train Approach for Handling Air Emission for the Treatment of Volatile Organic Compounds From Wood Processing, Forest Products Society, June 1999 (Invited Speaker)1999. Controlling Air Emissions From Composite Mills Using Chemical Additives, Forest Products Society, June 9 (Invited Speaker)1999. Controlling Air Emissions from Composite Mills using Chemical Additives, TAPPI International Environmental Conference.
9

1999. Controlling Air Emissions in the Forest Products Industry, AW&PA and DOE, Invited speaker on funded project 1998 Controlling Air Emissions in the Forest Products Industry, AW&PA, Invited speaker on funded project 1998, Environmental Movement in the United States, Invited speaker by the Taiwanese Government, June 1998, Bioremediation, a treatment for air, soil and water, a series of presentations for industrial and government groups in Argentina, February 1998 1998. Development of an on-line Gas Chromatographic Analysis for Volatile Organic Compounds in the Forest Products Industry, Proceedings from the Society for Industrial Microbiology, Bioremediation for Industry Meeting, West Bend, IN March 8-11,1998 1997. Coupled Physical /Chemical and Biofiltration Technologies to Reduce Air Emissions from the Forest Products Industries, Proceedings from the Midwest Meeting of the National Council for Air and Stream Improvement (NCASI), Green Bay, WI, 1997.
10

----------
-----
-----
Table 1. VOCs from kiln drying 6 and pressing 8 of southern pine flakes.
4-Allylanisole 6
2-n-Amylfuran 8
Benzaldehyde 8
Campholenic aldehyde 8
Estragole 8
Fenchyl alcohol 6,8
Hexanoic acid 8
Limonene 6,8
Methanol 8
Octanal 8
(E)-2-octenal 8
a-Pinene 6,8
Borneol 6,8 Formaldehyde 8 Methyleugenol 6 b-Pinene 6,8
Butyl benzene 8 Heptanal 8 b-Myrcene 6 a-Terpineol 6,8
Camphene 6,8 Hexanal 8 Nonanal 8 Verbenone 8
Table 2. Reduction in the Model Air Stream Component VOCs using Chemical Treatments.
Chemical Overall reduction * Mono-Terpene Reduction
Nitric acid 75% 89% Aluminum sulfate . 18H2O 51% 59% Ferric chloride (anhydrous) 46% 55% Sodium hydroxide 66% 64% Ammonium hydroxide 0% Hydroxylamine-HCl 0% Urea 60% 64% Sodium bisulfite 0% Hydrogen peroxide 45% 42% Maleic anhydride 0%
• The overall reduction is based on comparing areas of the individual peaks before and after addition of treatment chemicals. This is an average of a minimum of four runs.
11
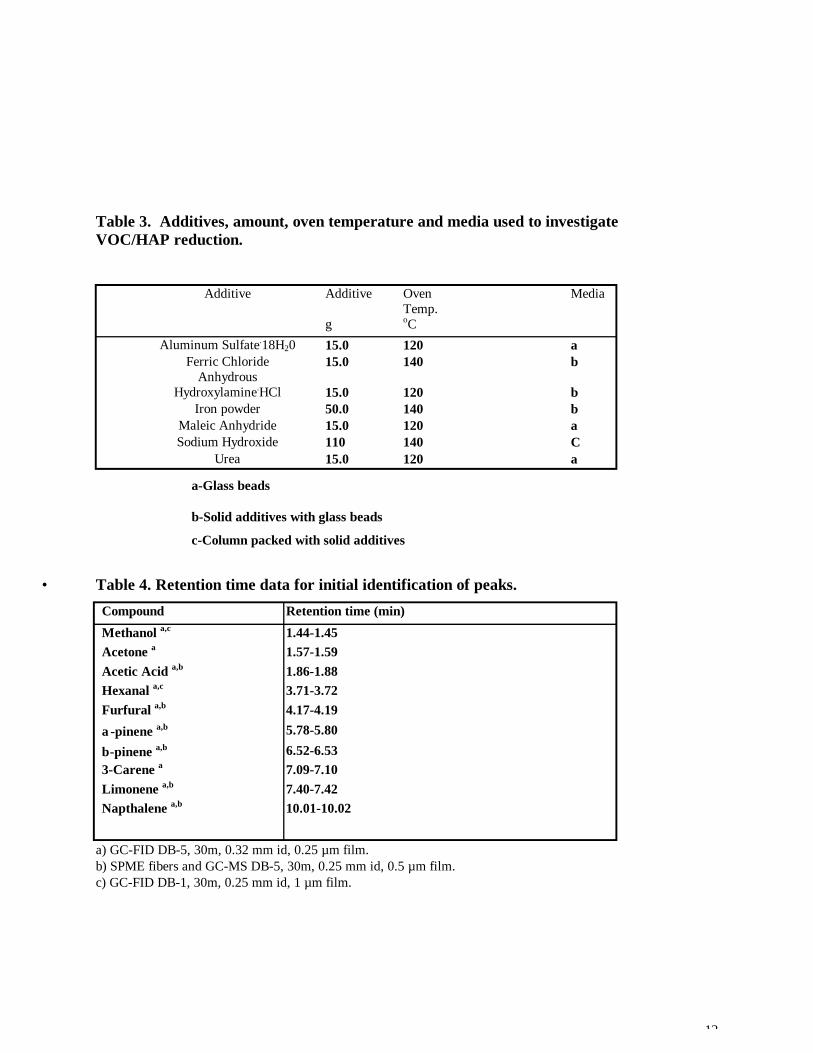
Table 3. Additives, amount, oven temperature and media used to investigate VOC/HAP reduction.
Additive Additive Oven Media Temp.
g oC Aluminum Sulfate.18H20 15.0 120 a
Ferric Chloride 15.0 140 b Anhydrous
Hydroxylamine.HCl 15.0 120 b Iron powder 50.0 140 b
Maleic Anhydride 15.0 120 a Sodium Hydroxide 110 140 C
Urea 15.0 120 a
a-Glass beads
b-Solid additives with glass beads
c-Column packed with solid additives
• Table 4. Retention time data for initial identification of peaks.
Compound Retention time (min)
Methanol a,c 1.44-1.45 Acetone a 1.57-1.59 Acetic Acid a,b 1.86-1.88 Hexanal a,c 3.71-3.72 Furfural a,b 4.17-4.19
a-pinene a,b 5.78-5.80
b-pinene a,b 6.52-6.53 3-Carene a 7.09-7.10 Limonene a,b 7.40-7.42 Napthalene a,b 10.01-10.02
a) GC-FID DB-5, 30m, 0.32 mm id, 0.25 mm film. b) SPME fibers and GC-MS DB-5, 30m, 0.25 mm id, 0.5 mm film. c) GC-FID DB-1, 30m, 0.25 mm id, 1 mm film.
12

---- --------
---- --------
---- ----
---- --------
---- --------
---- ----
Table 5. The percent reduction of VOC/HAPs using various additive treatments. a, b, c
Additive Treatment rt (min)
Methanol
1.45 (% red.)
Acetone
1.58 (% red.)
Acetic Acid 1.88 (% red.)
Hexanal
3.75 (% red.)
a-Pinene
5.84 (% red.)
b-Pinene
6.58 (% red.)
3-Carene
7.04 (% red.)
Limonene
7.39 (% red.)
Iron 27 21 100 29 54 36 Sodium hydroxide
42 3 100 100 -3 -2 -22
Urea 8 21 100 19 23 -4 Ferric chloride 44 63 100 90 100 100 100 Aluminum sulfate
14 16 100 89 100 -113
Hydroxylamine hydrochloride
16 2 26 56 98 100 100 -182
Maleic anhydrite 2 2 100 0.5 26 100 7 2 a) A blank indicates that the compound was not present. b) 100 % indicates that the compound was not present in the additive reduced sample. c) A negative number indicates an increase, rather than a reduction in concentration.
Table 6. The area reduction for individual compounds using various additive treatments. a, b, c
Additive Treatment rt (min)
Methanol
1.45 (Area)
Acetone
1.58 (Area)
Acetic Acid 1.88 (Area)
Hexanal
3.75 (Area)
a-Pinene
5.84 (Area)
b-Pinene
6.58 (Area)
3-Carene
7.04 (Area)
Limonene
7.39 (Area)
Iron 11 6 12 57 36 12 Sodium hydroxide
16 1 3 9 -4 -1 -1
Urea 4 7 9 36 12 -1 Ferric chloride 20 26 4 19 49 14 48 Aluminum sulfate
9 2 3 118 28 -3
Hydroxylamine hydrochloride
7 1 1 17 260 66 13 -75
Maleic anhydrite
1 1 1 0.1 54 3 1 1
a) A blank indicates that the compound was not present. b) A negative number indicates an increase, rather than a reduction in concentration. c) The bold numbers indicate the greatest area reduction for a given compound.
13

Table 7. Compounds* identified using GC-MS.
Acetic acid 2-n-Amylfuran 8
Benzaldehyde 8
Borneol 6,8
Bornyl acetate 8
2-Ethylhexanol 8
Furfural Fenchyl alcohol 6,8
Hexamethylcyclotrisiloxane Hexanoic Acid 8
Naphthalene g-Nonanolacetone 1-Octanol 8
Octyl acetate a-Pinene 6,8
Butylated Hydroxytoluene D-Carvone 8
4-Hexanolide Isobornyl acetate
b-Pinene 6,8
a-Terpineol 8
Carvacrol Decamethylcyclopentasiloxane 3.5-Dimethoxybenzaldehyde 6,6-Dimethyl-bicyclo[3.1.1]heptan-3-ol 8
o- Isopropenyltoluene D-Limonene 8
m-Methylacetophenone 3-Methyl-a-methylstyrene
Thymol g-Undecalactone D-Verbenone 8
Dodecamethylcyclohexasiloxane 1-Methylnaphthalene * Compounds identified in other studies 6,8 that were matched with those found in this study.
14

Figure 1. Experiment Design of the Laboratory Reactor.
Recirculation Pump
Flow Control Valve
Sample Chamber
Additive Chamber
GC Valve
Injection Port (Open)
Pump to GC (200ml/min)
On Off
Oven set at 120oC
15
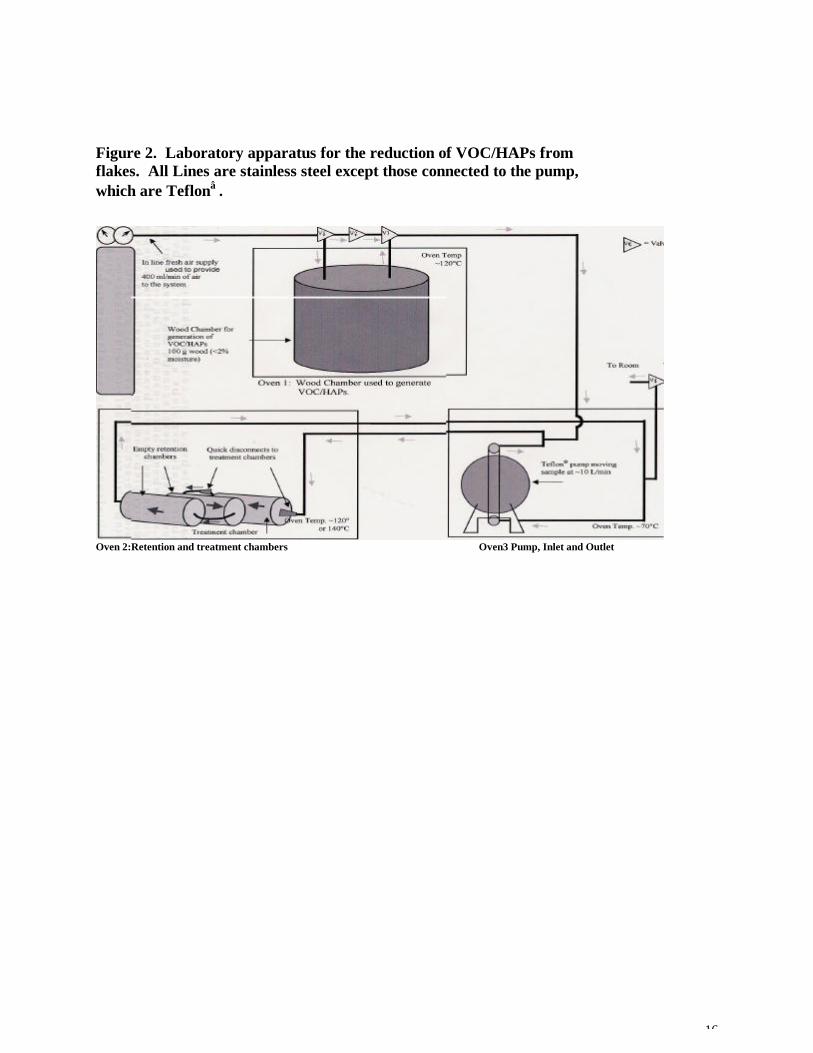
Figure 2. Laboratory apparatus for the reduction of VOC/HAPs from flakes. All Lines are stainless steel except those connected to the pump, which are Teflon� .
Oven 2:Retention and treatment chambers Oven3 Pump, Inlet and Outlet
16

Figure 3. Control data for 11 consecutive samples with GC-FID using the same wood sample.
0
50
100
150
200
250
300
1.36
1.40
1.53
5.57
5.76
6.04
6.14
6.54
7.41
7.49
Retention time (min)
Pea
k ar
ea
1 2 3 4 5 6 7 8 9 10 11Sample
Figure 4. Typical GC-FID chromatographs for control and ferric chloride additive runs.
1 2 3 4 5 6 7 8 9 10
pA
20 30 40 50 60
FID1 A, (DOE2P\0622B12.D)
1 2 3 4 5 6 7 8 9 10
pA
20 30 40 50 60
FID1 A, (DOE2P\0622B09.D)
Control
Ferric Chloride
min
min
17

Figure 5. Reduction of VOC/HAPs by ferric chloride. a, b, c
Ferric Chloride
100%44% 63%
100%
90%
100%
100%
0
10
20
30
40
50
60 M
etha
nol
Acet
one
Acet
icAc
id
Hex
anal
alph
aPi
nene
beta
Pine
ne
3-C
aren
e
Lim
onen
e
Area
Control
Treated
% = % reduction
a) Each data bar is the mean with n=4 and error bars of one standard deviation. b) No data indicates a compound was not identified. c) 100% indicates the compound was eliminated.
18

Figure 6. Typical GC-FID chromatographs for control and hydroxylamine hydrochloride additive runs.
1 2 3 4 5 6 7 8 9 10
FID1 A, (DOE2P\0715B07.D)
1 2 3 4 5 6 7 8 9 10
FID1 A, (DOE2P\0715B10.D)
Control
min
pA
20 40 60 80
100
min
pA
20 40 60 80
100 Hydroxylamine Hydrochloride
Figure 7. Reduction of VOC/HAPs by hydroxylamine hydrochloride. a, b, c
2%
0
Met
hano
l
Acet
one
Acet
icAc
id
Hex
anal
alph
aPi
nene
beta
Pine
ne
3-C
aren
e
Lim
onen
e
Area
ControlHydroxylamine Hydrochloride
100%
98%
56%
26%
16%
-182%
50
100
150
200
250
300 Treated
% = % reduction
100%
a) Each data bar is the mean with n=4 and error bars of one standard deviation. b) Negative % indicates an increase in the peak. c) 100% indicates the compound was eliminated.
19

%
t r o lte d
Figure 8. Typical GC-FID chromatographs for control and iron additive runs.
FID1 A, (DOE2P\1014B04.D)
pA 10080 60 40 20
min
Control
pA 10080 60 40 20
1 2 3 4 5 6 7 8 9 10 FID1 A, (DOE2P\1014B06.D)
1 2 3 4 5 6 7 8 9 10
Figure 9. Reduction of VOC/HAPs by iron. a, b, c
min
Iron
Area
2 5 0
2 0 0
1 5 0
1 0 0
5 0
0
I
3 6
C o n T r e a
r o n
2 7 % 2 1 % 1 0 0 %
2 9 %
5 4 %
% = % r e d u c t i o n Met
hano
l
Acet
one
Acet
ic
Acid
Hex
anal
alph
a
Pine
ne
beta
Pine
ne
3-C
aren
e a) Each data bar is the mean with n=4 and error bars of one standard deviation. b) No data indicates a compound was not identified. c) 100% indicates the compound was eliminated.
20

References
1. Word, D.H. Measuring and Controlling Volatile Organic Compound and Particulate Emissions from Wood Processing Operations and Wood-Based Products. The Forest Products Society, Proceedings No. 7301; The Forest Products Society: Madison, 1995, pp 9-13. 2. Browning, B.L. The chemistry of wood. Interscience. Publishers Division of John Wiley and Sons, 1963. 3. Carlson, F.E.; Phillips, E.K.; Tenhaeff, S.C.; Detlefsen, W.D. Measuring and Controlling Volatile Organic Compound and Particulate Emissions from Wood Processing Operations and Wood-Based Products. The Forest Products Society, Proceedings No. 7301; The Forest Products Society: Madison, 1995, pp 52-61. 4.Koontz, M.D.; Hoag, M.L. Measuring and Controlling Volatile Organic Compound and Particulate Emissions from Wood Processing Operations and Wood-Based Products. The Forest Products Society, Proceedings No. 7301; The Forest Products Society: Madison, 1995, pp 76-87. 5.Renko, R. VOC specs generate new control methods. Wood Technology, 1993, pp 22-23. 6. Ingram, L.L.; Taylor, F.W.; Punsavon, V.; Templeton, M.C. Measuring and Controlling Volatile Organic Compound and Particulate Emissions from Wood Processing Operations and Wood-Based Products. The Forest Products Society, Proceedings No. 7301; The Forest Products Society: Madison, 1995, pp 35-40. 7. EPA. . Plain English Guide to the Clean Air Act. 1995. 8. O’Neill, S.R.C. Thesis, University of Maine: Orono, ME. Dept. of Forest Management. 2000. 9.Banerjee, S.; Hutten, M.; Su, W. Environmental Science & Technology, 1995, 28(4), pp11351136. 10. Banerjee, S.; Su, W.; Wild, M.P. Environmental Science & Technology, 1998, 32(9), pp 1303-1307. 11. Su, W.; Yan, J.; Banerjee S. Environmental Science & Technology, 1999, 33(7), pp10561059. 12. Biedell, E.L.; Nester, J.L. Pollution Engineering,1995, 27(12), pp 44-46. 13. Pennington, R.L. Environmental Protection, 1996, 7(11), pp 32-35. 14. Shirely, B. Selecting the Appropriate SPME Fiber for Your Application Needs. EAS (T499232), 1999.
21