it's (change in) the (future) economy, stupid: economic
TRANSCRIPT
It’s (Change in) the (Future) Economy, Stupid:Economic Indicators, the Media, and Public Opinion
Stuart N. Soroka University of MichiganDominik A. Stecula University of British ColumbiaChristopher Wlezien University of Texas at Austin
Economic perceptions affect policy preferences and government support. It thus matters that these perceptions are driven byfactors other than the economy, including media coverage. We nevertheless know little about how media reflect economictrends, and whether they influence (or are influenced by) public economic perceptions. This article explores the economy,media, and public opinion, focusing in particular on whether media coverage and the public react to changes in or levels ofeconomic activity, and the past, present, or future economy. Analyses rely on content-analytic data drawn from 30,000 newsstories over 30 years in the United States. Results indicate that coverage reflects change in the future economy, and that thisboth influences and is influenced by public evaluations. These patterns make more understandable the somewhat surprisingfinding of positive coverage and public assessments in the midst of the Great Recession. They also may help explain previousfindings in political behavior.
A growing body of work demonstrates a link be-tween economic conditions and both attitudesabout government policy and preferences for
spending (e.g., Durr 1993; Erikson, MacKuen, and Stim-son 2002; Soroka and Wlezien 2010; Stevenson 2001;Wlezien 1995). There also are vast literatures explor-ing the degree to which support for governments andleaders follows economic trends. Some work focuseson economic conditions and assessments of presiden-tial/government performance and voting (e.g., Bartelsand Zaller 2001; Campbell 1996; Clarke and Stewart1995; Erikson 1989; Happy 1986; Hibbs 1987; MacKuen,Erikson, and Stimson 1992; Nadeau, Niemi, and Am-ato 1994, 1996; Nadeau et al. 1999; Price and Sanders1993; Sanders 1996, 1999; Sanders, Marsh, and Ward
Stuart N. Soroka is Professor of Communication Studies and Political Science, and Faculty Associate at the Center for Political Studies, Insti-tute for Social Research, University of Michigan, 5370 North Quad, 105 South State Street, Ann Arbor, MI 48109-1285 ([email protected]).Dominik A. Stecula is a Ph.D. student, Department of Political Science, University of British Columbia, C425 – 1866 Main Mall, Van-couver, British Columbia V6T 1Z1 ([email protected]). Christopher Wlezien is Hogg Professor of Government, Department ofGovernment, University of Texas at Austin, Batts Hall, Austin, TX 78712-1704 ([email protected]).
Previous versions of this article were presented at the 68th Annual Conference of the American Association for Public Opinion Research,Boston, May 2013, and the 71st Annual Conference of the Midwest Political Science Association, Chicago, April 2013. We are gratefulto Stephen Farnsworth and J. Scott Matthews for helpful advice along the way, to Brian J. Fogarty for comments on a previous draft, toAtaman Ozyildirim for help with Conference Board indicators, and to Lori Young for her work on the Lexicoder Sentiment Dictionary.Partial support for this research was provided by the Fonds de recherche sur la societe et la culture, Quebec, Canada. The data used inthis study, as well as a do-file replicating all the results, are available directly from the authors at snsoroka.com, as well as in the AJPS DataArchive on Dataverse (http://dvn.iq.harvard.edu/dvn/dv/ajps).
1993; for reviews, see Lewis-Beck and Stegmaier 2000,2007); a related body of research uses key economic vari-ables to predict—with a good degree of success—the out-come of elections, both in the United States and else-where (e.g., Abramowitz 1988; Erikson and Wlezien 2012;Lewis-Beck 1988b; Wlezien and Erikson 1996; for recentreviews, see Kayser and Wlezien 2011; Linn, Nagler, andMorales 2010). There is, in sum, a considerable body of ev-idence highlighting the political importance of economicconditions.
Public perceptions of the economy matter as well.In fact, past work suggests that economic perceptionsinfluence vote intentions and government evaluationsabove and beyond the impact of the actual economy(e.g., Nadeau, Niemi, and Amato 1994). The sources of
American Journal of Political Science, Vol. 59, No. 2, April 2015, Pp. 457–474
C©2014, Midwest Political Science Association DOI: 10.1111/ajps.12145
This is an open access article under the terms of the Creative Commons Attribution License, which permits use, distribution andreproduction in any medium, provided the original work is properly cited.
457
458 STUART N. SOROKA, DOMINIK A. STECULA, AND CHRISTOPHER WLEZIEN
public perceptions of the economy are nevertheless notwell understood. For instance, although research suggeststhat media coverage can affect public economic percep-tions (e.g., De Boef and Kellstedt 2004; Nadeau et al.1999; Soroka 2006, 2014),1 we have only a partial under-standing of what causes that coverage. The real economysurely plays a role; it is not well understood how. It also isnot clear whether and how public economic perceptionsthemselves impact coverage. This article seeks to redressthis imbalance.
The central contribution here is an investigation oftwo absolutely critical but underappreciated aspects ofthe media-economy-opinion nexus. First, we consider thepossibility that both media and public opinion react moreto changes than the levels in economic conditions. Theymay not react to high unemployment so much as anincrease in the rate, for instance. Second, we considerwhether the media and the public respond to the past,present, or future economy. They may not react to wherewe have been as much as where we are; but it also may bethat media react mostly to where we are going. Indeed,media may also react in part not just to the economy, butalso to public perceptions of the economy; that is, mediacontent may partly reflect where the public thinks theeconomy is going.
Some of these possibilities have been explored in partin existing political behavioral research, which we discussin greater detail in the following section. The relative im-pact of changes versus levels in the future versus the pastand present economy has received very little attention inthe literature focused on media content, however. This istrue in spite of the fact that the ways in which mass mediaregister and convey economic information may providevaluable insights relevant to our understanding of politi-cal behavior. Indeed, in addition to better understandingthe ways in which the economy becomes “news,” one ob-jective here is to see whether media content mirrors, andperhaps even helps explain, existing political-behavioralfindings.
The article begins with a review of the literature onthe relationship between the economy, economic news,and public perceptions. We then introduce and analyzeour data: content-analytic results from nearly 30,000 newsstories over 20 years in the United States, alongside mea-sures of the economy and public economic sentiment.We explore the relationship between media content andthe economy, and then turn to aggregate-level trendsin public opinion. Results speak to the nature of the
1Also see, for example, work on the impact of presidential rhetoricby Wood, Owens, and Durham (2005).
relationship between the economy, economic news, andpublic sentiment; in particular, they make clear the ex-tent to which media stories (and media effects) are drivenby short-term changes, rather than long-term levels, ofeconomic indicators. It appears that both the mediaand the public are particularly responsive to where theeconomy is going in the future, in addition to—and atleast sometimes more than—where it has been or cur-rently is. As we shall see, this has consequences for pub-lic assessments of the economy, which themselves alsoaffect media coverage. All of this matters, we believe,for the way in which the economy matters for politicalbehavior.
The Economy, Economic News,and Economic Perceptions
The literature focused directly on media coverage of theeconomy is relatively small, but there is a considerablebody of work focused on the impact that this media cover-age may have on public opinion. This research makes clearthat there are close relationships between the condition ofthe economy, the media’s portrayal of this condition, andpeople’s opinions about the economy. Put simply: Themedia play an important role in shaping public opinionabout the economy. This has been well established in theliteratures on public opinion and political communica-tion (e.g., Blood and Phillips 1995, 1997; Boomgaardenet al. 2011; De Boef and Kellstedt 2004; Glynn, Huge, andHoffman 2008; Goidel et al. 2010); it has been illustratedin work by economists as well (e.g., Carroll 2003; Domsand Morin 2004; Hollanders and Vliegenthart 2011). Ad-ditionally, the political importance of the effects of mediacoverage on public opinion is made readily clear in theliteratures (cited above) on policy preferences and eco-nomic voting.
Existing research tends to focus on either the(a) volume or (b) tone of media coverage. It may be thatboth play important—and distinct—roles in the media-opinion relationship, however. Consider work suggestingthat, since gathering and processing information aboutthe economy is costly, people do not continuously updatetheir expectations but rather do so only occasionally andremain largely inattentive in between (e.g., Carroll 2003and Doepke et al. 2008, both of which suggest that updat-ing may occur less than once a year). Expectation updat-ing, according to this work, occurs when there are highvolumes of economic news, and economic news tends tobe most frequent when the economy is bad (e.g., Doms
IT’S (CHANGE IN) THE (FUTURE) ECONOMY, STUPID 459
and Morin 2004; Lamla and Lein 2008; Shah et al. 1999).2
It follows that individuals’ expectations may be a productnot just of media tone, but of the volume of coverage aswell, which may often serve to augment the impact ofnegative tone.
We explore effects of both volume and tone below.Additionally, we provide a much more detailed discussionof measures of tone and volume in Appendix A in the sup-porting information. For now, what is most important isthat both may matter for public perceptions, above andbeyond economic conditions. This is because media con-tent is not just a reflection of economic conditions. Thereare a variety of differences between the economy and me-dia coverage of the economy across both time and mediaoutlets, and there is a growing body of work making thisfact increasingly clear (see discussion below). There isrelatively little work speaking to the nature of the differ-ence, however.3 This is disconcerting given the potentiallyimportant implications of discrepancies between the realeconomy and economic news.
The literature points to what appear to be striking in-stances of such discrepancies. One relatively well-knownexample (noted by Lipset 1993, among others) is fromthe 1992 U.S. election: The argument is that PresidentBush lost his reelection bid not on the basis of the actualstate of the economy, but due to people’s perceptions ofthe state of the economy, which were driven by overtlynegative economic coverage. It is this election that pro-duced the phrase “It’s the economy, stupid,” attributedto Clinton strategist James Carville and meant to be theClinton campaign’s primary message. (This, of course,is the phrase that led to the title of the current article.)The aim was to highlight what was then still a falteringeconomy in an effort to encourage voters to reject Bushand support Clinton instead. Research highlights the im-portance of economic perceptions in that election (e.g.,Alvarez and Nagler 1995), and research on other electionsprovides some supporting evidence. (See work that pre-dicts U.S. election outcomes using measures of economicperceptions; e.g., Holbrook 1994.) In fact, perceptions of
2Indeed, media generally tend to focus on “problems”; see, forexample, Altheide (1997) and Bennett (1997).
3There are some important exceptions, however. Fogarty (2005) ex-amines the connection between various economic indicators andNew York Times front-page coverage. Goidel et al. (2010) explorethe relationship between various media sources (local and nationalnewspapers and TV broadcasts) and the economy (as well as opin-ion). Harrington (1989) examines the degree to which networknews focuses on negative information, contrasting election andnonelection years. Farnsworth and Lichter (2006, 2011) examinevariation in media coverage of presidents on a range of issues, in-cluding the economy. Also see work listed in Appendix D in thesupporting information.
the economy can matter more than objective conditionsfor citizens’ political judgments (e.g., Sanders 2000); italso appears that media coverage can distort perceptions,at least to some degree, including in 1992 (Hetherington1996).
What drives the gap between media content and real-ity? One account, which we discuss further in the follow-ing section, stresses the significance of “biases” in mediagatekeeping and news production. Another variant, andone that we want to emphasize here, is that the economy islarge and complex, and can be described and reflected inmany different ways, and media content tends to capturecertain elements of the economy more systematically thanothers. Past work has demonstrated a tendency for mediato focus more on negative than on positive information(e.g., Soroka 2006, 2012, 2014), for instance. Here we wantto examine other elements of the economy on which bothmedia content and public economic sentiment tend to befocused.
The Focus of Media Coverage
Our examination focuses on two aspects of the media-economy relationship. First, we examine whether the me-dia coverage reflects changes in the economy alongside, ifnot entirely instead of, levels. Second, we assess whethercoverage responds to the economic past, present, orfuture.
Changes versus Levels
The idea that change matters to media coverage is not new,although it has not been examined in much detail whereaggregate trends in media content are concerned. Theemphasis is clear in the general literature on journalisticpractices, however. There is a body of work suggestingthat journalistic norms lead to systematic patterns in newscontent (e.g., Bennett 1997; Meyrowitz 1994; Shoemakerand Vos 2009).
More specifically, research on journalistic practicesmakes clear the significance of novelty and change in theselection of news stories. Thomas Patterson (1994, 60)writes that “above all else, reporters are taught to searchwhat is new and different in events of the past twenty-fourhours.” Election campaigns are particularly attractive tojournalists, for instance, because they provide a constantlyshifting set of topics and characters (e.g., Skewes 2007; seealso a review of the “game” frame in Aalberg, Stromback,and de Vreese 2012). Discussions of ongoing, often long-standing, political issues systematically get less coverage
460 STUART N. SOROKA, DOMINIK A. STECULA, AND CHRISTOPHER WLEZIEN
than whatever new topics arise.4 Novelty and change aredefining features of newsworthiness.5
Studies of the actual content of news stories high-light similar themes. There is a growing body of workfocused on how the newsroom priorities of timelinessand novelty tend to reduce coverage of longer-term pro-cesses, for instance. This has been an emphasis in work onscience reporting in particular, especially on environmen-tal issues (e.g., Boykoff and Boykoff 2007; Mazur 2009;Mazur and Lee 1997; McComas and Shanahan 1999; Mc-Cright and Dunlap 2003; Soroka et al. 2012; Trumbo1995).
But one does not need to look to very long-termprocesses to see the priority that novelty has in news gate-keeping; for example, media coverage of campaign-periodpolls increases with poll volatility (Matthews, Pickup, andCutler 2012). There is, of course, no reason to believe thatthis tendency is evident only in science news or coverageof pre-election polls.
Journalists are not working in a vacuum—they arewriting to appeal to an audience. So it should come asno surprise that research in political behavior points tothe importance of changes in conditions where pub-lic perceptions are concerned as well. For instance, re-search on election outcomes reveals that voters rewardand punish incumbents mostly on the basis of economicchange. There is an especially long history of such re-search on U.S. presidential elections, where scholars usingdifferent economic measures all demonstrate that incum-bent support depends on the “slope” of the economy—the direction and magnitude of economic change—notthe level per se (Abramowitz 1988; Bartels and Zaller2001; Campbell 1996; Hibbs 1987; Wlezien and Erik-son 1996). Importantly, this work also shows that eco-nomic change closer to the election matters more to vot-ers than earlier economic change.6 Much the same is truefor government approval between elections (especially
4“The first time that a candidate takes a position on a key issue, thepress is almost certain to report. Further statements on the sameissue become progressively less newsworthy, unless a new wrinkleis added” (Patterson 1994, 61).
5The literature on this issue is vast. See, for example, Farnsworthand Lichter (2006), Jamieson (1992), Robinson and Sheehan(1983), and Davis (1992). Also see Klein’s (2010) related commen-tary on journalism and Fuller (2010), who links the journalisticpursuit of novelty to humans’ evolutionarily advantageous ten-dency to be especially attentive to new information.
6This is important because the Election Day outcome is not a simplesum of changes over the course of the term, which would implythat the level of the economy is determining.
see Erikson, MacKuen, and Stimson 2002);7 compar-ative research is also confirming (see, e.g., Andersonand Wlezien 1997; Clarke and Stewart 1995; Kayser andWlezien 2011; Van Der Brug, Van Der Eijk, and Franklin2007).
The Past, Current, or Future Economy
We are also interested in the time horizon of the eco-nomic conditions reflected in media content. Specifically,we are interested in the possibility that media contentfocuses more on prospective than on current or retro-spective economic conditions. Work in political behaviorhas considered this issue—the distinction in that litera-ture is between naive voters who can base votes only onpast conditions versus sophisticated voters who are ableto take forward projections into account. Research ini-tially focused largely on the former possibility, althougha literature on the latter has also accumulated (for re-views, see Lewis-Beck and Stegmaier 2000, 2007; Singerand Carlin 2013). There is, for instance, a considerablebody of work suggesting that voters are driven in part byprospective evaluations (e.g., Fiorina 1981; Kuklinski andWest 1981; Lewis-Beck 1988a; Lockerbie 1991); the sameappears to be true for trends in both presidential approval(Chappell & Keech 1985; MacKuen, Erikson, and Stimson1992) and “most important problem” responses (Wlezien2005) as well. In sum, to borrow MacKuen, Erikson, andStimson’s (1992) terminology, voters sometimes appearto behave more like (prospectively focused) bankers than(retrospectively focused) peasants.
The work by MacKuen, Erikson, and Stimson (1992)is particularly relevant here. Their primary focus is onthe interplay between the economy, consumer sentiment(both retrospective and prospective), and presidentialevaluations. In accounting for consumer sentiment, how-ever, they add trends in a set of survey questions askingwhether respondents have heard any “favorable or unfa-vorable” news about business conditions. The measure isstrongly related to economic expectations, a signal thatmedia content may be rather forward-looking.
These authors do not directly examine economic ef-fects on media content, however, and there have been, toour knowledge, no serious considerations of the relativeweight of past, current, and future economic conditionsin shaping economic news. Analyses of media coverageof economic conditions tend to focus on the relation-ship between media coverage and a single indicator of
7The effects on approval are a bit less obvious, as changes in theeconomy impact changes in approval, which tend to decay overtime.
IT’S (CHANGE IN) THE (FUTURE) ECONOMY, STUPID 461
economic conditions—sometimes prospective, althoughtypically not. In fact, the existing media-focused literaturedoes not directly test the relative importance of levels orchanges either. For more detailed information, AppendixD in the supporting information provides a list of recentstudies of media content on the economy, noting deci-sions regarding levels versus changes, and past, present,or future economic measures.
Given work on (a) the potential importance of eco-nomic sentiment to political behavior and (b) the poten-tial importance of media content to economic sentiment,we see this as an important gap in the literature. Wethus consider here whether media focus more on futurethan on current and past economic conditions. In doingso, we may be one step closer to accounting for the rel-ative importance of prospective evaluations in politicaljudgments—the future economy matters in part becausethis is what media content is focused on.
The Data
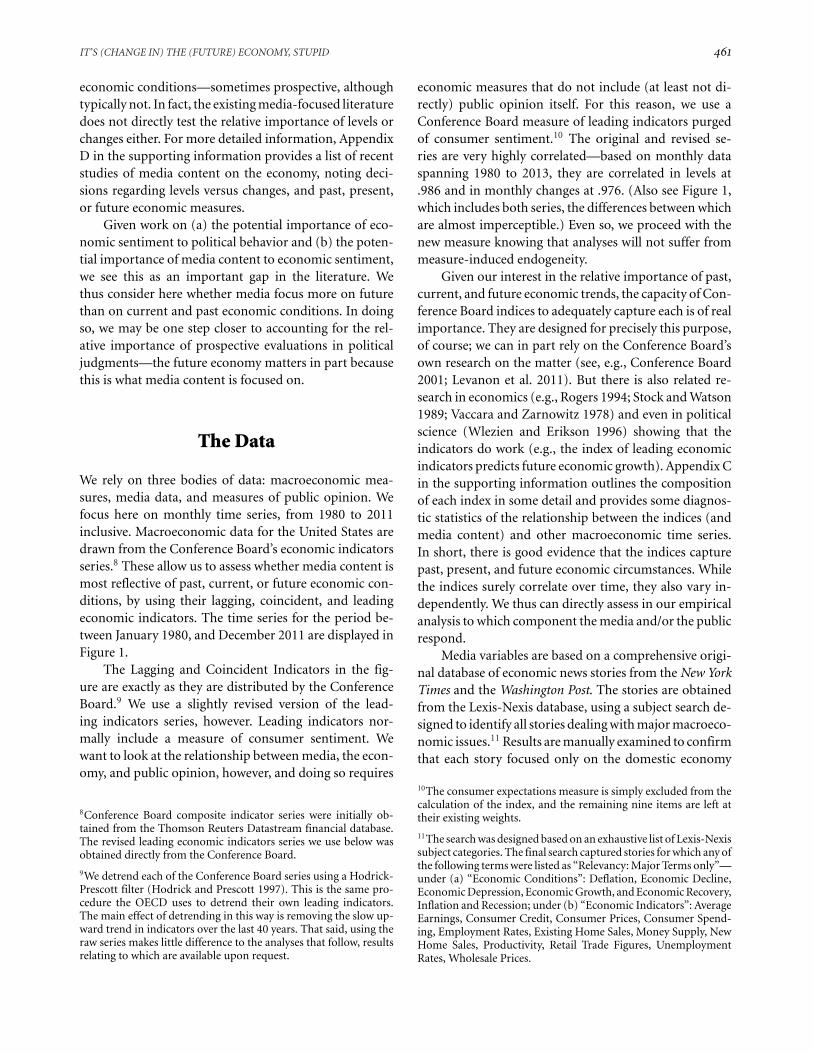
We rely on three bodies of data: macroeconomic mea-sures, media data, and measures of public opinion. Wefocus here on monthly time series, from 1980 to 2011inclusive. Macroeconomic data for the United States aredrawn from the Conference Board’s economic indicatorsseries.8 These allow us to assess whether media content ismost reflective of past, current, or future economic con-ditions, by using their lagging, coincident, and leadingeconomic indicators. The time series for the period be-tween January 1980, and December 2011 are displayed inFigure 1.
The Lagging and Coincident Indicators in the fig-ure are exactly as they are distributed by the ConferenceBoard.9 We use a slightly revised version of the lead-ing indicators series, however. Leading indicators nor-mally include a measure of consumer sentiment. Wewant to look at the relationship between media, the econ-omy, and public opinion, however, and doing so requires
8Conference Board composite indicator series were initially ob-tained from the Thomson Reuters Datastream financial database.The revised leading economic indicators series we use below wasobtained directly from the Conference Board.
9We detrend each of the Conference Board series using a Hodrick-Prescott filter (Hodrick and Prescott 1997). This is the same pro-cedure the OECD uses to detrend their own leading indicators.The main effect of detrending in this way is removing the slow up-ward trend in indicators over the last 40 years. That said, using theraw series makes little difference to the analyses that follow, resultsrelating to which are available upon request.
economic measures that do not include (at least not di-rectly) public opinion itself. For this reason, we use aConference Board measure of leading indicators purgedof consumer sentiment.10 The original and revised se-ries are very highly correlated—based on monthly dataspanning 1980 to 2013, they are correlated in levels at.986 and in monthly changes at .976. (Also see Figure 1,which includes both series, the differences between whichare almost imperceptible.) Even so, we proceed with thenew measure knowing that analyses will not suffer frommeasure-induced endogeneity.
Given our interest in the relative importance of past,current, and future economic trends, the capacity of Con-ference Board indices to adequately capture each is of realimportance. They are designed for precisely this purpose,of course; we can in part rely on the Conference Board’sown research on the matter (see, e.g., Conference Board2001; Levanon et al. 2011). But there is also related re-search in economics (e.g., Rogers 1994; Stock and Watson1989; Vaccara and Zarnowitz 1978) and even in politicalscience (Wlezien and Erikson 1996) showing that theindicators do work (e.g., the index of leading economicindicators predicts future economic growth). Appendix Cin the supporting information outlines the compositionof each index in some detail and provides some diagnos-tic statistics of the relationship between the indices (andmedia content) and other macroeconomic time series.In short, there is good evidence that the indices capturepast, present, and future economic circumstances. Whilethe indices surely correlate over time, they also vary in-dependently. We thus can directly assess in our empiricalanalysis to which component the media and/or the publicrespond.
Media variables are based on a comprehensive origi-nal database of economic news stories from the New YorkTimes and the Washington Post. The stories are obtainedfrom the Lexis-Nexis database, using a subject search de-signed to identify all stories dealing with major macroeco-nomic issues.11 Results are manually examined to confirmthat each story focused only on the domestic economy
10The consumer expectations measure is simply excluded from thecalculation of the index, and the remaining nine items are left attheir existing weights.
11The search was designed based on an exhaustive list of Lexis-Nexissubject categories. The final search captured stories for which any ofthe following terms were listed as “Relevancy: Major Terms only”—under (a) “Economic Conditions”: Deflation, Economic Decline,Economic Depression, Economic Growth, and Economic Recovery,Inflation and Recession; under (b) “Economic Indicators”: AverageEarnings, Consumer Credit, Consumer Prices, Consumer Spend-ing, Employment Rates, Existing Home Sales, Money Supply, NewHome Sales, Productivity, Retail Trade Figures, UnemploymentRates, Wholesale Prices.
462 STUART N. SOROKA, DOMINIK A. STECULA, AND CHRISTOPHER WLEZIEN
FIGURE 1 Composite Indicators in the United States, 1980–2011
(i.e., not on the economy of other countries); irrelevantstories are eliminated. Any story of fewer than 100 wordsis also excluded, since these are typically short notes ratherthan actual newspaper articles. Economic coverage alsotends to include stories that are in fact just long lists ofreported economic figures and indicators; these too areeliminated. The final data set includes 31,180 stories forthe two newspapers.
The next task is to convert the database of storiesinto time series of economic news coverage. There are,of course, several different approaches; we focus here ontwo different measures:
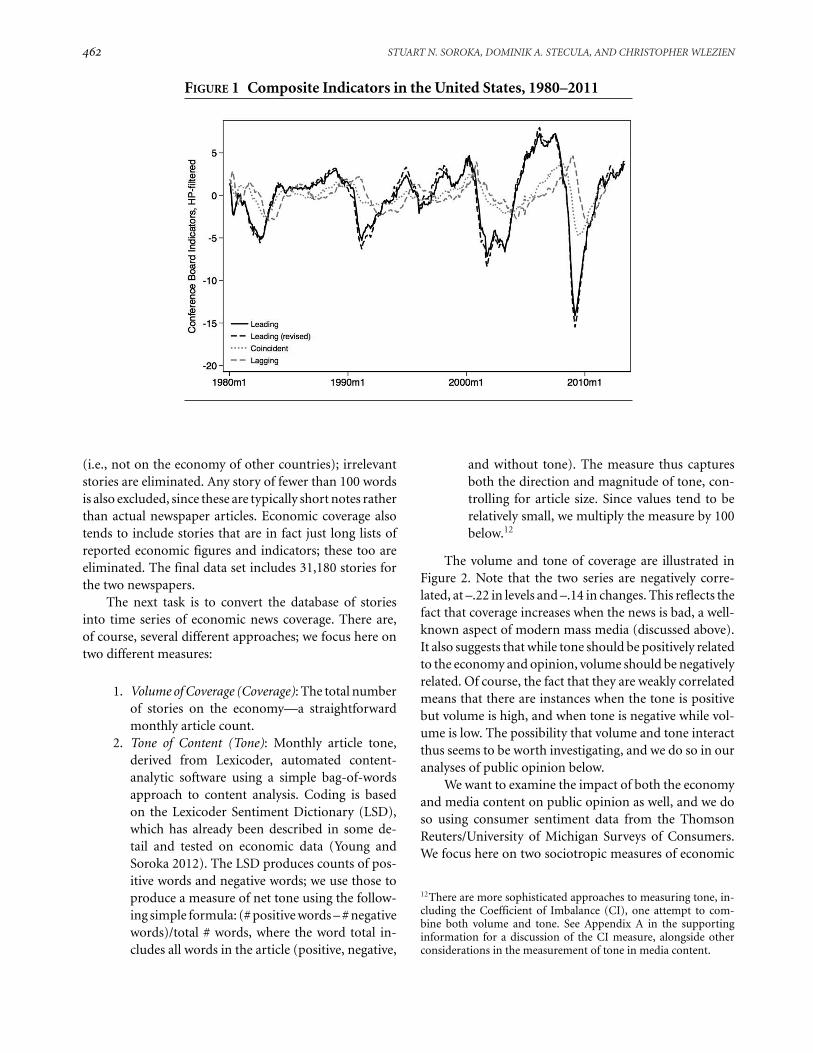
1. Volume of Coverage (Coverage): The total numberof stories on the economy—a straightforwardmonthly article count.
2. Tone of Content (Tone): Monthly article tone,derived from Lexicoder, automated content-analytic software using a simple bag-of-wordsapproach to content analysis. Coding is basedon the Lexicoder Sentiment Dictionary (LSD),which has already been described in some de-tail and tested on economic data (Young andSoroka 2012). The LSD produces counts of pos-itive words and negative words; we use those toproduce a measure of net tone using the follow-ing simple formula: (# positive words – # negativewords)/total # words, where the word total in-cludes all words in the article (positive, negative,
and without tone). The measure thus capturesboth the direction and magnitude of tone, con-trolling for article size. Since values tend to berelatively small, we multiply the measure by 100below.12
The volume and tone of coverage are illustrated inFigure 2. Note that the two series are negatively corre-lated, at –.22 in levels and –.14 in changes. This reflects thefact that coverage increases when the news is bad, a well-known aspect of modern mass media (discussed above).It also suggests that while tone should be positively relatedto the economy and opinion, volume should be negativelyrelated. Of course, the fact that they are weakly correlatedmeans that there are instances when the tone is positivebut volume is high, and when tone is negative while vol-ume is low. The possibility that volume and tone interactthus seems to be worth investigating, and we do so in ouranalyses of public opinion below.
We want to examine the impact of both the economyand media content on public opinion as well, and we doso using consumer sentiment data from the ThomsonReuters/University of Michigan Surveys of Consumers.We focus here on two sociotropic measures of economic
12There are more sophisticated approaches to measuring tone, in-cluding the Coefficient of Imbalance (CI), one attempt to com-bine both volume and tone. See Appendix A in the supportinginformation for a discussion of the CI measure, alongside otherconsiderations in the measurement of tone in media content.
IT’S (CHANGE IN) THE (FUTURE) ECONOMY, STUPID 463
FIGURE 2 The Volume and Tone of Economic News Coverage
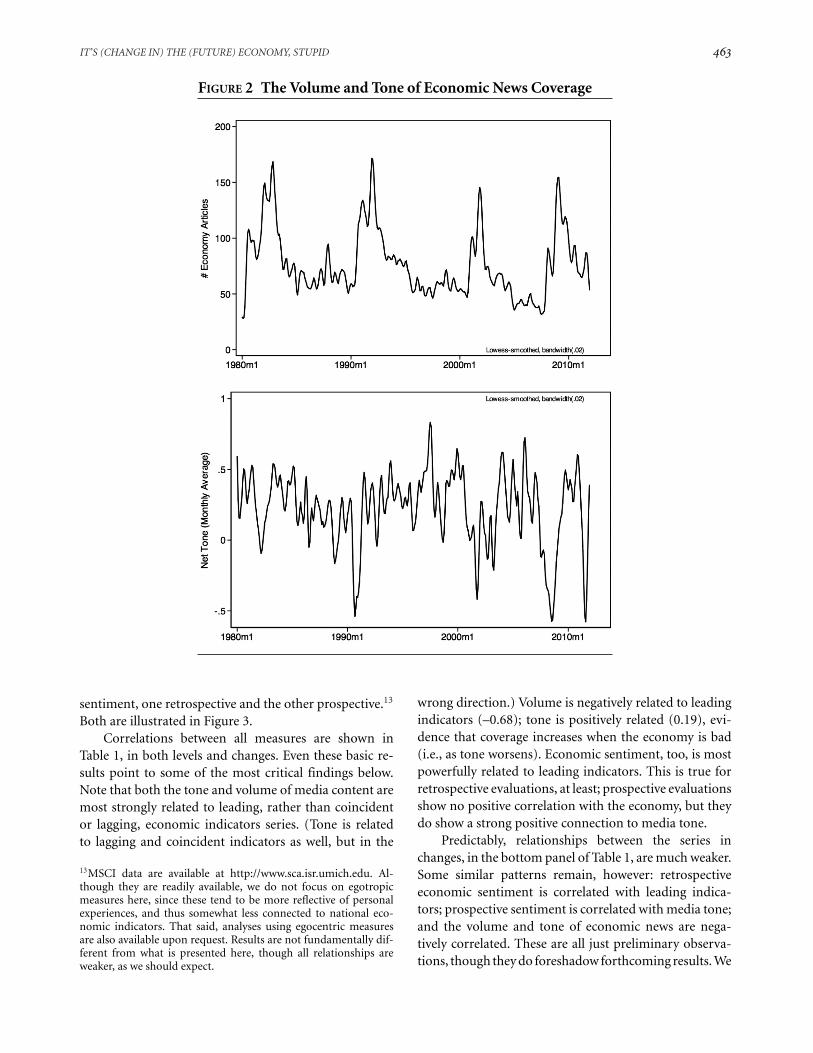
sentiment, one retrospective and the other prospective.13
Both are illustrated in Figure 3.Correlations between all measures are shown in
Table 1, in both levels and changes. Even these basic re-sults point to some of the most critical findings below.Note that both the tone and volume of media content aremost strongly related to leading, rather than coincidentor lagging, economic indicators series. (Tone is relatedto lagging and coincident indicators as well, but in the
13MSCI data are available at http://www.sca.isr.umich.edu. Al-though they are readily available, we do not focus on egotropicmeasures here, since these tend to be more reflective of personalexperiences, and thus somewhat less connected to national eco-nomic indicators. That said, analyses using egocentric measuresare also available upon request. Results are not fundamentally dif-ferent from what is presented here, though all relationships areweaker, as we should expect.
wrong direction.) Volume is negatively related to leadingindicators (–0.68); tone is positively related (0.19), evi-dence that coverage increases when the economy is bad(i.e., as tone worsens). Economic sentiment, too, is mostpowerfully related to leading indicators. This is true forretrospective evaluations, at least; prospective evaluationsshow no positive correlation with the economy, but theydo show a strong positive connection to media tone.
Predictably, relationships between the series inchanges, in the bottom panel of Table 1, are much weaker.Some similar patterns remain, however: retrospectiveeconomic sentiment is correlated with leading indica-tors; prospective sentiment is correlated with media tone;and the volume and tone of economic news are nega-tively correlated. These are all just preliminary observa-tions, though they do foreshadow forthcoming results. We
464 STUART N. SOROKA, DOMINIK A. STECULA, AND CHRISTOPHER WLEZIEN
FIGURE 3 Public Opinion about the Economy
TABLE 1 Bivariate Correlations: Economic, Media, and Public Opinion Measures
In (Concurrent) Levels EI, Lag EI, Coin EI, Lead Volume Tone SR
EI, Coincident 0.514∗
EI, Leading –0.072 0.664∗
Volume –0.019 –0.420∗ –0.686∗
Tone (LSD) –0.355∗ –0.167∗ 0.188∗ –0.220∗
Sociotropic Retrospective (SR) –0.256∗ 0.191∗ 0.621∗ –0.582∗ 0.425∗
Sociotropic Prospective –0.507∗ –0.506∗ –0.266∗ 0.166∗ 0.377∗ 0.265∗
In (Concurrent) Changes EI, Lag EI, Coin EI, Lead Volume Tone SR
EI, Coincident –0.078EI, Leading –0.311∗ 0.544∗
Volume 0.056 –0.078 –0.181∗
Tone (LSD) –0.030 0.030 0.085 –0.135∗
Sociotropic Retrospective (SR) –0.070 0.132∗ 0.339∗ –0.142∗ 0.184∗
Sociotropic Prospective –0.068 –0.116∗ 0.047 –0.047 0.176∗ 0.404∗
Note: N varies from 338 to 384, depending on data availability ∗p < .05.
now turn to a more rigorous examination of the relation-ships between the economy, media, and public sentimentbelow.
The Economy and the MediaWe begin with an analysis of the relationship betweeneconomic indicators and media coverage. We rely—hereand in all subsequent analyses—on time-series errorcorrection models (ECMs), where current changes in a
dependent variable are regressed on lagged levels of thatvariable and both current changes and lagged levels ofthe independent variable(s) as well.14 ECMs have some
14Note that we use regression models appropriate for interval-leveldata in spite of the fact that one of our variables, the numberof economic news stories, is, strictly speaking, a count variable—itcannot be less than zero, and it takes on only integer values. Neitherof these facts is problematic for our analyses, particularly since thenumber of economic news stories per month is always well abovezero. In our data, the minimum value is 17 and the maximum is239; the variable is positively skewed, then (skewness = 1.16), butit is essentially a normal distribution with a right-hand tail.
IT’S (CHANGE IN) THE (FUTURE) ECONOMY, STUPID 465
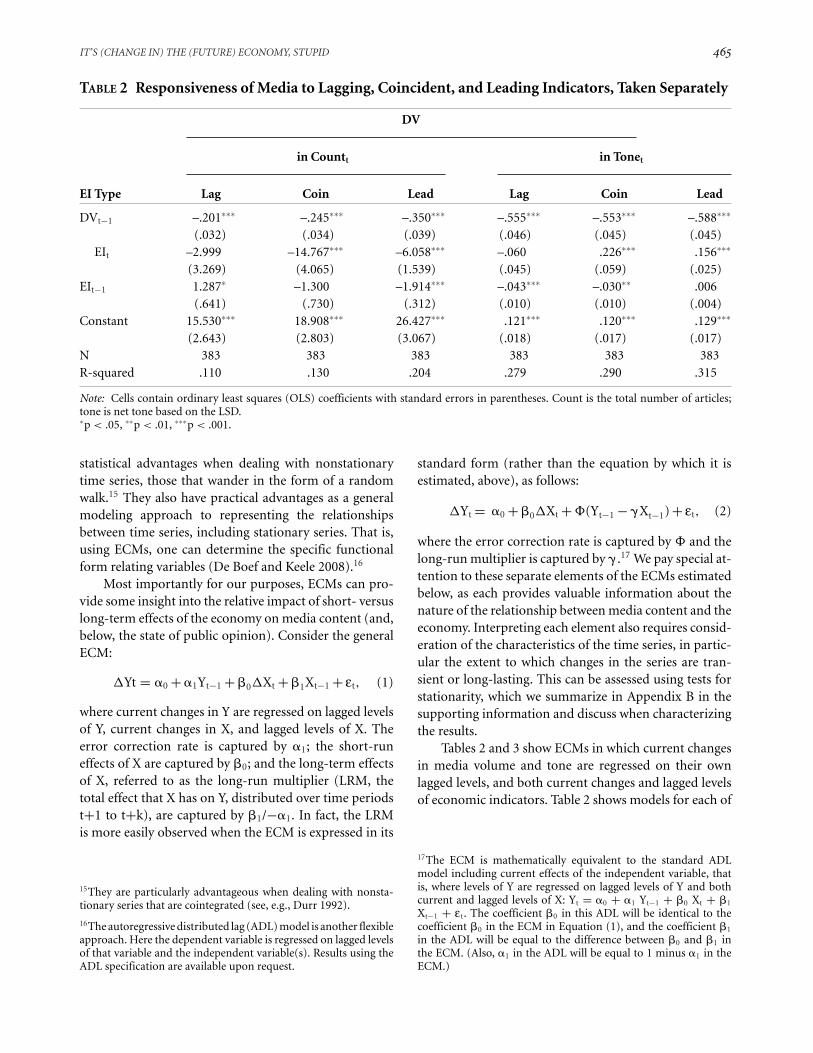
TABLE 2 Responsiveness of Media to Lagging, Coincident, and Leading Indicators, Taken Separately
DV
� in Countt � in Tonet
EI Type Lag Coin Lead Lag Coin Lead
DVt−1 –.201∗∗∗ –.245∗∗∗ –.350∗∗∗ –.555∗∗∗ –.553∗∗∗ –.588∗∗∗
(.032) (.034) (.039) (.046) (.045) (.045)� EIt –2.999 –14.767∗∗∗ –6.058∗∗∗ –.060 .226∗∗∗ .156∗∗∗
(3.269) (4.065) (1.539) (.045) (.059) (.025)EIt−1 1.287∗ –1.300 –1.914∗∗∗ –.043∗∗∗ –.030∗∗ .006
(.641) (.730) (.312) (.010) (.010) (.004)Constant 15.530∗∗∗ 18.908∗∗∗ 26.427∗∗∗ .121∗∗∗ .120∗∗∗ .129∗∗∗
(2.643) (2.803) (3.067) (.018) (.017) (.017)N 383 383 383 383 383 383R-squared .110 .130 .204 .279 .290 .315
Note: Cells contain ordinary least squares (OLS) coefficients with standard errors in parentheses. Count is the total number of articles;tone is net tone based on the LSD.∗p < .05, ∗∗p < .01, ∗∗∗p < .001.
statistical advantages when dealing with nonstationarytime series, those that wander in the form of a randomwalk.15 They also have practical advantages as a generalmodeling approach to representing the relationshipsbetween time series, including stationary series. That is,using ECMs, one can determine the specific functionalform relating variables (De Boef and Keele 2008).16
Most importantly for our purposes, ECMs can pro-vide some insight into the relative impact of short- versuslong-term effects of the economy on media content (and,below, the state of public opinion). Consider the generalECM:
�Yt = �0 + �1Yt−1 + �0�Xt + �1Xt−1 + εt, (1)
where current changes in Y are regressed on lagged levelsof Y, current changes in X, and lagged levels of X. Theerror correction rate is captured by �1; the short-runeffects of X are captured by �0; and the long-term effectsof X, referred to as the long-run multiplier (LRM, thetotal effect that X has on Y, distributed over time periodst+1 to t+k), are captured by �1/−�1. In fact, the LRMis more easily observed when the ECM is expressed in its
15They are particularly advantageous when dealing with nonsta-tionary series that are cointegrated (see, e.g., Durr 1992).
16The autoregressive distributed lag (ADL) model is another flexibleapproach. Here the dependent variable is regressed on lagged levelsof that variable and the independent variable(s). Results using theADL specification are available upon request.
standard form (rather than the equation by which it isestimated, above), as follows:
�Yt = �0 + �0�Xt +�(Yt−1 − �Xt−1) + εt, (2)
where the error correction rate is captured by � and thelong-run multiplier is captured by � .17 We pay special at-tention to these separate elements of the ECMs estimatedbelow, as each provides valuable information about thenature of the relationship between media content and theeconomy. Interpreting each element also requires consid-eration of the characteristics of the time series, in partic-ular the extent to which changes in the series are tran-sient or long-lasting. This can be assessed using tests forstationarity, which we summarize in Appendix B in thesupporting information and discuss when characterizingthe results.
Tables 2 and 3 show ECMs in which current changesin media volume and tone are regressed on their ownlagged levels, and both current changes and lagged levelsof economic indicators. Table 2 shows models for each of
17The ECM is mathematically equivalent to the standard ADLmodel including current effects of the independent variable, thatis, where levels of Y are regressed on lagged levels of Y and bothcurrent and lagged levels of X: Yt = �0 + �1 Yt−1 + �0 Xt + �1
Xt−1 + εt. The coefficient �0 in this ADL will be identical to thecoefficient �0 in the ECM in Equation (1), and the coefficient �1
in the ADL will be equal to the difference between �0 and �1 inthe ECM. (Also, �1 in the ADL will be equal to 1 minus �1 in theECM.)
466 STUART N. SOROKA, DOMINIK A. STECULA, AND CHRISTOPHER WLEZIEN
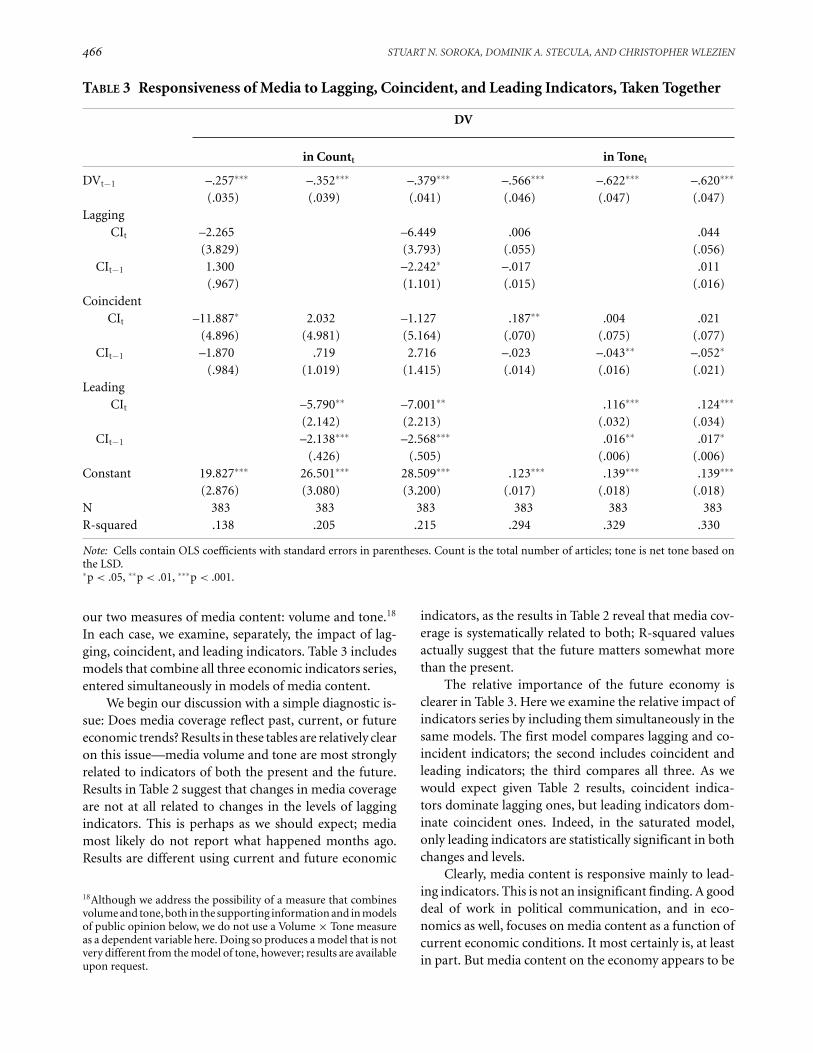
TABLE 3 Responsiveness of Media to Lagging, Coincident, and Leading Indicators, Taken Together
DV
� in Countt � in Tonet
DVt−1 –.257∗∗∗ –.352∗∗∗ –.379∗∗∗ –.566∗∗∗ –.622∗∗∗ –.620∗∗∗
(.035) (.039) (.041) (.046) (.047) (.047)Lagging
� CIt –2.265 –6.449 .006 .044(3.829) (3.793) (.055) (.056)
CIt−1 1.300 –2.242∗ –.017 .011(.967) (1.101) (.015) (.016)
Coincident�CIt –11.887∗ 2.032 –1.127 .187∗∗ .004 .021
(4.896) (4.981) (5.164) (.070) (.075) (.077)CIt−1 –1.870 .719 2.716 –.023 –.043∗∗ –.052∗
(.984) (1.019) (1.415) (.014) (.016) (.021)Leading
� CIt –5.790∗∗ –7.001∗∗ .116∗∗∗ .124∗∗∗
(2.142) (2.213) (.032) (.034)CIt−1 –2.138∗∗∗ –2.568∗∗∗ .016∗∗ .017∗
(.426) (.505) (.006) (.006)Constant 19.827∗∗∗ 26.501∗∗∗ 28.509∗∗∗ .123∗∗∗ .139∗∗∗ .139∗∗∗
(2.876) (3.080) (3.200) (.017) (.018) (.018)N 383 383 383 383 383 383R-squared .138 .205 .215 .294 .329 .330
Note: Cells contain OLS coefficients with standard errors in parentheses. Count is the total number of articles; tone is net tone based onthe LSD.∗p < .05, ∗∗p < .01, ∗∗∗p < .001.
our two measures of media content: volume and tone.18
In each case, we examine, separately, the impact of lag-ging, coincident, and leading indicators. Table 3 includesmodels that combine all three economic indicators series,entered simultaneously in models of media content.
We begin our discussion with a simple diagnostic is-sue: Does media coverage reflect past, current, or futureeconomic trends? Results in these tables are relatively clearon this issue—media volume and tone are most stronglyrelated to indicators of both the present and the future.Results in Table 2 suggest that changes in media coverageare not at all related to changes in the levels of laggingindicators. This is perhaps as we should expect; mediamost likely do not report what happened months ago.Results are different using current and future economic
18Although we address the possibility of a measure that combinesvolume and tone, both in the supporting information and in modelsof public opinion below, we do not use a Volume × Tone measureas a dependent variable here. Doing so produces a model that is notvery different from the model of tone, however; results are availableupon request.
indicators, as the results in Table 2 reveal that media cov-erage is systematically related to both; R-squared valuesactually suggest that the future matters somewhat morethan the present.
The relative importance of the future economy isclearer in Table 3. Here we examine the relative impact ofindicators series by including them simultaneously in thesame models. The first model compares lagging and co-incident indicators; the second includes coincident andleading indicators; the third compares all three. As wewould expect given Table 2 results, coincident indica-tors dominate lagging ones, but leading indicators dom-inate coincident ones. Indeed, in the saturated model,only leading indicators are statistically significant in bothchanges and levels.
Clearly, media content is responsive mainly to lead-ing indicators. This is not an insignificant finding. A gooddeal of work in political communication, and in eco-nomics as well, focuses on media content as a function ofcurrent economic conditions. It most certainly is, at leastin part. But media content on the economy appears to be
IT’S (CHANGE IN) THE (FUTURE) ECONOMY, STUPID 467
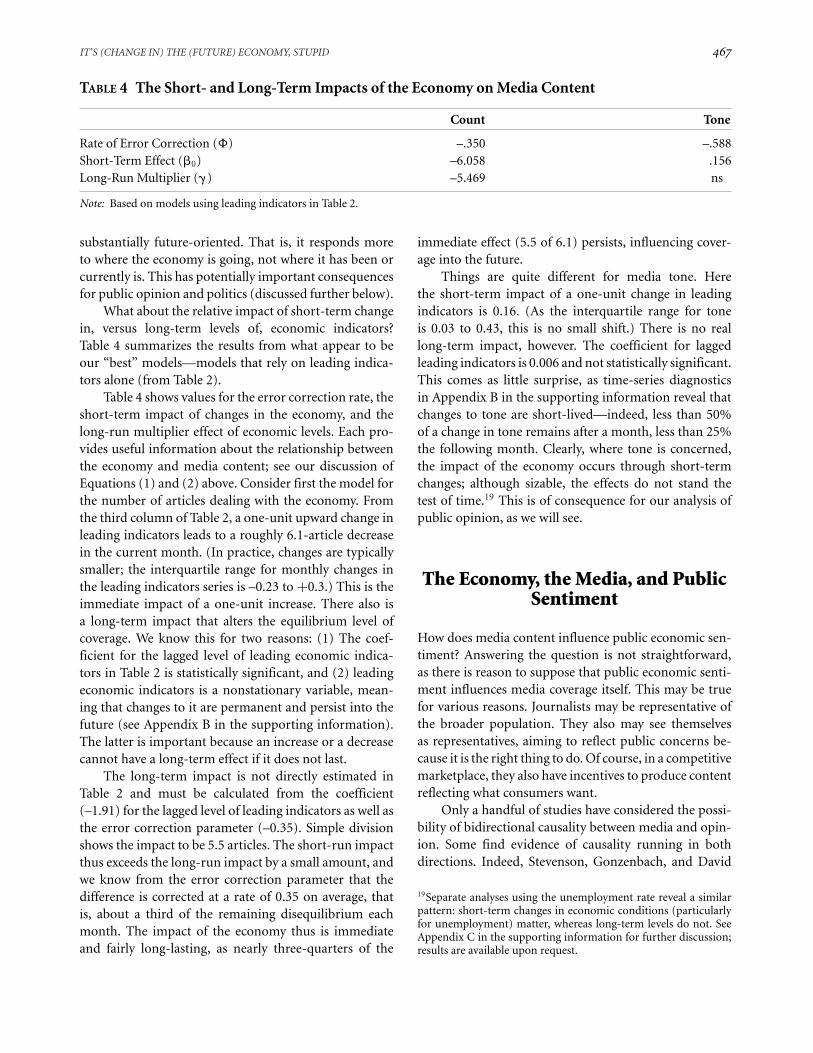
TABLE 4 The Short- and Long-Term Impacts of the Economy on Media Content
Count Tone
Rate of Error Correction (�) –.350 –.588Short-Term Effect (�0) –6.058 .156Long-Run Multiplier (�) –5.469 ns
Note: Based on models using leading indicators in Table 2.
substantially future-oriented. That is, it responds moreto where the economy is going, not where it has been orcurrently is. This has potentially important consequencesfor public opinion and politics (discussed further below).
What about the relative impact of short-term changein, versus long-term levels of, economic indicators?Table 4 summarizes the results from what appear to beour “best” models—models that rely on leading indica-tors alone (from Table 2).
Table 4 shows values for the error correction rate, theshort-term impact of changes in the economy, and thelong-run multiplier effect of economic levels. Each pro-vides useful information about the relationship betweenthe economy and media content; see our discussion ofEquations (1) and (2) above. Consider first the model forthe number of articles dealing with the economy. Fromthe third column of Table 2, a one-unit upward change inleading indicators leads to a roughly 6.1-article decreasein the current month. (In practice, changes are typicallysmaller; the interquartile range for monthly changes inthe leading indicators series is –0.23 to +0.3.) This is theimmediate impact of a one-unit increase. There also isa long-term impact that alters the equilibrium level ofcoverage. We know this for two reasons: (1) The coef-ficient for the lagged level of leading economic indica-tors in Table 2 is statistically significant, and (2) leadingeconomic indicators is a nonstationary variable, mean-ing that changes to it are permanent and persist into thefuture (see Appendix B in the supporting information).The latter is important because an increase or a decreasecannot have a long-term effect if it does not last.
The long-term impact is not directly estimated inTable 2 and must be calculated from the coefficient(–1.91) for the lagged level of leading indicators as well asthe error correction parameter (–0.35). Simple divisionshows the impact to be 5.5 articles. The short-run impactthus exceeds the long-run impact by a small amount, andwe know from the error correction parameter that thedifference is corrected at a rate of 0.35 on average, thatis, about a third of the remaining disequilibrium eachmonth. The impact of the economy thus is immediateand fairly long-lasting, as nearly three-quarters of the
immediate effect (5.5 of 6.1) persists, influencing cover-age into the future.
Things are quite different for media tone. Herethe short-term impact of a one-unit change in leadingindicators is 0.16. (As the interquartile range for toneis 0.03 to 0.43, this is no small shift.) There is no reallong-term impact, however. The coefficient for laggedleading indicators is 0.006 and not statistically significant.This comes as little surprise, as time-series diagnosticsin Appendix B in the supporting information reveal thatchanges to tone are short-lived—indeed, less than 50%of a change in tone remains after a month, less than 25%the following month. Clearly, where tone is concerned,the impact of the economy occurs through short-termchanges; although sizable, the effects do not stand thetest of time.19 This is of consequence for our analysis ofpublic opinion, as we will see.
The Economy, the Media, and PublicSentiment
How does media content influence public economic sen-timent? Answering the question is not straightforward,as there is reason to suppose that public economic senti-ment influences media coverage itself. This may be truefor various reasons. Journalists may be representative ofthe broader population. They also may see themselvesas representatives, aiming to reflect public concerns be-cause it is the right thing to do. Of course, in a competitivemarketplace, they also have incentives to produce contentreflecting what consumers want.
Only a handful of studies have considered the possi-bility of bidirectional causality between media and opin-ion. Some find evidence of causality running in bothdirections. Indeed, Stevenson, Gonzenbach, and David
19Separate analyses using the unemployment rate reveal a similarpattern: short-term changes in economic conditions (particularlyfor unemployment) matter, whereas long-term levels do not. SeeAppendix C in the supporting information for further discussion;results are available upon request.
468 STUART N. SOROKA, DOMINIK A. STECULA, AND CHRISTOPHER WLEZIEN
TABLE 5 Tests of Causality
DV
Economic Media: Media:Evaluations Count Tone
Retrospective EvaluationsEconomic Evaluations — 5.854∗ 15.590∗∗∗
Leading Indicators .759 18.565∗∗∗ .416Media: Count .069 — 2.687Media: Tone 19.228∗∗∗ 1.267 —
Prospective EvaluationsEconomic Evaluations — 1.891 18.840∗∗∗
Leading Indicators 5.433∗ 33.693∗∗∗ 4.152∗
Media: Count 1.874 — .281Media: Tone 2.938a 1.818 —
Note: Cells contain chi-square values from tests of statistical sig-nificance, based on VAR models using a single lag of all variablesin levels.ap < .10, ∗p < .05, ∗∗p < .01, ∗∗∗p < .001.
(1994) find that public perceptions of the economy havea stronger effect on media coverage than coverage has onperceptions; Haller and Norpoth (1997) reach a similarconclusion; and Wu et al. (2002) find a more balanced, butclearly bidirectional, relationship. Another body of workpoints toward a simple unidirectional effect of media onopinion: Each of Fan (1993), Blood and Phillips (1995,1997), and Hollanders and Vliegenthart (2011) find thatmedia coverage Granger-causes economic perceptions,and not the other way around.
Is there evidence of bidirectional causality in our me-dia and opinion data? To begin with, Table 5 shows testsof Granger causality for four variables: sociotropic eco-nomic evaluations, and both media count and tone.20
The table contains estimates from vector autoregression(VAR) models, using a single lag of each variable, with allvariables measured in levels. The top panel shows resultsfor retrospective evaluations and the bottom panel resultsfor prospective evaluations.
Recall that we are mostly interested in the relation-ships between these evaluations and media coverage. The
20We do not include a model using leading economic indicators(LEIs) as the dependent variable. Those results suggest that toneand both retrospective and prospective evaluations cause leadingeconomic indicators, implying that the public and mass mediaeffectively anticipate leading economic indicators, or that the latteractually reflect the former. This is true even when our revisedLEI measure excludes consumer expectations. The possibility thatleading indicators are not exogenous to our other measures is, ofcourse, rather problematic. That said, we do not fully trust theseresults; because the leading indicator series is nonstationary, vectorautoregression results are problematic.
TABLE 6 Responsiveness of Media Coverage toEconomic Evaluations (and theEconomy)
DV
� in Count � in Tone
DVt−1 –.385∗∗∗ –.686∗∗∗
(.041) (.048)� LEIt –4.105∗ .097∗∗∗
(1.737) (.026)LEIt−1 –1.435∗∗∗ .002
(.383) (.005)� Retrospective Evaluationst –.275∗ .007∗∗∗
(.117) (.002)Retrospective Evaluationst−1 –.105∗∗ .002∗∗
(.040) (.001)� Prospective Evaluationst .103 .005a
(.165) (.002)Prospective Evaluationst−1 .104 .003a
(.108) (.002)Constant 27.511∗∗∗ .134∗∗∗
(3.167) (.023)N 380 380R-squared .223 .386
Note: Cells contain OLS coefficients with standard errors in paren-theses.ap < .10, ∗p < .05, ∗∗p < .01, ∗∗∗p < .001.
results do suggest the possibility of bidirectional causality,at least with respect to media tone. In each case, the con-tent of media coverage leads public opinion, but opinionleads coverage as well. This is especially true for retrospec-tive evaluations; for prospective assessments, the analysisimplies that causality runs primarily from the public tomedia coverage, as the impact of media on evaluation isnot highly reliable (p < .10). Of course, Granger tests of-fer limited information, particularly where we expect thatrelationships are current, not lagged. While these testsprovide some useful diagnostics, then, they cannot reallyresolve the issue of directionality in such circumstances.
That said, we can estimate ECMs of both opinion andmedia coverage that include the other potentially endoge-nous variable. For instance, current changes in opinioncan be modeled as a function of lagged opinion, currentchanges and lagged levels of media content, and currentchanges and lagged levels of leading indicators. The co-efficient for current changes in media content can tell uslittle about the effect of media on public opinion, as itmay be that it also captures the reciprocal effect of opin-ion on coverage. But the effect of lagged levels of media
IT’S (CHANGE IN) THE (FUTURE) ECONOMY, STUPID 469
TABLE 7 Responsiveness of Economic Evaluations to Media (and the Economy)
DV
� in Retrospective Evaluations � in Prospective Evaluations
DVt−1 –.082∗∗∗ –.081∗∗∗ –.241∗∗∗ –.241∗∗∗
(.017) (.017) (.031) (.031)� LEIt 3.836∗∗∗ 3.697∗∗∗ 1.214∗ 1.216a
(.843) (.846) (.617) (.619)LEIt−1 –.089 –.080 –.316∗∗ –.316∗∗
(.169) (.169) (.118) (.118)� Media Countt –.042 –.042 –.001 –.001
(.025) (.025) (.018) (.018)Media Countt−1 –.037 –.045∗ .016 .016
(.022) (.022) (.015) (.015)� Media Tonet 8.977∗∗∗ 8.672∗∗∗ 4.882∗∗∗ 4.887∗∗∗
(1.670) (1.677) (1.200) (1.206)Media Tonet−1 9.670∗∗∗ 4.464 4.200∗∗ 4.304
(1.890) (3.716) (1.377) (2.630)Interaction: Count × Tonet−1 .068 –.001
(.042) (.031)Constant .095 .844 .034 .017
(1.735) (1.791) (1.249) (1.303)N 380 380 380 380R-squared .231 .236 .180 .180
Note: Cells contain coefficients with standard errors in parentheses from OLS models.ap < .10, ∗p <.05 ∗∗p < .01, ∗∗∗p < .001.
content is likely more revealing about the effect of mediaon opinion. There is little basis for supposing that pre-vious coverage would be endogenous to current changesin opinion, after all; lagged levels of media content arelikely exogenous. The same is true for a model of mediacoverage that includes lagged opinion as a regressor. Us-ing these ECMs, then, we may be able to identify “true”lagged effects of media coverage on opinion, as well aslagged effects of opinion on media coverage.21
Table 6 shows results for ECMs of media content.Here changes in either the count or tone of media con-tent are regressed on (a) lagged levels of media content,(b) current changes and lagged levels of both retrospec-tive and prospective economic sentiment, and (c) currentchanges and lagged levels of leading indicators. As wehave already seen, media content reflects the state of theeconomy, primarily in current changes. Results in Table 6also suggest that economic evaluations may find their
21To be clear: note that although we estimate the effects of cur-rent changes in both equations, endogeneity means that we cannotconclude anything about the true nature of this concurrent re-lationship. But lagged levels, which are likely exogenous, can berevealing.
way into media content. Again, we only take seriouslythe lagged effects of public opinion, which presumablyare exogenous to current changes in tone. That the co-efficients for the lagged variables are meaningfully (andsignificantly) smaller than those for changes may indicatethat changes in public opinion actually are endogenous tochanges in media coverage. (In other words, endogeneitymay be inflating the coefficients relating the two concur-rently.) Regardless, these models make clear that laggedopinion may influence media content independent of theeconomy. And, importantly, it is retrospective evaluationsthat matter most.22 This is a useful reminder that mediacontent is not entirely driven by prospective features of theeconomy—recall results in Tables 2 and 3 showing me-dia responsiveness to coincident indicators as well. (Thatsaid, even retrospective evaluations respond in part toprospective economic trends, as we shall see below.)
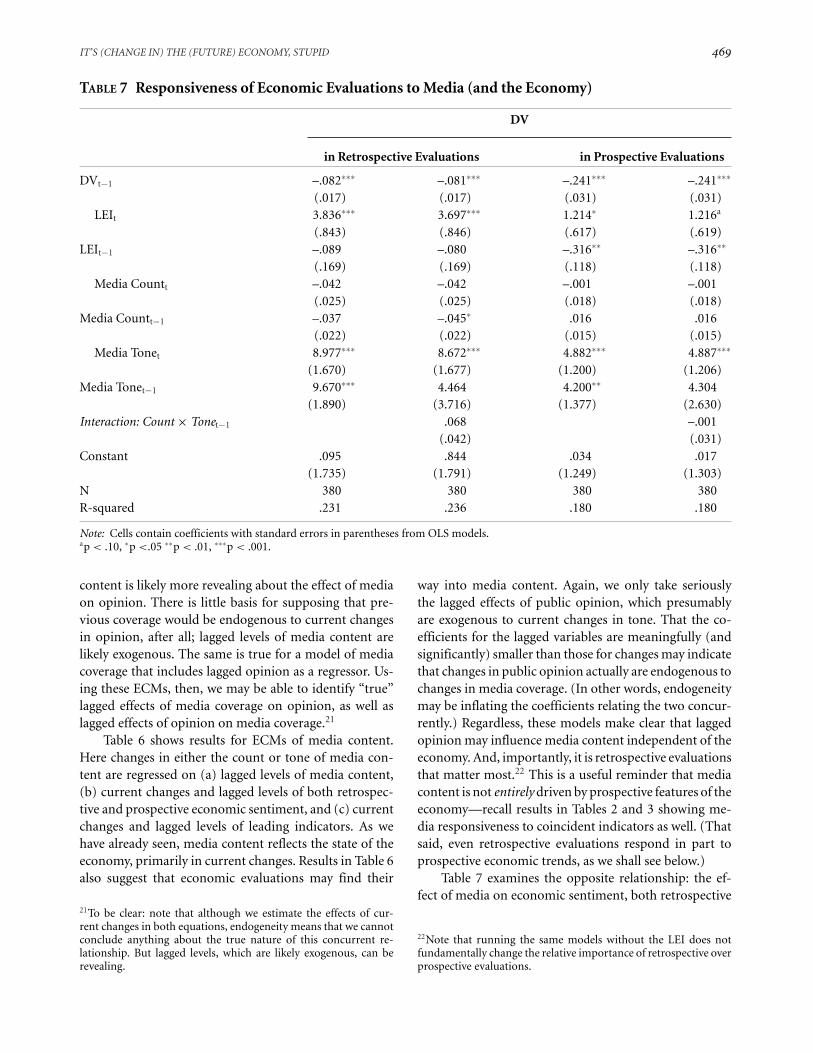
Table 7 examines the opposite relationship: the ef-fect of media on economic sentiment, both retrospective
22Note that running the same models without the LEI does notfundamentally change the relative importance of retrospective overprospective evaluations.
470 STUART N. SOROKA, DOMINIK A. STECULA, AND CHRISTOPHER WLEZIEN
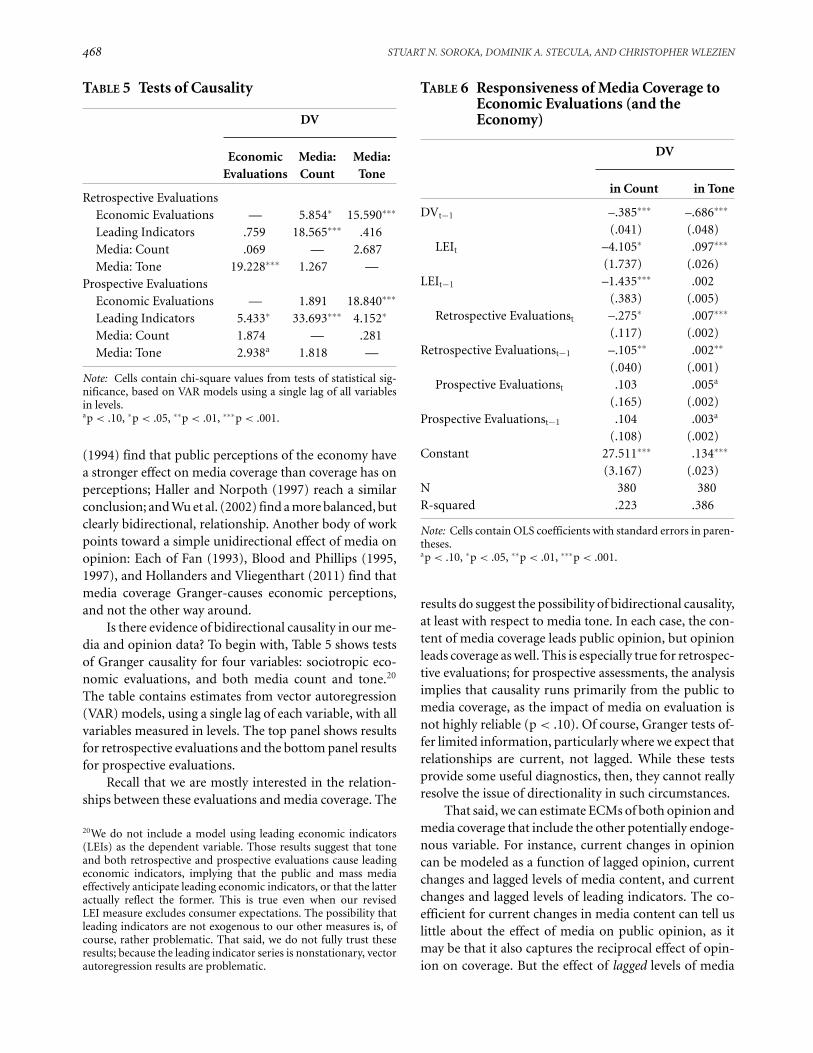
FIGURE 4 Leading Indicators and Media Tone during the Great Recession
and prospective. Changes in sentiment are regressed on(a) lagged levels of sentiment, (b) current changes andlagged levels of media content, and (c) current changesand lagged levels of leading indicators. A model also showsthe results of including an interaction between mediacount and tone, allowing for the possibility that the im-pact of tone increases alongside the volume of coverage.
Results suggest that economic sentiment is related toboth the actual economy and media coverage. Changes inleading economic indicators have a positive current effecton both retrospective and prospective assessments. In-terestingly, the effect of changes in these future-oriented
indicators is largest and most reliable for retrospections.Prospections are driven more by the level of leading indi-cators, which actually have a negative effect on prospec-tions; that is, as the future economy gets better, expecta-tions about the future get worse. This makes sense giventhat leading economic indicators point to comparativelyshort-run economic developments and that changes inthose indicators are most predictive of economic change(Wlezien and Erikson 1996). The effect largely comportswith what Katona (1972) found, specifically, that eco-nomic expectations are most optimistic when the level ofthe economy is at its worst.
IT’S (CHANGE IN) THE (FUTURE) ECONOMY, STUPID 471
Media coverage also matters for economic evalua-tions, almost entirely through tone. (Coefficients for bothtone and count change little when each is included inde-pendently, so we include just the complete model here.)The number of articles is not a statistically significant de-terminant, but the tone quite clearly is. Interacting countand tone, in the second models in Table 7, also addsnothing beyond what we get from tone on its own, thoughthe coefficient in the model of retrospective evaluationsdoes point in the expected direction (i.e., an increase inthe impact of tone when volume increases).
As in Table 6, the effects of current changes in Table 7tell us nothing about the impact of media coverage onopinion, but the effects of lagged levels do. That the coef-ficients for changes and levels in media tone are about thesame in each equation is suggestive about current effects,but we stop short of drawing this conclusion. All we cansurmise is that lagged levels of tone influence public eval-uations of the economy above and beyond the effects ofleading economic indicators. That said, the effect of toneis only temporary. This is because tone is a stationary vari-able, and so changes to it are themselves not permanent(see Appendix B in the supporting information and thediscussion surrounding Table 4). By definition, then, theimpact of tone on evaluations is significant, but it doesnot last.23
Discussion and Conclusions
Preceding sections have explored the nature of the rela-tionship between the economy, news coverage, and pub-lic sentiment. The analyses point to some interesting andimportant results. First, media content is more likely toreflect leading indicators than either coincident or laggingones. Second, it is current changes in those prospectiveconditions that matter most. So media content reflectsthe change in the future economy more than it reflectsthe level of economic conditions.
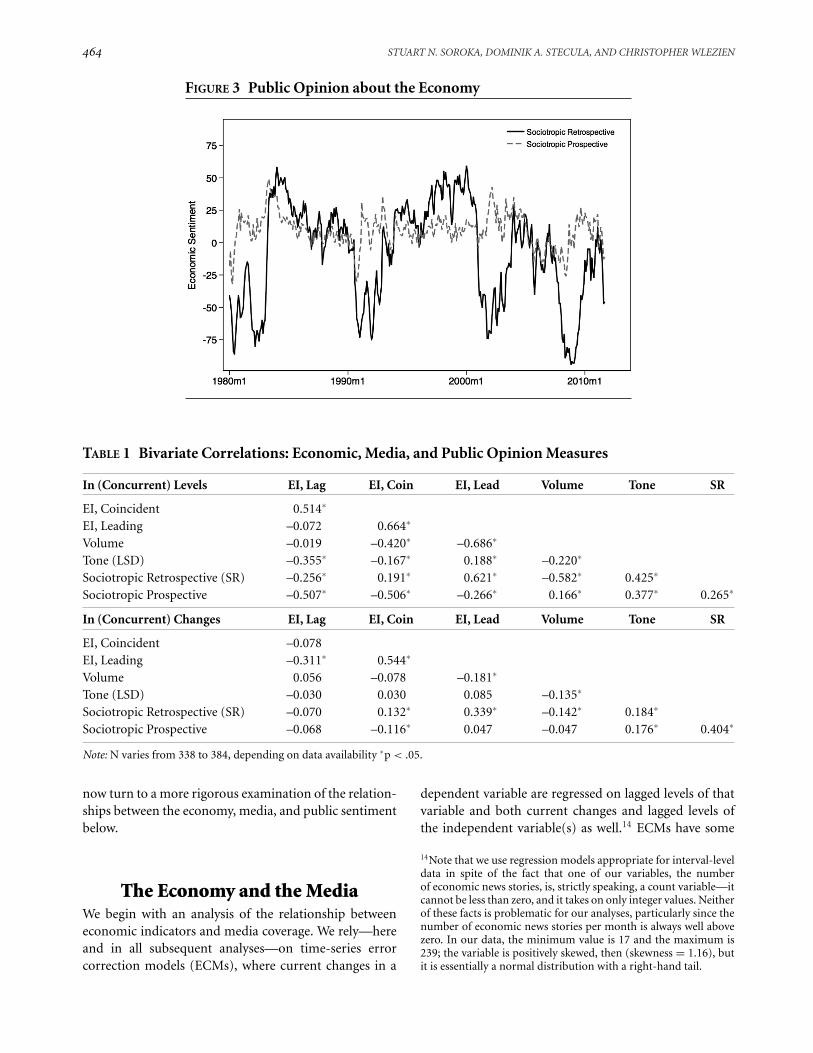
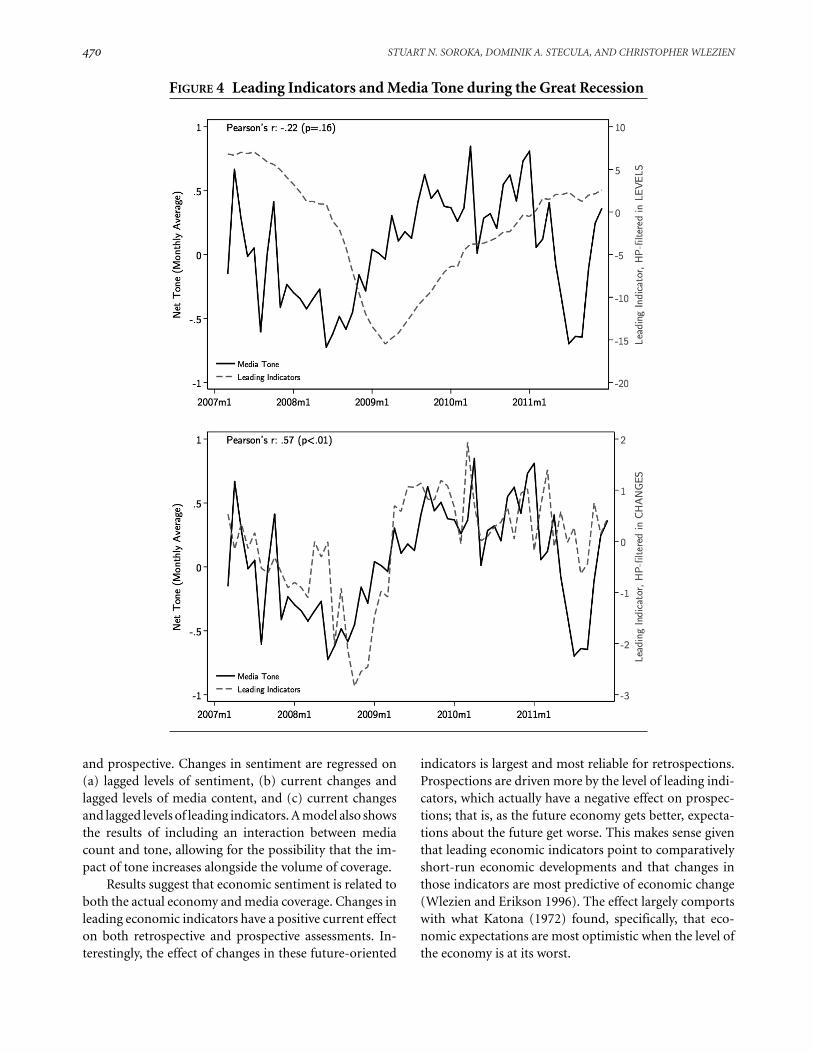
The Great Recession is illustrative. The top panel ofFigure 4 shows two lines: One is levels of the leading indi-cators series, and the other is media tone. Each is shownfrom 2007–2011 inclusive to the present, to highlight theperiod of the Great Recession. Most striking is the markedimprovement in media tone beginning in mid-2008, evenas the economy continued to decline.
This begs the question: Why does media content im-prove even as the economy continues to falter? The answer
23The negative effect of leading indicators on prospections, by con-trast, is long term. This is partially moderated by the effect of mediatone, which itself reflects leading indicators, as we saw in Tables 3and 6.
lies in the media focus on changes over levels. Considerthe link between media content and the economy illus-trated in the bottom panel of Figure 4. This figure is basedon exactly the same data. Here, however, leading indica-tors are shown not in levels, but in changes. The Pearson’scorrelation is 0.59; the two series are strongly related. Me-dia tone may not match well with levels of the economy,then, but it is powerfully connected to changes in thoseconditions.24 In the case of the recession, this meant animprovement in media tone even as the economy con-tinued to decline, that is, because the rate of economicdecline slowed.
This is not a finding peculiar to the recession, ofcourse—as previous analyses have demonstrated, theseresults hold even when we use a much longer time period(and also when we exclude the Great Recession). Mediacontent regularly reacts more to changes than to levelsof mainly prospective economic conditions. The findingis of real consequence for those interested in how thepublic reacts to economic information. Past work showsthat media content on economic issues matters, aboveand beyond the economy itself. Our analysis of both ret-rospective and prospective economic sentiment providesfurther evidence of this relationship. But if media mat-ter, and if media capture—mostly, at least—the tone ofchanges in the future economy, then we should expect tosee public opinion react not so much to what currently isgoing on in the economy, but what is likely to be going onsoon. This has implications for consumer behavior; it alsohas implications for economic voting and a wide range ofpolicy attitudes. It also may make more understandablethe tendency to reward politicians based on the magni-tude and direction of economic change, and especiallywhere the economy is going (e.g., Erikson, MacKuen, andStimson 2002).
The fact that media variables are statistically signif-icant predictors of public perceptions need not meanthat media coverage actually causes those perceptions. Itmay be that media measures just do a very good job ofcapturing the economy itself, better even than particulareconomic indicators. While we cannot readily distinguishthis possibility from direct media causality, we can (and
24Note that the figures show the relationship between levels of me-dia tone and economic indicators (in levels and changes), althoughthe ECMs focus on changes in media tone. A simple algebraicmanipulation—adding the lagged dependent variable to both sidesof the equation—produces a model in which the level of mediatone is a function of lagged tone and the change in the economy.Representing our results in terms of levels of media tone is thus un-problematic; the implication is that the magnitude of coefficientsin the ECM speaks not just to the relative weight of short-termchange and long-term levels in changes in the dependent variable,but in levels of that variable as well.
472 STUART N. SOROKA, DOMINIK A. STECULA, AND CHRISTOPHER WLEZIEN
do) assess the “mediation” of economic conditions andthe relationship(s) between media content and publicperceptions. This has been our objective here, thoughfuture work might consider carefully the degree to whichmedia move us closer to, or further away from, anaccurate assessment of the economy.
Future work might also examine the degree to whichthese findings are generalizable to other countries, othernews topics, and a wider variety of news sources. Oursuspicion is that the findings are broadly generalizable,but that there is some variation as well. Whether and theextent to which that is true remains to be seen.
References
Aalberg, Toril, Jesper Stromback, and Claes H. de Vreese. 2012.“The Framing of Politics as Strategy and Game: A Review ofConcepts, Operationalizations and Key Findings.” Journal-ism 13(2): 162–78.
Abramowitz, Alan I. 1988. “An Improved Model for PredictingPresidential Election Outcomes.” PS: Political Science andPolitics 21(4): 843–47.
Altheide, David L. 1997. “The News Media, the Problem Frame,and the Production of Fear.” The Sociological Quarterly38(4): 647–68.
Alvarez, Michael, and Jonathan Nagler. 1995. “Economics, Is-sues and the Perot Candidacy: Voter Choice in the 1992Presidential Election.” American Journal of Political Science39(3): 714–44.
Anderson, Christopher J., and Christopher Wlezien. 1997. “TheEconomics of Politics in Comparative Perspective Revised.”Political Behavior 19(1): 1–6.
Bartels, Larry, and John Zaller. 2001. “Presidential Vote Models:A Recount.” PS: Political Science and Politics 34: 9–20.
Bennett, W. Lance. 1997. “Cracking the News Code: Some RulesThat Journalists Live By.” In Do the Media Govern? Politi-cians, Voters, and Reporters in America, ed. Shanto Iyengarand Richard Reeves. Thousand Oaks, CA: Sage, 103–17.
Blood, Deborah J., and Peter C. B. Phillips. 1995. “RecessionHeadline News, Consumer Sentiment, the State of the Econ-omy and Presidential Popularity: A Time Series Analysis1989–1993.” International Journal of Public Opinion Research7(1): 2–22.
Blood, Deborah J., and Peter C. B. Phillips. 1997. “EconomicHeadline News on the Agenda: New Approaches to Un-derstanding Causes and Effects.” In Communication andDemocracy: Exploring the Intellectual Frontiers in Agenda-Setting Theory, ed. Maxwell McCombs, Donald L. Shaw,and David Weaver. Mahwah, NJ: Lawrence Erlbaum, 97–113.
Boomgaarden, Hajo G., Joost van Spanje, Rens Vliegenthart,and Claes H. de Vreese. 2011. “Covering the Crisis: MediaCoverage of the Economic Crisis and Citizens’ EconomicExpectations.” Acta Politica 46(4): 353–79.
Boykoff, Maxwell T., and Jules M. Boykoff. 2007. “ClimateChange and Journalistic Norms: A Case Study of U.S. MassMedia Coverage.” Geoforum 38(6): 1190–1204.
Campbell, James. 1996. “Polls and Votes: The Trial-Heat Presi-dential Election Forecasting Model, Certainty, and PoliticalCampaigns.” American Politics Research 24(4): 408–33.
Carroll, Christopher D. 2003. “Macroeconomic Expectations ofHouseholds and Professional Forecasters.” Quarterly Journalof Economics 118(1): 269–98.
Chappell, Henry, and William R. Keech. 1985. “A New View ofPolitical Accountability of Economic Performance.” Ameri-can Political Science Review 79(1): 10–27.
Clarke, Harold D., and Marianne C. Stewart. 1995. “EconomicEvaluations, Prime Ministerial Approval and GoverningParty Support: Rival Models Reconsidered.” British Journalof Political Science 25(2): 145–70.
Conference Board. 2001. Business Cycle Indicators Handbook.New York: Conference Board.
Davis, Richard. 1992. The Press and American Politics. New York:Longman.
De Boef, Suzanna, and Luke Keele. 2008. “Taking Time Seri-ously.” American Journal of Political Science 52(1): 184–200.
De Boef, Suzanna, and Paul Kellstedt. 2004. “The Political (andEconomic) Origins of Consumer Confidence.” AmericanJournal of Political Science 48(4): 933–49.
Doepke, Jorg, Jonas Dovern, Ulrich Fritsche, and Jirka Slacalek.2008. “The Dynamics of European Inflation Expectations.”B. E. Journal of Macroeconomics, 8(1): 1–23.
Doms, Mark, and Norman Morin. 2004. “Consumer Sentiment,the Economy, and the News Media.” Federal Reserve Boardof San Francisco Working Paper 2004-09.
Durr, Robert H. 1992. “An Essay on Cointegration and ErrorCorrection Models.” Political Analysis 4: 185–228.
Durr, Robert H. 1993. “What Moves Policy Sentiment?” Amer-ican Political Science Review 87(1): 158–70.
Erikson, Robert S. 1989. “Economic Conditions and the Presi-dential Vote.” American Political Science Review 83(2): 567–73.
Erikson, Robert S., Michael B. MacKuen, and James A. Stimson.2002. The Macro Polity. Cambridge: Cambridge UniversityPress.
Erikson, Robert S., and Christopher Wlezien. 2012. The Time-line of Presidential Elections. Chicago: University of ChicagoPress.
Fan, David. 1993. “Predictions of Consumer Confi-dence/Sentiment from the Press.” Presented at the annualmeeting of the American Association of Public Opinion Re-search.
Farnsworth, Stephen J., and S. Robert Lichter. 2006. The Medi-ated Presidency: Television News and Presidential Governance.Lanham, MD: Rowman and Littlefield.
Farnsworth, Stephen J., and S. Robert Lichter. 2011. “The Re-turn of the Honeymoon: Television News Coverage of NewPresidents, 1981–2009.” Presidential Studies Quarterly 41(3):590–603.
Fiorina, Morris. 1981. Retrospective Voting in American NationalElections. New Haven, CT: Yale University Press.
IT’S (CHANGE IN) THE (FUTURE) ECONOMY, STUPID 473
Fogarty, Brian J. 2005. “Determining Economic News Cover-age.” International Journal of Public Opinion Research 17(2):149–72.
Fuller, Jack. 2010. What Is Happening to News? The InformationExplosion and the Crisis in Journalism. Chicago: Universityof Chicago Press.
Glynn, Carroll J., Michael E. Huge, and Lindsay H. Hoffman.2008. “Did the Media Help Inflate the Housing Bubble?Media Coverage of Real Estate Markets in Times of Change.”Presented at the Association for Education in Journalism &Mass Communication Annual Conference.
Goidel, Kirby, Stephen Procopio, Dek Terrell, and H. DennisWu. 2010. “Sources of Economic News and Economic Ex-pectations.” American Politics Research 38(4): 759–77.
Happy, J. R. 1986. “Voter Sensitivity to Economic Conditions:A Canadian-American Comparison.” Comparative Politics19(1): 45–56.
Harrington, David E. 1989. ‘‘Economic News on Television: TheDeterminants of Coverage.’ Public Opinion Quarterly 53(1):566–74.
Haller, H. Brandon, and Helmut Norpoth. 1997 “Reality Bites:News Exposure and Economic Opinion.” Public OpinionQuarterly 61: 555–75.
Hetherington, Marc J. 1996. “The Media’s Role in FormingVoters’ National Economic Evaluations in 1992.” AmericanJournal of Political Science 40(2): 372–95.
Hibbs, Douglas A., Jr. 1987. The American Political Economy.Cambridge, MA: Harvard University Press.
Hodrick, Robert, and Edward C. Prescott. 1997. “Postwar U.S.Business Cycles: An Empirical Investigation.” Journal ofMoney, Credit, and Banking 29(1): 1–16.
Holbrook, Thomas. 1994. “Campaigns, National Conditions,and U.S. Presidential Elections.” American Journal of PoliticalScience 38(4): 973–98.
Hollanders, David, and Rens Vliegenthart. 2011. “The Influenceof Negative Newspaper Coverage on Consumer Confidence:The Dutch Case.” Journal of Economic Psychology 32(3): 367–73.
Jamieson, Kathleen Hall. 1992. Dirty Politics. New York: OxfordUniversity Press.
Katona, George. 1972. “Theory of Expectations.” In Human Be-havior and Economic Affairs, ed. Burkhard Strumpel, JamesN. Morgan, and Ernest Zahn. San Francisco, CA: Jossey-Bass,549–82.
Kayser, Mark A., and Christopher Wlezien. 2011. “PerformancePressure: Patterns of Partisanship and the Economic Vote.”European Journal of Political Research 50(3): 365–94.
Klein, Ezra. 2010. “Do News Media Spend Too Much Time onNews?” Washington Post, June 22. http://goo.gl/g1tWBK.
Kuklinski, James H., and Darrell M. West. 1981. “Economic Ex-pectations and Voting Behavior in United States House andSenate Elections.” American Political Science Review 75(2):436–47.
Lamla, Michael J., and Sarah M. Lein. 2008. “The Role of Me-dia for Consumers’ Inflation Expectation Formation.” KOFSwiss Economic Institute Working Paper 201.
Levanon, Gad, Ataman Ozyildirim, Brian Schaitkin, andJustyna Zabinska. 2011. “Comprehensive Benchmark Re-visions for the Conference Board Leading Economic Index
for the United States.” Conference Board Working PaperEPWP1106.
Lewis-Beck, Michael S. 1988a. Economics and Elections: TheMajor Western Democracies. Ann Arbor, MI: University ofMichigan Press.
Lewis-Beck, Michael S. 1988b. “Economics and the AmericanVoter: Past, Present, Future.” Political Behavior 19(1): 5–21.
Lewis-Beck, Michael S., and Mary Stegmaier. 2000. “EconomicDeterminants of Electoral Outcomes.” Annual Review of Po-litical Science 3: 183–219.
Lewis-Beck, Michael S., and Mary Stegmaier. 2007. “EconomicModels of Voting.” In The Oxford Handbook of Political Be-havior, ed. Russell Dalton and Hans-Dieter Klingemann.Oxford: Oxford University Press, 518–37.
Linn, Suzanna, Jonathan Nagler, and Marco A. Morales. 2010.“Economics, Elections, and Voting Behavior.” In The OxfordHandbook of American Elections and Political Behavior, ed.Jan E. Leighley. Oxford: Oxford University Press, 375–96.
Lipset, Seymour M. 1993. “The Significance of the 1992 Elec-tion.” PS: Political Science and Politics 26(1): 7–16.
Lockerbie, Brad. 1991. “Prospective Economic Voting in U.S.House Elections.” Legislative Studies Quarterly 16(2): 239–61.
MacKuen, Michael B., Robert S. Erikson, and James A. Stimson.1992. “Peasants or Bankers? The American Electorate andthe U.S. Economy.” American Political Science Review 86(3):597–611.
Matthews, J. Scott, Mark Pickup, and Fred Cutler. 2012. “TheMediated Horserace: Campaign Polls and Poll Reporting.”Canadian Journal of Political Science 45(2): 261–87.
Mazur, Allan. 2009. “American Generation of EnvironmentalWarnings: Avian Influenza and Global Warming.” HumanEcology Review 16(1): 17–26.
Mazur, Allan, and Linling Lee. 1993. “Sound the Global Alarm:Environmental Issues in the US National News.” Social Stud-ies of Science 23: 681–720.
Mazur, Allan, and Linling Lee. 2003. “Sounding the GlobalAlarm: Environmental Issues in the U.S. National News.”Social Studies of Science 23(4): 681–720.
McComas, Katherine, and James Shanahan. 1999. “Telling Sto-ries about Global Climate Change: Measuring the Impact ofNarratives on Issue Cycles.” Communication Research 26(1):30–57.
McCright, Aaron M., and Riley E. Dunlap. 2003. “Defeating Ky-oto: The Conservative Movement’s Impact on U.S. ClimateChange Policy.” Social Problems 50(3): 348–73.
Meyrowitz, Joshua. 1994. “The (Almost) Invisible Candidate:A Case Study of News Judgment as Political Censorship.” InControlling Broadcasting: Access Policy and Practice in NorthAmerica and Europe, ed. Meryl Aldridge and Nicholas He-witt. Manchester: Manchester University Press, 93–107.
Nadeau, Richard, Richard G. Neimi, and Timothy Amato. 1994.“Expectations and Preferences in British Elections.” Ameri-can Political Science Review 88(2): 371–383.
Nadeau, Richard, Richard G. Niemi, and Timothy Am-ato. 1996. “Prospective and Comparative or Retrospec-tive and Individual? Party Leaders and Party Support inGreat Britain.” British Journal of Political Science 26(2):245–58.
474 STUART N. SOROKA, DOMINIK A. STECULA, AND CHRISTOPHER WLEZIEN
Nadeau, Richard, Richard G. Niemi, David P. Fan, and TimothyAmato. 1999. “Elite Economic Forecasts, Economic News,Mass Economic Judgments, and Presidential Approval.”Journal of Politics 61(1): 109–35.
Patterson, Thomas. 1994. Out of Order. New York: Vintage.
Price, Simon, and David Sanders. 1993. “Modeling GovernmentPopularity in Postwar Britain: A Methodological Example.”American Journal of Political Science 37(1): 317–34.
Robinson, Michael, and Margaret Sheehan. 1983. Over the Wireand on TV. New York: Russell Sage Foundation.
Rogers, Mark. 1994. Handbook of Key Economic Indicators. NewYork: Richard Irwin.
Sanders, David. 1996. “Economic Performance, ManagementCompetence and the Outcome of the Next General Election.”Political Studies 44(2): 203–31.
Sanders, David. 1999. “Conservative Incompetence, Labour Re-sponsibility and the Feelgood Factor: Why the EconomyFailed to Save the Conservatives in 1997.” Electoral Studies19: 251–70.
Sanders, David. 2000. “The Real Economy and the PerceivedEconomy in the Popularity Functions: How Much Do VotersNeed to Know? A Study of British Data, 1974–97.” ElectoralStudies 19(2): 275–94.
Sanders, David, David Marsh, and Hugh Ward. 1993. “TheElectoral Impact of Press Coverage of the British Economy,1979–87.” British Journal of Political Science 23(2): 175–210.
Shah, Dhavan V., Mark D. Watts, David Domke, David P.Fan, and Michael Fibison. 1999. “News Coverage, EconomicCues, and the Public’s Presidential Preferences, 1984–1996.”Journal of Politics 61(4): 914–43.
Shoemaker, Pamela J., and Tim P. Vos. 2009. Gatekeeping The-ory. New York: Routledge.
Singer, Matthew M., and Ryan E. Carlin. 2013. “Context Counts:The Election Cycle, Development and the Nature of Eco-nomic Voting.” Journal of Politics 75(3): 730–42.
Skewes, E.A. 2007. Message Control: How News is Made on thePresidential Campaign Trail. Lanham, MD: Rowman andLittlefield.
Soroka, Stuart. 2006. “Good News and Bad News: Asymmet-ric Responses to Economic Information.” Journal of Politics68(2): 372–85.
Soroka, Stuart. 2012. “The Gatekeeping Function: Distributionsof Information in Media and the Real World.” Journal ofPolitics 74(2): 514–28.
Soroka, Stuart. 2014. Negativity in Democratic Politics: Causesand Consequences. Cambridge: Cambridge University Press.
Soroka, Stuart, Stephen Farnsworth, Lori Young, and AndreaLawlor. 2012. “Event-Driven Environmental News in theU.S. and Canada.” Electronic Media and Politics 1(10): 143–57.
Soroka, Stuart, and Christopher Wlezien. 2010. Degrees ofDemocracy: Politics, Public Opinion and Policy. Cambridge:Cambridge University Press.
Stevenson, Randolph T. 2001. “The Economy and Pol-icy Mood: A Fundamental Dynamic of Democratic
Politics?” American Journal of Political Science 45(3):620–33.
Stevenson, Robert L., William J. Gonzenbach, and Prabu David.1994. “Economic Recession and the News.” Mass Commu-nications Review 21: 4–19.
Stock, James H., and Mark W. Watson. 1989. “NewIndexes of Coincident and Leading Economic Indi-cators.” In NBER Macroeconomics Annual 1989, ed.Oliver Blanchard and Stanley Fischer. Cambridge, MA:MIT Press, 351–409.
Trumbo, Craig. 1995. “Longitudinal Modeling of Public Issues:An Application of the Agenda-Setting Process to the Issueof Global Warming.” Journalism and Mass CommunicationMonographs 152: 1–57.
Vaccara, Beatrice N., and Victor Zarnovitz. 1978. “Forecastingwith the Index of Leading Indicators.” NBER Working PaperNo. 244.
Van Der Brug, Wouter, Cees Van DerEijk, and Mark Franklin.2007. The Economy and the Vote: Economic Conditions andElections in Fifteen Countries. Cambridge: Cambridge Uni-versity Press.
Wlezien, Christopher. 1995. “The Public as Thermostat: Dy-namics of Preferences for Spending.” American Journal ofPolitical Science 39(4): 981–1000.
Wlezien, Christopher. 2005. “On the Salience of Political Is-sues: The Problem with ‘Most Important Problem’.” Elec-toral Studies 24(4): 555–79.
Wlezien, Christopher, and Robert S. Erikson. 1996. “Tempo-ral Horizons and Presidential Election Forecasts.” AmericanPolitics Research 24(4): 492–505.
Wood, B. Dan, Chris T. Owens, and Brandy M. Durham. 2005.“Presidential Rhetoric and the Economy.” Journal of Politics67(3): 627–45.
Wu, H. Dennis, Robert L. Stevenson, Hsiao-Chi Chen, and Z.Nuray Guner. 2002. “The Conditioned Impact of RecessionNews: A Time-Series Analysis of Economic Communicationin the United States, 1987–1996.” International Journal ofPublic Opinion Research 14(1): 19–36.
Young, Lori, and Stuart Soroka. 2012. “Affective News: TheAutomated Coding of Sentiment in Political Texts.” PoliticalCommunication 29(2): 205–31.
Supporting Information
Additional Supporting Information may be found in theonline version of this article at the publisher’s website:
Appendix A: Measuring Media ToneAppendix B: Tests of StationarityAppendix C: Measures of the Past, Present and FutureEconomyAppendix D: Past Studies of Media Coverage of theEconomy