ittizan (balanced fund) istiqrar (stable capital fund) ihfaz
TRANSCRIPT
ITTIZAN (BALANCED FUND)
ISTIQRAR (STABLE CAPITAL FUND)
IHFAZ (EQUITY INDEX FUND)
ITTIHAD (GROWTH FUND)
ISTIFAD (BLUE CHIPS FUND)
IRAD (DIVIDEND FUND)
IHSAN (BALANCED FUND)

This document provides detailed features, investment objectives, strategy and approach of the 7 Shariah-compliant funds and all other
important information that you will need to know regarding these investment funds.
1. ITTIZAN (BALANCED FUND)
2. ISTIQRAR (STABLE CAPITAL FUND)
3. IHFAZ (EQUITY INDEX FUND)
4. ITTIHAD (GROWTH FUND)
5. ISTIFAD (BLUE CHIPS FUND)
6. IRAD (DIVIDEND FUND)
7. IHSAN (BALANCED FUND)
The choice of funds should be based on, among others, your tolerance to risk. Please seek advice from your Takaful Financial
Consultants of the company on your tolerance to risk. For Ittizan and Istiqrar, the funds are no longer being offered for new
investment.
The above mentioned funds will be professionally managed by the Investment Division of Syarikat Takaful Malaysia Berhad. The
investment team comprises of a group of professional portfolio managers and investment research analysts who possess an average
of 15 years experience in fund management and has previously managed more than RM7 billion worth of funds.
Note: The selection of investible securities is conducted in a systematic manner where the investment process is governed by internal
policies. In addition to that, the systematic investment process is strictly guided by the Company’s Shariah Advisory Body to ensure
that the Shariah principles are not compromised in every investment decision made.
MARKET REVIEW & OUTLOOK
DECEMBER 2012
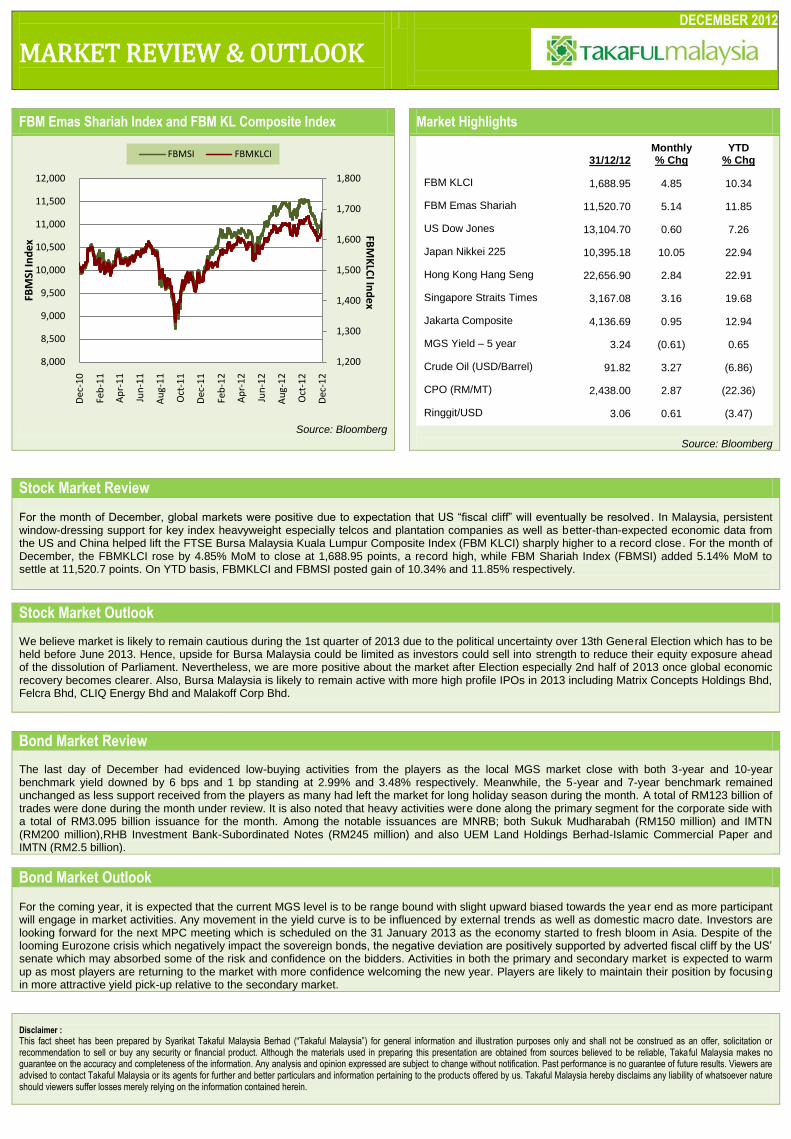
FBM Emas Shariah Index and FBM KL Composite Index Market Highlights
Source: Bloomberg
31/12/12
Monthly % Chg
YTD % Chg
FBM KLCI 1,688.95 4.85 10.34
FBM Emas Shariah 11,520.70 5.14 11.85
US Dow Jones 13,104.70 0.60 7.26
Japan Nikkei 225 10,395.18 10.05 22.94
Hong Kong Hang Seng 22,656.90 2.84 22.91
Singapore Straits Times 3,167.08 3.16 19.68
Jakarta Composite 4,136.69 0.95 12.94
MGS Yield – 5 year 3.24 (0.61) 0.65
Crude Oil (USD/Barrel) 91.82 3.27 (6.86)
CPO (RM/MT) 2,438.00 2.87 (22.36)
Ringgit/USD 3.06 0.61 (3.47)
Source: Bloomberg
Stock Market Review For the month of December, global markets were positive due to expectation that US “fiscal cliff” will eventually be resolved . In Malaysia, persistent window-dressing support for key index heavyweight especially telcos and plantation companies as well as better-than-expected economic data from the US and China helped lift the FTSE Bursa Malaysia Kuala Lumpur Composite Index (FBM KLCI) sharply higher to a record close. For the month of December, the FBMKLCI rose by 4.85% MoM to close at 1,688.95 points, a record high, while FBM Shariah Index (FBMSI) added 5.14% MoM to settle at 11,520.7 points. On YTD basis, FBMKLCI and FBMSI posted gain of 10.34% and 11.85% respectively.
Stock Market Outlook
We believe market is likely to remain cautious during the 1st quarter of 2013 due to the political uncertainty over 13th General Election which has to be held before June 2013. Hence, upside for Bursa Malaysia could be limited as investors could sell into strength to reduce their equity exposure ahead of the dissolution of Parliament. Nevertheless, we are more positive about the market after Election especially 2nd half of 2013 once global economic recovery becomes clearer. Also, Bursa Malaysia is likely to remain active with more high profile IPOs in 2013 including Matrix Concepts Holdings Bhd, Felcra Bhd, CLIQ Energy Bhd and Malakoff Corp Bhd.
Bond Market Review
The last day of December had evidenced low-buying activities from the players as the local MGS market close with both 3-year and 10-year benchmark yield downed by 6 bps and 1 bp standing at 2.99% and 3.48% respectively. Meanwhile, the 5-year and 7-year benchmark remained unchanged as less support received from the players as many had left the market for long holiday season during the month. A total of RM123 billion of trades were done during the month under review. It is also noted that heavy activities were done along the primary segment for the corporate side with a total of RM3.095 billion issuance for the month. Among the notable issuances are MNRB; both Sukuk Mudharabah (RM150 million) and IMTN (RM200 million),RHB Investment Bank-Subordinated Notes (RM245 million) and also UEM Land Holdings Berhad-Islamic Commercial Paper and IMTN (RM2.5 billion).
Bond Market Outlook For the coming year, it is expected that the current MGS level is to be range bound with slight upward biased towards the year end as more participant will engage in market activities. Any movement in the yield curve is to be influenced by external trends as well as domestic macro date. Investors are looking forward for the next MPC meeting which is scheduled on the 31 January 2013 as the economy started to fresh bloom in Asia. Despite of the looming Eurozone crisis which negatively impact the sovereign bonds, the negative deviation are positively supported by adverted fiscal cliff by the US‟ senate which may absorbed some of the risk and confidence on the bidders. Activities in both the primary and secondary market is expected to warm up as most players are returning to the market with more confidence welcoming the new year. Players are likely to maintain their position by focusing in more attractive yield pick-up relative to the secondary market.
Disclaimer :
This fact sheet has been prepared by Syarikat Takaful Malaysia Berhad (“Takaful Malaysia”) for general information and illustration purposes only and shall not be construed as an offer, solicitation or recommendation to sell or buy any security or financial product. Although the materials used in preparing this presentation are obtained from sources believed to be reliable, Takaful Malaysia makes no guarantee on the accuracy and completeness of the information. Any analysis and opinion expressed are subject to change without notification. Past performance is no guarantee of future results. Viewers are advised to contact Takaful Malaysia or its agents for further and better particulars and information pertaining to the products offered by us. Takaful Malaysia hereby disclaims any liability of whatsoever nature should viewers suffer losses merely relying on the information contained herein.
1,200
1,300
1,400
1,500
1,600
1,700
1,800
8,000
8,500
9,000
9,500
10,000
10,500
11,000
11,500
12,000
Dec
-10
Feb
-11
Ap
r-1
1
Jun
-11
Au
g-1
1
Oct
-11
Dec
-11
Feb
-12
Ap
r-1
2
Jun
-12
Au
g-1
2
Oct
-12
Dec
-12
FBM
SI In
de
x
FBMSI FBMKLCI
FBM
KLC
I Ind
ex
ITTIZAN (Balanced Fund)
DECEMBER 2012
Investment Objective To achieve reasonable returns and capital growth opportunities through selected investment in Shariah approved shares listed in Bursa Malaysia and Shariah compliant Islamic debt securities.
Investment Strategy Invest in a balanced asset allocation comprising of Shariah compliant equities and Islamic debt securities.
Asset Allocation Equity : 30% - 70% Sukuk/Cash : 30% - 70%
Fund Manager Investment Division of Syarikat Takaful Malaysia Berhad
Performance Benchmark Combination of
70% FBM Emas Shariah Index (FBMSI)
30% one-month return Maybank General Investment Account Rate (GIA)(source: FBMSI from Bloomberg, GIA from Maybank)
Fees & Charges Fund management fee
Max 1.5% of fund‟s NAV per annum
Custodian fee 0.03% of fund‟s NAV per annum
Risk Profile Moderate As the Fund‟s investment involved marketable securities such as stocks and Islamic debt securities (IDS)/sukuk, the investors should be prepared to accept some interim price volatility. Investment in IDS carries some risks such as changes in interest rate and credit rating of the issuer. An increase in interest rate or downgrading of credit rating of the issuer would result to the fall in bond prices; hence impacted the performance of the Fund. The key risks for this Fund are market risk, interest rate risk, credit/default risk, specific security risk, liquidity risk, operational risk, reclassification of Shariah status risk. Please refer to Appendix 1 for further details.
Risk Management Proper asset allocation, diversification and liquidity management are among the methods can be adopted by the Fund Manager to manage the Fund risks. If there is high possibility that the equity market may fall, the exposure in equity investment would be reduced to a lower level and vice versa. In managing the investment risks for IDS, the Fund Manager will adopt extensive research and analysis on the issuer, credit rating, maturity factor, liquidity and selected yield measures. The Fund Manager will also constantly monitor the macro economic factors that may impact the interest rate environment.
Target Market The fund is no longer being offered for new investment.
Basis & Frequency of Unit Valuation Please refer to Appendix 2.
Exceptional Circumstances Please refer to Appendix 2.
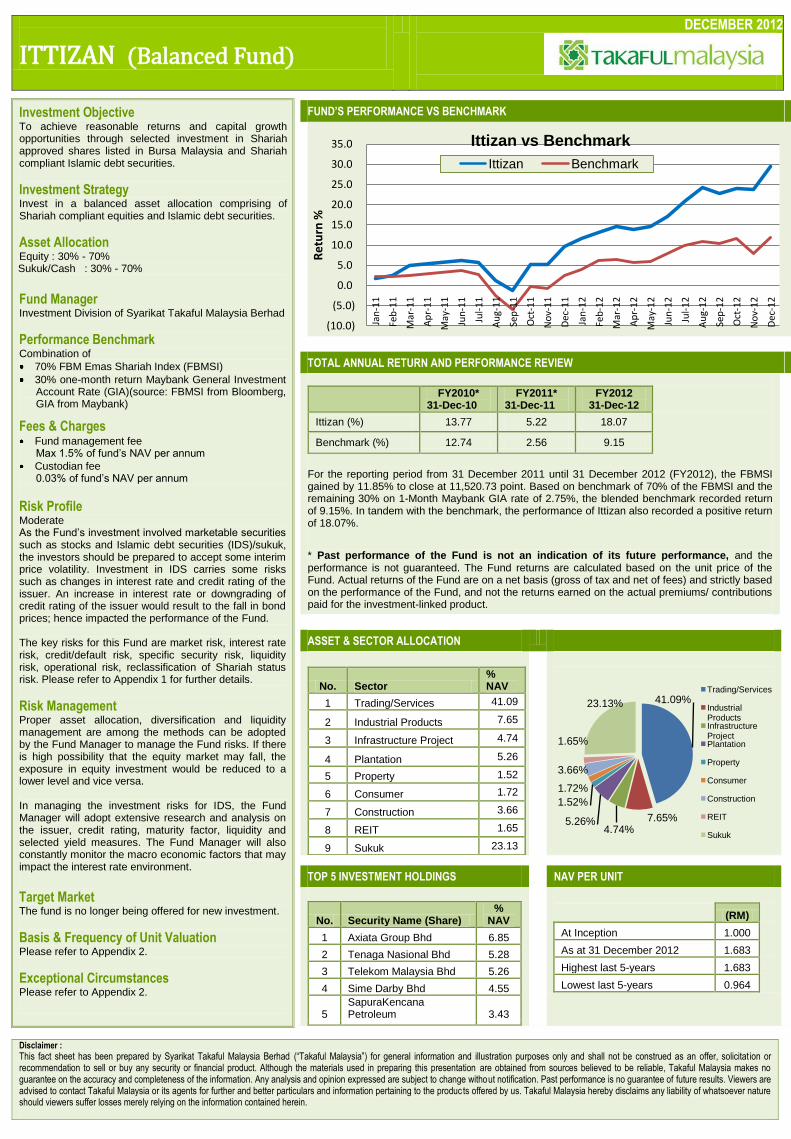
FUND’S PERFORMANCE VS BENCHMARK
TOTAL ANNUAL RETURN AND PERFORMANCE REVIEW
FY2010*
31-Dec-10 FY2011*
31-Dec-11 FY2012
31-Dec-12
Ittizan (%) 13.77 5.22 18.07
Benchmark (%) 12.74 2.56 9.15
For the reporting period from 31 December 2011 until 31 December 2012 (FY2012), the FBMSI gained by 11.85% to close at 11,520.73 point. Based on benchmark of 70% of the FBMSI and the remaining 30% on 1-Month Maybank GIA rate of 2.75%, the blended benchmark recorded return of 9.15%. In tandem with the benchmark, the performance of Ittizan also recorded a positive return of 18.07%.
* Past performance of the Fund is not an indication of its future performance, and the performance is not guaranteed. The Fund returns are calculated based on the unit price of the Fund. Actual returns of the Fund are on a net basis (gross of tax and net of fees) and strictly based on the performance of the Fund, and not the returns earned on the actual premiums/ contributions paid for the investment-linked product.
ASSET & SECTOR ALLOCATION
No. Sector % NAV
1 Trading/Services 41.09
2 Industrial Products 7.65
3 Infrastructure Project 4.74
4 Plantation 5.26
5 Property 1.52
6 Consumer 1.72
7 Construction 3.66
8 REIT 1.65
9 Sukuk 23.13
TOP 5 INVESTMENT HOLDINGS NAV PER UNIT
No. Security Name (Share) %
NAV
1 Axiata Group Bhd 6.85
2 Tenaga Nasional Bhd 5.28
3 Telekom Malaysia Bhd 5.26
4 Sime Darby Bhd 4.55
5 SapuraKencana Petroleum 3.43
(RM)
At Inception 1.000
As at 31 December 2012 1.683
Highest last 5-years 1.683
Lowest last 5-years 0.964
Fund’s Performance vs Benchmark
Disclaimer :
This fact sheet has been prepared by Syarikat Takaful Malaysia Berhad (“Takaful Malaysia”) for general information and illustration purposes only and shall not be construed as an offer, solicitat ion or recommendation to sell or buy any security or financial product. Although the materials used in preparing this presentation are obtained from sources believed to be reliable, Takaful Malaysia makes no guarantee on the accuracy and completeness of the information. Any analysis and opinion expressed are subject to change without notification. Past performance is no guarantee of future results. Viewers are advised to contact Takaful Malaysia or its agents for further and better particulars and information pertaining to the products offered by us. Takaful Malaysia hereby disclaims any liability of whatsoever nature should viewers suffer losses merely relying on the information contained herein.
(10.0)
(5.0)
0.0
5.0
10.0
15.0
20.0
25.0
30.0
35.0
Jan
-11
Feb
-11
Mar
-11
Ap
r-1
1
May
-11
Jun
-11
Jul-
11
Au
g-1
1
Sep
-11
Oct
-11
No
v-1
1
Dec
-11
Jan
-12
Feb
-12
Mar
-12
Ap
r-1
2
May
-12
Jun
-12
Jul-
12
Au
g-1
2
Sep
-12
Oct
-12
No
v-1
2
Dec
-12
Re
turn
%
Ittizan vs Benchmark
Ittizan Benchmark
41.09%
7.65%4.74%
5.26%
1.52%
1.72%
3.66%
1.65%
23.13%
Trading/Services
Industrial ProductsInfrastructure Project Plantation
Property
Consumer
Construction
REIT
Sukuk
ISTIQRAR (Stable Capital Fund)
DECEMBER 2012
Investment Objective To achieve relatively stable pattern of investment returns over medium term trough selected investment in Shariah approved shares listed in Bursa Malaysia and Shariah-compliant fixed income securities.
Investment Strategy Invest in a balanced asset allocation comprising mainly in Islamic debt securities with smaller exposure in Shariah-compliant equity.
Asset Allocation Equity : up to 35% Sukuk/Cash : 65% - 100%
Fund Manager Investment Division of Syarikat Takaful Malaysia Berhad
Performance Benchmark Combination of
30% FBM Emas Shariah Index (FBMSI)
70% one-month return Maybank General Investment Account Rate (GIA)
(source: FBMSI from Bloomberg, GIA from Maybank)
Fees & Charges Fund management fee
Max 1.5% of fund‟s NAV per annum
Custodian fee 0.03% of fund‟s NAV per annum
Risk Profile Low As the Fund‟s investment involved marketable securities such as stocks and Islamic debt securities (IDS)/sukuk, the investors should be prepared to accept some interim price volatility. Investment in IDS carries some risks such as changes in interest rate and credit rating of the issuer. An increase in interest rate or downgrading of credit rating of the issuer would result to the fall in bond prices; hence the impacted performance of the Fund. The key risks for this Fund are market risk, interest rate risk, credit/default risk, specific security risk, liquidity risk, operational risk, reclassification of Shariah status risk. Please refer to Appendix 1 for further details.
Risk Management Proper asset allocation, diversification and liquidity management are among the methods can be adopted by the Fund Manager to manage the Fund risks. If there is high possibility that the equity market may fall, the exposure in equity investment would be reduced to a lower level and vice versa. In managing the investment risks for IDS, the Fund Manager will adopt extensive research and analysis on the issuer, credit rating, maturity factor, liquidity and selected yield measures. The Fund Manager will also constantly monitor the macro economic factors that may impact the interest rate environment.
Target Market The fund is no longer being offered for new investment.
Basis & Frequency of Unit Valuation Please refer to Appendix 2.
Exceptional Circumstances Please refer to Appendix 2.
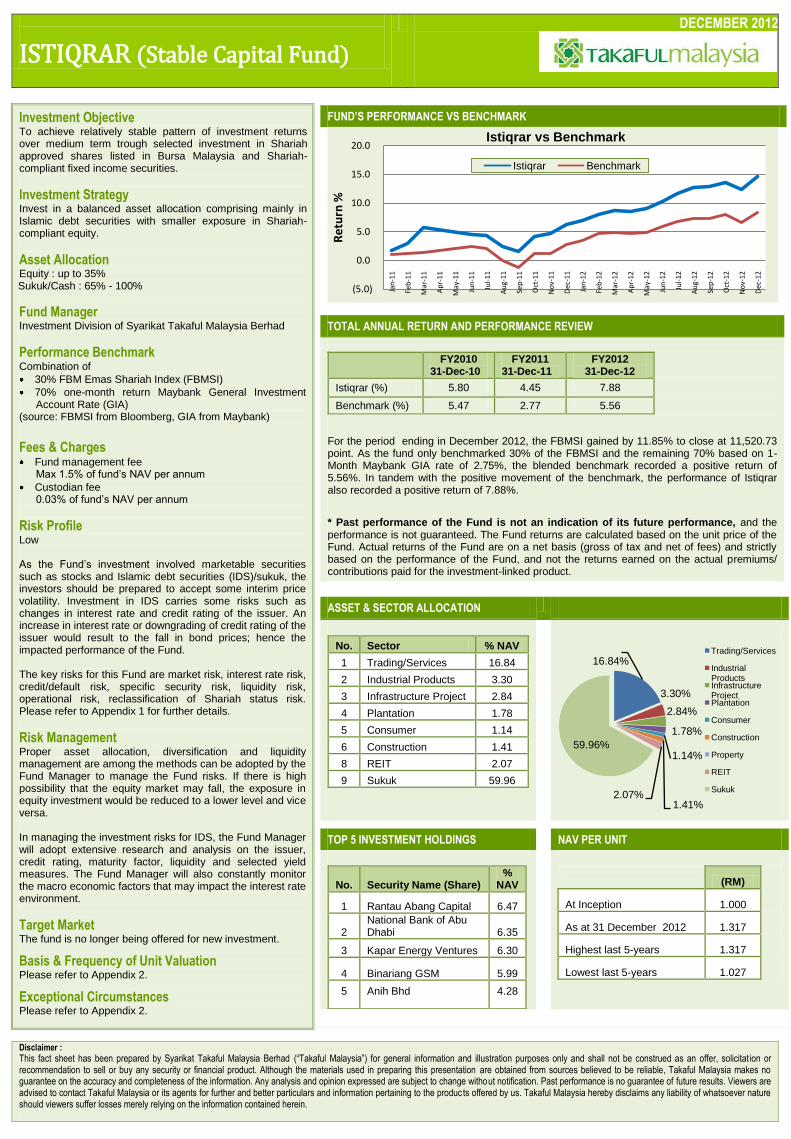
FUND’S PERFORMANCE VS BENCHMARK
TOTAL ANNUAL RETURN AND PERFORMANCE REVIEW
FY2010
31-Dec-10 FY2011
31-Dec-11 FY2012
31-Dec-12
Istiqrar (%) 5.80 4.45 7.88
Benchmark (%) 5.47 2.77 5.56
For the period ending in December 2012, the FBMSI gained by 11.85% to close at 11,520.73 point. As the fund only benchmarked 30% of the FBMSI and the remaining 70% based on 1-Month Maybank GIA rate of 2.75%, the blended benchmark recorded a positive return of 5.56%. In tandem with the positive movement of the benchmark, the performance of Istiqrar also recorded a positive return of 7.88%.
* Past performance of the Fund is not an indication of its future performance, and the performance is not guaranteed. The Fund returns are calculated based on the unit price of the Fund. Actual returns of the Fund are on a net basis (gross of tax and net of fees) and strictly based on the performance of the Fund, and not the returns earned on the actual premiums/ contributions paid for the investment-linked product.
ASSET & SECTOR ALLOCATION
No. Sector % NAV
1 Trading/Services 16.84
2 Industrial Products 3.30
3 Infrastructure Project 2.84
4 Plantation 1.78
5 Consumer 1.14
6 Construction 1.41
8 REIT 2.07
9 Sukuk 59.96
TOP 5 INVESTMENT HOLDINGS NAV PER UNIT
No. Security Name (Share) %
NAV
1 Rantau Abang Capital 6.47
2 National Bank of Abu Dhabi 6.35
3 Kapar Energy Ventures 6.30
4 Binariang GSM 5.99
5 Anih Bhd 4.28
(RM)
At Inception 1.000
As at 31 December 2012 1.317
Highest last 5-years 1.317
Lowest last 5-years 1.027
Fund’s Performance vs Benchmark
Disclaimer :
This fact sheet has been prepared by Syarikat Takaful Malaysia Berhad (“Takaful Malaysia”) for general information and illustration purposes only and shall not be construed as an offer, solicitat ion or recommendation to sell or buy any security or financial product. Although the materials used in preparing this presentation are obtained from sources believed to be reliable, Takaful Malaysia makes no guarantee on the accuracy and completeness of the information. Any analysis and opinion expressed are subject to change without notification. Past performance is no guarantee of future results. Viewers are advised to contact Takaful Malaysia or its agents for further and better particulars and information pertaining to the products offered by us. Takaful Malaysia hereby disclaims any liability of whatsoever nature should viewers suffer losses merely relying on the information contained herein.
(5.0)
0.0
5.0
10.0
15.0
20.0
Jan
-11
Feb
-11
Mar
-11
Ap
r-11
May
-11
Jun
-11
Jul-
11
Au
g-11
Sep
-11
Oct
-11
No
v-1
1
Dec
-11
Jan
-12
Feb
-12
Mar
-12
Ap
r-12
May
-12
Jun
-12
Jul-
12
Au
g-12
Sep
-12
Oct
-12
No
v-1
2
Dec
-12
Re
turn
%
Istiqrar vs Benchmark
Istiqrar Benchmark
16.84%
3.30%
2.84%
1.78%
1.14%
1.41%2.07%
59.96%
Trading/Services
Industrial ProductsInfrastructure Project Plantation
Consumer
Construction
Property
REIT
Sukuk
IHFAZ (Equity Index Fund)
DECEMBER 2012
Investment Objective To achieve returns that tracks the performance of FBM Emas Shariah Index.
Investment Strategy Invest mainly in the top of the Index component stocks; closely tracking the movement of the Benchmark in the medium to long term;
Constant rebalancing of the component stocks to closely track the benchmark performance.
Asset Allocation Equity : 90% - 95% Money Market : 5% - 10%
Fund Manager Investment Division of Syarikat Takaful Malaysia Berhad
Performance Benchmark FBM Emas Shariah Index (FBMSI) (source : Bloomberg)
Fees & Charges Fund management fee
1.0% - 1.5% of fund‟s NAV per annum
Custodian fee 0.03% of fund‟s NAV per annum
Risk Profile Moderate As the Fund‟s stock investment consist of the top forty of the index component stocks which including blue chip and growth stocks, the investors should be prepared to accept some interim price volatility with possibility of a severe downturn in the equity markets. The key risks for this Fund are market risk, specific security risk, liquidity risk, operational risk, reclassification of Shariah status risk. Please refer to Appendix 1 for further details.
Risk Management Proper asset allocation, diversification and liquidity management are among the methods can be adopted by the Fund Manager to manage the Fund risks such as market risk, specific security risk and liquidity risk. If there is high possibility that the equity market may fall, the exposure in equity investment would be reduced to a lower level and vice versa. The Fund Manager will also adopt a prudent investment selection process by investing in selected stock universe after undergoing some screening process.
Target Market Customers who prefer moderate risk investment profile with a moderate expected return.
Basis & Frequency of Unit Valuation Please refer to Appendix 2.
Exceptional Circumstances Please refer to Appendix 2.
Tracking Error (TE) TE is a measure of the deviation from the benchmark. It measures of how closely a portfolio follows the index to which it is benchmark. The closer its track the benchmark, the lesser is the amount of TE.
FUND’S PERFORMANCE VS BENCHMARK
TOTAL ANNUAL RETURN AND PERFORMANCE REVIEW
Indices FY2010
31-Dec-10 FY2011
31-Dec-11 FY2012
31-Dec-12
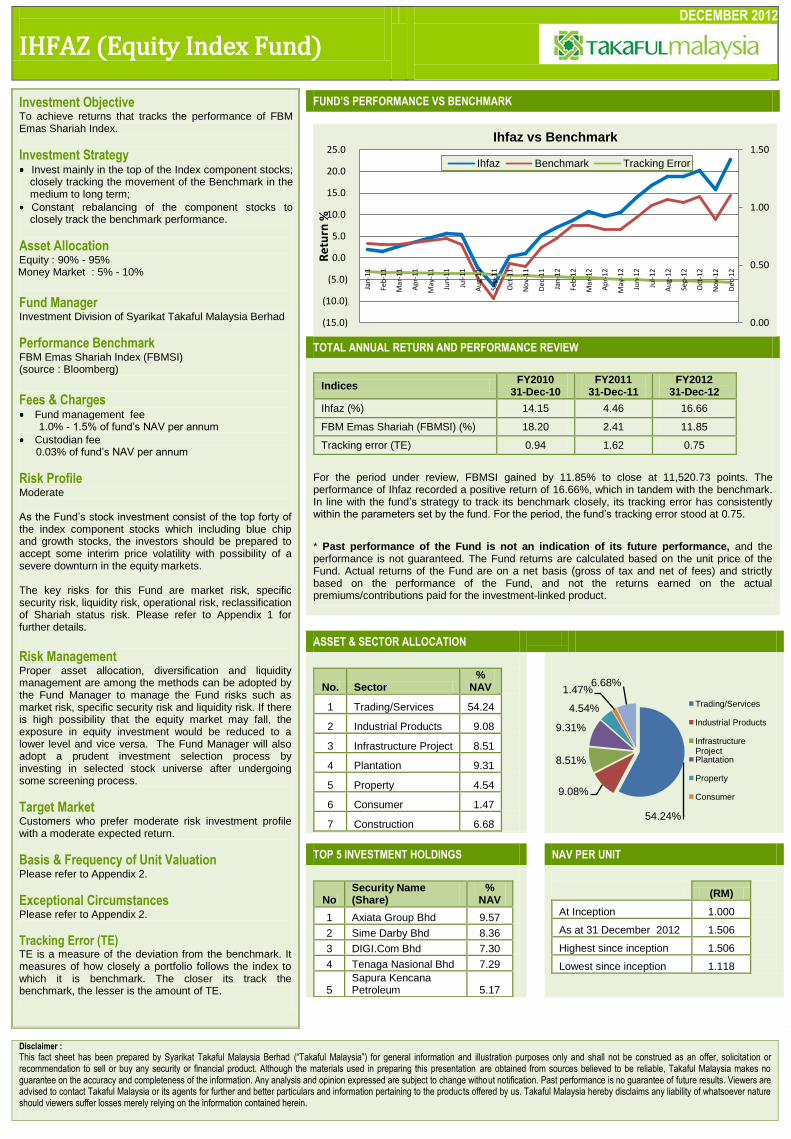
Ihfaz (%) 14.15 4.46 16.66
FBM Emas Shariah (FBMSI) (%) 18.20 2.41 11.85
Tracking error (TE) 0.94 1.62 0.75
For the period under review, FBMSI gained by 11.85% to close at 11,520.73 points. The performance of Ihfaz recorded a positive return of 16.66%, which in tandem with the benchmark. In line with the fund‟s strategy to track its benchmark closely, its tracking error has consistently within the parameters set by the fund. For the period, the fund‟s tracking error stood at 0.75.
* Past performance of the Fund is not an indication of its future performance, and the performance is not guaranteed. The Fund returns are calculated based on the unit price of the Fund. Actual returns of the Fund are on a net basis (gross of tax and net of fees) and strictly based on the performance of the Fund, and not the returns earned on the actual premiums/contributions paid for the investment-linked product.
ASSET & SECTOR ALLOCATION
No. Sector %
NAV
1 Trading/Services 54.24
2 Industrial Products 9.08
3 Infrastructure Project 8.51
4 Plantation 9.31
5 Property 4.54
6 Consumer 1.47
7 Construction 6.68
TOP 5 INVESTMENT HOLDINGS NAV PER UNIT
No Security Name (Share)
% NAV
1 Axiata Group Bhd 9.57
2 Sime Darby Bhd 8.36
3 DIGI.Com Bhd 7.30
4 Tenaga Nasional Bhd 7.29
5 Sapura Kencana Petroleum 5.17
(RM)
At Inception 1.000
As at 31 December 2012 1.506
Highest since inception 1.506
Lowest since inception 1.118
Fund’s Performance vs Benchmark
Disclaimer :
This fact sheet has been prepared by Syarikat Takaful Malaysia Berhad (“Takaful Malaysia”) for general information and illustration purposes only and shall not be construed as an offer, solicitat ion or recommendation to sell or buy any security or financial product. Although the materials used in preparing this presentation are obtained from sources believed to be reliable, Takaful Malaysia makes no guarantee on the accuracy and completeness of the information. Any analysis and opinion expressed are subject to change without notification. Past performance is no guarantee of future results. Viewers are advised to contact Takaful Malaysia or its agents for further and better particulars and information pertaining to the products offered by us. Takaful Malaysia hereby disclaims any liability of whatsoever nature should viewers suffer losses merely relying on the information contained herein.
0.00
0.50
1.00
1.50
(15.0)
(10.0)
(5.0)
0.0
5.0
10.0
15.0
20.0
25.0
Jan
-11
Feb
-11
Mar
-11
Ap
r-11
May
-11
Jun
-11
Jul-
11
Au
g-11
Sep
-11
Oct
-11
No
v-11
Dec
-11
Jan
-12
Feb
-12
Mar
-12
Ap
r-12
May
-12
Jun
-12
Jul-
12
Au
g-12
Sep
-12
Oct
-12
No
v-12
Dec
-12
Re
turn
%
Ihfaz vs Benchmark
Ihfaz Benchmark Tracking Error
54.24%
9.08%
8.51%
9.31%
4.54%
1.47%6.68%
Trading/Services
Industrial Products
Infrastructure Project Plantation
Property
Consumer
-15.0
-10.0
-5.0
0.0
5.0
10.0
Re
turn
(%
)
Ihfaz vs Benchmark and Tracking Error
Ihfaz Benchmark Tracking Error
ITTIHAD (Growth Fund)
DECEMBER 2012
™
Investment Objective To achieve capital growth opportunities and dividend income through selective investments in Shariah approved shares listed in Bursa Malaysia.
Investment Strategy Invest primarily in selected Shariah compliant equities that comprise of a diversified portfolio of index-linked companies, blue-chip stocks and companies with growth prospects and attractive dividend yields that are listed on Bursa Malaysia;
Active portfolio management - constant review on asset allocation and stocks holding. Stock/portfolio turnover would be practically high in search for opportunities in capital gain and dividend yield stocks.
Asset Allocation Equity : 50% - 95% Cash/Sukuk : 5% - 50%
Fund Manager Investment Division of Syarikat Takaful Malaysia Berhad
Performance Benchmark FBM Emas Shariah Index (FBMSI) (source : Bloomberg)
Fees & Charges Fund management fee
1.0% - 1.5% of fund‟s NAV per annum
Custodian fee 0.03% of fund‟s NAV per annum
Risk Profile High Since the fund investment also consist of growth stocks which are normally more volatile in prices as compared to blue chips and high dividend yield stocks, the investors should be prepared to accept some interim price volatility, of which sometimes can be significant to achieve that higher return. The key risks for this Fund are market risk, specific security risk, interest rate risk, credit/default risk, liquidity risk, operational risk, reclassification of Shariah status risk. Please refer to Appendix 1 for further details.
Risk Management Proper asset allocation, diversification and liquidity management are among the methods can be adopted by the Fund Manager to manage the Fund risks. If there is high possibility that the equity market may fall, the exposure in equity investment would be reduced to a lower level and vice versa. The Fund Manager will also adopt a prudent investment selection process by investing in selected stock universe after undergoing some screening process. In managing the investment risks for IDS, the Fund Manager will adopt extensive research and analysis on the issuer, credit rating, maturity factor, liquidity and selected yield measures. The Fund Manager will also constantly monitor the macro economic factors that may impact the interest rate environment.
Target Market Customers who prefer a high risk investment profile with a high expected return.
Basis & Frequency of Unit Valuation Please refer to Appendix 2.
Exceptional Circumstances Please refer to Appendix 2.
FUND’S PERFORMANCE VS BENCHMARK
TOTAL ANNUAL RETURN AND PERFORMANCE REVIEW
FY2010
31-Dec-10 FY2011
31-Dec-11 FY2012
31-Dec-12
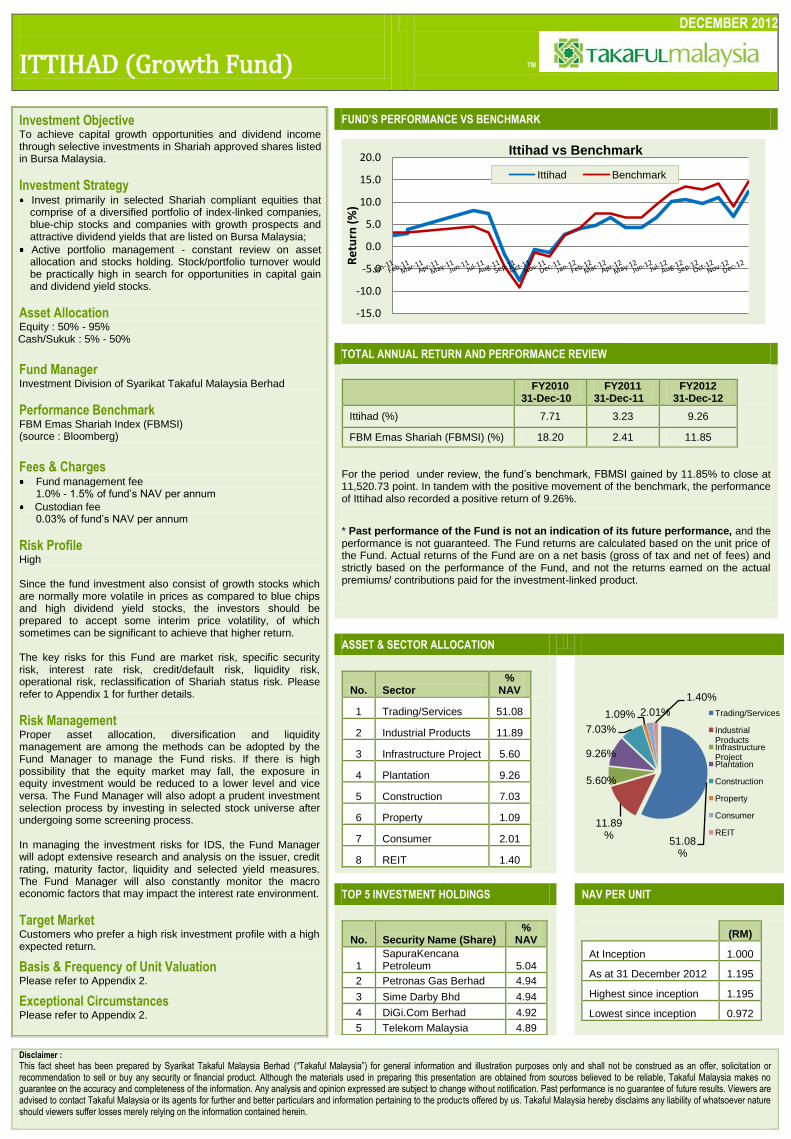
Ittihad (%) 7.71 3.23 9.26
FBM Emas Shariah (FBMSI) (%) 18.20 2.41 11.85
For the period under review, the fund‟s benchmark, FBMSI gained by 11.85% to close at 11,520.73 point. In tandem with the positive movement of the benchmark, the performance of Ittihad also recorded a positive return of 9.26%.
* Past performance of the Fund is not an indication of its future performance, and the performance is not guaranteed. The Fund returns are calculated based on the unit price of the Fund. Actual returns of the Fund are on a net basis (gross of tax and net of fees) and strictly based on the performance of the Fund, and not the returns earned on the actual premiums/ contributions paid for the investment-linked product.
ASSET & SECTOR ALLOCATION
No. Sector %
NAV
1 Trading/Services 51.08
2 Industrial Products 11.89
3 Infrastructure Project 5.60
4 Plantation 9.26
5 Construction 7.03
6 Property 1.09
7 Consumer 2.01
8 REIT 1.40
TOP 5 INVESTMENT HOLDINGS NAV PER UNIT
No. Security Name (Share) %
NAV
1 SapuraKencana Petroleum 5.04
2 Petronas Gas Berhad 4.94
3 Sime Darby Bhd 4.94
4 DiGi.Com Berhad 4.92
5 Telekom Malaysia 4.89
(RM)
At Inception 1.000
As at 31 December 2012 1.195
Highest since inception 1.195
Lowest since inception 0.972
Fund’s Performance vs Benchmark
Disclaimer :
This fact sheet has been prepared by Syarikat Takaful Malaysia Berhad (“Takaful Malaysia”) for general information and illustration purposes only and shall not be construed as an offer, solicitat ion or recommendation to sell or buy any security or financial product. Although the materials used in preparing this presentation are obtained from sources believed to be reliable, Takaful Malaysia makes no guarantee on the accuracy and completeness of the information. Any analysis and opinion expressed are subject to change without notification. Past performance is no guarantee of future results. Viewers are advised to contact Takaful Malaysia or its agents for further and better particulars and information pertaining to the products offered by us. Takaful Malaysia hereby disclaims any liability of whatsoever nature should viewers suffer losses merely relying on the information contained herein.
-15.0
-10.0
-5.0
0.0
5.0
10.0
15.0
20.0
Re
turn
(%
)
Ittihad vs Benchmark
Ittihad Benchmark
51.08%
11.89%
5.60%
9.26%
7.03%
1.09% 2.01%
1.40%
Trading/Services
Industrial ProductsInfrastructure Project Plantation
Construction
Property
Consumer
REIT
ISTIFAD (Blue Chips Fund)
DECEMBER 2012
Investment Objective To achieve consistent capital growth in the long run through investments in Shariah Compliant Blue Chip Shares.
Investment Strategy Invest primarily in Shariah compliant equities with higher market capitalisation to achieve long term capital growth;
Active portfolio management - constant review on asset allocation and stock holding in search of stocks that meet the objective of the Fund.
Asset Allocation Equity : 40% - 90% Money Market : 10% - 60%
Fund Manager Investment Division of Syarikat Takaful Malaysia Berhad
Performance Benchmark FBM Emas Shariah Index (FBMSI) (source : Bloomberg)
Fees & Charges Fund management fee
1.0% - 1.5% of fund‟s NAV per annum
Custodian fee 0.03% of fund‟s NAV per annum
Risk Profile Moderate As the Fund‟s stock investment focus mainly in blue chip stocks whose prices normally do not fluctuate as much as growth stocks, the investors should be willing to accept some moderate growth in principal. The key risks for this Fund are market risk, specific security risk, liquidity risk, operational risk, reclassification of Shariah status risk. Please refer to Appendix 1 for further details.
Risk Management Proper asset allocation, diversification and liquidity management are among the methods can be adopted by the Fund Manager to manage the Fund risks. If there is high possibility that the equity market may fall, the exposure in equity investment would be reduced to a lower level and vice versa. The Fund Manager will also adopt a prudent investment selection process by investing in selected stock universe after undergoing some screening process.
Target Market Customers who prefer moderate risk investment profile with a high expected return.
Basis & Frequency of Unit Valuation Please refer to Appendix 2.
Exceptional Circumstances Please refer to Appendix 2.
FUND’S PERFORMANCE VS BENCHMARK
TOTAL ANNUAL RETURN AND PERFORMANCE REVIEW
FY2010
31-Dec-10 FY2011
31-Dec-11 FY2012
31-Dec-12
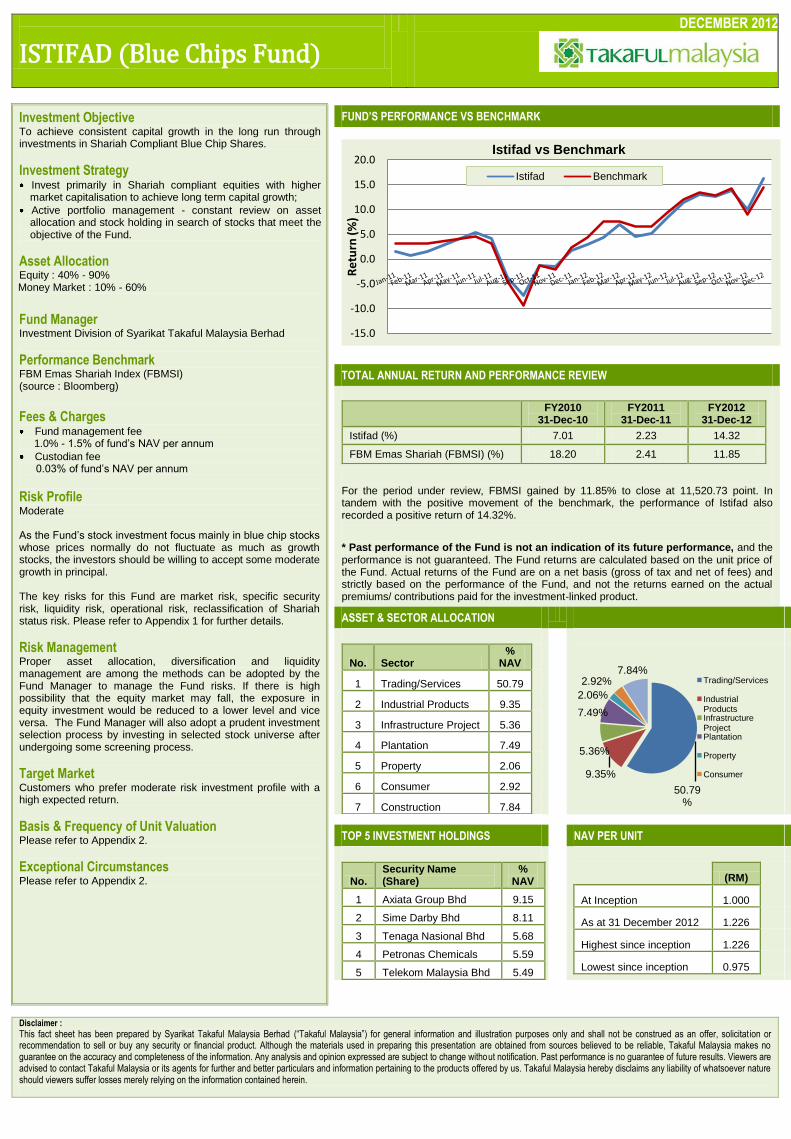
Istifad (%) 7.01 2.23 14.32
FBM Emas Shariah (FBMSI) (%) 18.20 2.41 11.85
For the period under review, FBMSI gained by 11.85% to close at 11,520.73 point. In tandem with the positive movement of the benchmark, the performance of Istifad also recorded a positive return of 14.32%.
* Past performance of the Fund is not an indication of its future performance, and the performance is not guaranteed. The Fund returns are calculated based on the unit price of the Fund. Actual returns of the Fund are on a net basis (gross of tax and net of fees) and strictly based on the performance of the Fund, and not the returns earned on the actual premiums/ contributions paid for the investment-linked product.
ASSET & SECTOR ALLOCATION
No. Sector %
NAV
1 Trading/Services 50.79
2 Industrial Products 9.35
3 Infrastructure Project 5.36
4 Plantation 7.49
5 Property 2.06
6 Consumer 2.92
7 Construction 7.84
TOP 5 INVESTMENT HOLDINGS NAV PER UNIT
No. Security Name (Share)
% NAV
1 Axiata Group Bhd 9.15
2 Sime Darby Bhd 8.11
3 Tenaga Nasional Bhd 5.68
4 Petronas Chemicals 5.59
5 Telekom Malaysia Bhd 5.49
(RM)
At Inception 1.000
As at 31 December 2012 1.226
Highest since inception 1.226
Lowest since inception 0.975
Fund’s Performance vs Benchmark
Disclaimer :
This fact sheet has been prepared by Syarikat Takaful Malaysia Berhad (“Takaful Malaysia”) for general information and illustration purposes only and shall not be construed as an offer, solicitat ion or recommendation to sell or buy any security or financial product. Although the materials used in preparing this presentation are obtained from sources believed to be reliable, Takaful Malaysia makes no guarantee on the accuracy and completeness of the information. Any analysis and opinion expressed are subject to change without notification. Past performance is no guarantee of future results. Viewers are advised to contact Takaful Malaysia or its agents for further and better particulars and information pertaining to the products offered by us. Takaful Malaysia hereby disclaims any liability of whatsoever nature should viewers suffer losses merely relying on the information contained herein.
-15.0
-10.0
-5.0
0.0
5.0
10.0
15.0
20.0
Re
turn
(%
)
Istifad vs Benchmark
Istifad Benchmark
50.79%
9.35%
5.36%
7.49%
2.06%
2.92%7.84%
Trading/Services
Industrial ProductsInfrastructure Project Plantation
Property
Consumer
IRAD (Dividend Fund)
DECEMBER 2012
Investment Objective To achieve dividend income in the long term trough selective investments in high dividend yield shares that provide a minimum annual gross dividend of 4%.
To achieve capital growth through selective investments in Blue Chips Shares that could potentially provide capital growth in the long run.
Investment Strategy Invest primarily in dividend yield stocks that provide a minimum annual gross dividend of 4% as well as blue-chip stocks that could potentially grow in the long run;
At all times, exposure in stocks that yield a minimum of 4% annual gross dividend shall be at least 50% of the equity exposure;
Constant review on asset allocation and stock holding in search of stocks that comply with the objective of the Fund.
Fund Manager Investment Division of Syarikat Takaful Malaysia Berhad
Performance Benchmark FBM Emas Shariah Index (FBMSI) (source : Bloomberg)
Fees & Charges Fund management fee
1.0% - 1.5% of fund‟s NAV per annum
Custodian fee 0.03% of fund‟s NAV per annum
Asset Allocation Equity : 40% - 90% (at least 50% in dividend yield shares) Money Market : 10% - 60%
Risk Profile Moderate As the Fund‟s stock investment focus mainly in high dividend yield stocks whose prices normally do not fluctuate as much as growth stocks, the investors should be willing to accept some moderate growth in principal. The key risks for this Fund are market risk, specific security risk, liquidity risk, operational risk, reclassification of Shariah status risk. Please refer to Appendix 1 for further details.
Risk Management Proper asset allocation, diversification and liquidity management are among the methods can be adopted by the Fund Manager to manage the Fund risks. If there is high possibility that the equity market may fall, the exposure in equity investment would be reduced to a lower level and vice versa. The Fund Manager will also adopt a prudent investment selection process by investing in selected stock universe after undergoing some screening process.
Target Market Customers who prefer moderate risk investment profile with a moderate expected return.
Basis & Frequency of Unit Valuation Please refer to Appendix 2.
Exceptional Circumstances Please refer to Appendix 2.
FUND’S PERFORMANCE VS BENCHMARK
TOTAL ANNUAL RETURN AND PERFORMANCE REVIEW
FY2010
31-Dec-10 FY2011
31-Dec-11 FY2012
31-Dec-12
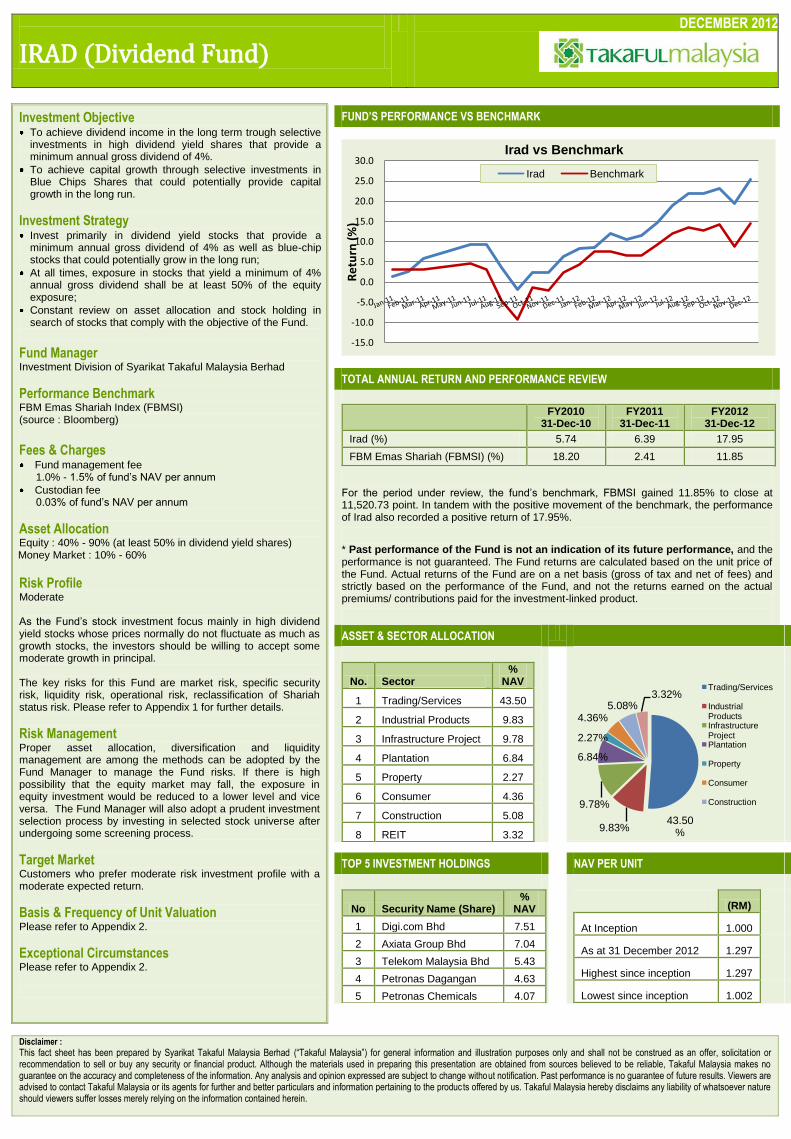
Irad (%) 5.74 6.39 17.95
FBM Emas Shariah (FBMSI) (%) 18.20 2.41 11.85
For the period under review, the fund‟s benchmark, FBMSI gained 11.85% to close at 11,520.73 point. In tandem with the positive movement of the benchmark, the performance of Irad also recorded a positive return of 17.95%.
* Past performance of the Fund is not an indication of its future performance, and the performance is not guaranteed. The Fund returns are calculated based on the unit price of the Fund. Actual returns of the Fund are on a net basis (gross of tax and net of fees) and strictly based on the performance of the Fund, and not the returns earned on the actual premiums/ contributions paid for the investment-linked product.
ASSET & SECTOR ALLOCATION
No. Sector %
NAV
1 Trading/Services 43.50
2 Industrial Products 9.83
3 Infrastructure Project 9.78
4 Plantation 6.84
5 Property 2.27
6 Consumer 4.36
7 Construction 5.08
8 REIT 3.32
TOP 5 INVESTMENT HOLDINGS NAV PER UNIT
No Security Name (Share) %
NAV
1 Digi.com Bhd 7.51
2 Axiata Group Bhd 7.04
3 Telekom Malaysia Bhd 5.43
4 Petronas Dagangan 4.63
5 Petronas Chemicals 4.07
(RM)
At Inception 1.000
As at 31 December 2012 1.297
Highest since inception 1.297
Lowest since inception 1.002
Fund’s Performance vs Benchmark
Disclaimer :
This fact sheet has been prepared by Syarikat Takaful Malaysia Berhad (“Takaful Malaysia”) for general information and illustration purposes only and shall not be construed as an offer, solicitat ion or recommendation to sell or buy any security or financial product. Although the materials used in preparing this presentation are obtained from sources believed to be reliable, Takaful Malaysia makes no guarantee on the accuracy and completeness of the information. Any analysis and opinion expressed are subject to change without notification. Past performance is no guarantee of future results. Viewers are advised to contact Takaful Malaysia or its agents for further and better particulars and information pertaining to the products offered by us. Takaful Malaysia hereby disclaims any liability of whatsoever nature should viewers suffer losses merely relying on the information contained herein.
-15.0
-10.0
-5.0
0.0
5.0
10.0
15.0
20.0
25.0
30.0
Re
turn
(%
)
Irad vs Benchmark
Irad Benchmark
43.50%9.83%
9.78%
6.84%
2.27%
4.36%5.08%
3.32%Trading/Services
Industrial ProductsInfrastructure Project Plantation
Property
Consumer
Construction
IHSAN (Balanced Fund)
DECEMBER 2012
Investment Objective To achieve moderate streams of income and consistent capital growth over the medium-to-long term period by investing in a diversified portfolio of investments;
To construct a diversified portfolio containing a balanced mixture of equities and fixed income securities.
Investment Strategy Invest in a balanced asset allocation comprising of Shariah-compliant equity, debt securities and money market.
Asset Allocation Equity : 10% - 40% Sukuk/cash : 10% - 60%
Fund Manager Investment Division of Syarikat Takaful Malaysia Berhad
Performance Benchmark Combination of
40% FBM Emas Shariah Index (FBMSI)
60% 12-month return Maybank General Investment Account Rate (GIA) (source: FBMSI from Bloomberg, GIA from Maybank)
Fees & Charges Fund management fee :
1.0% - 1.2% of fund‟s NAV per annum
Custodian fee : 0.03% of fund‟s NAV per annum
Risk Profile Low As the Fund‟s investment involved marketable securities such as stocks and Islamic debt securities (IDS), the investors should be prepared to accept some interim price volatility. Investment in IDS carries some risks such as changes in interest rate and credit rating of the issuer. An increase in interest rate or downgrading of credit rating of the issuer would result to the fall in bond prices; hence impacted the performance of the Fund. The key risks for this Fund are market risk, interest rate risk, credit/default risk, specific security risk, liquidity risk, operational risk, reclassification of Shariah status risk. Please refer to Appendix 1 for further details.
Risk Management Proper asset allocation, diversification and liquidity management are among the methods can be adopted by the Fund Manager to manage the Fund risks. If there is high possibility that the equity market may fall, the exposure in equity investment would be reduced to a lower level and vice versa. In managing the investment risks for IDS, the Fund Manager will adopt extensive research and analysis on the issuer, credit rating, maturity factor, liquidity and selected yield measures. The Fund Manager will also constantly monitor the macro economic factors that may impact the interest rate environment. Target Market Customers who prefer a moderate risk investment profile with a moderate expected return.
Basis & Frequency of Unit Valuation Please refer to Appendix 2.
Exceptional Circumstances Please refer to Appendix 2.
FUND’S PERFORMANCE VS BENCHMARK
TOTAL ANNUAL RETURN AND PERFORMANCE REVIEW
FY2011
31-Dec-11 FY2012
31-Dec-12
Ihsan (%) 2.56 7.88
Benchmark (%) 2.81 6.66
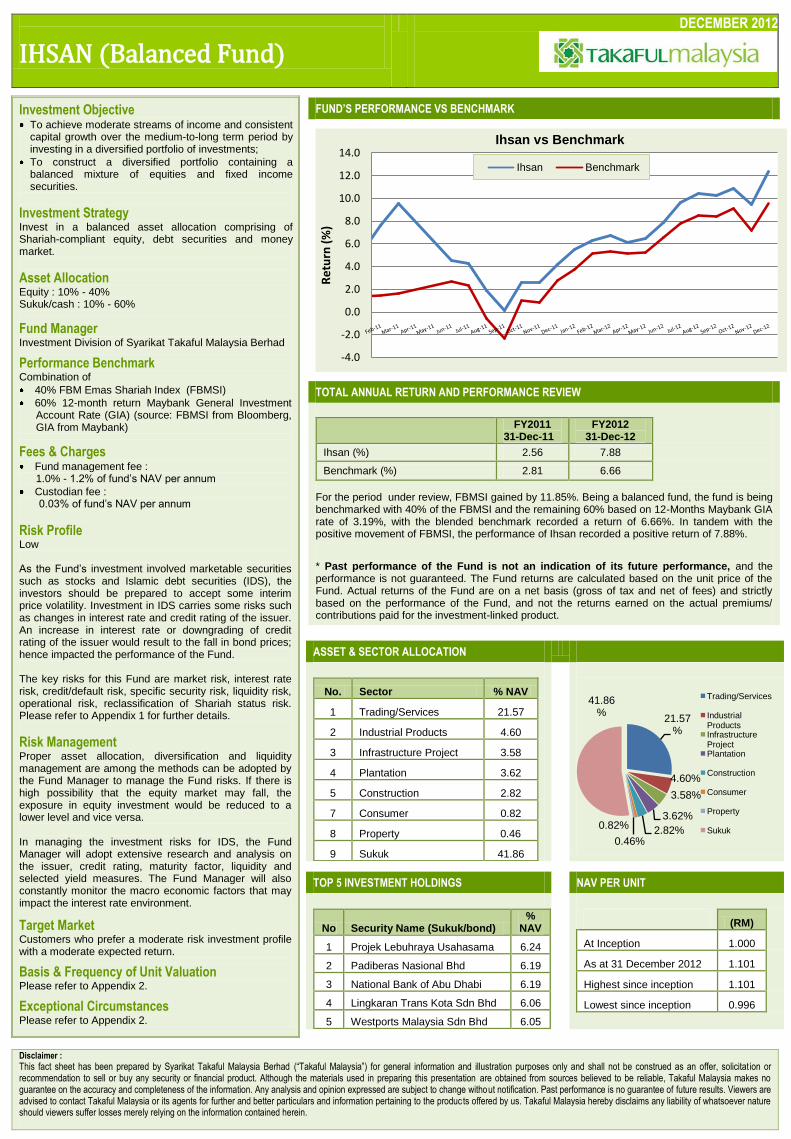
For the period under review, FBMSI gained by 11.85%. Being a balanced fund, the fund is being benchmarked with 40% of the FBMSI and the remaining 60% based on 12-Months Maybank GIA rate of 3.19%, with the blended benchmark recorded a return of 6.66%. In tandem with the positive movement of FBMSI, the performance of Ihsan recorded a positive return of 7.88%.
* Past performance of the Fund is not an indication of its future performance, and the performance is not guaranteed. The Fund returns are calculated based on the unit price of the Fund. Actual returns of the Fund are on a net basis (gross of tax and net of fees) and strictly based on the performance of the Fund, and not the returns earned on the actual premiums/ contributions paid for the investment-linked product.
ASSET & SECTOR ALLOCATION
No. Sector % NAV
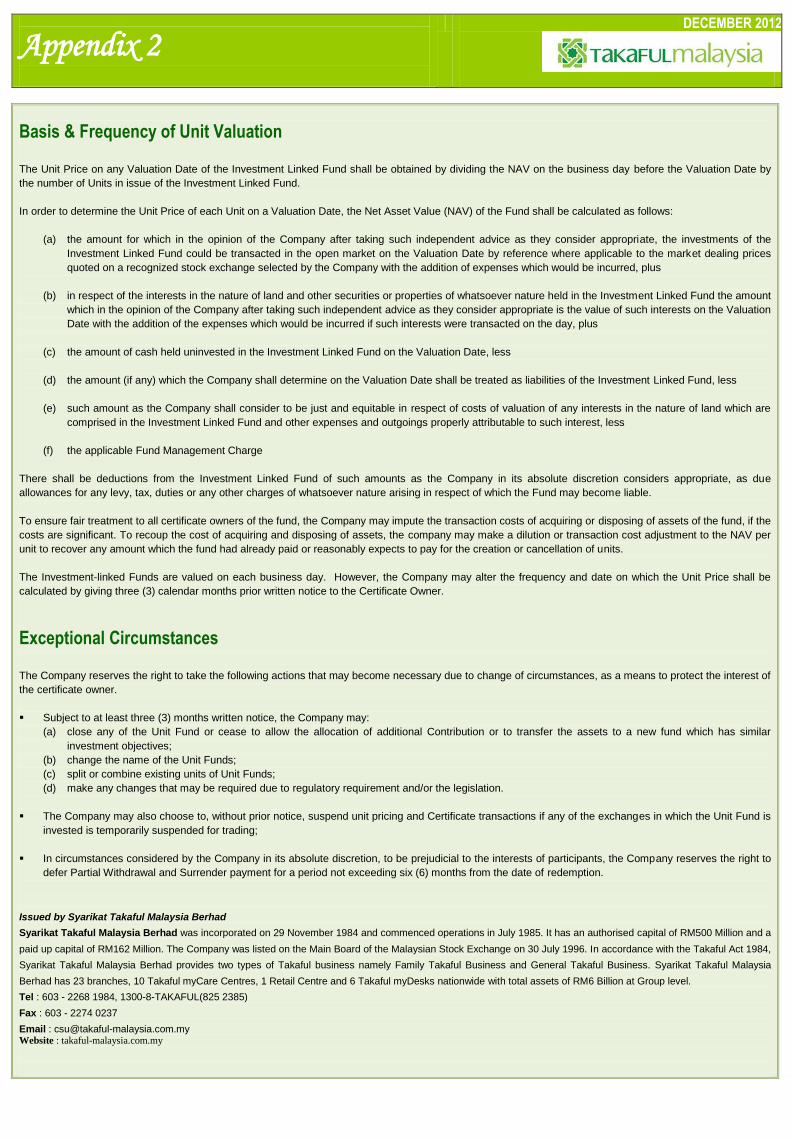
1 Trading/Services 21.57
2 Industrial Products 4.60
3 Infrastructure Project 3.58
4 Plantation 3.62
5 Construction 2.82
7 Consumer 0.82
8 Property 0.46
9 Sukuk 41.86
TOP 5 INVESTMENT HOLDINGS NAV PER UNIT
No Security Name (Sukuk/bond) %
NAV
1 Projek Lebuhraya Usahasama 6.24
2 Padiberas Nasional Bhd 6.19
3 National Bank of Abu Dhabi 6.19
4 Lingkaran Trans Kota Sdn Bhd 6.06
5 Westports Malaysia Sdn Bhd 6.05
(RM)
At Inception 1.000
As at 31 December 2012 1.101
Highest since inception 1.101
Lowest since inception 0.996
Fund’s Performance vs Benchmark
Disclaimer :
This fact sheet has been prepared by Syarikat Takaful Malaysia Berhad (“Takaful Malaysia”) for general information and illustration purposes only and shall not be construed as an offer, solicitat ion or recommendation to sell or buy any security or financial product. Although the materials used in preparing this presentation are obtained from sources believed to be reliable, Takaful Malaysia makes no guarantee on the accuracy and completeness of the information. Any analysis and opinion expressed are subject to change without notification. Past performance is no guarantee of future results. Viewers are advised to contact Takaful Malaysia or its agents for further and better particulars and information pertaining to the products offered by us. Takaful Malaysia hereby disclaims any liability of whatsoever nature should viewers suffer losses merely relying on the information contained herein.
-4.0
-2.0
0.0
2.0
4.0
6.0
8.0
10.0
12.0
14.0
Re
turn
(%
)
Ihsan vs Benchmark
Ihsan Benchmark
21.57%
4.60%
3.58%
3.62%
2.82%0.82%
0.46%
41.86%
Trading/Services
Industrial ProductsInfrastructure Project Plantation
Construction
Consumer
Property
Sukuk
Appendix 1 DECEMBER 2012
Definition of Risks and Risk Management Techniques
1. Market risk
Refers to potential impact arising from adverse price movements that affects the market values of the investments due to changes in economic
cycles, financial market conditions, currency and interest rate. The risk may also arise due to changes in any political and regulatory forms.
Market risk is managed through portfolio diversification and asset allocation whereby the securities exposure is monitored / reduced in the event of
anticipated market weaknesses.
2. Liquidity risk
Refers to potential impact of not being able to convert Shariah compliant investment into cash at or near its fair value, which primarily depends on the
volume traded for that particular Shariah compliant investments in the market.
The investment policy is to always maintain a prudent level of liquid assets so as to reduce liquidity risk.
3. Interest rate risk
Refers to potential impact affecting the market values of investment into Islamic debt securities arising from adverse movement in interest rates.
When interest rate rise, the value of Islamic debt securities fall and vice versa, thus affecting the market value of the fund. Although the fund does not
invest in conventional bonds, any changes in interest rate trend could also affect the price and yield of Islamic debt securities as conventional interest
rate is generally used as indicative rate to determine the profit rate for the Islamic debt securities.
In managing the risks, the Fund Manager will adopt an active investment management by constantly review the fund‟s strategy and portfolio.
4. Credit/Default risk
Refers to potential decrease in credit worthiness of the issuers for Islamic debt investments in the event that the issuer is faced with unexpected
financial difficulties. In the worst case scenario, the issuer may default in the payment of principal and profits for the Islamic debt securities issued,
decreasing the prices and value of that particular Islamic debt securities and thus affecting the market value of the fund.
The Fund Manager manages the risk by setting internal counterparty limits and undertaking internal credit evaluation to minimise such risk.
5. Specific security risk
Refers to the risk of individual security including stock or Islamic debt security invested in the portfolio. A major price change of any particular security,
which is a component of the fund‟s portfolio, would affect the NAV and daily prices of the Fund.
The mechanism employed to minimize the risk is through the process of portfolio diversification and prudent investment selection process by the
Fund Manager.
6. Operational risk
Refers to the risk that the Company fails to fulfill its obligation or perform other required actions because of inadequate policies and procedures,
human resources, information systems or internal control.
To minimize the risks, the Fund Manager will work with the Fund„s Trustee, internal compliance unit and other divisions to ensure compliance with all
relevant legislations and policies and procedures are put in place at all the time.
7. Reclassification of Shariah status risk
Refers to potential revision on the status of Shariah compliant securities in the fund to become non-Shariah compliant in the periodic review by the
SAC.
The Fund Manager will take the necessary steps to dispose such securities in accordance with the advice from the SAC and the Shariah Advisor.
The Fund Manager will manage the investment-linked funds according to the fund strategy and target asset allocation policy. Nevertheless, the Fund Manager
may take temporary steps which may not be consistent with the stated strategy and asset allocation policy in attempting to respond to adverse market,
economic conditions.
Fund’s Performance vs Benchmark
Appendix 2
DECEMBER 2012
Basis & Frequency of Unit Valuation The Unit Price on any Valuation Date of the Investment Linked Fund shall be obtained by dividing the NAV on the business day before the Valuation Date by
the number of Units in issue of the Investment Linked Fund.
In order to determine the Unit Price of each Unit on a Valuation Date, the Net Asset Value (NAV) of the Fund shall be calculated as follows:
(a) the amount for which in the opinion of the Company after taking such independent advice as they consider appropriate, the investments of the
Investment Linked Fund could be transacted in the open market on the Valuation Date by reference where applicable to the market dealing prices
quoted on a recognized stock exchange selected by the Company with the addition of expenses which would be incurred, plus
(b) in respect of the interests in the nature of land and other securities or properties of whatsoever nature held in the Investment Linked Fund the amount
which in the opinion of the Company after taking such independent advice as they consider appropriate is the value of such interests on the Valuation
Date with the addition of the expenses which would be incurred if such interests were transacted on the day, plus
(c) the amount of cash held uninvested in the Investment Linked Fund on the Valuation Date, less
(d) the amount (if any) which the Company shall determine on the Valuation Date shall be treated as liabilities of the Investment Linked Fund, less
(e) such amount as the Company shall consider to be just and equitable in respect of costs of valuation of any interests in the nature of land which are
comprised in the Investment Linked Fund and other expenses and outgoings properly attributable to such interest, less
(f) the applicable Fund Management Charge
There shall be deductions from the Investment Linked Fund of such amounts as the Company in its absolute discretion considers appropriate, as due
allowances for any levy, tax, duties or any other charges of whatsoever nature arising in respect of which the Fund may become liable.
To ensure fair treatment to all certificate owners of the fund, the Company may impute the transaction costs of acquiring or disposing of assets of the fund, if the
costs are significant. To recoup the cost of acquiring and disposing of assets, the company may make a dilution or transaction cost adjustment to the NAV per
unit to recover any amount which the fund had already paid or reasonably expects to pay for the creation or cancellation of units.
The Investment-linked Funds are valued on each business day. However, the Company may alter the frequency and date on which the Unit Price shall be
calculated by giving three (3) calendar months prior written notice to the Certificate Owner.
Exceptional Circumstances The Company reserves the right to take the following actions that may become necessary due to change of circumstances, as a means to protect the interest of
the certificate owner.
Subject to at least three (3) months written notice, the Company may:
(a) close any of the Unit Fund or cease to allow the allocation of additional Contribution or to transfer the assets to a new fund which has similar
investment objectives;
(b) change the name of the Unit Funds;
(c) split or combine existing units of Unit Funds;
(d) make any changes that may be required due to regulatory requirement and/or the legislation.
The Company may also choose to, without prior notice, suspend unit pricing and Certificate transactions if any of the exchanges in which the Unit Fund is
invested is temporarily suspended for trading;
In circumstances considered by the Company in its absolute discretion, to be prejudicial to the interests of participants, the Company reserves the right to
defer Partial Withdrawal and Surrender payment for a period not exceeding six (6) months from the date of redemption.
Issued by Syarikat Takaful Malaysia Berhad
Syarikat Takaful Malaysia Berhad was incorporated on 29 November 1984 and commenced operations in July 1985. It has an authorised capital of RM500 Million and a
paid up capital of RM162 Million. The Company was listed on the Main Board of the Malaysian Stock Exchange on 30 July 1996. In accordance with the Takaful Act 1984,
Syarikat Takaful Malaysia Berhad provides two types of Takaful business namely Family Takaful Business and General Takaful Business. Syarikat Takaful Malaysia
Berhad has 23 branches, 10 Takaful myCare Centres, 1 Retail Centre and 6 Takaful myDesks nationwide with total assets of RM6 Billion at Group level.
Tel : 603 - 2268 1984, 1300-8-TAKAFUL(825 2385)
Fax : 603 - 2274 0237
Email : [email protected] Website : takaful-malaysia.com.my
Fund’s Performance vs Benchmark