itto undertakes a wide range of work on incentives to
TRANSCRIPT

TECHNICAL SERIES
49TROPICAL TIMBER 2050An analysis of the future supply of and demand for tropical timber and its contributions to a sustainable economy
INTERNATIONAL TROPICAL TIMBER ORGANIZATION
JULY 2021
I N T E R N A T I O N A L T R O P I C A L T I M B E R O R G A N I Z A T I O NInternational Organizations Center, 5th Floor, Pacifico-Yokohama, 1-1-1, Minato-Mirai, Nishi-ku, Yokohama, 220-0012, Japan
Tel 81-45-223-1110 Fax 81-45-223-1111 Email [email protected] Web www.itto.int
© ITTO 2021
TROPIC
AL TIM
BER 2050ITTO
TECH
NIC
AL SER
IES 49
This document is printed on recycled paper.
ITTO undertakes a wide range of work on incentives to promote sustainable forestry in tropical countries, including the development of models for forecasting trends in tropical timber supply and demand. Such models can assist in planning policies at the national and international levels, and they can be used to forecast likely recovery times from shocks to the sector—such as that caused by the COVID-19 pandemic.
This report describes a model developed to forecast trends in tropical timber supply and trade to 2050. It analyzes potential scenarios and examines previous economic and non-economic shocks to estimate the likely time required for the sector to recover to pre-pandemic levels.
The report also considers longer-term factors. With global resource use set to more than double by 2050, it is essential to strive for carbon-neutral production based on renewable and sustainably produced materials such as wood. Sustainably produced tropical timber could take a leading role in this quest as a substitute for non-environmentally friendly materials; the report sets out five complementary strategies that could help drive sustainable growth in the sector.
This report is part of an ongoing effort by ITTO to provide knowledge and learning experiences on incentivizing investments in natural tropical forests and the sustainable production of the wood and non-wood products arising from them. Among other things, the wealth of information herein highlights the crucial role that sustainably managed tropical forests can play in climate-change mitigation and adaptation by encouraging the greater engagement of governments and private-sector players in this sphere.

1
TS49
TROPICAL TIMBER 2050An analysis of the future supply of and demand for tropical timber and its contributions to a sustainable economy
Christian Held, Eva Meier-Landsberg and Verónica Alonso
ITTO Technical Series #49
TECHNICAL SERIES

2
TROPICAL TIMBER 2050
Preferred citation: Held, C., Meier-Landsberg, E. & Alonso, V. 2021. Tropical timber 2050: an analysis of the future supply of and demand for tropical timber and its contributions to a sustainable economy. ITTO Technical Series No. 49. International Tropical Timber Organization (ITTO), Yokohama, Japan.
The International Tropical Timber Organization (ITTO) is an intergovernmental organization promoting the conservation and sustainable management, use and trade of tropical forest resources. Its members represent the bulk of the world’s tropical forests and of the global tropical timber trade. ITTO develops internationally agreed policy documents to promote sustainable forest management and forest conservation and assists tropical member countries to adapt such policies to local circumstances and to implement them in the field through projects. In addition, ITTO collects, analyzes and disseminates data on the production and trade of tropical timber and funds projects and other actions aimed at developing sustainable forest industries at both the community and industrial scales. Since it became operational in 1987, ITTO has funded more than 1200 projects, pre-projects and activities valued at more than USD 430 million. All projects are funded by voluntary contributions, the major donors to date being the governments of Japan and the United States of America.
© ITTO 2021
This work is copyright. Except for the ITTO logo, graphical and textual information in this publication may be reproduced in whole or in part provided that it is not sold or put to commercial use and its source is acknowledged.
Disclaimer
The designations employed and the presentation of material herein do not imply the expression of any opinion whatsoever concerning the legal status of any country, territory, city or area, or of its authorities or concerning the delimitation of its frontiers and boundaries.
ISBN 978-4-86507-071-2
Cover image: Tropical forest above a floor made of tropical timber. © POND5/foto76

3
TS49
CONTENTS
Foreword........................................................................................................................................................ 6
Acknowledgements........................................................................................................................................ 7
Abbreviations and acronyms......................................................................................................................... 8
Executive summary........................................................................................................................................ 9
1 General approach..................................................................................................................................... 11
2 Tropical timber supply and demand to 2050.......................................................................................... 15
3 Production and consumption of tropical wood products in 2050......................................................... 30
4 Tropical timber in a sustainable economy............................................................................................... 45
5 ITTO’s role in the transition and modernization of the tropical forest sector...................................... 53
Annex 1: List of countries and regions....................................................................................................... 54
Annex 2: Wood product conversion factors to RWE.................................................................................. 57
Annex 3: GFPM tables................................................................................................................................ 58
Annex 4: Comparison of production volumes versus FAO-reported data................................................. 61
Annex 5: Comparison of roundwood projections for Africa..................................................................... 62
Annex 6: Employment factors..................................................................................................................... 63
Annex 7: Timber construction factors........................................................................................................ 64
Annex 8: Emission substitution factors for wood products....................................................................... 65
Annex 9: Net trade data, GFPM................................................................................................................. 66
References.................................................................................................................................................... 72
Tables
Table 1: Regions used in the study................................................................................................................. 12
Table 2: Industrial roundwood production in 2050 from natural forests and plantations in tropical producer regions.............................................................................................................................. 23
Table 3: Future fields of activity in the transition and modernization of the tropical forest sector.................. 53
Figures
Figure 1: Work packages................................................................................................................................ 12
Figure 2: Tropical timber product groups and estimated sources of raw material............................................ 13
Figure 3: The GFPM model—inputs, trends and outputs............................................................................. 14
Figure 4: Industrial roundwood and woodfuel production, 2000, 2015 and 2050......................................... 16
Figure 5: Projected production and consumption of industrial roundwood and woodfuel in tropical producer regions, 2050................................................................................................................... 16
Figure 6: Projected global industrial roundwood production and consumption in 2050, by selected world region................................................................................................................................... 16
Figure 7: Population growth, consumption growth and total consumption of industrial roundwood, 2015–2050, by selected world region.............................................................................................. 17
Figure 8: Per-capita consumption of industrial roundwood and woodfuel in 2015 and 2050, by selected world region.................................................................................................................. 17
Figure 9: Trade balance of industrial roundwood in 2050, by selected world region....................................... 18
Figure 10: Global industrial roundwood production and GDP growth, 1989–2050..................................... 18

4
TROPICAL TIMBER 2050
Figure 11: GDP growth rates, tropical producer regions and world, 1990–2025........................................... 19
Figure 12: Industrial roundwood production in tropical producer regions and World GDP growth, 1990–2026................................................................................................................................... 19
Figure 13: Woodfuel consumption in tropical producer regions, and world GDP growth, 2000–2019.......... 20
Figure 14: Indicative flow of roundwood in tropical producer regions in 2050.............................................. 22
Figure 15: Total and natural-forest industrial roundwood production in tropical producer regions, 1990–2019................................................................................................................................... 23
Figure 16: Industrial roundwood production, Cameroon and Peru, 2000–2019........................................... 23
Figure 17: Industrial concession areas and areas under community-based forest management in tropical regions, 2015................................................................................................................................ 25
Figure 18: Industrial roundwood production in forest plantations in tropical producer regions, 2015 and 2050...................................................................................................................................... 26
Figure 19: Forestry employment and industrial roundwood production and trade, Viet Nam, 2000–2018................................................................................................................................... 27
Figure 20: Estimated area of land under agroforestry in tropical producer regions, 2014............................... 28
Figure 21: Participation of selected world regions in the production and consumption of primary wood products, 2050............................................................................................................................. 31
Figure 22: Primary wood-product production, 2000, 2015 and 2050........................................................... 31
Figure 23: Production and consumption of sawnwood, veneer and plywood in tropical producer regions, 2050................................................................................................................................ 32
Figure 24: Production and consumption of particleboard/fibreboard and woodpulp in tropical producer regions, 2050................................................................................................................................ 32
Figure 25: Per-capita consumption of primary wood products in selected world regions, 2015 and 2050...... 32
Figure 26: Regional population growth, consumption growth and total consumption of primary wood products, 2050............................................................................................................................. 33
Figure 27: Trade balance of primary wood products in selected world regions, 2050..................................... 34
Figure 28: Exports of sawnwood and wood-based panels in tropical producer regions, and world GDP growth, 1990–2019...................................................................................................................... 35
Figure 29: Exports of tropical roundwood, sawnwood and wood-based panels, Cameroon and Peru, and world GDP growth, 2001–2019................................................................................................... 36
Figure 30: Consumption of sawnwood and wood-based panels in tropical producer regions and world GDP growth, 1990–2019...................................................................................................................... 36
Figure 31: Exports of secondary wood products from Peru and Viet Nam, 2000–2019................................. 37
Figure 32: Consumption and exports of woodpulp in tropical producer regions and world GDP, 1990–2019................................................................................................................................... 38
Figure 33: Wood-product imports and wood-industry GDP growth, Peru, 2007–2019................................ 39
Figure 34: Enterprises, and employment in forest industries, by region, 2015............................................... 40
Figure 35: Import share of sawnwood and wood-based panels in domestic consumption in Peru and Viet Nam, and development of medium-sized/large wood-industry enterprises, 2007–2018........ 40
Figure 36: Formal employment in forest industries in tropical producer regions in 2015, by subsector, and increase in employment to 2050............................................................................................ 41
Figure 37: Expansion of intake capacities and investment requirements for forest industries in tropical producer regions by 2050............................................................................................................. 42
5
TS49
Figure 38: Per-capita material consumption, selected world regions, 2017................................................... 46
Figure 39: Global material use in 2017 and 2060, and impact of structural and technology change.............. 46
Figure 40: Material consumption mix, selected world regions, 2017.............................................................. 46
Figure 41: China’s non-renewable material use per capita, 2000–2017.......................................................... 47
Figure 42: Non-renewable material consumption in sub-Saharan Africa, 2015–2050.................................... 48
Figure 43: Non-renewable material consumption in Latin America and the Caribbean, 2015–2050............. 48
Figure 44: Non-renewable material consumption in Southeast Asia, 2015–2050........................................... 49
Figure 45: Housing demand in tropical producer regions, 2015–2050.......................................................... 50
Figure 46: Production of textile fibre, cellulose fibre and corresponding industrial roundwood demand, 2015 and 2050............................................................................................................................. 51
Figure 47: Five generic strategies to enhance the use of tropical wood resources............................................. 52

6
TROPICAL TIMBER 2050
FOREWORD
ITTO undertakes a wide range of work on incentives to promote sustainable forest management in tropical countries. Recently, this has included the development of models for forecasting trends in tropical timber supply and demand with a view to predicting regional surpluses and deficits of timber supply that appropriate incentives might help address. Such models can be crucial tools for planning policies at the national and international levels, as well as for forecasting likely recovery times from shocks to the sector—such as that caused by the ongoing COVID-19 pandemic.
This report, an output of ITTO’s Biennial Work Programme activity on legal and sustainable supply chains, describes a model developed to forecast trends in tropical timber supply and trade to 2050. It analyzes a number of potential scenarios and examines previous economic and non-economic shocks to estimate the likely time required for the sector to recover to pre-pandemic levels.
The model and this report are part of an ongoing effort by ITTO to provide knowledge and learning experiences on potential frameworks for incentivizing investments in natural tropical forests and the sustainable production of the wood and non-wood products arising from them. The wealth of information herein will help engage both governments and private-sector players more prominently in climate-change mitigation and REDD+ processes linked to tropical forests.
The work summarized in this report took place in parallel with a related activity that examined existing and potential incentive schemes for sustainable forest management in tropical countries, based on eight detailed case studies in the three main tropical regions. ITTO published that report in April 2021 as Fiscal and Non-fiscal Incentives for Sustainable Forest Management (Technical Series No. 48).
ITTO is grateful to the authors of the present report—Christian Held, Eva Meier-Landsberg and Verónica Alonso from the Germany-based company, Unique Forestry and Land Use—for their tireless work on the model and this report. Alain Karsenty, the lead consultant who oversaw the work in the parallel study referred to above, also provided many insights to this report. Finally, we thank the Government of Germany in particular and also the governments of the United States of America and Japan for making funding available to carry out this important study, which I commend to all ITTO members and stakeholders.
Steve JohnsonITTO Officer-in-chargeYokohama, July 2021

7
TS49
ACKNOWLEDGEMENTS
The authors thank ITTO for its support, flexibility and constructive reviews, as well as for making ITTO data and market insights available on tropical timber producer countries.
Thanks are also due to the Government of Germany (through the Federal Ministry of Food and Agriculture) for providing the grant to ITTO that allowed this study. Alain Karsenty, who led a parallel study on incentives for sustainable forest management, provided valuable feedback in addition to coordinating and providing results from his research.
Since this was a desk-based exercise, it is important to acknowledge the work on reliable statistics on timber production and wood products carried out across the globe by national statistics offices, which frequently work in difficult environments and still come up with much useful information. Considerable progress has been made, and the quality of information available in international forest products statistics has improved substantially for many countries. In addition to ITTO’s databases, FAO’s forest products database is of great value for understanding global timber production and trade trends.
The authors extend their thanks to the many researchers who work on basic research and innovative topics to advance the role of timber as a sustainable material, while highlighting the need to bring together the environmental and societal requirements of modern silviculture and forest management.
Finally, many thanks are due to Alastair Sarre, whose editing contributed greatly to the readability of this report, and to Claudine Fleury and Claudia Adan, who produced the French and Spanish translations, respectively.

8
TROPICAL TIMBER 2050
ABBREVIATIONS AND ACRONYMS
CBFM community-based forest management
CLT cross-laminated timber
EU FLEGT European Union Forest Law Enforcement, Governance and Trade
FAO Food and Agriculture Organization of the United Nations
GDP gross domestic product
GFPM Global Forest Production Model
Gt gigatonne(s)
ha hectare(s)
IRW industrial roundwood
ITTO International Tropical Timber Organization
m metre(s)
MSMEs micro, small and medium-sized enterprises
RWE roundwood equivalent
SFM sustainable forest management
SMEs small and medium-sized enterprises
SSP shared socioeconomic pathway
UN United Nations
USD United States dollar(s)

9
TS49
EXECUTIVE SUMMARY
Tropical timber supply and demand in 2050
Production of roundwood in tropical producer regions
The overall production of roundwood in tropical producer regions will decline due to decreasing woodfuel consumption (270 million m³ less woodfuel in 2050 than in 2015). Nevertheless, total woodfuel production in 2050 (718 million m³) will be higher than industrial roundwood (IRW) production in that year.
IRW production in sub-Saharan Africa, Latin America and Southeast Asia will grow by 24% by 2050 (to 533 million m³) compared with 2015. The three regions will be net exporters of IRW in that year, producing 19% of global IRW production.
Plantation forestry will be the main source of IRW in tropical producer regions in 2050. With limited expansion possibilities for large-scale plantations, smallholders and agroforestry systems will be increasingly important for production. All production systems need further improvements in productivity and timber quality. Private equity capitalization and incentives for small to large plantation-based enterprises will be key for stimulating sector growth.
IRW production in natural forests will remain fairly stable. To maintain market share for tropical timber derived from natural forests, sustainable forest management will need to be more competitive by expanding the range of commercial species and including revenue streams from carbon and ecosystem services. Industrial concessions and communities will need to improve their silviculture and obtain third-party certification of legality and sustainability.
Production and consumption of tropical timber products
The production of tropical primary-processed wood products will be 36% higher in 2050 (at 476 million m³ roundwood equivalent) than in 2015, comprising 12% of global production. The share of global consumption of primary-processed wood products in tropical producer regions will be 12%, which is disproportionately low considering that 38% of the world population will live in these regions by 2050.
The forest industry in tropical producer regions will have to modernize and invest more than USD 40 billion by 2050 in the expansion of processing capacities. Employment in forest industries in tropical producer regions will grow by 1.3 million jobs by 2050, to 7 million.
Meeting future employment needs in the wood-processing industries in tropical producer countries will require a well-trained workforce, which still needs to be developed. Forest enterprises face several challenges in enhancing productivity and value-adding, especially informality, restricted access to capital, and a lack of business development support. These challenges need to be overcome to ensure global competitiveness and an adequate timber supply for future employment and sustainable growth in producer countries.
Transformative public and private investments in the tropical timber industry will be required to overcome the abovementioned challenges. Public investment would facilitate the raising of private investments at scale and is needed to stimulate sustainable growth. Any effort aimed at enhancing tropical timber industries must be harmonized with the actions required to achieve the widespread adoption of sustainable forest management for tropical timber production.
Synthesis of tropical timber in the sustainable economy of 2050Economic growth will lead to a net increase in global material use of nearly 100% by 2050. The vast majority of these materials will be non-renewable, and their use is closely linked to negative externalities such as greenhouse-gas emissions, biodiversity loss and public health issues.
As tropical low- and middle-income countries rapidly grow their economies, building a sustainable and resilient future requires finding strategies to mitigate the negative effects of material use and resource extraction.
Tropical timber can play a major role in slowing biodiversity loss, ecosystem degradation, social inequality and other negative externalities related to the extraction of natural resources in tropical regions.

10
TROPICAL TIMBER 2050
The enhanced use of tropical timber should be based on the following complementary strategies and key actions:
• increasing resource efficiency, such as reducing waste through technical improvements in production processes and the digitization of value chains, using side-streams and byproducts and, where feasible, applying cascade use;
• changing consumption patterns, such as that projected for the declining use of woodfuel, and allocating freed resources to new processing pathways;
• developing regional processing industries to reduce export volumes and increase domestic value-added;
• improving forest management, for example by expanding certification and improving management planning. Production systems will need to be modified to enable higher harvesting rates, improve forest health and produce higher-value assortments; and
• exploring opportunities and striving for timber-focused investments in natural capital—green investments, investments in nature-based solutions such as tropical rainforest conservation and landscape restoration, and subsidies or tax reductions for “green” products will be incentives for increasing natural capital and economic efficiency.
ITTO’s role in the tropical forest-sector transition and modernizationThe present study identifies future opportunities and challenges for the tropical forest sector. In view of these, ITTO can take a leading role in guiding the tropical forest sector’s transition and modernization in the decades to come. The study concludes with a set of activities that could be accommodated or strengthened in ITTO’s work programme, as set out in the following table.
Focus area Proposed fields of future activities
1 Sustainable forest management: managing and
conserving tropical forests
Develop innovative business models and multiple revenue streams for natural forest management,
including “concessions 2.0”
Develop concepts to provide the raw materials of the future: high-quality raw materials
for modern industries from productive plantations that are resilient to climate change
2 Economics, statistics and markets: improving
the transparency of—and expanding
international markets for—tropical timber
Support international initiatives that promote timber trade, legality and transparency through data
analytics and impact monitoring
Analyse current and future market requirements and understand the transitions required for
tropical timber supply and value chains
3 Sustainable forest industries: developing
efficient and value-adding tropical forest-based
industries
Promote innovation and digitalization in tropical timber sectors, from forest information systems and
timber production to wood-product processing and consumer requirements
Develop incentive and capitalization schemes for tropical forest-sector small and medium-sized
enterprises
4 Climate-change mitigation and adaptation:
addressing climate change
Promote the substitution of non-renewable materials with sustainable timber to mitigate
greenhouse-gas emissions and other negative externalities associated with the use of
non-renewable materials
Cooperate with initiatives that address deforestation and degradation and promote reforestation
for commercial purposes
5 Capacity building: raising the capacity
of forest stakeholders to manage and benefit
from their resources
Promote diversity in tropical timber production to enable broad participation, ownership and
benefit-sharing in sustainable forest management, including in small to large enterprises and between
private and public actors, genders and generations
Facilitate knowledge transfer and provide training and education to meet future silvicultural and
industry labour requirements
Future fields of activity in the tropical-forest-sector transition and modernization

11
TS49
1 GENERAL APPROACH
This study summarizes the status of tropical timber production and presents projected future developments in tropical timber supply and demand to 2050. The forecast data used in the study rely mainly on the following publicly available resources:
• Food and Agriculture Organization of the United Nations (FAO) data on forest area and forest product production and trade, as contained in the FAOSTAT database (FAO 2020).
• Projections generated by the Global Forest Production Model (GFPM) (Buongiorno et al. 2003; Buongiorno 2015) for forest products and forest area (mid-case scenario).
• United Nations (UN) and World Bank/International Finance Corporation data and forecasts for population and gross domestic product (GDP).
• National statistical data on forest-sector employment and forest industries.
• Studies and scientific papers.
Figure 1 summarizes the main work packages in this study.
Focus area Proposed fields of future activities
1 Sustainable forest management: managing and
conserving tropical forests
Develop innovative business models and multiple revenue streams for natural forest management,
including “concessions 2.0”
Develop concepts to provide the raw materials of the future: high-quality raw materials
for modern industries from productive plantations that are resilient to climate change
2 Economics, statistics and markets: improving
the transparency of—and expanding
international markets for—tropical timber
Support international initiatives that promote timber trade, legality and transparency through data
analytics and impact monitoring
Analyse current and future market requirements and understand the transitions required for
tropical timber supply and value chains
3 Sustainable forest industries: developing
efficient and value-adding tropical forest-based
industries
Promote innovation and digitalization in tropical timber sectors, from forest information systems and
timber production to wood-product processing and consumer requirements
Develop incentive and capitalization schemes for tropical forest-sector small and medium-sized
enterprises
4 Climate-change mitigation and adaptation:
addressing climate change
Promote the substitution of non-renewable materials with sustainable timber to mitigate
greenhouse-gas emissions and other negative externalities associated with the use of
non-renewable materials
Cooperate with initiatives that address deforestation and degradation and promote reforestation
for commercial purposes
5 Capacity building: raising the capacity
of forest stakeholders to manage and benefit
from their resources
Promote diversity in tropical timber production to enable broad participation, ownership and
benefit-sharing in sustainable forest management, including in small to large enterprises and between
private and public actors, genders and generations
Facilitate knowledge transfer and provide training and education to meet future silvicultural and
industry labour requirements
Key points• The study uses the Global Forest Product
Model and publicly available data to provide projections to 2050 for tropical timber supply and demand and trends in tropical timber resources, products and industries.
• In making its projections, the study assumes the “middle of the road” shared socioeconomic pathway.
• The study discusses the potential impact of economic fluctuations on timber production based on an analysis of global and regional data for gross domestic product and tropical wood-product production and consumption.
• It also analyzes global material use and the potential of tropical timber to provide sustainable substitutes for non-renewable materials.
Tropical producer regionsThis study focuses on three tropical timber-producing regions: Latin America and the Caribbean, Southeast Asia and sub-Saharan Africa. For the purposes of the study, these regions are referred to generally as tropical producer regions. The full list of countries, by region, is in Annex 1.
To ensure a full picture of future timber supply and demand, the study compares the situation in the tropical producer regions with other regions (Table 1), with a focus on China, Europe and North America; various other regions are included but discussed only in certain contexts.
Tropical timber production and product classificationIn this study, tropical timber is defined as any wood produced in tropical producer regions (see above).1
This includes:
• tropicalhardwoods(typicallyfromnaturalforests);
• plantationhardwoods(e.g.Eucalyptus, Acacia, teak, Gmelina and sandalwood); and
• plantationsoftwoods(e.g.pines,cypress).
Consequently, the consumption of tropical timber equals the production of wood in tropical producer regions. On the other hand, the consumption of timber in these regions includes wood products imported from non-tropical producer regions. Thus, the data presented in this report require careful reading to avoid confusion.
Tropical timber products are defined here as comprising all wood-based products in the FAO products definitions produced in tropical timber producer regions.2 This definition is adopted due to limitations in production and trade statistics, which do not allow reliable differentiation between tropical and temperate species in individual countries, particularly when dealing with processed products. On the other hand, using this definition creates sources of error. For example, it includes Brazil and South Africa, which are not wholly located in the tropics.
1 The terms “timber” and “wood” are generally used interchangeably in this report.
2 www.fao.org/forestry/statistics/80577/en

12
TROPICAL TIMBER 2050
Figure 2 shows the wood-product categories examined in this study. The main product groups are woodfuel; industrial roundwood (IRW); saw/veneer-log-based products (sawnwood, veneer and plywood); and wood-fibre-based products (particleboard/fibreboard and woodpulp).
If not specifically mentioned, the wood-product volumes presented in this study are roundwood equivalent (RWE). Primary-processed wood products are converted to RWE to allow comparisons and to indicate the raw-material volumes involved in production and processing. Conversion coefficients for RWE are available in Annex 2.
Figure 2 shows the estimated sources of raw material for the various product groups in tropical producer regions. The estimates assume that wood-fibre-based products are sourced primarily from plantations and that total IRW production in the tropical producer regions comprises 60% plantation timber (Payn et al. 2015) (the remaining volume shares are attributed to natural-forest production).
The Global Forest Product ModelThe forecasts of tropical timber consumption and supply in 2050 presented here are based largely on projections obtained from the GFPM (Buongiorno 2015; Annex 3).
The GFPM is a dynamic economic model of worldwide production, consumption and trade of forest products. It is a general-equilibrium model, which, for every year and country, simulates changes in forest area, stock, production, consumption and trade.
The model entails scenarios of projected socioeconomic global change called “shared socioeconomic pathways” (SSPs), of which five exist; they are used widely to derive scenarios of greenhouse-gas emissions for policymaking purposes. The Sixth Assessment Report on climate change by the Intergovernmental Panel on Climate Change (IPCC), due to be published in 2021, will use SSPs. The GFPM and the IPCC both use SSP 2—the
Figure 1: Work packages
Tropical producer regionsa Other regions
Latin America and the Caribbean China
Southeast Asiab Europe
Sub-Saharan Africa North America
Northern Africa/Western Asia
Oceania
Rest of Asia (Central and East Asia)
South Asia
Notes: a Non-tropical countries such as Argentina, Chile and South Africa are included in these groups because they have subtropical zones. b Southeast Asia
comprises Brunei, Cambodia, Indonesia, the Lao People’s Democratic Republic, Malaysia, Myanmar, the Philippines, Singapore, Thailand, Timor-Leste and Viet Nam.
South Asia comprises Afghanistan, Bangladesh, Bhutan, India, Iran, Maldives, Nepal, Pakistan and Sri Lanka.
Table 1: Regions used in the study
Key parameters and database
Status of tropical timber supply and demand
Tropical timber in a sustainable economy
• Specification of tropical producer regions• Definition of product groups• Forest area and timber resources• Validation of GFPM database
• GFPM-based projections of tropical timber supply and demand• Status of and trends in tropical timber resources• The structure of forest industries and tropical timber resources
• Analysis of global material use and the future role of the tropical regions• Description of new markets for wood products in tropical producer regions

13
TS49
“middle of the road” scenario—as their mid case. In SSP 2, “The world follows a path in which social, economic, and technological trends do not shift markedly from historical patterns. Development and income growth proceeds unevenly, with some countries making relatively good progress while others fall short of expectations. Global and national institutions work toward but make slow progress in achieving sustainable development goals. Environmental systems experience degradation, although there are some improvements and overall the intensity of resource and energy use declines. Global population growth is moderate and levels off in the second half of the century. Income inequality persists or improves only slowly and challenges to reducing vulnerability to societal and environmental changes remain” (Riahi et al. 2017).
On the supply side, the GFPM projections are based on assumptions regarding forest-area loss due to the expansion of agricultural land and the increasing role of plantations as the main source of supply (Daigneault 2018).
A shortcoming of the GFPM model is that it lacks a clear attribution of timber sources (e.g. the volumes coming from plantations versus natural forests). The GFPM’s baseline projections for primary-processed wood products reflect moderate development paths and consider foreseeable megatrends.
Minor edits were made to the GFPM’s generic output numbers, but only when we discovered obvious data bugs—for example when a country showed zero production or zero consumption by 2050 (e.g. Nigeria, which was showing zero woodfuel production and consumption). Where indicated by plausibility, an average annual growth rate based on historical data was applied.
Like every model, GFPM has its limitations in reflecting real-world dynamics. It should be understood as a strong reduction of a complex reality in order to enable the envisioning of certain aspects of the future. Developments in emerging markets are especially difficult to anticipate. Nonetheless, the GFPM is currently the only model that enables wood production and consumption projections at the country level while factoring in reciprocal effects of the resource base and market demand and considering global megatrends.
The most recent version of the GFPM has been calibrated for the base year of 2015 and draws on historical FAO production and consumption data. Hence, the analysis and presentation of the GFPM-derived forecast data compare 2015 and 2050. FAO data were used for the analysis and presentation of historical time series.
Because this study comes at a time of global economic turmoil due to the COVID-19 pandemic, the forecasts herein need to be contextualized carefully. The model configuration does not integrate 2020 production and consumption data and therefore does not take into account the impacts of the pandemic. The study discusses the potential impact of economic fluctuations on timber production based on a historical analysis of global and regional GDP data in relation to the production and consumption of wood products in tropical producer regions.
Figure 3 illustrates the key parameters and assumptions made by the GFPM.
Figure 2: Tropical timber product groups and estimated sources of raw material
Sources: Based on Payn et al. (2015); FAO (2020).
Roundwood
Woodfuel (mainly natural forest, <10% plantations)
Industrial roundwood (60% plantations, 40% natural forest)
Sawnwood, veneer and plywood (50% natural forest, 50% plantations)
Particleboard, fibreboard and woodpulp (almost exclusively plantations)

14
TROPICAL TIMBER 2050
The impact of informal and illegal timber production on model forecasts
Historical data and projection figures in this report draw on the GFPM, which relies on FAO-reported data. As widely acknowledged, FAO is the most comprehensive and reliable source of data on forests and wood-product production and consumption. It is also known, however, that roundwood and wood-product volumes may go unreported when informally or illegally produced. Significant deviations in real product volumes from those reported could seriously affect projections. This is especially true for countries in tropical regions where governance structures and reporting procedures may be relatively less developed.
To assess the magnitude of potential deviations in harvested and processed wood volumes, data from case studies on illegal and informal forest operations were compared against FAO-reported information (see Annex 4). This comparison produced a highly heterogeneous picture, ranging from the
underreporting of total volumes in FAO data, to exact matches between FAO data and those from case studies, to overestimates. Nevertheless, the weighted average of 109 million m³ of IRW production derived from case studies in eight tropical countries is only 4% higher than that derived from FAO data. There was wider deviation in sawnwood production, with the weighted average of 7.5 million m³ for sawnwood production in ten countries indicating that FAO data underreported by 27% compared with the case studies.
The input assumptions for the GFPM projections seem reliable for IRW production within the given range of uncertainties for any forecast model. Projections for tropical sawnwood show less accuracy, but there were no systematic deviations and the case studies were therefore considered unrepresentative of the entire tropical forest sector. Hence, the authors did not alter the GFPM’s projected numbers to maintain the integrity of model.
Figure 3: The GFPM model—inputs, trends and outputs
GFPM model
Projections of the relationship between general economic growth and the forest sector to 2050
Outputs of the model
Forest area and stock, demand, supply and trade of forest products by 2050
Model inputs
SSP2, current forest area and stock, gross domestic product (GDP), population, demand, supply and trade of forest products and transportation costs
Major assumptions in the model
• GDP and population grow globally, leading to an overall increased demand for and trade of forest products
• Future woodfuel demand decreases due to technology changes
• Agricultural land expansion continues at the expense of natural forests. Plantations will be the main source of wood, increasing at a slower pace
• Payments for forest carbon sequestration via afforestation and avoided deforestation are priced from 2030 onwards, which will slow down wood harvesting

15
TS49
This chapter summarizes key numbers in the supply of, and demand for, roundwood in tropical producer regions to 2050, as projected by the GFPM. It discusses: the impacts of global GDP fluctuations on tropical roundwood production and how these might alter GFPM results; actual and future production systems of tropical roundwood; and challenges for tropical roundwood production given changing societal and economic demands. The chapter concludes with a set of key actions for shaping the role of tropical roundwood production in 2050.
ProductionGlobal production of all roundwood will grow by 13% by 2050, to 4.3 billion m³, driven by increasing demand for IRW. The increase in global IRW production to 2.8 billion m³ ( 45%) in 2050 will occur mainly in Europe and North America. The forecast data show that IRW production in tropical producer regions will grow by 24%, from 429 million m³ in 2015 to 534 million m³ in 2050 (Figure 4). Southeast Asia is expected to grow its production by 26%, from 136 million m³ to 173 million m³. Production will increase in Latin America and the Caribbean by 25% (from 227 million m³ to 283 million m³) and in sub-Saharan Africa by 19% (from 65 million m³ to 78 million m³).
Woodfuel production will decline by 21% in 2050 (to 1.4 billion m³) (Figure 4), due mainly to a decline in consumption in sub-Saharan Africa. Sub-Saharan Africa will remain the major woodfuel-consuming region, however, and there will still be a shortfall in production of 18 million m³ (Figure 5).3,4
The consumption of modern biomass (e.g. wood pellets and woodchips) is not directly reflected in and cannot be extracted from the GFPM; volumes are indirectly included in IRW volumes. Demand for modern biomass is projected to grow substantially, especially in industrialized economies (OECD 2018).
3 Detailed forecasts for world regions are available in annexes 3 and 9.4 Annex 5 discusses the accuracy of long-term woodfuel consumption
projections for sub-Saharan Africa. A comparison of historical forecast studies shows that the GFPM has been fairly accurate in projecting woodfuel consumption in Africa. Other forecast approaches overestimated woodfuel consumption by more than 20%.
2 TROPICAL TIMBER SUPPLY AND DEMAND TO 2050
Key points• Total global production of roundwood will
increase by 13% by 2050, to 4.3 billion m³. The total production volume of roundwood in tropical timber producer regions in 2050 is projected at 1.3 billion m³, of which woodfuel will account for 57%.
• Global woodfuel production will decrease from 1.8 billion m³ in 2015 to 1.5 billion m³ in 2050, a decline of 21%. The decrease will mainly be due to reduced consumption in sub-Saharan Africa.
• Global industrial roundwood production is projected to grow by 45% by 2050, to 2.8 billion m³, but tropical production will increase by only 24%, to 533 million m³.
• All tropical timber producer regions will be net exporters of industrial roundwood by 2050.
• Tropical industrial roundwood will increasingly be supplied by plantations, with natural forests projected to account for 27% of the volume in 2050, down from 35% in 2015.
• To maintain market share, timber production in tropical forests needs to become more competitive by expanding the range of commercial species and including revenue streams from carbon and ecosystem services.
• Industrial concessions and communities will need to improve silviculture and obtain third-party certification of legality and sustainability.
• With limited expansion possibilities for large-scale plantations, smallholders and agroforestry systems will become important producers. Both need further improvements in productivity and timber quality.
• Private-equity capitalization and incentives for small-to-large plantation-based enterprises will be crucial for stimulating sector growth.

16
TROPICAL TIMBER 2050
ConsumptionThe moderate growth in IRW production in tropical producer regions to 2050 ( 24%) compared with global growth rates (45%) is explained mainly by the relatively low rate of growth in consumption projected for the tropical producer regions. Only a 20% increase is anticipated by 2050 due to relatively low growth in demand for primary-processed wood products in these regions as well as to bottlenecks in industrial processing and limitations posed by IRW production systems. These aspects are discussed later.
In general, the domestic uptake of IRW is projected to be comparatively low in tropical producer regions. Thirty-eight percent of the global population will live in tropical producer regions by 2050 but only 17% of global IRW will be consumed there (Figure 6). Wood consumption in those economies will not catch up with industrialized economies by 2050, despite population growth and the considerable potential for growth in market demand (Figure 7). This won’t change unless wood-product consumption increases in the construction and manufacturing sectors in tropical producer regions.
More positively, woodfuel consumption is projected to drop substantially, notably in sub-Saharan Africa, where per-capita consumption will decline from 0.6 m³ in 2015 to 0.2 m³ in 2050 (Figure 8). Nevertheless, given the large increase in population projected in sub-Saharan Africa over the period, the region’s woodfuel demand will still be the highest of all the world regions (Figure 4).
500
1000
1500
2000
2500
3000
2000 2015 2050 2000 2015 2050 Industrial roundwood Woodfuel
mill
ion
m3 (R
WE)
Southeast Asia
Latin America and Caribbean Sub-Saharan Africa
Rest of world
Figure 4: Industrial roundwood and woodfuel production, 2000, 2015 and 2050
Sources: FAO (2020); GPFM, corrected/adjusted by the authors.
Figure 5: Projected production and consumption of industrial roundwood and woodfuel in tropical producer regions, 2050
50 100 150 200 250 300 350 400
Latin Americaand Caribbean
SoutheastAsia
Sub-SaharanAfrica
Latin Americaand Caribbean
SoutheastAsia
Sub-SaharanAfrica
Industrial roundwood Woodfuel
mill
ion
m3 (R
WE)
Production Consumption
Sources: FAO (2020); GPFM, corrected/adjusted by the authors.
Figure 6: Projected global industrial roundwood production and consumption in 2050, by selected world region
Sub-SaharanAfrica, 3%
Latin America andCaribbean,10%
SoutheastAsia, 6%
China,12%
Europe, 32%
North America,
28%
South Asia, 4%
Rest of world, 5%
Industrial roundwood production, 2050
Sub-Saharan Africa, 2%
Latin America andCaribbean, 9%
SoutheastAsia, 6%
China, 21%
Europe, 32%
NorthAmerica,
20%
South Asia, 5%
Rest of world, 5%
Industrial roundwood consumption, 2050
Source: GPFM, corrected/adjusted by the authors.

17
TS49
TradeAlong with domestic consumption, exports will be a main driver of IRW production growth in tropical producer regions. For example, around 75% of the projected growth in IRW production in Latin America and the Caribbean to 2050, and 38% of growth in Southeast Asia, can be explained by increasing IRW exports.
By 2050, all tropical producer regions will be net exporters of IRW5(Figure 9; Annex 9), mainly consisting of plantation roundwood. Southeast Asia
5 Note that the net export volume projected by the GFPM indicates the trade balance, and exports and imports may be higher. Further, net exporters and net importers will still be importing and exporting.
Figure 7: Population growth, consumption growth and total consumption of industrial roundwood, 2015–2050, by selected world region
Sub-Saharan AfricaLatin America and Caribbean
Southeast Asia
China
Europe
North America
South Asia
0%
50%
100%
150%
-50% 0% 50% 100% 150%
Cons
umpt
ion
grow
th, 2
015–
2050
Population growth, 2015–2050
Industrial roundwood consumption
Note: Europe = approx. 0.9 billion m3 (RWE).
Sources: GPFM, corrected/adjusted by the authors; UN (2020a).
will be a net exporter of 14 million m³ of IRW per year, supplied mainly by Malaysia, Viet Nam and the Lao People’s Democratic Republic (in descending order by volume). Latin America will also be a net exporter of IRW in 2050, at 42 million m³, with Brazil and Chile contributing 22 million m³ and 17 million m³, respectively. Sub-Saharan Africa’s net trade surplus will reach 15 million m³ in 2050, almost exclusively because of net exports from South Africa of 14 million m³. IRW exports in 2050 will mainly target markets in Asia, especially China and South Asia. North Africa will also be an important importer of IRW. East Africa, the Caribbean, Peru and the Philippines will experience significant IRW supply gaps by 2050.
Figure 8: Per-capita consumption of industrial roundwood and woodfuel in 2015 and 2050, by selected world region
0.0
0.2
0.4
0.6
0.8
1.0
1.5
1.4
1.6
2015 2050
Sub-Saharan Africa
2015 2050 2015 2050 2015 2050 2015 2050 2015 2050 2015 2050
Industrial roundwood
South Asia Latin Americaand Caribbean
Southeast Asia China Europe North America
Woodfuel
m3 (
RWE)
per
cap
ita
Sources: GPFM, corrected/adjusted by the authors; UN (2020a).
Effects of GDP fluctuations on tropical timber productionRecent decades have shown that global economic fluctuations affect global and tropical timber production, with economic shocks resulting in substantial production declines. Typically, tropical IRW production has recovered within three to five years after economic shocks—more dynamically than the global average. In general, GDP fluctuations do not have a strong effect on woodfuel consumption, the exception being in Latin America, where the share of industrial woodfuel consumers is relatively high, and consumption patterns suggest a modest relationship with GDP.

18
TROPICAL TIMBER 2050
Industrial roundwood
The GFPM projections presented above indicate moderate development paths and consider foreseeable megatrends. But timber is a vital raw material for global industries, and its consumption is directly related to short-term economic dynamics. Here, we examine historical developments in the global economy and draw lessons for understanding the potential impacts of GDP fluctuations on the projections.
Past decades have seen several economic fluctuations with significant impacts on global timber consumption patterns—some of global magnitude, others more regional in scale. Experts and science suggest that the frequency of such events will increase in the future (OECD 2010; Zseleczky and Yosef 2014).
At the time this report was produced, the COVID-19 pandemic was causing a unique shock to the global economy, resulting in a drop of global GDP of 4.4% in 2020 (IMF 2020). The crisis is likely to have affected timber production in 2020. Although the
impact on timber production could not be quantified at the time of writing, the drop may be similar to previous economic shocks. The highest reduction in timber production in recent decades occurred during the global financial crisis of 2009, when global IRW production fell by more than 6% for two consecutive years.
Global timber production recovered within three to five years after economic downturns in 2001 and 2009 to reach pre-crisis production levels (Figure 10). But history also shows longer recovery periods; for example, global timber production took more than ten years to recover after the collapse of the socialist economies in the 1990s.
Assuming that the world economy will recover from the impacts of the pandemic by the end of 2021 (according to the International Monetary Fund’s scenario of June 2020), it seems reasonable to assume that global timber production will reach pre-crisis levels by 2026. This will affect GFPM forecasts of timber consumption. The pre-crisis configuration of the GFPM projected a global demand for IRW of around 2.9 billion m³ by 2050. Factoring in a pandemic-induced five-year recovery period, the consumption volume in 2050 will be around 2.6 billion m³ (Figure 10).
In light of the pandemic, the annual growth rate of IRW production will drop from 1.1% to 0.9% between 2020 and 2050, still higher than the growth rate of 0.7% achieved in the 30-year period between 1989 and 2019.
Timber production in the tropical producer regions of sub-Saharan Africa, Latin America and the Caribbean and Southeast Asia has reacted in different ways in the past to global economic shocks
Figure 9: Trade balance of industrial roundwood in 2050, by selected world region
-300 -200 -100 0 100 200 300China
EuropeLatin America and Caribbean
North AmericaNorth Africa/Western Asia
OceaniaRest of AsiaSouth Asia
Southeast AsiaSub-Saharan Africa
million m3 (RWE)
Industrial roundwood
Source: GPFM, corrected/adjusted by the authors.
-5.00 -4.00 -3.00 -2.00 -1.00 -
1.00 2.00 3.00 4.00 5.00
500
0
1,000
1,500
2,000
2,500
3,000
1989
1990
1991
1992
1993
1994
1995
1996
1997
1998
1999
2000
2001
2002
2003
2004
2005
2006
2007
2008
2009
2010
2011
2012
2013
2014
2015
2016
2017
2018
2019
2020
2021
2022
2023
2024
2025
2026
2027
2028
2029
2030
2031
2032
2033
2034
2035
2036
2037
2038
2039
2040
2041
2042
2043
2044
2045
2046
2047
2048
2049
2050
% G
DP g
row
th p
er y
ear
mill
ion
m3 (
RW
E)
IRW production baseline (without COVID impact) IRW production (COVID-adjusted) GDP growth (current USD) (second wave)
Figure 10: Global industrial roundwood production and GDP growth, 1989–2050
Sources: FAO (2020) (baseline years 1989–2019); GFPM (baseline years 2020 to 2050); World Bank (2020) for GDP 1989–2019; IMF (2020) for GDP 2020–2050;
authors’ elaboration for COVID-19-adjusted IRW production.

19
TS49
Figure 11: GDP growth rates, tropical producer regions and world, 1990–2025
-10.0
-5.0
0.0
5.0
10.0
15.0
1990
1991
1992
1993
1994
1995
1996
1997
1998
1999
2000
2001
2002
2003
2004
2005
2006
2007
2008
2009
2010
2011
2012
2013
2014
2015
2016
2017
2018
2019
2020
2021
2022
2023
2024
2025
GDP
grow
th (%
)
World Sub-Saharan Africa Latin America Southeast Asia
Sources: World Bank (2020) for GDP 1990–2019; IMF (2020) for GDP 2020–2025.
Sources: FAO (2020) (baseline years 1989–2019); GFPM (baseline years 2020–2026); World Bank (2020) for GDP years 1990–2019;
IMF (2020) for GDP 2020–2026; authors’ own elaboration for COVID-19-adjusted IRW production.
Figure 12: Industrial roundwood production in tropical producer regions and World GDP growth, 1990–2026
-5.0
-4.0
-3.0
-2.0
-1.0
0.0
1.0
2.0
3.0
4.0
5.0
50
100
150
200
250
300
2000
2001
2002
2003
2004
2005
2006
2007
2008
2009
2010
2011
2012
2013
2014
2015
2016
2017
2018
2019
2020
2021
2022
2023
2024
2025
2026
GDP
grow
th (%
)
mill
ion
m3 (
RWE)
Sub-Saharan Africa (COVID-adjusted) Latin America (COVID-adjusted) Southeast Asia (COVID-adjusted)
Latin America (baseline) Southeast Asia (baseline) GDP (current USD) (second wave)

20
TROPICAL TIMBER 2050
and depressions. Since the early 2000s, however, economies in the tropical timber producer regions have become increasingly connected to global economic development, and regional GDPs have more or less followed fluctuations in global GDP (Figure 11).
Timber production in Latin America and Southeast Asia clearly dropped in reaction to the GDP fluctuations in 2001 and 2009 (Figure 12) but, in both regions, production had mostly recovered to pre-crisis levels within three years. Notably, in both regions, IRW production showed impressive growth in the years after the economic shocks, temporarily overcompensating for the losses incurred during the crises.
Timber production in sub-Saharan Africa has been largely disconnected from global economic fluctuations and has barely reacted to drops in global GDP. This may not be the case, however, for those countries in the region with a high dependency on wood-product exports.
All three regions are experiencing massive recessions due to the COVID-19 pandemic (IMF 2020). Latin America will likely be affected hardest, with a negative GDP of more than 8% in 2020. Regional GDP growth is expected to be around 3% in both sub-Saharan Africa and Southeast Asia in 2020, which is less of a drop than the predicted global average of 4.4%.6
6 Scenario of the IMF, October 2020 (www.imf.org/en/Publications/WEO/weo-database/2020/October).
The impact of the pandemic on tropical forest sectors may be stronger than during previous events because of the magnitude of the economic shock and the greater integration of tropical forest sectors in global value chains. Given this, it may take longer for timber production in tropical producer regions to reach pre-crisis levels.
Figure 12 shows projected timber production assuming a conservative five-year recovery phase in Latin America and Southeast Asia, with production in sub-Saharan Africa largely unaffected. Note that the production drop in 2020 in the figure is only to visualize the impact of the recession. An exact quantification of production losses is not yet possible.
Woodfuel
Previous fluctuations in global GDP have had a less noticeable impact on woodfuel consumption in tropical producer regions than on IRW. One reason for this is the lack of reliable data on woodfuel consumption, which is commonly based on estimates.
FAO-recorded woodfuel consumption in sub-Saharan Africa and Southeast Asia has not changed in the past in reaction to GDP fluctuations (Figure 13). In both regions, woodfuel is a major source of primary energy required for daily subsistence and is usually available at low or without any direct cost; consumption to meet daily needs is not subject to macroeconomic
Figure 13: Woodfuel consumption in tropical producer regions, and world GDP growth, 2000–2019
Sources: FAO (2020); World Bank (2020).
-2.00
-1.00
0
1.00
2.00
3.00
4.00
5.00
0
100
200
300
400
500
600
700
2000
2001
2002
2003
2004
2005
2006
2007
2008
2009
2010
2011
2012
2013
2014
2015
2016
2017
2018
2019
GDP
grow
th (%
)
mill
ion
m3 (
RWE)
Sub-Saharan Africa Southeast Asia Latin America World GDP
21
TS49
impacts. Temporary increases in consumption due to the re-migration of part of the urban labour force to rural areas during economic recessions could not be identified in the data. Such a phenomenon may have a significant impact on woodfuel consumption at the local level but has not tended to affect regionally aggregated consumption volumes.
Woodfuel consumption has shown volatility in response to GDP fluctuations in Latin America, however. Although not statistically significant, data suggest that decreasing GDP growth in that region has resulted in a reduction in woodfuel consumption. The reason for this might be the higher share of consumption accounted for by industrial consumers (e.g. in the manufacture of steel); their usage is likely to decline during economic downturns as they reduce production due to decreased demand.
Sources of future tropical roundwood supply Overall demand for roundwood harvested in natural forests in tropical producer regions will decline to 2050 due to decreasing woodfuel consumption. Demand for IRW from these regions will increasingly be met by plantation-grown timber, with IRW production in natural forests remaining fairly stable.
The GFPM projects a total production volume of roundwood in tropical producer regions of 1253 million m³ in 2050, of which woodfuel will account for 57% (719 million m³). The GFPM projects a total IRW production volume of 534 million m³ in 2050 (43% of total roundwood production).
There is high uncertainty in the share of natural-forest timber production in total production in 2050. This is mainly because tropical hardwoods and plantation-grown timber can substitute for each other in numerous market segments (Figure 14). Moreover, the competitiveness of natural-grown tropical hardwoods is constrained by high production costs and limited versatility in final applications. Natural-grown tropical hardwoods are expected to maintain a long-term advantage over plantation-grown timber in only a few core market segments, such as outdoor applications, furniture and high-end interior works (Turner 2010). No identifiable trend suggests a substantial increase in for tropical timber from natural forests to 2050. Figure 14 presents a range for tropical hardwood production from natural forests of up to 149 million m³ in 2050but indicates that exact volumes cannot be projected and the range is more likely to be lower than higher.
Primary wood-product specifications in future markets will directly affect raw-material requirements. Fibre-based wood products will increase market share, triggering timber production in high-productivity, short-rotation plantations. Sawlog-based wood products will increasingly be used as inputs for engineered wood products and mass timber, requiring strict compliance with quality and product standards. The total volume of plantation-grown IRW in 2050 is estimated at 327 million m³, with an unknown portion destined for use as woodfuel.
Woodfuel and modern biomass
Woodfuel will account for 57% (719 million m³) of total roundwood production in tropical producer regions in 2050. Private households will still rely heavily on natural forests and woodlands as their main resource base, but woodfuel plantations, agroforestry systems and woodlots established by households and communities will increasingly address demand. Globally, only about 7% of woodfuel consumption was supplied from plantations in 2010, and natural forest is still the dominant source of woodfuel in tropical regions (Penna 2010). The share of plantation-grown woodfuel is hard to estimate, and the rate of future substitution of plantation-grown biomass for natural-forest woodfuel will depend on national policies promoting woodfuel planting, the dissemination of knowledge and materials, and funding for these efforts.
The production of modern biomass (e.g. wood pellets, woodchips for large-scale biomass plants, and retort-produced charcoal) will predominantly use plantation-grown biomass and wood-industry residues. Some tropical producer countries have already established supply chains to feed modern biomass-based industries. In Brazil, the world’s largest charcoal producer, for example, about 70% of charcoal is derived from plantation-grown timber for industry end users (Bailis et al. 2013).
Notably, only a small proportion of regional modern biomass production (as of 2015) is consumed in the tropical producer regions, and significant shares are exported to industrialized economies (e.g. wood pellets and woodchips from Viet Nam to Japan and the Republic of Korea). Nevertheless, biomass plays a crucial role in the sustainable-energy strategies of several tropical countries (IRENA 2014), indicating that regional demand will grow for plantation-grown biomass.

22
TROPICAL TIMBER 2050
Industrial roundwood
The GFPM projects a total IRW production volume of 534 million m³ in 2050 (43% of total roundwood production). Of this, the share supplied by natural forests will decline from around 35% in 2015 to 27% in 2050, although the total production volume of tropical hardwood IRW will decrease only slightly, with a production volume of up to 149 million m³ in 2050 (down from 150–160 million m³ in 2015). The projected stagnation of tropical hardwood IRW production continues a historical trend since 1990: tropical hardwood production volume has been relatively stable (at 150–170 million m³ per year; Figure 15) over the last three decades. Although overall IRW production has grown by more than 60% in tropical producer regions since 1990, the share of tropical hardwoods has declined from 58% to 35%.
Production volumes have changed substantially over time in individual countries. For example, Peru’s formal tropical timber production declined between 2007 and 2019 due to the decreasing availability of commercial species and changes in the concession system. On the other hand, Cameroon’s production has generally increased since 2000 due to the expansion of concession areas and increased log exports (Figure 16).
Projections of production indicate increasing demand for plantation-grown pulp and fibre logs and sawlogs. Production volumes of plantation-grown IRW is estimated at 389 million m³ in 2050, representing 73% of total IRW production in tropical producer regions (Table 2). The actual share of plantation-based production is estimated at around 65% (Payn et al. 2015; Nepal et al. 2019).
The growing demand for plantation timber is triggered by market requirements that increasingly favour standardized and highly versatile raw materials to feed large-scale industrialized primary processing. Moreover, applications of wood products in key markets are undergoing fundamental changes; for example, the construction sector, which is the main market for sawnwood products, will increasingly consume high-performance engineered wood products for mass timber construction, a trend driven by the development of sustainable construction solutions in increasingly urbanized societies.
Challenges in topical timber production in natural forests and plantations The production of tropical timber in natural forests will face increasing competition from planted forests to 2050. To maintain market share, sustainable forest
Notes: Dark-green boxes present the roundwood mix from various sources; blue boxes present roundwood flow from planted sources; yellow boxes present natural forest roundwood flows; and light-green boxes present roundwood flows that include planted and natural sources.
Source: Authors’ own elaboration based on GFPM projections.
Figure 14: Indicative flow of roundwood in tropical producer regions in 2050
Roundwood production volume in tropical producer regions 2050 1253 million m3 (100%)
Net exports from various sources
60–70 million m³ (6%)
Pulp/fibre logs from plantations and agroforestry
178 million m3 (14%)
Sawlog/veneer logs from plantations and agroforestry > 149 million m³ (12–24%)
Sawlog/veneer logs (tropical hardwoods) from natural forests and agroforestry
< 149 million m³ (0–12%)
Woodfuel production, mainly from natural forests
719 million m³ (57%); increasing share
of plantations and agroforestry supplyWoodpulp, particleboard,
fibreboard, textile fibre+
Innovative fibre uses and wood chemicals
Sawnwood, veneer and plywood, secondary-processed products
(e.g. mass timber, glue lam, cross-laminated timber,
carpentry, flooring) +
processing residues for use as wood fibre and bioenergy
Modern construction, paper packaging, paper and paperboard,
textiles, chemical industries
Furniture, interior works, solid wood
packagingTraditional construction and special market segments
(e.g. boat building)
Fuelwood, charcoal, wood pellets, woodchips
Traditional combustion (mainly pivate households)
Modern combustion (mainly industries and
energy sector)
Sawnwood, veneer and plywood, secondary-processed products
(e.g. carpentry, flooring)+
processing residues mainly for use as bioenergy
(fuelwood, charcoal)

23
TS49
Tropical producer region Industrial roundwood (IRW) production
(1000 m3)a
Natural-forest hardwood production (1000 m3)b
% natural-forest hardwood production as percent
of totalb
IRW plantation production (1000 m3)b
Sub-Saharan Africa 78 049 39 025 50 39 025
Latin America and the
Caribbean
282 664 28 266 10 254 398
Southeast Asia 173 206 77 943 45 95 263
Total 533 919 145 234 27 388 686
Table 2: Industrial roundwood production in 2050 from natural forests and plantations in tropical producer regions
Sources: a Projections of the GFPM; b estimate based on Nepal et al. (2019).
Figure 15: Total and natural-forest industrial roundwood production in tropical producer regions, 1990–2019
Source: ITTO (2020), corrected for pulplogs and plantation volumes in Southeast Asia.
Figure 16: Industrial roundwood production, Cameroon and Peru, 2000–2019
0
10
20
30
40
50
60
70
0
100 000
200 000
300 000
400 000
500 000
600 000 19
90
1991
1992
1993
1994
1995
1996
1997
1998
1999
2000
2001
2002
2003
2004
2005
2006
2007
2008
2009
2010
2011
2012
2013
2014
2015
2016
2017
2018
2019
% n
atur
al-fo
rest
har
dwoo
ds in
pro
duct
ion
mill
ion
m3 (
RWE)
Natural-forest hardwood production Total industrial roundwood production, tropical producer regions
Plantation production, tropical producer regions % share of tropical hardwoods in industrial roundwood production
0.0
0.5
1.0
1.5
2.0
2.5
2000
2001
2002
2003
2004
2005
2006
2007
2008
2009
2010
2011
2012
2013
2014
2015
2016
2017
2018
2019
2000
2001
2002
2003
2004
2005
2006
2007
2008
2009
2010
2011
2012
2013
2014
2015
2016
2017
2018
2019
Indu
stria
l rou
ndw
ood
prod
uctio
n (m
illio
n m
3 RW
E)
Peru
0.0
0.5
1.0
1.5
2.0
2.5
3.0
3.5
4.0
4.5
Indu
stria
l rou
ndw
ood
prod
uctio
n (m
illio
n m
3 RW
E)
Cameroon
Source: FAO (2020).

24
TROPICAL TIMBER 2050
management (SFM) in tropical forests will need to become more competitive by expanding the range of commercial timber species and including revenue streams from ecosystem services, including carbon sequestration. Industrial concessions and communities will need to improve their silviculture and obtain third-party certification of legality and sustainability.
Plantation forestry will be the main supplier of future timber markets in tropical producer regions. With limited expansion possibilities for large-scale plantations, smallholder and agroforestry production will become increasingly important. Both systems need further improvements in productivity and timber quality. Private-equity capitalization and incentives for plantation-based enterprises, large and small, will be key for stimulating sector growth.
Natural forests in future tropical timber supply
Future tropical timber production in natural forests will have to consider multiple societal demands and provide proof of sustainability.Net deforestation has been substantial in tropical producer regions in recent decades. Latin America and the Caribbean and Southeast Asia have both lost 5% of their forest cover since 2000, and sub-Saharan Africa has lost 7%; overall, these three regions lost 108 million ha between 2000 and 2015 (FAO 2016). GFPM projections indicate a slowdown in net deforestation in Latin America and the Caribbean and Southeast Asia, with about 1% additional forest-cover loss to 2050, but sub-Saharan Africa is projected to lose another 8% of its forest. The main drivers of deforestation will be land-use change to agriculture, pasture, infrastructure, settlement and mining.
The consequences of deforestation are felt at the local to global scales. Deforestation affects the livelihoods of local communities, reducing their supply of forest products (e.g. woodfuel and non-wood forest products) and ecosystem services. It also degrades the natural capital stock of countries and contributes to biodiversity loss and greenhouse-gas emissions.
Ongoing deforestation and weak forest governance in tropical producer regions have led to stagnating market demand for tropical timber in industrialized countries. Overall, the commercial use of timber produced in natural tropical forests is perceived negatively in international forest policies and in national timber procurement (Turner 2010), and
many tropical timber consumer countries prioritize the conservation of natural forests and the maintenance of ecosystem services. Although there is evidence that SFM that includes timber production can be compatible with conservation objectives, multipurpose management remains challenging to implement and monitor (Grulke et al. 2016). Appropriate SFM approaches will result in tradeoffs in both economic returns and conservation. The voluntary certification of SFM, and international initiatives like the European Union Forest Law Enforcement, Governance and Trade (EU FLEGT) programme, are crucial instruments for the future of timber production in natural tropical forests.
The sustainability of timber production in natural tropical forests is limited by a lack of management planning. Timber is produced in tropical countries by a variety of actors, such as rural households, micro-scale operators, industrial concessionaires and community-based forest managers. The latter two in particular are crucial for SFM in tropical forests and supply substantial volumes of good-quality timber (although data do not clearly indicate the production share).
Despite the significant areas under community-based forest management (CBFM) and industrial concessions, only 191 million ha of natural tropical production forests (11% of the total natural tropical forest area) had forest management plans in 2015, indicating difficulties for the sustainable supply of natural tropical timber (MacDicken et al. 2015).
Globally, the area of natural forest in tropical producer regions (1.7 billion ha, of which 123 million ha consists of industrial concessions and 716 million ha is under CBFM; see Figure 17) should be sufficient to sustainably supply the projected 149 million m³ of IRW and a substantial share of the projected 719 million m3 of woodfuel demand in 2050. Supply gaps could arise at the national and subnational levels, however, in the face of population pressure, resource depletion and poor governance (see the national-level GFPM projections in Annex 9).
Industry concessions in natural forests will need to explore new business models and silvicultural concepts. Forest concessions cover about 123 million ha across the three tropical regions (Figure 17). The situation is heterogeneous, with some countries terminating their concession systems and others modernizing theirs. Among the most important challenges facing concessions are the complexity of natural-forest management; the increasing area

25
TS49
of secondary forests and logged-over concessions; the requirements for complying with environmental and social safeguards; the often poor forest governance systems in tropical countries; the narrow market for only a few of the many tree species in natural tropical forests; competition from informal and partly illegal actors, which undercuts domestic market prices as well as some international markets (e.g. in Asia); and conflicts in large-scale concessions between enterprises and communities, often because of the longstanding neglect of participatory processes during the planning and execution of concession management (FAO 2018).
In the face of increasing demands on tropical forests for their multiple goods and ecosystem services, SFM-oriented timber production must become an accepted tool for forest conservation while ensuring benefits for a wide range of actors, from small to large scale and from communities to industrial players. Industrial concessions need new business models, moving away from timber-dominated approaches towards diversified models aimed at producing multiple goods and ecosystem services (Karsenty and Vermeulen 2016). In the course of this development, new silvicultural strategies will need to be explored and adopted.
CBFM will need more support to overcome capacity gaps and to participate successfully in the timber markets of the future. The total areaof forest subject to CBFM across the three tropical producer regions is estimated at 716 million ha (Figure 17). There is evidence that, when population pressure is not too high, community-managed forests are more effective than centrally managed forests at preventing forest degradation (FAO 2018), but integrating CBFM schemes into value chains remains challenging. Frequently, for example, CBFM is subject to conflicts over land tenure; communities lack management plans and technical and financial capacity and require significant support to build this; market access is poor; and communities must often rely on service providers to execute forest operations (Gilmore 2016).
A lack of community capacity and appropriate management planning is restricting the participation of CBFM operations in timber value chains. Although several countries have made substantial progress, there is still a need to revise legislation and improve the enabling environment. Flexibility is needed in forest regulations to reflect the wide range of forest conditions and actors in CBFM.
Forest plantations in future tropical timber supply
Plantations will supply future tropical timber demand from diversifying production systems. The area of natural forests is declining in the tropics and the area of forest plantations is increasing. The total area of forest plantations in the three tropical producer regions is estimated at more than 40 million ha (FAO 2016)—although part of this is designated for protection and conservation purposes. Plantations produced an estimated 67% of IRW supply in the tropical regions in 2015, and this proportion is projected to increase to 73% by 2050 (Figure 18).
The biggest increases in forest plantation area to 2050 are projected to be in Southeast Asia and Latin America, with only minor increases in Africa (Indufor 2012; d’Annunzio 2015).
No comprehensive information is available on the structure of plantation ownership and enterprises in the tropics. FAO (2016) estimated that 50% of the global plantation estate was owned publicly in 2005. Since then, however, there has been substantial private-sector investment in tropical plantations, and huge internationally funded smallholder promotion programmes have been implemented. At the same time, several countries (e.g. the United Republic of Tanzania and Zambia) have partly privatized publicly owned plantation estates. Hence, the ownership structure may look quite different today.
0 50
100
150
200
250
300
350
400
450
Latin America and Caribbean Sub-Saharan Africa Southeast Asia
mill
ion
ha
Area under industrial concessions Area under community-based forest management
Figure 17: Industrial concession areas and areas under community-based forest management in tropical regions, 2015
Note: The area given for concessions in sub-Saharan Africa includes only Central and West Africa.
Sources: FAO (2018); Gilmore (2016).

26
TROPICAL TIMBER 2050
Plantations will receive increasing interest from financial and industrial investors, but investment opportunities need to develop. Large-scale plantations are operated by both public and private enterprises. Commonly, these operations are integrated units or profit centres of a corporation’s processing activities. Significant plantation estates in the tropics supply huge pulp industries, sawmills and particleboard/fibreboard producers.
Large investors in commercial plantations generally raise their own public or private finance for their forestry investments. Even so, there are several ways they can increase the attractiveness of their investment while also reducing risks to the business, including by making strategic and operational choices based on good market research, careful site–species–market matching, and the adoption of appropriate management practices to ensure optimum growth and quality.
Many large-scale plantations in the tropics have failed financially without industrial integration. The capital intensity of such operations is substantial, and dealing with global commodity market dynamics and local risks in developing countries is complex. Nevertheless, increasing interest among institutional investors in forests as an asset class has prompted the establishment of numerous forest funds in recent years with substantial investments in large-scale plantations in tropical regions; examples include New Forests in Southeast Asia, Criterion African Partners in sub-Saharan Africa, and the Arbaro Fund in Latin America and Africa.
Plantation-sector investors are particularly active in Asia and Latin America, where there is significant market and economic growth and forest companies are looking to obtain market share and secure access to resources as part of their global strategies. On the other hand, few international companies have invested significantly in sub-Saharan Africa outside South Africa, despite rapidly increasing demand driven by population growth. The pre-maturity of timber and forestry markets, difficult access to land, and the green-field nature of most investment opportunities have tended to deter international investors (ITTO/IMM 2019).
Smallholders and outgrowers will be crucial for timber production to 2050 but face technical and financial constraints. Triggered by growing market demand and increasing timber prices, smallholder plantations and woodlots have grown in significance in tropical regions. Some farmers and communities are planting trees independently as individuals or in groups and others are organized under the umbrellas of donor-funded programmes (e.g. the originally European Union-funded and now FAO-operated Sawlog Production Grant Scheme in Uganda and the Participatory Forest Programme in the United Republic of Tanzania). In Latin America, many countries provide incentives for smallholders, such as the Certificado Incentivo Forestal in Colombia and the highly successful Chilean incentive scheme (now phased out).
Large-scale forest companies are also operating outgrower schemes to enable them to draw on smallholder woodlots as a means of supply and risk management. This model is receiving increasing interest because access to large portions of land for industrial plantations is becoming more difficult and expensive in many tropical countries.
In general, smallholders face restrictions on their access to high-quality seeds and seedlings, and many lack silvicultural knowledge and the financial capacity to bridge the time lag in obtaining returns on investment. Thus, opportunity costs and technical support often determine the potential for scaling up smallholder activities; the need of smallholders for early returns tends to favour the production of short-rotation, low-quality timber. In Viet Nam, for example, smallholders produce more than 20 million m³ annually, but the impact of this on the development of the domestic wood sector remains limited. A large proportion of the raw material is exported as woodchips, despite a desperate need among
Figure 18: Industrial roundwood production in forest plantations in tropical producer regions, 2015 and 2050
Note: See Table 2 for volumes.
Sources: Based on Payn et al. (2015); Nepal et al. (2019).
37%
87%
48%
67%
50%
90%
55%
73%
0102030
405060
7080
90100
Sub-SaharanAfrica
Latin Americaand Caribbean
Southeast Asia Total tropicalproducer regions
%
Plantation-grown wood as % of total industrial roundwood, 2015
Plantation-grown wood % of total industrial roundwood, 2050

27
TS49
domestic enterprises for sawlogs. In fact, Viet Nam is importing increasing quantities of sawlogs for domestic processing. Given the dispersed nature of the production system, increases in domestic timber production have not resulted in large gains in employment in the formal forest sector (Figure 19).
Plantations are facing risks and restrictions. Planted forests are increasingly threatened by pests and diseases, either introduced accidentally or adapted to new host trees. Managing this threat requires innovative solutions and a global approach (Wingfield et al. 2015). There is an ongoing need to develop, test and mass-produce “new” plantation species and clonal varieties. Different techniques need to be tried and adopted, such as in terms of spacing, crop management and the wider use of alternative production models (e.g. silvopastoral systems).
Increasing competition for fertile land and a focus on rehabilitating degraded land also bring challenges for commercial tree-planting. Important considerations include better identifying sites that will support productive tree growth; the careful matching of species to such sites (including the use of indigenous species, where appropriate); and adopting techniques to ameliorate site conditions, such as site-specific fertilization and cultivation.
Agroforestry and tree-crops in future tropical timber supply
Exotic species from “modern” agroforestry systems increasingly contribute to timber supply, but traditional production systems will continue to be largely subsistence-driven. Agroforestry is a
form of land use in which woody perennials (such as trees, shrubs, palms and bamboos) and agricultural crops and animals are produced on the same parcel of land in some form of spatial and temporal arrangement (FAO 2019b). Some agroforestry systems traditionally grow and make use of native species, and others mix exotic tree species with agricultural production and animal husbandry. Thus, agroforestry systems can be sources of both exotic and indigenous tree species.
Another important source of timber in tropical producer countries are trees outside forests, although this resource cannot clearly be separated from agroforestry, and the two frequently overlap (FAO 2002). Generally, trees outside forests are characterized by lower tree densities per hectare, and they are not necessarily linked to an agricultural production system. There is no comprehensive source of data on timber production from trees outside forests at a regionally aggregated scale, and this section, therefore, refers only to areas that can be clearly identified as agroforestry production systems where tree canopies cover more than 30% of the surface area in a given portion of land.
Globally, there is an estimated 209 million ha of agroforestry systems in tropical producer regions with tree cover of more than 30% (Zomer et al. 2014) (Figure 20). Despite this large area, however, the role of agroforestry in IRW production has not been analyzed systematically, although data from case studies indicate that it could be substantial in some countries and regions. In India, for example, agroforestry and trees outside forests provide more than 90% of domestic IRW production (Shrivastava and Saxena 2017; Dev et al. 2018). There are also examples of agroforestry systems in Latin America and Africa that provide sawlogs and biomass for industrial uses (Somirraba et al. 2012; Iiyama et al. 2014). In Indonesia, homegarden systems supply tropical hardwood sawlogs to domestic processors (Irawanti et al. 2017; Rahman et al. 2016).
Nevertheless, the vast majority of the land under agroforestry is used for subsistence and to supply artisanal industries, and few national forest policies take agroforestry fully into account as a potential sustainable resource base. Increasing the participation of agroforestry systems in timber value chains is often restricted by institutional frameworks that neglect the character of such systems and apply general forest-sector licensing regulations to them, which are challenging to meet for occasional timber producers.
Figure 19: Forestry employment and industrial roundwood production and trade, Viet Nam, 2000–2018
5 000
10 000
15 000
20 000
25 000
30 000
5
0 0
10
15
20
25
30
1998
1999
2000
2001
2002
2003
2004
2005
2006
2007
2008
2009
2010
2011
2012
2013
2014
2015
2016
2017
2018 No
. of e
mpl
oyee
s in
fore
stry
and
logg
ing
mill
ion
m3 (
RWE)
Employment in forestryExport woodchips IRW production, less woodchips and IRW exportsIRW imports
Sources: FAO (2020); Viet Nam annual statistical yearbooks (2001–2019)
published by the General Statistics Office of Viet Nam.

28
TROPICAL TIMBER 2050
In the case of natural-forest-based agroforestry systems, licensing procedures and insecure land tenure are serious constraints (FAO 2019b).
The area of agroforestry systems that purposefully produce commercial IRW and woodfuel is increasing, in which exotic hardwood species are commonly intercropped or planted on short rotations. In Latin America, for example, silvopastoral systems are gaining increasing interest in the supply of timber for wood-based industries, pulp producers and biomass at a large scale (FAO 2019a). The areas of such systems, and their contributions to overall timber supply, are unknown. In Africa, agroforestry systems have become an important source of woodfuel; Iiyama et al. (2014) suggested that such systems have substantial potential in sub-Saharan Africa if widely adopted at the landscape scale as an integrated strategy.
Interest in agroforestry is likely to continue increasing among policymakers and agricultural investors in view of the need for agricultural approaches that are resilient to climate change and which enable the carbon-neutral production of agricultural commodities (Reppin et al. 2020).
The potential of tree plantations to supply tropical timber markets in the future will depend on improvements in timber quality and increased knowledge on wood properties. Tree-crop plantations (e.g. rubber, oil palm, coconut and horticultural) have significant potential for IRW production in tropical regions. In Southeast Asia, rubberwood is already an important source of IRW: in Viet Nam, for example, rubberwood production exceeds 3 million m³ annually, which is 15% of domestic IRW production (Forest Trends 2018). There is about 11.4 million ha of rubber plantations globally, of which 8.8 million ha is in Southeast Asia. Because the quality of rubberwood stands varies, the actual volume entering wood
industries is unknown. Case studies suggest a commercial volume of 50–100 m³ per ha at the end of the rubber-tapping cycle (ITTO 2008).
Due to the price volatility of natural rubber, timber sales from rubber plantations have become important for stabilizing cash flows and generating positive returns. Traditionally, rubberwood has been used in furniture production, but research indicates that it is also suitable for structural construction (Eufrade et al. 2015). There is increasing interest in improving the silvicultural management of rubber plantations to place more emphasis on timber production. Thus, the rubberwood resource will continue to supply timber markets in the future.
The industrial potential of the wood standing in more than 30 million ha of oil-palm plantations has not been fully explored. Experts estimate that, over the course of replanting oil-palm plantations in Asia, Africa and South America, 100–120 million m³ of logs could be available annually.7 It appears, however, that no significant volumes are currently entering wood-processing value chains. Research is ongoing,8 but a significant market presence of palm wood seems unlikely in the near future.
Key actions to support tropical timber productionMultilevel efforts are required to maintain and enhance tropical timber production. These include making progress in forest governance, enhancing the competitiveness of timber production and establishing new business models. Timber production in natural forests will have to comply with increasing societal demands for proof of sustainability and the integration of ecosystem services. Plantations and agroforestry production must attract sufficient capital to professionalize production systems and produce high-quality timber for innovative wood-product markets.
Develop enabling forest governance systems. Investment in large-scale production in plantations and natural forests requires reliable and transparent forest policies and an enabling environment for investment. At the same time, small producers and communities need fair and equitable access to resources.
7 www.wbpionline.com/features/oil-palm-wood-an-untapped-resource-6012167
8 E.g. the international research and development programme PalmwoodNet (2015–2018), which combined actors from timber processing, palm-oil producers and timber consumers.
Figure 20: Estimated area of land under agroforestry in tropical producer regions, 2014
21%
9%
51%
0
10
20
30
40
50
60
0 10 20 30 40 50 60 70 80 90
100
Latin Americaand Carribbean
Sub-Saharan Africa Southeast Asia
% o
f tot
al a
gric
ultu
ral a
rea
mill
ion
ha
Area > 30% tree cover % of total agricultural area
Source: Zomer et al. (2014).

29
TS49
Hence, support for national efforts to improve forest policies and governance should be prioritized. Going beyond the analytical scope of this study, ongoing initiatives such as the EU FLEGT programme and those of FAO and the World Bank emphasize that clear, certified sustainable production, equitable laws on forest resource tenure and access, and effective law enforcement are instrumental for promoting forest-sector development.
Support the development of new business models for natural forest management and plantations. Tropical timber production can generate revenues from timber, non-timber forest products and ecosystem services (e.g. carbon storage and watershed protection) and thereby contribute to economic and social development. Such a blend of revenue streams, if realized, would provide leverage for commercial timber production where otherwise it would be economically restricted. Such blended business models must be further explored for natural forests, plantations and agroforestry.
Mobilize capital and incentives for smallholder tree-planting and communities. Smallholders and communities often lack access to capital for commercial activities. This is because most traditional financers see forestry as a high-risk investment and are deterred by the long length of time before the main income streams materialize. Forestry typically requires the vast majority of its finance in the early phase, and small actors often require financial incentives to kickstart their businesses. Such incentives could be in the form of soft loans or grants that are conditional on performance. Distributing free seedlings often does not have the desired result because growers do not value them sufficiently. Governments can offer direct and indirect incentives to attract investments in forest management and tree-planting, such as sound technical support (e.g. applied research and practical training facilities), infrastructure improvements and a favourable taxation environment that takes into account the peculiar timing of most forestry investments.
Resolve market constraints for smallholders and communities. The existence of accessible markets for products is crucial for the viability of smaller growers and communities. These actors often have weak market linkages and poor access to market information. They also lack the economies of scale and understanding of quality standards that are vital for accessing certain markets. Such constraints can be at least partly offset by assisting producers to consolidate into groups or clusters, which act to create an enabling environment by providing, among other things, technical support and market information.
Ensure adaptability to climate change, which will be crucial for maintaining forest productivity. Climate change is affecting timber production in various ways. Where temperatures are increasing and droughts becoming more frequent, trees are increasingly stressed and vulnerable to pests, diseases and wildfire, ultimately meaning reduced growth and often tree mortality. Silviculture must continually evolve to meet such challenges.
Research and development should be enhanced to continually adjust the silviculture of natural forests in light of changing biophysical and societal conditions, including the management of secondary and logged-over forests, adjusting to climate change, and the combined production of timber, non-timber forest products and ecosystem services. Other research topics should focus on increasing productivity in plantations and agroforestry. With a view to timber markets in 2050, emphasis should also be placed on obtaining a better understanding of wood properties to match future market demand in innovative products. Opportunities should be assessed for the greater use of lesser-known species in natural forests, timber from tree-crop plantations, and increasing the versatility of plantation species in multiple uses in the construction sector.

30
TROPICAL TIMBER 2050
This chapter summarizes key numbers on the future supply of and demand for primary-processed wood products in the tropical producer regions. It discusses the impact of fluctuations in global GDP on primary wood-product production and trade and describes factors that influence the vulnerability and resilience of tropical wood-sector industries. The chapter also reviews the challenges facing tropical wood-processing industries under changing market requirements and concludes with a set of actions to consider for enhancing tropical wood-processing industries to 2050.
ProductionThe projected global production volume of primary-processed wood products in 2050 will amount to 3.7 billion m³ RWE (+61% compared with 2015).9 The tropical producer regions will contribute 12% of this (Figure 21).
Sawnwood will be the most important primary-processed wood product globally in 2050 (1.2 billion m³ RWE), but the greatest increase in production is expected to be in veneer/plywood and wood-based panels. Combined, the output of these latter two product groups will surpass 1.6 billion m³ RWE in 2050. Global woodpulp production will be an estimated 760 million m³ RWE in 2050 (Figure 22).
Production in tropical producer regions will increase by a total of 36% (RWE) across all product groups. Among the regions, Southeast Asia will be the major producer of log-based products (i.e. sawnwood, veneer and plywood) (Figure 23), and Latin America will be the most important producer of fibre-based products (particleboard, fibreboard and woodpulp). Nevertheless, woodpulp production will decline significantly in Latin America and Southeast Asia (Figure 24). Although production in sub-Saharan Africa will increase by more than 60%, the total production volume of primary wood products will remain relatively small, at 50 million m³ RWE.
9 Detailed projections for world regions are available in annexes 3 and 9.
3 PRODUCTION AND CONSUMPTION OF TROPICAL WOOD PRODUCTS IN 2050
Key points• Global production of primary wood products
is projected at 3.7 billion m³ (roundwood equivalent) in 2050, an increase of 61% compared with 2015. Tropical production of primary wood products will increase by only 36%, however, to 476 million m3.
• The production increase in tropical producer regions will be driven partly by exports: net export volumes will contribute 23% to production growth to 2050 in Latin America and 30% in Southeast Asia.
• The domestic consumption of primary wood products will be relatively low in tropical producer regions in 2050, at 12% of global consumption, even though 38% of the world population will be living in those regions.
• Low domestic market demand in the tropical producer regions will constrain wood-industry development by deterring investments in modern, capital-intensive wood-processing industries.
• Forest industry employment in the tropical producer regions is projected to grow by 1.3 million jobs, to 7 million full-time-equivalent employees in 2050.
• Future employment in the forest sector, especially in wood-processing industries, will require a well-trained workforce, which still needs to be developed.
• The forest industry in tropical producer regions will need to modernize in the lead-up to 2050 and invest more than USD 40 billion in the expansion of processing capacities.
• Transformative public and private investments in the tropical timber industry will be required to overcome the tropical timber sector’s challenges. Public investments would facilitate the raising of private investments at scale and are needed to stimulate sustainable growth.
• The wood-processing sector will need to overcome structural barriers that hinder enterprise development.

31
TS49
Figure 21: Participation of selected world regions in the production and consumption of primary wood products, 2050
Source: GPFM, corrected/adjusted by the authors.
China, 29%
Europe, 29%
North America,20%
Primary wood product production, 2050
China, 41%
North America,16%
Primary wood product consumption, 2050
Europe, 17%
Sub-SaharanAfrica, 1%
Latin Americaand Caribbean, 6%
SoutheastAsia, 5%
South Asia, 3%
Rest of world, 6%
Sub-SaharanAfrica, 1%
Latin Americaand Caribbean, 6%
SoutheastAsia, 5%
South Asia, 4%
Rest of world, 10%
Figure 22: Primary wood-product production, 2000, 2015 and 2050
0
200
400
600
800
1,000
1,200
1,400
2000 2015 2050 2000 2015 2050 2000 2015 2050 2000 2015 2050
Sawnwood Veneer and plywood Particleboard and fibreboard Woodpulp
mill
on m
³ (RW
E)
Latin America and Caribbean Southeast Asia Sub-Saharan Africa Rest of world
Source: GPFM, corrected/adjusted by the authors.

32
TROPICAL TIMBER 2050
Consumption Primary wood-product consumption growth in tropical producer regions to 2050 will be higher than the global average, at +76%. Growth will be mainly in Southeast Asia (+108%), followed by sub-Saharan Africa (+76%) and Latin America (+ 56%). In volume terms in the three regions, the largest consumption of primary wood products in 2050 will be in Latin America, at 209 million m³ RWE; Southeast Asian consumption will be around 180 million m³ RWE and sub-Saharan consumption will be about 52 million m³ RWE.
Despite decent growth rates in tropical producer regions to 2050, the relative share of these regions in global primary wood-product consumption will be disproportionate to the size of the population. The per-capita consumption of primary wood products will remain consistently low in tropical producer regions (Figure 25); industries and households in tropical producer regions will consume 12% of primary wood products globally in 2050, despite representing 38% of the world population (Figure 26). Consumption will be higher in Latin America and Southeast Asia than in sub-Saharan Africa, due mainly to consumption by secondary-processing and manufacturing sectors in those regions.
- 10 20 30 40 50 60 70 80 90
100
Latin Americaand Caribbean
SoutheastAsia
Sub-SaharanAfrica
Latin Americaand Caribbean
SoutheastAsia
Sub-SaharanAfrica
Sawnwood Veneer and plywood
mill
ion
m3 (
RW
E)
Production Consumption
Figure 23: Production and consumption of sawnwood, veneer and plywood in tropical producer regions, 2050
Source: GPFM, corrected/adjusted by the authors.
Figure 24: Production and consumption of particleboard/fibreboard and woodpulp in tropical producer regions, 2050
Production Consumption
-
10
20
30
40
50
60
70
Latin Americaand Caribbean
SoutheastAsia
Sub-SaharanAfrica
Latin Americaand Caribbean
SoutheastAsia
Sub-SaharanAfrica
Particleboard and fibreboard Woodpulp
mill
ion
m3 (
RWE)
Source: GPFM, corrected/adjusted by the authors.
Figure 25: Per-capita consumption of primary wood products in selected world regions, 2015 and 2050
0.0
0.2
0.4
0.6
0.8
1.0
1.2
1.4
1.6
2015 2050 2015 2050 2015 2050 2015 2050 2015 2050 2015 2050 2015 2050
Sub-SaharanAfrica
South Asia Latin Americaand Caribbean
Southeast Asia China Europe North America
m3 (
RWE)
per
cap
ita
Sawnwood Veneer and plywood Particleboard/fibreboard Woodpulp
Sources: GPFM, corrected/adjusted by the authors; UN (2020a).

33
TS49
TradeThe production increase in tropical producer regions will be driven partly by exports: net export volumes will contribute 23% to production growth in Latin America and 30% in Southeast Asia. The trade in primary wood products will vary between producer regions (Figure 27). Latin America will be a net exporter across all primary wood-product groups, exporting mainly wood-based panels and pulp. Sub-Saharan Africa’s trade balance will be slightly positive for sawnwood and woodpulp but strongly negative for particleboard/fibreboard and veneer/plywood: dependency will be high on imports for particleboard and fibreboard, with almost 40% of regional consumption originating outside the region. Southeast Asia will become a major exporter of sawnwood, veneer and plywood but will require imports of wood-based panels and woodpulp to meet regional demand.
Globally, China will be the largest consumer of primary-processed wood products in 2050 and heavily dependent on imports. Other important export destinations will be other Asian subregions and North Africa.
Effects of GDP fluctuations on processing and trade of tropical wood productsTropical wood-processing industries have coped comparatively well with recent global economic shocks, although the full magnitude of the impacts of the COVID-19 pandemic is yet to be assessed. Experience suggests that certain factors make the tropical forest sector resilient to economic fluctuations. In the aftermath of the most recent shock, the sector will need to stimulate domestic consumption, promote domestic value-adding and participate in international value chains with value-added products rather than raw materials. The export of low-value-added products is a risk factor, although tropical hardwood exports show high resilience.
Exports from tropical producer regions have been more seriously affected than domestic consumption by past economic crises, especially sawnwood and wood-based panels (Figure 28) (on the other hand, woodpulp exports have been relatively robust in the face of economic shocks, see Figure 32).
There was a massive drop in exports of sawnwood and wood-based panels from Latin America and Southeast Asia during the 2008/2009 global financial crisis, and volumes have not yet recovered to pre-crisis levels. A major export destination of Latin America had been the North American construction sector,
Figure 26: Regional population growth, consumption growth and total consumption of primary wood products, 2050
Sub-Saharan Africa
Latin Americaand Caribbean
Southeast Asia
China
EuropeNorth America
South Asia
-50%
0%
50%
100%
150%
0% 50% 100% 150%
Cons
umpt
ion
grow
th, 2
015–
2050
Population growth, 2015–2050
Primary wood-product consumption (size of circle proportional to projected consumption in 2050)
Sources: GPFM, corrected/adjusted by the authors; UN (2020a).

34
TROPICAL TIMBER 2050
which was “ground zero” for that crisis and which has recovered only slowly. Southeast Asia’s recovery phase was more positive, but export destinations, mainly in East Asia, have increasingly been served by other suppliers, challenging the competitiveness of Southeast Asian production.
In sum, the export of low-value-added primary wood products increases vulnerability to economic shocks, and the strong export dependency for unprocessed wood products should be re-considered to enhance the tropical forest sector’s resilience.
Tropical hardwood exports are an exception, with volumes relatively stable over time. In Cameroon, for example, hardwood exports have recovered immediately after past economic shocks; in Peru, such exports increased in volume during the 2008/2009 global financial crisis (Figure 29).
Domestic consumption and value adding are stabilizing factors. Domestic consumption has proved to be a stabilizer for tropical timber production in previous economic crises. Production declines in sawnwood and wood-based panels recovered relatively quickly in tropical producer regions after the 2008/2009 global financial crisis, with the exception of sawnwood consumption in Latin America (Figure 30).
Latin America’s long-term and Southeast Asia’s temporary severe reduction in sawnwood consumption also resulted from structural changes
in both production and demand. Although market demand in tropical producer regions increasingly draws on standardized and engineered sawnwood products, the sawmilling industry in the tropics still faces innovation and investment bottlenecks. Moreover, the substitution of sawnwood by wood-based panels and non-wood products is negatively affecting sawnwood consumption. The 2008/2009 global financial crisis had a catalytic effect on sawnwood industries in tropical regions, resulting in a reduction in production capacity (e.g. in Latin America), although the overall consumption of wood products was stable. This trend will most likely continue post-2020.
Domestic demand, driven by strong population growth, was the most likely reason for the stable volumes—and fast recovery in the consumption—of sawnwood and wood-based panels in sub-Saharan Africa after the 2008/2009 global financial crisis, albeit from a low base. The stabilizing effect of domestic consumption in Southeast Asia and Latin America arises from the intake by manufacturing industries, which use sawnwood and panels as inputs for secondary wood processing. Exports of the derived products have been shown to be relatively stable in the face of GDP fluctuations, with short recovery periods after economic shocks (e.g. in Peru and Viet Nam—Figure 31).
Figure 27: Trade balance of primary wood products in selected world regions, 2050
-500 -300 -100 100 300 500
China
Europe
Latin America and Caribbean
North America
Northern Africa/Western Asia
Oceania
Rest of Asia
South Asia
Southeast Asia
Sub-Saharan Africa
millon m3 (RWE)
Sawnwood Veneer and plywood Particleboard/fibreboard Woodpulp
Source: GPFM, corrected/adjusted by the authors.

35
TS49
Pulp and paper will continue to drive timber production in tropical producer regions. In the past, woodpulp production has largely been robust in the face of economic shocks (Figure 32), and tropical producer regions maintained stable growth trajectories during the 2008/2009 global financial crisis. Woodpulp production may be a winner in the COVID-19 pandemic due to temporary increases in mail-order packaging and increased demand for hygienic paper products. The woodpulp market is highly internationalized, with opportunities to diversify markets. The consumption and export of woodpulp may help timber production stabilize in tropical producer regions and return to its pre-crisis growth trajectory. Given that large volumes of
woodpulp are exported from tropical regions without further processing, however, this might mean less opportunity to enhance value-adding.
Challenges for tropical timber-processing industriesThe forest industry in tropical producer regions will need to modernize in the lead up to 2050 and invest more than USD 40 billion in the expansion of processing capacities. Forest industry employment in the tropical producer regions is projected to grow by 1.3 million jobs by 2050, to 7 million full-time-equivalent employees. In the future, the forest sector, especially the wood-processing industries, will require
Figure 28: Exports of sawnwood and wood-based panels in tropical producer regions, and world GDP growth, 1990–2019
Sources: FAO (2020); World Bank (2020).
-2.0
-1.0
0.0
1.0
2.0
3.0
4.0
5.0
0
5
10
15
20
25
GDP
grow
th (%
)
mill
ion
m3 (
RWE)
Sawnwood
Sub-Saharan Africa Latin America Southeast Asia GDP change
1990
1991
1992
1993
1994
1995
1996
1997
1998
1999
2000
2001
2002
2003
2004
2005
2006
2007
2008
2009
2010
2011
2012
2013
2014
2015
2016
2017
2018
2019
-2.0
-1.0
-
1.0
2.0
3.0
4.0
5.0
0
5
10
15
20
25
GDP
grow
th (%
)
mill
ion
m3 (R
WE)
Wood-based panels
Sub-Saharan Africa Latin America Southeast Asia GDP change
1990
1991
1992
1993
1994
1995
1996
1997
1998
1999
2000
2001
2002
2003
2004
2005
2006
2007
2008
2009
2010
2011
2012
2013
2014
2015
2016
2017
2018
2019

36
TROPICAL TIMBER 2050
Figure 29: Exports of tropical roundwood, sawnwood and wood-based panels, Cameroon and Peru, and world GDP growth, 2001–2019
-2.00
-1.00
0
1.00
2.00
3.00
4.00
5.00
0.0
0.5
1.0
1.5
2.0
2.5
3.0
3.520
0120
0220
0320
0420
0520
0620
0720
0820
0920
1020
1120
1220
1320
1420
1520
1620
1720
1820
19
GDP
grow
th (%
)
GDP
grow
th (%
)
mill
ion
m3 (
RWE)
mill
ion
m3 (
RWE)
Cameroon Peru
Wood-based panel exports Sawnwood exports
Industrial roundwood exports World GDP growth
2001
2002
2003
2004
2005
2006
2007
2008
2009
2010
2011
2012
2013
2014
2015
2016
2017
2018
2019
Wood-based panel exports Sawnwood exports
Industrial roundwood exports World GDP growth
0
4.00
3.00
2.00
1.00
-1.00
-2.00
5.00
0
0.2
0.4
0.6
0.8
1.0
1.2
1.4
Note: The low volume of Peruvian log exports in 2015–2019 was caused by changes in national forest policies on concessions and timber extraction.
Sources: FAO (2020); World Bank (2020).
Figure 30: Consumption of sawnwood and wood-based panels in tropical producer regions and world GDP growth, 1990–2019
-2.0
-1.0
0
1.0
2.0
3.0
4.0
5.0
0
10
20
30
40
50
60
70
80
90
GDP
grow
th (%
)
mill
ion
m3 (R
WE)
mill
ion
m3 (R
WE)
Sawnwood
Sub-Saharan Africa Latin America
Southeast Asia GDP growth (current USD) (second wave)
Sub-Saharan Africa Latin America
Southeast Asia GDP growth (current USD) (second wave)
-2.0
-1.0
0
1.0
2.0
3.0
4.0
5.0
0
5
10
15
20
25
30
35
GDP
grow
th (%
)
Wood-based panels
1990
1991
1992
1993
1994
1995
1996
1997
1998
1999
2000
2001
2002
2003
2004
2005
2006
2007
2008
2009
2010
2011
2012
2013
2014
2015
2016
2017
2018
2019
1990
1991
1992
1993
1994
1995
1996
1997
1998
1999
2000
2001
2002
2003
2004
2005
2006
2007
2008
2009
2010
2011
2012
2013
2014
2015
2016
2017
2018
2019
Sources: FAO (2020); World Bank (2020).

37
TS49
a well-trained workforce, which still needs to be developed. Forest-sector enterprises face several other challenges in increasing productivity and value-adding due to the informality of large parts of the sector in many tropical countries, restricted access to capital, and a lack of business development support. These challenges need to be overcome to ensure global competitiveness and an adequate timber supply.
Low domestic market demand will constrain wood-industry development. The consumptionof primary wood products is commonly driven by domestic market demand in construction. However, wood consumption in tropical producer regions has traditionally been low in urban construction, and construction in rural areas is increasingly based on concrete and bricks; therefore, domestic wood consumption is relatively low in many tropical countries.
Household purchasing power will increase in tropical producer regions, but it won’t catch up with industrialized economies by 2050. Hence, private
domestic demand for secondary-processed wood products (e.g. paper and furniture) will remain a limiting factor for market opportunities. Low domestic demand is deterring investment in modern, capital-intensive wood-processing industries.
Many countries are stuck in a negative feedback loop, in which a lack of knowledge about modern timber products constrains demand and hence the development of a modern processing industry, which in turn reduces the incentive to invest in timber production and processing. Consequently, growing demand for advanced wood products is met by imports, with negative effects on the wood industry’s participation in national economies; this is the case, for example, in Peru (Figure 33).
Since the 1960s, the construction sector in tropical countries has had a general preference for concrete in high-rise buildings and bricks in rural housing. The sector is neglecting the increasing versatility and
Figure 31: Exports of secondary wood products from Peru and Viet Nam, 2000–2019
Source: UN Comtrade (2020).
0
20
40
60
80
100
120
2000
2001
2002
2003
2004
2005
2006
2007
2008
2009
2010
2011
2012
2013
2014
2015
2016
2017
2018
2019
USD
mill
ion
Peru
Furniture exports (HS codes 9401 and 9403) Secondary-processed sawnwood exports (HS code 4409)
0
1000
2000
3000
4000
5000
6000
7000
8000
9000
2000
2001
2002
2003
2004
2005
2006
2007
2008
2009
2010
2011
2012
2013
2014
2015
2016
2017
2018
2019
USD
mill
ion
Viet Nam
Furniture exports (HS codes 9401 and 9403) Secondary-processed sawnwood export (HS code 4409)

38
TROPICAL TIMBER 2050
-2.0
-1.0
0
1.0
2.0
3.0
4.0
5.0
0
5
10
15
20
25
30
35
40
45
GDP
grow
th (%
)
mill
ion
m3 (R
WE)
Consumption
Sub-Saharan Africa Latin America
Southeast Asia GDP growth
-2.0
-1.0
0
1.0
2.0
3.0
4.0
5.0
0
10
20
30
40
50
60
70
80
90
100
GDP
grow
th (%
)
mill
ion
m3 (
RWE)
Exports
Sub-Saharan Africa Latin America
Southeast Asia GDP growth
1990
1991
1992
1993
1994
1995
1996
1997
1998
1999
2000
2001
2002
2003
2004
2005
2006
2007
2008
2009
2010
2011
2012
2013
2014
2015
2016
2017
2018
2019
1990
1991
1992
1993
1994
1995
1996
1997
1998
1999
2000
2001
2002
2003
2004
2005
2006
2007
2008
2009
2010
2011
2012
2013
2014
2015
2016
2017
2018
2019
performance of modern mass timber products10 that have evolved in the last 20 years; modern timber construction is basically non-existent in tropical countries. The positive effect of using timber products instead of conventional materials in construction has been widely acknowledged (World Bank 2017), but tropical countries have not yet translated this into clear policies to promote timber construction, such as in public procurement (GlobalABC 2020).
Being correlated with per-capita income, paper and tissue consumption will remain below the global average in tropical regions to 2050. The industrial use of wood fibre (e.g. for packaging and textiles) is also
10 Mass timber is a new category of wood product comprising multiple solid wood panels nailed or glued together.
expected to remain low in tropical regions, despite substantial growth due to technical innovations in clothing and demand from logistics. Industrialized regions are increasingly exploring wood fibre as a raw material in the bioeconomy (Hetemäki and Hurmekoski 2016), such as for textile fibre, plastics substitutes and chemicals, but most investment in tropical countries is still in conventional production.
With limited domestic markets, the export of low-value-added wood products is an increasingly important factor in production growth in tropical producer regions. However, export dependency on primary-processed wood products causes vulnerability to global economic fluctuations. Moreover, international markets are highly competitive and are dominated by actors from North America and Europe.
Figure 32: Consumption and exports of woodpulp in tropical producer regions and world GDP, 1990–2019
Sources: FAO (2020); World Bank (2020).

39
TS49
The wood-processing sector will need to overcome structural barriers that hinder enterprise development. The lack of a competitive wood industry is caused partly by a lack of suitable IRW supply, but more importantly it is rooted in structural challenges that cause deficits in investment and innovation.
The situation of today’s tropical timber-processing sector presents a divided picture. A wide array of economic actors and enterprises process timber in the tropics. In many countries, parallel structures of highly professional formalized industries exist alongside informal artisanal value chains.
Thus, permeability between segments is poor. Micro enterprises rarely grow to become small or medium-sized enterprises (SMEs) because of restrictions imposed by their informal character and their lack of technical and financial capacity. SMEs rarely become large players because of a lack of financial possibilities and limited access to international markets. They rarely attract foreign equity because they cannot produce bankable information.
In the absence of a vibrant SME sector, large-scale enterprises are crucial for competitive forest sectors in the tropics. These are very capital-intensive, however, and require a high level of technical and managerial skill to operate in emerging economies. Most commonly, large wood companies operate their own forest resources (e.g. concessions or plantations). They frequently form part of international corporations, and their operations benefit from economies of scale. Large wood-based enterprises in the tropics are found
mainly in the pulp-and-paper subsector and in particleboard/fibreboard production in Latin America and Southeast Asia (Figure 34).
Frequently, such large entities operate in isolation of domestic value chains. In some cases, SMEs supply the large enterprises with pre-fabricated products, but ecosystem-type clusters of SMEs and large corporations like those in Europe and North America are rare in the tropics. More often, large companies operate as competitors for raw materials and market share and further restrict the development potential of SMEs.
Tropical wood industries will require a shift from micro enterprises to SMEs. The forest sector today contributes more than 5.7 million jobs to employment in registered enterprises in tropical producer regions. More than 95% of these enterprises are micro enterprises, with 5–10 employees. Such enterprises employ more than 60% of the wood-industry workforce in the tropics, compared with around 20% in China and industrialized countries (Figure 34). In fact, the backbone of the wood industry in industrialized regions are SMEs, which have up to 300 employees;11 such enterprises employ the lion’s share (50–60%) of the workforce. In tropical countries, the SME share of the workforce is barely 20%.
In many tropical countries, wood-industry development is stagnating despite increasing demand (Figure 35). For example, the number of wood-processing
11 In Brazil, Canada and the United States of America, SMEs have up to 500 employees, by definition.
Figure 33: Wood-product imports and wood-industry GDP growth, Peru, 2007–2019
Sources: Peru national statistical office; FAO (2020).
2007 2008 2009 2010 2011 2012 2013 2014 2015 2016 2017 2018 2019
0
100
200
300
400
500
600
700
0
50
100
150
200
250
300
2010 2011 2012 2013 2014 2015 2016 2017 2018 2019
Woo
d-in
dust
ry G
DP (U
SD m
illio
n)
Impo
rt va
lue
(USD
mill
ion)
Particleboard (4410) Fibreboard (HS 4411) Plywood (HS 4412) Sawnwood (HS 4407)
Logs (HS 4403) Others (HS 44) Wood-industry GDP

40
TROPICAL TIMBER 2050
Figure 34: Enterprises, and employment in forest industries, by region, 2015
0% 10% 20% 30% 40% 50% 60% 70% 80% 90% 100%
Sub-Saharan Africa
Latin America and Caribbean
Southeast Asia
Industrial
China
Enterprise structure in pulp-and-paper industry
Micro enterprises Small/medium-sized enterprises Large enterprises
Micro enterprises Small/medium-sized enterprises Large enterprises
0% 10% 20% 30% 40% 50% 60% 70% 80% 90% 100%
Sub-Saharan Africa
Latin America and Caribbean
Southeast Asia
Tropical
Industrial
China
Employment structure in pulp-and-paper industry
Micro enterprises Small/medium-sized enterprises Large enterprises
0% 10% 20% 30% 40% 50% 60% 70% 80% 90% 100%
Micro enterprises Small/medium-sized enterprises Large enterprises
0% 10% 20% 30% 40% 50% 60% 70% 80% 90% 100%
Sub-Saharan Africa
Latin America and Caribbean
Southeast Asia
Industrial
China
Sub-Saharan Africa
Latin America and Caribbean
Southeast Asia
Industrial
China
Enterprise structure in wood industry Employment structure in wood industry
Sources: Compiled from national accounts statistics, industry surveys and FAO (2020).
Figure 35: Import share of sawnwood and wood-based panels in domestic consumption in Peru and Viet Nam, and development of medium-sized/large wood-industry enterprises, 2007–2018
No. o
f ent
erpr
ises
Medium-large woodindustry enterprises
Sawnwood and wood-basedpanels import share
Medium-large woodindustry enterprises
Sawnwood and wood-basedpanels import share
0
5
10
15
20
25
30
35
40
10.0
0
20.0
30.0
40.0
50.0
60.0
70.0
2007 2008 2009 2010 2011 2012 2013 2014 2016 2017 2018
%
Peru
0
20
40
60
80
100
120
140
0
5.0
10.0
15.0
20.0
25.0
30.0
35.0
2007 2009 2010 2011 2012 2013 2014 2015 2016 2017 2018
No. o
f ent
erpr
ises
%
Viet Nam
enterprises is declining in Peru and Viet Nam, and growing domestic demand is being met by imports. Increasingly, tropical countries are importing standardized wood products to supply domestic construction and manufacturing industries, thus missing opportunities for substantial value-adding and employment. A larger share of modern SMEs in tropical producer regions is needed if domestic demand is to be met locally.
The projected increase in IRW production and processing-industry capacity in the tropics will create approximately 1.3 million additional jobs
by 2050, for a total of about 7 million12 directjobs (Figure 36). Jobs in the forest sector will look different in 2050 compared with today, however, because the forest industries will increasingly require a well-trained labour force. Future employment requirements in forest industries will, for example, encompass job profiles for mechanical harvesting, electricians and mechanics to operate modern machinery, digital designers and information
12 Note that this number reflects registered/formal employment. There is a significant additional informal workforce, especially in households and micro enterprises.
Sources: Compiled from national accounts statistics, industry surveys and FAO (2020).

41
TS49
technology specialists. Thus, realizing the employment potential will require investment in education, particularly vocational training, and on-the-job capacity building.
Tropical timber subsectors need to develop competitive SME segments by providing access to capital and business development support.It is widely acknowledged that SMEs are the drivers of competitive industrial sectors, but they face severe constraints in emerging economies that limit the capacity of micro enterprises to grow into SMEs and restrict the enhanced participation of SMEs in value chains. The key challenges for forest-based SMEs can be summarized as follows:
• To maintain and enhance competitiveness and productivity, micro, small and medium-sized enterprises (MSMEs) require investment and working capital, which generally they cannot access
from commercial banks. In this regard they face similar problems to MSMEs in other sectors—the MSME “financing gap” (World Bank/IFC 2017).
• To grow, wood-sector SMEs require reliable sources of legal raw materials. In the highly informal space that exists in many tropical countries, SMEs compete with informal competitors and have difficulty identifying trustworthy providers, which usually supply larger industry players. Transaction costs are high for SMEs, and so is the cost of raw materials.
• Tropical timber-processing SMEs lack access to international markets. Either they are contracted by larger industries, or they directly serve the domestic market. In domestic markets, they face competition from low-priced competitors operating in the informal space. Usually, domestic markets are price- rather than quality-driven.
Figure 36: Formal employment in forest industries in tropical producer regions in 2015, by subsector, and increase in employment to 2050
Sources: GFPM; UNIQUE forestry and land-use forest industry benchmarks database (Annex 6).
0
1000
2000
3000
4000
5000
6000
Sub-Saharan Africa Latin America and Caribbean Southeast Asia
No. o
f em
ploy
ees
(100
0)
Total in 2015 Increase to 2050
0
500
1000
1500
2000
2500
3000
3500
4000
4500
5000
Sub-Saharan Africa Latin Americaand Caribbean
Southeast Asia
No. o
f em
ploy
ees
(100
0)
Forestry and logging Wood industry Pulp and paper

42
TROPICAL TIMBER 2050
• There is a severe shortage of trained workers in the wood industry. SMEs compete with large companies for qualified staff and lack the capacity to pay competitive salaries. In general, the forest and wood-industry sectors are not perceived as providing an attractive working environment. The situation could worsen as economies grow and the services and manufacturing sectors offer more employment opportunities.
• Overall, the technical equipment and know-how in SMEs is not state-of-the-art. The productivity and quality of wood-sector SMEs are uncompetitive compared with large companies and imported products.
Tropical timber-processing industries will have to mobilize capital for capacity expansion and industry modernization. Given the projected level of production in tropical producer regions in 2050, future IRW processing capacities will need to grow by more than 160 million m³ to meet the regional increase in demand in line with the GFPM forecast. The total intake capacity of tropical wood industries in 2050 will be 476 million m³. To reach this capacity, substantial investments will be needed in new processing lines and existing enterprises will need to modernize their equipment. Most existing machines are configured for large-dimension timber from natural forests but, increasingly, the supply will comprise small-dimension timber from plantations and agroforestry systems. Establishing the necessary
Figure 37: Expansion of intake capacities and investment requirements for forest industries in tropical producer regions by 2050
Sources: GFPM; UNIQUE forestry and land-use forest industry benchmarks database.
-40
-30
-20
-10
0
10
20
30
40
50
Sub-Saharan Africa Latin America and Caribbean Southeast Asia
mill
ion
m3 (R
WE)
inta
ke c
apac
ity
Industry capacity expansion/divestment, 2050
Sawmilling Veneer/plywood mills Particleboard/fibreboard Woodpulp mills
0
5 000
10 000
15 000
20 000
25 000
30 000
35 000
Sub-Saharan Africa Latin America and Caribbean Southeast Asia
USD
mill
ion
Capital expenditure requirements for new industry capacity, 2050
New industry capacity substituting log exports New industry capacity for projected production New industry capacity import subsitution

43
TS49
additional capacity in the wood industry will require capital expenditure of about USD 40 billion by 2050,13 as well as significant investment to modernize outdated facilities.
If tropical producer regions were to avoid log exports and, rather, produce additional value-added products, another USD 18 billion would need to be invested in processing. Domestic production to substitute for wood-product imports would require an investment in capacity of USD 8 billion.
Reaching the production volume projected by the GFPM to 2050 will require an expansion in capacity across all forest subsectors in sub-Saharan Africa. Southeast Asia will require a massive expansion of sawlog- and veneer-log-processing capacity, although minor divestments are projected for the woodpulp subsector. Latin America will need a substantial increase in particleboard and fibreboard capacity, but woodpulp production capacity is projected to decline significantly (Figure 37).
Key actions to support the transition of the tropical timber industry The tropical timber industry needs transformative public and private investments to overcome its challenges. Public investment would facilitate the raising of private investments at scale and help stimulate sustainable growth. Any effort to increase investment in tropical timber industries will need to be harmonized with action to encourage the widespread adoption of SFM in timber production. The key actions described below would have catalytic power.
Capitalize start-ups and SMEs. Obtaining the required investment in modern industries will only be possible by capitalizing domestic enterprises. A critical mass of technology-driven start-ups and SMEs is needed to build future modern companies that can attract larger equity investments. This requires the formalization of enterprises and the creation of investment accelerators. Financing products are needed that meet the specific needs of the forest sector, such as recoverable or convertible grants or subordinated loans. Building, formalizing and capitalizing enterprises should be accelerated in existing clusters with structures of raw-material supply and multilevel processing.
13 This assumption is based on an industry average capital expenditure investment of USD 250 per m3 of intake in modern primary-processing industries.
Develop knowledge and skills in the wood industry. In the future, the labour requirements for modern wood industries will be more sophisticated, and ensuring sufficient well-trained personnel will require solid education and training. Most tropical countries lack sufficient qualified workforces, and the forest sector must compete with other industries for talent at the management and production levels. In addition to wood-processing qualifications, the pool of future workers in wood industries will require skills in information technology for computer-aided design, robotics and e-marketing. The forest sector will need to improve on work conditions, salaries and reputation.
Standardize tropical timber products to make them competitive in a global commodity market. To be competitive, tropical timber products will need to comply with international product standards. Only standardized products will allow mass markets in construction and fibre to expand timber use and compete with non-wood products.
Encourage traceability-of-origin and sustainability certification to gain access to new markets for wood products in substituting for non-renewable materials. Increasing the positive contributions of tropical timber products to sustainable growth in tropical countries will require reliable sustainability certification and environmental product declarations to facilitate their preferential use according to public procurement guidelines and private market preferences.

44
TROPICAL TIMBER 2050
Plywood production, Côte d'Ivoire. Photo: © R. Carrillo/ITTO

45
TS49
4 TROPICAL TIMBER IN A SUSTAINABLE ECONOMY
Key points
• Global resource use could more than double by 2050, exceeding global sustainable supply sooner rather than later and triggering negative impacts on biodiversity, climate, ecosystems and human wellbeing.
• Economic growth in emerging countries will increase net global material use from 89 Gt in 2017 to 167 Gt in 2060, an increase of 88%. In the future material mix, fossil fuels and non-renewable construction materials will represent the largest shares.
• Strategies for coping with future material demand should prioritize resource-use efficiency and encourage societies to strive to achieve carbon-neutral production based on renewable and sustainably produced materials such as wood.
• The adoption of strategies to reduce non-renewables and increase sustainable resources from tropical forests in the materials mix in emerging economies will reduce negative externalities.
• Tropical timber could take a leading role because the increasing demand for goods in the construction sector and other sectors like plastics and textiles can partly be met by wood-based products.
• Five complementary generic strategies could help increase the use of tropical timber: 1) increase resource efficiency; 2) reallocate resources; 3) reduce export volumes and increase domestic value-added by developing processing industries; 4) improve forest management; and 5) encourage timber-focused investments in natural capital.
Tropical timber can play a major role in slowing down biodiversity loss, ecosystem degradation, social inequality and other negative externalities related to the extraction of natural resources in tropical producer regions. Although there are natural and economic limits to the resource base, there is potential to make increased use of sustainably produced tropical timber products to enhance value-added and the sustainable timber footprint in the tropics.
At the time of this study, countries were dealing with the impacts of the COVID-19 pandemic at all levels of their national economies. The shock to economies and enterprises is dynamic and in some cases specific to regions and industries. The measures taken by governments are varied; the impacts of societal constraints, and the short-term success of monetary backup strategies, may be more or less assessable, but the long-term effects remain uncertain.
The pandemic has increased awareness of the need to build sustainable economies and societies. Many governments, non-governmental organizations and corporate stakeholders are committed to doing so. “Building back better” means building resilient societies after the pandemic by safeguarding nature and biodiversity, creating green jobs and fostering the transition to a carbon-neutral society (UNEP 2020).
Material consumption in tropical producer regionsGrowing populations and higher living standards will significantly increase demand for goods and services, housing and energy in coming decades. Global resource use could more than double by 2050 (OECD 2018; UNEP 2016), exceeding global sustainable supply sooner rather than later (UNEP 2016) and triggering negative impacts on biodiversity, ecosystems and human wellbeing. If emerging economies continue to pursue current development paths, carbon emissions will continue to increase and pressure on valuable ecosystems will rise. The economic costs of climate change will be accompanied by increasing human-health problems. OECD (2018) projected that the toxic effects on humans and ecosystems related to the extraction and processing of metals will at least double by 2060.
High-income countries have material-consumption footprints of about 27 tonnes per capita, which is about 13 times that of low-income countries (UNEP 2020). The lion’s share of this footprint comprises non-renewable materials; Figure 38 presents a comparison of per-capita resource consumption in selected world regions.

46
TROPICAL TIMBER 2050
Tropical producer regions exhibit low-to-medium consumption compared with China, Europe and North America. On the other hand, future economic growth will be higher in emerging countries than in other regions.
Living standards gradually assimilate across economies, and the resource use of emerging economies in tropical producer regions will increase fast—as projected for India and Indonesia and most countries in sub-Saharan Africa and Asia with rapidly growing material use (OECD 2018).
Material intensity will decline due to technical and structural developments, an important step towards decoupling production growth from resource extraction. OECD (2018) projected that, by 2060, structural and technology changes will enable a
decrease of 148 gigatonnes (Gt) (80 Gt + 68 Gt) in annual material use. The growing economies and their demand will outweigh the savings made from those efficiency gains, however (Figure 39): economic growth will increase net global material use from 89 Gt in 2017 to 167 Gt in 2060, an increase of 88%. It is important, therefore, to focus on the types of materials used and to evaluate their externalities, especially their environmental and social impacts.
The global extraction of metals and non-metallic minerals has increased significantly, from almost 12 billion tonnes per year in the 1970s to close to 55 billion tonnes per year in 2017. The externalities related to the mining and refining of these materials account for 20% of climate-change impacts and also for 20% of particulate-matter health impacts (UNEP 2016).
Figure 38: Per-capita material consumption, selected world regions, 2017
Source: UN (2020b).
0
5.0
10.0
15.0
20.0
25.0
30.0
Sub-SaharanAfrica
LatinAmerica
SoutheastAsia
China NorthAmerica
Europe
tonn
es p
er p
erso
nFigure 39: Global material use in 2017 and 2060, and impact of structural and technology change
Source: OECD (2018).
050
100150200250300350
2017 level Economicgrowth
Structuralchange
Technologychange
2060projection
Gt
+224
-80
-68
Figure 40: Material consumption mix, selected world regions, 2017
Source: UN (2020b); industrial roundwood and woodfuel shares based on current wood consumption.
0
10
20
30
40
50
60
%
70
80
90
100
Sub-Saharan Africa Latin America Southeast Asia China North America Europe
Industrial roundwood
Woodfuel Non-metallic minerals—construction dominant
Non-metallic minerals—industrialor agricultural dominant
Metal ores Fossil fuels Agriculturalbiomass, grazingand other biomass

47
TS49
According to OECD projections, concrete production alone will account for 12% of total greenhouse-gas emissions in 2060 and metal production for another 12% (OECD projections for 2060). According to the International Energy Agency and the Cement Sustainability Initiative, cement production (a key input in concrete) could increase by as much as 23% by 2050, but cement-related emissions will have to fall by at least 16% by 2030 to meet the target set in the Paris Agreement on climate change of limiting global warming to below 2 ºC (Lehne and Preston 2018). Tropical regions currently use a considerably higher proportion of agricultural biomass and woodfuel in their material mixes (Figure 40), but demand for concrete and metals in those regions will grow rapidly as populations and economies grow.
Sixty-eight percent of the global population—7 billion people—will live in urban areas by 2050, up from 54% in 2015 (UN 2020a). This implies that an additional 2.7 billion people will live in cities, almost half (1.3 billion) of whom will be in tropical producer regions. It is clear, therefore, that urbanization will be a main driver of increased material use due to high demand for housing and building materials.
Without tangible action, both politically and in industrial development, material use will increase in non-renewable segments, and bio-based products will lose significant share (see Figure 41). Planetary boundaries will be exceeded and pollution externalities will increase. Many tropical producer countries will be affected disproportionately.
Strategies for coping with future demand for goods and housing should prioritize resource-use efficiency and encourage societies to strive to achieve carbon-neutral production based on renewable and sustainably produced materials such as wood.
OECD (2018) projected that the highest growth in material intensity will be in emerging and developing economies, including many tropical producer countries.
Figure 41 depicts how material use develops in fast-growing economies, using China as an example. Material consumption there increased rapidly, based predominantly on the extraction of unsustainable non-metallic minerals, metal ores and coal; the consumption of renewable resources (not shown) remained relatively constant.
Figure 41: China’s non-renewable material use per capita, 2000–2017
Source: UN (2020b).
0
5
10
15
20
25 20
00
2001
2002
2003
2004
2005
2006
2007
2008
2009
2010
2011
2012
2013
2014
2015
2016
2017
tonn
es p
er p
erso
n
Non-metallic minerals—construction dominant
Non-metallic minerals—industrialor agricultural dominant
Metal ores Petroleum Natural gas Coal

48
TROPICAL TIMBER 2050
Figure 42: Non-renewable material consumption in sub-Saharan Africa, 2015–2050
Sources: Projections based on UN (2020a) and UN (2020b).
0
1
2
3
4
5
6
2015
2016
2017
2018
2019
2020
2021
2022
2023
2024
2025
2026
2027
2028
2029
2030
2031
2032
2033
2034
2035
2036
2037
2038
2039
2040
2041
2042
2043
2044
2045
2046
2047
2048
2049
2050
billi
on to
nnes
Non-metallic minerals—construction dominant
Non-metallic minerals—industrial or agriculturaldominant
Metal ores Petroleum Natural gas Coal
Figure 43: Non-renewable material consumption in Latin America and the Caribbean, 2015–2050
Sources: Projections based on UN (2020a) and UN (2020b).
0
1
2
3
4
5
6
7
8
201
5
201
6
201
7
201
8
201
9
202
0
202
1
202
2
202
3
202
4
202
5
202
6
202
7
202
8
202
9
203
0
203
1
203
2
203
3
203
4
203
5
203
6
203
7
203
8
203
9
204
0
204
1
204
2
204
3
204
4
204
5
204
6
204
7
204
8
204
9
205
0
billi
on to
nnes
Non-metallic minerals—construction dominant
Non-metallic minerals—industrial or agricultural dominant
Metal ores Petroleum Natural gas Coal

49
TS49
An extrapolation of historical trends based on compound annual growth rates for the tropical producer regions suggests a similar possible development path. Figure 42, Figure 43 and Figure 44 show that, if these projections come to reality, they will make achievement of the Paris Agreement on climate change and the Sustainable Development Goals unlikely. Material demand is growing, and this is unavoidable, but the adoption of strategies to reduce non-renewables and increase sustainable resources from tropical forests in the materials mix in emerging economies will downsize negative externalities.
The biggest driver of non-renewable material and energy use, the construction sector, is underdeveloped with regard to wood use. Data on the market share of wood construction is incomplete and there are big regional differences. It can be assumed, however, that the market share of wood in the construction sector is below 10% globally (Leskinen et al. 2018) and that this share will decline in the future due to the overall rapid growth in the use of other materials.
Tropical timber for construction, textiles and plastics Decoupling material use from economic growth is an ultimate goal, but it is not foreseeable on a global scale. Material substitution may be second-best, but it is a ready-to-use solution. Tropical timber could take a leading role because the increasing demand for goods in the construction sector and other sectors like plastics and textiles can partially be met by wood-based products. Substitution with sustainably produced wood should cause reductions in greenhouse-gas emissions14 and bring about benefits for human health and wellbeing, especially in rural areas.
Material substitution in the construction sector
Total demand for new residential housing in tropical producer regions will be around 321 million units to 2050, mostly in urban areas (Figure 45). The demand for housing in these regions has not been sufficiently addressed in recent decades due to
14 See Annex 8 for greenhouse-gas substitution factors of wood products.
Figure 44: Non-renewable material consumption in Southeast Asia, 2015–2050
0
2
4
6
8
10
12
201
5
201
6
201
7
201
8
201
9
202
0
202
1
202
2
202
3
202
4
202
5
202
6
202
7
202
8
202
9
203
0
203
1
203
2
203
3
203
4
203
5
203
6
203
7
203
8
203
9
204
0
204
1
204
2
204
3
204
4
204
5
204
6
204
7
204
8
204
9
205
0
billi
on to
nnes
Non-metallic minerals—construction dominant
Non-metallic minerals—industrialor agricultural dominant
Metal ores Petroleum Natural gas Coal
Sources: Projections based on UN (2020a) and UN (2020b).

50
TROPICAL TIMBER 2050
misguided administrative planning and a lack of capital in households. Nevertheless, future economic pathways indicate that residential construction will become more formal and standards will increase. With most population growth likely to occur in urban areas, new construction will be realized in a mix of houses and apartments in multistorey buildings.
Resource demand in the construction sector, and the related emissions, are—and will remain—exceptional compared with other sectors. The sector released almost 40% of energy- and process-related emissions in 2018. To achieve the Sustainable Development Goals, decarbonizing the building and construction sector is essential;15 according to UNEP (2019), this would be among the most cost-effective climate actions for achieving the commitments embodied in the Paris Agreement.
Ximenes et al. (2012) calculated greenhouse-gas emissions for different (standard) building configurations in Australia and concluded that greenhouse-gas emissions from extraction, manufacturing, transport, use in construction, maintenance and disposal could easily be halved by replacing construction elements like subfloors made of concrete and wall elements (brick) with mass timber products. Mass timber construction is a construction process based on wood materials as the main structural element; it is a fast-growing market segment in temperate regions, replacing common building materials like concrete and steel, mostly in low- to mid-rise buildings but with the potential for more. Cross-laminated timber (CLT), an engineered wood product, is a success story in mass timber construction. It is an excellent substitute for walls and floors and,
15 See Annex 7 for substitution factors of timber in construction.
at the same time, it provides an opportunity to produce higher-value-added products from low-quality timber. CLT production is still mainly located in Europe, however; it is growing strongly in North America, and Japan is paving the way for CLT production. There is a need for further research on CLT production with tropical species; Liao et al. (2017) tested the feasibility of manufacturing CLT using fast-grown small-diameter Eucalyptus, with promising results.
Substitution of textile fibre
It is projected that, by 2050, the global textiles industry will account for 26% of the global carbon budget (including emissions from fibre production, clothing manufacture and disposal). Moreover, polyester-based textiles will add 22 million tonnes of microfibre to the pollution of the oceans.
According to BSR (2009), energy use for the raw-material feedstock and production of polyester fibre is about 90 megajoules per kilogram of fibre, much higher than the global average of 12 megajoules per kilogram for viscose pulp.16 When wood-based textile fibre is produced at an integrated pulp-and-paper site, textile fibres can be manufactured with very low and possibly even zero carbon emissions.17
The raw material for viscose and other wood-based fibres can be produced with low-water-using processes, making the water footprint significantly less than that for cotton and polyester. Cellulose textile fibre could also be an alternative for cotton in regions where climate-change-induced temperature increases and water shortages restrict the growing capability of cotton.
Total consumption of textile fibre is projected to increase to 146 million tonnes by 2050 (Figure 46), with polyester fibres holding 77% of the market (Hughes 2018). Today, the share of cellulose fibre in textile fibre production is 6%, which is low compared with cotton (25%) and polyester and other synthetics (69%) (Textile Exchange 2019). There are major cellulosic fibre production facilities in China, India and Southeast Asia. In Southeast Asia, where the GPFM is projecting a severe regional woodpulp gap by 2050, it would be worthwhile assessing the feasibility of combined the processing capacities of woodpulp and textile fibre.
16 If viscose production is used as a benchmark, the lowest-emission producer emits under 0.5 million tonnes of carbon-dioxide equivalent per tonne of viscose grade pulp.
17 https://paper360.tappi.org/2019/07/22/wood-pulp-the-new-cotton-for-the-garment-industry
Figure 45: Housing demand in tropical producer regions, 2015–2050
Note: Average of five persons per unit. Source: Authors’ own calculations based on UN (2020a) and UN (undated).
-50
0
50
100
150
200
Urban Rural
Sub-Saharan Africa
No. o
f new
hous
ing un
its (m
illion
)
Latin America Southeast Asia

51
TS49
The main hindrance to cellulosic fibre commanding a higher market share is its high production costs. The end-price of viscose in the market is significantly higher than that of polyester. The main challenges for enhanced production, therefore, will be to decrease production costs and to organize efficient supply chains.
Substitution of plastics
More than 90% of plastics produced today are derived from virgin fossil-fuel feedstock, with a significant carbon impact that will become even more significant as consumption increases. Plastics production accounts for about 6% of global oil consumption (WEF 2016).
Plastics production is projected to grow from 311 million tonnes in 2015 to 1.1 billion tonnes in 2050. If so, the plastics sector will account for 20% of total oil consumption and 15% of the global annual carbon budget by 2050. Moreover, plastic packaging is almost exclusively single-use; it generates significant negative externalities, with the United Nations Environment Programme conservatively valuing these at USD 40 billion in 2015 (WEF 2016).
Substitutes for plastics made from wood (bioplastics) are technologically available and some are already in mass production, but production costs are higher than for conventional plastics (Selvamurugan and Sivakumar 2019). The products are biodegradable and reusable; as for conventional plastics, the single use of bioplastics should be avoided to increase its positive environmental impacts. The global pulp-and-paper industry is investing in research and prototype production lines to increase product versatility and cost-efficiency. It is reasonable to assume that, by 2050, competitive cellulose-based plastic substitutes will be available on the market.
In addition to innovative bioplastics, conventional wood and paper products can substitute for plastics in several applications, such as single-use packaging, laminates in flooring, and plastic furniture. The substantial substitution of plastics with wood products could contribute significantly to achieving emission reduction targets—if wood products outperform plastics in their durability. Using 1 tonne of wood products to substitute for plastics mitigates approximately 3.6 tonnes of carbon-dioxide equivalent emissions (Rüter et al. 2016; see Annex 8 for a list of emission substitution factors for selected non-wood products).
Key actions to promote tropical timber in a sustainable economy Globally changing consumption patterns and increasing resource efficiency will release wood resources for allocation elsewhere. Investments in nature-based solutions, such as tropical rainforest conservation and landscape restoration, and subsidies or tax reductions for green products, will encourage increases in natural capital and economic efficiency. Due to their complexity and interrelatedness, the extent of the potential increase in natural capital is not projected here; nevertheless, it could be substantial.
Tropical timber will only be able to contribute to sustainable economies if:
• its production is delinked from deforestation and forest degradation;
• it can be produced at competitive price levels;
• the technical specifications are competitive and accepted in consumer markets;
• sufficient capital can be mobilized to invest in raw-material production and processing; and
• there is a favourable policy environment.
Putting aside the heterogeneous conditions among tropical producer countries and regions, the following five complementary generic strategies (depicted in Figure 47) could help increase the use of tropical timber:
1) Increase resource efficiency—for example by reducing waste through technical improvements in production processes and the digitization of value chains, using side-streams and byproducts, and applying cascade use where reasonable.
2) Reallocate resources—the global consumption of wood-based products changes over time; where demand declines for a certain product (e.g. the
Figure 46: Production of textile fibre, cellulose fibre and corresponding industrial roundwood demand, 2015 and 2050
Source: Authors’ own calculations based on WEF (2016) and Textile Exchange (2019).
0 20 40 60 80
100 120 140 160
Textile fibre(tonnes)
Cellulose textile fibre,2015 (tonnes)
IRW consumptionfor cellulose wood-based
fibre production (m3)
mill
ion
2015 2050

52
TROPICAL TIMBER 2050
projected 30% decline in woodpulp production in Latin America to 2050), the free resource can be allocated to another use path. Moreover, future developments and the adoption of new technologies will lead to more efficient energy systems and the reduced use of woodfuel.
3) Reduce export volumes and increase domestic value-added by developing processing industries—according to GFPM projections, all tropical producer regions will be net exporters of IRW by 2050. The surplus production will primarily originate in plantation estates in a few countries (e.g. Brazil, Malaysia, South Africa, Uruguay and Viet Nam) (see Annex 9 for detailed projected net export volumes; other tropical countries, such as the Philippines and Uganda, are projected to have significant IRW deficits). In GFPM projections, 60–70 million m³ (6%) of timber production in tropical producer regions will be exported in 2050, mainly as IRW, but processed products will mainly be imported. Overcoming the projected lack of industry development and investment in tropical regions requires increasing in-country value-added on timber products and additional volumes of wood in regional value chains (related to side-streams and cascades). Viet Nam, for example, produces 12 million m³ of woodchips per year in its large expanse of plantations. These woodchips are exported, and the country’s booming furniture industry is supplied largely by imported roundwood and primary-processed wood products.
4) Improve forest management—for example by expanding certification, improving management planning and undertaking active asset management. Production systems will need to be modified to
enable higher harvesting rates, improve forest health and produce higher-value assortments. Global woodfuel production is concentrated in tropical regions, but the production of IRW and processed products is underrepresented. The GFPM projects that 57% (719 million m³) of tropical wood resources will still be used for woodfuel in 2050.
5) Encourage timber-focused investments in natural capital—a growing number of stimulus packages include investments in (for example) forest landscape restoration and nature-based solutions. As an umbrella concept, nature-based solutions act to protect, sustainably manage and restore ecosystems in order to provide diverse services for human wellbeing. Producing tropical timber under this umbrella seems reasonable but will need to ensure inclusive approaches that combine complex environmental, societal and economic considerations. There is a further need to explore and test business models for nature-based solutions in the tropical timber sector.
Increasing resource efficiency
Changing consumption
patterns
Promoting domestic industries
Improving natural forest management
Timber-focused investments in natural capital
Figure 47: Five generic strategies to enhance the use of tropical wood resources

53
TS49
In light of the opportunities and challenges identified in this study, ITTO could take a leading role in guiding the development of the tropical forest sector in the decades to come. The Organization’s work programme
deals with specific aspects of the development of the tropical forest sector. Table 3 provides an indicative list of potential future activities (some of which ITTO is already engaged in).
5 ITTO’S ROLE IN THE TRANSITION AND MODERNIZATION OF THE TROPICAL FOREST SECTOR
Table 3: Future fields of activity in the transition and modernization of the tropical forest sector
Focus area Field of future activities
1 SFM: managing and conserving tropical forests
Develop innovative business models and multiple revenue streams for natural forest management, including “concessions 2.0”
Develop concepts to provide the raw materials of the future: high-quality raw materials for modern industries from productive plantations that are resilient to climate change
2 Economics, statistics and markets: improving the transparency of—and expanding international markets for—tropical timber
Support international initiatives that promote timber trade, legality and transparency through data analytics and impact monitoring
Analyse current and future market requirements and understand the transitions required for tropical timber supply and value chains
3 Sustainable forest industries: developing efficient and value-adding tropical forest-based industries
Promote innovation and digitalization in tropical timber sectors, from forest information systems and timber production to wood-product processing and consumer requirements
Develop incentive and capitalization schemes for small and medium-sized enterprises
4 Climate-change mitigation and adaptation: addressing climate change
Promote the substitution of non-renewable materials with sustainable timber to mitigate greenhouse-gas emissions and other negative externalities associated with the use of non-renewable materials
Cooperate with initiatives that address deforestation and degradation and promote reforestation for commercial purposes
5 Capacity building: raising the capacity of forest stakeholders to manage and benefit from their resources
Promote diversity in tropical timber production to enable broad participation, ownership and benefit-sharing in SFM, including in small to large enterprises and between, private and public actors, genders and generations
Facilitate knowledge transfer and provide training and education to meet future silvicultural and industry labour requirements

54
TROPICAL TIMBER 2050
Annex 1: List of countries and regions
Region Country
Sub-Saharan Africa
Angola
Benin
Botswana
Burkina Faso
Burundi
Cabo Verde
Cameroon
Central African Republic
Chad
Comoros
Congo
Côte d'Ivoire
Democratic Republic of the Congo
Djibouti
Equatorial Guinea
Eritrea
Eswatini
Ethiopia
Gabon
Gambia
Ghana
Guinea
Guinea-Bissau
Kenya
Lesotho
Liberia
Madagascar
Malawi
Mali
Mauritania
Mauritius
Mayotte
Mozambique
Namibia
Niger
Nigeria
Rwanda
Saint Helena, Ascension and Tristan da Cunha
Sao Tome and Principe
Senegal
Seychelles
Sierra Leone
Somalia
South Africa
South Sudan
Togo
Uganda
United Republic of Tanzania
Zambia
Zimbabwe
Northern America
Canada
Greenland
Saint Pierre and Miquelon
United States of America
Latin America and Caribbean
Antigua and Barbuda
Argentina
Aruba
Bahamas
Barbados
Belize
Bolivia (Plurinational State of)
Brazil
British Virgin Islands
Cayman Islands
Chile
Colombia
Costa Rica
Cuba
Curazao
Dominica
Dominican Republic
Ecuador
El Salvador
Falkland Islands (Malvinas)
French Guiana
Grenada
Guadeloupe
Guatemala
Guyana
Haiti
Honduras
Jamaica
Martinique
Mexico
Montserrat
Nicaragua
Panama
Paraguay

55
TS49
Peru
Saint Kitts and Nevis
Saint Lucia
Saint Vincent and the Grenadines
Saint-Martin (French Part)
Suriname
Trinidad and Tobago
Turks and Caicos Islands
Uruguay
Venezuela (Bolivarian Republic of)
South Asia Afghanistan
Bangladesh
Bhutan
India
Iran (Islamic Republic of)
Maldives
Nepal
Pakistan
Sri Lanka
Southeast Asia Brunei Darussalam
Cambodia
Indonesia
Lao People’s Democratic Republic
Malaysia
Myanmar
Philippines
Singapore
Thailand
Timor-Leste
Viet Nam
China China
China, Hong Kong SAR
China, Macao SAR
China, mainland
China, Taiwan Province of
Rest of Asia Democratic People’s Republic of Korea
Japan
Kazakhstan
Kyrgyzstan
Mongolia
Republic of Korea
Tajikistan
Turkmenistan
Uzbekistan
Northern Africa/Western Asia
Algeria
Armenia
Azerbaijan
Bahrain
Cyprus
Egypt
Georgia
Iraq
Israel
Jordan
Kuwait
Lebanon
Libya
Morocco
Oman
Palestine
Qatar
Saudi Arabia
Sudan
Sudan (former)
Syrian Arab Republic
Tunisia
Turkey
United Arab Emirates
Yemen
Europe Albania
Andorra
Austria
Belarus
Belgium
Bosnia and Herzegovina
Bulgaria
Croatia
Czechia
Denmark
Estonia
Faroe Islands
Finland
France
Germany
Gibraltar
Greece
Hungary
Iceland
Ireland
Italy

56
TROPICAL TIMBER 2050
Latvia
Liechtenstein
Lithuania
Luxembourg
Malta
Montenegro
Netherlands
North Macedonia
Norway
Poland
Portugal
Republic of Moldova
Romania
Russian Federation
Serbia
Slovakia
Slovenia
Spain
Sweden
Switzerland
Ukraine
United Kingdom
Oceania American Samoa
Australia
Christmas Island
Cocos (Keeling) Islands
Cook Islands
Fiji
French Polynesia
Kiribati
Marshall Islands
Micronesia (Federated States of)
Nauru
New Caledonia
New Zealand
Niue
Norfolk Island
Northern Mariana Islands
Palau
Papua New Guinea
Pitcairn Islands
Samoa
Solomon Islands
Tokelau
Tonga
Tuvalu
Vanuatu
Wake Island
Wallis and Futuna Islands

57
TS49
Annex 2: Wood product conversion factors to RWE
Source: FAO (2020).
Product Coefficient
Fibreboard 1.7
Industrial roundwood 1
Particleboard 1.51
Plywood 2
Sawnwood 2
Veneer sheets 2
Woodfuel 1
Woodpulp 4

58
TROPICAL TIMBER 2050
Region Production (m3, RWE)IRW Woodfuel
2015 2050 2015 2050
Sub-Saharan Africa 65 442 700 78 049 330 589 613 500 351 641 817
Latin America and Caribbean 226 641 900 282 664 100 262 105 900 240 440 300
Southeast Asia 136 945 700 173 205 698 154 202 200 126 730 200
Subtotal (tropical regions) 429 030 300 533 919 128 1 005 921 600 718 812 317
China 268 066 600 327 863 100 174 309 100 163 582 100
Europe 568 543 500 918 743 200 146 345 500 153 780 000
North America 511 471 000 786 943 500 47 322 800 49 573 600
India 46 842 600 97 331 200 303 968 200 236 986 700
Rest of South Asia 9 582 500 11 212 155 79 182 500 50 147 962
Rest of world 111 118 600 152 821 600 78 708 400 67 286 218
Total (world) 1 944 655 100 2 828 833 883 1 835 758 100 1 440 168 897
Sawnwood Veneer and plywood
2015 2050 2015 2050
Sub-Saharan Africa 19 497 800 22 552 834 3 348 400 9 823 027
Latin America and Caribbean 69 776 800 83 009 440 13 713 200 34 884 800
Southeast Asia 43 060 400 88 841 000 27 499 000 58 827 600
Subtotal (tropical regions) 132 335 000 194 403 274 44 560 600 103 535 427
China 136 481 200 61 567 410 221 336 000 575 518 400
Europe 299 021 000 590 053 465 21 685 400 62 551 295
North America 239 789 800 256 116 200 25 309 400 42 909 200
India 13 967 000 17 284 000 5 948 200 28 527 600
Rest of South Asia 5 924 800 8 018 896 1 020 400 1 474 200
Rest of world 58 735 800 65 867 298 11 349 600 29 792 575
Total (world) 886 254 600 1 193 310 543 331 209 600 844 308 697
Particleboard and fibreboard Woodpulp
2015 2050 2015 2050
Sub-Saharan Africa 1 911 094 4 695 253 6 386 000 13 291 589
Latin America and Caribbean 21 116 722 46 856 470 97 503 200 66 011 397
Southeast Asia 13 057 855 17 059 146 33 516 800 29 998 400
Subtotal (tropical regions) 36 085 671 68 610 870 137 406 000 109 301 386
China 143 895 888 412 428 243 37 517 200 8 870 372
Europe 110 427 422 266 488 416 182 034 800 155 585 268
North America 53 140 226 67 714 007 263 743 200 386 109 200
India 512 774 2 182 070 27 064 050 52 838 370
Rest of South Asia 2 924 569 4 109 425 2 041 150 1 435 230
Rest of world 26 708 001 61 415 620 50 504 000 50 030 300
Total (world) 373 694 551 882 948 651 700 310 400 764 170 127
Annex 3: GFPM tables

59
TS49
Region Consumption (m3 roundwood equivalent)IRW Woodfuel
2015 2050 2015 2050
Sub-Saharan Africa 58 376 800 62 657 758 589 752 500 369 787 824
Latin America and Caribbean 215 450 700 240 601 900 262 077 000 240 438 300
Southeast Asia 112 508 800 159 315 200 154 178 300 126 706 000
Subtotal (tropical regions) 386 336 300 462 574 858 1 006 007 800 736 932 124
China 335 161 900 593 318 100 174 318 500 163 582 600
Europe 557 120 800 911 318 943 143 818 100 150 356 700
North America 491 252 900 574 762 400 47 123 000 50 287 000
India 54 038 300 125 795 000 303 971 200 236 986 900
Rest of South Asia 9 667 700 11 557 120 79 185 500 50 157 062
Rest of world 109 653 900 149 952 341 78 776 200 68 194 463
Total (world) 1 943 231 800 2 829 278 762 1 833 200 300 1 456 496 848
Sawnwood Veneer and plywood
2015 2050 2015 2050
Sub-Saharan Africa 17 084 400 22 548 743 3 422 000 12 119 645
Latin America and Caribbean 63 847 800 82 925 800 10 606 000 22 525 400
Southeast Asia 35 139 200 56 814 400 16 869 400 50 833 000
Subtotal (tropical regions) 116 071 400 162 288 943 30 897 400 85 478 045
China 194 282 200 285 082 600 203 815 400 594 817 800
Europe 213 047 400 250 272 000 22 377 400 35 807 000
North America 214 469 000 247 360 200 31 509 800 42 861 000
India 15 143 000 24 758 800 6 654 200 28 966 800
Rest of South Asia 8 469 600 11 660 200 1 131 400 3 694 845
Rest of world 116 495 400 149 320 200 28 347 800 47 490 200
Total (world) 877 978 000 1 130 742 943 324 733 400 839 115 690
Particleboard and fibreboard Woodpulp
2015 2050 2015 2050
Sub-Saharan Africa 2 559 349 7 745 918 6 536 400 9 600 000
Latin America and Caribbean 21 397 539 44 907 704 37 990 800 58 259 600
Southeast Asia 6 770 006 24 215 732 27 341 600 47 592 000
Subtotal (tropical regions) 30 726 894 76 869 354 71 868 800 115 451 600
China 140 379 119 468 289 016 107 630 400 137 418 000
Europe 99 862 012 161 732 011 196 052 400 158 400 401
North America 54 610 785 71 898 947 217 603 600 200 924 000
India 1 199 184 5 892 336 30 553 770 58 356 480
Rest of South Asia 5 004 297 14 715 366 4 259 430 6 339 120
Rest of world 37 686 714 78 912 934 69 543 200 72 164 000
Total (world) 369 469 005 878 309 964 697 511 600 749 053 601

60
TROPICAL TIMBER 2050
Region Net export volumeIRW Woodfuel
2015 2050 2015 2050
Sub-Saharan Africa 7 065 900 15 391 573 -139 000 -18 146 006
Latin America and Caribbean 11 191 200 42 062 200 28 900 2 000
Southeast Asia 24 436 900 13 890 498 23 900 24 200
Subtotal (tropical regions) 42 694 000 71 344 270 - 86 200 -18 119 806
China -67 095 300 -265 455 000 -9 400 -500
Europe 11 422 700 7 424 257 2 527 400 3 423 300
North America 20 218 100 212 181 100 199 800 -713 400
India -7 195 700 -28 463 800 -3 000 -200
South Asia -85 200 -344 965 -3 000 -9 100
Rest of world 1 464 700 2 869 259 -67 800 -908 245
Total (world) 1 423 300 -444 879 2 557 800 -16 327 951
Sawnwood Veneer and plywood
2015 2050 2015 2050
Sub-Saharan Africa 2 413 400 4 091 -73 600 -2 296 618
Latin America and Caribbean 5 929 000 83 640 3 107 200 12 359 400
Southeast Asia 7 921 200 32 026 600 10 629 600 7 994 600
Subtotal (tropical regions) 16 263 600 32 114 331 13 663 200 18 057 382
China - 57 801 000 -223 515 190 17 520 600 -19 299 400
Europe 85 973 600 339 781 465 -692 000 26 744 295
North America 25 320 800 8 756 000 -6 200 400 48 200
India -1 176 000 -7 474 800 -706 000 -439 200
Rest of South Asia -2 544 800 -3 641 304 -111 000 -2 220 645
Rest of world -57 759 600 -83 452 902 -16 998 200 -17 697 625
Total (world) 8 276 600 62 567 600 6 476 200 5 193 007
Particleboard and fibreboard Woodpulp
2015 2050 2015 2050
Sub-Saharan Africa -648 255 -3 050 665 -150 400 3 691 589
Latin America and Caribbean -280 817 1 948 766 59 512 400 7 751 797
Southeast Asia 6 287 849 -7 156 586 6 175 200 -17 593 600
Subtotal (tropical regions) 5 358 777 -8 258 484 65 537 200 -6 150 214
China 3 516 769 -55 860 773 -70 113 200 - 128 547 628
Europe 10 565 410 104 756 405 -14 017 600 -2 815 133
North America -1 470 559 -4 184 940 46 139 600 185 185 200
India -686 410 -3 710 266 -3 489 720 -5 518 110
Rest of South Asia -2 079 728 -10 605 941 -2 218 280 -4 903 890
Rest of world -10 978 713 -17 497 314 -19 039 200 -22 133 700
Total (world) 4 225 546 4 638 687 2 798 800 15 116 526

61
TS49
Annex 4: Comparison of production volumes versus FAO-reported data
Timber volumes reported by FAO versus case-study data on illegal production
Country IRW production m³ reported by FAO for 2013/14 Under/overestimation of illegal/informal volumes
Indonesiaa 74 041 000 +12%
Malaysiaa 16 748 000 –31%
Democratic Republic of the Congoa
4 611 013 –8%
Papua New Guineaa 4 017 000 0%
Cameroona 2 700 000 –11%
Congoa 2 233 123 +10%
Ghanaa 2 337 000 +14%
Lao People’s Democratic Republica
2 132 000 +6%
Weighted average, IRW –4%
Country Sawnwood production in m³ reported by FAO for 2010/11
Under/overestimation of illegal/informal volumes
Cameroonb 1 003 000 –50%
Gabonb 500 000 0%
Congob 228 000 –54%
Democratic Republic of the Congob
150 000 –67%
Central African Republicb
58 357 –243%
Ghanab 515 000 –46%
Indonesiab 4 160 000 –1%
Guyanab 76 000 –97%
Perub 711 000 –111%
Surinameb 113 000 –33%
Weighted average, sawnwood –27%
Sources: FAO (2020); a Hoare (2015); b Kishor and Lescuyer (2012).

62
TROPICAL TIMBER 2050
The significant reduction in woodfuel consumption in sub-Saharan Africa projected by the GFPM contradicts other forecast studies (e.g. Grieg-Gran et al. 2015) that expect significantly higher woodfuel consumption in sub-Saharan Africa. Usually, other studies extrapolate historic consumption figures or actual per-capita consumption into the future. In contrast, the GFPM configuration factors in woodfuel substitution rates considering reduction pathways in developing countries that follow woodfuel consumption in industrialized economies.
A cross-check of historical forecast studies shows that the GFPM has been quite accurate in forecasting woodfuel consumption in Africa.
The following table compares historical IRW and wood fuel projections for Africa for 2020 by:
• The GFPM projected in 2006. The GFPM was based on a set of assumptions, as explained in Chapter 1, and was parametrized with historical data up to 2005.
• The FAO Forest Sector Outlook Study Africa from 2003 (FOSA). The FOSA forecast was based on historical trend extrapolations and per-capita consumption ratios.
The 2020 projections for industrial roundwood production in Africa were quite similar for both GFPM and FOSA. Actual FAO data for 2019 show that the GFPM underestimated IRW production by 6%, while the FOSA projection overestimated production by 13%.
Woodfuel projections for woodfuel production in Africa were wider apart for both approaches. Compared against actual production figures for 2019, the GFPM projection was much more accurate, underestimating production by 2%, compared with the FOSA approach, which overestimated woodfuel production by 21%.
Annex 5: Comparison of roundwood projections for Africa
Comparison of historical long-term forecasts for IRW and woodfuel in Africa
Consumption in 1000 m³ Projection 2020 Actual FAO data 2019c Deviation GFPM 2006 vs. FAO actual 2019
IRW Woodfuel IRW Woodfuel IRW Woodfuel
GFPM 2006a 83 495 688 743 78 910 700 072
–4 585 –11 329
FOSA 2003b 89 000 850 000 10 090 149 928
Sources : a Turner et al. (2010) ; b FAO (2003); c FAO (2020).

63
TS49
Annex 6: Employment factors
2015 employment factors from UNIQUE forest-sector employment database
per 1000 m³ (RWE) production volume
Forestry and logging
Wood industry (sawnwood, veneer,
plywood)
Wood industry (particleboard
and fibreboard)
Woodpulp (and paper)
Other uses (pellets, bioplastics,
textile fibre)
Sub-Saharan Africa 3 10 5 2.5 0
Latin America and Caribbean
1 5 5 2 0
Southeast Asia 1 20 5 3.5 0
Employment factors assuming increased efficiency and productivity 2050
per 1000 m³ (RWE) production volume
Forestry and logging
Wood industry (sawnwood, veneer,
plywood)
Wood industry (particleboard and
fibreboard)
Woodpulp Other uses (pellets, bioplastics,
textile fibre)
Sub-Saharan Africa 2 10 5 2 2
Latin America and Caribbean
1 5 5 2 2
Southeast Asia 1 10 5 2 2
Source: Factors derived from National Accounts and industry surveys.

64
TROPICAL TIMBER 2050
Annex 7: Timber construction factors
Residential housing type Timber construction type Volume of IRW per 1000 m² floor area in structural elements
Average floor area (m² per unit)
Total IRW consumption per unit (m3)
Multistorey urban residential apartment block
CLT and mass timber construction
296 m³ (a) 75 22
Low-cost house (single-storey)
Timber frame construction
243 m³ (b) 75 18
Sources: a Forestry Innovation Investment (2017); b Reynoso (2017).

65
TS49
Harvested wood product (HWP)
Carbon stored in HWPs (tonnes carbon per m³ HWP)
Substitution factor for HWP (tonnes carbon
per tonne HWP)
Comment
Sawnwood 0.06a 1.26b
Substituting conventional construction material mix (concrete, steel, bricks)
Substitution factor likely to increase if cement industry is able to reduce carbon footprint up to 2050
Wood fibre pulp Not accounted
3.62b
Substituting polyester textile fibre
Substitution factor likely to increase if industries decrease up to 2050
2b
Substitution mix polyester and other plastics
Wood pellets Not accounted 1d Substituting mineral coal
Annex 8: Emission substitution factors for wood products
Sources: a VCS module VMD 0026 estimation of carbon stocks in the long-lived wood products pool, vs 1, 2012; b Rüter et al. (2016); c Own estimate based on Rüter et al. (2016); d Conservative value based on Brack (2017).

66
TROPICAL TIMBER 2050
Annex 9: Net trade data, GFPMIRW net trade 2050
Latin America and Caribbean
Country Net trade (m³)
Argentina 45 800
Bahamas –27 500
Barbados –1 400
Belize –27 800
Bolivia (Plurinational State of) –1 100
Brazil 22 676 100
Chile 16 815 500
Colombia 235 100
Costa Rica 746 000
Cuba –2 300
Dominica –1 300
Dominican Republic –12 500
Ecuador 36 200
El Salvador 119 900
French Guiana 9 500
Guatemala 1 100
Guyana 204 300
Haiti –24 700
Honduras –9 700
Jamaica –82 100
Martinique –1 000
Mexico –1 400
Netherlands Antilles 0
Nicaragua –200
Panama 137 900
Paraguay 1 700
Peru –52 600
Saint Lucia –300
Saint Vincent/Grenadines –1 800
Suriname 272 000
Trinidad and Tobago –159 800
Uruguay 1 143 700
Venezuela Bolivarian Republic of 24 900
Southeast Asia
Country Net trade (m³)
Brunei Darussalam –2 600
Cambodia 5 700
Indonesia 300 900
Lao People’s Democratic Republic 2 616 600
Malaysia 7 487 200
Myanmar 216 900
Philippines –480 000
Singapore –4 102
Thailand 466 600
Timor-Leste –1 200
Viet Nam 3 284 500
Sub-Saharan Africa
Country Net trade (m³)
Angola 1 300
Benin 30 000
Botswana –2 500
Burkina Faso 126 898
Burundi 22 100
Cameroon 109 700
Central African Republic 253 700
Chad –400
Congo 1 514 200
Côte d'Ivoire 22 000
Democratic Republic of the Congo 25 000
Djibouti –300
Equatorial Guinea 656 100
Ethiopia –86 100
Gabon 298 500
Gambia 296 100
Ghana 35 600
Guinea –22 500
Guinea-Bissau 30 000
Kenya –113 200
Lesotho –1 300
Liberia 55 800
Madagascar 900
Malawi –600
Mali –9 600
Mauritania –87 400
Mauritius –28 300
Mozambique 170 900
Niger –6 811
Nigeria 36 613
Réunion 5 700
Rwanda 7 500
Sao Tome and Principe 0
Senegal –81 700
Sierra Leone 21 800
Somalia –2 700
South Africa 14 544 200
Swaziland –2 600
Togo –3 781
Uganda –2 046 846
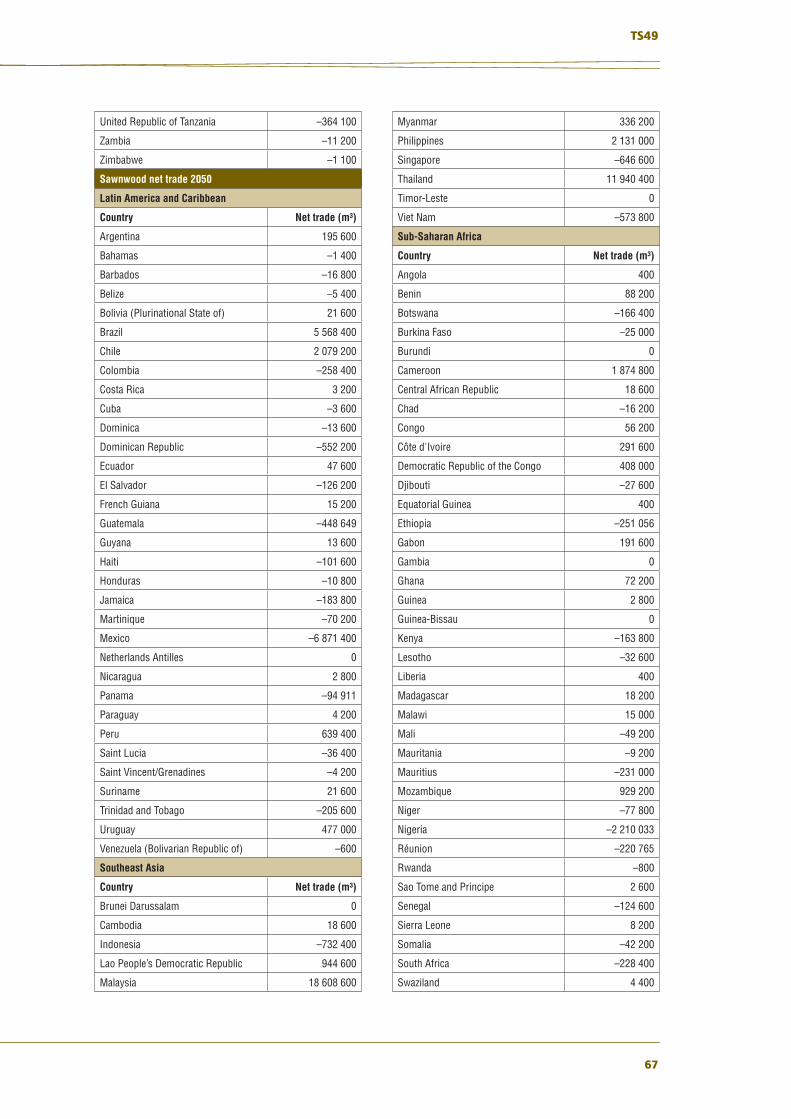
67
TS49
United Republic of Tanzania –364 100
Zambia –11 200
Zimbabwe –1 100
Sawnwood net trade 2050
Latin America and Caribbean
Country Net trade (m³)
Argentina 195 600
Bahamas –1 400
Barbados –16 800
Belize –5 400
Bolivia (Plurinational State of) 21 600
Brazil 5 568 400
Chile 2 079 200
Colombia –258 400
Costa Rica 3 200
Cuba –3 600
Dominica –13 600
Dominican Republic –552 200
Ecuador 47 600
El Salvador –126 200
French Guiana 15 200
Guatemala –448 649
Guyana 13 600
Haiti –101 600
Honduras –10 800
Jamaica –183 800
Martinique –70 200
Mexico –6 871 400
Netherlands Antilles 0
Nicaragua 2 800
Panama –94 911
Paraguay 4 200
Peru 639 400
Saint Lucia –36 400
Saint Vincent/Grenadines –4 200
Suriname 21 600
Trinidad and Tobago –205 600
Uruguay 477 000
Venezuela (Bolivarian Republic of) –600
Southeast Asia
Country Net trade (m³)
Brunei Darussalam 0
Cambodia 18 600
Indonesia –732 400
Lao People’s Democratic Republic 944 600
Malaysia 18 608 600
Myanmar 336 200
Philippines 2 131 000
Singapore –646 600
Thailand 11 940 400
Timor-Leste 0
Viet Nam –573 800
Sub-Saharan Africa
Country Net trade (m³)
Angola 400
Benin 88 200
Botswana –166 400
Burkina Faso –25 000
Burundi 0
Cameroon 1 874 800
Central African Republic 18 600
Chad –16 200
Congo 56 200
Côte d'Ivoire 291 600
Democratic Republic of the Congo 408 000
Djibouti –27 600
Equatorial Guinea 400
Ethiopia –251 056
Gabon 191 600
Gambia 0
Ghana 72 200
Guinea 2 800
Guinea-Bissau 0
Kenya –163 800
Lesotho –32 600
Liberia 400
Madagascar 18 200
Malawi 15 000
Mali –49 200
Mauritania –9 200
Mauritius –231 000
Mozambique 929 200
Niger –77 800
Nigeria –2 210 033
Réunion –220 765
Rwanda –800
Sao Tome and Principe 2 600
Senegal –124 600
Sierra Leone 8 200
Somalia –42 200
South Africa –228 400
Swaziland 4 400

68
TROPICAL TIMBER 2050
Togo –367
Uganda –93 288
United Republic of Tanzania –8 800
Zambia 5 600
Zimbabwe –5 200
Veneer and plywood net trade 2050
Latin America and Caribbean
Country Net trade (m³)
Argentina –128 400
Bahamas –34 000
Barbados –24 200
Belize –38 000
Bolivia (Plurinational State of) –6 200
Brazil 12 105 800
Chile 52 400
Colombia –48 200
Costa Rica –4 400
Cuba –1 800
Dominica –4 200
Dominican Republic –121 400
Ecuador 23 200
El Salvador –38 600
French Guiana –11 000
Guatemala –125 000
Guyana 31 400
Haiti –37 200
Honduras –69 800
Jamaica –123 000
Martinique –17 800
Mexico –120 400
Netherlands Antilles 0
Nicaragua –56 600
Panama –6 000
Paraguay 6 000
Peru 4 800
Saint Lucia –24 600
Saint Vincent/Grenadines –7 800
Suriname –600
Trinidad and Tobago –17 200
Uruguay 1 213 000
Venezuela (Bolivarian Republic of) –10 800
Southeast Asia
Country Net trade (m³)
Brunei Darussalam –6 000
Cambodia –470 600
Indonesia 426 600
Lao People’s Democratic Republic 11 600
Malaysia 11 357 400
Myanmar 17 600
Philippines –3 146 800
Singapore –1 743 800
Thailand –79 000
Timor-Leste –22 600
Viet Nam 1 650 200
Sub-Saharan Africa
Country Net trade (m³)
Angola –235 600
Benin –2 000
Botswana –8 800
Burkina Faso –89 000
Burundi –11 400
Cameroon 151 600
Central African Republic 0
Chad –10 400
Congo 6 000
Côte d'Ivoire 92 000
Democratic Republic of the Congo –26 400
Djibouti –60 400
Equatorial Guinea –27 800
Ethiopia –378 000
Gabon 672 000
Gambia –18 400
Ghana 36 800
Guinea –8 400
Guinea-Bissau 0
Kenya –80 000
Lesotho –7 600
Liberia –35 000
Madagascar –400
Malawi 9 800
Mali –35 200
Mauritania –2 200
Mauritius –70 000
Mozambique –11 000
Niger –146 000
Nigeria –1 521 468
Réunion –83 800
Rwanda –35 600
Sao Tome and Principe 0
Senegal –87 800
Sierra Leone –22 400
Somalia –44 800
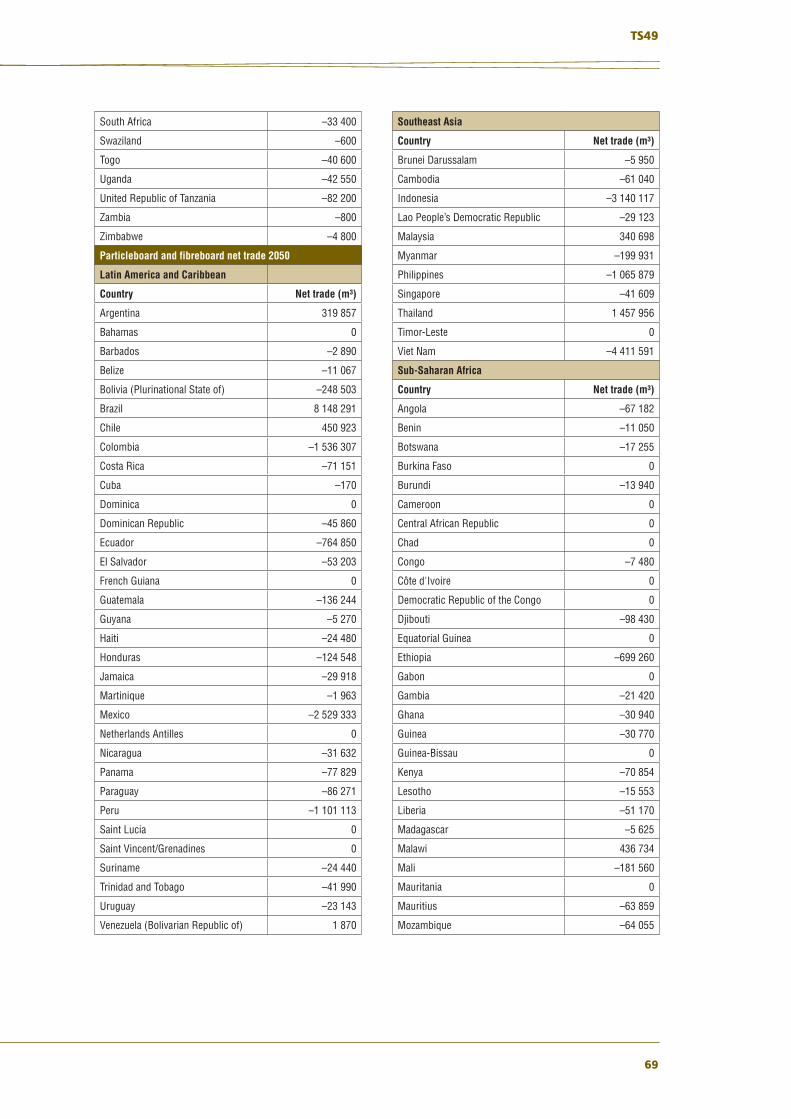
69
TS49
South Africa –33 400
Swaziland –600
Togo –40 600
Uganda –42 550
United Republic of Tanzania –82 200
Zambia –800
Zimbabwe –4 800
Particleboard and fibreboard net trade 2050
Latin America and Caribbean
Country Net trade (m³)
Argentina 319 857
Bahamas 0
Barbados –2 890
Belize –11 067
Bolivia (Plurinational State of) –248 503
Brazil 8 148 291
Chile 450 923
Colombia –1 536 307
Costa Rica –71 151
Cuba –170
Dominica 0
Dominican Republic –45 860
Ecuador –764 850
El Salvador –53 203
French Guiana 0
Guatemala –136 244
Guyana –5 270
Haiti –24 480
Honduras –124 548
Jamaica –29 918
Martinique –1 963
Mexico –2 529 333
Netherlands Antilles 0
Nicaragua –31 632
Panama –77 829
Paraguay –86 271
Peru –1 101 113
Saint Lucia 0
Saint Vincent/Grenadines 0
Suriname –24 440
Trinidad and Tobago –41 990
Uruguay –23 143
Venezuela (Bolivarian Republic of) 1 870
Southeast Asia
Country Net trade (m³)
Brunei Darussalam –5 950
Cambodia –61 040
Indonesia –3 140 117
Lao People’s Democratic Republic –29 123
Malaysia 340 698
Myanmar –199 931
Philippines –1 065 879
Singapore –41 609
Thailand 1 457 956
Timor-Leste 0
Viet Nam –4 411 591
Sub-Saharan Africa
Country Net trade (m³)
Angola –67 182
Benin –11 050
Botswana –17 255
Burkina Faso 0
Burundi –13 940
Cameroon 0
Central African Republic 0
Chad 0
Congo –7 480
Côte d'Ivoire 0
Democratic Republic of the Congo 0
Djibouti –98 430
Equatorial Guinea 0
Ethiopia –699 260
Gabon 0
Gambia –21 420
Ghana –30 940
Guinea –30 770
Guinea-Bissau 0
Kenya –70 854
Lesotho –15 553
Liberia –51 170
Madagascar –5 625
Malawi 436 734
Mali –181 560
Mauritania 0
Mauritius –63 859
Mozambique –64 055

70
TROPICAL TIMBER 2050
Niger 0
Nigeria –1 856 155
Réunion –8 421
Rwanda –30 770
Sao Tome and Principe 0
Senegal –9 010
Sierra Leone –70 550
Somalia –147 050
South Africa 888
Swaziland 224 688
Togo 0
Uganda –87 909
United Republic of Tanzania –10 140
Zambia –31 620
Zimbabwe –10 947
Woodpulp net trade 2050
Latin America and Caribbean
Country Net trade (m³)
Argentina –545 200
Bahamas 0
Barbados 0
Belize 0
Bolivia (Plurinational State of) –78 400
Brazil 12 670 000
Chile 3 379 200
Colombia –1 732 000
Costa Rica –96 400
Cuba –18 800
Dominica 0
Dominican Republic –9 200
Ecuador –92 000
El Salvador –2 800
French Guiana 0
Guatemala –4 800
Guyana 0
Haiti 0
Honduras 0
Jamaica 0
Martinique 0
Mexico –6 135 003
Netherlands Antilles 0
Nicaragua 0
Panama –1 200
Paraguay 0
Peru –360 800
Saint Lucia 0
Saint Vincent/Grenadines 0
Suriname 0
Trinidad and Tobago –194 000
Uruguay 1 957 600
Venezuela (Bolivarian Republic of) –984 400
Southeast Asia
Country Net trade (m³)
Brunei Darussalam 0
Cambodia 0
Indonesia –4 420 400
Lao People’s Democratic Republic –17 200
Malaysia –1 746 400
Myanmar –14 800
Philippines –56 400
Singapore –6 000
Thailand –6 958 800
Timor-Leste 0
Viet Nam –4 373 600
Sub-Saharan Africa
Country Net trade (m³)
Angola –73 789
Benin 0
Botswana 0
Burkina Faso 0
Burundi 0
Cameroon –800
Central African Republic 0
Chad 0
Congo 0
Côte d’Ivoire –7 200
Democratic Republic of the Congo –14 000
Djibouti –73 200
Equatorial Guinea 0
Ethiopia –206 800
Gabon 0
Gambia 0
Ghana 0
Guinea 0
Guinea-Bissau 0
Kenya –2 400
Lesotho 0
Liberia 0
Madagascar 0
Malawi 0
Mali 0
Mauritania 0

71
TS49
Mauritius –800
Mozambique –69 600
Niger –22 000
Nigeria 4 280 978
Réunion 0
Rwanda 0
Sao Tome and Principe 0
Senegal –1 200
Sierra Leone –400
Somalia 0
South Africa –116 400
Swaziland 0
Togo 0
Uganda 0
United Republic of Tanzania 0
Zambia 0
Zimbabwe –800

72
TROPICAL TIMBER 2050
REFERENCES
Bailis, R., Rujanavech, C., Dwivedii, P., Vilela, A., Chang, H. & Miranda, R. 2013. Innovation in charcoal production: a comparative life-cycle assessment of two kiln technologies in Brazil. Energy for Sustainable Development 17: 189–200.
BSR 2009. Apparel industry life cycle carbon mapping. Business for Social Responsibility (BRS).
Buongiorno J. 2015. Global modelling to predict timber production and prices: the GFPM approach. Forestry: An International Journal of Forest Research 88(3): 291–303. https://doi.org/10.1093/forestry/cpu047
Buongiorno, J., Zhu, S., Zhang, D., Turner, J. & Tomberlin, D. 2003. The Global Forest Products Model (GFPM): structure, estimation, applications. Academic Press.
Brack, D. 2017. Woody biomass for power and heat impacts on the global climate. Research Paper. The Royal Institute of International Affairs, Chatham House, London, UK.
Daigneault, A., Johnston, C., Korosuo, A., Baker, J., Forsell, N., Prestemon, J. & Abt, R. 2018. Developing detailed shared socioeconomic pathway (SSP) narratives for the global forest sector. Paper presented at the 2018 Forest and Agriculture GHG Modeling Forum. Shepherdstown, USA.
D’Annunzio, R., Sandker, M., Finegold, Y. & Min, Z. 2015. Projecting global forest area towards 2030. Forest Ecology and Management 352: 124–133.
Dev, I., Ram, A., Baskar, S. & Chaturvedi, O. 2018. Agroforestry for climate resilience and rural livelihood: role of agroforestry in current scenario. Natural Resource Management Division, ICAR, New Delhi, India.
Eufrade Junior, H., Monari Ohto, J., da Silva, L., Lara Palma, H. & Ballarin, A.W. 2015. Potential of rubberwood (Hevea brasiliensis) for structural use after the period of latex extraction: a case study in Brazil. Journal of Wood Science 61: 384–390.
FAO 2002. Trees outside forests: towards a better awareness. FAO Conservation Guide 35. Food and Agriculture Organization of the United Nations (FAO), Rome.
FAO 2003. Forestry outlook study for Africa. Regional report: opportunities and challenges towards 2020. FAO Forestry Paper No. 141. Food and Agriculture Organization of the United Nations (FAO), Rome.
FAO 2016. Global forest resources assessment 2015: how are the world’s forests changing? Food and Agriculture Organization of the United Nations (FAO), Rome.
FAO 2018. Rethinking forest concessions: improving the allocation of state-owned forests for better economic, social and environmental outcomes. Forestry Working Paper No. 4. Food and Agriculture Organization of the United Nations (FAO), Rome.
FAO 2019a. Silvopastoral systems and their contribution to improved resource use and sustainable development goals: evidence from Latin America. Food and Agriculture Organization of the United Nations (FAO), CIPAV and Agri Benchmark, Cali, Colombia.
FAO 2019b. Agroforestry and tenure. Forestry Working Paper No. 8. Food and Agriculture Organization of the United Nations (FAO), Rome.
FAO 2020. FAOSTAT. Forestry production and trade 1961–2018 (query panel) [online]. Food and Agriculture Organization of the United Nations (FAO), Rome [accessed 20 January 2020]. www.fao.org/faostat/en/#data/FO
Forest Trends 2018. Vietnam: diagnoses and regulatory assessment of small and micro forest enterprises in the Mekong region. Washington, DC.
Forestry Innovation Investment 2017. Introduction to Brock Commons tallwood house: UBC tall wood building [online] [accessed July 2020]. www.naturallywood.com/resource/introduction-to-brock-commons-tallwood-house-ubc-tall-wood-building
Gilmore, D. 2016. Forty years of community-based forestry: a review of its extent and effectiveness. FAO Forestry Paper No. 176. Food and Agriculture Organization of the United Nations (FAO), Rome.
GlobalABC 2020. Regional roadmap for buildings and construction in Latin America: towards a zero-emission, efficient and resilient buildings and construction sector. International Energy Agency, Paris.
Grieg-Gran, M., Bass, S., Booker, F. & Day, M. 2015. The role of forests in a green economy transformation in Africa. United Nations Environment Programme, Nairobi.

73
TS49
Grulke, M., del Valle, P., Calo, I., Merger, E., Pawlowski, G. & Wittmann, N. 2016. Sustainable natural forest management in the tropics: best practices and investment opportunities for large scale forestry. Unique, Freiburg, Germany.
Hetemäki, L. & Hurmekoski, E. 2016. Forest products markets under change: review and research implications. Current Forestry Reports 2: 177–188.
Hoare, A. 2015. Tackling illegal logging and the related trade: what progress and where next? Chatham House, London.
Hughes, K. 2018. Cotton report 2017: cotton production & trade trends. International Cotton Advisory Committee.
Iiyama, M., Neufeldt, H., Dobie, P., Njenga, M., Ndegwa, G. & Jamnadass, R. 2014. The potential of agroforestry in the provision of sustainable woodfuel in sub-Saharan Africa. Current Opinionin Environmental Sustainability 6: 138–147.
IMF 2020. IMF data (data query) [online]. International Monetary Fund (IMF) [accessed November 2020]. www.imf.org/en/Data
Indufor 2012. Strategic review on the future of forest plantations. Helsinki.
Irawanti, S., Race, D. & Stewart, H. 2017. Understanding the timber value chain in community-based forestry in Indonesia: analysis of sengon in central Java. Journal of Sustainable Forestry 36(8): 847–862. Doi: 10.1080/10549811.2017.1381029
IRENA 2014. Global bioenergy: supply and demand projections. A working paper for REmap 2030. International Renewable Energy Agency (IRENA).
ITTO 2008. Promotion of rubberwood processing technology in the Asia-Pacific region. Proceedings of the ITTO/CFC International Rubberwood Workshop, 8–10 December 2008. Yokohama, Japan.
ITTO 2020. Biennial Review statistics (data query) [online]. Yokohama, Japan [accessed November 2020]. www.itto.int/biennal_review
ITTO/IMM 2019. Forest sector investments in FLEGT VPA countries: scoping study on investors’ perspectives and investment monitoring. ITTO and the Independent Market Monitor (IMM), Yokohama, Japan.
Karsenty, A. & Vermeulen, C. 2016. Toward concessions 2.0: articulating inclusive and exclusive management in production forests in Central Africa. International Forestry Review 18(S1).
Kishor, N. & Lescuyer, G. 2012. Controlling illegal logging in domestic and international markets by harnessing multi-level governance opportunities. International Journal of the Commons 6(2): 255–270.
Lehne, J. & Preston, F. 2018. Making concrete change: innovation in low-carbon cement and concrete. Chatham House, London.
Leskinen, P., Cardellini, G., González-García, S., Hurmekoski, E., Sathre, R., Seppälä, J., Smyth, C., Stern, T. & Verkerk, P. 2018. Substitution effects of wood-based products in climate change mitigation. From Science to Policy 7. European Forest Institute, Helsinki.
Liao, Y., Tu, D., Zhou, J., Zhouc, H., Yuna, H., Gua, J. & Hu, C. 2017. Feasibility of manufacturing cross-laminated timber using fast-grown small diameter eucalyptus lumbers. Construction and Building Materials 132: 508–515.
MacDicken, K., Sola, P., Hall, J., Sabogal, C., Tadoum, M. & de Wasseige, C. 2015. Global progress toward sustainable forest management. Forest Ecology and Management 352: 47–56.
Nepal, P., Korhonenb, J., Prestemonc, J. & Cubbage, F. 2019. Projecting global planted forest area developments and the associated impacts on global forest product markets. Journal of Environmental Management 240: 421–430.
OECD 2010. OECD reviews of risk management policies: future global shocks, improving risk governance. Organisation for Economic Co-operation and Development (OECD), Paris.
OECD 2018. Global material resources outlook to 2060: economic drivers and environmental consequences. Organisation for Economic Co-operation and Development (OECD), Paris.
Payn, T., Carnus, J.M., Peter Freer-Smith, P., Kimberley, M., Kollert, W., Liue, S. Orazio, C., Rodriguez, L., Neves Silvah, L. & Wingfield, M. 2015. Changes in planted forests and future global implications. Forest Ecology and Management 352: 57–67.

74
TROPICAL TIMBER 2050
Penna, I. 2010. Understanding the FAO’s ‘wood supply from planted forests’ projections. University of Ballarat Centre for Environmental Management. Monograph Series No. 2010/01. University of Ballarat, Ballarat, Australia.
Rahman, S., Sunderland, T., Roshetko, J., Basuki, I. & Healey, J. 2016. Tree culture of smallholder farmers practicing agroforestry in Gunung Salak Valley, West Java, Indonesia Syed Ajijur. Small-scale Forestry 15: 433–442.
Reppin, S., Kuyah, S., de Neergaard, A., Oelofse, M. & Rosenstock, T. 2020. Contribution of agroforestry to climate change mitigation and livelihoods in Western Kenya. Agroforestry Systems 94: 203–220.
Reynoso, O., de la Rosa, A., Fuentes Salinas, M., Corona Ambriz, A. 2017. Wood frame house construction project in Mexico. Proyecto de construcción de una casa de madera tipo en México. División de Ciencias Forestales Universidad Autónoma Chapingo, Mexico.
Riahi, K., van Vuuren, D.P., Kriegler, E., Edmonds, J., O’Neill, B.C., Fujimori, S., et al. 2017. The shared socioeconomic pathways and their energy, land use, and greenhouse gas emissions implications: an overview. Global Environmental Change 42: 153–168.
Rüter, S., Werner, F., Forsell, N., Prins, C., Vial, E. & Levet, A. 2016. ClimWood2030: climate benefits of material substitution by forest biomass and harvested wood products. Perspective 2030. Final report. Thünen Report 42.
Selvamurugan, M. & Sivakumar, P. 2019. Bioplastics—an eco-friendly alternative to petrochemical plastics. Current World Environment 14(1): 49–59.
Shrivastava, S. & Saxena, A. 2017. Wood is good: but, is India doing enough to meet its present and future needs? Centre for Science and Environment, New Delhi.
Somirraba, E., Beer, J., Alegre-Orihuela, J., Andrade, H.J., Cerda, R., DeClerck, F. et al. 2012. Mainstreaming agroforestry in Latin America. In: P.K.R. Nair and D. Garrity, eds. Agroforestry—the future of global land use, pp. 429–453. Advancesin Agroforestry 9. Springer.
Textile Exchange 2019. Preferred fiber & materials. Market report 2019. Textile Exchange.
Turner, J. 2010. Long-term outlook for the tropical timber market. Final report prepared for ITTO.
UN undated. World urbanization prospects 2018 (data query) [online]. United Nations (UN) Department of Economic and Social Affairs, New York, USA [accessed June 2020]. https://population.un.org/wup/DataQuery
UN 2020a. World population prospects 2019 (data query) [online]. United Nations (UN) Department of Economic and Social Affairs, New York, USA [accessed June 2020]. https://population.un.org/wpp/DataQuery
UN 2020b. SDGs indicators: United Nations (UN) global SDG database (data query) [online]. New York, USA [accessed August 2020]. https://unstats.un.org/sdgs/indicators/database
UN Comtrade 2020. United Nations (UN) Comtrade database (data query) [online]. New York, USA [accessed June 2020]. http://comtrade.un.org/db
UNEP 2016. Global material flows and resource productivity. Assessment report for the UNEP International Resource Panel. United Nations Environment Programme (UNEP), Nairobi.
UNEP 2019. 2019 global status report for buildings and construction towards a zero emissions, efficient and resilient buildings and construction sector. UN Environment Programme (UNEP), Nairobi.
UNEP 2020. Building resilient societies after the CoViD-19 pandemic. Key messages from the International Resource Panel. United Nations Environment Programme (UNEP), Nairobi.
WEF 2016. The new plastics economy: rethinking the future of plastics. World Economic Forum (WEF), Geneva, Switzerland.
Wingfield, M.J., Brockerhoff, E. Wingfield, B. & Slippers, B. 2015. Planted forest health and the need for a global strategy. Science 349(6250): 832–836.
World Bank 2017. Harnessing the potential of private sector: engagement in productive forests for green growth. World Bank/PROFOR/Climate Investment Fund, Washington, DC.
World Bank 2020. World Bank indicators for current GDP in US$ (data query) [online] [accessed November 2020]. https://data.worldbank.org/indicator/NY.GDP.MKTP.CD

75
TS49
World Bank/IFC 2017. MSME finance gap assessment of the shortfalls and opportunities in financing micro, small and medium enterprises in emerging markets. World Bank and International Finance Corporation (IFC), Washington, DC.
Ximenes, F. George, B., Cowie, A., Williams, J. & Kelly, G. 2012. Greenhouse gas balance of native forests in New South Wales, Australia. Forests 3: 653–683.
Zomer, R., Trabucco, A., Coe, R., Place, F., Van Noordwijk, M. & Xu, J. 2014. Trees on farms: an update and reanalysis of agroforestry's global extent and socio-ecological characteristics. Working Paper 179. World Agroforestry Centre, Bogor, Indonesia.
Zseleczky, L. & Yosef, S. 2014. Are shocks really increasing? A selective review of the global frequency, severity, scope, and impact of five types of shocks. IFPRI Vision 2020 Conference Paper No. 5.

76
TROPICAL TIMBER 2050

TECHNICAL SERIES
49TROPICAL TIMBER 2050An analysis of the future supply of and demand for tropical timber and its contributions to a sustainable economy
INTERNATIONAL TROPICAL TIMBER ORGANIZATION
JULY 2021
I N T E R N A T I O N A L T R O P I C A L T I M B E R O R G A N I Z A T I O NInternational Organizations Center, 5th Floor, Pacifico-Yokohama, 1-1-1, Minato-Mirai, Nishi-ku, Yokohama, 220-0012, Japan
Tel 81-45-223-1110 Fax 81-45-223-1111 Email [email protected] Web www.itto.int
© ITTO 2021
TROPIC
AL TIM
BER 2050ITTO
TECH
NIC
AL SER
IES 49
This document is printed on recycled paper.
ITTO undertakes a wide range of work on incentives to promote sustainable forestry in tropical countries, including the development of models for forecasting trends in tropical timber supply and demand. Such models can assist in planning policies at the national and international levels, and they can be used to forecast likely recovery times from shocks to the sector—such as that caused by the COVID-19 pandemic.
This report describes a model developed to forecast trends in tropical timber supply and trade to 2050. It analyzes potential scenarios and examines previous economic and non-economic shocks to estimate the likely time required for the sector to recover to pre-pandemic levels.
The report also considers longer-term factors. With global resource use set to more than double by 2050, it is essential to strive for carbon-neutral production based on renewable and sustainably produced materials such as wood. Sustainably produced tropical timber could take a leading role in this quest as a substitute for non-environmentally friendly materials; the report sets out five complementary strategies that could help drive sustainable growth in the sector.
This report is part of an ongoing effort by ITTO to provide knowledge and learning experiences on incentivizing investments in natural tropical forests and the sustainable production of the wood and non-wood products arising from them. Among other things, the wealth of information herein highlights the crucial role that sustainably managed tropical forests can play in climate-change mitigation and adaptation by encouraging the greater engagement of governments and private-sector players in this sphere.