ity of lafayette environmental action plan
TRANSCRIPT
Environmental Action Plan
City of Lafayette
Draft Version September 14, 2017

P a g e 2 C i t y o f L a f a y e t t e
Table of Contents
TITLE PAGE
Introduction 3
Greenhouse Gas Emissions (GHG) Inventory 4-8
Resource Conservation Solid Waste Water Energy Use Green Construction
9-21
Community Health Food & Agriculture Green Business
22-25
Transportation 26-30
Open Space, Parks, & Landscape 31-32
Glossary & Acronyms 33
List of State Bills Referenced
Staff
Emily Carroll, Planning Technician
Julia Koppman Norton, Assistant Planner
Technical Assistance
QuEST
Bart Carr, Senior Program Manager, Recycle Smart
Steve Richard, Co-Founder and Board President 2007-2015, Sustainable Lafayette
Acknowledgements & Credits
Environmental Task Force
Bart Carr
John Hansen
Mark Higgins
Dick Holt
Nancy Hu
Greg Meronek
Matthew Rodger
Zachary Simon-Adler
Linda Staaf
P a g e 3 C i t y o f L a f a y e t t e
Introduction
EXECUTIVE SUMMARY
On November 13, 2006, the Lafayette City Council adopted the Environmental Strategy, which was updated in 2011. The mission of the Strategy was to “…[develop] and [implement] environmental policies and programs that will enable the City and its residents to meet their present needs without sacrificing the ability of future generations to meet their needs.” It was developed as a guide to help Lafayette think, act, and plan more sustainably by helping to understand the cause of environmental problems and developing criteria for evaluating the long-term impacts of the City’s decisions. To monitor the community’s progress in meeting its sustainability goals, the Environmental Task Force created a set of environmental indicators. Given current environmental trends and standards at the state and local levels, the Environmental Action Plan was developed by the Environmental Task Force to provide a more complete image of how the City can continue to reduce its environmental footprint. The Action Plan is a policy document that includes quantitative goals and associated recommended programs, enabling the City to maintain local control while implementing State mandates to lower greenhouse gas emissions and to monitor other environmental factors. The Action Plan is intended to primarily be used by the City for guidance when developing or updating documents, policies, or procedures or when developing annual Work Plans, but also includes a number of programs that are related to the work of community groups and organizations. The Environmental Task Force will assist the community groups and organizations such as the Chamber of Commerce, Sustainable Lafayette, the Lafayette Community Garden, and local schools with implementing the programs.
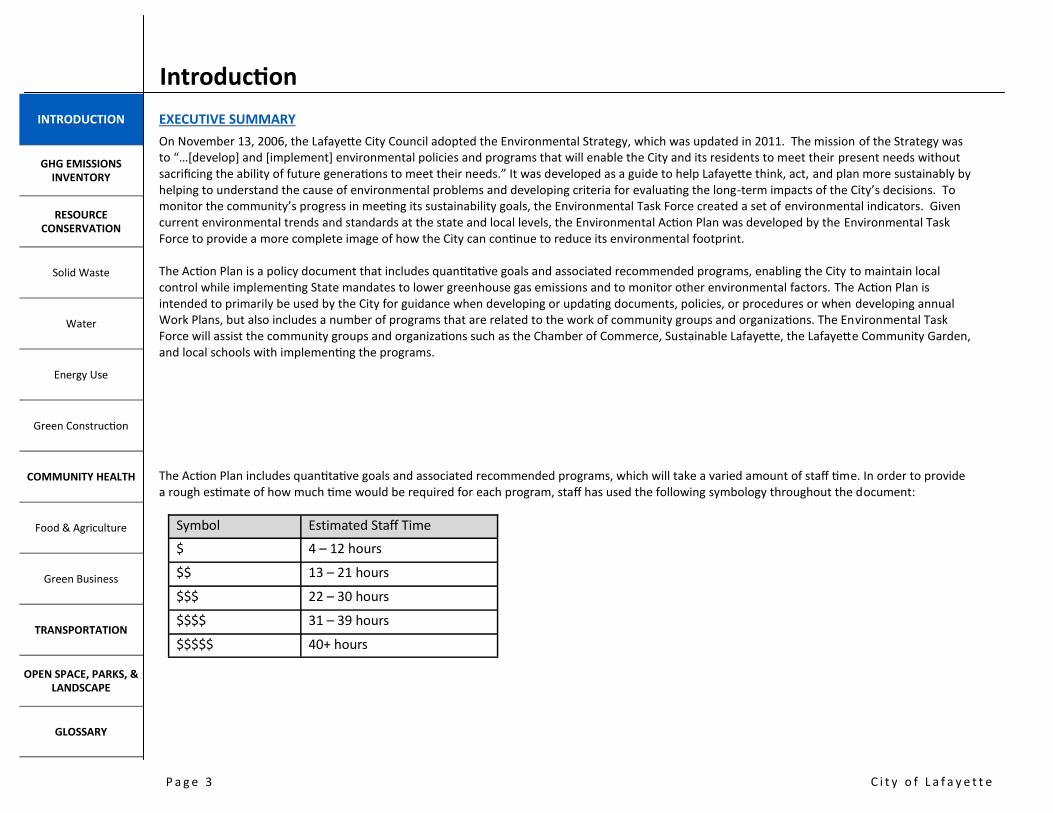
The Action Plan includes quantitative goals and associated recommended programs, which will take a varied amount of staff time. In order to provide a rough estimate of how much time would be required for each program, staff has used the following symbology throughout the document:
INTRODUCTION
GHG EMISSIONS INVENTORY
RESOURCE CONSERVATION
Solid Waste
Water
Energy Use
Green Construction
COMMUNITY HEALTH
Food & Agriculture
Green Business
TRANSPORTATION
OPEN SPACE, PARKS, & LANDSCAPE
GLOSSARY
Symbol Estimated Staff Time
$ 4 – 12 hours
$$ 13 – 21 hours
$$$ 22 – 30 hours
$$$$ 31 – 39 hours
$$$$$ 40+ hours

P a g e 4 C i t y o f L a f a y e t t e
Greenhouse Gas Emissions Inventory
INTRODUCTION
GHG EMISSIONS INVENTORY
RESOURCE CONSERVATION
Solid Waste
Water
Energy Use
Green Construction
COMMUNITY HEALTH
Food & Agriculture
Green Business
TRANSPORTATION
OPEN SPACE, PARKS, & LANDSCAPE
GLOSSARY
The City of Lafayette began collecting Greenhouse Gas Emissions (“GHG”) inventories in 2005 and has conducted a subsequent study each 5 years – 2010 and 2015. The GHG emissions inventory and forecast provides a summary of community-wide and municipal GHG emissions, GHG emissions by energy sector, energy use, and major sources of GHGs caused by activities in Lafayette. This data was used to develop reduction strategies and will be used as a baseline for future climate action planning projects. This inventory is based on a consistent approach using nationwide best practices and recommenda-tions from Local Governments for Sustainability (ICLEI). Community Inventory includes: Transportation on Local Roads Transportation on State Highways Transportation from Off-Road Vehicles Residential Energy Use Commercial Energy Use Solid Waste Wastewater Treatment
Municipal Inventory includes: Buildings & Facilities Vehicle Fleet Transit Fleet Public Lighting Water Delivery Wastewater Treatment Solid Waste Employee Commute
Emissions not included in the 2015 inventory are: Fire Station—energy use, fuel used by Fire Department vehicles, solid waste Back-up generator Veteran’s Memorial Construction (previously included in 2005 & 2010 inventories) PG&E-owned streetlights Alternate Daily Cover (ADC) *The 2005 baseline inventory did not quantify emissions for wastewater, residential electricity, or off-road equipment; 2010 was used as a proxy for the baseline year. *Self-hauled waste information was only released by CalRecycle for the 2015 inventory.
Emissions Summary by Sector: 2005-2015 (MT CO2e)
Sector Source Percent Change from
2005 Percent Change
from 2010
Energy
Residential Energy
Electricity -21% -11%
Natural Gas -15% -17%
Commercial/Industrial Ener-gy
Electricity -6% -5%
Natural Gas 2% -2%
Transportation
Local Roads Local Roads
-43% -33%
State Highways State Highways
8% 1%
Off-Road Equipment (Residential)
Off-Road Equipment (Residential) 5% 5%
Solid Waste Solid Waste Disposal Landfilled Waste -27% 36%
Wastewater Wastewater Treatment n/a -2%
Annual Emissions Total -12% -9%
COMMUNITY INVENTORY

P a g e 5 C i t y o f L a f a y e t t e
INTRODUCTION
GHG EMISSIONS INVENTORY
RESOURCE CONSERVATION
Solid Waste
Water
Energy Use
Green Construction
COMMUNITY HEALTH
Food & Agriculture
Green Business
TRANSPORTATION
OPEN SPACE, PARKS, & LANDSCAPE
GLOSSARY
COMMUNITY INVENTORY SUMMARY
0
10000
20000
30000
40000
2005 2010 2015
Residential GHG Emissions (MT CO2e)
Residential Energy Electricity Residential Energy Natural Gas
0
3000
6000
9000
12000
2005 2010 2015
Solid Waste Greenhouse Gas Emissions (MT CO2e)
0
5,000
10,000
15,000
2005 2010 2015
Commercial/Industrial Energy GHG Emissions (MT CO2e)
Commercial/Industrial Energy Electricity
Commercial/Industrial Energy Natural Gas
0
100000
200000
2005 2010 2015
Transportation Greenhouse Gas Emissions (MT CO2e)
Local Roads State highways Off-Road Equipment
P a g e 6 C i t y o f L a f a y e t t e
Greenhouse Gas Emissions Inventory
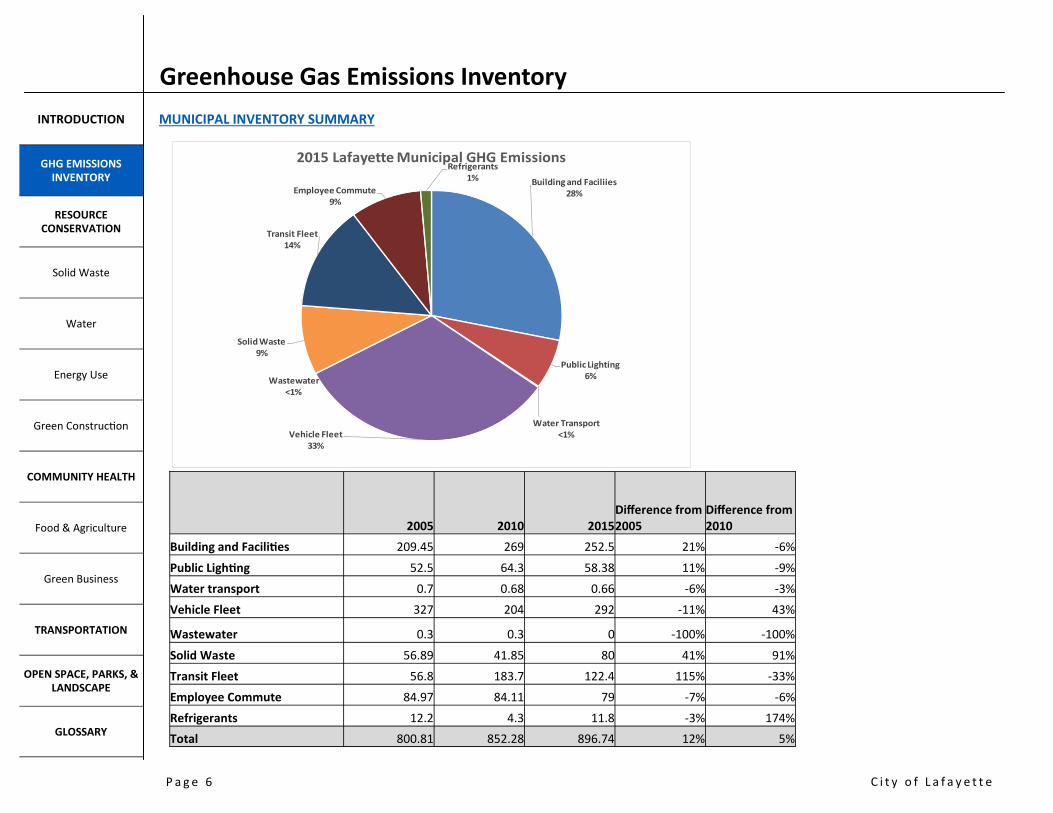
MUNICIPAL INVENTORY SUMMARY
INTRODUCTION
GHG EMISSIONS INVENTORY
RESOURCE CONSERVATION
Solid Waste
Water
Energy Use
Green Construction
COMMUNITY HEALTH
Food & Agriculture
Green Business
TRANSPORTATION
OPEN SPACE, PARKS, & LANDSCAPE
GLOSSARY
2005 2010 2015 Difference from 2005
Difference from 2010
Building and Facilities 209.45 269 252.5 21% -6%
Public Lighting 52.5 64.3 58.38 11% -9%
Water transport 0.7 0.68 0.66 -6% -3%
Vehicle Fleet 327 204 292 -11% 43%
Wastewater 0.3 0.3 0 -100% -100%
Solid Waste 56.89 41.85 80 41% 91%
Transit Fleet 56.8 183.7 122.4 115% -33%
Employee Commute 84.97 84.11 79 -7% -6%
Refrigerants 12.2 4.3 11.8 -3% 174%
Total 800.81 852.28 896.74 12% 5%
Building and Faciliies28%
Public Lighting6%
Water Transport<1%Vehicle Fleet
33%
Wastewater<1%
Solid Waste9%
Transit Fleet14%
Employee Commute9%
Refrigerants1%
2015 Lafayette Municipal GHG Emissions

P a g e 7 C i t y o f L a f a y e t t e
Greenhouse Gas Emissions Inventory PROJECTIONS
A business-as-usual (BAU) forecast is an estimate of future energy use, accounting for anticipated population and commercial growth in Lafayette while assuming that energy consumption habits will remain constant. Various growth factors were used to forecast emissions through 2030. Projected household growth figures for Lafayette were obtained from Plan Bay Area’s 2012 Sustainable Communities Strategy (SCS) and used as a metric for estimating future emissions from electricity and natural gas consumption. Plan Bay Area was also used for the commercial sector projection. Job growth was taken into account in projecting future emissions from electricity and commercial gas use. The Metropolitan Transportation Commission was used to estimate vehicle miles traveled through 2030. The following tables outline business-as-usual GHG emissions, forecasted by sector: Community MT CO2e (Metric Tons of Carbon Dioxide Equivalent)
Municipal MT CO2e
Sector 2005 2010 2015 2020 2025 2030
Buildings 209 270 270 270 270 270
Public Lighting* 86 79 76 78 80 82
Vehicle Fleet 327 205 205 205 205 205
Transit Fleet 57 183 183 183 183 183
Employee Commute 85 85 85 85 85 85
Government Generated Waste 57 41 41 41 41 41
Water Delivery 1 1 1 1 1 1
Total BAU 821 864 861 863 865 867
INTRODUCTION
GHG EMISSIONS INVENTORY
RESOURCE CONSERVATION
Solid Waste
Water
Energy Use
Green Construction
COMMUNITY HEALTH
Food & Agriculture
Green Business
TRANSPORTATION
OPEN SPACE, PARKS, & LANDSCAPE
GLOSSARY
Sector 2005 2010 2015 2020 2025 2030
Residential Energy 54,700 53,277 56,654 58,036 59,417 60,799
Commercial & Industrial Energy 18,215 17,484 18,281 19,134 20,088 20,992
Transportation 248,424 247,583 251,411 263,178 275,496 286,803
Solid Waste 8,892 1,764 1,840 1,920 2,004 2,091
Wastewater 600 600 612 628 643 660
Total 330,831 320,708 328,798 342,946 357,648 371,345
Percent change from baseline year 3.6%

P a g e 8 C i t y o f L a f a y e t t e
Greenhouse Gas Emissions Inventory PROJECTIONS, CONT’D.
The State of California has been proactive in reducing GHG emissions, exemplified by the state legislature’s passage of several regulations that affect vehicle standards, building standards, and the renewable energy content of electricity, which will serve to reduce GHG emissions at the local level. As of 2011, Clean Air Fuel Standards (Assembly Bill 1493) require car manufacturers to reduce GHG emissions in new passenger cars and light trucks, which is projected to decrease Lafayette’s transportation emissions by 46,135 MTCO2e by 2020. Renewable Portfolio Standards require investor-owned utility (“IOU”) providers, such as Pacific Gas & Electric, to increase the portion of electricity from eligible renewable sources to 33% by 2020 (previously to 20% by 2010) , which is estimated to decrease emissions in Lafayette’s residential, commercial, and industrial sectors by 13,132 MTCO2e.1 Low Carbon Fuel Standards require 10% or greater reduction in the carbon intensity of California’s transportation fuels by 2020, which is estimated to decrease Lafayette’s transportation emissions by 17,633 MTCO2e by 2020.2 Community Choice Aggregations (“CCAs”), approved by the State in 2002 through AB117, afford a community to reduce GHG emissions at levels below investor-owned utility standards. When the business-as-usual forecast and state reduction legislation are accounted for, Lafayette’s emissions are projected to be 266,046 MTCO2e or 19.5% below baseline emissions. If these state reductions and population growth projections are accurate, the City will meet its reduction goal by 2020 based on State regulations alone. However, AB32 recommends that local governments adopt a GHG reduction target of 15% below baseline levels by 2020. Additionally, Executive Order S-3-05, created a goal to reduce GHG emissions to 1990 level by 2020 and to 80% below 1990 levels by 2050. More recently, Executive Order B-30-15 aims to reduce emissions 40% below 1990 levels by 2030. The City needs to facilitate a reduction in emissions of 61,740 MTCO2e at minimum to meet its 15% below baseline emissions target.
INTRODUCTION
GHG EMISSIONS INVENTORY
RESOURCE CONSERVATION
Solid Waste
Water
Energy Use
Green Construction
COMMUNITY HEALTH
Food & Agriculture
Green Business
TRANSPORTATION
OPEN SPACE, PARKS, & LANDSCAPE
GLOSSARY
1 Renewables Portfolio Standard (RPS) Program (http://www.energy.ca.gov/renewables/) 2
CA Air Resources Board ( https://www.arb.ca.gov/newsrel/newsrelease.php?id=760)

P a g e 9 C i t y o f L a f a y e t t e
INTRODUCTION
GHG EMISSIONS INVENTORY
RESOURCE CONSERVATION
Solid Waste
Water
Energy Use
Green Construction
COMMUNITY HEALTH
Food & Agriculture
Green Business
TRANSPORTATION
OPEN SPACE, PARKS, & LANDSCAPE
GLOSSARY
Resource Conservation SOLID WASTE
Introduction:
The aim of the solid waste section is to reduce GHG emissions caused by solid waste. There is a direct connection between waste diversion and the reduction of GHG emissions.1 Solid waste deposited in landfills emits methane, a GHG that is 21 times more potent than carbon dioxide.2 Landfills are the third largest source of methane emissions in the United States.3 Approximately 64-percent of California’s solid waste disposal is from commercial sources, including restaurants, retail, professional services, construction, and demolition activities.4 Diverting commercial waste from the landfill is vital to reducing GHG emissions caused by solid waste. Aside from managing commercial waste, GHG emissions can be reduced through lowering residential consumption and altering waste disposal patterns. Recycling, reusing, and reducing residential consumption serves to keep waste out of landfills, reduces demand on virgin sources of materials, and decreases associated GHG emissions. Solid waste emissions in the community sector decreased 27-percent from 8,892 MT CO2e to 2,402 MT CO2e from 2005 to 2015. Solid waste emissions for the municipal sector decreased from 58.89 MTCO2e to 41.85 MTCO2e, a 29 percent reduction between 2005 and 2010. In 2015, the emission increased to 80 MTCO2e, a 91% increase (SEE NOTE IN DATA TO DETERMINE HOW TO ADDRESS THIS HERE —> remove?)
Solid Waste Standards:
State Standards The California Integrated Waste Management Act of 1989 (AB 939) requires all California cities to divert 50-percent of all solid waste from landfill disposal through source reduction, recycling, and composting activities. Efforts were further by legislation in 2011 (AB 341) which enacted a policy goal that at least 75-percent of solid waste generated in California should be reduced, recycled, or composted by 2020. Additionally, per the California Green Building Standards Code (CALGreen), “covered” construction and demolition projects must divert 65-percent of all construction and demolition debris from the landfill. As of 2011, California only has enough landfill space for the next 25-years and these standards are intended to guarantee available landfill space until the 2080’s. These state standards were established assuming the rate of waste generated per person per day (between 1990 and 2010) is calculated at an average of 10.7 lbs. per day. To meet the 75-percent state-wide goal, by 2020, residents will be permitted to dispose of no more than 2.7 lbs. of waste per person per day. City Standards In 2011, the Lafayette City Council voted to exceed the AB 939 standard by adopting the waste diversion goal of achieving a 75-percent waste diversion rate as part of the Environmental Strategy.
1 CalRecycle 2
San Luis Obispo Climate Action Plan 3
EPA 4
AB 341

P a g e 1 0 C i t y o f L a f a y e t t e
INTRODUCTION
GHG EMISSIONS INVENTORY
RESOURCE CONSERVATION
Solid Waste
Water
Energy Use
Green Construction
COMMUNITY HEALTH
Food & Agriculture
Green Business
TRANSPORTATION
OPEN SPACE, PARKS, & LANDSCAPE
GLOSSARY
Resource Conservation SOLID WASTE
Existing Actions:
The City of Lafayette currently surpasses the state diversion goal by approximately 10-percent, having diverted 58-percent in 2014.5
5 RecycleLafayette.org
Community Municipal
Require construction & demolition projects to divert a minimum of 65-percent of all construction waste and debris from the landfill
75-percent diversion rate from the landfill in 2020.
Provide recycling receptacles in each staff members’ offices, as well as recycling and green waste receptacles at all City-owned buildings.
Participate in curbside recycling, residential green waste, and residential food waste collection.
Incorporated a Green Purchasing Policy provision as part of the City’s Municipal Purchasing Policy within the Administrative Rules & Regulations.
Partner with Recycle Smart, formerly known as the Central Contra Costa Solid Waste Authority (“CCCSWA”) with the following programs:
Food Recycling Program: 68 restaurants and food stores participate Composting Workshops at Lafayette Community Garden & Outdoor Learning
Center, Mt. Diablo Nursery, & Orchard Nursery Special Reuse & Cleanup days.
Provide food waste collection in break rooms.
Provide commercial recycling outreach & services to all businesses. Use Color Cube printers that generate no waste for the landfill based on use of wax, rather than traditional ink cartridges.
Provide commercial organics collection (yard waste, food waste, woof, & low-grade paper) to businesses as required by AB1826.
Use cloth dish towels to reduce the use of paper towels.
Adopted regulations for single-use carry out bags and food packaging recycling. Grind wood waste by Public Works Department to use for mulch/soil amendment.
Partnered with Sustainable Lafayette to promote Recycle Lafayette – a city-wide campaign to reach the 75% source reduction, recycling, and compost rate through outreach to residents, schools, & the business community.
Donate/sell excess or obsolete equipment or supplies.
Worked with the Chamber of Commerce’s Green Committee to provide outreach to the business community about commercial recycling.
Donate/sell excess or obsolete equipment or supplies.
Conducted trash audits at elementary and middle schools.
Eliminated school-provided disposable lunch trays and water bottles at elemen-tary schools.
Provide recycling bins in the downtown.
Educated public about consignment and reuse stores and collection opportuni-ties within the community.
P a g e 1 1 C i t y o f L a f a y e t t e
INTRODUCTION
GHG EMISSIONS INVENTORY
RESOURCE CONSERVATION
Solid Waste
Water
Energy Use
Green Construction
COMMUNITY HEALTH
Food & Agriculture
Green Business
TRANSPORTATION
OPEN SPACE, PARKS, & LANDSCAPE
GLOSSARY
Resource Conservation SOLID WASTE
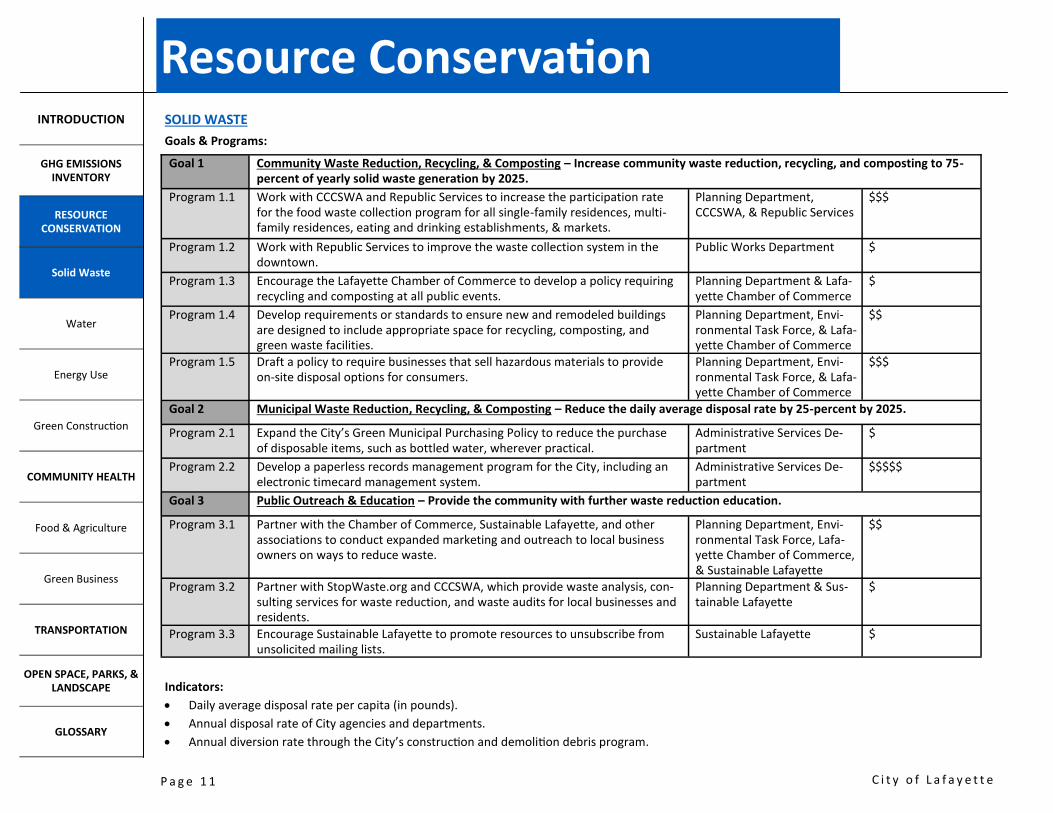
Goals & Programs:
Indicators:
Daily average disposal rate per capita (in pounds).
Annual disposal rate of City agencies and departments.
Annual diversion rate through the City’s construction and demolition debris program.
Goal 1 Community Waste Reduction, Recycling, & Composting – Increase community waste reduction, recycling, and composting to 75-percent of yearly solid waste generation by 2025.
Program 1.1 Work with CCCSWA and Republic Services to increase the participation rate for the food waste collection program for all single-family residences, multi-family residences, eating and drinking establishments, & markets.
Planning Department, CCCSWA, & Republic Services
$$$
Program 1.2 Work with Republic Services to improve the waste collection system in the downtown.
Public Works Department $
Program 1.3 Encourage the Lafayette Chamber of Commerce to develop a policy requiring recycling and composting at all public events.
Planning Department & Lafa-yette Chamber of Commerce
$
Program 1.4 Develop requirements or standards to ensure new and remodeled buildings are designed to include appropriate space for recycling, composting, and green waste facilities.
Planning Department, Envi-ronmental Task Force, & Lafa-yette Chamber of Commerce
$$
Program 1.5 Draft a policy to require businesses that sell hazardous materials to provide on-site disposal options for consumers.
Planning Department, Envi-ronmental Task Force, & Lafa-yette Chamber of Commerce
$$$
Goal 2 Municipal Waste Reduction, Recycling, & Composting – Reduce the daily average disposal rate by 25-percent by 2025.
Program 2.1 Expand the City’s Green Municipal Purchasing Policy to reduce the purchase of disposable items, such as bottled water, wherever practical.
Administrative Services De-partment
$
Program 2.2 Develop a paperless records management program for the City, including an electronic timecard management system.
Administrative Services De-partment
$$$$$
Goal 3 Public Outreach & Education – Provide the community with further waste reduction education.
Program 3.1 Partner with the Chamber of Commerce, Sustainable Lafayette, and other associations to conduct expanded marketing and outreach to local business owners on ways to reduce waste.
Planning Department, Envi-ronmental Task Force, Lafa-yette Chamber of Commerce, & Sustainable Lafayette
$$
Program 3.2 Partner with StopWaste.org and CCCSWA, which provide waste analysis, con-sulting services for waste reduction, and waste audits for local businesses and residents.
Planning Department & Sus-tainable Lafayette
$
Program 3.3 Encourage Sustainable Lafayette to promote resources to unsubscribe from unsolicited mailing lists.
Sustainable Lafayette $

P a g e 1 2 C i t y o f L a f a y e t t e
INTRODUCTION
GHG EMISSIONS INVENTORY
RESOURCE CONSERVATION
Solid Waste
Water
Energy Use
Green Construction
COMMUNITY HEALTH
Food & Agriculture
Green Business
TRANSPORTATION
OPEN SPACE, PARKS, & LANDSCAPE
GLOSSARY
Resource Conservation WATER
Introduction:
The intent of the water use section is to promote water conservation and improve wastewater and stormwater management. Water pollution from stormwater runoff and improper disposal of waste may contaminate fish, recreation areas, and drinking water.10 Water use also causes increases in GHG emissions as it is a carbon-intensive resource that requires a significant amount of energy to pump, treat, distribute, and heat.11 Water-related energy use
constitutes approximately 20-percent of California’s electricity use.9
Water usage accounts for less than 1-percent of Lafayette’s municipal GHG emissions, and wastewater accounts for less than 1-percent of community and municipal GHG emissions.
The average Californian uses about 140 gallons of water per day for drinking, bathing, washing clothes, watering gardens, and other household uses. However, on a per-capita basis, the water footprint of the average Californian is actually 1,500 gallons per day, based on the water required to produce the food we eat, the clothes we wear, the beverages we drink, and the other industrial goods on which we rely. By comparison, the average Californian’s water footprint is slightly less than the average American but considerably more than the average resident in other developed countries or the world. More than 90% of California’s water footprint is associated with agricultural products. Meat and dairy products have especially large water footprints due to the amount of water-intensive feed required to raise the animals. An additional 4% of California’s water footprint is associated with direct household water consumption (e.g., for landscape irrigation), and the remaining 3% with other industrial products we consume, such as clothing
and electronics.10
The City of Lafayette’s water supply is provided by the East Bay Municipal Utility District (EBMUD) and the City’s wastewater is collected and treated by the Central Contra Costa Sanitary District (CCCSD). Water conservation is vitally important to every facet of life. Mountain snowpack, water stored in reservoirs, and water pumped from underground aquifers are the three main water sources that sustain California.12 EBMUD’s water supply is predominantly from the Sierra Nevada snowpack and rainfall stored in the Mokelumne River watershed.13
There have been multiple consecutive dry years in California, resulting in water shortages. After experiencing the driest year in recorded state history, in January 2014 Governor Brown proclaimed a State of Emergency due to drought conditions and directed state officials to take all necessary actions to make water immediately available.14
The state of emergency ended in April 2017, with the exception of four counties15
; however, water conservation and the protection of EBMUD’s water supply is of high importance to the City of Lafayette. Reducing water usage can be accomplished through effective stormwater and wastewater management as well as through capturing, treating, and repurposing local stormwater and wastewater. This recycled water can be used for many things, including irrigation, toilets, and fighting fires.
9 http://www.ppic.org/content/pubs/report/R_1016AER.pdf
10 http://pacinst.org/wp-content/uploads/2013/02/executive_summary6.pdf
11 Contra Costa County Clean Water
12 Santa Monica Climate Action Plan 13 http://water.ca.gov/waterconditions/waterconditions.cfm 14 East Bay Municipal Utility District, Central Contra Costa Sanitary District 15
Office of the Governor https://www.gov.ca.gov/news.php?id=18368 16
CA Department of Water Resources (http://www.water.ca.gov/waterconditions/declaration.cfm )

P a g e 1 3 C i t y o f L a f a y e t t e
INTRODUCTION
GHG EMISSIONS INVENTORY
RESOURCE CONSERVATION
Solid Waste
Water
Energy Use
Green Construction
COMMUNITY HEALTH
Food & Agriculture
Green Business
TRANSPORTATION
OPEN SPACE, PARKS, & LANDSCAPE
GLOSSARY
State Water Standards:
Given the lengthy state of emergency drought there are many statewide regulations that aim towards making water conservation a way of life in Califor-nia.
On April 1, 2015, Governor Brown issued executive Order B-29-15 which aims to achieve a statewide 25-percent reduction in potable urban water usage (when compared to 2013 numbers) through February 28, 2016. The state also adopted the California Green Building Standards Code (CALGreen) in 2011. Among many requirements, CALGreen includes minimum requirements in the area of water conservation. CALGreen water efficiency and conservation standards require new construction to reduce use of potable water by 20-percent during and after building construction activities.
In addition, the State released its most recent update to the California Water Action Plan in 2016 (http://resources.ca.gov/docs/california_water_action_plan/Final_California_Water_Action_Plan.pdf) which includes broad policy goals and general actions to help state efforts on water conservation and use. Some of the broad policies include rebates to homeowners willing to replace lawns for more drought-tolerant landscapes and replace toilets with more efficient flushes of 1.28 or less gallons per flush. (http://www.saveourwaterrebates.com/).
The Dept. of Water Resources is also overseeing an ongoing update to the California Water Plan to be finalized in 2018. Though the plan, the State will for the first time "identify specific outcomes and metrics to track performance, prioritize near-term State actions and investments, recommend financing methods having more stable revenues, and inform water deliberations and decisions as they unfold." (http://www.water.ca.gov/waterplan/cwp/update2018/index.cfm) The Executive Order B-29-15 also directed Department of Water Resources (DWR) to update the State’s Model Water Efficient Landscape Ordinance (MWELO) through expedited regulation. Approved on July 15, 2015, significant changes to the regulation include more efficient irrigation systems, incen-tives for graywater usage, improvements in stormwater capture, limiting the portion of landscapes that can be planted with high water use plants, and reporting requirements as to the implementation and enforcement of the ordinance. (http://www.water.ca.gov/wateruseefficiency/landscapeordinance/docs/MWELO%202015%20Revision%20Fact%20Sheet.pdf). Local agencies have until December 1, 2015 to adopt the MWELO or to adopt a Local Ordi-nance which must be at least as effective in conserving water as MWELO. (http://www.water.ca.gov/wateruseefficiency/landscapeordinance/docs/2015%20MWELO%20Guidance%20for%20Local%20Agencies.pdf
1 2 3 4
Resource Conservation

P a g e 1 4 C i t y o f L a f a y e t t e
INTRODUCTION
GHG EMISSIONS INVENTORY
RESOURCE CONSERVATION
Solid Waste
Water
Energy Use
Green Construction
COMMUNITY HEALTH
Food & Agriculture
Green Business
TRANSPORTATION
OPEN SPACE, PARKS, & LANDSCAPE
GLOSSARY
Local Water Standards:
EBMUD has adopted a Water Supply Management Program 2040 Plan (WSMP 2040) that aims to meet water needs through the year 2040 through ag-gressive conservation and water recycling, while also factoring in the potential global and regional effects of climate change on the reliability of water sup-ply to the EBMUD service area. The WSMP 2040 portfolio includes rationing the water supply by 15-percent, conserving 39 million gallons of water per day, and recycling 11 million gallons of water per day. Multiple recycled water projects, including Reliez Valley Recycled Water Project for landscape irri-gation, are permitted by the San Francisco Regional Water Quality Control Board under General Order 96-011. (www.ebmud.com/index.php/download_file/force/804/779/?Order_96-011_Cover_Page_Master_Permit_Att_G-Website-Rev_101608_0.pdf) In 2014 EBMUD enacted a Water Shortage Emergency Action Plan, enacting and revising Section 28 of its Regulations Governing Water Use. Section 28 places limits on outdoor potable water use; customers are required to limit watering of outdoor landscapes to two times per week, use a hose with a shutoff valve for handwashing motor vehicles, use a broom or air blower (rather than water) to clean driveways and sidewalks, and turn off fountains and decorative water features unless the water is recirculated. EBMUD also issued two new ordinances restricting water waste: an excessive use penalty and a water theft ordinance (EBMUD Urban Water Management Plan 2015, https://wuedata.water.ca.gov/public/uwmp_attachments/4291196525/UWMP-2015-%20BOOK-FINALweb.pdf). In 2015, EBMUD's Board adopted a 20% mandatory water use reduction goal. This goal was set not only to comply with the Governor’s order, but also to conserve water in keeping with the Drought Management Program Guidelines. (EBMUD Urban Water Management Plan 2015, https://wuedata.water.ca.gov/public/uwmp_attachments/4291196525/UWMP-2015-%20BOOK-FINALweb.pdf).
Resource Conservation
P a g e 1 5 C i t y o f L a f a y e t t e
INTRODUCTION
GHG EMISSIONS INVENTORY
RESOURCE CONSERVATION
Solid Waste
Water
Energy Use
Green Construction
COMMUNITY HEALTH
Food & Agriculture
Green Business
TRANSPORTATION
OPEN SPACE, PARKS, & LANDSCAPE
GLOSSARY
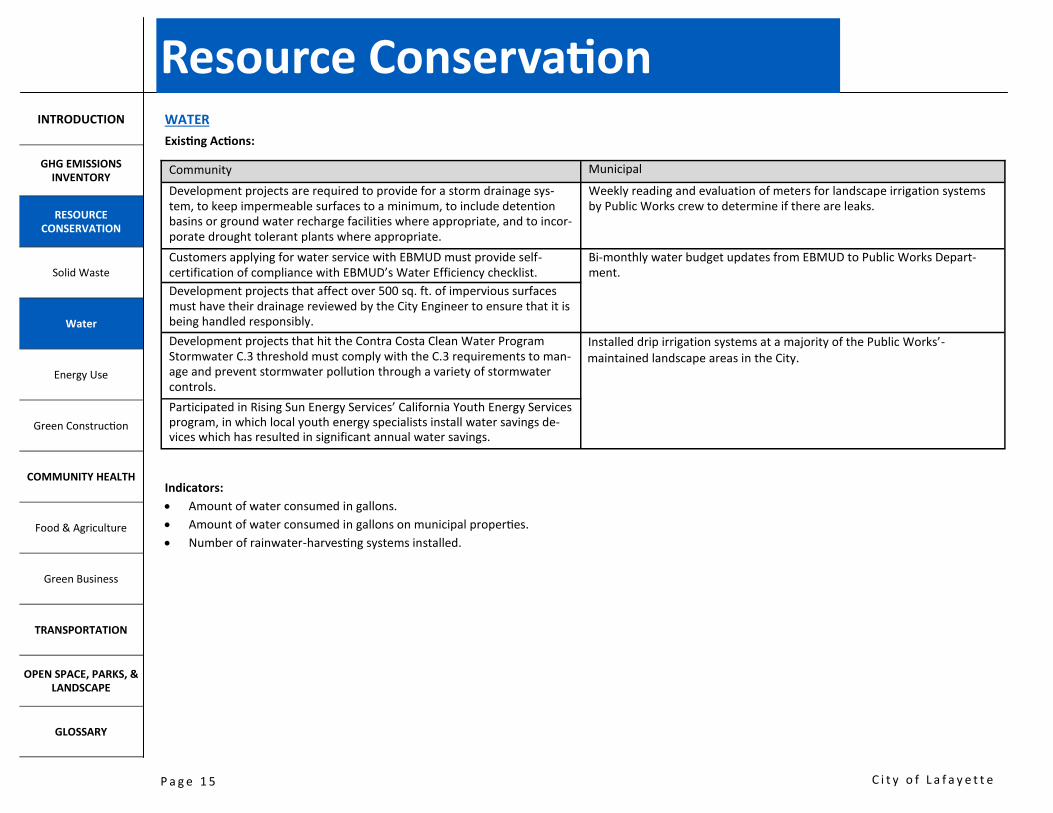
Resource Conservation WATER
Existing Actions:
Indicators:
Amount of water consumed in gallons.
Amount of water consumed in gallons on municipal properties.
Number of rainwater-harvesting systems installed.
Community Municipal
Development projects are required to provide for a storm drainage sys-tem, to keep impermeable surfaces to a minimum, to include detention basins or ground water recharge facilities where appropriate, and to incor-porate drought tolerant plants where appropriate.
Weekly reading and evaluation of meters for landscape irrigation systems by Public Works crew to determine if there are leaks.
Customers applying for water service with EBMUD must provide self-certification of compliance with EBMUD’s Water Efficiency checklist.
Bi-monthly water budget updates from EBMUD to Public Works Depart-ment.
Development projects that affect over 500 sq. ft. of impervious surfaces must have their drainage reviewed by the City Engineer to ensure that it is being handled responsibly.
Development projects that hit the Contra Costa Clean Water Program Stormwater C.3 threshold must comply with the C.3 requirements to man-age and prevent stormwater pollution through a variety of stormwater controls.
Installed drip irrigation systems at a majority of the Public Works’-maintained landscape areas in the City.
Participated in Rising Sun Energy Services’ California Youth Energy Services program, in which local youth energy specialists install water savings de-vices which has resulted in significant annual water savings.

P a g e 1 6 C i t y o f L a f a y e t t e
INTRODUCTION
GHG EMISSIONS INVENTORY
RESOURCE CONSERVATION
Solid Waste
Water
Energy Use
Green Construction
COMMUNITY HEALTH
Food & Agriculture
Green Business
TRANSPORTATION
OPEN SPACE, PARKS, & LANDSCAPE
GLOSSARY
Resource Conservation WATER
Goals & Programs:
Goal 1 Community Water Conservation – Decrease water usage by 20-percent per capita by 2020.
Program 1.1 Adopt water efficient landscape requirements for projects that trigger discre-tionary review that include:
Incorporating native and drought tolerant vegetation Minimizing irrigated lawn areas Designing irrigation systems to avoid runoff and overspray.
Planning Department & Envi-ronmental Task Force
$$$$$
Program 1.2 Explore the feasibility of requiring all existing multi-unit buildings to be “sub-metered” to enable monitoring water consumption on a unit-by-unit basis.
Planning Department & EB-MUD
$$$
Program 1.3 Encourage innovative strategies to decrease potable water consumption, such as installing a recycled water pipeline or establishing a recycled water facility in Lafayette. This may include the use of rainwater-harvesting systems and recycled and gray water for various purposes including irrigation.
Planning Department & Engi-neering Department
$$$$$
Program 1.4 Streamline permit process for installing gray water facilities. Planning Department & Engi-neering Department
$$
Goal 2 Municipal Water Conservation – Decrease water usage by 20-percent per capita by 2020.
Program 2.1 Continue to implement water-conscious policies and practices for municipal operations throughout the downtown, in parks, and City-owned properties. These may include:
Installing water efficient landscapes and irrigation systems when new features are required
Upgrading or installing water-conserving fixtures (e.g., faucets, high-efficiency toilets, etc.)
Using recycled water as available, if recycled water is sourced from Lafa-yette, given the constraints involved with transporting water.
Public Works Department & Parks, Trails, & Recreation Department
$
Goal 3 Public Outreach & Education – Provide the community with further water conservation and management information.
Program 3.1 Develop online resources and outreach materials for water conservation tips, planting guides, available rebates for water-saving equipment, and ways to minimize water pollution.
Planning Department & Envi-ronmental Task Force
$$
Program 3.2 Promote the following programs, tools, incentives, and water conservation information for the community:
East Bay Municipal Utility District’s WaterSmart Center StopWaste.org’s Bay Friendly Landscaping Program Rising Sun Energy Center’s California Youth Energy Services EPA’s WaterSense Program.
Planning Department & Sus-tainable Lafayette
$

P a g e 1 7 C i t y o f L a f a y e t t e
INTRODUCTION
GHG EMISSIONS INVENTORY
RESOURCE CONSERVATION
Solid Waste
Water
Energy Use
Green Construction
COMMUNITY HEALTH
Food & Agriculture
Green Business
TRANSPORTATION
OPEN SPACE, PARKS, & LANDSCAPE
GLOSSARY
Resource Conservation ENERGY USE
Introduction:
The intent of this section is to promote reduction of GHG emissions caused by energy use through energy conservation and efficiency and the use of renewable energy sources. Energy-related emissions account for more than 80-percent of the carbon dioxide released into the atmosphere each year.21
These emissions can be reduced through using less energy, increasing the efficiency of energy sources, and using renewables. Fossil fuels are currently used to satisfy nearly 80-percent of the world’s primary energy needs, thus finding ways to diversify energy sources is important for securing a more sustainable future for energy.22 Currently, among the many renewable options, solar photovoltaic generates 54 percent of California’s renewable energy generation. The energy generation from new solar photovoltaic in California is forecasted to increase greatly in the next couple of years and contribute to 32-percent of the renewable resource mix by 2020.23
In 2002, AB117 was passed, authorizing the creation of Community Choice Aggregators to generate and obtain electricity from renewable sources and provide it to customers via PG&E’s infrastructure. As of September 2016, the energy used in Lafayette’s homes and businesses is generated by MCE Clean Energy and transmitted by Pacific Gas and Electric Company (PG&E). All electricity customers within the City are automatically enrolled in MCE’s “light green” 53-percent renewable service, but have the option to opt-up to “deep green,” the 100-percent renewable service, or opt-out to PG&E. MCE generates electricity from a mix of conventional non-renewable resources (25%) and renewable sources including hydroelectric, geothermal, wind, solar, and biomass (75%).24 MCE’s goal is to achieve a 100-percent GHG-free supply portfolio by 2025.25
The amount of energy used to power homes and businesses determines how much power MCE needs to generate and the quantity of GHGs emitted.26
Most of the residential buildings in Lafayette were constructed between 1950 and 1959, with approximately 89-percent of all housing built before 1979. Since most homes in Lafayette were built prior to Title 24 Standards, Lafayette has a considerable opportunity to impact this market for energy improvements and emission savings. In addition to energy retrofits and improvements, increasing locally-generated electricity would lead to further reductions in GHG emissions. High upfront costs are often a barrier to renewable energy installations, so many of the programs in this section seek to ease this financial burden.27 Municipal energy usage for Buildings and Facilities has fluctuated between 2005 and 2015. Energy use accounted for 209.45 MTCO2e, 269 MTCO2e, and 252.5 MTCO2e in 2005, 2010 and 2015 respectively. The following chart describes emissions associated with energy use for the residential and commercial/industrial use for both electricity and natural gas.
21 http://www.eia.gov/environment/emissions/ghg_report/ghg_carbon.cfm 22 http://www.data.worldbank.org/indicator/EG.USE.COMM.FO.Z5 23
http://www.cpuc.ca.gov/NR/rdonlyres/68D58BFE-E350-4D49-B3D6-DAB43B806A5F/0/2013Q2RPSReportFINAL.PDF; www.energy.ca.gov/renewables/tracking_progress/documents/renewable.pdf 24
MCE Clean Energy’s 2017 Integrated Resource Plan 25
MCE Clean Energy’s 2017 Integrated Resource Plan 26
QuEST 27
Cal Poly Climate Action Plan
Sector Source 2005 2010 2015 Percent
Change from 2005
Percent Change from
2010
Energy
Residential Energy Electricity 18925 16718 14884.01451 -0.21352631 -0.10970125
Natural Gas 35572 36559 30228.07835 -0.15022832 -0.17316999
Commercial/Industrial Energy
Electricity 10489 10387 9824.035454 -0.06339637 -0.05419896
Natural Gas 6829 7097 6950.591919 0.01780523 -0.02062957
P a g e 1 8 C i t y o f L a f a y e t t e
INTRODUCTION
GHG EMISSIONS INVENTORY
RESOURCE CONSERVATION
Solid Waste
Water
Energy Use
Green Construction
COMMUNITY HEALTH
Food & Agriculture
Green Business
TRANSPORTATION
OPEN SPACE, PARKS, & LANDSCAPE
GLOSSARY
Resource Conservation ENERGY USE
Energy Use Standards:
In 1978, the California Energy Commission (CEC) adopted the California Code of Regulations (CCR). Title 24 of the CCR consists of regulations to enhance California building standards. In 2007, the California Governor directed state agencies to develop green building standards for residential, commercial, and public building construction for the 2010 code adoption process. This effort resulted in establishing Title 24 Part 11, also referred to as CalGreen, which was voluntary in 2008 and mandatory starting in 2011. In 2009, AB 758 was passed that requires the California Energy Commission to develop a comprehensive program to achieve greater energy efficiency in the state’s existing buildings. In 2010 (updated in 2011), Title 24 Part 6 was created that includes requirements for lighting, insulation, and equipment upgrades to buildings undergoing additions, alteration, or repairs. Effective in 2014, the CEC will require all new residential buildings to have solar-ready roofs. California’s Renewable Portfolio Standard (RPS) is one of the most ambitious renewable energy standards in the country. It was first codified in 2002 by SB 1078. In 2011, California’s RPS was updated and mandates that 33-percent of electricity delivered in California is generated by renewable sources like solar, wind, and geothermal by 2020. In the second quarter of 2013, the California Public Utilities Commission (CPUC) reported California is on track to meet 33-percent by 2020. The California Solar Initiative (CSI) was authorized in 2006 by SB 1 and allows the CPUC to provide incentives to install solar technology on existing residential, commercial, nonprofit, and governmental buildings if they are customers of the State’s investor-owned utilities, such as PG&E. Effective in 2014, AB 1103 mandates that electric and gas utilities maintain records of the energy consumption data of all non-residential buildings to which they provide service. It also mandates that an owner or operator of a non-residential building shall disclose ENERGY STAR Portfolio Manager benchmarking data and ratings for the most recent 12-month period to a prospective buyer, lessee, or lender and to the CEC.
21 http://www.eia.gov/environment/emissions/ghg_report/ghg_carbon.cfm 22 http://www.interacademycouncil.net/ 23
http://www.cpuc.ca.gov/NR/rdonlyres/68D58BFE-E350-4D49-B3D6-DAB43B806A5F/0/2013Q2RPSReportFINAL.PDF 24
MCE Clean Energy’s 2017 Integrated Resource Plan 25
MCE Clean Energy’s 2017 Integrated Resource Plan
P a g e 1 9 C i t y o f L a f a y e t t e
INTRODUCTION
GHG EMISSIONS INVENTORY
RESOURCE CONSERVATION
Solid Waste
Water
Energy Use
Green Construction
COMMUNITY HEALTH
Food & Agriculture
Green Business
TRANSPORTATION
OPEN SPACE, PARKS, & LANDSCAPE
GLOSSARY
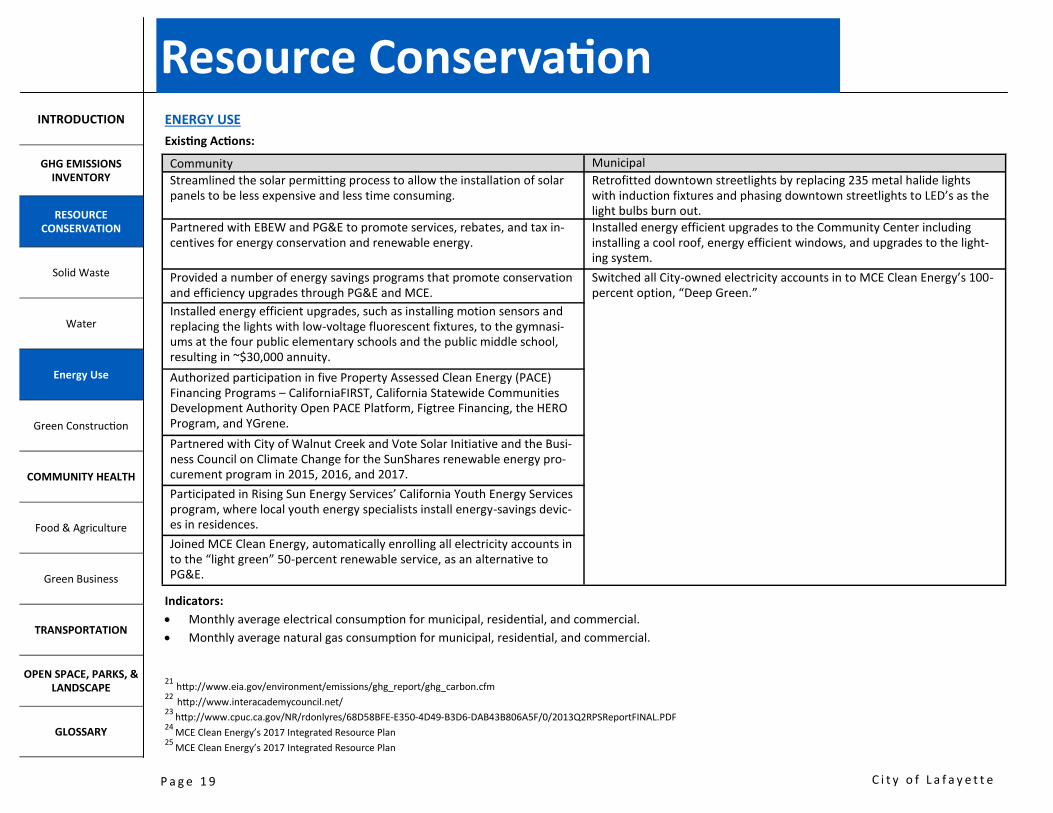
Resource Conservation ENERGY USE
Existing Actions:
Indicators:
Monthly average electrical consumption for municipal, residential, and commercial.
Monthly average natural gas consumption for municipal, residential, and commercial.
21 http://www.eia.gov/environment/emissions/ghg_report/ghg_carbon.cfm 22 http://www.interacademycouncil.net/ 23
http://www.cpuc.ca.gov/NR/rdonlyres/68D58BFE-E350-4D49-B3D6-DAB43B806A5F/0/2013Q2RPSReportFINAL.PDF 24
MCE Clean Energy’s 2017 Integrated Resource Plan 25
MCE Clean Energy’s 2017 Integrated Resource Plan
Community Municipal
Streamlined the solar permitting process to allow the installation of solar panels to be less expensive and less time consuming.
Retrofitted downtown streetlights by replacing 235 metal halide lights with induction fixtures and phasing downtown streetlights to LED’s as the light bulbs burn out.
Partnered with EBEW and PG&E to promote services, rebates, and tax in-centives for energy conservation and renewable energy.
Installed energy efficient upgrades to the Community Center including installing a cool roof, energy efficient windows, and upgrades to the light-ing system.
Provided a number of energy savings programs that promote conservation and efficiency upgrades through PG&E and MCE.
Switched all City-owned electricity accounts in to MCE Clean Energy’s 100-percent option, “Deep Green.”
Installed energy efficient upgrades, such as installing motion sensors and replacing the lights with low-voltage fluorescent fixtures, to the gymnasi-ums at the four public elementary schools and the public middle school, resulting in ~$30,000 annuity.
Authorized participation in five Property Assessed Clean Energy (PACE) Financing Programs – CaliforniaFIRST, California Statewide Communities Development Authority Open PACE Platform, Figtree Financing, the HERO Program, and YGrene.
Partnered with City of Walnut Creek and Vote Solar Initiative and the Busi-ness Council on Climate Change for the SunShares renewable energy pro-curement program in 2015, 2016, and 2017.
Participated in Rising Sun Energy Services’ California Youth Energy Services program, where local youth energy specialists install energy-savings devic-es in residences.
Joined MCE Clean Energy, automatically enrolling all electricity accounts in to the “light green” 50-percent renewable service, as an alternative to PG&E.

P a g e 2 0 C i t y o f L a f a y e t t e
INTRODUCTION
GHG EMISSIONS INVENTORY
RESOURCE CONSERVATION
Solid Waste
Water
Energy Use
Green Construction
COMMUNITY HEALTH
Food & Agriculture
Green Business
TRANSPORTATION
OPEN SPACE, PARKS, & LANDSCAPE
GLOSSARY
Resource Conservation ENERGY USE
Goals & Programs:
Goal 1 Community Energy Use – Reduce community energy use from 2015 by 5-percent by 2020 and transition to 75% renewable energy by 2025.
Program 1.1 Promote energy audits for existing residential and commercial development. Planning Department $
Program 1.2 Encourage property owners to monitor building energy use through energy monitors, web applications, and State-required energy use disclosures.
Planning Department & Sustaina-ble Lafayette
$
Program 1.3 Develop regulations that require new construction, large additions, and major remodels to adhere to additional energy efficiency performance standards, such as exceeding Title 24 requirements by 10-percent.
Planning Department & Environ-mental Task Force
$$$$
Program 1.4 Review and update wind energy conversion system regulations. Planning Department & Environ-mental Task Force
$$$$
Program 1.5 Encourage Sustainable Lafayette to work with the School District Green Team to identify saving opportunities and energy needs for Lafayette schools.
Environmental Task Force & Sus-tainable Lafayette
$
Program 1.6 Encourage residents to apply for matching incentive funding through the Comprehensive Residential Building Retrofit Program and other state pro-grams.
Planning Department & Sustaina-ble Lafayette
$
Program 1.7 Encourage residents and business owners to switch to MCE Clean Energy’s 100-percent renewable electricity option, “Deep Green.” Encourage 4% of residents to opt-up by December 2018, 6% by December 2019, 8% by Decem-ber 2020, and 10% by December 2021.
Planning Department, Environ-mental Task Force, & Sustainable Lafayette
$$
Goal 2 Municipal Energy Use – Reduce municipal energy use from 2015 levels by 5-percent by 2020.
Program 2.1 Expand the City’s Green Municipal Purchasing Policy to ensure that equip-ment, appliances, and lighting are replaced with high-efficient models.
Administrative Services Depart-ment
$
Program 2.2 Benchmark and track all City-owned buildings and assess building perfor-mance on a semi-annual basis.
Administrative Services Depart-ment
$$
Program 2.3 Identify sources of funding for energy upgrades, audits, and benchmarking. Planning Department, Environ-mental Task Force, & Sustainable Lafayette
$
Program 2.4 Develop at least one municipal renewable energy pilot project, such as in-stalling a green roof, by 2025.
Planning Department $$

P a g e 2 1 C i t y o f L a f a y e t t e
INTRODUCTION
GHG EMISSIONS INVENTORY
RESOURCE CONSERVATION
Solid Waste
Water
Energy Use
Green Construction
COMMUNITY HEALTH
Food & Agriculture
Green Business
TRANSPORTATION
OPEN SPACE, PARKS, & LANDSCAPE
GLOSSARY
Resource Conservation ENERGY USE
Goals & Programs:
Goal 3 Public Outreach & Education – Provide the community with further energy efficiency and reduction education.
Program 3.1 Collaborate with local utility providers, the County and State, businesses, and community organizations to develop energy conservation campaigns and mar-keting for existing programs.
Planning Department $
Program 3.2 Maintain a list of funding sources for energy improvements. Planning Department $
Program 3.3 Promote sources of funding and rebates for solar installations, such as U.S. Department of Energy SunShot Initiative.
Planning Department & Sustaina-ble Lafayette
$
Program 3.4 Promote the following programs and events for services, tools, incentives, and energy-efficiency information for the community:
Rising Sun Energy Center’s California Youth Energy Services Lafayette Earth Day Festival Lafayette Junior’s Annual Kitchen Tour Lamorinda Web Home Expo.
Planning Department & Sustaina-ble Lafayette
$

P a g e 2 2 C i t y o f L a f a y e t t e
INTRODUCTION
GHG EMISSIONS INVENTORY
RESOURCE CONSERVATION
Solid Waste
Water
Energy Use
Green Construction
COMMUNITY HEALTH
Food & Agriculture
Green Business
TRANSPORTATION
OPEN SPACE, PARKS, & LANDSCAPE
GLOSSARY
Resource Conservation GREEN CONSTRUCTION
Introduction:
Green construction refers to a sustainable, resource-efficient, and environmentally responsible process of building or remodeling a structure. It includes siting, design, construction, operation, maintenance, renovation, and demolition of a structure. Green buildings re-use existing materials; conserve water; reduce the need for artificial lighting, heating, cooling, and ventilation; and provide optimal air quality for building occupants.33 In addition to using green construction techniques for building, there are basic building efficiency upgrades that can be done to improve building performance, especially in older buildings. There are multiple non-profit organizations that support green construction, including the U.S Green Building Council through their Leadership in Energy and Environmental Design (“LEED”) program, Build it Green’s GreenPoint Rated (“GPR”) program, and the International Living Future Institute’s Living Building Challenge (“LBC”) program. LEED is a green building tool that addresses the entire building lifecycle and provides third-party verification of green buildings. Building projects satisfy prerequisites and earn points to achieve different levels of certification. Points may be earned by using sustainable sites, water efficiency, energy and the atmosphere, materials and resources, indoor environmental quality, and innovation in design.34 GreenPoint Rated is a program similar to LEED, although it focuses on residential projects in California. GPR verifies that a home has been built or remodeled according to proven green standards. The GPR program has certificates for whole homes and for elements of homes (e.g., remodeling a kitchen). GPR awards points for projects across different categories that include energy efficiency, resource conservation, indoor air quality, water conservation, and community.35 The Living Building Challenge is a building certification program, advocacy tool, and philosophy that defines the most advanced measure of sustainability in the built environment possible today. The LBC is comprised of seven performance categories, called Petals (place, water, energy, health and happiness, materials, equity, and beauty); Petals are subdivided into a total of twenty imperatives, each of which focuses on a specific sphere of influence. The LBC offers a Living Certification for buildings, renovations, and landscape and infrastructure projects when all twenty imperatives are met; a Petal Certification when at least seven imperatives are met; and a Net Zero Energy Certification when 100-percent of the building’s energy needs on a net annual basis are supplied by on-site renewable energy. The LBC certifications are based on actual performance, rather than modeled outcomes. The LEED, GPR, and LBC
programs exceed Title 24 standards. The City of Lafayette contracts out to the Contra Costa County Building Inspection Department, who implements Title 24.
Green Construction Standards:
The City contracts with the Contra Costa County Building Inspection Department, who enforces the State’s standards for green construction (Title 24), which are updated every three years and further discussed in the Energy Use section of this document.
33 Berkeley Climate Action Plan 34
http://www.usgbc.org/leed/rating-systems/new-construction 35
http://www.builditgreen.org/greenpoint-rated/ and Deborah Lichliter

P a g e 2 3 C i t y o f L a f a y e t t e
INTRODUCTION
GHG EMISSIONS INVENTORY
RESOURCE CONSERVATION
Solid Waste
Water
Energy Use
Green Construction
COMMUNITY HEALTH
Food & Agriculture
Green Business
TRANSPORTATION
OPEN SPACE, PARKS, & LANDSCAPE
GLOSSARY
Resource Conservation GREEN CONSTRUCTION
Existing Actions:
Indicators:
Inventory of buildings with LEED certification.
Inventory of buildings with GPR certification.
Inventory of Municipal buildings with any green building certification.
Community Municipal
Adopted a set of optional green building guidelines, which encourage use of green building materials and techniques [Contra Costa County Building Inspection Department].
Installed solar panels over carport on the Lafayette Library & Learning Cen-ter.
Adopted Downtown Design Guidelines (DDGs), which include green con-struction guidelines, such as using durable and renewable materials, incor-porating green roofs, and designing buildings to be adaptable for multiple uses.
Sustainable approach to construction of the Lafayette Community Center’s Manzanita Room, including: Ample roof surface with southern exposure for future solar panels, Existing electrical circuit in parking lot that could be modified to accom-
modate charging stations, 50% of the construction and demolition debris was diverted from the
landfill, through recycling and reuse, Used insulated metal panels composed of 70% recycled steel, Design of building shell reduces energy demands due to insulation and
waterproofing, and Use of LED-lighting, an energy-efficient heat pump system, and low-flow
plumbing fixtures.
Adopted Property Assessed Clean Energy financing programs to enable efficient building upgrades.
Grant annual Awards of Environmental Excellence [Environmental Task Force & Sustainable Lafayette].
Contract with the County Building Inspection Department to ensure all state requirements are met.

P a g e 2 4 C i t y o f L a f a y e t t e
INTRODUCTION
GHG EMISSIONS INVENTORY
RESOURCE CONSERVATION
Solid Waste
Water
Energy Use
Green Construction
COMMUNITY HEALTH
Food & Agriculture
Green Business
TRANSPORTATION
OPEN SPACE, PARKS, & LANDSCAPE
GLOSSARY
Resource Conservation GREEN CONSTRUCTION
Goals & Programs:
Indicators:
Inventory of buildings with LEED certification.
Inventory of buildings with GPR certification.
Inventory of Municipal buildings with any green building certification.
Goal 1 Community Green Construction – Increase number of certified green buildings on an ongoing basis.
Program 1.1 Develop incentives to encourage developers and property owners to exceed minimum CalGreen requirements, such as obtaining LEED certification, GPR certification, or a self-certification equivalent.
Planning Department & Environ-mental Task Force
$$$$
Program 1.2 Encourage the use of regional materials to decrease GHG emissions associat-ed with transporting materials from elsewhere.
Planning Department & Lafayette Chamber of Commerce
$
Program 1.3 Require applicants to complete a Build It Green Checklist or a similar already established checklist for discretionary development projects.
Planning Department $
Program 1.4 Promote local and state-wide programs to improve building efficiency in exist-ing buildings that include CalSPREE rebates, Savings by Design, Energy Star, etc.
Planning Department $
Program 1.5 Continue to pursue partnerships with organizations, such as QuEST, for tech-nical assistance to calculate greenhouse gas emissions associated with build-ings and facilities throughout the community.
Planning Department $$
Goal 2 Municipal Green Construction – Obtain green building certification for a minimum of one additional municipally-owned building by 2030.
Program 2.1 Pursue green building initiatives for new City Offices. Administrative Services Depart-ment
$$
Program 2.2 Establish a fund for municipal green construction upgrades. Engineering Department & Admin-istrative Services Department
$$
Program 2.3 Pursue grants and other forms of outside funding for municipal green con-struction upgrades.
Planning Department $$
Goal 3 Public Outreach & Education – Provide the community with further green construction education.
Program 3.1 Promote available financial incentives and low-cost financing tools to enable increased green building in the private sector.
Planning Department $
Program 3.2 Develop materials to promote green construction on the City’s website, at the Planning Counter, and at the Lafayette Chamber of Commerce.
Planning Department $

P a g e 2 5 C i t y o f L a f a y e t t e
INTRODUCTION
GHG EMISSIONS INVENTORY
RESOURCE CONSERVATION
Solid Waste
Water
Energy Use
Green Construction
COMMUNITY HEALTH
Food & Agriculture
Green Business
TRANSPORTATION
OPEN SPACE, PARKS, & LANDSCAPE
GLOSSARY
Community Health FOOD & AGRICULTURE
Introduction:
Food production is recognized as one of the nation’s largest sources of environmental degradation. Approximately one-third of all GHG emissions result from the global food system, due to importation, soil degradation, and deforestation. According to the Food and Agriculture Organization, the main global sources of emissions are: “feed production and processing (45 percent of the total), outputs of GHG during digestion by cows (39 percent), and manure decomposition (10 percent). The remainder is attributable to the processing and transportation of animal products.”37 The most effective approaches to curbing GHG emissions associated with food are reducing the consumption of carbon-intensive foods, including dairy products and red meat, and increasing the availability of fresh, locally-sourced, organic produce.
Food & Agriculture Standards:
The United States Food and Drug Administration (“FDA”) regulate food safety programs, manufacturing processes, industry systems, and import/export activities. The FDA regulates $417 billion worth of domestic food and $49 billion worth of imported food each year—everything we eat except for meat, poultry, and some egg products, which are regulated by the U.S. Department of Agriculture. The California Department of Food and Agriculture (“CDFA”) is divided into seven divisions and carries out state food safety and regulation of policy. Their mission is to help the Governor and Legislature ensure delivery of safe food and fiber through responsible environmental stewardship in fair marketplace for all Californians. The CDFA wants to guarantee that only safe and quality food reaches the consumer and ensure an equitable marketplace for agricultural products. The CDFA inspects fruits, vegetables, and nuts to ensure maturity, grade, size, weight, and packaging. The department performs verification audits to ensure safe handling and agricultural practices and conducts pest prevention and management programs to protect California horticulture, agriculture, and natural resources. The Contra Costa County Environmental Health Department is responsible for regulating restaurants, certified farmer’s markets, farm stands, mobile food facilities, permanent food facilities, and temporary food facilities. Additionally, the City regulates crop and tree farming, livestock, small farming, horticulture, viticulture, and agriculture in all zoning districts as a permitted use, not permitted use, or a use that requires a land use permit.
Existing Actions:
37 FAO: http://www.fao.org/news/story/en/item/197608/icode/
Community Municipal
Established Urban Farmers, a grassroots, all-volunteer, non-profit organiza-tion which grows and gleans fresh fruit harvested locally.
Leased land from EBMUD to provide the Lafayette Community Garden (Lafayette Community Garden has a contract with Sustainable Lafayette which has a contract with the City which has a contract with EBMUD).
Established the Lafayette Community Garden in collaboration with Sustain-able Lafayette to grow food collaboratively, facilitate workshops to pro-mote sustainable gardening, and share food.
Developed policy to avoid use of chemicals that are discouraged by CA Re-gional Water Quality Control Board, encourage integrated pest manage-ment practices, and perform weed abatement by hand when economically viable. Created edible gardens at local schools.
Provided workshops on raising chickens and rabbits. Minimize the use of hazardous or toxic materials, such as persistent organic pollutants (POPs) and persistent bio-accumulative & toxic chemicals (PBTs), by residents, businesses, and City operations.
Passed legislation to allow and define number of food-producing animals that can be kept by residents.
Using mulch as a weed-mitigation measure in order to decrease the use of chemical mitigation measures.

P a g e 2 6 C i t y o f L a f a y e t t e
INTRODUCTION
GHG EMISSIONS INVENTORY
RESOURCE CONSERVATION
Solid Waste
Water
Energy Use
Green Construction
COMMUNITY HEALTH
Food & Agriculture
Green Business
TRANSPORTATION
OPEN SPACE, PARKS, & LANDSCAPE
GLOSSARY
Community Health FOOD & AGRICULTURE
Goals & Programs:
Indicators:
Number of schools with gardens and associated programming.
Number of Lafayette Community Garden members and visitors.
Number of residents participating in food sharing, community supported agriculture, or gleaning programs.
Quantity and type of hazardous materials (including POP & PBT-containing materials) purchased by the City.
37 http://ccafs.cgiar.org/bigfacts/global-agriculture -emissions/
Goal 1 Community – Increase availability of fresh, locally produced, organic produce.
Program 1.1 Encourage Sustainable Lafayette to work with Global Student Embassy to es-tablish gardens and associated programming at all Lafayette schools.
Planning Department & Sustaina-ble Lafayette
$
Program 1.2 Encourage Sustainable Lafayette to create a campaign to increase participa-tion with the Lafayette Community Garden, the Global Student Embassy, the Urban Farmers, and other similar organizations.
Planning Department, Sustainable Lafayette, & Lafayette Community Garden
$
Goal 2 Municipal – Increase availability of fresh, locally produced, organic produce to promote community health and to minimize resource consumption.
Program 2.1 Expand community gardens on City-owned properties, such as the Lafayette Community Center.
Parks, Trails, & Recreation Depart-ment
$$$
Program 2.2 Establish a policy in the Administrative Regulations that requires the City to supply, when possible, local food from Lafayette businesses when food is pro-vided at meetings and events.
Administrative Services Depart-ment
$
Program 2.3 Encourage Sustainable Lafayette to assist local businesses with becoming cer-tified Fair Trade USA.
Planning Department & Sustaina-ble Lafayette
$
Goal 3 Public Outreach & Education – Provide the community with further education on the local food movement.
Program 3.1 Promote Lafayette Community Garden, the Urban Farmers, and other similar organizations and their events on the City’s website.
Planning Department $
Program 3.2 Encourage Sustainable Lafayette to educate local gardeners in resource effi-cient and pollution prevention landscape management practices. Use the Green Gardener Certification Program in Redwood City as a guide.
Planning Department & Sustaina-ble Lafayette
$
Program 3.3 Encourage Sustainable Lafayette and the Lafayette Chamber of Commerce to develop an “As Fresh As It Gets” campaign to support and encourage the con-sumption of fresh, locally produced, organic products.
Planning Department, Sustainable Lafayette, & Lafayette Chamber of Commerce
$

P a g e 2 7 C i t y o f L a f a y e t t e
INTRODUCTION
GHG EMISSIONS INVENTORY
RESOURCE CONSERVATION
Solid Waste
Water
Energy Use
Green Construction
COMMUNITY HEALTH
Food & Agriculture
Green Business
TRANSPORTATION
OPEN SPACE, PARKS, & LANDSCAPE
GLOSSARY
Community Health GREEN BUSINESS
Introduction:
The Green Business Program, a partnership of the Lafayette Chamber of Commerce, City of Lafayette, Contra Costa County, and the Association of Bay Area Governments, is designed to assist, recognize, and promote local businesses that volunteer to operate in a more environmentally responsible way. To be certified “green,” businesses must be in compliance with all state and local regulations and meet the program’s standards for energy and water conservation, pollution prevention, and diverting waste from the landfill. Certified Green Businesses exhibit a tangible commitment to reducing waste and conserving resources, serving as a great example to other local businesses. There are currently three green business programs—Lafayette Green Business, the Bay Area Green Business Program, and the California Green Business Program—which are administered by the Lafayette Chamber of Commerce, Contra Costa County, and the State of California respectively.
Green Business Standards:
There are no federal, state, or city standards for green businesses, but there are a number of guidelines and certification programs such as those offered by the U.S. Small Business Administration, the Bay Area Green Business program, and the Lafayette Green Business program operated by the Lafayette Chamber of Commerce.
Existing Actions:
Community Municipal
Prepared a Lafayette Green Shopper Guide, which outlines Lafayette Chamber of Commerce members that are certified Lafayette Green Busi-nesses, Bay Area Certified Green Businesses, or sell “green” products or services [Lafayette Chamber of Commerce].
Obtained certification of the Lafayette City Offices and the Lafayette Com-munity Center as a Lafayette Green Business and Bay Area Certified Green
Business.
Prepared a Lafayette Business Owners Green Brochure, that includes 15 tips to “green” your business [Lafayette Chamber of Commerce].
Partnered with a green business consulting firm to outline tips for “greening” your business [Lafayette Chamber of Commerce].
Adopted Ordinance 626, regulating single-use carryout bags and food pack-aging recycling.
Prepare handout for reducing or eliminating junk mail [Lafayette Chamber of Commerce].

P a g e 2 8 C i t y o f L a f a y e t t e
INTRODUCTION
GHG EMISSIONS INVENTORY
RESOURCE CONSERVATION
Solid Waste
Water
Energy Use
Green Construction
COMMUNITY HEALTH
Food & Agriculture
Green Business
TRANSPORTATION
OPEN SPACE, PARKS, & LANDSCAPE
GLOSSARY
Community Health GREEN BUSINESS
Goals & Programs:
Indicators:
Number of businesses participating in the Lafayette Green Business Program.
Number of businesses participating in the Bay Area Green Business Program.
Goal 1 Community –
Program 1.2 Develop a plastic straw ban for local businesses. Planning Department, Environ-mental Task Force, Lafayette Chamber of Commerce, & Sustain-able Lafayette
$$$$$
Goal 2 Municipal –
Program 2.1 Update regulations to attract and support local businesses over chain retail-ers.
Planning Department, Lafayette Chamber of Commerce, & Envi-ronmental Task Force
Program 2.2 Certify all municipal buildings as a Certified Lafayette Green Businesses and Bay Area Certified Green Business.
Administrative Services Depart-ment
$$
Goal 3 Public Outreach & Education – Provide the community with further
Program 3.1 Encourage the Lafayette Chamber of Commerce and Sustainable Lafayette to assist businesses in obtaining a green business certification by partnering business owners with interns and organizations to supplement their efforts.
Planning Department, Lafayette Chamber of Commerce, & Sustain-able Lafayette
$
P a g e 2 9 C i t y o f L a f a y e t t e
INTRODUCTION
GHG EMISSIONS INVENTORY
RESOURCE CONSERVATION
Solid Waste
Water
Energy Use
Green Construction
COMMUNITY HEALTH
Food & Agriculture
Green Business
TRANSPORTATION
OPEN SPACE, PARKS, & LANDSCAPE
GLOSSARY
Transportation Introduction:
Transportation comprises nearly one-third of total U.S. emissions36 and close to 40-percent of California’s emissions. Transportation-related emissions are linked to the travel mode (passenger vehicle, heavy equipment, bicycle, etc.), trip length, number of trips, efficiency of vehicles, and land use and development patterns. Getting people out of their single-occupancy vehicles and encouraging use of transit and active transportation options such as walking or biking is crucial for reducing congestion and carbon emissions. Based on the GHG inventories for the City, emissions from local roads decreased significantly between 2005 and 2015, emissions from state highways increased slightly, and emissions from residential off-road equipment remained constant. Overall, the 2015 GHG inventory showed that 5% of all emissions came from off-road equipment, 17% from local roads, and 56% from the state highway.
Transportation Standards:
It is statewide policy to encourage widespread electrification of the transportation sector. Numerous state laws, regulations and executive orders exist pertaining to the reduction of mobile/transportation GHG emissions. Mobile emissions include both on- and off-road vehicles and equipment. Regulations & Initiatives In December 2016, the California Public Utilities Commission authorized PG&E to spend $130 million to install up to 7,500 charging stations at multifamily residential dwellings and workplace locations throughout its service territory (Decision 16-12-065). This program covers most to all of the cost of charger installation at qualified facilities. The California Public Utilities Commission entered into a settlement agreement with NRG Energy Inc. to bring to California a statewide network of charging stations for PEVs, including at least 200 public fast-charging stations and the infrastructure for up to 10,000 privately-owned charging stubs (make-readies) at multi-family residences, workplaces and other locations. Newly constructed residential and most non-residential buildings will be PEV-capable as a matter of state law. The California Building Standards Commission adopted changes to the California Green Building Standards Code (Title 24, Part 11 Green Building Standards Code) requiring all newly constructed parking lots and housing to put electrical capacity in place to easily install PEV chargers. Effective January 2017, the number of parking spaces that must be PEV-capable increases to 6% for most non-residential buildings. In January 2016, California adopted the first PEV charging station accessibility requirements in the nation, providing clear standards and guidance to ensure charging stations are accessible to ZEV users with disabilities. In April 2016, the California Department of Food and Agriculture entered into an interagency agreement with the California Energy Commission to develop specifications and accuracy tolerances for the commercial (non-utility) measurement of electricity as a motor vehicle fuel dispensed from PEV charging equipment. In March 2013, the California Department of Transportation issued a directive standardizing signage for public PEV charging stations and hydrogen fueling stations on highways and roads across the state. The California Manual on Uniform Traffic Control Devices also now permits signage for alternative fuel charging on highways in urban areas.
36 https://www.epa.gov/ghgemissions/inventory-us-greenhouse-gas-emissions-and-sinks

P a g e 3 0 C i t y o f L a f a y e t t e
INTRODUCTION
GHG EMISSIONS INVENTORY
RESOURCE CONSERVATION
Solid Waste
Water
Energy Use
Green Construction
COMMUNITY HEALTH
Food & Agriculture
Green Business
TRANSPORTATION
OPEN SPACE, PARKS, & LANDSCAPE
GLOSSARY
Transportation The California Energy Commission is working to complete the California segments of the West Coast Electric Highway, funding networks of DC fast chargers along key interregional highway corridors. The California Energy Commission provided $8.8 million for 61 DC fast chargers along north-south corridors for Interstate 5, U.S. Highway 101 and State Highway 99. A second solicitation for $9.9 million to support east-west highway corridors was released in January 2016. In September 2015, California signed a Letter of Intent with the New Energy and Industrial Technology Organization (NEDO) of Japan to support the installation of 30-50 DC fast chargers from Monterey to Lake Tahoe via Sacramento. In partnership with the California Plug-In Electric Vehicle Collaborative, Governor Brown hosted two high-level convening's of CEOs (in 2013 and 2015) at the “Drive the Dream” event to encourage companies across California to commit to expanding workplace charging. Statutes & Executive Orders In 2002, the State Legislature passed Assembly Bill (AB) 1493, with the intent to reduce GHG emissions from passenger vehicles by regulating manufacturing standards related to fuel efficiency, beginning in 2009. As a result of this legislation, it anticipated that GHG emissions from California passenger vehicles will have decreased by approximately 30-percent in 2016. In 2007, the State Legislature passed two bills pertinent to mobile GHG emissions reduction: Senate Bill (SB) 97 and AB 118. SB 97 streamlines environmental review for projects under CEQA when the subject project contributes to emissions reductions goals set forth in a local GHG reduction strategy or plan. For example, a project that reduces single-vehicle occupancy demand by reducing on-site parking or providing additional active
transportation facilities may qualify for CEQA exemption under SB 97. In addition, AB 118 provides established the Alternative and Renewable Fuel and Vehicle Technology Program to fund public projects that deploy alternative and renewable fuels, such as electric vehicle charging infrastructure.
In 2008, SB 375 was passed as the Sustainable Communities & Climate Protection Act, which mandates that the California Air Resources Board (ARB) develop GHG reduction targets specific to passenger vehicles. As such, Metropolitan Planning Organizations (MPOs) must each develop a Sustainable Community Strategy (SCS) that delineates passenger vehicle GHG reduction targets. For the San Francisco Bay Area MPO, known as the Metropolitan Transportation Commission (MTC), Plan Bay Area represents the regional SCS.
In 2012, Governor Edmund Brown issued Executive Order B-16-12 directing the state to accelerate the market for zero emissions vehicles in California. It orders State agencies to facilitate the rapid commercialization of zero-emission vehicles (ZEVs). The Executive Order sets a target for the number of 1.5 million ZEVs in California by 2025. Also the Executive Order sets as a target for 2050 a reduction of GHG emissions from the transportation sector equaling 80 percent less than 1990 levels. In 2015, executive order B-30-15 sets an interim milestone reduce GHG emissions to 40% less than 1990 levels by 2030. In 2013, the State Legislature re-authorized two programs that provide as much as $100 million annually towards innovative transportation and fuel technologies, including PEV charging and hydrogen station infrastructure, through 2024: the Air Quality Improvement Program (AQIP), administered by the California Air Resources Board, and the Alternative and Renewable Fuel and Vehicle Technology Program (ARFVTP), administered by the California Energy Commission.

P a g e 3 1 C i t y o f L a f a y e t t e
INTRODUCTION
GHG EMISSIONS INVENTORY
RESOURCE CONSERVATION
Solid Waste
Water
Energy Use
Green Construction
COMMUNITY HEALTH
Food & Agriculture
Green Business
TRANSPORTATION
OPEN SPACE, PARKS, & LANDSCAPE
GLOSSARY
Transportation In 2014, the State Legislature passed and Governor Brown signed the California Charge Ahead Initiative (Senate Bill 1275), a landmark bill supporting consumer incentives and rebates to enable one million ZEVs on California’s roads by January 1, 2023. The law requires the California Air Resources Board to adopt programs that benefit disadvantaged communities, including projects that provide grants for fleet managers to replace polluting medium- and heavy-duty vehicles with cleaner vehicles. Another 2014 law, Senate Bill 1204, established the California Clean Truck, Bus, and Off-Road Vehicle and Equipment Technology Program to fund purchase incentives for commercially available heavy-duty zero and near zero-emission technologies. In 2015, the State Legislature passed and Governor Brown signed into law the Clean Energy and Pollution Reduction Act of 2015 (Senate Bill 350) which established as a statewide policy widespread electrification of the transportation sector. The law promotes additional investments in electrification by investor-owned electric utilities, based on guidance developed by the California Public Utilities Commission. Proposed investments should improve access to electricity as an economical and alternative transportation fuel, leverage vehicles as a resource to integrate a grid powered by 50% renewable electricity, and reduce emissions of air pollutants and greenhouse gases. Currently under consideration (2017), AB 1184 would authorize up to $3 billion to be spent on EV rebates.
Existing Actions:
36 https://www.epa.gov/ghgemissions/inventory-us-greenhouse-gas-emissions-and-sinks
Community Municipal
Provided bike valet at community events such as the Lafayette Art & Wine Festival and Earth Day Festival [Lafayette Chamber of Commerce & Sus-tainable Lafayette].
Provided a Bicycle-Pedestrian Advisory Committee to advise the City on issues related to non-motorized vehicles and pedestrians.
Promoted Go Lafayette to help Lafayette residents and employees make informed choices about getting around quickly and sustainably [Sustainable Lafayette].
Adopted a Bikeways Master Plan, Walkways Master Plan, and Trails Master Plan.
Promoted Bike Lafayette to support, encourage, and grow cycling commu-nity in Lafayette [Sustainable Lafayette].
Provided three bicycles as part of Lafayette fleet.
Participated in the Safe Routes to School Program [Transportation Planner, Bicycle Pedestrian Advisory Committee, & Public Schools].
Provided discounted BART tickets for daily commute to all regular City em-ployees.
Promoted family bike rides during the summer [Sustainable Lafayette].
Participated in the Lamorinda School Bus Program.
Provided intra-county bus transit service [County Connection].
Provided a BART Station to connect Lafayette with the greater SF Bay Area.
Installed three Electric Vehicle Charging Stations at public parking lots in the downtown.

P a g e 3 2 C i t y o f L a f a y e t t e
INTRODUCTION
GHG EMISSIONS INVENTORY
RESOURCE CONSERVATION
Solid Waste
Water
Energy Use
Green Construction
COMMUNITY HEALTH
Food & Agriculture
Green Business
TRANSPORTATION
OPEN SPACE, PARKS, & LANDSCAPE
GLOSSARY
Transportation Goals & Programs:
Goal 1 Community – Reduce community-wide GHG emissions caused by transportation by 40-percent below 1990 levels by 2030.
Program 1.1 Require new and redeveloped street designs to address the needs of all users – motorists, pedestrians, bicyclists, children, persons with disabilities, seniors, and users of public transit – where appropriate.
Engineering Department & Bicycle Pedestrian Advisory Committee
$$$$$
Program 1.2 Research traffic congestion management techniques that decrease vehicle stop rate and time, such as signal synchronization or roundabouts.
Engineering Department $$
Program 1.3 Complete the capital improvements identified in the Bikeways Master Plan, Walkways Master Plan, and Trails Master Plan.
Engineering Department, Bicycle Pedestrian Advisory Committee, & Parks, Trails, & Recreation Depart-ment
$$$$$
Program 1.4 Expand Safe Routes to Schools Programs to include all public and private schools.
Transportation Planner, Engineer-ing Department, & Bicycle Pedes-trian Advisory Committee
$$$
Program 1.5 Update the On- and Off-Street Parking Ordinance to include short-term and long-term bicycle parking standards.
Planning Department & Bicycle Pedestrian Advisory Committee
Program 1.6 Research opportunities for a bike-share program near parking facilities. Planning Department, Transporta-tion Planner, & Bicycle Pedestrian Advisory Committee
$$
Program 1.7 Offer free or discounted bus passes to residents, employees, seniors and stu-dents.
Transportation Planner & Lamorin-da School Bus Program
Program 1.8 Study the opportunities and constraints of carpooling and use of the Lamorin-da School Bus and partner with local schools to expand programs.
Transportation Planner & School Bus Program Manager
$$$$
Program 1.9 Require new businesses to participate in the Transportation Demand Manage-ment Program (511.ContraCosta.org).
Planning Department
Program 1.10
Study the feasibility of a downtown shuttle. Transportation Planner
Program 1.11
Encourage car-sharing companies to designate spaces in public parking areas and multifamily housing projects.
Planning Department $$
Program 1.12
Require all new development with 50 or more parking spaces to designate a minimum 8% of parking spaces for clean air vehicles.
Planning Department $
Program 1.13
Expand the network of electric vehicle charging stations and car-sharing park-ing spaces, particularly at BART, schools, shopping centers, and office com-plexes.
Planning Department & Adminis-trative Services Department
$$$$
Program 1.14
Update the On-and Off-Street Parking Ordinance to include requirements to pre-wire for electric vehicle charging stations.
Planning Department $$
Program 1.15
Continue to research federal, state, and local funding for bikeways improve-ments, transit service upgrade projects, and active transportation upgrades.
Transportation Planner & Bicycle Pedestrian Advisory Committee
$
Program 1.16
Complete and implement the Downtown Congestion Study. Transportation Planner, Engineer-ing Department, & Circulation Commission
$$$$$
Program 1.17
Amend the zoning ordinance to disallow drive-thru restaurants, which result in significant emissions from vehicle idling.
Transportation Planner & Planning Department
$$

P a g e 3 3 C i t y o f L a f a y e t t e
INTRODUCTION
GHG EMISSIONS INVENTORY
RESOURCE CONSERVATION
Solid Waste
Water
Energy Use
Green Construction
COMMUNITY HEALTH
Food & Agriculture
Green Business
TRANSPORTATION
OPEN SPACE, PARKS, & LANDSCAPE
GLOSSARY
Transportation
Indicators:
Origin of Lafayette BART riders. Travel mode share to Lafayette BART.
Number of riders that leave and arrive at Lafayette BART. Miles of bike lanes (qualify by class ratings).
Number of people that participate in Bike to Work Day. Number of employees that participate in Bike to Work Day.
Number of bike racks. Number of public EV charging stations.
Percent of residents that reside within __ distance of Highway 24 or __ distance of BART.
36 https://www.epa.gov/ghgemissions/inventory-us-greenhouse-gas-emissions-and-sinks
Goal 2 Municipal – Reduce municipal GHG emissions caused by transportation by __-percent by 2020.
Program 2.1 Expand the City’s Green Municipal Purchasing Policy to include the replace-ment of all City-owned vehicles with alternative fuel, fuel-efficient, electric, or hybrid vehicles.
Administrative Services Depart-ment
$$
Program 2.2 Install electric vehicle charging stations on all City-owned properties. Planning Department & Adminis-trative Services Department
$$$$$
Program 2.3 Expand the bicycle fleet to include bicycles at the Police Department, Public Works Corporation Yard, and the Community Center.
Transportation Planner & Bicycle Pedestrian Advisory Committee
$
Program 2.4 Provide short-term and long-term bicycle parking at all City-owned buildings. Transportation Planner & Bicycle Pedestrian Advisory Committee
$$
Goal 3 Public Outreach & Education – Provide the community with further education on ways to reduce vehicle miles traveled.
Program 3.1 Promote Go Lafayette, 511.org, and other transportation resources on the City’s website.
Transportation Planner $
Program 3.2 Expand the Bike to Work Day program by providing more outreach within the community.
Transportation Planner, Bicycle Pedestrian Advisory Committee, & Lafayette Chamber of Commerce
$
Program 3.3 Coordinate an annual downtown bicycle event. Lafayette Chamber of Commerce, Sustainable Lafayette, & Bicycle Pedestrian Advisory Committee
Program 3.4 Encourage the Lafayette Chamber of Commerce and Sustainable Lafayette to provide an annual free bicycle repair day.
Transportation Planner, Lafayette Chamber of Commerce, & Sustain-able Lafayette
$
Program 3.5 Encourage Sustainable Lafayette to work with the school district to promote a campaign to be “idle-free.”
Transportation Planner, Sustaina-ble Lafayette, & Schools
$
Program 1.16
Complete and implement the Downtown Congestion Study. Transportation Planner, Engineer-ing Department, & Circulation Commission
$$$$$
Program 1.17
Amend the zoning ordinance to disallow drive-thru restaurants, which result in significant emissions from vehicle idling.
Transportation Planner & Planning Department
$$

P a g e 3 4 C i t y o f L a f a y e t t e
INTRODUCTION
GHG EMISSIONS INVENTORY
RESOURCE CONSERVATION
Solid Waste
Water
Energy Use
Green Construction
COMMUNITY HEALTH
Food & Agriculture
Green Business
TRANSPORTATION
OPEN SPACE, PARKS, & LANDSCAPE
GLOSSARY
Open Space, Parks, & Landscape OPEN SPACE, PARKS, & LANDSCAPE
Introduction:
Open space offers ecological, aesthetic, recreational, educational, social, and economic benefits, in addition to serving to protect biological resources, environmentally-sensitive areas, water resources, air quality, and natural resources such as creeks and trees. Trees, for example, provide community benefits including reducing stormwater runoff, capturing carbon dioxide, providing shade, privacy, and habitat, and beautifying neighborhoods. While the maintenance of open space and landscape produces some GHGs, the amount of GHG emissions produced is typically a small percentage of the total. Plants and soils are often referred to as “carbon sinks,” in which GHGs such as carbon dioxide are taken out of the atmosphere and stored in leaves, stems, and roots. The City currently has 4,035 acres of tree canopy, or approximately 41% of the city’s land, which is higher than the tree coverage of Contra Costa County (15%) and the State of California (18%). Economically, the value of the City’s trees equate to $19.8 million per year in terms of carbon storage and $730,000 annually in terms of carbon sequestration. According to the Arbor Environmental Alliance, a single tree can absorb CO2 at a rate of 48 lbs/year.37 Lafayette also has 7 public parks constituting approximately 91 acres of existing parkland. Based on the GHG inventory, Buildings & Facilities, which includes Buckeye Fields and the Community Park, encompassed 28% of the City’s municipal emissions in 2015, and Water Transport, which includes sprinklers and irrigation control, encompassed less than 1% of the City’s municipal emissions. Emissions from both of these categories, Buildings & Facilities and Water Transport, decreased slightly between 2005 and 2015.
Open Space, Parks, & Landscape Standards:
U.S. Forest Service Open Space Conservation Strategy (2007)- This strategy outlines national priorities for the USFS to achieve a network of open space across the landscape supporting healthy ecosystems and quality of life, including private forests and rangelands, national forests and grasslands, other public land, riparian areas and wildlife corridors, and urban greenspaces. The strategy identifies four priority actions: 1) Convene partners to identify and protect priority open space; 2) Promote national policies and markets to help private landowners conserve open space; 3) Provide resources and tools to help communities expand and connect open spaces; and 4) Participate in community growth planning to reduce ecological impacts and wildfire risks.
* As of August 10, 2017 this plan is no longer available on the USFS website
State of California Government Code Section 65560 et. Seq.—covers state standards for open space lands within local planning, including definition of “open-space land” along with goals for use and management of open spaces within cities and/or counties of California.
Contra Costa County General Plan Chapter 9: Open Space Element – satisfies the requirements of Section 65560 et. Seq. The three major components are a policy framework for the preservation of open space lands, an open space map identifying county land subject to the policies contained herein, and an implementation program. Section 9.5 of the Open Space Element lists Overall Goals and Policies, which include: 1) to preserve and protect the ecological, scenic, cultural/historic, and recreational resource lands of the County; 2) to conserve the open space and natural resources of the county through control of the direction, extent, and timing of urban growth; 3) to achieve a balance of open space in urban areas to meet the social, environmental, and economic needs of the County now and for the future.
City goal to provide 5-acres of parkland per every 1,000 residents
37 http://www.arborenvironmentalalliance.com/carbon-tree-facts.asp

P a g e 3 5 C i t y o f L a f a y e t t e
INTRODUCTION
GHG EMISSIONS INVENTORY
RESOURCE CONSERVATION
Solid Waste
Water
Energy Use
Green Construction
COMMUNITY HEALTH
Food & Agriculture
Green Business
TRANSPORTATION
OPEN SPACE, PARKS, & LANDSCAPE
GLOSSARY
Open Space, Parks, & Landscape OPEN SPACE, PARKS, & LANDSCAPE
Existing Actions:
37 http://www.arborenvironmentalalliance.com/carbon-tree-facts.asp
Community Municipal
Worked to identify potential land available for acquisition & to create awareness of the need to protect undeveloped land [Lafayette Open Space Group].
Drafted Chapter 6-17 “Tree Protection” of the Lafayette Municipal Code [Planning Department].
Encouraged civic planting and conservation programs [Lafayette Garden Club].
Worked with the Association of Bay Area Governments to designate Burton Ridge and Lafayette Ridge as Priority Conservation Areas [Planning Depart-ment].
Developed an Open Space Plan that identifies areas with open space preservation potential [Planning Department].
Partnered with the City of Walnut Creek, East Bay Regional Park District, and the Muir Heritage Land Trust to designate a 23-acre parcel as perma-nent part of Acalanes Ridge Open Space [City Manager].
Hosted an annual Creek Clean-Up Day [Creeks Committee].
Developed creek setback regulations [Engineering Department].

P a g e 3 6 C i t y o f L a f a y e t t e
INTRODUCTION
GHG EMISSIONS INVENTORY
RESOURCE CONSERVATION
Solid Waste
Water
Energy Use
Green Construction
COMMUNITY HEALTH
Food & Agriculture
Green Business
TRANSPORTATION
OPEN SPACE, PARKS, & LANDSCAPE
GLOSSARY
Open Space, Parks, & Landscape OPEN SPACE, PARKS, & LANDSCAPE
Goals & Programs:
Indicators:
Number of acres of designated open space and parkland.
Parkland acres per capita.
Number of properties within 1/2-mile of a park.
Number of net new trees planted.
Goal 1 Community – Support the preservation and enhancement of open space and recreational areas for the community.
Program 1.1 Develop an Arbor Day Celebration. Sustainable Lafayette, with assis-tance from Parks, Trails, & Recrea-tion Department
$
Program 1.2 Encourage ongoing Lafayette-based donation programs for open space preservation and maintenance.
Sustainable Lafayette $
Goal 2 Municipal – Prioritize at least three programs by 2030 that will help to preserve open space, parks, & landscape areas.
Program 2.1 Update the list of existing City-maintained trees to identify and prioritize po-tential tree planting locations.
Parks, Trails, & Recreation Depart-ment & Public Works Department
$
Program 2.2 Expand tree planting through programs, such as adopt-a-tree, commemora-tive plaques, and other volunteer-based planting.
Sustainable Lafayette & Parks, Trails, & Recreation Department
$$
Program 2.3 Develop a list of climate-appropriate trees for maximizing shade and carbon sequestration to be incorporated as part of the Downtown Street Improve-ment Master Plan. Consider using the CUFR Carbon Calculator.
Environmental Task Force & Plan-ning Department, with review by Parks, Trails, & Recreation Depart-ment & the Downtown Street Im-provement Master Plan Implemen-tation Committee
$$$
Program 2.4 Replace City-owned lawn and garden equipment with new, battery-powered, zero-emission lawn and garden equipment when the zero-emission equip-ment becomes more efficient.
Public Works Department $
Goal 3 Public Outreach & Education – Encourage engagement and increase awareness of the importance of open space, parks, and land-scape.
Program 3.1 Partner with regional organizations to create volunteer opportunities for trail work, habitat restoration, open space maintenance, and tree planting.
Parks, Trails, & Recreation Depart-ment
$$$
Program 3.2 Promote participation in StopWaste.org’s Bay Friendly Landscaping program and identify educational demonstration projects.
Planning Department & Sustaina-ble Lafayette
$

P a g e 3 7 C i t y o f L a f a y e t t e
INTRODUCTION
GHG EMISSIONS INVENTORY
RESOURCE CONSERVATION
Solid Waste
Water
Energy Use
Green Construction
COMMUNITY HEALTH
Food & Agriculture
Green Business
TRANSPORTATION
OPEN SPACE, PARKS, & LANDSCAPE
GLOSSARY
1. Alternate Daily Cover (ADC) is a green material used for solid waste cover in landfills. ADC does not typically make up a significant source of emissions.
2. An Environmental Indicator is a statistic or trend that displays the direction in which a particular condition is heading. The indicators are grouped under the City’s adopted Environmental Strategy goals and establish baselines and measurements which gauge the community’s progress in meeting these goals. It is anticipated that more indicators will be added as data relevant to Lafayette becomes available.
3. Gleaning is the act of collecting leftover crops for those in need. 4. Waste Diversion is the process of reducing the amount of waste
disposed of at landfills through waste prevention, recycling, reuse, and composting.
Glossary & Acronyms