iucn situation analysis on east and southeast asian ... · intertidal habitats, with particular...
TRANSCRIPT

IUCN situation analysis on East and Southeast Asian intertidal habitats, with particular reference to the Yellow Sea (including the Bohai Sea)
John MacKinnon, Yvonne I. Verkuil and Nicholas Murray
Occasional Paper of the IUCN Species Survival Commission No. 47
INTERNATIONAL UNIONFOR CONSERVATION OF NATURE
www.iucn.org
Produced with support from

The designation of geographical entities in this book, and the presentation of the material, do not imply the expression of any opinion whatsoever on the part of IUCN or the compilers concerning the legal status of any country, territory, or area, or of its authorities, or concerning the delimitation of its frontiers or boundaries. The views expressed in this publication do not necessarily reflect those of IUCN or other participating organizations.
Published by: IUCN, Gland, Switzerland
Copyright: © 2012 International Union for Conservation of Nature and Natural ResourcesReproduction of this publication for educational or other non-commercial purposes is authorized without prior written permission from the copyright holder provided the source is fully acknowledged. Reproduction of this publication for resale or other commercial purposes is prohibited without prior written permission of the copyright holder.
Citation: MacKinnon, J., Verkuil, Y.I. & Murray, N. 2012. IUCN situation analysis on East and Southeast Asian intertidal habitats, with particular reference to the Yellow Sea (including the Bohai Sea). Occasional Paper of the IUCN Species Survival Commission No. 47. IUCN, Gland, Switzerland and Cambridge, UK. ii + 70 pp.
ISBN: 978-2-8317-1255-0
Photo credits: Tony Mok (cover photo, Seaweed farming on the Xiapu mudflat, Fujian County, China), Jeong Ahn (photo page 13), Jan van der Kam (photo in Fig. 3, page 7), Ju Yung Ki (photos Box 2, page 18), Nick Murray (photos Fig. 10, Appendix 9)
Available from: IUCN (International Union for Conservation of Nature)Publications ServicesRue Mauverney 281196 GlandSwitzerlandTel +41 22 999 0000Fax +41 22 999 [email protected]/publications
Also available at www.iucn.org/asiancoastalwetlands
About IUCNIUCN, International Union for Conservation of Nature, helps the world find pragmatic solutions to our most pressing environment and development challenges. IUCN works on biodiversity, climate change, energy, human livelihoods and greening the world economy by supporting scientific research, managing field projects all over the world, and bringing governments, NGOs, the UN and companies together to develop policy, laws and best practice. IUCN is the world’s oldest and largest global environmental organization, with more than 1,200 government and NGO members and almost 11,000 volunteer experts in some 160 countries. IUCN’s work is supported by over 1,000 staff in 45 offices and hundreds of partners in public, NGO and private sectors around the world. Web: www.iucn.org
IUCN Species Survival CommissionThe Species Survival Commission (SSC) is the largest of IUCN’s six volunteer commissions with a global membership of 8,000 experts. SSC, working with the Global Species Programme of IUCN, advises IUCN and its members on the wide range of technical and scientific aspects of species conservation and is dedicated to securing a future for biodiversity. SSC has significant input into the international agreements dealing with biodiversity conservation. Web: http://www.iucn.org/about/work/programmes/species/about_ssc/index.cfm
IUCN Asia Regional OfficeIUCN’s Asia programme is served by the IUCN Asia Secretariat, based out of the Asia Regional Office (ARO) in Bangkok, Thailand, in close collaboration with IUCN Headquarters in Gland, Switzerland. The IUCN Secretariat has some 300 staff in country and liaison offices in Bangladesh, Cambodia, China, India, Lao PDR, Nepal, Pakistan, Sri Lanka, Thailand and Viet Nam. To address the challenges in managing the large transboundary ecosystems of Asia and respond to the demands of the constituents, the Asia Region has realigned to form three subregional groups: a Southeast Asia Group managed by a Group Head (Cambodia, Indonesia, Lao PDR, Singapore, Thailand, Timor-Leste and Viet Nam); a South Asia Subregional Group (covering all the South Asian countries) headed by one of the IUCN Country Representatives in South Asia on a rotational basis; and a North and East Asia Subregional Group managed directly by the Regional Director working closely with the Country Representative of China (China, Mongolia, Japan, North Korea and South Korea).

Table of Contents
Executive Summary ................................................................................................................................ ii1. Introduction ...................................................................................................................................... 12. Methodology of study ...................................................................................................................... 23. The intertidal zone of East and Southeast Asia ............................................................................... 44. Why mud matters – the importance and values of intertidal habitats ............................................ 45. Identification of critical sites and species........................................................................................ 56. Parallel declines in other taxa and services .................................................................................... 87. Threats to the intertidal zone ......................................................................................................... 118. Vanishing intertidal habitats ........................................................................................................... 139. Direct links between species decline and habitat loss due to land reclamation .......................... 1610. Implications for fisheries ................................................................................................................ 1911. Threats to land and property ......................................................................................................... 2012. Review of drivers of coastal zone reclamation .............................................................................. 2113. Review of protective measures and tools available ...................................................................... 2314. Conclusions ................................................................................................................................... 29Acknowledgements ..............................................................................................................................30List of abbreviations and acronyms ..................................................................................................... 31References ............................................................................................................................................ 32Appendix 1. List of globally threatened and Near Threatened waterbird species of intertidal habitats in East Asia .......................................................................................................................38Appendix 2. List of key areas for waterbirds, and particularly shorebirds, in the EAAF, with specific threats ............................................................................................................................... 42Appendix 3. Major problems, drivers and possible solutions to reduce loss of intertidal habitats
and biota ........................................................................................................................................48Appendix 4. List of major international programmes with direct relevance to the EAAF .................... 51Appendix 5. Matrix of issues affecting different countries/territories ................................................. 52Appendix 6. Comparative review of protected area legislation and management ..............................53Appendix 7. Comparative table of legislative procedures for EIA /SEA by country/territory ..............54Appendix 8. Participation in Multilateral Environmental Agreements and associated actions ...........56Appendix 9. A selection of case studies in key areas .......................................................................... 57Appendix 10. List of attendees of the 6th Meeting of Partners of the East Asian-Australasian
Flyway Partnership (EAAFP MOP6), 19–22 March 2012, and the 9th Spoon-billed Sandpiper Task Force Meeting, 23–24 March 2012, Palembang, Indonesia ..................................................60
Appendix 11. The 388 sites considered in the IUCN situation analysis to identify key areas .............62
Intertidal Report • i
Executive Summary
The IUCN Species Survival Commission and IUCN Asia Regional Office commissioned this independent report to assess the state and condition of intertidal habitats along the East Asian-Australasian Flyway (EAAF), in response to growing concerns expressed by IUCN members over observed declines in biodiversity, the loss of ecological services, and an increase in ecological disasters. This report is a situation analysis, and it seeks to gather in one place the relevant data and analyses, and to present as clear a picture of the status of the intertidal zone in the EAAF as the data allow. By intention, this report makes no recommendations, but it should serve as a resource for those stakeholders empowered to make or influence decisions and policies in the region.
This report makes use of the status and population trends of key species of waterbirds as indicators of the environmental health of intertidal habitats (including beaches, marshes, mudflats, mangroves and seagrass beds). It presents an analysis of ~390 coastal sites used by waterbirds along the EAAF and identifies 16 key areas. The findings presented show that there is cause for significant concern over the status of the intertidal zone along the EAAF. Fisheries and vital ecological services are collapsing and ecological disasters increasing, with concomitant implications for human livelihoods. Observed rates of declines of waterbird species of 5–9% per year (and up to 26% per year for Critically Endangered Spoon-billed Sandpiper Eurynorhynchus pygmeus) are among the highest of any ecological system on the planet. Breeding success among migrating species in their Arctic breeding grounds and survival on most wintering grounds (for northern breeding species) at the southern end of their migrations appears satisfactory, at least where hunting is sustainable. However, problems clearly are occurring along the EAAF during migration. Unless major steps are taken to reverse current trends, the EAAF is likely to experience extinctions and associated collapses of essential and valuable ecological services in the near future.
Although all sectors of the EAAF face a variety of threats, the Yellow Sea (including the Bohai Sea) emerges as the focus of greatest concern, with six of 16 key areas identified in this report in the region. Here, the fast pace of coastal land reclamation is the most pressing threat. Remote sensing and geographical information system (GIS) analyses show mean losses of 35% of intertidal habitat area across the six key areas of the Yellow Sea since the early 1980s. Losses of such magnitude are likely the key drivers of declines in biodiversity and ecosystem services in the intertidal zone of the region.
This report reviews the drivers that are leading to such environmental degradation. We evaluated the processes that should maintain or restore a balance between developmental needs and environmental needs (including legal instruments, financing, habitat and species conservation, awareness and knowledge), and found that these were usually weak, and were in some cases dysfunctional. Drivers are reviewed at both the national and site-specific level. The report highlights the risks to biodiversity, to the livelihoods of coastal communities, and to economic investments if the ‘business as usual’ scenario continues. The stakes are very high including financial loss to the fisheries sector and the potential financial damage and loss of coastal cities, towns and lands.
The countries along the EAAF have made commitments to global biodiversity targets under several key multilateral environmental agreements, but it will not be possible for the countries to meet these commitments without halting the declining trends in species populations and habitat availability and quality identified in this report. Each country’s economic and environmental sustainability is being damaged by the actions of its neighbours. Various existing regional seas initiatives are failing to address these specific problems. The fast pace and nature of human developments affecting the EAAF jeopardizes species that depend on this zone as well as the valuable ecological services that intertidal zone ecosystems deliver to humans. Different species use different suites of sites during northbound and southbound migrations. Therefore, protection of only the best sites will not provide an adequate site network for all migratory species and broader protection of a comprehensive and complementary set of sites is necessary.
Although this is a situation analysis and does not include recommendations, we allow ourselves this comment. The birds and habitats of the EAAF are the shared natural heritage of 22 countries. Many of the steps that need to be taken to secure this resource in the long term will require international cooperation. Unless the fast economic development of this region can be balanced with adequate environmental safeguards, impressive-looking economic gains could be short-lived and undermined by the loss of valuable ecosystem services and a growing list of costly ecological disasters.
ii • Intertidal Report

Intertidal Report • 1
1. IntroductionIntertidal flats, the narrow band of habitat between the marine, freshwater and land environments, are characterized by regular tidal inundation, low slopes and muddy deposits (Healy et al. 2002). They provide ecosystem services such as food, shoreline stabilization, protection from storm events, maintenance of biodiversity and are often at the centre of social activities (Millennium Ecosystem Assessment 2005).
Globally, approximately 35% of mangroves were lost between 1980 and 2000 (Giri et al. 2011) and some 30% of seagrasses have been lost in the last ~100 years (Waycott et al. 2009). For intertidal flats, which are similarly heavily impacted by human influence, we have less certainty of their present distribution, status and trends (Healy et al. 2002, Millennium Ecosystem Assessment 2005, Keddy 2010). However, current estimates of the rate of intertidal habitat loss in Asia are equal to or greater than recorded losses of mangroves (Giri et al. 2011), tropical forest (Achard et al. 2002) and seagrasses (Waycott et al. 2009). For example, over the past 50 years, losses of up to 51% of coastal wetlands (including marshes) have occurred in China (An et al. 2007b), 40% in Japan, 60% in the Republic of Korea (ROK), and more than 70% in Singapore (Hilton & Manning 1995, Yee et al. 2010).
Birds serve as excellent indicators of environmental health and change. They occupy a wide range of niches, use many types of food and physical resources, and are sensitive to environmental changes. Just as nineteenth century miners looked to their caged canaries as an indication that it was safe to continue breathing the mine air, we use data on fluctuating bird populations (Rogers et al. 2006c) to alert us of modern environmental dangers. Birds are studied and monitored by considerable numbers of ornithologists and researchers, yielding unparalleled data on population trends over time. Like the canaries, the recent reports of major declines of waterbirds migrating through the East Asian-Australasian Flyway (EAAF, Figure 1) are an indication of significant environmental changes that require urgent investigation. A higher number and proportion of waterbirds are globally threatened in the EAAF than in any of the other seven major flyways of the world (Kirby 2010; see Figure 2). Most of these species are dependent on tidal flats, in particular 24 globally threatened or Near Threatened species of shorebirds, waterfowl, spoonbills, cranes, seabirds and pelicans (IUCN 2011), plus a further nine shorebird species currently under review which could be classified as threatened or Near Threatened in the near future.
The loss of intertidal areas along migratory pathways, especially staging sites (where birds must replenish their energy stores during migration for long, energetically expensive flights) can have extreme consequences for shorebird populations (Myers et al. 1987, Goss-Custard et al. 1995, Baker et al. 2004, Buehler & Piersma 2008, Warnock 2010, Rakhimberdiev et al. 2011). For the millions of shorebirds that migrate through the East Asian-Australasian Flyway, the intertidal areas of Asia are a crucial migratory bottleneck (Barter 2002, 2003, Bamford et al. 2008, Cao et al. 2009, Rogers et al. 2010, Yang et al. 2011a).
Apart from being vital habitat for the survival of millions of birds of more than a hundred species, intertidal habitat is critical as nesting beaches for sea turtles, breeding areas for Asia’s seals, spawning grounds for important economic fisheries, and homes of thousands of species of invertebrates. Many species that rely on intertidal habitats in Asia are in trouble; for example, five species of intertidal sea grasses are globally threatened (Short et al. 2011) and the eastern Taiwan Strait population of the Indo-Pacific Humpback Dolphin Sousa chinensis is Critically Endangered (Ross et al. 2010).
This situation analysis was initiated by the IUCN to synthesize available information on status, trends and threats, identify areas most at risk of destruction and provide guidance to begin to conserve these important ecosystems. To complete the synthesis, a review focusing on three key inputs was undertaken: (i) an extensive review of published and unpublished literature; (ii) an analysis of published and unpublished data from a range of sources; and (iii) expert input from regional and local experts.

2 • Intertidal Report
2. Methodology of studyOverviewThis situation analysis is based on an extensive systematic literature review and supplemented with expert review and input from around the globe. A wide range of data on waterbirds and selected other taxa, habitat loss and threatening processes was compiled and analysed to identify which are the most important and vulnerable areas for biodiversity conservation. This analysis focuses on the drivers that are causing, or threaten to cause, the most severe losses of intertidal ecosystems and the services they provide, both in general across the entire EAAF and specifically in the most important sites. Information on past, current and future plans for land reclamation of intertidal habitats gives an indication of the sites most seriously at risk. Several case studies are presented, offering detailed information on the sites that are either most threatened or most important for waterbird migration.
Data and DatabasesExpert elicitationA request to solicit facts, views and opinions was sent by the Director General of the IUCN to relevant government agencies of all of the governments and non-government organizations associated with the countries and territories covered in this study. The responses received were incorporated in the study, and are available on request from the authors. Further, the authors attended the 6th Meeting of Partners of the East Asian-Australasian Flyway Partnership, where extensive discussions were held with experts and government officials.
Bird populationsOn the basis of data availability and sensitivity of species to environmental change, we selected the waterbirds (including shorebirds such as sandpipers, plovers, snipes and allies) confined to intertidal zones and the intertidal habitats (see list in Appendix 1) as the most appropriate indicators in our analysis. Indeed, waterbird species that inhabit intertidal areas give us a convenient and powerful indication of ecosystem well-being, given that they are at the top of the food chain (Mallory et al. 2006) and we have good monitoring data for these species (e.g. Li et al. 2007, 2009b, Bamford et al. 2008). A database containing information on the abundance, distribution, conservation status and other pertinent details of 155 species of waterbirds that depend on East Asian intertidal and associated habitats was established. Of the 155 species, 24 are globally threatened (i.e., Critically
Figure 1. A) The eight broad flyways of waders / shorebirds. B) The East Asian-Australasian Flyway (EAAF). The arrows schematically show the many routes taken by migratory waterbirds travelling along this part of the globe (Boere & Stroud 2006, Bamford et al. 2008). In reality the migration routes of one species can cover large parts of the flyway as individual birds consistently take different routes on northbound and southbound trips (Minton et al. 2011, Battley et al. 2012). The journeys toward the breeding grounds largely converge on the Yellow Sea (including the Bohai Sea), which serve as a major refuelling station between March and May each year.
A) B)
Pacific Americas
Mississippi Americas
Atlantic Americas
East Atlantic
Black Sea/Mediterranean
West Asia/East Africa
Central Asia
East Asian - Australasian

Intertidal Report • 3
Endangered, Endangered or Vulnerable on the IUCN Red List of Threatened Species; www.iucnredlist.org) or Near Threatened (see Appendix 1); 711 are migratory shorebirds (including gulls and terns) (see Section 5). In addition, we present trend data on selected shorebird populations for the key areas identified in this analysis and the total EAAF (made possible through data provided by the University of Queensland and the Australasian Wader Studies Group).
Important sites and key areasBy collating information on Important Bird Areas (BirdLife International 2001), EAAF Migratory Waterbird partnership sites, Internationally Important Shorebird Sites (Bamford et al. 2008), and coastal protected areas, 388 coastal sites were identified for inclusion in this study (Appendix 11). From this group of sites, a subset of sites (Appendix 11; sites in bold) were determined to have high numbers of globally threatened or Near Threatened waterbirds, high shorebird diversity or large shorebird populations of at any time of year. Specifically, the subset included sites that had the greatest values for these three factors:
1. The number of globally threatened and Near Threatened shorebird species and other tidal waterbirds;
2. Number of shorebird species present with >1% of the total EAAF population (using peak high counts, any time of year);
3. Total abundance of shorebirds.
To analyse the final subset of sites, we pooled them into key areas, based on their geographic location. Sites that were situated closely along continuous stretches of intertidal habitats were considered as one key area. A total of 16 key areas were identified (Section 5, Appendix 2). Using information from the literature review, published and unpublished data sources, and from the expert consultation process, an analysis of each key area was completed. For each key area we determined:
1. Protected area coverage (Appendix 2);2. Where possible, the conservation status of each key area, both national and international, and
inclusion or potential inclusion on the Ramsar list of internationally important wetlands (BirdLife International 2005) (Appendix 2);
3. The biodiversity features according to the factors mentioned above (Appendix 2);4. The area of intertidal wetlands pre-2000 and current (post 2010). Where possible, published
sources were used. For areas where no information was available, we used an unpublished remote sensing dataset of tidal flats of East Asia by Murray et al. (unpubl. data). Extent of tidal areas was calculated using satellite images of known tide height from the Landsat Archive. High-tide and low-tide images were differentiated to determine the area of tidal flat lost between the two time periods (Appendix 2);
5. The proportion of intertidal wetlands affected by land reclamation (Table 4 and Appendix 2); 6. Drivers and threats to these sites (Appendix 2).
The study also presents case studies of some of the most threatened and most important sites for waterbirds (Appendix 9).
Policy analysisPolicy analysis involved identifying the major threats to coastal ecosystems and seeking the underlying causes behind those threats. It included a review of the policy, legislation, Environmental Impact Assessment (EIA) and Strategic Environmental Assessment (SEA) processes, Protected Area (PA) coverage and management of each country against the background of the types of socio-economic development in those countries. We employed simple scaled rating scores dependent on expert opinion and review.
Public reviewA one month period of public review was held, whereby officials of each country and other interested parties were given opportunity to comment on the draft of the entire report. All comments received were collated and considered for incorporation into the final report.
1 Not including Grey-headed Lapwing Vanellus cinereus, Australian Pratincole Stiltia isabella, Northern Lapwing Vanellus vanellus, and Long-billed Plover Charadrius placidus, which do not use tidal flats and/or are sedentary.
4 • Intertidal Report
0
2
4
6
8
10
12
14
16
18
% s
peci
es
Proportion of globally threatened and Near Threatened waterbird species by flyway
Nspecies = 5/128 6/92 6/138 11/126 10/108 14/124 13/108 34/178
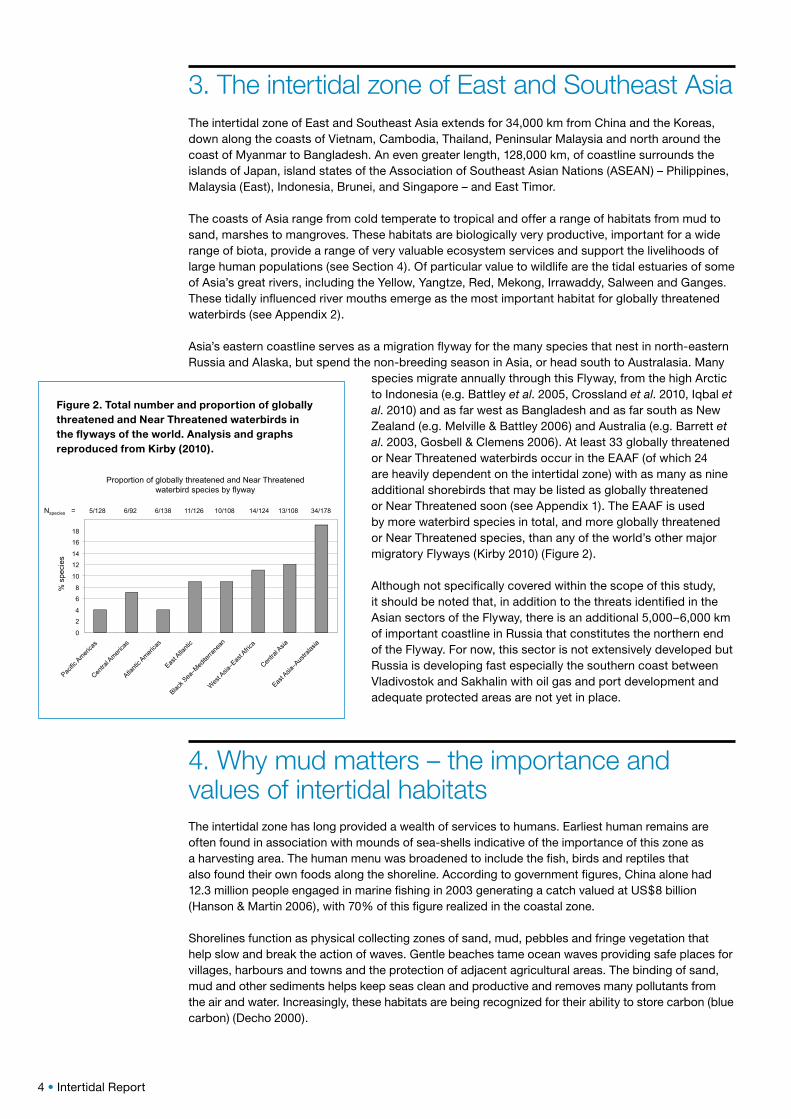
3. The intertidal zone of East and Southeast AsiaThe intertidal zone of East and Southeast Asia extends for 34,000 km from China and the Koreas, down along the coasts of Vietnam, Cambodia, Thailand, Peninsular Malaysia and north around the coast of Myanmar to Bangladesh. An even greater length, 128,000 km, of coastline surrounds the islands of Japan, island states of the Association of Southeast Asian Nations (ASEAN) – Philippines, Malaysia (East), Indonesia, Brunei, and Singapore – and East Timor.
The coasts of Asia range from cold temperate to tropical and offer a range of habitats from mud to sand, marshes to mangroves. These habitats are biologically very productive, important for a wide range of biota, provide a range of very valuable ecosystem services and support the livelihoods of large human populations (see Section 4). Of particular value to wildlife are the tidal estuaries of some of Asia’s great rivers, including the Yellow, Yangtze, Red, Mekong, Irrawaddy, Salween and Ganges. These tidally influenced river mouths emerge as the most important habitat for globally threatened waterbirds (see Appendix 2).
Asia’s eastern coastline serves as a migration flyway for the many species that nest in north-eastern Russia and Alaska, but spend the non-breeding season in Asia, or head south to Australasia. Many
species migrate annually through this Flyway, from the high Arctic to Indonesia (e.g. Battley et al. 2005, Crossland et al. 2010, Iqbal et al. 2010) and as far west as Bangladesh and as far south as New Zealand (e.g. Melville & Battley 2006) and Australia (e.g. Barrett et al. 2003, Gosbell & Clemens 2006). At least 33 globally threatened or Near Threatened waterbirds occur in the EAAF (of which 24 are heavily dependent on the intertidal zone) with as many as nine additional shorebirds that may be listed as globally threatened or Near Threatened soon (see Appendix 1). The EAAF is used by more waterbird species in total, and more globally threatened or Near Threatened species, than any of the world’s other major migratory Flyways (Kirby 2010) (Figure 2).
Although not specifically covered within the scope of this study, it should be noted that, in addition to the threats identified in the Asian sectors of the Flyway, there is an additional 5,000–6,000 km of important coastline in Russia that constitutes the northern end of the Flyway. For now, this sector is not extensively developed but Russia is developing fast especially the southern coast between Vladivostok and Sakhalin with oil gas and port development and adequate protected areas are not yet in place.
4. Why mud matters – the importance and values of intertidal habitatsThe intertidal zone has long provided a wealth of services to humans. Earliest human remains are often found in association with mounds of sea-shells indicative of the importance of this zone as a harvesting area. The human menu was broadened to include the fish, birds and reptiles that also found their own foods along the shoreline. According to government figures, China alone had 12.3 million people engaged in marine fishing in 2003 generating a catch valued at US$8 billion (Hanson & Martin 2006), with 70% of this figure realized in the coastal zone.
Shorelines function as physical collecting zones of sand, mud, pebbles and fringe vegetation that help slow and break the action of waves. Gentle beaches tame ocean waves providing safe places for villages, harbours and towns and the protection of adjacent agricultural areas. The binding of sand, mud and other sediments helps keep seas clean and productive and removes many pollutants from the air and water. Increasingly, these habitats are being recognized for their ability to store carbon (blue carbon) (Decho 2000).
Figure 2. Total number and proportion of globally threatened and Near Threatened waterbirds in the flyways of the world. Analysis and graphs reproduced from Kirby (2010).

Intertidal Report • 5
Healthy strand vegetation, sea grass beds, algal beds and mangroves provide significant shelter in the face of typhoons and storms and against the tsunamis that are frequent in a zone prone to devastating earthquakes (Caldecott & Wickremasinghe 2005). Coastal damage seen after the great tsunami in Aceh, Indonesia in 2004 revealed that sites protected by intact healthy coral, mangrove or other coastal vegetation were dramatically less damaged than sites where these same habitats had been destroyed (Chang et al. 2006, Forbes & Broadhead 2007).
Intertidal habitats are amongst the most productive ecosystems on earth. Intertidal habitats, including tidal mudflats, tidal marshes and mangroves, provide safe spawning areas and nurseries for countless species of fish and crustaceans on which coastal fisheries depend (Yusoff et al. 2006). They also consolidate sediments into fertile new lands protecting offshore coral reefs from siltation and thereby enhance the productivity of reefs and coastal waters. Clean, beautiful shorelines offer wonderful and inspiring recreational opportunities, including for gastronomic tourism associated with seafood, and important local economies can develop as a result (Table 1).
Costanza et al. (1997) valued the ecosystem services of the coastal zone, mostly from coastal wetlands, globally at US$14.2 trillion per annum (or 43% of all global ecosystem services). More precise economic assessments of the values of these services need to be undertaken regionally. One preliminary study by the Korean Ocean Research and Development Institute (KORDI 2006) came up with the following estimates: annual value of a hectare of the ROK’s intertidal habitats (US$32,660), which includes marine products (US$9,993), ecosystem preservation (US$8,548), habitat (US$7,533), water purification (US$3,702), recreation (US$1,443), and disaster prevention (US$1,442). Ecosystem service values for 170 km2 of intertidal flats planned for reclamation in Xinghua Bay, Fujian, China, were estimated at US$0.65 billion/annum or US$38,235/ha/annum with an estimated loss of value of US$8,250/ha/annum if the land were reclaimed for agriculture or ponds (Yu et al. 2008). Given that there are more than 1 million ha of intertidal habitats in the Yellow Sea (including the Bohai Sea), these estimates point towards service values exceeding at least US$30 billion per annum. An et al. (2007b) estimate that the historical loss of 51% of China’s coastal wetlands (not all intertidal) resulted in an annual loss of US$46 billion. The loss of ecosystem services caused by sea enclosures and land reclamation in China has been estimated at US$27.76 billion/annum (CCICED 2010b).
Bennett & Reynolds (1993) point out that mangroves not only deliver a huge boon of services, but that they also provide livelihood to large numbers of people. When intertidal habitat is converted there are high financial gains, through mariculture, infrastructure and related jobs, however other social and financial values are often not appreciated until they are lost (Wang et al. 2010b).
5. Identification of critical sites and species Bird declinesThe coastal intertidal zone is narrow. The total area involved is very small, fragile and is rapidly vanishing. Indeed, several countries have already lost between 40% and 55% of all intertidal habitat (Davidson 2011). The region of greatest habitat loss is the Yellow Sea (including the Bohai Sea) region (for details see Section 8), which is a critical convergence for many migration routes (Barter 2002, Heo 2000, Yi 2003, 2004).
Many birds that use intertidal habitats are migrants and travel annually along the EAAF. They connect continents and countries and are, therefore, excellent environmental indicators at both global and local scales (Battley et al. 2008). Of the 155 species of waterbirds that depend on East Asian intertidal and associated habitats, at least 50 species of migratory shorebirds and 21 migratory gulls and terns in the EAAF are strongly dependent on intertidal habitats (Table 2). Fifteen globally threatened or Near Threatened migratory intertidal species, including the Endangered Spotted Greenshank Tringa guttifer and the Critically Endangered Spoon-billed Sandpiper Eurynorhynchus pygmeus and Chinese Crested Tern Sterna bernsteini (Chan et al. 2010a), have more than 95% of their entire global population in the EAAF; at least one species entirely confined to the EAAF and currently listed as Least Concern, Grey-tailed Tattler Heteroscelus brevipes, is likely to be listed as threatened in the near future (Appendix I). A further six migratory shorebird species, currently listed as Least Concern, also have more than 95% of their entire global population in the EAAF (Sharp-tailed Sandpiper

6 • Intertidal Report
Table 1. Summary of the main ecosystem services provided by mudflats and mangroves of the intertidal zone in East and Southeast Asia (following typology of Ranganathan et al. 2008).
Services/benefits provided Notes Vulnerability References
Provisioning Services
Sustainable fisheries About 30 million fishermen in the entire study area depend on nets and fish traps in the tidal zone for their livelihood. A huge volume of shellfish and sea cucumbers is also harvested. The intertidal zone is also an important nursery area for many economically important deep-water species
Reclamation, overharvesting, alien species and pollution all threaten fisheries which are now in serious decline
Rönnbäck 1999, TEEB 2010
Biochemical Extraction of medicines and other materials from biota (fish, molluscs, corals, jellyfish)
Loss of biota and habitats Constanza et al. 1997
Genetic materials For example, spread of genes for resistance to plant pathogens or hybridization with ornamental species
Loss of biota and habitats Wilson et al. 2005
Harvest of non-timber forestry products
Honey, resins, tannins, edible nuts, seaweeds, shells Loss of mangroves and beach forest TEEB 2010
Silviculture/aquaculture Intertidal zone used for rearing commercial species of plants and animals (crustaceans, fish, pearls, mangroves, algae)
Productivity threatened by pollution and loss of habitat. Over development of aquaculture can lead to spread of diseases, pollution and invasive alien species
Bennett & Reynolds 1993, Wilson et al. 2005
Regulating Services
Detoxification and purification of water resources
Mud, gravel and their fauna of worms, molluscs and crustaceans remove pollutants from water
Loss of purification role leads to dangerous outbreaks of red and green algal blooms and dangerous toxins in seafood
Wilson et al. 2005
Climate regulation and carbon sequestration and fixation
Mudflats are important carbon sinks that help to regulate climate change through the process referred to as ‘blue carbon’
Reclamation converts important carbon sinks into carbon sources
Decho 2000
Coastal protection/natural hazard protection
Mudflats and beaches disperse and break tidal action and safeguard shorelines from cyclones, tsunamis, erosion and salination. Mangoves protect coastal villages
Reclamation focuses and increases wave action and accelerates scouring at other parts of coastline increasing risk of storm damage and floods. Loss of coastal vegetation leaves coastline vulnerable to storms and sand storms
Caldecott & Wickremasinghe 2005, Chang et al. 2006, Forbes & Broadhead 2007
Water regulation (hydrological flows)
Groundwater recharge/discharge Wilson et al. 2005
Cultural Services
Educational Opportunities for formal and informal education and training Wilson et al. 2005
Coastal tourism, landscape diversity and scenic values including watching migrating birds, marine mammals etc. Eating fresh seafood, boating, surfing
Beauty and inspiration by the big swirling flocks of shorebirds and the science behind seasonal long-distance migration of birds and mammals adds to property values and supports large tourism industry that caters for more than 100 million tourists per year
Conversion, reclamation and development along the shoreline compromise aesthetic values. The amazing athletic physiology of birds covering 8,000 km or more in single flights, not sleeping or drinking for over a week
Wilson et al. 2005, Woodley 2009
Supporting Services
Habitat for birds and other wildlife
Many charismatic, rare and important species depend on this zone. They are easily viewed on open flats and beaches adding to recreational and conservation values (see Cultural Services above)
Reclamation, cutting of mangroves, introduction of alien plants and pollution all destroy wildlife habitat
Bennett & Reynolds 1993, BirdLife International 2005
Nutrient recycling Storage, recycling, processing, and acquisition of nutrients Changes to seawater chemistry result in loss of many important species and negative changes in benthic communities. Shortage of oxygen destroys many economic species
Bennett & Reynolds 1993, Constanza et al. 1997
Nutrient export Outwelling of organic nutrients and detritus increases productivity of local fisheries and nourishes plankton communities
Loss of biological productivity of intertidal zone due to pollution or habitat loss
Wolanski 2007
Soil formation Sediment retention and accumulation of organic matter Lost through coastal erosion Wilson et al. 2005

Intertidal Report • 7
Calidris acuminata, Red-necked Stint C. ruficollis, Long-toed Stint C. subminuta, Pacific Golden Plover Pluvialis fulva, Oriental Pratincole Glareola maldivarum and Swinhoe’s Snipe Gallinago megala).
There are indications of serious declines in some bird populations along the EAAF. Of all monitored populations of Arctic breeding shorebirds in north-eastern Russia, 89% now show declines (E. Syroechkovskiy, pers. comm.). Monitoring on beaches of Australia reveals declines in the numbers of EAAF migrant shorebirds wintering there (Gosbell & Clemens 2006, Wilson et al. 2011, Szabo et al. 2012). Analysis of monitoring data of Japanese shorebirds between 1975 and 2008 evidenced declines in most species, especially those that stop at the Yellow Sea (including the Bohai Sea) (Amano et al. 2010). The fastest declining migratory shorebirds in the EAAF are the long-distance, Arctic-breeding migrants, such as the Spoon-billed Sandpiper (Amano et al. 2010, Zöckler et al. 2010b) (Figure 3) and the Red Knot Calidris canutus (Wilson et al. 2011, Garnett et al. 2011) (Figure 4). At the current rate of decline (26% per annum), Spoon-billed Sandpipers could be extinct within the decade despite ongoing conservation action (Pain et al. 2011) (Figure 3). Similarly, with the current rates of decline, for every 100 Red Knots migrating along the EAAF in 1992, only seven will be left in 2020 (Figure 4).
Identification of key areasWhile migrating through the EAAF, shorebirds use areas with intertidal habitat. Throughout the EAAF around 390 internationally important sites for shorebirds have been identified (Appendix 11), here clustered into 16 key areas (Appendix 2). Six of these 16 key areas for shorebird biodiversity are in the Yellow Sea (including the Bohai Sea) (Figure 5). It was only in the 1990s that the ornithological importance of the Yellow Sea (including the Bohai Sea) became clear. It is possible that other key areas remain to be discovered in less accessible parts of the EAAF, such as the west coast of DPRK. Outside the Yellow Sea (including the Bohai Sea), ten areas in South and Southeast Asia with high intertidal biodiversity were identified. Some of the areas in the south are mainly non-breeding sites and are critical to the survival of particular species, such as the Spoon-billed Sandpiper (spending the non-breeding season largely on Sonadia Island in Bangladesh and in the Gulf of Martaban in Myanmar) and the Spotted Greenshank (dependent largely on the Malay Peninsula).
The six key shorebird areas in the Yellow Sea (including the Bohai Sea) support an overwhelming majority of shorebirds migrating through the EAAF. At least 36 shorebird species (Barter 2006) occur in internationally important numbers at 66 distinct shorebird sites (excluding the unknown sites in DPRK). As many as 22 shorebird species strongly depend on the Yellow Sea (including the Bohai Sea): 50–100% of the individuals use the Yellow Sea and Bohai Sea during northbound or
Figure 4. Population decline of Great Knots Calidris tenuirostris and of the EAAF populations of Red Knot Calidris canutus and Bar-tailed Godwit Limosa lapponica (for flyway routes see Figure 6). Shown are the measured current rates of decline and the projected trajectories if no further conservation measures are taken (after Amano et al. 2010 and Wilson et al. 2011).
Figure 3. Population decline in Spoon-billed Sandpiper Eurynorhynchus pygmeus showing measured current rate of decline and the projected trajectory to extinction if no additional conservation measures are taken(after Zöckler et al. 2010b; but see Pain et al. 2011).

8 • Intertidal Report
southbound migrations (Barter 2002, Battley et al. 2012) (e.g. Figure 6). In eight species, as much as 70% of the population relies on the Yellow Sea (including the Bohai Sea) as a “fuel” stop (Barter 2002). All these species are declining: three species are Near Threatened (Great Knot Calidiris tenuirostris, Far Eastern Curlew Numenius madagascariensis and Eurasian Curlew Numenius arquata), two are globally declining (Bar-tailed Godwit Limosa lapponica) and Grey Plover Pluvialis squatarola), and three are regionally declining (Dunlin Calidris alpina, Kentish Plover Charadrius alexandrinus and Whimbrel Numenius phaeopus) (Amano et al. 2010, Battley et al. 2012).
6. Parallel declines in other taxa and servicesOther taxa are undergoing declines parallel with birds (Table 3), further indicating the deteriorating productivity and health of the intertidal zone. Cascading declines are being recorded throughout the food web (WWF et al. 2006). In all areas of East and Southeast Asia, important stocks of economically important fish, crustaceans, shellfish and cephalopods are collapsing, causing livelihood losses for several million artisanal fishermen. In some countries, hunting for birds is increasing in response to collapse of fish stocks. Sea mammals and turtles are also undergoing rapid declines, and many are now threatened with extinction. The frequency of toxic algal blooms has increased dramatically; temperature, acidity and water levels have risen (Nicholls & Cazenave 2010); the frequency of catastrophic storms have increased (see Figure 8, Section 7), and the damage to coastlines from cyclones and tsunamis is becoming more serious, especially where the natural coastline has been destroyed (Caldecott & Wickremasinghe 2005).
Status of waterbirds in Asia and the EAAF, from a global perspective Number of species References
All waterbird species in Asia and the EAAF
Total Asian waterbird species 349 Li et al. 2006
Total waterbird species dependent on intertidal flats in the EAAF 155 Li et al. 2009b
Globally threatened or Near Threatened waterbird species in the EAAF 24 Appendix 1
Shorebird, gulls and tern species in the EAAF
Total migratory shorebird species (sandpipers, plovers, snipes and allies) in the EAAF 54* Bamford et al. 2008
Total migratory gull and tern species depending on intertidal flats in the EAAF 21 Li et al. 2009b
Globally threatened or Near Threatened shorebird, gull and tern species in the EAAF 14 Appendix 1
Candidate EAAF shorebird species to be uplisted on IUCN Red List 9 Appendix 1
International comparison
Globally threatened and Near Threatened intertidal species in the EAAF 33 of 155 (21%) Appendix 1**
Globally threatened and Near Threatened waterbird species in Americas 18 of 202 (9%) Kirby et al. 2008
Globally threatened and Near Threatened waterbird species in Europe, C Asia, Africa & Middle East 26 of 162 (16%) Kirby et al. 2008
Globally threatened and Near Threatened waterbird species in Asia 46 of 201 (23%) Kirby et al. 2008
* Note that number includes Grey-headed Lapwing, Australian Pratincole, Northern Lapwing, and Long-billed Plover, which do not use tidal flats and/or are sedentary.
Table 2. Overview of the conservation status of waterbirds in general, and shorebirds (sandpipers, plovers, snipes and allies) in particular, in Asia and in the East-Asian Australasian Flyway.
** Includes species currently listed as LC, eligible for uplisting to Near Threatened or Vulnerable.
Intertidal Report • 9
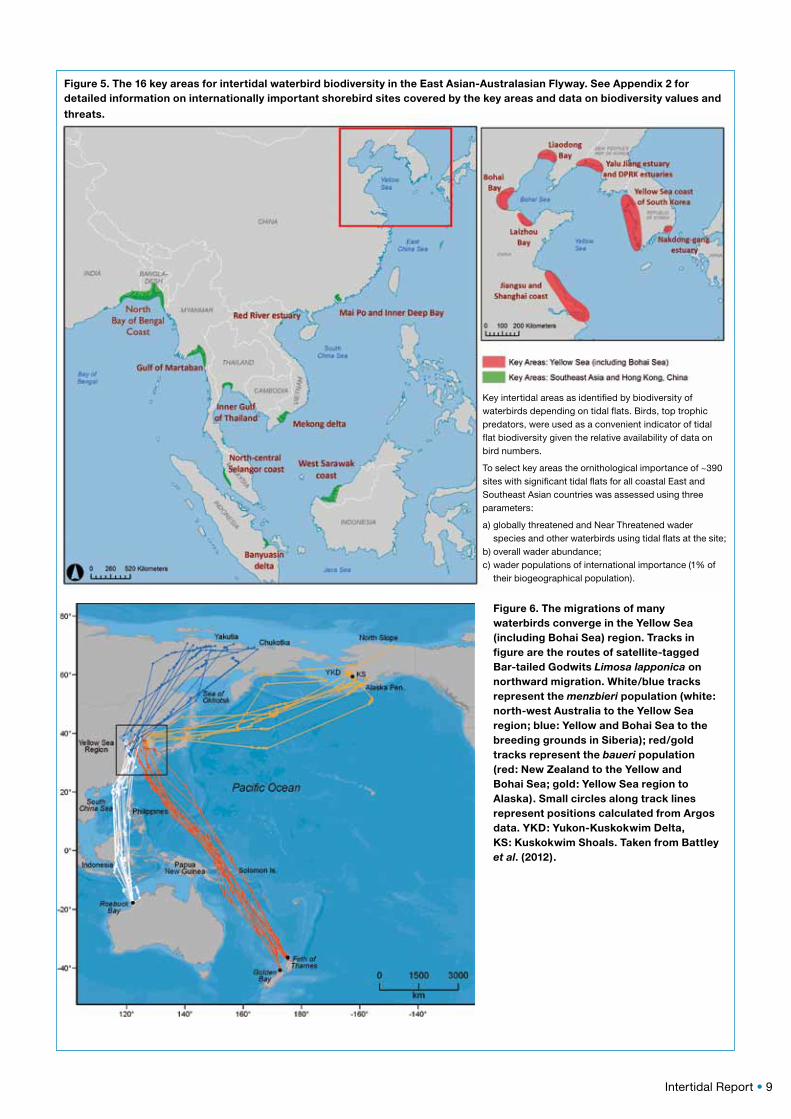
Figure 5. The 16 key areas for intertidal waterbird biodiversity in the East Asian-Australasian Flyway. See Appendix 2 for detailed information on internationally important shorebird sites covered by the key areas and data on biodiversity values and
threats.
Figure 6. The migrations of many waterbirds converge in the Yellow Sea (including Bohai Sea) region. Tracks in figure are the routes of satellite-tagged Bar-tailed Godwits Limosa lapponica on northward migration. White/blue tracks represent the menzbieri population (white: north-west Australia to the Yellow Sea region; blue: Yellow and Bohai Sea to the breeding grounds in Siberia); red/gold tracks represent the baueri population (red: New Zealand to the Yellow and Bohai Sea; gold: Yellow Sea region to Alaska). Small circles along track lines represent positions calculated from Argos data. YKD: Yukon-Kuskokwim Delta, KS: Kuskokwim Shoals. Taken from Battley et al. (2012).
Key intertidal areas as identified by biodiversity of waterbirds depending on tidal flats. Birds, top trophic predators, were used as a convenient indicator of tidal flat biodiversity given the relative availability of data on bird numbers.
To select key areas the ornithological importance of ~390 sites with significant tidal flats for all coastal East and Southeast Asian countries was assessed using three parameters:
a) globally threatened and Near Threatened wader species and other waterbirds using tidal flats at the site;
b) overall wader abundance;c) wader populations of international importance (1% of
their biogeographical population).

10 • Intertidal Report
Table 3. Some documented examples of parallel biodiversity declines in other taxa and increasing catastrophes.
Change observed Comment Cause References
The output of prawns in the Bohai Sea fell from more than 40,000 tonnes in the 1970s to just 1,000 tonnes in 2004. A 1998 survey indicated that the total biomass of fisheries was reduced by 89% compared with 1992.
This is an important economic catch. 20% of all China’s protein is marine-based. Fish farming production now exceeds wild catch, but may not be sustainable and is dependent on catch of threatened supply of wild larvae.
Excessive fishing, over-exploitation, disease and pollution have severely damaged this fishery resource. Legacy of habitat damage caused by historical trawling.
Qiao 2001
147,000 km² of Chinese seas classified as in serious eutrophic situation in 2009. Liaodong Bay, Bohai Bay, Laizhou bay, Yangtze Estuary, Hangzhou Bay and Zhujiang Estuary are the worst affected.
This constitutes maximum 3.7% of China’s total marine area.
Pollution from land-based and marine sources, especially agricultural chemical run off.
SOA 2009, CCICED 2010b, Cao & Wong 2007
Shellfish population on the east coast of Jiaozhou Bay, Shandong, China, is at the brink of extinction.
154 species in 1960s reduced to 33 in 1980s and only 17 in 1980s with only one of the original 14 dominant species remaining.
Sustained land reclamation and urban encroachment.
Liu & Sun 2008
Sea horses and other fish are undergoing dramatic declines throughout the tropical region.
Fish species are taken as foods, as fish meal to use in aquaculture, for ornamental fish trade and as traditional medicines.
Loss of key nursery areas plus overharvesting, use of destructive trawls, fine nets, traps, explosives and poisons.
TEEB 2010
Serious declines in all marine mammals of Yellow Sea.
Spotted Seal Phoca largha breeding sites on winter ice flows of Bohai Sea and summer resting places on islands of Yellow Sea are all threatened.
Pollution leads to reproductive failure, loss of fish prey to starvation, habitat loss on summer beaches and accidental death in fishing nets.
Smith & Yan 2008, Ross et al. 2010
Serious loss of coastal vegetation throughout the region including major loss of mangroves (China has lost 73% since 1950s).
Many commercially important plants are declining – reed harvest, medicinal species, fodder species, plants used by fisheries and ecological and physical fixation of coastal sediments.
Habitat loss due to reclamation, fishponds, salt-pans combined with invasion by alien species such as Spartina cord grass.
Zhang et al. 2005
Important beds of seaweeds and sea grasses seriously damaged and declining throughout the region.
Many edible species of algae being lost; sea grasses important for wildlife (five species in the EAAF globally threatened); single celled algae important for fishery food chains, shorebirds and carbon fixation.
Pollution, changes in nitrogen levels and salinity caused by damming estuaries
WWF et al. 2006, Short et al. 2011
Dramatic increase in jellyfish blooms in the Yellow Sea (including the Bohai Sea).
Injury to humans, loss of tourism revenues, indirect reduction of fisheries.
Overfishing of jellyfish larval predators, litter provides habitat for jellyfish and jellyfish prey on fish larvae.
Xian et al. 2005, Kawahara et al. 2006, Titelman & Hansson 2006, Dong et al. 2010
Regional populations of Green Turtle Chelonia mydas, have declined dramatically in recent years. Presently only seven natural beaches in South China are utilized by nesting Green Turtles.
Previously distributed widely throughout the waters of China and commonly found on nesting beaches in South China. The only remaining mainland nesting beach is located in the Gangkou Sea Turtle National Nature Reserve (114o2’E, 22o3’N) in Guangdong.
Caught in fishnets, nest disturbance, ingestion of litter, loss of coastal habitat and impact of severe pollution.
Song et al. 2002, Wallace et al. 2011
Biotic community structure changed from crustacean to molluscs dominated in Yangtze Estuary.
In an effort to restore the large loss of biomass, 15 tons of benthic organisms were returned between 2002 and 2004, but the resultant community changed and is less valuable.
Biomass loss was caused by construction of deep water channel in Yangtze River Estuary.
Zhen et al. 2006.
Probability of lethally low oxygen levels (hypoxia) increased by 90% since 1990 around Yangtze Estuary.
This serious lack of oxygen leads to collapse of marine ecosystems and fisheries resulting in dead zones.
Pollution and loss of tidal cleansing functions increased by reclamations.
Wei et al. 2007
Overall changes in biotic composition in Bohai and Yellow Sea.
Less big carnivorous fish, more small low economic value fish, more jellyfish, less diatoms and more flagellates.
Overfishing, pollution, habitat loss and reduced river discharge (results in lowering of Si/N ratio).
Kim et al. 2007, UNDP/GEF 2009, Yang et al. 2011b
Frequency of harmful algal blooms (HAB) increased 3.4 times since 1990s, now affecting 16,300 km2 in Yellow Sea.
Causes direct economic losses estimated at $285 million annually in China alone plus associated health risks.
Pollution and loss of tidal cleansing functions increased by reclamations.
Zhou et al. 2001, Song 2007

Intertidal Report • 11
Small Yellow Croaker Larimichthys polyactis has declined 80% since the 1960s in China and ROK.
This was formerly one of the most abundant economic species of the Yellow Sea accounting for 37% of total catch.
Overfishing combined with changing nature of the Yellow Sea. High trophic species replaced by low trophic anchovy and sandlance.
Zhou 2004, Tang 2006, Li et al. 2011
ROK has seen sharp declines in mollusc harvest.
50,000–90,000 tons of hard clams and 1000 tons of mud octopus were collected annually in the ROK, mostly in Saemangeum Estuary.
Saemangeum supply almost dried up since closing of the seawall gates in 2006.
WWF et al. 2006
7. Threats to the intertidal zoneA multitude of destructive processes and issues are negatively affecting shorelines and the intertidal zones of East and Southeast asia (Cheung et al. 2002). Questionnaires sent to managers of a number of sites of the Flyway Partners revealed a variety of perceived concerns in listing threats faced at individual sites (D. Watkins, pers. comm.; Figure 7). However, these sites are mostly protected areas with some security from other land claims. On the basis of the scale, timing of declines, irreversible nature of the threat, direct links to specific reclamations and measured bird losses, and the combination of direct and indirect impacts, this report suggests that by far the most serious and irreversible threat is the loss of habitat caused by reclamation of intertidal habitats for other uses such as agriculture, fish ponds, salt-pans and increasingly ports, industrial sites, tourism and new urban development. The following list, based on literature review and expert input lists the main threats to intertidal habitats and biota in approximate order of severity.
· Loss and fragmentation of habitat. According to the China National Wetland Conservation Action Plan (2000) some 1.19 million ha of coastal tidal flats have been lost and 1 million ha of coastal wetlands have been urbanized or used for mining. This constitutes a loss of 51% of all China’s coastal wetlands (Chen et al. 2005, CCICED 2010b, Bi et al. 2011). Mangroves decreased from ~50,000 ha in 1950 to 22,700 ha in 2001 – a 44% loss (Chen et al. 2009). Loss of coastal
Change observed Comment Cause References
Figure 7. Proportional responses received from site managers of East Asian-Australasian Flyway sites to a questionnaire about perceived threats to each site. Courtesy D. Watkins, Wetlands International Oceania, 6th Meeting of Partners of the East Asian-Australasian Flyway Partnership, Palembang, March 2012.

12 • Intertidal Report
wetlands continued and accelerated during the following decade. Much of the intertidal zone, especially in the Bohai Sea, is now occupied by aquaculture cage and salt farms. Incredibly, Asia accounts for 90% of the global aquaculture production with more than two-thirds occurring in China (Naylor et al. 2000). Intertidal habitat loss is a threat in all countries of the study (see Figure 9) (Bird Conservation Society of Thailand 2004, Trainor et al. 2008, Ardli & Wolff 2009, Choi et al. 2010, Toril et al. 2010, Murray et al. 2011, Wen 2012). Countries not yet facing much damage to habitat such as Myanmar (Naing 2007) are set to open up new developments, including reclamation for deep sea ports which could be very damaging unless the preliminary planning and zoning is sound. DPRK has also not yet reclaimed much of its coastline, but completed the 8,800-ha Taegyedo Tideland Reclamation project in 2010 and has plans for more reclamations (KCNA 2010).
· Damming of many major rivers in the region has led to changes in silt discharge, seasonality and quality of freshwater discharge (Chen et al. 2005, Syvitski et al. 2009, Wang et al. 2010a, Yang et al. 2011b). Silt load of the Haihe River which flows into the Bohai Sea has reduced from an average of 0.75 kg/m3 to 0.1 kg/m3 as a result of damming and upstream water extraction (CCICED 2010b). Reduced discharge along the entire east coast of China has reversed the shoreline accretion process resulting in a now receding shoreline (almost 5 m per year along Hebei coast) which will impact recent coastal reclamations (CCICED 2010b) and reduce biological productivity (Ning et al. 2010).
· Overuse of fertilizers, pesticides and herbicides in agriculture results in agricultural runoff to the ocean, leading to excessive nitrogen loads and growing threats from harmful algal blooms in many coastal areas (Tang et al. 2006). Blooms in 2008 and 2009 caused direct economic losses of nearly US$300 million (CCICED 2010b). Antibiotics are also released from aquaculture, with unknown consequences on coastal ecosystems (Wang et al. 2008, Gräslund & Bengtsson 2001).
· Pollution due to industrial emissions, wastewater and sewage discharges both directly and indirectly (Li & Daler 2004) into the coastal zone (Sowana et al. 2011). Common pollutants include phosphate, hydrocarbons, pesticides (Hu et al. 2009), inorganic nitrogen, heavy metals and organic matter.
· Oil spills are an increasingly dangerous problem and are presently occurring with high frequency. The South China Sea to Yellow Sea passage is the busiest shipping lane in the world. Accidental leaks occur and oil rigs are becoming more common in the Bohai Sea and South China Sea. Major oil spills and blow outs have already impacted many coastal habitats in the ROK and the Bohai Sea of China, and there are hundreds of small leaks that are barely reported (CCICED 2010b).
· Plastic litter, on beaches and in the sea, is mildly toxic and occurs in ever greater volumes in all coastal areas of the globe. Being non-biodegradable, plastics are a serious threat to all marine wildlife. In the intertidal zone, plastics may be ingested by wildlife, contaminate feeding sites, ensnare animals, reduce access to feeding and roosting sites, and directly impact individual animals through entanglement. Seven shorebirds and a Chinese Egret Egretta eulophotes were found caught in a single net on a single day in Gomso Bay (South Korea) (D. Rogers, pers. comm.).
· Tidal energy developments, which involve the construction of sea walls and tidal barrages, lead to direct loss of tidal flats. These developments also change near-shore tidal flows, which leads to increased impacts to siltation dynamics and damage to near-shore areas (Gill 2005). A large tidal energy project is being developed at Incheon, ROK (see case study in Appendix 9).
· Overharvesting and overuse of intertidal resources, including fish, molluscs, sea-cucumber, sea-urchins and seaweeds. The recent industrialization of harvesting methods has resulted in even greater harvests of intertidal flora and fauna with less manual labour required, which is impacting ecosystem processes throughout the intertidal zone. In most areas, the intertidal zone is a maze of fishing platforms traps and nets that not only add to overfishing, but prevents adult fish from reaching spawning nurseries (CCICED 2010b).
· Aquaculture/mariculture has developed so fast in some areas that it brings stress to coastal and intertidal ecosystems, causing great changes to beaches, wetlands, seaweed beds and coral reef ecosystems. Mariculture directly destroys the spawning grounds and habitat of fishery resources, and further influences the regenerative capacity of fishery resources (CCICED 2010b). The potential for a disastrous collapse in mariculture production and wild fisheries becomes increasingly likely (see Section 10).
· Hunting using mist nets, fine fish nets, snares, egg collection, poison and guns is occurring on or adjacent to beaches throughout the EAAF. For instance, while there are only a few hundred Spoon-billed Sandpipers left globally, hunting of these birds continues at their major remaining non-breeding area in Myanmar (Zöckler et al. 2010a). Additionally, fishing nets accidentally kill significant shorebirds if left on flats at low tide.

Intertidal Report • 13
· Exotic species are negatively affecting native coastal habitat, causing local species to be displaced by species accidentally or deliberately introduced from other areas. With increase in global shipping trade the influx of such species is increasing, especially in the coastal zone. Examples include Spartina grass in China (An et al. 2007a, Li et al. 2009a), zebra mussels, and tilapia fish along most coasts and estuaries (Yu & Yan 2002) in the region.
· Competition for food by human fishermen together with associated disturbance by humans and boats has continued to put pressure on waterbirds along the EAAF.
· Anthropogenic climate change has led to raised temperatures, sea levels, acidity and reduced oxygen. Tropical cyclones and floods (Figure 8) are becoming more frequent (Chen 1997). These changes will result in loss of many beaches and intertidal habitats, including many valuable agricultural and mariculture developments, villages and even coastal towns. Such climate change may also lead to seasonal mismatch between migration times and habitat productivity (Maclean et al. 2007). This threat is likely to become much more significant as climate continues to change.
· Windfarms are being constructed on land, onshore and offshore, mostly on tidal flats, and present a risk to coastal birdlife if sited close to important species localities (RSPB 2009), primarily through collision with wind turbines and through environmental impact in the construction phase. For example, East Asia’s largest wind farm, part of which has already been constructed, is at Rudong, where 50% of the global population of Spoon-billed Sandpiper was recorded in 2011 (Lee 2011) (see case study in Appendix 9).
· Sinking of coastal areas due to groundwater abstraction is exacerbating habitat loss due to reclamation (Syvitski et al. 2009) and sea level rise (Han et al. 1996). This weakens sea defences, can damage property and increases salt influx. Reclamation can result in increased sea levels – Saemangeum, for example, increased the level of the Yellow Sea (Lee et al. 2010).
8. Vanishing intertidal habitats The practice of converting the shallow intertidal flats into new land (commonly termed reclamation) is ancient and widespread. Early reclamations were incremental, advancing out onto the mudflats from the terrestrial coastline. Shorelines were continuously accreting and shorebirds fed mostly on the least affected lower tidal flats (Rogers et al. 2006b, Rosa et al. 2007). Reclamations were largely completed for new agricultural land for use as rice paddies or for salt-pans and during the past three decades for small-scale aquaculture.
Figure 8. Rising frequency of major flood events between 1950 and 2000 on four continents. Source: International Disaster Database, EM-DAT 2011.
Clearing after oil spill on the coast of the Republic of Korea
Plastic litter on a beach in the Republic of Korea

14 • Intertidal Report
However, the extent of habitat loss due to land reclamation (Figure 9) have accelerated with improving engineering techniques and faster paced infrastructure development. New industrial reclamations often involve constructing sea walls through deep water, from headland to headland, destroying all tidal flats. Habitat loss is thus more complete and sudden, leaving birds with little time to adjust. Moreover, reclamation of entire bays is likely to target habitats of greatest importance to shorebirds, which tend to occur in highest numbers on the largest tidal flats, often in estuaries (Table 4). Therefore, modern reclamation can be even more destructive to shorebirds than indicated by total tidal flat area lost.
In the Yellow Sea (including the Bohai Sea), the mean area of intertidal habitat lost from the six key areas since the early 1980s is 35% (Table 4; Appendix 2). This puts losses on a similar scale to tropical forests (Achard et al. 2002), sea-grasses (Waycott et al. 2009) and mangroves (Giri et al. 2011). In the Saemangeum area alone, the 40,100-ha development has resulted in massive intertidal destruction as part of the largest reclamation project to date (Birds Korea 2010), which resulted in a loss of 28,000 ha of intertidal flat (Moores 2012). Similarly, the reclamation of Caofeidian in the Bohai Sea plans to cover 31,000 ha by 2030 (CCICED 2010b), the largest reclamation project in the world. In China, the total area of planned reclamations yet to be initiated is more than 570,000 ha, which is extent the size of the intertidal flat reclamations in the last decade (Table 5).
* Data from Taiwan, Province of China, is represented separately because of the difference in intertidal habitat loss percentage.
Figure 9. Relative intertidal habitat loss due to land reclamation (by country/territory*), showing clumped percentiles of habitat loss by colour (see key). For data and references see Appendix 6.

Intertidal Report • 15
Table 4. National loss of coastal wetland (including marshes) and loss of intertidal flats in key areas (see Figure 5 for location) for intertidal waterbird biodiversity (in alphabetical order). Key areas were also identified in Bangladesh (1), Indonesia (1), Malaysia (2), Myanmar (1) and Vietnam (2), but no quantitative reclamation data were available (Appendix 2). Estimates of proportion coastal wetland reclaimed based on published sources.
Country
Coastal wetland ca.1980 ca.2010 (national, ha)
Proportion coastal wetland reclaimed (national) since 1980 Key area (see Appendix 2 and Figure 5)
Approximate intertidal flat area (ha) lost in key areas†
Proportion intertidal flat lost in key areas in last decade†
China (including Hong Kong, SAR China); DPR Korea
51%*
Bohai Bay – north-west Bohai Sea 53,100 59%
Jiangsu and Shanghai coast, Yellow Sea 100,00060% Jiangsu
15% Shanghai
Laizhou Bay – south Bohai Sea 23,000 53%
Liaodong Bay – north-east Bohai Sea 13,000 31%
Mai Po and Inner Deep Bay (or Shenzhen Bay) 190 6%
Yalu Jiang Estuary and DPRK estuaries 10,000 11%
Republic of Korea
312,000* 248,940*
60%**
eastern Yellow Sea coast 52,000 34%
eastern Yellow Sea coast – Saemangeum only 28,000*** 97%
Nakdong-gang Estuary – Sea of Japan 300 20%
Thailand – Inner Gulf of Thailand 0 0%
Singapore 70%internationally important EAAF site, but no key area with >20,000 shorebirds
– –
* Data sources: An et al. 2007b, Hilton & Manning 1995, Moores 2012, ROK Ministry of Land Transportation and Maritime Affairs (MLTM) 2008, Yee et al. 2010.** Total intertidal flat reclaimed in ROK is 60,800 ha (ROK Ministry of Land Transportation and Maritime Affairs (MLTM) 2008), which is 22% of total wetland area.*** Total project including all wetlands covers 40,100 ha (Birds Korea 2010). † For data sources see Appendix 2.
Figure 10. Loss of intertidal flats in the Yellow Sea (including Bohai Sea) as determined by analysis of images from the Landsat Archive (Murray et al. 2011, Yang et al. 2011). Region-wide rates are compared with the rates in Bohai Bay (Yang et al. 2011). The rate of loss in the key areas (in red) are given in Appendix 2. Future predictions (in grey shaded area) were generated using the estimates of rate of loss and extrapolating between years, and forward to 2020.

16 • Intertidal Report
Table 5. Approved and ongoing large–scale reclamation plans of coastal provinces and cities in China and the Republic of Korea (sources: CCICED 2010b, Ko et al. 2011). Little published data were available for DPRK, but the 8,800–ha Taegyedo Tidal Reclamation project was completed in 2010 according to the Korean News Service (KCNA 2010) and extensive sea walls are visible on Google Map for extensive parts of the coastline.
Coastal provinces and towns Time scale
Scale of reclamation plans relevant for intertidal flats (ha) Purpose and data source
Hebei ~2020 45,200 Qinghuangdao harbor master plan; Tangshan harbor master plan; Huanghua harbor master plan; Caofeidian industrial park master plan
Tianjin ~2020 21,500 Tianjin coastal leisure tourism area masterplan; Tianjin harbor industrial area master plan
Shandong 2009 – 2020 42,000 Special plans of concentrated and intensive sea use in Shandong Peninsula blue sea economic zone (2009–2020)
Jiangsu 2009 – 2020 180,000 Jiangsu coastal development plan (2009–2020)
Shanghai 2011 – 2020 40,000 Shanghai municipal development and protection of beach resources planning revision
Zhejiang 2005 – 2020 174,670 Zhejiang beach reclamation master plan (2005–2020)
Fujian 2005 – 2020 55,100 Fujian province beach reclamation plan (2001–2020)
Hainan – unknown
Guangxi 2008~2025 4,980 Guangxi Beihai city masterplan (2008–2025)
Guangdong 2005~2010 14,610 Guangdong province marine function zoning
Total China 2005> 578,060
Ganghwa (west) 2012> 7,940 Ganghwa Tidal Power Station (Birds Korea 2010, Ko et al. 2011)
Incheon Bay 2012> 15,700 – 19,600 Incheon Tidal Power Station (MOMAF 2006, KHNP & Ecoeye 2010, Cho et al. 2011)
Songdo Tidal Flat 2009> >1,000 Incheon Free Economic Zone (IFEZ) (Birds Korea 2010, Incheon Free Economic Zone 2011)
Garolim Bay* 2012> 9,000 Tidal Power Plant (Cho et al. 2011)
Total ROK 2009> >33,640
* The Garolim Bay development is currently halted (S. Millington, pers. comm.)
9. Direct links between species decline and habitat loss due to land reclamationStudies of waterbirds linking habitat loss and population trends in Asia are badly needed. However, the urgency of the situation has become clear already. Several studies have indicated an unambiguous link between habitat losses and declines of birds (Box 1), such as when declines immediately follow habitat losses (Rogers et al. 2009), or when declines occur in migratory populations using the Yellow Sea (including Bohai Sea) but not in resident populations (Amano et al. 2010, Wilson et al. 2011). A common assumption made by land managers and governments is that birds will move to somewhere else following destruction of tidal habitats. This was shown not to be the case in both the Saemangeum studies for Great Knot (Moores 2012) and the Bohai studies where Red Knot are compressed into smaller and smaller remaining mudflats (Hassell et al. 2011), contributing at least to some of the observed declines in Red Knot. Moreover, the negative effects of reclamation on shorebird populations have been demonstrated in other flyways (Burton 2006, Burton et al. 2006).
Documenting the functional links between reclamation activities and biodiversity declines with detailed ecological research is incredibly important for the conservation case of intertidal wetlands.

Intertidal Report • 17
Box 1. Removing vital rungs of the ladder: why small habitat losses can have disproportional effect on populations of migrating birds
Not all migrating birds use exactly the same routes and stopover sites. Some species are very specialized and only use sites with specific resources (Piersma 2006), or staging sites where they can build up enough weight for long-distance journeys (Warnock 2010). Different species’ bills are adapted to different types of mud or sand and to take different foods. Northward migration routes often differ from southward routes (Newton 2007, Gill et al. 2009, Minton et al. 2010, Lindström et al. 2011), for example due to seasonal differences in food availability (Yang et al. 2011a). The entire mixed species migration is dictated by specialization and constraints (Piersma 2007, Buehler & Piersma 2008, Batbayar et al. 2011). This leads to 45% of one population of Red Knots using only 20 km of coastline in Bohai Bay, China (Yang et al. 2008, Rogers et al. 2010), or more than 70% of the Flyway’s Bar-tailed Godwit population depending on one other Yellow Sea site, namely Yalu Jiang (Barter and Riegen 2004).
A relatively small loss of key sites can result in big population declines (Wilcove & Wilkelski 2008). A classic example is the population crash of the Red Knot in the eastern United States caused by over-harvesting of Horseshoe Crabs Limulus polyphemus at a single stopover site, the one in Delaware Bay (Baker et al. 2004). Historically, the rufa subspecies of Red Knots have used Delaware Bay and its superabundant supply of Horseshoe Crab eggs to put on fuel reserves for their long flights to the Arctic (Niles et al. 2008).
As refuelling sites are lost or degraded this causes remaining sites to become migratory bottlenecks of heightened significance (Verkuil et al. 2012). Reclamation along much of the Tianjin coast has forced larger numbers of birds to remaining intertidal flats in Tangshan, Bohai (Yang et al. 2011a, Hassell et al. 2011) (now threatened by reclamation developments beyond the already completed Caofeidian reclamation plan). Loss of habitats along the south China coast has increased the importance of Mai Po and Inner Deep Bay (Anonymous 2009, Chan et al. 2009); damage to the entire eastern seaboard of Sumatra has funnelled populations to the Banyuasin Delta (Verheugt et al. 1993, Iqbal et al. 2010); and developments in the Red River, Vietnam have concentrated birds into the small site of Xuan Thuy (Tordoff 2002). The closure of Saemangeum (itself a hub for several species) diverted birds to adjacent wetlands in the Geum Estuary and Gomso Bay, also threatened by looming reclamation plans (Moores et al. 2008). However, the number of displaced birds found on Korean shores fell far short of the numbers lost from Saemangeum, suggesting that remaining tidal flats in Korea were not large enough to support so many displaced birds, and that many birds must have perished because of the Saemangeum reclamation (Moores 2012).
For example, conservation organizations legally fighting the Wadden Sea shellfish-dredging permits issued by the Dutch Government won the case because they could refer to published research proving the causality between the activities and loss of biodiversity (van Gils et al. 2006, Kraan et al. 2007, 2009, 2010, 2011, Piersma 2009). Similar detailed research is now carried out in Bohai Bay by a consortium from Beijing Normal University, two Dutch institutions (University of Groningen and Royal Netherlands Institute for Sea Research - NIOZ) and the US Geological Survey (Anchorage) under the umbrella of the Global Flyway Network (GFN) and funded partially by WWF and BirdLife Netherlands (Yang et al. 2011a, Hassell 2011, T. Piersma, pers. comm.). Similarly, senior scientists and graduate students from Massey University, New Zealand, collaborate with volunteers from the New Zealand-based Miranda Naturalists Trust to document the migration patterns of shorebirds at Yalu Jiang and in the DPRK (Barter & Riegen 2004, A. Riegen, K. Woodley and D. Melville, pers. comm.).
In ROK, surveys of Saemangeum (Box 2) and nearby wetland systems were completed to assess whether birds were able to change to alternative flats when their original foraging habitat was reclaimed (Table 6). Following closure of the sea wall, there were strong declines recorded at Saemangeum and increases were recorded using two adjacent estuaries, Geum and Gomso, to the north and south (Moores et al. 2008). However, the increases in other Korean sites fell far short of the numbers of shorebirds lost from Saemangeum, and the total counts showed a large overall decline of shorebirds in the area (Figure 11).
Concurrent monitoring in non-breeding areas in Australia also showed declines in shorebird species affected by the Saemangeum reclamation, suggesting that a large proportion of the displaced birds perished (Rogers et al. 2009, Moores 2012, D. Rogers, pers. comm.). For example, on Eighty-mile Beach, a pristine site in north-western Australia which supports the largest non-breeding shorebird populations in the Flyway, most migratory shorebird species have declined appreciably in the past decade, while resident shorebird species have remained stable or increased (Table 7). Similarly, many species monitored elsewhere in Australia have undergone declines (for short review see Hansen (2011)). Although declines such as those on Eighty-mile Beach cannot be solely attributed to the loss of Saemangeum, several studies have indicated that threats are likely to occur at key migration sites rather than in non-breeding areas (Amano et al. 2010, Wilson et al. 2011, Szabo et al. 2012).

18 • Intertidal Report
Recently, an application of the IUCN Red List categories and criteria at the national scale showed that shorebirds are the fastest declining bird group in Australia (Szabo et al. 2012). The authors attributed the declines in the status of shorebirds to threats operating outside of Australia, implicating loss of intertidal habitat to coastal development in migratory staging sites as the likely key cause of the declines. Indeed, population declines of migratory shorebirds have been recorded at several non-breeding sites in southern and eastern Australia. In general, concurrent declines have occurred at numerous independent non-breeding sites (Gosbell & Clemens 2006, Garnett et al. 2011). Further declines have been recorded in Queensland, with many migratory species in Moreton Bay showing evidence of declining local populations. Since all the species that were identified as declining are dependent on the Yellow Sea (including Bohai Sea) during migration, it is likely that habitat losses in that region are the principal drivers of declines. Also, numbers of Curlew Sandpiper Calidris ferruginea monitored on six discrete and independent sites in Australia all show the same rates of decline (D. Rogers, pers. comm.). The sites themselves are well protected so this appears to be further evidence that it is problems at the staging habitat, mostly in Bohai Bay that are responsible for these declines. Monitoring of some species at their Arctic breeding grounds indicates that indeed declines are likely caused by problems during their long migrations along the Flyway (Syroechkovskiy 2012) and not from losses on the breeding grounds.
Figure 11. Changes in the population size and distribution of shorebirds in Saemangeum and adjacent intertidal areas after the closure of the Saemangeum sea wall in 2006 (data courtesy D. Rogers, N. Moores, P. Battley, C. Hassell & K. Gosbell). Research on tidal flat reclamations and the reducing of shorebird numbers in the East Asian-Australasian Flyway through Saemangeum Shorebird Monitoring Program (SSMP, Moores et al. 2008) and Monitoring Yellow Sea Migrants in
Australia (MYSMA, Rogers et al. 2009).
Box 2. Saemangeum, Republic of Korea (Scott 1989, Moores et al. 2001, 2008, Moores 2012)
The Saemangeum mudflats at the mouths of the Dongjin and Mangyeong Rivers, on the coast of ROK has been recognised as one of the most important staging sites for migrating shorebirds in the world (Appendix 2). In the 1980s, well over 200,000 shorebirds depended on the Saemangeum estuarine habitats as an important feeding ground on the EAAF, including Spotted Greenshank and Spoon-billed Sandpiper. The entire estuary was dammed by the 33-km-long Saemangeum Seawall Project despite repeated criticism from environmentalists. It was closed off in April 2006 and officially completed in 2010 (work began in 1991). Reclamation within the wall continues and land is scheduled to be converted for agriculture or industrial development (see artists concept below). Shortly after closing the estuary to tidal influence, millions of molluscs perished and the populations of the birds depending on the estuaries as a staging site declined dramatically. Even though much is already lost, conservationists still think parts of the area are worth protective management and corrective actions. As recently as September 2011, the few remaining “living tidal-flats” in the Saemangeum reclamation area still have small numbers of shorebirds, including Critically Endangered Spoon-billed Sandpipers.
Photos show artists concept, sea wall completed and dead shellfish following closure.

Intertidal Report • 19
Table 6. Results of the Saemangeum Shorebird Monitoring Program (SSMP), including surveys of the Saemangeum reclamation area and nearby wetland systems before and after closure of the sea wall (Moores et al. 2008, Rogers et al. 2009).
The three sites of the Saemangeum Shorebird Monitoring Program (SSMP)
Number of shorebird species that declined, 2006–2008
Number of shorebird species that increased, 2006–2008
Saemangeum 19 5
Geum Estuary 9 15
Gomso Bay 0 12
Total SSMP Region 15 9
Table 7. Overview of population changes of shorebird species spending the non-breeding season in Eighty-mile Beach, north-western Australia. Analysis of the counts by Australasian Wader Studies Group showed population changes in the 15 most abundant shorebird species (D. Rogers, pers. comm.).
Eighty-mile Beach non-breeding counts (Blue, resident species; Black, migratory species; Bold, migrants strongly dependent on intertidal flats) December 2008
As % of 1999 and 2001 surveys
Greater Sand Plover 22,885 35.4%
Curlew Sandpiper 3,292 41.0%
Bar-tailed Godwit 51,719 46.9%
Grey-tailed Tattler 7,950 54.3%
Eastern Curlew 423 59.7%
Ruddy Turnstone 2,433 69.9%
Grey Plover 1,146 72.3%
Great Knot 128,653 76.1%
Red Knot 23,123 77.9%
Common Greenshank 2,534 104.0%
Sanderling 3,605 112.0%
Pied Oystercatcher 809 116.0%
Red-necked Stint 28,443 118.5%
Red-capped Plover 6,752 219.4%
10. Implications for fisheries Fish and shellfish are a major food source for wildlife and form the major source of protein for the enormous human population of the coastal regions of East and Southeast Asia. Additionally, commercial and artisanal fishing industries are the main livelihood of many coastal communities. However, fisheries throughout the region are collapsing for a variety of reasons:
· Overfishing: Motorized fishing vessels in China increased from 10,000 in the late 1960s to 200,000 in the mid-1990s and have also increased in size, horsepower and modernized gear (China Fishery Yearbook 1998). Since 1989, China became the world’s largest producer of fish (China Fishery Yearbook 2009) but catch per unit effort has decreased steadily with large bottom feeding and highly valued species being replaced in the catch by smaller pelagic, lower trophic, less valuable species. Much of the current catch is only used as feed for mariculture. Stocks of key species such as Large Yellow Croaker Pseudosciaena crocea are exhausted (Tang 1993) and many species breed prematurely (Li et al. 2011). Shellfish, being a very important component of the total harvest, are also overfished.
· Use of unsustainable fishing or collection methods: Even without mechanization, shellfish are often over-harvested by hand (Pedersen & Thang 1996) and industrialization of the shellfish industry has made matters worse. Increased use of explosives and poisons in coral reef areas is

20 • Intertidal Report
causing terrible losses of complex species communities. Other unsustainable practices include the use of fine mesh nets and destructive trawl nets, harvesting of rare species of ornamental fish, molluscs and corals for tourist souvenirs, and dredging of entire reefs and beaches for lime and sand.
· Decrease in fish, crustacean and shellfish population recruitment: Stocks are failing to be replenished because vital spawning areas are being reclaimed, or scoured by increased sea action (itself increased by shoreline shortening of reclamations). Adult fish have reduced access to spawning areas due to a maze of traps, nets and other barriers (fish pens). Recruitment is hampered by distorted population demography (fewer reproducing adults) and increased harvest of wild larvae for mariculture use.
· Pollution: Fish and shellfish are dying and are rendered unsafe for human consumption as a result of increased pollution (Liu et al. 2007). The contaminants include heavy metals, persistent organic pollutants, toxic algal blooms and plankton. The reversal of coastal accretion, and increased scouring and coastal erosion, means that many pollutants that were removed from the ecosystem and held in deep mud are now being released back into food chains. Declines of marine fisheries due to reclamations, pollution and overfishing cause fishermen to seek new livelihoods in the damaging activities of mariculture (see below).
· Growth of mariculture: To meet growing demand for seafood products in face of collapsing marine supplies, mariculture has been stimulated into rapid growth in volume and technology. Mariculture production overtook wild capture in China since 1988. Today, 60% of commercial seafood products are from mariculture rather than offshore fisheries. However, mariculture waste feed and excrement introduces increasing pollution of nitrogen, phosphorous and organic matter (Cui et al. 2005), further degrading wild fisheries. Mariculture leads to increasing spread of diseases and easier transmission of diseases. It also results in an overall loss of the genetic resource base of the fisheries industry. The loss of genetic variation decreases adaptability in the face of changing climate and new diseases.
11. Threats to land and propertyContinued coastal reclamation is leaving entire seaboards vulnerable to natural disasters from erosion, land subsidence, salination, flooding, cyclones and tsunamis. These dangers are amplified by the loss of silt discharge from major rivers, by rising sea levels and increasingly frequent extreme weather events (Figure 8) arising from climate change. All low-lying coastal lands and coastal cities are at risk.
By 2006, there were 90,048 dams constructed on the largest eight rivers flowing into the eastern seas of which 4,697 are greater than 30 m in height (CCICED 2010b). These dams, combined with reduced water flow, water diversion schemes and removal of gravel and sand for construction, have resulted in a huge reduction in silt load reaching the sea. Sediment flux from Liaohe, Haihe, Huanghe and Huaihe rivers of northern China have decreased by 99%, 99%, 87% and 66%, respectively. Measurements for Yangtze, Qiantangjiang, Minjiang and Zhujiang Rivers of southern China decreased by 67%, 42%, 41% and 65%, respectively (CCICED 2010b).
Land reclamation and construction of sea walls effectively shortens the coastline of bays and estuaries, which intensifies the scouring of sea waves. For instance, the Saemangeum seawall project reduced that shoreline to one-third of its original length. The result of intensified sea action in tandem with reduced silt deposition is that the former rate of coastal accretion has been reversed. Silt is removed by wave action leaving coarser gravel. As much as 70% of the coasts of China are now eroding (Wang 2010). Rates vary from 0.5 m/year to 14m/year, with most severe effects noticed in Bohai Sea around the Liaohe and Luanhe estuaries where erosion rates reach 2.5–5 m/year and 15–300 m/year, respectively, and Haikou area of Hainan with 5m/year (CCICED 2010b).
Land subsidence has occurred in many coastal cities such as Tianjin, Xiamen and Shanghai. As coastal regions subside, sea level rises and frequency of cyclones increases, and land losses and saltwater intrusion will accelerate (Nicholls & Cazenave 2010). Consequently, natural defences against storm damage and tsunamis are lost (Syvitski et al. 2009).

Intertidal Report • 21
12. Review of drivers of coastal zone reclamationSeveral different drivers encourage the reclamation of tidal flats (Figure 12). Appendix 3 presents a matrix of the observed threats, their drivers and possible solutions. Most are financial in nature and tend to dominate the weaker drivers for biodiversity conservation and protection of coastlines for their ecosystem services. More developed countries reclaim land for urban and infrastructure development. These are usually planned by central government or provincial development plans. Less developed countries face local drivers to undertake smaller reclamations for agricultural or aquacultural conversion when costs are low. In tropical countries this often involves pressures to extend clearing of intertidal mangroves, which also causes damage and siltation of adjacent coral reefs. The growth of threats appears to be accelerating. The following paragraphs review the main drivers involved.
DemographicAlmost one-third of the global human population currently lives along the seaboards of East and Southeast Asia. This number is rising at tremendous speed due to the labour force following work at population centres on the Asian coastlines. The pressures of expanding new developments and industries are unparalleled and are set to increase at a more rapid pace over the next three decades. Setting up of exclusive economic zones along the Chinese coast caused huge internal and international migration. China’s migrant coastal population is estimated at more than 30 million.
Figure 12. Summary of the drivers of intertidal habitat loss by country or territory showing the number of drivers identified (indicated by number and size of circle) and the proportions of the various types of drivers (see pie chart legend). For source data and references see Appendix 5.

22 • Intertidal Report
The total of 554 million people living in coastal areas of China is projected to grow to 700 million by 2020 and 840 million by 2030 (Jiang et al. 2006). ROK is also developing its coastal zone at a very high rate, involving large-scale demographic shifts to the urban areas of coastal cities. Overall population density of ROK is almost four times higher than China, but similar to China’s eastern sea board. Demographic pressure is also very high in Indonesia and Bangladesh.
Low costs of land reclamationLinham et al. (2010) found that the cost of tidal reclamation costs in East Asia is US$3–5 per cubic metre of material used (Table 8). For land reclamation in Hong Kong Harbour, Yim (1995) stated the costs of land reclamation per square metre of claim are US$3.9 when using marine fill and US$6.4 when using land-based fill material. Costs including subsequent construction on reclaimed lands can be far greater depending on the infrastructure required. Despite this, reclamation is far cheaper than land purchase or rental in most countries and certainly within urban areas, though reclamation costs are rising. The table below gives recent examples.
One of the reasons for apparent low costs of reclamation is that full environmental costs (such as loss of fisheries and other ecosystem services and externalities (TEEB 2010)) are generally omitted from project benefit evaluations. If full cost-benefit analyses are conducted, then reclamation projects may not be viable. For example, the cost of Saemangeum has been exceeded several fold and reclamation works are continuing after 22 years. Additionally, the costs of fill material used in reclamation is increasing (since Indonesia banned export of sand to Singapore in 2003, the cost has risen from $4 per tonne to $30–40).
EconomicGross domestic production (GDP) of the 11 coastal administrations of China rose at an average 10% per annum between 2001 and 2009, reaching $US2.8 trillion or 57% of the national GDP. This GDP figure is projected to rise another 2.5 times to reach $US 6.7 trillion by 2020. Many heavy industries – for example, steel, automobile and petrochemical plants, have been relocated into coastal areas, and ports and storage quays have been developed to accommodate the huge increase in China’s import and export sectors. The eight largest container ports in the world and 13 of the largest 20 are all located within the study area. The Chinese shoreline occupied by ports may increase from 600 km to 1,000 km. Together with other expansion of coastal industries and urban development, a further 5,000 km2 of sea will likely be reclaimed by 2020 (CCICED 2010b).
GDP of marine industries (shipping, fishing, mining, tourism, salt production and exploration/extraction for oil and gas) has grown even faster at an average of 15% per annum in China. New industries such as marine energy, marine engineering, biopharmaceuticals and marine sciences will help propel this growth even faster.
Ships and marine equipment exports from ROK in 2010 increased approximately 10% compared with the previous year, totalling US$49.8 billion, the largest performance ever. The production of marine equipment in ROK occurs in large industrial areas with direct access to the ocean. Such massive
Table 8. Costs of tidal reclamation in East Asia (Linham et al. 2010).
State/territory Location Area reclaimed (ha) Total Cost (US$)
Unit cost (US$) per ha
Taiwan, Province of China
Kaohsiung Harbor 422.5 3.0 billion 7.1 million
Macao, SAR China Zhuhai-Macao Port Artificial Island 208 0.37 billion 1.7 million
China (mainland) Xiamen 3,933 3.4 billion 882,400*
Republic of Korea Saemanguem (outer walls only) 28,300 2.1 billion 74,204
Bangladesh Meghna 60,000 18 million 300
* From Peng et al. (2005)

Intertidal Report • 23
industrial areas negatively impact coastal environments and expansion of the industry continues to threaten coastal ecosystems.
Socio-politicalThe strong socio-political push for rapid coastal development in China has been documented by CCICED (2010b). The development of marine resources has been identified as a special focus under China’s 10th, 11th and 12th five-year plans (2001, 2006, 2011). This has ensured rapid approval for coastal constructions that are claimed to be positive for economic development: moving industry, establishing exclusive economic zones, new urban zones, port developments, oil exploration, refinery facilities, coastal roads and tidal reclamations. Implementation of Marine Development and Development of Marine Industries were respectively specified in the reports of the 16th (2002) and 17th (2007) National Congress of the Communist Party of China (CCICED 2010b). In 2008, the State Council of China published the ‘Planning Outline of National Marine Program Development’ placing even greater political emphasis on the economic development of the coastal zone and indirectly mounting more threats to intertidal habitats and biota. Similar forces have occurred in the ROK, with the government identifying areas that could be reclaimed in the 1980s and then systematically reclaiming them, often using the reclamations as an election banner (Moores 2006). Other countries of the region are pursuing similar socio-political policies.
Cultural and ReligiousMany religious temples and cultural centres are found along the coasts of the Yellow (including the Bohai Sea) and South China seas. These are largely now developed as tourism sites and add additional pressure to the coastline. Some coastal regions have seen a huge increase in tourism development with disturbance to beaches and increased demand for sea-foods. Some sites now receive several million tourists per year (e.g. Sanya, Hainan 17 million, Phuket, Thailand 4.5 million, Kuta, Bali 2.7 million). Development of the Disneyland Resort in Hong Kong, SAR China, involved reclamation of 1.3 km2 of sea.
Science and TechnologyIn theory, advances in science and technology should help reduce waste of marine resources and improve effectiveness of conservation. However, in general, advances in technology are driving further the levels of use of resources and damage to ecosystems. Advances in agriculture and mariculture have both brought added stress to the natural ecosystems. Advances in fishing technologies have contributed significantly to the depletion of marine fish stocks. Other advances are pushing the development of exploration for oil, gas and other submarine minerals, development of marine energy sources, exploitation of new marine food sources, development of additional mariculture systems, and use of new species in the biopharmaceuticals industry.
Advanced research and understanding of climate change may lead to greater awareness of the threats to the coastal zone from rising sea levels and increased and intensified storms and cyclones which may result in a slowing of investment into this threatened zone, but is more likely to result in the reliance on even greater physical constructions and sea defences.
13. Review of protective measures and tools available
Weakness of drivers for conservation of intertidal habitatsThe challenges for conservation in the East Asian-Australasian Flyway are immense. Currently, conservation efforts for coastal areas are small, disparate and gaining little traction. Despite stated conservation policies of the territories concerned, several international agreements, an informal international partnership for the Flyway, and considerable conservation investments, the drivers for conservation that should be achieving a safer balance are failing to ensure environmental protection in intertidal habitats along the Flyway. The case studies presented in Appendix 9 give specific examples.

24 • Intertidal Report
AwarenessDespite the tremendous efforts of international and domestic programmes and non-governmental organizations (NGOs), awareness of the importance of preserving functional natural ecosystems remains low within government, media, public and fishing communities affected (ECBP 2008). Statements promoting maintaining balance and harmony between ecosystems and human development, found in so many government policy documents, are not being reflected in results.
Awareness based on species, or habitat concerns, or appeals to conservation values are failing to halt governments and developers as land reclamation promises development and jobs. In each country, there is insufficient awareness of the international commitments that were made in 2010 when the CBD Strategic Plan for Biodiversity and its 20 “Aichi Targets” were agreed and adopted. Several of the Aichi Targets are especially pertinent to conservation of intertidal wetlands along the Flyway, most notably:
Target 1: By 2020, at the latest, people are aware of the values of biodiversity and the steps they can take to conserve and use it sustainably.
Target 5: By 2020, the rate of loss of all natural habitats, including forests, is at least halved and where feasible brought close to zero, and degradation and fragmentation is significantly reduced.
Target 6: By 2020 all fish and invertebrate stocks and aquatic plants are managed and harvested sustainably, legally and applying ecosystem based approaches, so that overfishing is avoided, recovery plans and measures are in place for all depleted species, fisheries have no significant adverse impacts on threatened species and vulnerable ecosystems and the impacts of fisheries on stocks, species and ecosystems are within safe ecological limits.
Target 10: By 2015, the multiple anthropogenic pressures on coral reefs, and other vulnerable ecosystems impacted by climate change or ocean acidification are minimized, so as to maintain their integrity and functioning.
Target 11: By 2020, at least 17% of terrestrial and inland water, and 10% of coastal and marine areas, especially areas of particular importance for biodiversity and ecosystem services, are conserved through effectively and equitably managed, ecologically representative and well-connected systems of protected areas and other effective area-based conservation measures, and integrated into the wider landscape and seascapes.
Target 12: By 2020 the extinction of known threatened species has been prevented and their conservation status, particularly of those most in decline, has been improved and sustained.
Target 14: By 2020, ecosystems that provide essential services, including services related to water, and contribute to health, livelihoods and well-being, are restored and safeguarded, taking into account the needs of women, indigenous and local communities, and the poor and vulnerable.
In order to meet these targets, it is clear that indiscriminate tidal reclamation along the Flyway cannot continue.
Lack of awareness is not limited to the international commitments that each country has made. There is also little understanding that the continued loss of ecosystem services leads to increasing threats and damage to life, health and property (Janekarnkij 2010). Economic valuations of the ecosystem services delivered by forests were effective in leading to the banning of logging over most of China, but only following catastrophic floods in 1997 (CCICED 2010c). Other areas of China’s environmental policy have benefitted from joint international cooperative studies and reviews, especially the studies of special task forces organized under the China Council for International Cooperation in Environment and Development CCICED (Hanson & Martin 2006). Serious engagement of national and international celebrities, whether they are royalty, athletes, prominent businessmen, or artists can help highlight the importance of environmental issues and create a public turn-around.
Important studies and recommendations at the global level such as The Economics of Ecosystems and Biodiversity (TEEB) reports (TEEB 2010), or at national level such as the special ecosystem services task force report to the China Council for International Cooperation in Environment and

Intertidal Report • 25
Development (CCICED 2010a), make a splash on publication, but such awareness is seldom sustained as governments’ priorities keep diverting to deal with new challenges. Since there is rarely enough time for such awareness to be digested and relayed by media, educators and NGOs to the general public and local communities, who are usually the least empowered to effect development plans, it is often quicker to take awareness directly to local communities (Box 3).
Availability of informationAvailability of good and trusted information on the ecology of wetlands or waterbirds should not be taken for granted by either NGOs or governments. Their collection needs a scientific infrastructure, continuous funding and cohorts of dedicated young researchers. In a few western countries, notably the UK, The Netherlands and the USA, long-term centres of academic study of wetlands and waterbirds have become established over the last 50 years. Often, work elsewhere in the world is linked to these ‘source centres’, a clear example being the Global Flyway Network rooted in academia in The Netherlands and Canada, employing scientists working in Australia and along the flyway, and now linking up with scientists from Beijing Normal University to document and study causalities of change on the mudflats and shorebirds using Bohai Bay (Rogers et al. 2010, Yang et al. 2011a, Battley et al. 2012). Within the EAAF, the development and funding of scientific centres of excellence clearly needs attention.
Lack of clear accurate, trusted and convincing information both in general terms and at specific sites weakens the potential to question developers plans or ensure that local government do not approve them without proper costing of environmental damages and losses. For instance, according to the statistics of China’s State Oceanic Administration, the total approved coastal reclamation area in 2007 was 2,225 km2. However, results gathered by the National Dynamic Monitoring and Management System show an actual reclaimed area of 13,380 km² in 2008 (Fu et al. 2010). In cases where the developer (often part of the government) is able to appoint both the assessor and the review board, EIA regulations can be easily circumvented, and EIA reports can lack the impartiality and rigour that they need. Strategic planning and EIA procedures can themselves be biased in favour of development at the expense of environment, especially if realistic environmental costs are not included in cost-benefit analyses. Even when good information exists it is often unavailable because of poor access, scientists refraining from releasing results before they are published in scientific journals (in turn delayed by slow review procedures), and because information is lost in technical jargon that non-specialists, such as planners and media, cannot understand. Outlets such as the books Invisible Connections (Battley et al. 2008) and Godwits: Long Haul Champions (Woodley 2009), if properly targeted, can help convey the transfer of information whilst illustrating the beauty of the fragile phenomena at the same time.
Distortion of data reporting can have disastrous management implications. Watson & Pauly (2001) demonstrated that over-reporting of catch by China (presumably to demonstrate production increases, which is important for local officials’ performance appraisal) created a false perception of good health in world fisheries and delayed international action to conserve declining stocks.
Box 3. Examples of local community driven conservation
Apo Island, Philippines Local fishermen at Apo Island were convinced by marine scientist, Dr Angel Alcala, to create a marine sanctuary instead of overfishing the area which would have led to the destruction of their reef system. Apo has since come to be known as one of the best examples of community-organized marine sanctuaries. It took three years of communicating with the local fishermen, but Dr Alcala was successful and with the help of the Silliman University Marine Laboratory and the village head (a woman), an area 450 meters along the shoreline and 500 meters out from shore was selected in 1982. This conservation model led the way for the creation of hundreds of marine sanctuaries in the Philippines and is proof that community-driven conservation efforts really do have an impact. Even though it takes some time to see that impact, fisheries around such sites continue to increase decades after establishment of the sanctuaries.
Yalu Jiang, ChinaSuccess is not guaranteed. An example is in Yalu Jiang where excellent outreach work by the Miranda Naturalists Trust, resulted in excellent local support and awareness. Volunteers were able to document large numbers of migrating shorebirds and establish the importance of the site as a migration stop-over. However, this was not enough to prevent the area becoming consumed by national and provincial plans and eventually being turned over to reclamation by the provincial government (Lee 2010).

26 • Intertidal Report
Coastal management policyAll countries and territories of the Flyway have appropriate policy for biodiversity conservation in general and coastal management. Appendix 8 shows the various major international agreements they are party to, whose policies they share at international level and whose actions in terms of strategy and policy they are following. This existence and development of international conservation policy is an important component of international collaboration for conservation (Ministry of Environmental Protection 2011). For shorebirds migrating through the East Asian-Australasian Flyway, numerous shorebird specific policies and agreements apply (see Appendix 4). These agreements require all countries to manage their environment for the protection of an adequate network of sites for migrating birds. Furthermore, for migratory species several international policies apply, which require countries to conserve migratory birds flying throughout their region. However, despite many of these agreements and programmes being active for nearly three decades, shorebird declines are continuing.
Legislative frameworkGovernments of the region have been regularly introducing, revising and updating improved laws relating to coastal management and protection. Many international NGO’s are also publicly advocating intertidal protection and are working to assist (see Appendix 4). Laws and decrees (together with guidelines, procedures and regulations for application and enforcement) for conservation fall into two main categories: 1) procedures for identifying, proposing and formal gazettement of priority sites for protection as nature reserves; and 2) application of EIAs in the process of development. Additional laws are gradually being developed to regulate strategic planning and Strategic Environmental Assessment (SEA) processes in the region. Laws need to be developed in parallel with assignment of governance mandates to different agencies.
Without clear management mandates, without integrated planning between upstream and coastal consequences, without a SEA or clear development zoning scheme, and with weak EIA process and a multitude of overlapping plans being pursued via national, local or private planners, there is the realization that many large-scale developments are carried forward at great damage to the environment.
Appendix 6 provides specific details for protected area (PA) legislation on a state-by-state basis along the Flyway. Legislative frameworks for protection of marine protected areas in Southeast Asia have also been reviewed by Cheung et al. (2002). Much of this legislation is outdated and preservationist, failing to cater for changing boundaries of dynamic wetlands, control of invasive species, habitat restoration needs, international or transfrontier parks, multiple use reserves or local community co-management (Cheung et al. 2002, Yan et al. 2004). In some countries, gazettement may not guarantee permanent protection and coastal PA degazettement has occurred, such as the loss of coastal reserves in Singapore (Pandan and Kranji Nature Reserves) and Malaysia (Klias Peninsula National Park).
Most countries have legal requirements for applying EIA and application to larger developments is fairly routine. The table in Appendix 7 compares legal approaches to EIA. A review of EIA application in Asia (World Bank 2006) also highlights the weaknesses of existing systems, such as weak enforcement, low penalties, limited public participation, and the lack of coordination between government bodies at local and central levels. Furthermore, as in many parts of the world, EIA is usually conducted by the developer, not by an independent assessor. Whilst EIA seems to be useful in assessing direct physical impacts such as pollution, noise and land disturbance, it appears that indirect assessments of impacts on biodiversity and ecosystem functions is not well practiced. Overall, EIA has not been effective in limiting the environmental damages caused by coastal developments and land reclamations.
Strategic Environmental Assessment (SEA) Whilst EIA is applied to specific and relatively short-term projects and follows a narrowly defined format, SEA is applied to policies, plans and programmes with a broad and long-term strategic perspective. SEA considers a wider range of alternate scenarios and is conducted independently of project proponents and is less formally documented. SEA aims to balance environmental, social and economic objectives and inherently incorporates consideration of cumulative impacts (OECD 2006). A significant body of work on biodiversity and SEA/EIA including CBD guidance is relevant.
EIA is quite well developed and applied in South and Southeast Asia, but the application of SEA processes is still in a developing and experimental stage (World Bank 2006, Dusik & Xie 2009).

Intertidal Report • 27
SEA is generally not a mandated planning process. However, China and Vietnam have established and implemented pioneer SEAs, including legal frameworks, specific guidance and increasing practice. In Indonesia, since 2007, the Ministry of the Environment, Ministry of Home Affairs and National Development Planning Board intensively developed a regulatory framework and an SEA Pilot Project aimed at mitigating climate change through protecting forests in Sumatra. Malaysia, Philippines, Thailand and Cambodia have developed basic proposals for SEA frameworks or initiated experimental projects with international donors (Dusik & Xie 2009).
Although SEA offers potential to achieve better balance in future developments in the region, it has not played a significant role yet. When planning the location or types of developments threatening the intertidal ecosystems of the region the instigation of SEA would be an excellent tool to evaluate potential large and long-term impacts on the ecosystem and ecosystem services, and can serve as a fruitful collaboration of national and local planning.
The ‘Biodiversity Impact Assessment of China’s Beibu Gulf Economic Zone Industrial Development Strategies and Plans’ is an example of a regional level SEA undertaken by Beijing Normal University (2010) (Zhang et al. 2011) on behalf of the Ministry of Environment in China. The report reviews the impacts of existing and planned developments over a significant area of China’s south coast and specifically identifies reclamation of mudflats and mangroves as the main reason for the decline in coastal biota and water birds and lists overharvesting of shrimps and other seafood products as a secondary threat. The plan sets objectives to increase PA coverage, protect typical ecosystems and restore key species, keep the length of natural coastline no less than 48% of the total coastline and limit the length of planned port industrial coastline to less than 12.1% of the total. It remains to be seen whether the report can be put into effect by the Ministry of Environment in the face of already planned local development interests, but if successful it could serve as a valuable model.
Mandates and governanceEven in the absence of mandatory SEA planning processes, governments of the region need to plan and manage coastal habitat in a coordinated and unified manner. Possible conflicts of interests between different ministries and sectors and decentralization of governments have to be overcome so that local economic interests are lined up with national policy, or more importantly to ensure that local dependence of habitats is taken care of. This is particularly important in the case of the intertidal zone where uses and interests of many different sectors overlap. Processes for resolving contradictory interests can be developed. For instance, Grumbine & Xu (2011) recognize that Chinese conservation values, policies and practices are not well integrated due to four systemic barriers: weak rule of law; unclear land tenure; top down government authority; and disconnects between scientific research and management implementation. They suggest combining traditional Chinese environmental values with contemporary science and international conservation practices, which will help to create a ‘Conservation with Chinese Characteristics’ (Grumbine & Xu 2011). Involvement of local residents and traditional values is needed to ensure that the environmental argument is fully respected.
Management of coastal developments in China has been labeled “zero management” (CCICED 2010b), with no coordination management framework in place to reconcile negative impacts of land-based activities with management of marine resources, estuaries and adjacent seas. There is no single agency providing a whole-of-government coordinated approach for the sustainable development of China’s coastal and marine territory. The responsibilities of the various departments are governed by different uncoordinated legislation, resulting in many overlaps and conflicts of functions (CCICED 2010b). Similar overlaps of mandate are reported in several other countries in the region (see Appendix 7) leading to poor coordination and governance.
Integrated Coastal Zone Management (ICZM) and Ecosystem-Based Management (EBM) Whilst EIA and SEA approaches operate for developing and approving plans, ICZM offers a way to undertake integration between different sectors at the management level. Almost all countries of the region profess to employ some forms of integrated planning and management of their coastal zones. The problem is that awareness of the importance of biodiversity is so weak that relevant experts are rarely engaged on the integrated planning teams and if involved can generally only offer generic platitudes in the lack of hard economic data. The result is that biodiversity is rarely well presented and under-protected in resultant plans.

28 • Intertidal Report
Of many types of ICZM practiced to harmonize management of different sectors at various scales, EBM appears to be the most suitable to ensure that the continued delivery of vital ecosystem services is ensured. The EBM approach aims to ensure ecosystems are used in a sustainable way for improved human benefit and ecosystem services, in a monitored, integrated and participatory manner (Arkema et al. 2006).
Alder et al. (2010) assessed aggregate performance measures in managing marine ecosystems based on an evaluation of the national implementation of 14 indicators of EBM, including six biodiversity-related indicators, five value-related indicators and three job-related indicators, in survey of 53 maritime countries. Out of a maximum potential score of 10, the countries within our region scored at the lower end of the spread: Japan, 4.5; ROK, 4.2; Malaysia, 3.9; Philippines, 3.9; China, 3.7; Thailand, 3.6; Indonesia, 3.5; Myanmar, 3.3; DPRK, 2.8 and Bangladesh, 2.3 (Alder et al. 2010). There is evidently much room for improvement.
Conservation PlanningRecent selection of nature reserves and other protected areas has followed gradual identification of important sites and opportunities by respective management agencies to acquire land. Selection of some PAs and the types of development that have occurred in them has been sometimes motivated by local interests in developing potential tourism revenues rather than importance of sites for biodiversity (Yan et al. 2004). National PA systems have evolved rather than being based on comprehensive systems planning. However, a number of regional reviews have used gap analyses in an effort to help guide selection of potential sites to secure good representative PA systems (MacKinnon 1997, Cheung et al. 2002, MacKinnon et al. 2005, BirdLife International and IUCN 2007). In addition, conservation plans have been developed to protect specific habitat types, taxa or individual species.
As options for conservation are narrowed by growing land developments, there is a growing urgency to prioritize and zone areas for conservation protection and action. Conservation plans need to be integrated or mainstreamed into wider planning processes and protected areas planned from a broader landscape viewpoint (CCICED 2010d). Such approaches are being increasingly used in the development of National Biodiversity Strategies and Action Plans. Meanwhile, as awareness for a variety of environmental concerns grows, most governments of the region are striving to plan for a ‘greener’ type of development.
At the other extreme, conservationists with narrow target interests have been actively developing conservation plans to save individual species or closely related taxa. Examples on the EAAF include the International Single Species Action Plans under the CMS for Chinese Crested Tern (Chan et al. 2010a), and Black-faced Spoonbill (Chan et al. 2010b) and Spoon-billed Sandpiper (Zöckler et al. 2010b, Pain et al. 2011). There is a need to merge the two processes so that narrow target plans can fit neatly within broader plans. Moreover, synergy between many single species plans will generate overlaps and build up stronger justification for costly conservation actions. The same site that is important for shorebirds may also be important for marine turtles, rare plants or other priority conservation targets.
PA managementAll countries of the region have well-developed protected area systems (MacKinnon 1997, MacKinnon et al. 2005, MacKinnon & Yan 2007) (Appendix 6). Even Democratic People’s Republic of Korea (DPRK) has established 6% land coverage including a series of migratory bird reserves (Yun Son Suk & Kim Song Ok 2005. Most countries are well over the 10% protected area coverage target proposed byCBD in 1992, but considerable work remains to meet Target 11 of the CBD Strategic Plan for Biodiversity 2011–2020 (see above). Most of the countries are parties to the Ramsar Convention on Wetlands of International Importance (Appendix 8) and have established country focal points for the protection and monitoring of wetlands and especially of Ramsar Sites. Despite such progress, and in line with global patterns (Butchart et al. 2010), clearly the drivers of reclamation and other threats are much stronger than the drivers for conservation.
Furthermore, an analysis of the impressive protected areas of the region (Yan et al. 2004, MacKinnon et al. 2005, BirdLife International and IUCN 2007) reveals that there is a bias in establishment towards mountain reserves and inland wetlands, but a significant lack of representation of lowlands, coastal and marine areas. The reasons for this bias are that it is easier to designate large protected areas in the agriculturally less productive and more remote mountain areas (combined with high levels of awareness for the need to protect upstream water catchments in this region of high rainfall). In the

Intertidal Report • 29
coastal zone, awareness of conservation needs is low, probably due to reasons of demography and access, and competition for coastal lands is greatest. Conservation agencies have low financing and limited resources, resulting in weak protection and management of existing sites. Ministries or other agencies that are responsible for the establishment of protected areas or management of Ramsar Sites are generally low on the political hierarchy, not the agencies responsible for strategic planning or zoning of major developments in coastal regions, and at best only consulted during the EIA process of individual projects. The case studies in Appendix 9 illustrate these aspects in specific instances.
Where protected areas have been established in coastal areas, they have mostly been effective in conserving intertidal biota. For instance, despite big losses of habitat along the ROK coastline outside national parks, there has been no reclamation within any national park since the establishment of the Korea National Park Service.
The role of NGOs NGOs play an important role in all countries of the region augmenting government conservation activities and providing a voice for local communities and public concern about environmental conditions. In many cases, they play an active role in ground-level conservation work, advocacy and promoting awareness (e.g. Birds Korea 2010). In Hong Kong, SAR China, WWF manages the Mai Po Marshes Ramsar Site on behalf of the government. Increasingly, NGOs are involved in a consultancy capacity in government planning and technical meetings and in the implementation of bilateral and international cooperative projects and programmes (e.g. Birds Korea 2010). Major international environmental NGOs have well-established programmes throughout the region (Appendix 4), but there has been an encouraging and rapid growth in number (several hundred), capacity and activity of national or local NGOs in all territories of the region. In the last decade, the China Coastal Waterbird Census, a monthly monitoring event started in 2005, was formed by volunteers from birdwatching and conservation NGOs in China.
Community co-management initiativesCommunity-based conservation and management is poorly applied to coastal protected areas, despite the obvious interests of local fishing and seafood harvesting communities as stakeholders. There is much literature from other contexts (e.g. forest conservation) highlighting the enormous contribution community-based management can make to conservation while ensuring a sustainable flow of benefits to local communities, and this approach could also be of significant relevance in coastal habitats.
Territorial sovereigntyThere are some regional overlaps in claims of territorial sovereignty that lead to disputes and certainly hinder aspects of cooperative protection for some islands and marine areas (Taek Hyun & Schreurs 2003). Hanson & Martin (2006) list ‘Impacts on fisheries and ecosystems arising from uncontrolled/unregulated exploitation in disputed areas of the South China Sea’ as one of seven security issues affecting the environment.
14. Conclusions This study reports on the loss of East Asian intertidal habitats, and especially tidal flats, a large and urgent problem of global concern from a biodiversity conservation viewpoint. The problem extends far beyond the crisis facing many intertidal shorebird species and encompasses other taxa, commercial fisheries, livelihoods and the ecological well-being of intertidal zones across the whole of East Asia, and in particular in the Yellow Sea (including the Bohai Sea). The rate of loss of intertidal habitat is greater than in any other flyway in the world. This degradation, and consequent rate of decline of dependent species, is undermining the conservation efforts and targets of countries elsewhere on the EAAF and cannot be ignored without severe consequences. A business as usual scenario has a high chance of leading to a variety of biodiversity loss. Furthermore, the international commitments made by all countries in the region, especially to the Aichi Biodiversity Targets, will not be met unless major changes are made to manage the coastal zone in a manner that secures biodiversity and ecosystem services.
The indicators of a well-developed nation are now merely economic, but must include environmental security including sustainable coastal zone planning that takes into account the importance of tidal flats.

30 • Intertidal Report
The issue is multinational and national in nature, and its severity is not well recognized. Greater international cooperation would help address the many different threats and drivers of environmentally degrading processes. These processes are not all sea-based. Silt which is the lifeblood of the intertidal system is derived from inland sources. Actions are needed at inland point sources, the seas, and along the shoreline.
The lack of good and trusted information and the severity of ecosystem decline calls for a major shift in attitudes, policies and procedures by governments at national and local level, by planners and developers, by the funders of and investors in development, by the media, academia, general public and by local communities. It is not enough to strengthen, bolster and improve existing actions and programmes. A complete rethink could put intertidal mudflats at the core of coastal protection and any future coastal zone management. IUCN could play a stronger role in coordinating such actions, not by criticism or trying to push western values onto Asian countries, but by working through its national membership and partners to build on traditional belief and value systems, especially Buddhist and Daoist concepts of harmony with nature. IUCN could commission ecosystem studies, help develop an integrated action plan and work with governments to find solutions. A wide range of initiatives and partner programmes could be harmonized into a comprehensive action plan, but many of the actions are urgent and cannot wait for the completion of a full international plan.
The countries of the region would benefit greatly by drawing a red line on the destruction of the last estuarine intertidal habitats by following the precautionary principle, delaying approving new reclamations until better assessment of losses is completed, and even abandoning some environmentally damaging economic dreams by opening up some of the existing sea walls and reeling back excessive fishing and mariculture activities that are far beyond sustainable levels. Building on the supportive work of World Bank in promoting capacity in SEA procedures (World Bank 2006), countries could be assisted in strengthening coastal planning processes and strengthening the network of coastal protected areas.
AcknowledgementsThis publication owes a great debt to the late Mark Barter whose rigorous scientific studies and extensive publications have done so much to highlight the plight of migrating shorebirds of the region and provided such a sound basis for this report. We also wish to thank all participants and the Secretariat of the Sixth Meeting of Partners of the East Asian-Australasian Flyway Partnership and the Spoon-billed Sandpiper Task Force Workshop, held in March 2012, Palembang, Indonesia (see participant lists in Appendix 10), who so willingly gave their time and expertise to review an early presentation of our findings and sat with us to provide individual views comments and information. We particularly thank all the regional experts who provided detailed input and discussion with the authors during the meeting. We also wish to thank Nicola Crockford, Simon Stuart, Mike Hoffmann, Mike Crosby, Doug Watkins, Nial Moores, Danny Rogers, Taej Mundkur, Nils Warnock, Geoffrey Davison, Spike Millington, Geoff Carey, Janet Barber, Richard Fuller, Simba Chan, Phil Battley, David Melville, Andrew Laurie, Rob Schuckard, Jimmy Choi, Hong-Yan Yang, Jesse Conklin, Christoph Zöckler, Nigel Clark, Ken Gosbell, Eddy Wymenga, Michaela Spiske, Evgeny Syroechkovskiy, Lei Guangchun, and Cristi Nozawa for feedback and support. The following people commented on the draft during the public review period: David Allen, Tatsuya Amano, Helen Byron, Sharon Chan, K.S. Cheung, Chang-yong Choi, Jong-Kwan Choi, Sayam Chowdhury, Rob Clemens, Sacha Cleminson, Rosie Cooney, Nicola Crockford, Mike Crosby, Nick Davidson, Dan Friess, Vivian Fu, Ken Gosbell, Muhammad Iqbal, Rowena Langston, Andrew Laurie, Namue Lee, Roy R. “Robin” Lewis III, David Melville, Clive Minton, Nial Moores, Yuki Mori, Vladimir Morozov, Theunis Piersma, Peter Prokosch, Danny Rogers, Teng Fei, Phil Round, Derek Schubert, Simon Stuart, K. Sivakumar, Bena Smith, Bill Sutherland, Chavalit Vidthayanon, John Wang, Nils Warnock, Keith Woodley, Yeap Chin Aik, Llewellyn Young, Yat-tung Yu, Christoph Zöckler and national Ramsar representatives of China and Hong Kong, SAR China. We are grateful to Tony Mok, Jan van der Kam and Ju Yung Ki for granting us permission to use their photos. The authors and IUCN are grateful to acknowledge the Swiss Federal Office for the Environment (FOEN) for providing the core financial assistance, and Olivier Biber personally for his assistance in facilitating the grant. The Environment Agency - Abu Dhabi also provided additional funding to complete the report.

Intertidal Report • 31
List of abbreviations and acronyms
PoWPA Programme of Works on Protected Areas (of CBD)REDD Reducing Emissions from Deforestation and Forest
DegradationRM Malaysia ringgit ROK Republic of KoreaRSPB Royal Society for Protection of BirdsSEA Strategic Environmental AssessmentSi/N Silicon/NitrogenSSMP Saemangeum Shorebird Monitoring ProgramS$ Singapore dollarTEEB The Economics of Ecosystem and BiodiversityTOR Terms of reference TRAFFIC Wildlife Trade Monitoring NetworkUN United NationsUNEP United Nations Environment ProgrammeUS$ United States dollar WCA Waterfowl Conservation AreaWCMC World Conservation Monitoring CentreWHO World Health OrganizationWI Wetlands InternationalWWF Worldwide Fund for NatureWWT Wildfowl and Wetlands Trust
National/territorial ISO3 codes:BGD BangladeshBRN Brunei DarussalamCHN People’s Republic of ChinaHKG Hong Kong, Special Administrative Region of
ChinaIDN IndonesiaKHM CambodiaKOR Republic of KoreaMMR Myanmar/BurmaMYS MalaysiaPHL PhilippinesPRK Democratic Peoples’ Republic of KoreaJPN JapanSGP SingaporeTHA ThailandTWN Taiwan, Province of ChinaVNM Vietnam
ASEAN Association of Southeast Asian NationsCAMBA China Australia Migratory Bird AgreementCBD Convention on Biological DiversityCCICED China Council for International Cooperation in
Environment and DevelopmentCITES Convention on International Trade in Endangered
Species of Wild Fauna and FloraCJMBA China Japan Migratory Bird AgreementCMS Convention on Migratory Species DG Director GeneralDPRK Democratic Peoples’ Republic of KoreaEAAF East Asian-Australasian FlywayEAAFP East Asian-Australasian Flyway PartnershipECA Ecologically Critical AreaEnCA Environment Conservation ActEI Environmental ImpactEIA Environmental Impact AssessmentFAO Food and Agriculture OrganizationGDP Gross Domestic ProductGEF Global Environmental FacilityGIS Geographical Information SystemGISP Global Invasive Species ProgrammeHAB Harmful Algal BloomHK$ Hong Kong dollarIBA Important Bird AreaICF International Crane FoundationIUCN International Union for Conservation of NatureKCNA Korean Central News AgencyKEI Korea Environment InstituteKORDI Korea Ocean Research and Development InstituteMEA Multilateral Environmental AgreementMoE Ministry of Environment MOSTE Ministry of Science Technology and Environment
(Vietnam)NBSAP National Biodiversity Strategy and Action PlanNGO Non-governmental organizationNP National ParkNR Nature ReserveNT New Taiwan dollarPA Protected AreaPES Payment for Ecological ServicesPOP Persistent Organic Pollutant

32 • Intertidal Report
ReferencesAchard, F., Eva, H.D., Stibig, H.-J., Mayaux, P., Gallego, J., Richards, T.
& Malingreau, J.-P. (2002) Determination of deforestation rates of the world’s humid tropical forests. Science 297: 999–1002.
Alder, J.S., Cullis-Susuki, V., Karpouzi, K., Kachener, K., Mondoux, S., Swartz, W., Trujillo, P., Watson, R. & Pauly, D. (2010) Aggregate performance in managing ecosystems of 53 maritime countries. Marine Policy 31: 468–476.
Amano, T., Székely, T., Koyama, K., Amano, H. & Sutherland, W. (2010) A framework for monitoring the status of populations: An example from wader populations in the East Asian– Australasian Flyway. Biological Conservation 143: 2238–2247.
An, S.Q., Gu, B.H., Zhou, C.F., Wang, Z.S., Deng, Z.F., Zhi, Y.B., Li, H.L., Chen, L., Yu, D.H., & Liu, Y.H. (2007a) Spartina invasion in China: implications for invasive species management and future research. Weed Research 47: 183–191.
An, S., Li, H., Guan, B., Zhou, C., Wang, Z., Deng, Z., Zhi, Y., Liu, Y., Xu, C., Fang, S., Jiang, J. & Hongli Li, H. (2007b) China’s natural wetlands: past problems, current status, and future challenges. Ambio 34: 335–342.
Anonymous (2009) Monthly Waterbird Counts Data April 2008 – March 2009: Waterbird Monitoring at the Mai Po Inner Deep Bay Ramsar Site. Report by Hong Kong Bird Watching Society to the Agriculture, Fisheries and Conservation Department, Hong Kong Special Administrative Region Government. Available at: www.hkbws.org.hk.
Anonymous (2011) Shorebird Monitoring at the Mai Po Inner Deep bay Ramsar Site (2001–2011). Report by Hong Kong Bird Watching Society to the Agriculture, Fisheries and Conservation Department, Hong Kong Special Administrative Region Government, Hong Kong.
Ardli, E.R. & Wolff, M. (2009) Land use and land cover change affecting habitat distribution in the Segara Anakan lagoon, Java, Indonesia. Regional & Environmental Change 9: 235–243.
Arkmena, K., Abramson, S. & Dewsbury, B. (2006) Marine ecosystem-based management; from characterization to implementation. Frontiers in Ecology and Environment 4: 525–532.
Baker, A.J., González, P.M., Piersma, T., Niles, L.J., do Nascimento, I.D.S., Atkinson, P.W., Clark, N.A., Minton, C.D.T., Peck, M.K. & Aarts, G. (2004) Rapid population decline in red knots: fitness consequences of decreased refuelling rates and late arrival in Delaware Bay. Proceedings of the Royal Society of London Series B-Biological Sciences 271: 875–882.
Bakewell, D.N. (2009) Kapar Power Station Waterbird Report 2008. A report of monthly waterbird counts made at Stesen Janaletrik Sultan Salahuddin Abdul Aziz, Kapar, Selangor Darul Ehsan, Malaysia. MNS-BCC Waterbirds Group.
Bamford, M.J., Watkins, D.G., Bancroft, W., Tischler, G. & Wahl, J. (2008) Migratory Shorebirds of the East Asian Australasian Flyway; Population Estimates and Internationally Important Sites. Wetlands International – Oceania, Canberra, Australia.
Barrett, G., Silcocks, A., Barry, S., Cunningham, R. & Poulter, R. (2003) The New Atlas of Australian Birds. Royal Australian Ornithologists Union, Victoria, Australia.
Barter, M. (2002) Shorebirds of the Yellow Sea – Importance, Threats and Conservation Status. Global Series 9, International Wader Studies 12, Canberra, Australia. http://www.deh.gov.au/biodiversity/migratory/waterbirds/yellow-sea/index.html.
Barter, M. (2003) The Yellow Sea – a race against time. Wader Study Group Bulletin 100: 111–113.
Barter, M.A. (2006) The Yellow Sea – a vitally important staging region for migratory shorebirds. Pp. 663–667 in: Boere, G.C., Galbraith, C.A., & Stroud, D.A. (eds.) Waterbirds around the world. The Stationery Office, Edinburgh, UK.
Barter, M. & Riegen, A. (2004) Northward shorebird migration through Yalu Jiang National Nature Reserve. Stilt 46: 9–15.
Barter, M. & Xu, Q. (2004) Northward shorebird migration surveys in 2004 at three Yellow Sea sites in Jiangsu and Shandong provinces. Stilt 46: 2–8.
Barter, M., Tonkinson, D., Sixian, T., Xiao, Y. & Fawen. Q. (1997) Wader numbers on Chongming Dao, Yangtze Estuary, China, during early
1966 northward migration and the conservation implications. Stilt 30: 7–13.
Barter, M., Tonkinson, D., Lu, J.Z., Zhu, S.Y., Kong, Y., Wang, T.H., Li, Z.W. & Meng, X.M. (1998) Shorebird numbers in the Huang He (Yellow River) Delta during the 1997 northward migration. Stilt 33: 15–26.
Barter, M., Wilson, J.R., Li, Z.W., Li, Y.X., Yang, C.Y., Li, X.J., Liu, Y.F. & Tian, H.S. (2000a) Northward migration of shorebirds in the Shuangtaizihekou National Nature Reserve, Liaoning province, China in 1998 and 1999. Stilt 37: 2–10.
Barter, M., Wilson, J.R., Li, Z.W., Dong, Z.G., Cao, Y.G. & Jiang, L.S. (2000b) Yalu Jiang National Nature Reserve, North-Eastern China – A newly discovered internationally important yellow sea site for northward migrating shorebirds. Stilt 37: 13–20.
Barter, M., Du, J.J., Wang, H., Chen, Y.Q., Gao, Z.D., Cheng, H. & Li, C.R. (2001) Shorebird numbers in the Yancheng National Nature Reserve during the 2001 northward migration. Stilt 41: 27–34.
Barter, M., Riegen, A. & Xu, Q. (2003) Shorebird numbers in Bohai Wan during northward migration. Stilt 44: 3–8.
Barter, M., Gosbell, K., Cao, L. & Xu, Q. (2005a) Northward shorebird migration survey in 2005 at four new Yellow Sea sites in Jiangsu and Liaoning provinces. Stilt 48: 13–17.
Barter, M., L. Cao, L. W. Chen, & G. Lei. (2005b) Results of a survey for waterbirds in the lower Yangtze floodplain, China, in January–February 2004. Forktail 21: 1–7.
Batbayar, N., Takekawa, J.Y., Newman, S.H., Prosser, D.J., Natsagdorj, T. & Xiao, X. (2011) Migration strategies of Swan Geese Anser cygnoides from northeast Mongolia. Wildfowl 61: 90–109.
Battley, P.F., Rogers, D.I., van Gils, J.A., Piersma, T., Hassell, C.J., Boyle, A. & Yang, H.-Y. (2005) How do red knots Calidris canutus leave Northwest Australia in May and the reach the breeding grounds in June? Predictions of stopover times, fuelling rates and prey quality in the Yellow Sea. Journal of Avian Biology 36: 494–500.
Battley P., McCaffery, B., Rogers, D., Hong, J.-S., Moores, N., Ju Y.-K., Lewis, J., Piersma, T. & van de Kam, J. (2008) Invisible Connections. Why Migrating Shorebirds Need the Yellow Sea. CSIRO Publishing, Collingwood, Australia.
Battley, P.F., Warnock, N., Tibbitts, T.L., Gill, Jr. R.E., Piersma, T., Hassell, C.J., Douglas, D.C., Mulcahy, D.M., Gartrell, B.D., Schuckard, R., Melville, D.S. & Riegen, A.C. (2012). Contrasting extreme long-distance migration patterns in the Bar-tailed godwit. Journal of Avian Biology 43: 21–32.
Bennett, E.L. and Reynolds, C.J. (1993) The value of a mangrove area in Sarawak. Biodiversity and Conservation 2: 359–375.
BCS (Bird Conservation Society of Thailand (2004) Directory of Important Bird Areas in Thailand: key sites for conservation. Bird Conservation Society of Thailand/BirdLife International, Bangkok.
Bi, X., Wang, B. & Lu, Q. (2011) Fragmentation effects of oil wells and roads on the Yellow River Delta, North China. Ocean & Coastal Management 54: 256–264.
BirdLife International (2001) Threatened Birds of Asia: the BirdLife International Red Data Book. BirdLife International, Cambridge, UK.
BirdLife International (2005) Important Bird Areas and potential Ramsar Sites in Asia. BirdLife International, Cambridge, UK.
BirdLife International and IUCN-WCPA South-East Asia (2007) Gap analysis of protected areas coverage in the ASEAN countries. BirdLife International, Cambridge, UK.
Birds Korea (2010) The Birds Korea Blueprint 2010 for the conservation of the avian biodiversity of the South Korean part of the Yellow Sea. Birds Korea. Available at: http://www.birdskorea.org.
Boere, G.C. & Stroud, D.A. (2006) The flyway concept: what it is and what it isn’t. Pp. 40–47 in Boere, G.C., Galbraith, C.A. & Stroud, D.A. (eds.) Waterbirds around the world. The Stationery Office, Edinburgh, UK.
Buckton, S.T., Cu, N., Tu, D.N., Quynh, H.Q. (1999) The conservation of key wetland Sites in the Mekong Delta. Conservation Report Number 12, BirdLife International/Royal Netherlands Embassy.
Buehler, D.M. & Piersma, T. (2008) Travelling on a budget: predictions and ecological evidence for bottlenecks in the annual cycle of long-distance migrants. Philosophical Transactions of the Royal Society B-Biological Sciences 363: 247–266.
Burton, N.H.K. (2006) The impact of the Cardiff Bay barrage on wintering waterbirds. Pp. 805 in: Boere, G.C., Galbraith, C.A. &
Intertidal Report • 33
environmental impacts in Lingding Bay, Pearl River Estuary, South China. Ocean & Coastal Management 48: 65–83.
Cheung, C.P.S, Alino, P.M., Uychiaoco, A.J & Arceo, H.O. (2002) Marine Protected Areas in Southeast Asia. ARCBC, Philippines.
China Coastal Waterbird Census Team (2011) China Coastal Waterbird Census Report 1.2008–12.2009. Hong Kong Bird Watching Society, Hong Kong Special Administrative Region. Available at: www.chinabirdnet.org.
China Fishery Yearbook, 1980–2009. China Agriculture Press. Beijing, China.
Cho, K.D., Choi, B.K., Kim, S.W., Cho, S.H. & Cho, H.J. (2011) Investigation of Tidal Power Plants Construction Plans (Draft). Incheon Development Institute. (In Korean).
Choi, B.H., Kim, K.O., Lee, H.S., Yuk, J.H. (2010) Perturbation of regional ocean tides due to coastal dikes. Continental Shelf Research 30: 553–563.
Chowdhury, S.U., Foysal, M., Das, D.K., Mohsanin, S., Diyan, M.A.A. & Alam, A.B.M.S. (2011) Seasonal occurrence and site use by shorebirds at Sonodia Island, Cox’s Bazar, Bangladesh. Wader Study Group Bulletin 118: 77–81.
Chung, C.H. (2006) Forty years of ecological engineering with Spartina plantations in China. Ecological Engineering 27: 49–57.
Costanza, R., D’Arge, R., Groot, R.D., Farber, S., Grasso, M., Hannon, B., Limburg, K., Naeem, S., O’Neill, R.V., Paruelo, J., Raskin, R.G., Sutton, P. & van Belt, M. (1997) The value of the world’s ecosystem services and natural capital. Nature 387: 253–260.
Crossland, A.C., Sitorius, A.S. & Chandra, H.A. (2010) Discovery of important site for Sanderling Calidris alba on the south coast of Java. Stilt 57: 3–4.
Cui, Y., Chen, B.J. & Chen, J.F. (2005) Evaluation on self-pollution of marine culture in the Yellow Sea and Bohai Sea. Chinese Journal of Applied Ecology 161: 180–185.
Davidson, N. (2011) Drivers of migratory waterbird status: habitat loss, land claim and hunting. Presented at Global Flyways Workshop, Seosan City, 17–21 October 2011.
Decho, A.W. (2000) Microbial biofilms in intertidal systems: an overview. Continental Shelf Research 20: 1257–1273.
Dong, Z.J., Liu, D.Y. & Keesing, J.K. (2010) Jellyfish blooms in China: dominant species, causes and consequences. Marine Pollution Bulletin 60: 954–963.
Doornbos, G., Groenendijk, A.M. & Jo, Y.W. (1986) Nakdong Estuary barrage and reclamation project: preliminary results of the botanical, macrozoobenthic and ornithological Studies. Biological Conservation 38: 115–142.
Dusik, J. & Xie, J. (2009) Strategic Environmental Assessment In East And Southeast Asia – A Progress Review and Comparison of Country Systems and Cases. World Bank, Sustainable Development-East Asia and Pacific Region Discussion Papers.
ECBP (2008) Knowledge, Attitude and Practices Survey on Biodiversity in China 2007. Published Project Report of EU-China Biodiversity Programme, Beijing.
Forbes, K. & Broadhead, J. (2007) The role of coastal forests in the mitigation of tsunami impacts. FAO, Bangkok.
Fu, Y.B., Cao, K., Wang, F. & Zhang, F.S. (2010) Initial study of quantitative evaluation method of the intensity and potential of reclamation. (In Chinese).Ocean Development and Management, 1: 27–30.
Garnett, S., Szabo, J. & Dutson, G. (2011) The Action Plan for Australian Birds 2010. Birds Australia/Csiro Publishing, Collingwood, Australia.
Gill, A.B. (2005) Offshore renewable energy – ecological implications of generating electricity in the coastal zone. Journal of Applied Ecology 42: 605–615.
Gill, R.E. Jr., Tibbitts, T.L., Douglas, D.C, Handel C.M., Mulcahy, D.M., Gottschalck, J.C., Warnock, N., McCaffery, B.J., Battley, P.F. & Piersma, T. (2009) Extreme endurance flights by landbirds crossing the Pacific Ocean: ecological corridor rather than barrier? Proceedings of the Royal Society of London B: Biological Sciences 276: 447–457.
Giri, C., Ochieng, E., Tieszen, L. L., Zhu, Z., Singh, A., Loveland, T., Masek, J. & Duke, N. (2011) Status and distribution of mangrove forests of the world using earth observation satellite data. Global Ecology and Biogeography 20: 154–159.
Gosbell, K. & Clemens, R. (2006) Population monitoring in Australia: Some insights after 25 years and future directions. Stilt 50: 162–175.
Stroud, D.A. (eds.) Waterbirds Around the World. The Stationery Office, Edinburgh, UK.
Burton, N.H.K., Rehfisch, M.M., Clark, N.A. & Dodd, S.G. (2006) Impacts of sudden winter habitat loss on the body condition and survival of Redshank Tringa totanus. Journal of Applied Ecology 43: 464–473.
Butchart, S. H. M., Walpole, M., Collen, B., van Strien, A., Scharlemann, J. P. W., Almond, R. E. A., Baillie, J. E. M., Bomhard, B., Brown, C., Bruno, J., Carpenter, K. E., Carr, G. M., Chanson, J., Chenery, A. M., Csirke, J., Davidson, N. C., Dentener, F., Foster, M., Galli, A., Galloway, J. N., Genovesi, P., Gregory, R. D., Hockings, M., Kapos, V., Lamarque, J.-F., Leverington, F., Loh, J., McGeoch, M. A., McRae, L., Minasyan, A., Morcillo, M. H., Oldfield, T. E. E., Pauly, D., Quader, S., Revenga, C., Sauer, J. R., Skolnik, B., Spear, D., Stanwell-Smith, D., Stuart, S. N., Symes, A., Tierney, M., Tyrrell, T. D., Vie, J.-C. &Watson, R. (2010) Global Biodiversity: Indicators of Recent Declines. Science 328: 1164–1168.
Caldecott, J., & Wickremasinghe, W.R.S.M. (2005) Sri Lanka: Post-Tsunami Environmental Assessment. United Nations Environment Programme (UNEP)/Ministry of Environment & Natural Resources of Sri Lanka, Geneva/Battaramulla.
Cao, L., Barter, M. & Wang, X. (2008) Saunders’s Gull: a new population estimate. Bird Conservation International 18: 301–306.
Cao, L., Tang, S., Wang, X. & Barter, M. (2009) Importance of eastern China for shorebirds during the non-breeding season. Emu 109: 170–178.
Cao, W. & Wong, M. (2007) Current status of coastal zone issues and management in China: a review. Environment International 33: 985–992.
CCC (2009) Impact Assessment of Climate Change and Sea Level Rise on Monsoon Flooding. Climate Change Cell, DoE, MoEF, Dhaka.
CCICED (2010a) Ecosystems and China’s Green Development. Pp.163–263 in: Report of Ecosystem Services Task Force to CCICED AGM. Beijing.
CCICED (2010b) Ecosystem Issues and Policy Options Addressing Sustainable Development of China’s Ocean and Coast. Pp. 264–316 in: Report of Marine Ecosystems Task Force to CCICED AGM. Beijing.
CCICED (2010c) 2010 Annual General Meeting. Published meeting documents of China Council for International Development and Environment. Beijing.
CCICED (2010d) Mainstreaming Biodiversity into China’s Green Development. Background Paper for AGM2010, China Council for International Cooperation on Environment and development, Beijing.
Chan, S., Crosby, M., So, S., Wang, D.Z., Cheung, F. & Hua, F.Y. (2009) Directory of Important Bird Areas in China (Mainland): Key Sites for Conservation. BirdLife International, Cambridge, UK.
Chan, S., Chen, S.H. & Yuan, H.W. (2010a) International Single Species Action Plan for the Conservation of the Chinese Crested Tern (Sterna bernsteini). BirdLife International Asia Division, Tokyo; CMS Secretariat, Bonn, Germany.
Chan, S., Fang, W.H., Lee, K.S., Yamada, Y. & Yu, Y.T. 2010b. International Single Species Action Plan for the Conservation of the Black-faced Spoonbill (Platalea minor). BirdLife International Asia Division, Tokyo; CMS Secretariat, Bonn, Germany.
Chang, S.E., Eeri, M., Adams, B.J., Alder, J., Berke, P.R., Chuenpagdee, R., Ghosh, S. & Wabnitz, C. (2006) Coastal ecosystems and tsunami protection after the December 2004 Indian Ocean tsunami. Earthquake Spectra 22(S3): S863–S887.
Chape, S., Spalding, M. & Jenkins, M.D. (2008) The World’s Protected Areas: status, values and prospects in the 21st century. Prepared by the UNEP World Conservation Monitoring Centre. University of California Press, Berkeley.
Chen, J.Y. (1997). The impact of sea level rise on China’s coastal areas and its disaster hazard evaluation. Journal of Coastal Research 13: 925–930.
Chen, L., Wang, W., Zhang, Y. & Lin, G. (2009). Recent progresses in mangrove conservation, restoration and research in China. Journal of Plant Ecology 2: 45–54.
Chen, X.Q., Zhang, E.F., Mu, H.Q. & Zong, Y. (2005). A preliminary analysis of human impacts on sediment discharges from the Yangtze, China, into the sea. Journal of Coastal Research 21: 516–521.
Chen, S.S., Chen, L.F., Liu, Q.H., Li, X. & Tan, Q.Y. (2005) Remote sensing and GIS–based integrated analysis of coastal changes and their

34 • Intertidal Report
Goss-Custard, J.D., Clarke, R.T., Durell, S.E.A.L.D., Caldow, R.W.G & Ens, B.J. (1995) Population consequences of winter habitat loss in a migratory shorebird 2. Model predictions. Journal of Applied Ecology 32: 337–351.
Gräslund, S. & Bengtsson, B.E. (2001) Chemicals and biological products used in south-east Asian shrimp farming, and their potential impact on the environment – a review. Science of the Total Environment 280: 93–131.
Grumbine, R.E. & Xua, J. (2011) Creating a ‘Conservation with Chinese Characteristics’. Biological Conservation 144: 1347–1355.
Han, M.K., Hiu, J.J. & Wu, L. (1996) Potential impacts of sea-level rise on China’s coastal environment and cities: a national assessment. Journal of Coastal Research SI 14: 79–95.
Hansen, B. (2011) A brief overview of literature on waders in decline. Stilt 60: 6–8.
Hanson, A.J. & Martin, C. (2006) One Lifeboat – China and the World’s Environment and Development. CCICED and International Institute for Sustainable Development. Available at: http://www.iisd.org/pdf/2006/china_one_lifeboat.pdf.
Hassell, C., Boyle, A. & Slaymaker, M. (2011) Red Knot northward migration through Bohai Bay, China, field trip report April & May 2011. Global Flyway Network/Australasian Wader Studies Group.
Healy, T., Wang, Y. & Healy, J.-A. (eds.) (2002) Muddy coasts of the world: processes, deposits, and function. Elsevier Science, Amsterdam, The Netherlands.
Heo, H.Y. (ed.) (2000) The Biodiversity and protected Areas of Korea. Ministry of Environment/Korea National Park Service.
Hilton, M.J. &. Manning, S.S. (1995) Conversion of coastal habitats in Singapore: indications of unsustainable development. Environmental Conservation 22: 307–322.
Hu, L.M., Zhang, G, Zheng, B.H., Qin, Y.W., Lin, T. & Guo, Z.G. (2009) Occurrence and distribution of organochlorine pesticides (OCPs) in surface sediments of the Bohai Sea, China. Chemosphere 77: 663–672.
Incheon Free Economic Zone (IFEZ) (2011) Available at http://www.fez.go.kr/en/fezs/incheon-free-economic-zone.jsp
Iqbal, M., Abdillah, G. & Abdillah, H. (2010) Wintering shorebirds migrate during January 2009 along the east coast of North Sumatra province, Indonesia. Stilt 50: 18–23.
Islam, M.S. (2001) Southward migration of shorebirds in the Ganges Delta, Bangladesh. Stilt 39: 31–36.
IUCN (2011) The IUCN Red List of Threatened Species. Version 2011.2. Available ate: http://www.iucnredlist.org.
Janekarnkij, P. (2010) Assessing the value of Krabi River Estuary Ramsar Site. ARE Working Paper No. 2553/4. Department of Agricultural and Resource Economics, Faculty of Economics, Kasetsart University, Bangkok.
Jiang, Z.H., Xu, K.D. & Song, J. (2006) Research Report on National Population Development Strategy, Beijing.
Kabir, D.M.H & Hossain, J. (2007) Sundarban Reserve Forest: An account of people’s livelihood and biodiversity conservation. Study of implementation of Article 10(c) of CBD government.
Kawahara, M., Uye, S., Burnett, J. & Mianzan, H. (2006) Stings of edible jellyfish (Rhopilema hispidum, Rhopilema esculentum and Nemopilema nomurai) in Japanese waters. Toxicon 48: 713–716.
KCNA (2010) Report on completion of Taegyedo Tideland. Korean News Service press release. At available: http://www.kcna.co.jp/item/2010/201006/news30/20100630-09ee.html.
Ke, C-Q., Zhang, D., Wang, F-Q., Chen, S-X., Schmullius, C., Boerner, W-M. & Wang, H. (2011) Analyzing coastal wetland change in the Yancheng National Nature Reserve, China. Regional Environmental Change 11: 161–173.
Keddy, P.A. (2010) Wetland Ecology: Principles and Conservation, 2nd edition. Cambridge University Press, Cambridge, UK.
Kim, Y.O., Chae, J., Hong, J.S. & Jang, P.G. (2007) Comparing the distribution of ciliate plankton in inner and outer areas of a harbor divided by an artificial breakwater. Marine Environmental Research 64: 38–53.
Kim, H. (ed.) (2011) Saemangeum: a role model for green growth. Korean Research Institute for Human Settlement. Griz Gazette Space & Environment 43.
Kirby, J. 2010. Review 2: Review of Current Knowledge of Bird Flyways,
Principal Knowledge Gaps and Conservation Priorities. CMS Scientific Council: Flyway Working Group Reviews.
Ko, Y., Schubert, D.K. & Hester, R.T. (2011) A conflict of greens: green development versus habitat preservation – the case of Incheon, South Korea. Environment: Science & Policy for Sustainable Development 53: 3–17.
KORDI – Korean Ocean Research and Development Institute (2006) Coastal Wetlands Conservation Plan. Presented at the Symposium for Intertidal habitat Conservation and Sustainable Use, Gochang, Republic of Korea, 28 September 2006.
Korea Hydro & Nuclear Power Co. Ltd (KHNP) and Ecoeye Co. Ltd. (ROK) (2010). Clean Development Mechanism Project Design Document. Downloaded in November 2011 at: http://cdm.unfccc.int/Projects/Validation/DB/F8LSVUFKUW79Q565TOAQK4G2YIHKZR/view.html.
Korean Shorebird Network (2011) 2010 Fall Census on Shorebirds of Korea, Shinan County. With forewords by the national Minister of Environment, national Minister of Land, Transport and Maritime Affairs and representatives of the Common Wadden Sea Secretariat.
Kraan, C., Piersma, T., Dekinga, A., Koolhaas, A. & van der Meer, J. (2007) Dredging for edible cockles (Cerastoderma edule) on intertidal flats: short-term consequences of fisher patch-choice decisions for target and non-target benthic fauna. ICES Journal of Marine Science 64: 1735–1742.
Kraan, C., van Gils, JA., Spaans, B., Dekinga, A., Bijleveld, A.I., van Roomen, M., Kleefstra, R. & Piersma, T. (2009) Landscape-scale experiment demonstrates that Wadden Sea intertidal flats are used to capacity by molluscivore migrant shorebirds. Journal of Animal Ecology 78: 1259–1268.
Kraan, C., van Gils, J.A., Spaans, B., Dekinga, A. & Piersma, T. (2010) Why Afro-Siberian Red Knots Calidris canutus canutus have stopped staging in the western Dutch Wadden Sea during southward migration. Ardea 98: 155–160.
Kraan, C., Dekinga, A. & Piersma, T. (2011) Now an empty mudflat: past and present benthic abundances in the western Dutch Wadden Sea. Helgoland Marine Research, 65: 51–58.
Lee, E. (2010) Mission Impossible. Miranda Naturalist’s Trust News, 78: 12–13. Available: http://www.miranda-shorebird.org.nz/wp-content/uploads/2011/11/MNT-News-aug-10.pdf.
Lee, K.K. (1999) Using GIS for Assessing the Implication of Land-use Change on Waterbirds around Mai Po and Inner Deep Bay, Hong Kong. Unpublished MPhil thesis, City University of Hong Kong.
Lee, S., Lie, H.J., Song, K.M. & Cho, C.H. (2010) A tale of two coasts; tidal modification in Saemangeum and Isahaya. Pp. 91–109 in: Ishimatsu, A. & Lie, H.-J. (eds.) Coastal Environmental and Ecosystem Issues of the east China Sea. TERRAPUB/Nagasaki University.
Li, B., Liao, C.H., Zhang, X.D., Chen, H.L., Wang, Q., Chen, Z.Y., Gan, X.J., Wu, J.H., Zhao, B., Ma, Z.J., Cheng, X.L., Jiang, L.F. & Chen, J.K. (2009a) Spartina alterniflora invasions in the Yangtze River estuary China: an overview of current status and ecosystem effects. Ecological Engineering 35: 511–520.
Li, D.J. & Daler, D. (2004) Ocean pollution from land-based sources: East China Sea, China. Ambio 33: 107–113.
Li, J. (2011) Nearly one third of the world’s Spoon-billed Sandpiper recorded in Rudong, China. Conservation Leadership Programme, Projects in Asia/Pacific. Available at: http://maildogmanager.com/page.html?p=000001XDDtjL2KEbIcfGo+zqgsHKVikg.
Li, Z.W.D., Yeap, C.K. & Kumar, K. (2007) Surveys of Coastal Waterbirds and Wetlands in Malaysia, 2004–2006. Pp. 1–40 in: Li, Z.W.D. & Ounsted, R. (eds.) The Status of Coastal Waterbirds and Wetlands in Southeast Asia: Results of Waterbird Surveys in Malaysia (2004–2006) and Thailand and Myanmar (2006). Wetlands International, Kuala Lumpur, Malaysia.
Li, Z.W.D., Bloem, A., Delany, S., Martakis, G. & Quintero, J.O. (2009b) Status of Waterbirds in Asia – Results of the Asian Waterbird Census: 1987–2007. Wetlands International, Kuala Lumpur, Malaysia.
Li, Z.L., Shan, X.J., Jin, X.S. & Dai, F.Q. (2011) Long-term variations in body length and age at maturity of the small yellow croaker (Larimichthys polyactis Bleeker, 1877) in the Bohai Sea and the Yellow Sea. Fisheries Research 110: 67–74.
Lindström, Å., Gill Jr., R.E., Jamieson, S.E., McCaffery, B., Wennerberg, L., Wikelski, M. & Klaassen, M. (2011) A puzzling migratory detour: are

Intertidal Report • 35
fueling conditions in Alaska driving the movement of juvenile sharp-tailed sandpipers? Condor 113: 129–139.
Linham, M.M., Green, C.H. & Nicholls, R.J. (2010) AVOID Report on the costs of adaptation to the effects of climate change in the world’s large port cities. AV/WS2/D1/R14. Available at: http://www.avoid.uk.net.
Liu, H.B. & Sun, L. (2008) Analysis on land reclamation in Jiaozhou Bay and study on its protection methods. (In Chinese).Ocean Development and Management 6: 80–87.
Liu, W.X., Chen, J.L., Lin, X.M., Fan, Y.S. & Tao, S. (2007) Residual concentrations of micro pollutants in benthic mussels in the coastal areas of the Bohai Sea, North China. Environmental Pollution 146: 470–477.
Ma, Z., Wang, Y., Gan, X., Li, B., Cai, Y. & Chen, J. (2009) Waterbird population changes in the wetlands of Chongming Dongtan in the Yangtze River Estuary, China. Environmental Management 43: 1187–1200.
Maclean, I.M.D., Rehfisch, M.M., Delany, S. & Robinson, R.A. (2007) The Effects of Climate Change on Migratory Waterbirds within the African-Eurasian Flyway. British Trust for Ornithology. Available at: http://www.unep-aewa.org/meetings/en/tc_meetings/tc8docs/meetings_docs_pdf/tc8_24_report_effects_climate_change_on_mwb.pdf.
MacKinnon, J. (ed.) (1997) Protected Areas Systems Review of the Indo-Malayan Realm. The Asian Bureau for Conservation (ABC)/World Conservation Monitoring Centre (WCMC), Cambridge, UK.
MacKinnon, J. & Yan, X. (2008) Regional Action Plan for the Protected Areas of East Asia. Bangkok, Thailand.
MacKinnon, J., Yan, X., Lysenko, I., Chape, S., May, I. & Brown, C. (2005) GIS Assessment of the Status of Protected Areas in East Asia. UNEP-WCMC, Cambridge/IUCN, Gland Switzerland and Cambridge.
Mallory, M.L., Gilchrist, H.G., Braune, B.M. & Gaston, A.J. (2006) Marine birds as indicators of Arctic marine ecosystem health: linking the Northern Ecosystem Initiative to long-term studies. Environmental Monitoring and Assessment 113: 31–48.
Manopawitr, P. & Round, P.D. (2004) Thailand’s greatest wetland under imminent threat. Birding Asia 2: 74–77.
Melville, D.S. & Battley, P.F. (2006). Shorebirds in New Zealand. Stilt 50: 295–303.
Millennium Ecosystem Assessment (2005) Ecosystems and Human Well-being: current state and trends. In: Hassan, R., Scholes, R. & Ash, N. (eds.) The millennium ecosystem assessment series; v.1. Washington DC. Available at: http://www.millenniumassessment.org/documents/document.356.aspx.pdf.
Minton, C., Gosbell, K., Johns, P., Christie, M., Fox, J.W. & Afanasyev, V. (2010) Initial results from light level geolocator trials on Ruddy Turnstone Arenaria interpres reveal unexpected migration route. Wader Study Group Bulletin 117: 9–14.
Ministry of Environmental Protection (2011) China National Biodiversity Conservation Strategy and Action Plan. Beijing, China. (In Chinese).
MOMAF (2006) Marine Ecosystem Management Strategy Study, Final Report. Produced by the national Ministry of Maritime Affairs and Fisheries, ROK.
Moores, N. (2006) South Korea’s shorebirds: a review of abundance, distribution, threats and conservation. Stilt 50: 62–72.
Moores, N. (2012) The Distribution, Abundance and Conservation of Avian Biodiversity in Yellow Sea Habitats in the Republic of Korea. Unpublished PhD thesis.
Moores N., Kim S.-K., Park S.-B. & Sadayoshi, T. (eds.) (2001) Yellow Sea Ecoregion: Reconnaissance Report on Identification of Important Wetland and Marine Areas for Biodiversity. Volume 2: South Korea. Joint publication of WWF-Japan, Wetlands & Birds Korea, and Wetlands International China Program.
Moores, N., Rogers, D., Kim, R-H, Hassel, C., Gosbell, K., Kim, S.-A. & Park & M.–N. (2008) The 2006–2008 Saemangeum Shorebird Monitoring Program Report. Birds Korea publication.
Murray, N.J., Clemens, R.S. & Fuller, R.A. (2011) Massive losses of East Asian intertidal habitats detected by remote sensing. International Congress on Conservation Biology. Auckland, New Zealand.
Myers, J.P, Morrison, R.I.G., Antas, P.Z., Harrington, B.A., Lovejoy, T.E., Sallaberry, M., Senner, S.E. & Tarak, A. (1987) Conservation strategy for migratory species. American Scientist 75:18–26.
Naing, T.Z. (2007) Surveys of Coastal Waterbirds and Wetlands in the Ayeyarwaddy (Irrawaddy) Delta, Myanmar, December 2005 – March 2006. Pp. 68–83 in: Li, Z.W.D. & Ounsted, R. (eds.) The Status of Coastal Waterbirds and Wetlands in Southeast Asia: Results of Waterbird Surveys in Malaysia (2004–2006) and Thailand and Myanmar (2006). Wetlands International, Kuala Lumpur, Malaysia.
Naylor, R.L., Goldburg, R.J., Primavera, J.H., Kautsky, N., Beveridge, M.C M., Clay, J., Folke, C., Lubchenco, J., Mooney, H. & Troell, M. (2000) Effect of aquaculture on world fish supplies. Nature 405: 1017–1024.
Newton, I. (2007) The Migration Ecology of Birds. Academic Press, London.
Nicholls, R.J. & Cazenave, A. (2010) Sea-level rise and its impact on coastal zones. Science 328: 1517–1520.
Niles, L.J., Sitters, H.P., Dey, A.D., Atkinson, P.W., Baker, A.J., Bennett, K.A., Carmona, R., Clark, K.E., Clark, N.A., Espoz, C., González, P.M., Harrington, B.A., Hernández, D.E., Kalasz, K.S., Lathrop, R.G., Matus, R.N., Minton, C.D.T., Morrison, R.I.G., Peck, M.K., Pitts, W., Robinson, R.A. & Serrano, I.L. (2008) Status of the Red Knot (Calidris canutus rufa) in the Western Hemisphere. Studies in Avian Biology 36: 1–185. The Cooper Ornithological Society.
Ning, X., Lin, C., Su, J., Liu, C., Hao, Q., Le, F. & Tang, Q. (2010) Long-term environmental changes and responses of the ecosystems in the Bohai sea during 1960–1996. Deep-sea Research II 57: 1079–1091.
OECD (2006) Applying Strategic Environmental Assessment: Good Practice Guidance for Development Co-operation. Organisation for Economic Development and Cooperation.
Pain, D., Green, R. & Clark, N. (2011) On the edge: can the Spoon-billed Sandpiper be saved? British Birds 104: 350–363.
Pedersen, A. & Thang, N.T. (1996) The Conservation of Key Coastal Wetland Sites in the Red River Delta. Conservation Report Number 8. BirdLife International Vietnam Programme in collaboration with the Forest Inventory and Planning Institute, Hanoi, Vietnam.
Peng, B.R., Hong, H.S., Chen, W.Q., Xue, X.Z., Cao, X.L. & Peng, J.P. (2005) Ecological damage appraisal of sea reclamation: theory, method and application. Journal of Natural Resources 20: 714–728.
Phillips, M.J., Enyuan, F., Gavine, F., Hooi, T.K., Kutty, M.N., Lopez, N.A., Mungkung, R., Ngan, T.T., White, P.G., Yamamoto, K. & Yokoyama, H. (2009) Review of environmental impact assessment and monitoring in aquaculture in Asia-Pacific. Pp. 153–283 in: FAO. Environmental impact assessment and monitoring in aquaculture. FAO Fisheries and Aquaculture Technical Paper, No. 527. FAO, Rome.
Piersma, T. (2006) Understanding the numbers and distribution of waders and other animals in a changing world: habitat choice as the lock and the key. Stilt 50: 3–14.
Piersma, T. (2007) Using the power of comparison to explain habitat use and migration strategies of shorebirds worldwide. Journal of Ornithology 148: 45–59.
Piersma, T. (2009) Threats to intertidal soft-sediment ecosystems. Pp. 57–69 in: Reinhard, S. & Folmer, H. (eds.) Water Policy in the Netherlands. Integrated Management in a Densely Populated Delta. Resources for the Future, Washington, DC.
Qiao, Z. (2001) China. State and Future of China Fisheries Enhancement, Management Technology Development. State Oceanic Administration [13 Dec 2001]. Available at: http://www.soa.gov.cn/leader/9713a.htm.
Rakhimberdiev, E., Verkuil, Y.I., Saveliev, A.A., Väisänen, R.A., Karagicheva, J., Soloviev, M.Y., Tomkovich, P.S. & Piersma, T. (2011) A global population redistribution in a migrant shorebird detected with continent-wide qualitative breeding survey data. Diversity and Distributions 17: 144–151.
Ranganathan, J., Bennett, K., Raudsepp-Hearne, C., Lucas, N., Irwin, F., Zurek, M., Ash, N. & West, P. (2008) Ecosystem Services: A Guide for Decision Makers. World Resources Institute, Washington, USA.
Rogers, D.I., Moores, N. & Battley, P.F. (2006a) Northwards migration of shorebirds through Saemangeum, the Geum estuary and Gomso bay, South Korea in 2006. Stilt 50: 73–89.
Rogers, D., Piersma, T. & Hassell, C. (2006b) Roost availability may constrain shorebird distribution: Exploring the energetic costs of roosting and disturbance around a tropical bay. Biological Conservation 133: 225–235.
Rogers, D., Rogers, K., Gosbell, K. & Hassell, C. (2006c) Causes of variation in population monitoring surveys: insights from non-breeding counts in North-Western Australia , 2004–2005. Stilt 50: 176–193.

36 • Intertidal Report
Rogers, D., Hassell, C., Oldland, J., Clemens, R., Boyle, A. & Rogers, K. (2009) Monitoring Yellow Sea Migrants in Australia (MYSMA). North-western Australian shorebird surveys and workshops, December 2008.
Rogers, D.I., Yang, H.-Y., Hassell, C.J., Boyle, A.N., Rogers, K.G., Chen, B., Zhang, Z.W. & Piersma, T. (2010) Red Knots (Calidris canutus piersmai and C.c.rogersi) depend on a small threatened staging area in Bohai Bay, China. Emu 110: 307–315.
Rönnbäck, P. (1999) The ecological basis for economic value of seafood production supported by mangrove ecosystems. Ecological Economics 29: 235–252.
Rosa, S., Granadeiro, J., Cruz, M. & Palmeirim, J. (2007) Invertebrate prey activity varies along the tidal cycle and depends on sediment drainage: Consequences for the foraging behaviour of waders. Journal of Experimental Marine Biology and Ecology: 353: 35–44.
Ross, P.S., Dungan, S.Z., Hung, S.K., Jefferson, T.A., Macfarquhar, C., Perrin, W.F., Riehl, K.N., Slooten, E., Tsai, J., Wang, J. Y., White, B.N., Würsig, Yang, B.S.C. & Reeves, R. R. (2010) Averting the Baiji syndrome: conserving habitat for Critically Endangered dolphins in Eastern Taiwan Strait. Aquatic Conservation: Marine and Freshwater Ecosystems 20: 685–694.
Round, P.D. (2006) Shorebirds in the Inner Gulf of Thailand. Stilt 50: 96–102.
RSPB (2009) Upland birds face displacement threat from poorly sited wind turbines. Nature’s Voice Media Centre Press Release. Available at: http://www.rspb.org.uk/media/releases/details.aspx?id=tcm:9-230416.
Scott, D.A. (ed.) (1989) A Directory of Asian Wetlands. IUCN, Gland, Switzerland.
Short, F.T., Polidoro, B., Livingstone, S.R., Carpenter, K.E., Bandeira, S., Sidik Bujang J., Calumpong, H.P., Carruthers, T.J.B., Coles, R.G., Dennison, W.C., Erftemeijer, P.L.A., Fortes, M.D., Freeman, A.S., Jagtap, T.G., Kamal, A.H.M., Kendrick, G.A., Kenworthy, W. J., La Nafie, Y.A., Nasution, I.M., Orth, R.J., Prathep, A., Sanciangco, J.C., van Tussenbroek, B., Vergara, S.G., Waycott, M. & Zieman, J.C. (2011) Extinction risk assessment of the world’s seagrass species. Biological Conservation 144: 1961–1971.
Smith, A.T, & Yan, X. (eds.) (2008) A Guide to the Mammals of China. Princeton University Press, Princeton/Oxford.
SOA (2009) Bulletin of Marine Environmental Quality of China. (In Chinese).Available at: http://www.soa.gov.cn/soa/index.htm.
Song, L.P. (2007) The problem in the environmental legal system and recommendations. (In Chinese). Security, Health and Environment 7(11): 2–3.
Song, X, Wang, H., Wang, W., Gu, H., Chan, S. & Jiang, H. (2002) Satellite tracking of post-nesting movements of Green Turtles Chelonia mydas from the Gangkou Sea Turtle National Nature Reserve, China, 2001. Marine Turtle Newsletter 97: 8–9.
Sourcebook (2012) Sourcebook of Protected Areas. BirdLife Vietnam programme. Available at: http://birdlifeindochina.org/birdlife/source_book/source_book/index_EN.html.
Sowana, A., Shrestha, R.P., Parkpian, P. & Pongquan, S. (2011) Influence of coastal land use on soil heavy-metal contamination in Pattani Bay, Thailand. Journal of Coastal Research 27: 252–262.
Sripanomyom, S., Round, P.D., Savini, T., Trisurat, Y. & Gale, G.A. (2011) Traditional salt-pans hold major concentrations of overwintering shorebirds in Southeast Asia. Biological Conservation 144: 526–537.
Syvitski, J.P.M., Kettner, A.J., Overeem, I., Hutton, E.W.H., Hannon, M.T., Brakenridge, G.R., Day, J., Vörösmarty, C., Saito, Y., Giosan, L. & Nicholls, R.J. (2009) Sinking deltas due to human activities. Nature Geoscience 2: 681–686.
Szabo, J.K., Butchart, S.H.M., Possingham, H.P. & Garnett, S.T. (2012) Adapting global biodiversity indicators to the national scale: A Red List Index for Australian birds. Biological Conservation 148: 61–68.
Taek Hyun & Schreurs, M.A. (eds.) (2003) The environmental dimension of Asian Security: conflict and cooperation over energy, resources and pollution. United States Institute of Peace/State of the Environment, DPRK/UNEP.
Tang, Q. (1993) Effects of the long-term physical and biological perturbations on the contemporary biomass yields of the Yellow Sea ecosystem. Pp. 79–93 in: Sherman, K., Alexander, L.M. & Gold, B.D.
(eds.) Large Marine Ecosystems: Stress, Mitigation and Sustainability. AAAS Press, Washington DC.
Tang, Q.S. (2006) Marine biological resources and habitats in China’s exclusive economic zone. Science Press, Beijing.
Tang, D.L., Di, B.P., Wei, G., Ni, I.-H., Oh, I.S. & Wang, S.F. (2006) Spatial, seasonal and species variations of harmful algal blooms in the South Yellow Sea and East China Sea. Hydrobiologia 568: 245–253.
TEEB (2010) The Economics of Ecosystems and Biodiversity for Local and Regional Planners.
Titelman, J. & Hansson, L.J. (2006) Feeding rates of the jellyfish Aurelia aurita on fish larvae. Marine Biology 149: 297–306.
Tookwinas, S. (1998) Coastal Planning of Shrimp Farming: Carrying Capacity, Zoning and Integrated Planning in Thailand. Available at: http://aciar.gov.au/files/node/2196/pr90chapter21.pdf.
Tordoff, A.W. (ed.) (2002) Directory of Important Bird Areas in Vietnam: key sites for conservation. BirdLife International in Indochina/Institute of Ecology and Biological Resources, Hanoi.
Toril, K., Hoshi, T., Kano, T., Cho, B.J., Lim, B.H. & Choi, M.S. (2010) Investigation on tidal land reclamation in Korea using satellite image data. Geospatial World. Available at: http://www.geospatialworld.net.
Trainor, C.R., Santana, F., Pinto, P., Almeida, F.X., Safford, R. & Grimmet, R. (2008) Birds, birding and conservation in Timor-Leste. Birding Asia 9: 16–45.
UNDP/GEF (2009) Strategic Action Programme (SAP) for the Yellow Sea Large Marine Ecosystem (YSLME). Reducing environmental stress in the Yellow Sea Large Marine Ecosystem. Available at: http://www.yslme.org.
van Gils, J.A., Piersma, T., Dekinga, A., Spaans, B. & Kraan, C. (2006) Shellfish-dredging pushes a flexible avian toppredator out of a protected marine ecosystem. PLoS Biology 4: 2399–2404.
Verheugt, W.J.M., Skov, H. & Danielsen, F. (1993) Notes on the birds of the tidal lowlands and floodplains of South Sumatra province, Indonesia. Kukila 6: 53–84.
Verkuil, Y.I., Karlionova, N., Rakhimberdiev, E.N., Jukema, J., Wijmenga, J.J., Hooijmeijer, J.C.E.W., Pinchuk, P., Wymenga, E., Baker, A.J. & Piersma, T. (2012) Losing a staging area: Eastward redistribution of Afro-Eurasian ruffs is associated with deteriorating fuelling conditions along the western flyway. Biological Conservation 149: 51–59.
Wallace, B. P., Dimatteo, A.D., Bolten, A.B., Chaloupka, M.Y., Hutchinson, B.J., Abreu-Grobois, F.A., Mortimer, J.A., Seminoff, J.A., Amorocho, D., Bjorndal, K.A., Bourjea, J., Bowen, B.W., Briseño Dueñas, R., Casale, P., Choudhury, B.C., Costa, A., Dutton, P.H., Fallabrino, A., Finkbeiner, E.M., Girard, A., Girondot, M., Hamann, M., Hurley, B.J., López-Mendilaharsu, M., Marcovaldi, M.A., Musick, J.A., Nel, R., Pilcher, N. J., Troëng, S., Witherington, B. & Mast, R.B. (2011) Global Conservation Priorities for Marine Turtles. PLoS ONE 6: e24510.
Wang, H. (2010) Five awkward situations in development of marine economy. Speech at meeting on experimental activities of development of national marine economy. (In Chinese).
Wang, H., Bi, N., Saito, Y., Wang, Y., Sun, X., Zhang, J. & Yang, Z. (2010a) Recent changes in sediment delivery by the Huanghe (Yellow River) to the sea: causes and environmental implications in its estuary. Journal of Hydrology 391: 302–313.
Wang, X., Chen, W., Zhang, L., Jin, D. & Lu, C. (2010b) Estimating the ecosystem service losses from proposed land reclamation projects: A case study in Xiamen. Ecological Economics 69: 2549–2556.
Wang, Y., Wang, T., Li, A., Fu, J., Wang, P., Zhang, Q. & Jiang, G. (2008) Selection of bioindicators of polybrominated diphenyl ethers, polychlorinated biphenyl, and organochlorine pesticides in molluscs in the Chinese Bohai Sea. Environmental Science and Technology,42: 7159–7165.
Warnock, N. (2010) Stopover vs. staging: the difference between a hop and a jump. Journal of Avian Biology 41: 621–626.
Watson, R. & Pauly, D. (2001) Systematic distortions in world fisheries catch trends. Nature 414: 534–536.
Waycott, M., Duarte, C.M., Carruthers, T.J.B., Orth, R.J., Dennison, W.C., Olyarnik, S., Calladine, A., Fourqurean, J.W., Heck, K.L., Hughes, A.R., Kendrick, G.A., Kenworthy, W.J., Short, F.T. & Williams, S.L. (2009) Accelerating loss of seagrasses across the globe threatens coastal ecosystems. Proceedings of the National Academy of Sciences of the United States of America 106: 12377–12381.

Intertidal Report • 37
Wei, H., He, Y., Li, Z. & Wang, H. (2007) Summer hypoxia adjacent to the Changjiang Estuary. Journal of Marine Systems 69: 292–303.
Wen, Y.C. (2012) Coastal zone management in Taiwan: a review. Ocean & Coastal Management 38: 119–132.
Wilcove, D.S. & Wikelski, M. (2008) Going, going, gone: Is animal migration disappearing? PLoS Biology 6: 1361–1364.
Wilkinson, C. & Souter, D. (2008) Status of Caribbean coral reefs after bleaching and hurricanes in 2005. Global Coral Reef Monitoring Network/Reef and Rainforest Research Centre, Townsville.
Wilson, H.B., Kendall, B.E., Fuller, R.A., Milton, D.A. & Possingham, H.P. (2011) Analyzing variability and the rate of decline of migratory shorebirds in Moreton Bay, Australia. Conservation Biology 4: 758–766.
Wilson, M.A., Costanza, R., Boumans, R. & Liu, S. (2005) Integrated assessment and valuation of ecosystem goods and services provided by coastal systems. Pp. 1–24 in: Wilson, J.G. (ed.) The Intertidal Ecosystem: The Value of Ireland’s Shores. Royal Irish Academy, Dublin.
Wolanski, E., Chicharo, L. & Chicharo, M.A. (2008) Estuarine ecohydrology. Pp. 1413–1422 in: Jorgensen, S. & Fath, D. (eds.) Encyclopedia of Ecology, Vol. 2. Elsevier, Oxford, UK.
Woodley, K. (2009) Godwits: long-haul champions. Penguin Group, Auckland, New Zealand.
World Bank (2006) Environmental Impact Assessment Regulations and Strategic Environmental Assessment Requirements – Practices and Lessons Learned in East and Southeast Asia. Environment Social Development, Safeguard Dissemination Note No.2. Available at: http://go.worldbank.org/PBVROB95G0.
WWF, Korea Ocean Research and Development Institute (KORDI), Korea Environment Institute (KEI) (2006) The Yellow Sea Ecoregion – A Global Biodiversity Treasure. Available at: http://www.wwf.or.jp/activities/lib/pdf/200710y-seamap01e.pdf.
Xian, W., Kang, B. & Liu, R. (2005) Jellyfish blooms in the Yangtze Estuary. Science 307: 41.
Yan, X., Wang Sung, W. & Schei, P. (eds.) (2004) China’s Protected Areas. Tsinghua University Press, Beijing.
Yang, H.-Y., Chen, B. & Zhang, Z.-W. (2008) Seasonal changes in numbers and species composition of migratory shorebirds in northern Bohai Bay, China. Wader Study Group Bulletin 115: 133–139
Yang, H.-Y. Chen, B., Barter, M., Piersma, T., Zhou, C.-F., Li, F.-S. & Zhang, Z.-W. (2011a) Impacts of tidal land reclamation in Bohai Bay, China: ongoing losses of critical Yellow Sea waterbird staging and wintering sites. Bird Conservation International 21: 241–259.
Yang, Z., Ji, Y., Bi, N., Lei, K. & Wang, H. (2011b) Sediment transport off the Huanghe (Yellow River) delta and in the adjacent Bohai Sea in winter and seasonal comparison. Estuarine Coast Shelf Science 93: 173–181.
Yeap, C.A., Sebastian, A.C. & Davison, G.W.H. (eds.) (2007) Directory of Important Bird Areas in Malaysia: Key Sites for Conservation. MNS Conservation Publication No. 8. Kuala Lumpur: Malaysian Nature Society.
Yee, A.T.K, Ang, W.F., Teo, S., Liew, S.C. & Tan, H.T.W. (2010) The present extent of mangrove forests in Singapore. Nature in Singapore 3: 139–145.
Yi, J-Y. (2003) Critical habitat in the Yellow Sea from a Korean perspective. Pp. 188 in: Straw, P. (ed.) 2004. Status and Conservation of Shorebirds in the East Asian-Australasian Flyway; Proceedings of the Australasian
Shorebirds Conference 13–15 December 2003, Canberra, Australia. Wetlands International Global Series 18/ International Wader Studies 17/ Australasian Wader Studies Group and Wetlands International. Sydney, Oceania.
Yi, J-Y. (2004) Status and habitat characteristics of migratory shorebirds in Korea. Pp. 87–103 in: The Proceedings of the 2004 International Symposium on Migratory Birds, Gunsan, Korea. Ornithological Society of Korea.
Yim, W.W.S. (1995) Implications of sea-level rise for Victoria Harbour, Hong Kong. Journal of Coastal Research S1(14): 167–189.
Yu, L.Z. & Yan, X. (2002) Invasive Alien Species in China. China Forestry Publishing House, Beijing. (In Chinese).
Yu, W.W., Chen, B., & Zhang, L.P. (2008) Cumulative effects of reclamation on ecosystem services of tidal flat wetland – a case in the Xinghua Bay, Fujian, China. Marine Science Bulletin 1: 88–94. (In Chinese).
Yun, S.S. & Kim, S.O. (eds.) (2005) Natural Protected Areas in the DPRK. MAB National Committee of DPR Korea, Pyongyang, DPRK.
Yusoff, F.M., Shariff, M. & Gopinath, N. (2006) Diversity of Malaysian aquatic ecosystems and resources. Aquatic Ecosystem Health & Management 9: 119–135.
Zhang, B., Li, W. & Sun, G. (2011) Biodiversity impact assessment of industrial development plans for China’s Beibu Gulf Economic Zone. APPEEC ‘11 Proceedings of the 2011 Asia-Pacific Power and Energy Engineering Conference.
Zhang, X.L., Li, P.Y., Li, P. & Xu, X.Y. (2005) Present conditions and prospects of study on coastal wetland in China. (In Chinese).Advances in Marine Science 1: 87–95.
Zhen, X.Q., Chen. Y.J., Luo, M.B. & Wang, Y.L. (2006). Preliminary study of the restoration of benthos in the Yangtze River Estuary. Journal of Agro-Environment Science 2: 373–376.
Zhou, M.J., Zhu, M.Y. & Zhang, J. (2001) Status of harmful algal blooms and related research activities in China. Chinese Bulletin of Life Sciences 13: 54–59.
Zhou, Y.H. (2004) Study on Fujian’s intertidal habitat land reclamation using RS and GIS. Master Thesis, Fujian Normal University.
Zhu, S.Y., Li, Z.W., Lu, J.Z., Shan, K. & Barter, M.A. (2001) Northward migration of shorebirds through the Huang He Delta, Shandong province, in the 1997–1999 period. Stilt 38: 33–38.
Zöckler, C. & Bunting, G. (2006) Bangladesh 2006. Expedition report. Deutsche Ornithologen Gesellschaft (D-OG)/Arcoana Ecological Consulting, Cambrigde, UK.
Zöckler, C., Balachandran, S., Bunting, G.C., Fanck, M., Kashiwagi, M., Lappo, E.G., Maheswaran, G., Sharma, A., Syroechkovskiy, E.E. & Webb, K. (2005) The Indian Sunderbans: an important wintering site for Siberian waders. Wader Study Group Bulletin 108: 42–46.
Zöckler, C., Htin Hla, T., Clark, N., Syroechkovskiy, E.E., Yakushev, N., Daengphayon, S. & Robinson, R. (2010a) Hunting in Myanmar is probably the main cause of the decline of the Spoon-billed Sandpiper Calidris pygmeus. Wader Study Group Bulletin 117: 1–8.
Zöckler, C., Syroechkovskiy, E.E. & Atkinson, P.W. (2010b) Rapid and continued population decline in the Spoon-billed Sandpiper Eurynorhynchus pygmeus indicates imminent extinction unless conservation action is taken. Bird Conservation International 20: 95–111.

38 • Intertidal Report
Appendix 1. List of globally threatened and Near Threatened waterbird species of intertidal habitats in East Asia. Species are listed in decreasing order of conservation urgency, and in alphabetical order. The relative importance of the EAAF for a species is expressed from a global perspective (% global population). For identification of key areas the biogeographical shorebird population sizes were used (Appendix 2). Shorebirds (sandpipers, plovers, snipes and allies) are indicate by bold Latin names.
Species Common name IUCN
ca
tego
ry
Grou
p
IUCN Red List criteriaPopulation size*
% global population in EAAF**
% shorebird flyway population in Yellow Sea**
Reason for listing on the IUCN Red List
Sterna bernsteini Chinese Crested Tern
CR SN C2a(ii);D <50 100% Tiny population which is declining owing to egg-collection, disturbance and the loss of coastal wetlands.
Eurynorhynchus pygmeus
Spoon-billed Sandpiper
CR WS A2abcd+3bcd+4abcd; C2a(i)
140–480 >95% significant Extremely small population, and an extremely rapid population reduction. Habitat loss in its breeding, passage and non-breeding grounds, which is compounded by disturbance, hunting and the effects of climate change. Fledging success and juvenile recruitment are very low, leading to fears that the population is ageing rapidly.
Platalea minor Black-faced Spoonbill
EN WS C2a(i) 1,830–2,700 100% Very small population, split into several small subpopulations, that is believed to be undergoing a continuing decline owing to loss of habitat to industrial development, land reclamation and pollution.
Heliopais personatus
Masked Finfoot EN WR A2cd+3cd+4cd 2,500–10,000
100% This elusive species has a very small, and very rapidly declining population as a result of the ongoing loss and degradation of wetlands and especially riverine lowland forest in Asia.
Ciconia boyciana Oriental Stork EN WR C2a(ii) 3,000 100% Very small population, which has undergone a rapid decline that is projected to continue in the future, based on current levels of deforestation, wetland reclamation for agriculture, overfishing and disturbance.
Grus japonensis Red-crowned Crane
EN WR C1 1,700 100% Very small population. Population in Japan is stable but the mainland Asian population continues to decline owing to loss and degradation of wetlands through conversion to agriculture and industrial development.
Tringa guttifer Spotted Greenshank
EN WS C2a(i) 400–600 >95% significant Very small population which is declining as a result of the development of coastal wetlands throughout its range, principally for industry, infrastructure projects and aquaculture.
Appendices

Intertidal Report • 39
Egretta eulophotes Chinese Egret VU WS C2a(i) 2,600–3,400
100% Small, declining population, principally as a result of the reclamation of tidal mudflats and estuarine habitats for industry, infrastructure development and aquaculture. These factors qualify it as Vulnerable.
Pelecanus crispus Dalmatian Pelican
VU WS A2ce+3ce+4ce 10,000–13,900
<1% Conservation measures have resulted in a population increase in Europe. However, rapid population declines in the remainder of its range are suspected to be continuing and therefore the species is listed as Vulnerable.
Numenius madagascariensis
Far Eastern Curlew
VU WS A4bcd 38,000 100% Rapid population decline which is suspected to have been primarily driven by habitat loss and deterioration. Further proposed reclamation projects are predicted to cause additional declines in the future.
Calidris tenuirostris
Great Knot VU WS A4bcd 290,000 >90% significant Rapid population decline caused by the reclamation of nonbreeding stopover grounds, and under the assumption that further proposed reclamation projects will cause additional declines in the future.
Rynchops albicollis Indian Skimmer VU WR A2cde+3cde+4cde 6,000–10,000
10% Population is undergoing a rapid decline as a result of widespread degradation and disturbance of lowland rivers and lakes
Leptoptilos javanicus
Lesser Adjutant VU WR A2cd+3cd+4cd 3,000–4,100 60% Small population is rapidly declining, in particular as a result of hunting pressure.
Mycteria cinerea Milky Stork VU WR A2cd+3cd+4cd 5,000 100% Rapid population decline owing to ongoing loss of coastal habitat, human disturbance, hunting and trade. However, further data are needed on rates of decline in Sumatra, its stronghold.
Anser cygnoides Swan Goose VU WR A2bcd+3bcd+4bcd 60,000–80,000
100% Poor breeding success in recent years owing to drought, and considerable pressure from habitat loss, particularly owing to agricultural development, and unsustainable levels of hunting. Comprehensive surveys in the non-breeding range have failed to detect evidence of declines of the magnitude predicted.
Species Common name IUCN
ca
tego
ry
Grou
p
IUCN Red List criteriaPopulation size*
% global population in EAAF**
% shorebird flyway population in Yellow Sea**
Reason for listing on the IUCN Red List

40 • Intertidal Report
Larus relictus Relict Gull VU SN D2 3,000–4,100 100% Small, fluctuating population, breeding at a very small number of wetlands. Susceptible to stochastic effects and human impacts. Also thought to be declining as a result of reclamation of coastal wetlands for development.
Larus saundersi Saunders’s Gull VU SN A3c 7,100–9,600 100% Small, declining population. The rate of decline is likely to increase over the next three generations (18 years) as a result of land reclamation on intertidal flats and disturbance at colonies.
Limnodromus semipalmatus
Asian Dowitcher NT WS – 23,000 90% 40% Quite widespread, but moderately small population, thought to be in decline, owing primarily to destruction of its non-breeding grounds. An even more rapid population decline may take place in the future owing to climate change.
Esacus giganteus Beach Thick-knee
NT WS – 6,000 80% 0% This species qualifies as Near Threatened because it has a small population. If the population is found to be in decline it might qualify for uplisting to a higher threat category.
Limosa limosa Black-tailed Godwit
NT WS – 630,000–805,000
20–25% 30% Widespread and has a large global population, its numbers have declined rapidly in parts of its range owing to changes in agricultural practices. Overall, the global population is estimated to be declining.
Numenius arquata Eurasian Curlew NT WS – 770,000–1,065,000
40% 93% Common in many parts of its range, and determining population trends is problematic. Nevertheless, declines have been recorded in several key populations and overall a moderately rapid global decline is estimated.
Charadrius peronii Malaysian Plover NT WS – 10,000–25,000
100% 0% Likely to have a moderately small population which, owing to the development pressures on the coastal areas it inhabits, is likely to be undergoing a decline.
Charadrius javanicus
Javan Plover NT WR – unknown 100% 0% Narrow range in which development and recreation are putting pressure on critical breeding habitats. It is likely to have a moderately small population, and this is thought to be declining.
Appendix 1 cont’d. List of globally threatened and Near Threatened waterbird species of intertidal habitats in East Asia.
Species Common name IUCN
ca
tego
ry
Grou
p
IUCN Red List criteriaPopulation size*
% global population in EAAF**
% shorebird flyway population in Yellow Sea** Reason for listing

Intertidal Report • 41
Species Common name IUCN
ca
tego
ry
Grou
p
IUCN Red List criteriaPopulation size*
% global population in EAAF**
% shorebird flyway population in Yellow Sea**
Reason for listing on the IUCN Red List
Gavia adamsii Yellow-billed Loon
NT SN – 16,000–32,000
20% Undergoing a moderately rapid population decline owing to unsustainable subsistence harvest. However, accurate data is lacking and further surveys need to be conducted to quantify the current rate of harvest.
Limosa lapponica Bar-tailed Godwit
LC† WS – 1,100,000–1,200,000
28% >95%† Rapidly declining; 100% of the baueri and menzbieri populations are dependent on the Yellow Sea (Battley et al. 2012).
Calidris ferruginea Curlew Sandpiper
LC† WS – 1,800,000–1,900,000
10% 10% Rapidly declining.
Charadrius leschenaultii
Greater Sand Plover
LC† WS – 180,000–360,000
46% 50% Rapidly declining.
Heteroscelus brevipes
Grey-tailed Tattler
LC† WS – 40,000 100% 4% Rapidly declining.
Charadrius mongolus
Mongolian Plover LC† WS – 310,000–390,000
41% 23% Rapidly declining.
Calidris canutus Red Knot LC† WS – 1,100,000 15% 63% Rapidly declining; rogersi and piersmai populations strongly dependent on the Yellow Sea (Battley et al. 2005, Yang et al. 2011).
Arenaria interpres Ruddy Turnstone LC† WS – 460,000–800,000
6% 13% Rapidly declining.
Xenus cinereus Terek Sandpiper LC† WS – 160,000–1,200,000
18% 27% Rapidly declining.
Pluvialis squatarola
Grey Plover LC† WS – 692,000–692,000
18% 84% Rapidly declining.
Key*Source: BirdLife Data Zone (www.birdlife.org/datazone) and Waterbird Population Estimates (WPE; wpe.wetlands.org).**Source: Barter 2002; †Battley et al. 2012LC† = candidates to be uplisted to NT or VU on the 2013 IUCN Red ListWS = Waterbird-specialist intertidalWR = Waterbird-regularly occurs in intertidalWO = Waterbird-occasional visitor to intertidalSN = Seabird neritic (coastal)

42 • Intertidal Report
Appendix 2. List of key areas for waterbirds, and particularly shorebirds, in the EAAF, with specific threats. Key areas were identified with waterbird population data from 388 intertidal sites in all coastal East and Southeast Asian countries; birds as top trophic predators are indicators of intertidal flat biodiversity. For each key area is given: (green columns) Protected Areas, Ramsar Sites and Important Bird Areas (IBA); (orange columns) Biodiversity of waterbirds, for site
Key area and protection status Status of waterbirds dependent on intertidal# Loss of tidal flats in last decade Habitat change and land threats*Other
threats Other information
Coun
try/
Terr
itory
Key areaProtected Sites within Key Area*** Pr
otec
ted
area
cov
erag
e (h
a)
Impo
rtan
t Bird
Are
a (IB
A)
Num
ber o
f Nea
r Thr
eate
ned
and
thre
aten
ed s
peci
es
Shor
ebird
pop
ulat
ions
m
eetin
g 1%
crit
erio
n†
Min
imum
reco
rded
pop
ulat
ion
size
of s
hore
bird
s§
Key
seas
on^
Tida
l flat
siz
e ca
. 19
90–2
000
(ha)
Tida
l flat
siz
e cu
rren
t (ha
)
Tida
l flat
lost
(ha,
%)
Land reclamation Erosion/accretion Changes of habitat natureSee
Key^^ Data references**Specifically named sites and associated areas
Bang
lade
sh
North Bay of Bengal Coast
Sonadia Island ECA – IBA candidate & Ramsar candidate; Nijum Dweep NP; Sundarbans – Ramsar Site
601,
700
BD010 BD011 BD012 BD016
8 15 207,654
NB ~68,000 ••• •••
Tidal flat lost through Coastal Embankment Project (CEP) (Kabir & Hossain 2007). Hatiya and Sonadia Island (Chowdhury et al. 2011) have been proposed as seaport site.
Sediment transport and replacememt create new islands and change channels and flow of delta arms (Zöckler & Bunting 2006).
Mudflats converted to shrimp ponds, saltpans and mangrove plantations. Urgent action is required to mitigate shorebird hunting (Chowdhury et al. 2011). Pollution on Patenga beach due to port and ship breaking (S. Chowdhury, pers. comm.).
H P D
Islam 2001, Zöckler et al. 2005, Zöckler
& Bunting 2006, Kabir & Hossain
2007, Zöckler et al. 2010b, Chowdhury
et al. 2011
Ganges-Brahmaputra-Meghna Delta: Damar Char, Hatiya Island, Nijum Dweep, Patenga Beach, Char Shahajalal, Char Kukri mukri, Sonar Char. Associated areas: Sonodia Island (Cox’s Bazar), Sundarbans, shared with Sundarbans, India
9 16 210,770 (+40,000 in Sundarbans)
Chin
a (in
clud
ing
Hong
Kon
g, S
AR C
hina
)
Bohai Bay – north-west Bohai Sea, China
no protected areas 0 CN311
– 15 53,425
N S ~90,000 37,000
-31,300 (to 1993) -21,800 (to 2010) (59% loss)
Further land reclamation plans for 34,700 ha of tidal flat would affect 62% of global populations of red knots and 56% of the global population of Relict Gulls (Yang et al. 2011a).
••• ••• P D
Barter et al. 2003, Bamford et al. 2008, Rogers et al. 2010, Yang et al. 2008,
2011a
Beidaihe, North Bo Hai Wan, Northwest Bo Hai Wan, Shi Jiu Tuo/Daqing He, Tianjin/Tangshan/Caofeidian8 21 148,791
Jiangsu and Shanghai coast, Yellow Sea, eastern China
Chongming Dongtan Nature Reserve; Yancheng National National Nature Reserve and Dafeng Milu National Nature Reserve – Ramsar Sites; Jiuduansha NNR
563,
600
CN367 CN375
8 35 164,243
N=S NB
Yancheng ~100,000; Chongming Jiuduansha NNR 279,600 ha
Yancheng ~40,000; Chongming Jiuduansha NNR 236,851 ha (2007)
Total ~100,000 (60% and 15% loss)
Chongming: 2.19 million ha (50% wetland) enclosed by seawall; >15,000 ha intertidal has been developed, before 1990s in agriculture, after 1990s in aquaculture (Ma et al. 2009). Yancheng: from 1988 salt flats from >40% to <20% of reserve (Ke et al. 2011)). Rudong: wind farms and reclamation plans (China Coastal Waterbird Census Team 2011).
Reductions of sediment contributions of Yangtze River impacts extent of tidal flats (Cao et al. 2009).
Chongming: reclaimed land for farmland, fishponds, road systems more than doubled; 30% of intertidal planted with invasive Spartina (Ma et al. 2009). Yancheng: shellfish harvest (Barter et al. 2001); managed for Red-crowned Cranes. Rudong: pollution from chemical industry; invasive Spartina; restricted roost areas (China Coastal Waterbird Census Team 2011).
P D
Barter et al. 1997, Barter et al. 2001, 2005b, Bamford
et al. 2008, Ma et al. 2009, Cao et al.
2009, China Coastal Waterbird Census Team 2011, Ke et
al. 2011
Chongming Dongtan Nature Reserve, Dongsha Islands, Jiuduansha Nature Reserve, Rudong, Yancheng Nature Reserve.
18 38 «240,911
Laizhou Bay – south Bohai Sea, China
Yellow River (Huang He) Delta NR 15
3,00
0
CN327 CN328
4 16 134,893
N S ~43,000 ~20,00023,000 (53% loss)
Since 1980s, major reductions in tidal flat area and rates of loss are accelerating (Cao et al. 2009).
Sediment contributions of Yellow River declined by 70% leading to erosion of the delta and tidal flats (Cao et al. 2009).
••• P D
Zhu et al. 2001, Barter & Xu 2004, Barter et al. 1998, 2005a, Bamford et al. 2008, Cao et al.
2009
Laizhou Wan, South Bo Hai Wan, Yellow River (Huang He Delta) Nature Reserve
7 19 196,404
Liaodong Bay – north-east Bohai Sea, China
Shuangtaizihekou National Nature Reserve (Shuangtai Estuary) – Ramsar Site (8
0,00
0) 1
28,0
00
CN052
13 12 65,855
N S ~42,000 ~29,00013,000 (31% loss)
Tidal flat claimed to grow Cordgrass (Spartina sp.) (D. Melville, pers. comm.).
Sedimentation rates insufficient for new saltmarsh generation (D. Melville, pers. comm.).
Reclamation to grow Cordgrass. Shuangtaizihekou NNR managed for Red-crowned Crane breeding grounds (D . Melville, pers. comm.). Intensive reed harvesting, aquaculture and oil extraction.
P DBarter et al. 2000a, Bamford et al. 2008
Linghekou, Shuangtaizihekou NNR and Inner Golf of Liaodong
13 12 97,793
Mai Po and Inner Deep Bay (or Shenzhen Bay) – China, Hong Kong, SAR China
Mai Po Marshes & Inner Deep Bay – Ramsar Site; Futian Nature Reserve 1,
513;
368
HK001 CN496
20 14 54,457
N NB S 3,150 2,960 190
No land reclamation. Intertidal mudflats and mangroves in Ramsar Site are listed as Restricted Area under the Wild Animals Protection Ordinance (Lee 1999).
•••
Ponds function as de facto nature reserves yet allow for resource harvest and subsistence use by local people (http://www.ecf.gov.hk/en/approved/ncmap.html).
–
Lee 1999, Bamford et al. 2008, Anon. 2009, 2011, China Coastal Waterbird Census Team 2011
Futian Nature Reserve, Inner Deep Bay, Shenzhen River catchment area. Associated area (at 50 km): Taipa-Coloane Wetland (IBA:MO001)
11 9 51,045
Yalu Jiang Estuary and associated areas – China, DPR Korea
Yalu Jiang National Nature Reserve 10
8,05
7
CN062 13 10 174,179 N ~90,000 ~80,00010,000 (10.5% loss)
Extensive past reclamation (Barter et al. 2000b) and ongoing (D. Melville, pers. comm.). Used by 70% of flyway’s Bar-tailed Godwits (Barter & Riegen 2003).
•••Roost sites in fish ponds are critical (Barter et al. 2000b)
P D
Barter et al. 2000b, Barter & Riegen
2003, Bamford et al. 2008
Yalu Jiang Estuary (Dandong), Ryonghung Gang Estuary?

Intertidal Report • 43
with highest biodiversity (first row, bold) and for total area (second row); (yellow columns) Loss of tidal flat in last decades, which is size ca. 1990–2000 minus current size; (grey columns) Habitat change, land threats, and other threats (in grey); (blue columns) Names of specifically named sites in key area, and associated sites (sites in bold are sites with highest biodiversity value).
Key area and protection status Status of waterbirds dependent on intertidal# Loss of tidal flats in last decade Habitat change and land threats*Other
threats Other information
Coun
try/
Terr
itory
Key areaProtected Sites within Key Area*** Pr
otec
ted
area
cov
erag
e (h
a)
Impo
rtan
t Bird
Are
a (IB
A)
Num
ber o
f Nea
r Thr
eate
ned
and
thre
aten
ed s
peci
es
Shor
ebird
pop
ulat
ions
m
eetin
g 1%
crit
erio
n†
Min
imum
reco
rded
pop
ulat
ion
size
of s
hore
bird
s§
Key
seas
on^
Tida
l flat
siz
e ca
. 19
90–2
000
(ha)
Tida
l flat
siz
e cu
rren
t (ha
)
Tida
l flat
lost
(ha,
%)
Land reclamation Erosion/accretion Changes of habitat natureSee
Key^^ Data references**Specifically named sites and associated areas
Bang
lade
sh
North Bay of Bengal Coast
Sonadia Island ECA – IBA candidate & Ramsar candidate; Nijum Dweep NP; Sundarbans – Ramsar Site
601,
700
BD010 BD011 BD012 BD016
8 15 207,654
NB ~68,000 ••• •••
Tidal flat lost through Coastal Embankment Project (CEP) (Kabir & Hossain 2007). Hatiya and Sonadia Island (Chowdhury et al. 2011) have been proposed as seaport site.
Sediment transport and replacememt create new islands and change channels and flow of delta arms (Zöckler & Bunting 2006).
Mudflats converted to shrimp ponds, saltpans and mangrove plantations. Urgent action is required to mitigate shorebird hunting (Chowdhury et al. 2011). Pollution on Patenga beach due to port and ship breaking (S. Chowdhury, pers. comm.).
H P D
Islam 2001, Zöckler et al. 2005, Zöckler
& Bunting 2006, Kabir & Hossain
2007, Zöckler et al. 2010b, Chowdhury
et al. 2011
Ganges-Brahmaputra-Meghna Delta: Damar Char, Hatiya Island, Nijum Dweep, Patenga Beach, Char Shahajalal, Char Kukri mukri, Sonar Char. Associated areas: Sonodia Island (Cox’s Bazar), Sundarbans, shared with Sundarbans, India
9 16 210,770 (+40,000 in Sundarbans)
Chin
a (in
clud
ing
Hong
Kon
g, S
AR C
hina
)
Bohai Bay – north-west Bohai Sea, China
no protected areas 0 CN311
– 15 53,425
N S ~90,000 37,000
-31,300 (to 1993) -21,800 (to 2010) (59% loss)
Further land reclamation plans for 34,700 ha of tidal flat would affect 62% of global populations of red knots and 56% of the global population of Relict Gulls (Yang et al. 2011a).
••• ••• P D
Barter et al. 2003, Bamford et al. 2008, Rogers et al. 2010, Yang et al. 2008,
2011a
Beidaihe, North Bo Hai Wan, Northwest Bo Hai Wan, Shi Jiu Tuo/Daqing He, Tianjin/Tangshan/Caofeidian8 21 148,791
Jiangsu and Shanghai coast, Yellow Sea, eastern China
Chongming Dongtan Nature Reserve; Yancheng National National Nature Reserve and Dafeng Milu National Nature Reserve – Ramsar Sites; Jiuduansha NNR
563,
600
CN367 CN375
8 35 164,243
N=S NB
Yancheng ~100,000; Chongming Jiuduansha NNR 279,600 ha
Yancheng ~40,000; Chongming Jiuduansha NNR 236,851 ha (2007)
Total ~100,000 (60% and 15% loss)
Chongming: 2.19 million ha (50% wetland) enclosed by seawall; >15,000 ha intertidal has been developed, before 1990s in agriculture, after 1990s in aquaculture (Ma et al. 2009). Yancheng: from 1988 salt flats from >40% to <20% of reserve (Ke et al. 2011)). Rudong: wind farms and reclamation plans (China Coastal Waterbird Census Team 2011).
Reductions of sediment contributions of Yangtze River impacts extent of tidal flats (Cao et al. 2009).
Chongming: reclaimed land for farmland, fishponds, road systems more than doubled; 30% of intertidal planted with invasive Spartina (Ma et al. 2009). Yancheng: shellfish harvest (Barter et al. 2001); managed for Red-crowned Cranes. Rudong: pollution from chemical industry; invasive Spartina; restricted roost areas (China Coastal Waterbird Census Team 2011).
P D
Barter et al. 1997, Barter et al. 2001, 2005b, Bamford
et al. 2008, Ma et al. 2009, Cao et al.
2009, China Coastal Waterbird Census Team 2011, Ke et
al. 2011
Chongming Dongtan Nature Reserve, Dongsha Islands, Jiuduansha Nature Reserve, Rudong, Yancheng Nature Reserve.
18 38 «240,911
Laizhou Bay – south Bohai Sea, China
Yellow River (Huang He) Delta NR 15
3,00
0
CN327 CN328
4 16 134,893
N S ~43,000 ~20,00023,000 (53% loss)
Since 1980s, major reductions in tidal flat area and rates of loss are accelerating (Cao et al. 2009).
Sediment contributions of Yellow River declined by 70% leading to erosion of the delta and tidal flats (Cao et al. 2009).
••• P D
Zhu et al. 2001, Barter & Xu 2004, Barter et al. 1998, 2005a, Bamford et al. 2008, Cao et al.
2009
Laizhou Wan, South Bo Hai Wan, Yellow River (Huang He Delta) Nature Reserve
7 19 196,404
Liaodong Bay – north-east Bohai Sea, China
Shuangtaizihekou National Nature Reserve (Shuangtai Estuary) – Ramsar Site (8
0,00
0) 1
28,0
00
CN052
13 12 65,855
N S ~42,000 ~29,00013,000 (31% loss)
Tidal flat claimed to grow Cordgrass (Spartina sp.) (D. Melville, pers. comm.).
Sedimentation rates insufficient for new saltmarsh generation (D. Melville, pers. comm.).
Reclamation to grow Cordgrass. Shuangtaizihekou NNR managed for Red-crowned Crane breeding grounds (D . Melville, pers. comm.). Intensive reed harvesting, aquaculture and oil extraction.
P DBarter et al. 2000a, Bamford et al. 2008
Linghekou, Shuangtaizihekou NNR and Inner Golf of Liaodong
13 12 97,793
Mai Po and Inner Deep Bay (or Shenzhen Bay) – China, Hong Kong, SAR China
Mai Po Marshes & Inner Deep Bay – Ramsar Site; Futian Nature Reserve 1,
513;
368
HK001 CN496
20 14 54,457
N NB S 3,150 2,960 190
No land reclamation. Intertidal mudflats and mangroves in Ramsar Site are listed as Restricted Area under the Wild Animals Protection Ordinance (Lee 1999).
•••
Ponds function as de facto nature reserves yet allow for resource harvest and subsistence use by local people (http://www.ecf.gov.hk/en/approved/ncmap.html).
–
Lee 1999, Bamford et al. 2008, Anon. 2009, 2011, China Coastal Waterbird Census Team 2011
Futian Nature Reserve, Inner Deep Bay, Shenzhen River catchment area. Associated area (at 50 km): Taipa-Coloane Wetland (IBA:MO001)
11 9 51,045
Yalu Jiang Estuary and associated areas – China, DPR Korea
Yalu Jiang National Nature Reserve 10
8,05
7
CN062 13 10 174,179 N ~90,000 ~80,00010,000 (10.5% loss)
Extensive past reclamation (Barter et al. 2000b) and ongoing (D. Melville, pers. comm.). Used by 70% of flyway’s Bar-tailed Godwits (Barter & Riegen 2003).
•••Roost sites in fish ponds are critical (Barter et al. 2000b)
P D
Barter et al. 2000b, Barter & Riegen
2003, Bamford et al. 2008
Yalu Jiang Estuary (Dandong), Ryonghung Gang Estuary?
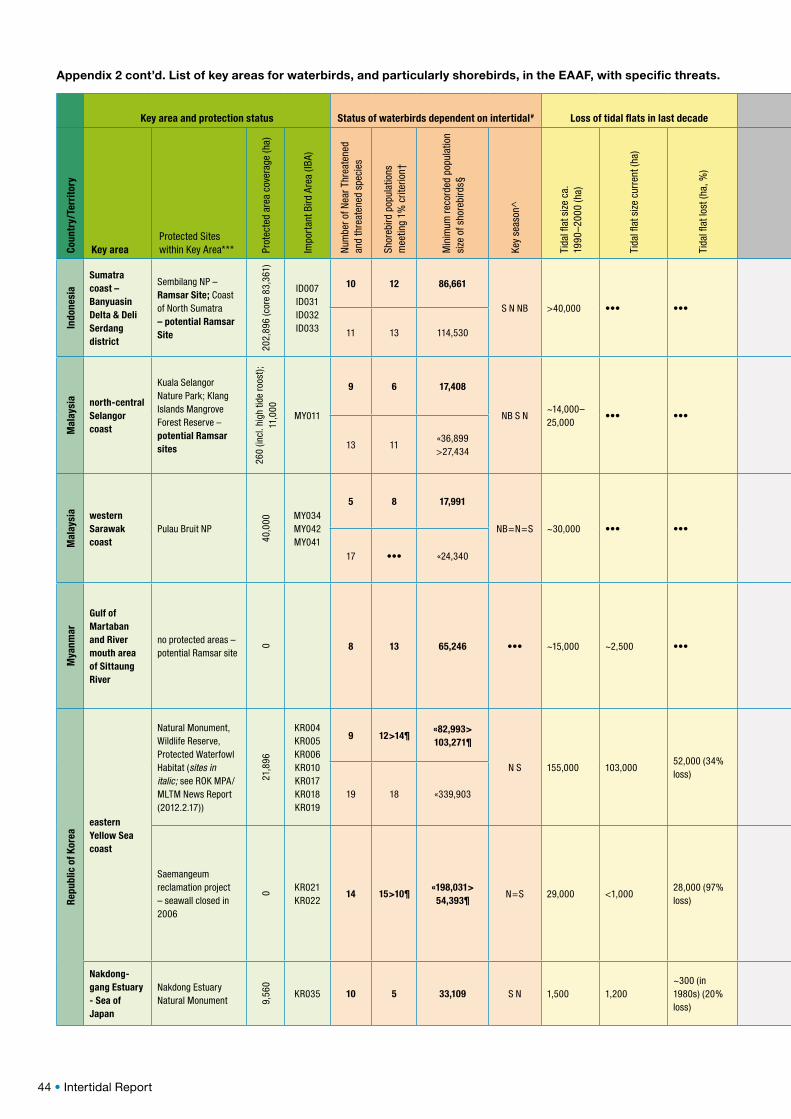
44 • Intertidal Report
Indo
nesi
a
Sumatra coast – Banyuasin Delta & Deli Serdang district
Sembilang NP – Ramsar Site; Coast of North Sumatra – potential Ramsar Site
202,
896
(cor
e 83
,361
)
ID007 ID031 ID032 ID033
10 12 86,661
S N NB >40,000 ••• •••Banyuasin Delta: heavy pressure from reclamation activities for aquaculture.
Banyuasin Delta: long-term average coastal accretion rate is estimated at about 100 m per year.
Banyuasin Delta: local fishing industry thrives largely on shrimps and prawns.
H P DVerheugt et al. 1993, Bamford et al. 2008,
Iqbal et al. 2010,
Banyuasin Delta, Bangan Percut, Pantai Ancol, Sembilang NP, Tanjung Bala, Tanjung Selokan, Tanjung Koyan11 13 114,530
Mal
aysi
a north-central Selangor coast
Kuala Selangor Nature Park; Klang Islands Mangrove Forest Reserve – potential Ramsar sites
260
(incl
. hig
h tid
e ro
ost)
; 11
,000
MY011
9 6 17,408
NB S N~14,000–25,000
••• •••
Up to 1997, 76 reclamation projects involving 384,000 ha of land (Yusoff et al. 2006). Mud and sandflats are not protected under the law; sand mining; reclamation of mangroves**.
Longshore-moving cycles of erosion and accretion, and changes in the location of the seaward edge of mangrove forest in modern times affected by increases of silt discharge by the larger rivers (D.R. Wells, pers. comm.).
Reclamation for housing estates, tourism, industry, agriculture, and aquaculture reduced the number of feeding and roosting areas. Port development Klang Islands (Li et al. 2007, Bakewell 2009) and illegal mangrove logging**.
P D
Yeap et al. 2007, Li et al. 2007,
Bamford et al. 2008, Bakewell 2009
Kapar Power Station, Klang Islands, Pantai Rasa Sayang, Pantai Tanjong Karang
13 11«36,899 >27,434
Mal
aysi
a western Sarawak coast
Pulau Bruit NP
40,0
00 MY034 MY042 MY041
5 8 17,991
NB=N=S ~30,000 ••• •••
Bako-Buntal: high human pressure in the bay. Pulau Bruit: increased utilization of land for agricultural purposes.
Pulau Bruit: drainage for cultivation affects may lead to decreased accretion or coastal erosion.
Bako-Buntal: restaurants line the sandbar, which is also the high tide roost for shorebirds. Pulau Bruit: migrant populations of waders have decreased due to several factors including severe erosions by storms and destructive waves.
H D Yeap et al. 2007
Bako-Buntal Bay, coast from Kuala Samarahan to Kuala Sadong, Pulau Bruit NP, Sadong-Saribas coast. Associated area: Tanjung Datu-Samunsam Protected Area
17 ••• «24,340
Mya
nmar
Gulf of Martaban and River mouth area of Sittaung River
no protected areas – potential Ramsar site
0 8 13 65,246 ••• ~15,000 ~2,500 •••
Moulamein Deep Sea Port. Further south: Dawei Industrial Zone is undergoing large coastal development (Zau Lunn, pers. comm.).
Highly dynamic.Area is too dynamic for aquaculture. Unsustainable fisheries with fine-mess nets. Oil and gas exploitation.
H (mistnets/
snares/poison)
Naing 2007, Bamford et al. 2008, Zöckler et al. 2010a,
H. Hla & N. Clark, pers. comm.
Associated area: Dawei River mouth in the Tanintharyi coastal zone. Other areas: Nanthar Island in the Rakhine coastal zone, Irrawaddy Delta (Labutta), Letkok Kon
Repu
blic
of K
orea
eastern Yellow Sea coast
Natural Monument, Wildlife Reserve, Protected Waterfowl Habitat (sites in italic; see ROK MPA/MLTM News Report (2012.2.17))
21,8
96
KR004 KR005 KR006 KR010 KR017 KR018 KR019
9 12>14¶«82,993> 103,271¶
N S 155,000 103,00052,000 (34% loss)
Of Asan Bay >30,000 ha reclaimed. Much of Cheonsu reclaimed in 1980s. Large-scale ongoing reclamation in Geum. Namyang now largely reclaimed. Small-scale reclamation in Ganghwa and Yeonjong, after large-scale in 1990s.
Accretion is very slow (Lee & Chough 1989).
Geum smothered in silts: lagging effect of Saemangeum project, leads to die-off of shellfish (Kim & Choi 2006). Benthic habitat quality change after reclamation (Choi et al. 2010). No undisturbed high-tide roost sites available for shorebirds at several sites.
P D
Barter 2002, Rogers et al. 2006a, Bamford et al. 2008, Moores et al. 2008,
Moores 2012
Asan Bay (Asan-ho lake and Sapgyo-ho lake), Cheonsu Bay, Geum-gang Estuary, Han-gang Estuary, Incheon Bay, Namyang Bay, Songdo Tidal Flat, Ganghwa-do Island, Yeongjong-do Island.
19 18 «339,903
Saemangeum reclamation project – seawall closed in 2006
0 KR021 KR022
14 15>10¶«198,031>54,393¶
N=S 29,000 <1,000 28,000 (97% loss)
Seawall closed in 2006, 5,000 ha flats remains but without tidal exchange (Moores 2012). Had Yellow Sea’s largest concentration of Spoon-billed Sandpiper (Moores 2012).
•••
Reclamation affected 30% of flyway’s Great Knots (Rogers et al. 2009). From 1997–2001, ca. 316,000 shorebirds during northward migration, ca. 257,000 on southward migration (Yi 2003, 2004). In 2010, fewer shorebirds during southbound migration (Korean Shorebird Network 2011).
P
Yi 2003, 2004, Rogers et al. 2006a,
2009, Moores et al. 2008, Korean
Shorebird Network 2011
Dongjin Estuary, Mangyeong Estuary
Nakdong-gang Estuary - Sea of Japan
Nakdong Estuary Natural Monument 9,
560
KR035 10 5 33,109 S N 1,500 1,200~300 (in 1980s) (20% loss)
Busan City wants to built airport in estuary. Various reclamation projects ongoing.
••• ••• P D
Doornbos et al. 1986, Barter 2002,
Bamford et al. 2008, Moores 2012
Nakdong-gang Estuary
Appendix 2 cont’d. List of key areas for waterbirds, and particularly shorebirds, in the EAAF, with specific threats.
Key area and protection status Status of waterbirds dependent on intertidal# Loss of tidal flats in last decade Habitat change and land threats*Other
threats Other information
Coun
try/
Terr
itory
Key areaProtected Sites within Key Area*** Pr
otec
ted
area
cov
erag
e (h
a)
Impo
rtan
t Bird
Are
a (IB
A)
Num
ber o
f Nea
r Thr
eate
ned
and
thre
aten
ed s
peci
es
Shor
ebird
pop
ulat
ions
m
eetin
g 1%
crit
erio
n†
Min
imum
reco
rded
pop
ulat
ion
size
of s
hore
bird
s§
Key
seas
on^
Tida
l flat
siz
e ca
. 19
90–2
000
(ha)
Tida
l flat
siz
e cu
rren
t (ha
)
Tida
l flat
lost
(ha,
%)
Land reclamation Erosion/accretion Changes of habitat natureSee
Key^^ Data references**Specifically named sites and associated areas

Intertidal Report • 45
Indo
nesi
a
Sumatra coast – Banyuasin Delta & Deli Serdang district
Sembilang NP – Ramsar Site; Coast of North Sumatra – potential Ramsar Site
202,
896
(cor
e 83
,361
)
ID007 ID031 ID032 ID033
10 12 86,661
S N NB >40,000 ••• •••Banyuasin Delta: heavy pressure from reclamation activities for aquaculture.
Banyuasin Delta: long-term average coastal accretion rate is estimated at about 100 m per year.
Banyuasin Delta: local fishing industry thrives largely on shrimps and prawns.
H P DVerheugt et al. 1993, Bamford et al. 2008,
Iqbal et al. 2010,
Banyuasin Delta, Bangan Percut, Pantai Ancol, Sembilang NP, Tanjung Bala, Tanjung Selokan, Tanjung Koyan11 13 114,530
Mal
aysi
a north-central Selangor coast
Kuala Selangor Nature Park; Klang Islands Mangrove Forest Reserve – potential Ramsar sites
260
(incl
. hig
h tid
e ro
ost)
; 11
,000
MY011
9 6 17,408
NB S N~14,000–25,000
••• •••
Up to 1997, 76 reclamation projects involving 384,000 ha of land (Yusoff et al. 2006). Mud and sandflats are not protected under the law; sand mining; reclamation of mangroves**.
Longshore-moving cycles of erosion and accretion, and changes in the location of the seaward edge of mangrove forest in modern times affected by increases of silt discharge by the larger rivers (D.R. Wells, pers. comm.).
Reclamation for housing estates, tourism, industry, agriculture, and aquaculture reduced the number of feeding and roosting areas. Port development Klang Islands (Li et al. 2007, Bakewell 2009) and illegal mangrove logging**.
P D
Yeap et al. 2007, Li et al. 2007,
Bamford et al. 2008, Bakewell 2009
Kapar Power Station, Klang Islands, Pantai Rasa Sayang, Pantai Tanjong Karang
13 11«36,899 >27,434
Mal
aysi
a western Sarawak coast
Pulau Bruit NP
40,0
00 MY034 MY042 MY041
5 8 17,991
NB=N=S ~30,000 ••• •••
Bako-Buntal: high human pressure in the bay. Pulau Bruit: increased utilization of land for agricultural purposes.
Pulau Bruit: drainage for cultivation affects may lead to decreased accretion or coastal erosion.
Bako-Buntal: restaurants line the sandbar, which is also the high tide roost for shorebirds. Pulau Bruit: migrant populations of waders have decreased due to several factors including severe erosions by storms and destructive waves.
H D Yeap et al. 2007
Bako-Buntal Bay, coast from Kuala Samarahan to Kuala Sadong, Pulau Bruit NP, Sadong-Saribas coast. Associated area: Tanjung Datu-Samunsam Protected Area
17 ••• «24,340
Mya
nmar
Gulf of Martaban and River mouth area of Sittaung River
no protected areas – potential Ramsar site
0 8 13 65,246 ••• ~15,000 ~2,500 •••
Moulamein Deep Sea Port. Further south: Dawei Industrial Zone is undergoing large coastal development (Zau Lunn, pers. comm.).
Highly dynamic.Area is too dynamic for aquaculture. Unsustainable fisheries with fine-mess nets. Oil and gas exploitation.
H (mistnets/
snares/poison)
Naing 2007, Bamford et al. 2008, Zöckler et al. 2010a,
H. Hla & N. Clark, pers. comm.
Associated area: Dawei River mouth in the Tanintharyi coastal zone. Other areas: Nanthar Island in the Rakhine coastal zone, Irrawaddy Delta (Labutta), Letkok Kon
Repu
blic
of K
orea
eastern Yellow Sea coast
Natural Monument, Wildlife Reserve, Protected Waterfowl Habitat (sites in italic; see ROK MPA/MLTM News Report (2012.2.17))
21,8
96
KR004 KR005 KR006 KR010 KR017 KR018 KR019
9 12>14¶«82,993> 103,271¶
N S 155,000 103,00052,000 (34% loss)
Of Asan Bay >30,000 ha reclaimed. Much of Cheonsu reclaimed in 1980s. Large-scale ongoing reclamation in Geum. Namyang now largely reclaimed. Small-scale reclamation in Ganghwa and Yeonjong, after large-scale in 1990s.
Accretion is very slow (Lee & Chough 1989).
Geum smothered in silts: lagging effect of Saemangeum project, leads to die-off of shellfish (Kim & Choi 2006). Benthic habitat quality change after reclamation (Choi et al. 2010). No undisturbed high-tide roost sites available for shorebirds at several sites.
P D
Barter 2002, Rogers et al. 2006a, Bamford et al. 2008, Moores et al. 2008,
Moores 2012
Asan Bay (Asan-ho lake and Sapgyo-ho lake), Cheonsu Bay, Geum-gang Estuary, Han-gang Estuary, Incheon Bay, Namyang Bay, Songdo Tidal Flat, Ganghwa-do Island, Yeongjong-do Island.
19 18 «339,903
Saemangeum reclamation project – seawall closed in 2006
0 KR021 KR022
14 15>10¶«198,031>54,393¶
N=S 29,000 <1,000 28,000 (97% loss)
Seawall closed in 2006, 5,000 ha flats remains but without tidal exchange (Moores 2012). Had Yellow Sea’s largest concentration of Spoon-billed Sandpiper (Moores 2012).
•••
Reclamation affected 30% of flyway’s Great Knots (Rogers et al. 2009). From 1997–2001, ca. 316,000 shorebirds during northward migration, ca. 257,000 on southward migration (Yi 2003, 2004). In 2010, fewer shorebirds during southbound migration (Korean Shorebird Network 2011).
P
Yi 2003, 2004, Rogers et al. 2006a,
2009, Moores et al. 2008, Korean
Shorebird Network 2011
Dongjin Estuary, Mangyeong Estuary
Nakdong-gang Estuary - Sea of Japan
Nakdong Estuary Natural Monument 9,
560
KR035 10 5 33,109 S N 1,500 1,200~300 (in 1980s) (20% loss)
Busan City wants to built airport in estuary. Various reclamation projects ongoing.
••• ••• P D
Doornbos et al. 1986, Barter 2002,
Bamford et al. 2008, Moores 2012
Nakdong-gang Estuary
Key area and protection status Status of waterbirds dependent on intertidal# Loss of tidal flats in last decade Habitat change and land threats*Other
threats Other information
Coun
try/
Terr
itory
Key areaProtected Sites within Key Area*** Pr
otec
ted
area
cov
erag
e (h
a)
Impo
rtan
t Bird
Are
a (IB
A)
Num
ber o
f Nea
r Thr
eate
ned
and
thre
aten
ed s
peci
es
Shor
ebird
pop
ulat
ions
m
eetin
g 1%
crit
erio
n†
Min
imum
reco
rded
pop
ulat
ion
size
of s
hore
bird
s§
Key
seas
on^
Tida
l flat
siz
e ca
. 19
90–2
000
(ha)
Tida
l flat
siz
e cu
rren
t (ha
)
Tida
l flat
lost
(ha,
%)
Land reclamation Erosion/accretion Changes of habitat natureSee
Key^^ Data references**Specifically named sites and associated areas

46 • Intertidal Report
Thai
land Inner Gulf of
Thailand
Don Loi Hot - Ramsar Site; Khok Kham and Pak Thale - Ramsar candidate
87,5
00
TH032 5 10 117,500 NB N 23,000 23,000 0
No reclamation on any significant scale has taken place (Round 2006), but election campaign proposed land reclamation of 10 km of coast (30.000 ha tidal flats; P. Round, pers. comm.).
Recession rate of 1.2–4.6 m/year; ca. 1 km tidal flat lost in last 30 years, especially from Bang Pakong River to the Thachin River (Sripanomyom et al. 2011).
Don Hoi Lot has razorshell fishery and is the single most disturbed stretch of shoreline for waterfowl in the entire gulf (Manopawitr & Round 2004).
H
BCS 2004, Manopawitr &
Round 2004, Round 2006, Sripanomyom
et al. 2011
Inner Gulf of Thailand
Viet
nam
Red River Delta
Xuan Thuy Natural Wetland Reserve - Ramsar Site 12
,000
VN012 VN013 VN014 VN015 VN016 VN017 VN060 VN061
8 2 7,801
N S~31,000-58,000
••• •••Entire delta areas reclaimed for agricultural land, aquaculture ponds, forestry and urban development.
••• ••• HTordoff 2002,
Bamford et al. 2008
An Hai, Ha Nam, Nghia Hung (Day and Ninh Co Estuary), Thai Thuy, Tien Hai, Tien Lang, Tra Co, Xuan Thuy
9 4 10,899
Viet
nam
Mekong and Saigon Delta
Gan Gio Mangrove Protected Area; Tan Thanh intertidal area & Ngang Island - potential Ramsar site
223,
213
VN001 VN002 VN051 VN062 VN063
5 1 20,083
NB N S ~273,800 ••• •••Mangrove planting on accreting mudflats reduces habitat for migratory waterbirds (Buckton et al. 1999).
Tidal flats dynamic due to erosion and accretion (Sourcebook 2012). Accretion rates along the coastline of up to 50 m per year (Buckton et al. 1999).
Mainly shrimps ponds and agricultural (rice) fields, some salt ponds. Disused agricultural land also provides habitat (Buckton et al. 1999). Mangrove forests protected now.
H (small scale)
Buckton et al. 1999, Tordoff 2002, Bamford et al. 2008, Sourcebook 2012, V. Morozov, pers.
comm.
Bai Boi, Binh Dai & Ba Tri, Gan Gio,Tan Thanh intertidal area & Ngang Island. Associated area: Dat Mui National Park (Ca Mau Province)
8 4 34,373
* Information without reference is taken from Asian Wetlands Directory 1989 and EAAF Shorebird Network Site
** Information on Important Bird Areas (IBA) and globally threatened birds taken from BirdLife Data Zone (www.birdlife.org/datazone)
*** NP = National Park; WCA = Waterfowl Conservation Area; ECA = Ecologically Critical Areas
••• No quantitative data available
# Number of GTBs given for all intertidal waterbirds (see Appendix 1). Other data only for extreme intertidal specialists: shorebirds (sandpipers, plovers, snipes and allies). First row: site with highest biodiversity. Second row: cumulative data for total area.
† 1% citerion: species present with 1% or more of the total EAAF population
§ Given are highest count (from data reference), or sum of count of species meeting 1% criterion (Bamford et al. 2008), either non-breeding, or during northbound or southbound migration
¶ Changes from 2006 to 2008 after closure of seawall in Saemangeum
« Indicates that a decline in shorebird population has been recorded
^ Key season: NB = nonbreeding NB, N = northbound S = southbound; based on number of present species meeting 1% criterion
^^ Other threats: H = hunting, P = pollution, D = human disturbance
Appendix 2 cont’d. List of key areas for waterbirds, and particularly shorebirds, in the EAAF, with specific threats.
Key area and protection status Status of waterbirds dependent on intertidal# Loss of tidal flats in last decade Habitat change and land threats*Other
threats Other information
Coun
try/
Terr
itory
Key areaProtected Sites within Key Area*** Pr
otec
ted
area
cov
erag
e (h
a)
Impo
rtan
t Bird
Are
a (IB
A)
Num
ber o
f Nea
r Thr
eate
ned
and
thre
aten
ed s
peci
es
Shor
ebird
pop
ulat
ions
m
eetin
g 1%
crit
erio
n†
Min
imum
reco
rded
pop
ulat
ion
size
of s
hore
bird
s§
Key
seas
on^
Tida
l flat
siz
e ca
. 19
90–2
000
(ha)
Tida
l flat
siz
e cu
rren
t (ha
)
Tida
l flat
lost
(ha,
%)
Land reclamation Erosion/accretion Changes of habitat natureSee
Key^^ Data references**Specifically named sites and associated areas

Intertidal Report • 47
Thai
land Inner Gulf of
Thailand
Don Loi Hot - Ramsar Site; Khok Kham and Pak Thale - Ramsar candidate
87,5
00
TH032 5 10 117,500 NB N 23,000 23,000 0
No reclamation on any significant scale has taken place (Round 2006), but election campaign proposed land reclamation of 10 km of coast (30.000 ha tidal flats; P. Round, pers. comm.).
Recession rate of 1.2–4.6 m/year; ca. 1 km tidal flat lost in last 30 years, especially from Bang Pakong River to the Thachin River (Sripanomyom et al. 2011).
Don Hoi Lot has razorshell fishery and is the single most disturbed stretch of shoreline for waterfowl in the entire gulf (Manopawitr & Round 2004).
H
BCS 2004, Manopawitr &
Round 2004, Round 2006, Sripanomyom
et al. 2011
Inner Gulf of Thailand
Viet
nam
Red River Delta
Xuan Thuy Natural Wetland Reserve - Ramsar Site 12
,000
VN012 VN013 VN014 VN015 VN016 VN017 VN060 VN061
8 2 7,801
N S~31,000-58,000
••• •••Entire delta areas reclaimed for agricultural land, aquaculture ponds, forestry and urban development.
••• ••• HTordoff 2002,
Bamford et al. 2008
An Hai, Ha Nam, Nghia Hung (Day and Ninh Co Estuary), Thai Thuy, Tien Hai, Tien Lang, Tra Co, Xuan Thuy
9 4 10,899
Viet
nam
Mekong and Saigon Delta
Gan Gio Mangrove Protected Area; Tan Thanh intertidal area & Ngang Island - potential Ramsar site
223,
213
VN001 VN002 VN051 VN062 VN063
5 1 20,083
NB N S ~273,800 ••• •••Mangrove planting on accreting mudflats reduces habitat for migratory waterbirds (Buckton et al. 1999).
Tidal flats dynamic due to erosion and accretion (Sourcebook 2012). Accretion rates along the coastline of up to 50 m per year (Buckton et al. 1999).
Mainly shrimps ponds and agricultural (rice) fields, some salt ponds. Disused agricultural land also provides habitat (Buckton et al. 1999). Mangrove forests protected now.
H (small scale)
Buckton et al. 1999, Tordoff 2002, Bamford et al. 2008, Sourcebook 2012, V. Morozov, pers.
comm.
Bai Boi, Binh Dai & Ba Tri, Gan Gio,Tan Thanh intertidal area & Ngang Island. Associated area: Dat Mui National Park (Ca Mau Province)
8 4 34,373
* Information without reference is taken from Asian Wetlands Directory 1989 and EAAF Shorebird Network Site
** Information on Important Bird Areas (IBA) and globally threatened birds taken from BirdLife Data Zone (www.birdlife.org/datazone)
*** NP = National Park; WCA = Waterfowl Conservation Area; ECA = Ecologically Critical Areas
••• No quantitative data available
# Number of GTBs given for all intertidal waterbirds (see Appendix 1). Other data only for extreme intertidal specialists: shorebirds (sandpipers, plovers, snipes and allies). First row: site with highest biodiversity. Second row: cumulative data for total area.
† 1% citerion: species present with 1% or more of the total EAAF population
§ Given are highest count (from data reference), or sum of count of species meeting 1% criterion (Bamford et al. 2008), either non-breeding, or during northbound or southbound migration
¶ Changes from 2006 to 2008 after closure of seawall in Saemangeum
« Indicates that a decline in shorebird population has been recorded
^ Key season: NB = nonbreeding NB, N = northbound S = southbound; based on number of present species meeting 1% criterion
^^ Other threats: H = hunting, P = pollution, D = human disturbance
Key area and protection status Status of waterbirds dependent on intertidal# Loss of tidal flats in last decade Habitat change and land threats*Other
threats Other information
Coun
try/
Terr
itory
Key areaProtected Sites within Key Area*** Pr
otec
ted
area
cov
erag
e (h
a)
Impo
rtan
t Bird
Are
a (IB
A)
Num
ber o
f Nea
r Thr
eate
ned
and
thre
aten
ed s
peci
es
Shor
ebird
pop
ulat
ions
m
eetin
g 1%
crit
erio
n†
Min
imum
reco
rded
pop
ulat
ion
size
of s
hore
bird
s§
Key
seas
on^
Tida
l flat
siz
e ca
. 19
90–2
000
(ha)
Tida
l flat
siz
e cu
rren
t (ha
)
Tida
l flat
lost
(ha,
%)
Land reclamation Erosion/accretion Changes of habitat natureSee
Key^^ Data references**Specifically named sites and associated areas

48 • Intertidal Report
Appendix 3. Major problems, drivers and possible solutions to reduce loss of intertidal habitats and biota (based on literature review and expert input).
Root causes/ drivers Perverse processes
Resultant threats to intertidal zone
Ultimate problems Domestic solutions International solutions
Short-sighted agricultural policy, perverse subsidies, low awareness, weak agro-practice controls.
Over-use of chemical fertilizers. Release of excess nitrogen into water system.
Dangerous algal blooms, red tides; reduced water transparency;
reduced silicates;
eutrophic conditions.
Health dangers, blockage of waterways, toxic to some fish, loss of diatoms basic to many foodchains; increased toxic dinoflagellates;
reduced oxygen in water.
Review agricultural policies; reverse perverse subsidies; promote more sustainable practices; strengthen agro-biodiversity protection.
FAO and other international programmes available to help countries develop sound agricultural policies and practices. Sharing of best practices.
Weak regulations and law enforcement or lack of budget for sewage treatment.
Release of untreated sewage into water system.
Algal blooms and dangerous bacteria.
Severe health dangers; loss of tourism potential;
loss of biodiversity.
Ensure both regulations and enforcements maintain high sewage treatment standards. This must cover domestic sewage and farm animal wastes.
WHO and other international programmes can help countries achieve higher standards of waste treatment.
Weak EIA, weak pollution legislation, weak law enforcement drive industries to take economic shortcuts. Vietnam War defoliation (historical residues).
Release of toxic metals and Persistent Organic Pollutants (POPs) into water system from industrial activities.
Toxic materials enter food chains and mud.
Human health hazard including carcinogenic threat; kills many wild creatures and targets vulnerable species; pollutants can persist in mud and living creatures for many years; fisheries decline.
Improve environmental legislation, law enforcement and monitoring. Better zoning into development and non-development areas and siting of pollution sources. Establish strict food and health standards; develop treatment facilities.
Stockholm Convention and other programmes available to share information on ways to achieve sound management of chemicals and wastes.
Failure to collect and treat garbage. Excessive use of plastic containers and wrappings.
Dumping of untreated garbage into waterways.
Massive unsightly and hazardous flotsam littering beaches.
Plastic waste covers beaches and mudflats; disturbs wildlife and can be hazardous to animals especially if ingested; slightly toxic
Campaigns and taxes to discourage use of plastic bags and other unnecessary packaging. Improve recycling and garbage treatment.
Waste often comes from distant countries. Issue needs to be tackled on a global basis.
Inadequate controls and enforcement of standards. Inadequate equipment to clean up spills.
Leaks from drilling platforms, tankers and cleaning bilges.
Oil spill washed up on shoreline.
Oil kills many birds, fish and invertebrates.
Tighten national standards and controls; improve response capability; ensure bird treatment capacity available.
Law of Sea and other programmes can be applied.
Few livelihood alternatives, growing demand from tourism industry and for export, lack of adequate quotas and controls.
Overharvesting of seafoods – fish, crustaceans, molluscs, worms.
Cutting of mangroves, erection of net systems and traps; raking of mudflats.
Loss of fish stocks, loss of invertebrates, disturbance to shorebirds that need undisturbed roosts.
Include more habitat in PA system; strengthen protective management and law enforcement; provide livelihood alternatives; use payment for ecosystem services (PES) to pay for good ecosystem co-management.
Certification for sustainable harvested products;
bilateral programmes can help provide alternative livelihoods.
Low awareness of ecology by foresters. Trees are not always ‘good’.
Budgets are available for tree planting, open wetlands offer cheap, open areas for planting.
Damaging important wetlands by inappropriate tree planting.
Loss of wetlands; introduction of alien species; changes to water table; shorebirds favour wide open spaces where they feel safe from predators.
Scientific community should advise managers on when and which species of tree planting are not appropriate.
Ramsar, Wetland International and other organizations and programmes should highlight this threat to wetlands and provide guidelines on ‘When and what not to plant’.
Lack of SEA; weak planning, weak PA legislation, failure to mainstream biodiversity, low awareness and short-sighted economic policies.
Urban, touristic or aquaculture encroachment.
Loss of vegetation above the high-tide line.
Loss of nesting areas and loss of undisturbed areas as secure roost sites for migratory shorebirds and other waterbirds.
Approve and apply SEA legislation. Strictly prohibit major developments in areas identified for essential ecosystem functions and socio-economic needs. Strengthen EIA enforcement. Strengthen awareness campaigns to public and planners.
International lobbying can be applied through international conventions/programmes; media coverage and diplomatic lobbying by International agencies.
Technical assistance has been provided by Word Bank and other donors.

Intertidal Report • 49
Failure to mainstream biodiversity, short-sighted economic policies; lack of suitable regulations and subsidies to promote wiser land allocations.
Mega-development plans for new economic zones;
perverse incentive schemes, land allocations.
Sea walls, reclamation of mudflats, blockage of original water flows.
Destruction/loss of intertidal habitats.
Development of National Biodiversity Strategies and Action Plans. Ensure biodiversity is considered by all relevant sectors. Strengthen SEA processes and EIA application. Publicize real costs of development and values of economic services delivered (e.g. TEEB).
Core articles of CBD.
Many programmes willing to work with countries towards better biodiversity mainstreaming. Diplomatic comment and lobbying by international organizations and programmes. International projects should set good example following highest standards.
Failure to harmonize human water needs with environmental water needs. Failure to mainstream biodiversity into hydro projects. Weak control of water use.
Damming, water diversions and river water extraction; water wastage due to inefficient irrigation.
Reduced flow of freshwater into estuaries.
Salination kills riverine and coastal flora, coastal agriculture and many invertebrates; reduced silt flow deprives mud bars of fresh silt and nutrients, leads to a reduced rate of coastal accretion and nutrient input to wetlands.
Important to achieve good balance between different water needs; preserve water security and water quality. Tight regulations and controls on water use and abuse.
Rivers cross national boundaries. Several international programmes tackle entire water systems – Greater Mekong Programme, Amur River Programme etc.
Funders and investors in hydro and irrigation projects should apply high environmental standards.
Weak landscape level planning; weak regulation enforcement.
Deforestation and agriculture in steep landscapes. Failure to attend to erosion scars.
Excessive silt loads in rivers; loss of precious topsoil.
Silting kills coral reefs undermining the structure of coastlines and resulting in shoreline erosion.
Restrict forest clearance, limit bio-fuel production; expand reforestation but with local species; use PES to reward good catchment protection.
CBD obligations and GEF funds available for combating land degradation.
Weak hunting controls. Some perverse policies like netting birds on airports. Weak law enforcement in PAs.
Use of guns and traps, electricity, poisons and explosives.
Mist netting of birds in reserves, agricultural lands, airports.
Excessive hunting and mist netting (especially shore and water birds) for sport, food, sale or to protect crops or for air safety.
Loss of millions of birds annually, all down the migration flyway.
Review the need to erect mist-nets on airports. Provide alternative livelihoods to hunters in coastal areas. Tighten hunting regulations, and tighten law enforcement.
CITES and TRAFFIC can help monitor illegal trade lines.
International organizations and programmes can exert diplomatic pressure to encourage countries to better tackle these issues.
Failure to curb and limit release of greenhouse gases; excessive and continuing destruction of natural vegetation.
Anthropogenic climate change.
Increased extreme weather (both hot and cold, wet and dry);
more typhoons, floods, droughts, heatwaves; raised sea temperatures, sea levels and sea pH; changes ocean currents; loss of glacier water sources.
Raised stress on all ecosystems. Bleaching of corals. Changes to species migration patterns and mismatch of timings. Loss of coastal habitat through sea level rise.
Reduce national greenhouse gas emission levels; encourage development of clean energy alternatives; develop national strategy for biodiversity and climate change; revise PA system for greater climate change resilience, especially to promote network connectivity.
Climate Change Protocols encourage countries to curb greenhouse gas emissions. GEF available to fund projects aimed at tackling climate change issues. REDD programmes. Ensure biodiversity concerns are included in climate change mitigation plans.
Poverty and lack of alternative livelihoods; weak control of forest damage; lack of suitable incentives.
Unsustainable cutting of mangroves for fuel and tannins; uncontrolled harvest of other resources.
Conversion of mangroves into fish ponds.
Destruction of mangrove habitat; acidification of soils and waters; source of invasive alien species.
Law enforcement, awareness activities, assistance with alternative livelihoods.
Technical assistance, advocacy, aid in alternative livelihoods, adherence to certification systems.
Root causes/ drivers Perverse processes
Resultant threats to intertidal zone
Ultimate problems Domestic solutions International solutions

50 • Intertidal Report
Uncontrolled release of invasive alien species (IAS).
Forestry, horticulture, agriculture, aquaculture and accidents all bring new species.
Spread of many invasive alien species of fauna and flora; spread of diseases and pathogens.
Damage to environment, displace local species, destroy local species; damage health of wildlife, domestic animals and humans.
Adopt cautionary IAS legislation with provisions for safe trials, releases, monitoring, and responses. Should include secure genetically modified organism (GMO) regulations.
Undertake studies, reporting and monitoring.
This issue is covered under CBD and PoWPA. Assistance can be gained from some international programmes, by way of information sharing, best control practices etc. IUCN SSC support from Invasive Species Specialist Group.
Corruption;
lack of transparency.
Approval of developments that enrich a few powerful people but at cost of: environment, long-term economic sustainability, wider public, biodiversity.
Lack of mainstreaming of biodiversity into plans and developments.
Whitewash EIA.
Diversion of key funds.
Misappropriation of farmers and public lands.
Failure to include environmental costs and externalities into development cost/benefit calculations.
Destruction of habitat;
promotion of many illegal actions.
Constantly fight and punish corruption; develop better transparency; greater public participation and comment;
greater freedom of media to cover environmental issues.
Diplomatic lobbying; setting good examples.
Lack of awareness; lack of funding.
Failure to build long-term environmental concerns into development process.
Lack of funding, weak environmental protection, lack of concern at degrading environment.
Loss of habitat, loss of species; weak protection of PAs; excessive consumption of unsustainably harvested products.
Promote awareness campaigns; include environmental training in education; reward environmental awareness in performance evaluation.
Development of or distribution of awareness materials in local languages.
Low capacity for research and monitoring; low funding allocations.
Lack of reliable data on coastal biodiversity; low awareness.
Decisions are made without sound information base.
Damaging developments and losses of habitat.
Strengthen research and monitoring. Involve academic institutions in management advice; promote better data sharing; participate in international programmes.
Improve the collation, analysis and publication of relevant data. Improve access to data via open websites and in local languages.
Lack of agreement on marine boundaries.
Failure of countries to take sustainable use approach.
“Opportunistic exploitation of marine biodiversity”.
Inability to establish protected areas or apply sustained harvesting of resources.
Refrain from irreversible developments or actions pending dispute resolution.
Encourage peaceful resolution, peace parks or get both sides to agree on necessary conservation measures.
Root causes/ drivers Perverse processes
Resultant threats to intertidal zone
Ultimate problems Domestic solutions International solutions
Appendix 3 cont’d. Major problems, drivers and possible solutions to reduce loss of intertidal habitats and biota (based on literature review and expert input).

Intertidal Report • 51
Appendix 4. List of major international programmes with direct relevance to the EAAF.
Programmes Mission/Functions Activities
A. Programmes under international conventions
UN Convention on Biological Diversity (CBD)
Articles cover the entire spectrum of actions to conserve biodiversity.
Programme of Work for Protected Areas specifically tries to promote compliance in protecting natural areas for biodiversity.
Ramsar Convention on Wetlands Protection of globally significant wetlands especially for waterbirds.
Requests member countries to protect globally significant wetlands. Provides EIA/SEA guidance.
Convention on Migratory Species (CMS) Worldwide UN convention. Conserves all types of migratory species but currently only has a few contracting parties in East Asia (see Appendix 8).
East Asian-Australasian Flyway Partnership (EAAFP)
Convention of migratory waterbirds and their habitats.
Establishes and supports protection for a network of protected sites for habitat of migrating birds along the Flyway. Supports several task forces, including Spoon-billed Sandpiper Task Force.
Republic of Korea-Australia Migratory Bird Agreement (ROKAMBA)
Cooperation between South Korea and Australia.
Co-operation in taking measures for the management and protection of migratory birds and their habitat and the prevention of the extinction of certain birds.
China Australia Migrating Birds Agreement (CAMBA)
Cooperation between China and Australia. Support protection of sites and study of migrations between the two countries.
Japan-Australia Migratory Bird Agreement (JAMBA)
Cooperation between Japan and Australia. Support protection of sites and study of migrations between the two countries.
China-Japan Migratory Bird Agreement (CJMBA)
Cooperation between China and Japan. Supports protection of migrating bird sites of birds shared between the two countries.
B. Programmes under specific international organizations
International Union for Conservation of Nature (IUCN)
Has special volunteer Commissions to assist with Protected Areas and Species.
Provides standards, guidance and best practices. Significant work on guidance for EIA/SEA. World Commission on Protected Areas pushes CBD Programme of Works on Protected Areas (PoWPA) and develops regional action plans; Species Survival Commission attends to species concerns with many taxonomic specialist groups. Produces Species Action Plans.
BirdLife International A global Partnership of national conservation organizations that strives to conserve birds, their habitats and global biodiversity, represented in 14 countries and territories in the EAAF. The IUCN Red List Authority for birds.
Maintains comprehensive database on globally threatened birds, and promotes their conservation through the Preventing Extinctions Programme. Important Bird Areas (IBA) Programme identifies, documents and protects key sites for bird conservation worldwide. Global Flyways Programme is currently initiating new activities in EAAF.
Wetlands International (WI) Global specialized NGO for wetlands conservation. Acts as co-convenor, along with IUCN SSC, of waterbird Specialist Groups.
Promotes importance for and supports protection of wetlands globally. Coordinates the International Waterbird Census and Waterbird Population Estimates programmes. Several national offices within the EAAF region.
Global Flyway Network (GFN) Research Programme
Research programme supervised under University of Groningen/Royal Netherlands Institute of Zoology.
Supports dedicated demographic and migration ecology research on a few key migrant species along the Flyway (Red and Great Knots, Bar- and Black-tailed Godwits), focusing the actual research efforts in north-west Australia (Roebuck Bay and Eighty-Mile Beach) and Bohai Bay, China, the latter in collaboration with Beijing Normal University.
WWF Global conservation NGO with many national programmes within EAAF region.
All forms of conservation activity but a long history of supporting wetlands conservation. Manages key site at Mai Po Ramsar Site Marshes in Hong Kong, SAR China.
Royal Society for the Protection of Birds (RSPB)/BirdLife in the UK
Specialist society supporting all types of bird conservation activities in UK and worldwide.
Supports Spoon-billed Sandpiper Task Force. Provides funds, news and technical materials.
Wildfowl and Wetlands Trust (WWT) Promotes research, conservation and education on matters of wildfowl and their wetlands.
Has special project for conservation of Spoon-billed Sandpiper using artificial breeding and head-starting.
C. Other
Global Environmental Facility (GEF) Provides funds for regional and national projects under CBD.
Has undertaken regional Southern Seas Project, Yellow Sea large Marine Ecosystem project and many national wetlands protection projects.
Asian Development Bank/ World Bank and several bilateral aid programmes
Fund development projects in Asia both as loans and grants and technical assistance.
Many environmental protection projects including wetlands and corridors.
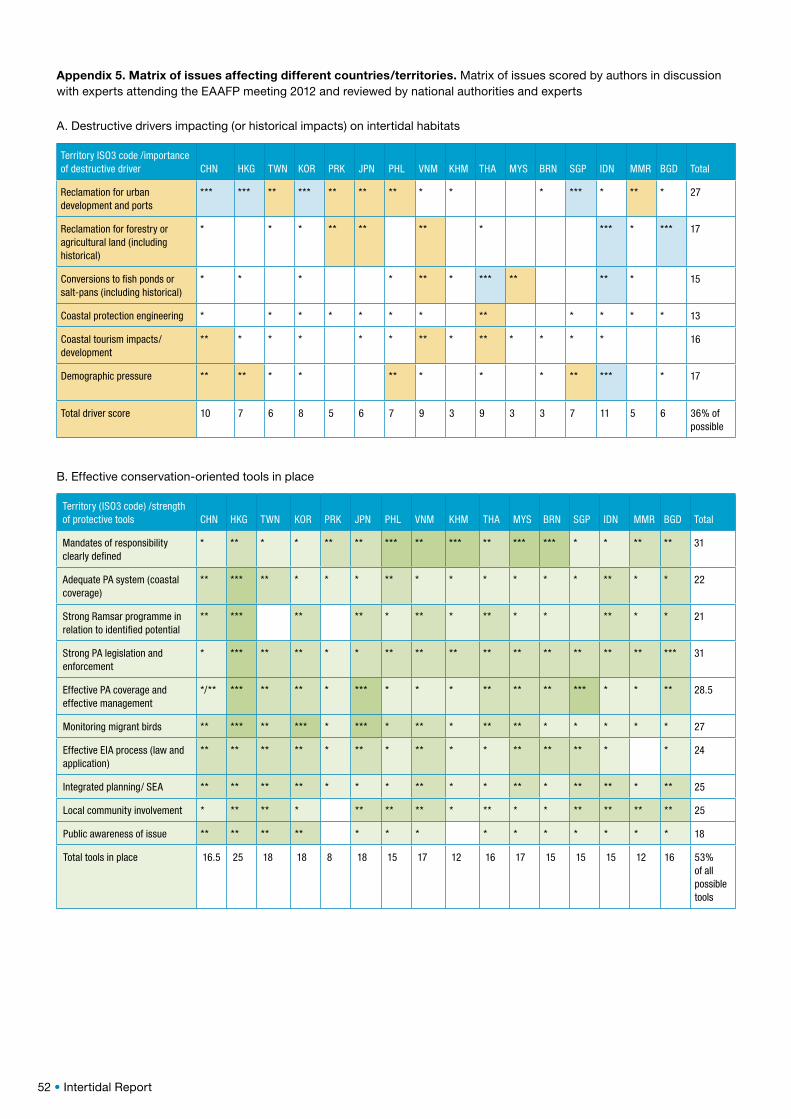
52 • Intertidal Report
Appendix 5. Matrix of issues affecting different countries/territories. Matrix of issues scored by authors in discussion with experts attending the EAAFP meeting 2012 and reviewed by national authorities and experts
A. Destructive drivers impacting (or historical impacts) on intertidal habitats
Territory ISO3 code /importance of destructive driver CHN HKG TWN KOR PRK JPN PHL VNM KHM THA MYS BRN SGP IDN MMR BGD Total
Reclamation for urban development and ports
*** *** ** *** ** ** ** * * * *** * ** * 27
Reclamation for forestry or agricultural land (including historical)
* * * ** ** ** * *** * *** 17
Conversions to fish ponds or salt-pans (including historical)
* * * * ** * *** ** ** * 15
Coastal protection engineering * * * * * * * ** * * * * 13
Coastal tourism impacts/development
** * * * * * ** * ** * * * * 16
Demographic pressure ** ** * * ** * * * ** *** * 17
Total driver score 10 7 6 8 5 6 7 9 3 9 3 3 7 11 5 6 36% of possible
B. Effective conservation-oriented tools in place
Territory (ISO3 code) /strength of protective tools CHN HKG TWN KOR PRK JPN PHL VNM KHM THA MYS BRN SGP IDN MMR BGD Total
Mandates of responsibility clearly defined
* ** * * ** ** *** ** *** ** *** *** * * ** ** 31
Adequate PA system (coastal coverage)
** *** ** * * * ** * * * * * * ** * * 22
Strong Ramsar programme in relation to identified potential
** *** ** ** * ** * ** * * ** * * 21
Strong PA legislation and enforcement
* *** ** ** * * ** ** ** ** ** ** ** ** ** *** 31
Effective PA coverage and effective management
*/** *** ** ** * *** * * * ** ** ** *** * * ** 28.5
Monitoring migrant birds ** *** ** *** * *** * ** * ** ** * * * * * 27
Effective EIA process (law and application)
** ** ** ** * ** * ** * * ** ** ** * * 24
Integrated planning/ SEA ** ** ** ** * * * ** * * ** * ** ** * ** 25
Local community involvement * ** ** * ** ** ** * ** * * ** ** ** ** 25
Public awareness of issue ** ** ** ** * * * * * * * * * * 18
Total tools in place 16.5 25 18 18 8 18 15 17 12 16 17 15 15 15 12 16 53% of all possible tools

Intertidal Report • 53
Appendix 6. Comparative review of protected area legislation and management.
Country/ Territory
Main laws for establishment/management of Protected Areas
% intertidal habitats lost since 1970s (measured by N. Murray in 2011 for Yellow Sea and Bohai Sea area, otherwise based on Google Map)
% territory protected (Chape et al. 2008)
% coastline protected (Assessed from PA maps of each territory)
No of coastal Ramsar Sites out of identified potential Ramsar Sites (BirdLife International 2005)
Bangladesh Bangladesh Wildlife Preservation Act, 1974
<10% 1.7% <5% 1/3
Brunei Darussalam
1934 Forest Act (revised in 1984); 1978 Wildlife Protection Act
<10% 59% 5-10% 0/2*
Cambodia Royal Decree 1993; King designations ad hoc <5% 24% 10–20% 1/6
China (mainland, including Macao, SAR China)
National regulations on establishment of nature reserves (1985); Forest Law (1984, revised 1998); Fishery Law (1986); Law on Protection of Wild Animals (1988); Environment Protection Law (1979, revised 1989)
c. 51% 15% c. 20% 5 out of 53; Macao has one potential Ramsar Site
Hong Kong, SAR China
Country Parks Ordinance, 1976 revised 2005; Marine Parks Ordinance, 1995, Wild Animals Protection Ordinance, 1976
10–20% 48% c. 26% 1/ 1
Taiwan, Province of China
National Parks Law, 1972; Cultural Heritage Preservation Law, 1982; Wildlife Conservation Law, 1989
10–20% 12% 38% 0/23
DPR Korea Law on Forests, 1992; Law on Prevention of Sea Pollution, 1997
c. 10% 6%, NBSAP plans for 20%
<5% 0/23*
Indonesia Forestry Act No. 41/1999 5–10% 24% 5–10% 1/31
Japan Nature Conservation Law, 1972; Natural Parks Law, 1957 (revised 2002); Promotion of Nature Restoration Act, 2003
40% 17% <5% 10/103
Malaysia National Parks Act 1980; National Forest Act 1984 (Act 313); Wildlife Conservation Act 2010; Marine Parks under Fisheries Act 1985 (Act 317, revised 1993), all supported by State level legislation
<10% 27% <5% 1/17
Myanmar 1994 Protection of Wildlife and Protected Areas Law (being revised)
<5% 5.2% <5% 1/5
Philippines National Integrated Protected Areas System Act of 1992 (being revised)
<10% 19% 10–20% 1/11
Republic of Korea
Natural Parks Act, 1997 (revised 2001); Natural Environment Conservation Act, 1991; Wetlands Conservation Act, 1999; Law on Conservation and Management of Marine Ecosystems; plus specific acts for protection of some small islands, main mountain range, cultural and genetic resources
55% 7% <5% 0/29
Singapore Parks and Trees Act 2005; National Parks Board Act sets up the organization
>70% 6.5% 4% 0/1*
Thailand Wild Animal Protection and Preservation Act 1960 (revised 1992); National Park Act 1961; Conservation of National Environmental Quality Act 1992
>15% 22% 5–10% 3/13
Vietnam Forest Law (1962 defines special forests); Decree No 117/2010/ND-CP organization and management of Special forest in Forestry System; Biodiversity Law 2008
10–20% 6.3% <5% 1/14
* Not a party to Ramsar

54 • Intertidal Report
Appendix 7. Comparative table of legislative procedures for EIA /SEA by country/territory (based on Phillips et al. 2009, World Bank 2006 and national expert comments).
Main EIA/SEA legislation Coverage
Who responsible for EIA Public involvement Comments Penalties
Bangladesh
EIA Regulations, 1992; Environment Conservation Act (ECA), 1995
Environmental Conservation Rules (ECR), 1997
All construction projects falling under orange and red categories of impacts.
Developer prepares report after TOR approved by Department of Environment who then must approve report.
Citizens may lodge petitions against any development.
EIA legislation for industrial projects does place emphasis on biodiversity/ecosystems.
Appellate body hearing petitions may impose fines, other penalties or order closure of development.
Brunei Darussalam
Draft law not yet approved
In principle the Government requires EIA for large and heavy industries.
Not applicable. Not applicable.
Cambodia
Sub-decree on EIA, 1999
Projects impacting on environment.
Ministry of Environment.
General statement in regulations.
No monitoring stipulated. Penalties determined by court of law.
China (mainland)
Environmental Impact Assessment Law, 2003
Should be undertaken before any development project starts.
Ministry of Environment and its provincial bureaus of Environmental Protection.
Public consultation is mandated with 2 weeks for public hearings.
Enforcement weak. Biodiversity content of reports is also poorly defined.
Maximum fine is only US$30,000, way below the cost of any development.
Hong Kong, SAR China
EIA Ordinance, 1998
Policies, plans and projects.
Department of Environmental Protection. Review panel established for each case.
Strict and concrete requirements in regulations. NGOs and public can be involved during the public consultation.
A statutory advisory body (Advisory Council for the Environment) has been established with members coming from public, academic and NGOs. Requires alternates studies and full disclosure. Effectiveness depends on strength of Review panel.
Range of fines up to HK$5,000,000 and/or up to 5 years in prison.
Taiwan, Province of China
Environmental Impact Assessment Act (revised 2003)
All development activities and constructions for which there is concern of adverse impact on the environment.
Environmental Protection Administration, Executive Yuan, at the central level, local governments at lower levels.
Phase II of EIA process involves public notification, public explanation meeting, public inspections and development of residents plan.
Developer prepares phase I EI statement for review by competent authority. Depending on review, may be required to move to phase II with fuller EIA, alternate plans, etc.
A range of penalties are defined with prison for maximum of 3 years and fines up to 1.5 million NT.
DPR Korea
Law of Environmental protection, 1986 (with Enforcement Decree dated 1995). Specific EIA regulations are lacking
A joint report by UNEP and Government of DPRK admits that environmental laws and regulations need to be formulated or upgraded urgently.
State Environmental Protection Bureau.
Not required. DPRK has seen red tides and withered crops, as well as the destruction of ecosystems, and water pollution, all side-effects of severe environmental pollution.
Courts can impose fines and closures.

Intertidal Report • 55
Indonesia
Environmental Management Act No.23, 1997; EIA Law, 2001
Projects with impacts on environment.
Environmental Impact Management Agency under MoE.
Strict and concrete requirements in regulations. Difficult for public to access details. NGOs may represent public.
Alternatives study and follow-up monitoring stipulated in regulations. Lack of cross sectoral coordination.
Fines imposed by local courts following standards and conditions (colour coded).
Japan
EIA Law promulgated 2008 (revised 2011)
Projects with impacts on environment.
Proponent submits EI statement and summary to prefectural governor.
All steps are open to mandatory public review.
A series of steps are taken depending on the nature of the project, the relevant ministry and the review comments received from public and related agencies. All relevant authorities must approve the EIA.
Penalties for non-compliance are not specified in the Law.
Malaysia
Environmental Quality Act, 1974
Section 34A, requires EIA for developments that have significant impact to the environment.
Ministry of Environment.
Limited. DG of department can approve reports after internal review with no need for public review. EIA is now becoming devolved to State Governments.
Specific guidelines are available for EIA on Coastal and Land Reclamation and also for coastal tourism developments and ports.
Contravention of regulations can carry fine up to RM 100,000 with up to 2 years imprisonment.
Myanmar
The need for EIA laws is recognized by the Myanmar Agenda 21. New law is in draft.
Projects undertaken by international agencies with mandatory EIA policies.
National Commission for Environmental Affairs (NCEA) has authority to require the commissioning of EIAs.
Depends on external agency conducting EIA. Public consultation mandatory.
EIAs are conducted on an ad hoc basis for projects funded by international organizations and some foreign corporations. New legislation is being developed.
Legal penalties to be included in new law.
Philippines
EIA Regulations DOA 30/2003
Projects with impacts on environment.
Department of Environment and Natural Resources.
Strict and concrete requirements in regulations with particular respect for indigenous cultural communities.
Alternatives study and follow-up monitoring stipulated in regulations. Developers still try to get round these regulations.
Up to 6 months in prison or up to 200,000 peso fine or both.
Republic of Korea
Environment Preservation Act, 1997;
EIA Act, 1993
Urban development projects, industrial site constructions, energy developments.
Korea Environment Institute (KEI) under Ministry of Environment.
All the projects subject to EIA must be approved through a public hearing.
Responsible administrative agency should implement consultation results, monitor implementation, and assign responsibilities for keeping records of the implementation procedures.
Improper implementation may result in the suspension of construction, sentence up to five years in prison, or fines up to 5,000,000 won.
Singapore
Environmental Protection and Management Act, 2000; covers only impacts of chemical air and water pollution, and noise controls.
Projects impacting on environment. There is a separate Traffic Impact Assessment process.
Ministry of Environment and Water Resources. NGOs may submit independent EIA. Biodiversity Impact Assessment is administrative process managed by the Urban Redevelopment Authority.
Not required. Follow-up monitoring stipulated in regulations.
Different fines for different offences up to S$50,000 and up to 2 years imprisonment.
Main EIA/SEA legislation Coverage
Who responsible for EIA Public involvement Comments Penalties

56 • Intertidal Report
Thailand
National Environmental Quality Act, 1992
Projects that will impact environment.
Ministry of Natural Resources and Environment took over from Ministry of Science and Technology.
Only a general statement in technical guidelines.
Biodiversity not specified. No information disclosure or follow-up monitoring stipulated.
Fees and penalties to be paid into Environmental Fund’. Up to 5 years in prison, up to 50,000 Baht, 4 times published fees and damages including any clean-up costs.
Vietnam
Decree 175/CP 18 October 1994 under Law on Environmental Protection, revised 2007
All large-sized or high potential impacts projects, of which several types are defined under the decree.
Ministry of Science Technology and Environment (MOSTE).
Local community representatives can input opinions.
Public disclosure required. No follow-up monitoring stipulated.
Law refers to fees and fines but does not specify maximum, decided by courts.
Appendix 8. Participation in Multilateral Environmental Agreements and associated actions.
ISO3 code /MEA party BGD BRN CHN IDN JPN KHM KOR MMR MYS PHL PRK SGP THA VNM
UN Convention on Biological Diversity yes yes yes yes yes yes yes yes yes yes yes no yes yes
UN Convention to Combat Desertification
yes no yes yes yes yes yes yes yes yes yes yes yes yes
UN Framework Convention on Climate change
yes yes yes yes yes yes yes yes yes yes yes yes yes yes
Convention on Migratory Species party no sign yes no sign no sign sign party no no sign sign
Ramsar Convention yes no yes yes yes yes yes yes yes yes no no yes yes
East Asian-Australasian Flyway Partnership
yes no yes yes yes yes yes ngo yes yes no yes yes yes
UN Convention on the Law of the Sea yes yes yes yes yes ratify only yes yes yes yes ratify only yes yes yes
Updated National Biodiversity Strategy and Action Plan (NBSAP) or equivalent
yes no yes yes yes yes yes yes state level yes yes yes yes yes
Appendix 7 cont’d. Comparative table of legislative procedures for EIA /SEA by country/territory.
Main EIA/SEA legislation Coverage
Who responsible for EIA Public involvement Comments Penalties

Intertidal Report • 57
Appendix 9. A selection of case studies in key areas.
Conditions and drivers vary greatly from one country to another. The following case studies reveal contrasting problems at different key sites along the EAAF.
A. Tianjin Land reclamations affect Bohai Sea shorebird populations
Land rentals in the special economic zone of Tianjin Municipality, China, are so high that although there is plenty of land available, it is cheaper and less trouble to reclaim new land from the sea. A huge new economic development complex being created on such reclaimed lands is causing extensive loss of important shorebird habitats. CCCC Tianjin Dredging Co., Ltd. won the US$125 million contract from local government to construct 46 km of sea walls and fill the area with dredged silt and sand. A rather complicated and expensive process is used to consolidate this new land before building on it. However, with no rock for some 300 m below the construction zone, and the potential for such a sand / mud mix to liquefy in the event of an earthquake, the entire project looks expensive, ecologically damaging and unsafe; 250,000 people died when the Tangshan earthquake hit this region of China in 1976. It seems developers are willing to take the risks and 44 km2 of new industrial land is being created.
The extent of civil engineering has changed the sea floor of the Yellow Sea, decreasing the size of a deep cold trough where fish survived the summer heat. Turbidity and pollution accumulate because the semi-enclosed Bohai Sea has a very slow seven-year replenishment rate. Loss of birds from Tianjin flats have resulted in big increases in birds at adjacent Tangshan whose flats may not be able to sustain increased populations and is itself threatened by provincial reclamation plans of Caofeidian (Yang et al. 2011a).
Key decision makers: Planners at national, provincial and municipal levelsKey drivers: National, provincial and municipal development plans; high prices for land rent
B. Gulf of Thailand threatened but salt-pans are better than fish ponds (Sripanomyom et al. 2011)
Almost all original mangroves and mudflats of the Gulf of Thailand have been converted into fish ponds, agriculture or salt-pans. Teams studying numbers of 35 species of non-breeding shorebirds at 20 localities around the Gulf of Thailand analysed the influence of landscape characteristics on species richness, abundance, and diversity of shorebirds from October 2006 through to April 2007. Sites with salt-pans present held significantly higher species richness, abundance and diversity of shorebirds. Areas with larger proportions given over to aquaculture tended to have lower species richness, abundance and diversity, partly due to lack of feeding space and also lack of secure high tide roosts. The inset figure shows overall abundance for surveyed sites.
The gulf exhibits examples of both good and poor coastal planning. The Department of Fisheries has tried to develop coastal zone planning for aquaculture. Provincial committees have been encouraged to take responsibility for this duty through the support of the Ministry of the Interior and the Ministry of Agriculture and Cooperatives, but progress has been slow. This may be because of the many conflicts which occur over coastal land use, as well as inadequate laws and regulations (Tookwinas 1998). Recent plans to reclaim and develop a 10-km strip along the northern end of the Gulf are currently being promulgated as part of electioneering promises.
Key decision makers: Planners at national, provincial and county levels, local landowners, farmersKey driver: National and Provincial plans for development of coastal region, investors in reclamations, businessmen, market forces
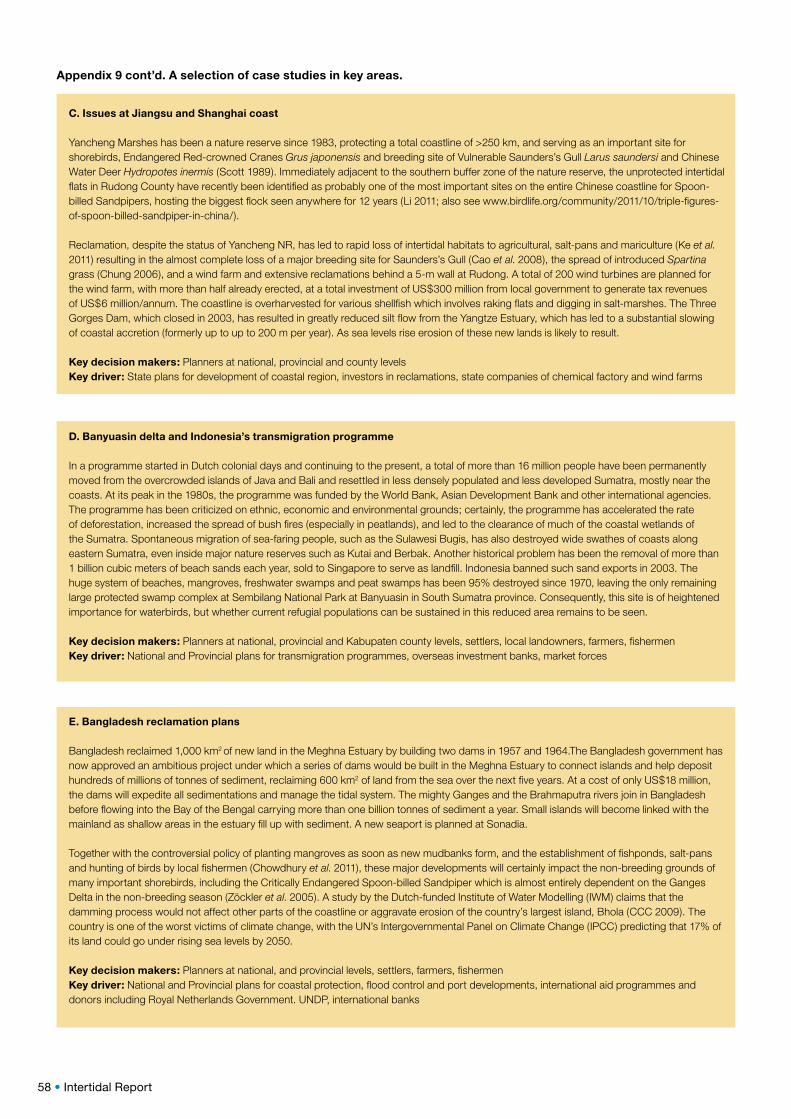
58 • Intertidal Report
Appendix 9 cont’d. A selection of case studies in key areas.
C. Issues at Jiangsu and Shanghai coast
Yancheng Marshes has been a nature reserve since 1983, protecting a total coastline of >250 km, and serving as an important site for shorebirds, Endangered Red-crowned Cranes Grus japonensis and breeding site of Vulnerable Saunders’s Gull Larus saundersi and Chinese Water Deer Hydropotes inermis (Scott 1989). Immediately adjacent to the southern buffer zone of the nature reserve, the unprotected intertidal flats in Rudong County have recently been identified as probably one of the most important sites on the entire Chinese coastline for Spoon-billed Sandpipers, hosting the biggest flock seen anywhere for 12 years (Li 2011; also see www.birdlife.org/community/2011/10/triple-figures-of-spoon-billed-sandpiper-in-china/).
Reclamation, despite the status of Yancheng NR, has led to rapid loss of intertidal habitats to agricultural, salt-pans and mariculture (Ke et al. 2011) resulting in the almost complete loss of a major breeding site for Saunders’s Gull (Cao et al. 2008), the spread of introduced Spartina grass (Chung 2006), and a wind farm and extensive reclamations behind a 5-m wall at Rudong. A total of 200 wind turbines are planned for the wind farm, with more than half already erected, at a total investment of US$300 million from local government to generate tax revenues of US$6 million/annum. The coastline is overharvested for various shellfish which involves raking flats and digging in salt-marshes. The Three Gorges Dam, which closed in 2003, has resulted in greatly reduced silt flow from the Yangtze Estuary, which has led to a substantial slowing of coastal accretion (formerly up to up to 200 m per year). As sea levels rise erosion of these new lands is likely to result.
Key decision makers: Planners at national, provincial and county levelsKey driver: State plans for development of coastal region, investors in reclamations, state companies of chemical factory and wind farms
D. Banyuasin delta and Indonesia’s transmigration programme
In a programme started in Dutch colonial days and continuing to the present, a total of more than 16 million people have been permanently moved from the overcrowded islands of Java and Bali and resettled in less densely populated and less developed Sumatra, mostly near the coasts. At its peak in the 1980s, the programme was funded by the World Bank, Asian Development Bank and other international agencies. The programme has been criticized on ethnic, economic and environmental grounds; certainly, the programme has accelerated the rate of deforestation, increased the spread of bush fires (especially in peatlands), and led to the clearance of much of the coastal wetlands of the Sumatra. Spontaneous migration of sea-faring people, such as the Sulawesi Bugis, has also destroyed wide swathes of coasts along eastern Sumatra, even inside major nature reserves such as Kutai and Berbak. Another historical problem has been the removal of more than 1 billion cubic meters of beach sands each year, sold to Singapore to serve as landfill. Indonesia banned such sand exports in 2003. The huge system of beaches, mangroves, freshwater swamps and peat swamps has been 95% destroyed since 1970, leaving the only remaining large protected swamp complex at Sembilang National Park at Banyuasin in South Sumatra province. Consequently, this site is of heightened importance for waterbirds, but whether current refugial populations can be sustained in this reduced area remains to be seen.
Key decision makers: Planners at national, provincial and Kabupaten county levels, settlers, local landowners, farmers, fishermenKey driver: National and Provincial plans for transmigration programmes, overseas investment banks, market forces
E. Bangladesh reclamation plans
Bangladesh reclaimed 1,000 km2 of new land in the Meghna Estuary by building two dams in 1957 and 1964.The Bangladesh government has now approved an ambitious project under which a series of dams would be built in the Meghna Estuary to connect islands and help deposit hundreds of millions of tonnes of sediment, reclaiming 600 km2 of land from the sea over the next five years. At a cost of only US$18 million, the dams will expedite all sedimentations and manage the tidal system. The mighty Ganges and the Brahmaputra rivers join in Bangladesh before flowing into the Bay of the Bengal carrying more than one billion tonnes of sediment a year. Small islands will become linked with the mainland as shallow areas in the estuary fill up with sediment. A new seaport is planned at Sonadia.
Together with the controversial policy of planting mangroves as soon as new mudbanks form, and the establishment of fishponds, salt-pans and hunting of birds by local fishermen (Chowdhury et al. 2011), these major developments will certainly impact the non-breeding grounds of many important shorebirds, including the Critically Endangered Spoon-billed Sandpiper which is almost entirely dependent on the Ganges Delta in the non-breeding season (Zöckler et al. 2005). A study by the Dutch-funded Institute of Water Modelling (IWM) claims that the damming process would not affect other parts of the coastline or aggravate erosion of the country’s largest island, Bhola (CCC 2009). The country is one of the worst victims of climate change, with the UN’s Intergovernmental Panel on Climate Change (IPCC) predicting that 17% of its land could go under rising sea levels by 2050.
Key decision makers: Planners at national, and provincial levels, settlers, farmers, fishermenKey driver: National and Provincial plans for coastal protection, flood control and port developments, international aid programmes and donors including Royal Netherlands Government. UNDP, international banks

Intertidal Report • 59
F. Reducing impacts of threats to Republic of Korea Yellow Sea coast
Following the great loss of Saemangeum intertidal habitats, other sites along the Korean coast have assumed greater importance for migrating shorebirds. At Ramsar CoP10 in 2008, Prime Minister Lee Myung-bak pledged that no new reclamation projects will be undertaken.
Following on from an original masterplan developed by the military government in the mid-1980s to reclaim 67% of all ROK estuaries, the current government had a long pipeline of plans in the name of ‘Green Development’ (Kim 2011). These would have included several more reclamations and also the development of large-scale tidal energy plants which overlap with important bird areas near Incheon. The existing plans are under review. The proposal for Ganghwa Tidal Power Plant was revised last year. The new proposal would occupy half the area and have half the power production capacity (420 MW instead of 840 MW), and it would not directly conflict with Natural Heritage Site No. 419 (K. Schubert, pers. comm.; see map).
Key decision makers: Planners at national, provincial and city levelsKey driver: National and Provincial plans for reclamation and energy, government budgets, construction industrySongdo Shoreline Change: Songdo Intertidal habitat was called “Meon-eoh-geum” = “endlessly far”! Tidal power plant plans overlap two Important Bird Areas (maps of shoreline change over the years courtesy of Fiona Cundy, Shannon Fiala, Claudia Jimenez, and Gar-Yin Lee, based on a document by Incheon Korean Federation for Environmental Movement; map of the conflicts among the proposed tidal power plants with Wetland Preservation Area no. 5 courtesy of Yekang Ko, Derek K. Schubert, Randolph T. Hester, based on a document by Korean Federation for Environmental Movement (KFEM) using a NAVER aerial image); reclamation history courtesy of Yekang Ko, Derek K. Schubert, Randolph T. Hester, based on data from Seeing the 120 Years of Incheon through Maps, Incheon Development Institute, 2004.

60 • Intertidal Report
Appendix 10. List of attendees of the 6th Meeting of Partners of the East Asian–Australasian Flyway Partnership (EAAFP MOP6), 19–22 March 2012, and the 9th Spoon-billed Sandpiper Task Force Meeting, 23–24 March, Palembang, Indonesia.
Name of officials/experts Partner organization
At 9th SBS Task Force
meeting
Mr Zulkifli Hasan Indonesia (Host) Minister of Forestry
Mr Darori IndonesiaDirector General of Forest Protection and Natural Resources Conservation
Mr H Alex Noerdin Indonesia Governor of South Sumatra
Mr H Amiruddin Inoed Indonesia Head of Banyuasin District
Mr H Eddy Santana Putra Indonesia Mayor of Palembang City
Dr Novianto Bambang Wawandono Indonesia Director, Directorate of Biodiversity Conservation
Mr Agus Sriyadi Budi Sutito Indonesia Deputy Director for Species Conservation, Directorate of Biodiversity Conservation
Mr Dadang Suganda Indonesia Head of Wasur NP
Mr Tatang Indonesia Head of Sembilang NP
Dr Yin Kimsean Cambodia (Chair) Secretary of State of the Ministry of Environment
Dr Srey Sunleang Cambodia Director, Ministry of Environment
Prof. Hem Bonarin Cambodia Pannasastra University of Cambodia
Prof. Lei Guangchun China (Vice Chair) Beijing Forestry University/EAAFP China Secretariat
Dr Yan Zhou China Beijing Forestry University
Mr Paul O’Neill Australia Assistant Director
Ms Makiko Yanagiya Japan Ministry of the Environment
Mr Anson Tagtag The PhilippinesProtected Areas and Wildlife Bureau- Department of Environment and Natural Resources
Mr Jeong Ik Jang Republic of Korea
Ms Soo-Mi Oh
Dr Jin-Han Kim National Institution of Biological Resources (NIBR), Senior Researcher
Dr Evgeny Syroechkovskiy Russian Federation y
Ms Sharon Chan (Chan Khar Luang) Singapore Asst Director (SBWR)
Mr How Choon Beng Senior Conservation Officer (Sungei Buloh Wetland Reserve, SBWR) National Parks Board
Ms Grace Yap National Environment Agency
Mr Douglas Alcorn United States United States Fish and Wildlife Service y
Mr Mohammad Shamsul Azam Bangladesh Deputy/BANGLADESH FOREST DEPARTMENT
Md. Mahmudul Hassan Bangladesh Bangladesh Forest Department
Mrs Aree Wattana Tummkird Thailand Director
Mr Sunate Karapan National Park, Wildlife and Plant Conservation
Dr Batbold Dorjgurkhem Mongolia Director
Dr Colin Francis John O’donnell New Zealand Department of Conservation
Mr Douglas Hykle CMS
Dr Boripat Siriaroonrat FAO Regional Office for Asia and the PacificEmergency Center for Transboundary Animal Diseases – Wildlife Health and Ecology Coordinator
n
Mr Ken Gosbell Australasian Wader Studies Group (AWSG) y
Phil Straw
Mr James Thomas Harris International Crane Foundation (ICF)
Mr Doug Watkins Wetlands International – Oceania Manager
Mr Roger Jaensch Wetlands International – Oceania Professional Associate
Dr Taej Mundkur Wetlands International HQ Programme Manager – Flyways y
Mr Bena Smith WWF Hong Kong Mai Po Reserve Manager
Dr Yvonne Ingje Verkuil IUCN-Canada/Netherlands Independent scientific consultant y
Dr John Ramsay Mackinnon IUCN-UK Individual Expert y
Mr Jonathan Routely Stacey (Programme Manager)
BirdLife International
Ms Cristi Nozawa BirdLife International y
Mr Simba Chan BirdLife International y

Intertidal Report • 61
Mr Noritaka Ichida BirdLife International
Mr Nobuhiko Kishimoto BirdLife International
Dr Mayumi Sato (Global Seabird Programme Asia Coordinator)
BirdLife International
Mr Le Trong Trai (Senior Programme Officer)
BirdLife International – Vietnam y
Ms Vivian Fu (Fu Wing Kan) BirdLife national partner Hong Kong Bird Watching Society (HKBWS) y
Mr YU Yat-Tung BirdLife national partner Hong Kong Bird Watching Society (HKBWS) y
Mr Htin Hla (Myanmar) BirdLife national partnerBiodiversity And Nature Conservation Assoiciation (BANCA, Myanmar)
y
Mr Don Geoff Eya Tabaranza BirdLife national partner Haribon Foundation, Philippines
Mr Yeap Chin Aik BirdLife national partner Malaysian Nature Society
Mr Wicha NARUNGSRI BirdLife national partner Bird Conservation Society of Thailand (BCST) y
Mr Wichyanan Limparungpatthanakij BirdLife national partner Bird Conservation Society of Thailand y
Mr Menxiu Tong Rudong Spoon-billed Sandpiper Survey Group y
Mr Gao Chuan Fujian Birdwatching Society y
Dr Shuihua Chen Zhejiang Museum of Natural History
Dr Sivananinthaperumal Balachandran BirdLife national partner Deputy Director, Bombay Natural History Society (BNHS) y
Mr Minoru Kashiwagi BirdLife national partner Wild Bird Society of Japan (WBSJ) y
Dr Baz Hughes Wildfowl & Wetlands Trust (WWT) Head of Species Conservation Department y
Mr Keith Woodley Miranda Naturalists’ Trust New Zealand
Mr Rick Humphries Rio Tinto
Mrs Denise Goldsworthy Rio Tinto – Dampier Salt
Mrs Nguyen Thi Luong Duyen VietnamBiodiversity Conservation Agency, Vietnam Environment Administration, Ministry of Natural Resources and Environment
n
Ms San San New (Myanmar)Myanmar, Forest Department, Ministry of Environmental Conservation and Forestry (MOECAF)
Staff Officer, Nature and Wildlife Conservation Division
Ms Lily Anak Sir MalaysiaSARAWAK FORESTRY CORPORATION (National Government) Conservation Executive
Dr Christoph Zöckler Spoon-billed Sandpiper Recovery Task Force UNEP WCMC, EAAFP SBS Task Force Coordinator y
Mr Masayuki Kurechi Japanese Association for Wild Goose Protection (JAWGP)
Mr Sayam Uddin Chowdhury Bangladesh Bird Club TF
Ms Jing LI Rudong Spoon-billed Sandpiper Survey Group China Coastal Waterbird Census, Rudong Team, Shanghai y
Ms Nicola J CrockfordRoyal Society for the Protection of Birds (RSPB)-BirdLife in the UK
International Species Policy Officer y
Dr Robert David SheldonRoyal Society for the Protection of Birds (RSPB) – BirdLife in the UK
Head of International Species Recovery y
Dr Morozov Vladimir Birds Russia y
Mr Pavel Ktitorov Russian Society for Conservation and Study of Birds (BirdsRussia)
?
Dr Nigel Anthony ClarkUK Spoon-billed Sandpiper Support team and BTO (British Trust for Ornithology)
y
Dr Nils David Warnock BirdLife national partner Audubon Alaska y
Mr Nial Moores Birds Korea ROK representative of the SBS task Force Team y
Karin Eberhard BirdLife national partnerBiodiversity And Nature Conservation Assoiciation (BANCA, Myanmar)
y
Nguyen Thang Univeristy Ho Chi Minh City y
Mr Nick Murray Queensland University Scientific advisor
Dr Richard Fuller Queensland University Scientific advisor
Mr Zaini Rakhman RAIN (Raptor Indonesia) Head
Mr Yus Roosila Noor Wetlands International -IP Wetlands International Indonesia Program
Dr Dewi Malia Prawiradilaga Indonesian Institute of Science Researcher for Indonesian Science Institute
Ms Dwi Mulyawati BirdLife national partner Burung Indonesia
Mr Yoppy Hidayanto BirdLife national partner Burung Indonesia
Mr Spike Millington Individual Expert y
Ms Carina Stover n
Mr Seung-Joo Hyun Finance Officer y
Ms Minseon Kim Public Information Officer y
Ms Yuna Choi Communication Officer y
Mr Kyoung-Seog Min Deputy Director n

62 • Intertidal Report
Appendix 11. The 388 sites considered in the IUCN situation analysis to identify key areas. Only sites for which biodiversity data was available could be included. Sites in bold had high biodiversity value, and fall within a key area (black) or outside (grey). Details of the identified key areas are provided in Appendix 2 (for each identified key area, additional sites might be named because they were later identified to be part of the key area, although no initial data was available for these sites).
Country/Territory IBA name Lat LongIBA number Ramsar Site name
Bangladesh Char Bhata* 22.83 91.25
Bangladesh Char Tania (Charan Dweep)*
Bangladesh Char Piya* 22.67 91.00
Bangladesh Maulavir Char (Moulavir Char)* 22.38 91.02
Bangladesh Nijum Dweep & Char Osman 22.12 91.05
Bangladesh Ganges-Brahmaputra-Meghna delta* 22.30 91.17 11
Bangladesh Ghatibhanga 21.52 91.90
Bangladesh Hatiya Island 22.58 91.17
Bangladesh Mendol Haor
Bangladesh Muhuri Dam 22.85 91.47 12
Bangladesh Noakhali 22.33 91.17
Bangladesh Patenga Beach 22.23 91.80 16
Bangladesh Sonar Char* 22.30 90.92
Bangladesh Sonadia Island & Cox’s Bazar) 21.31 91.54
Bangladesh Sunderbans (East, South, West Wildlife Sanctuaries) 21.83 89.67 10The Sundarbans Reserved Forest
*The delta is highly dynamic and therefore charts for which data was collected in the last century might currently not exist
Brunei Darussalam Brunei Bay 4.50 114.50 5
Brunei Darussalam Seria Coast or Sungei Bera 4.62 114.32 1
Cambodia Bassac Marshes 11.00 105.17 38
Cambodia Koh Kapik (Koh Kong or Kaoh Kapik) 11.50 103.03 28Koh Kapik and Associated Islets
Cambodia Koh Rong Archipelago 10.72 103.25 34
Cambodia Prek Taek Sap 10.57 103.68 33
Cambodia Prek/Stung Kampong Smach 10.63 103.87 32
Cambodia Sre Ambel 11.10 103.68 29
China (mainland) Baoshan Steel Plant Reservoirs 31.43 121.43
China (mainland) Beidaihe 39.82 119.50 311
China (mainland) Beili Wan Sigeng (Dongfang county) 19.18 108.67 507
China (mainland) Chongming Dongtan Nature Reserve 31.50 121.75 375Chongming Dongtan Nature Reserve, Shanghai
China (mainland) Coast between Ao Jiang and Feiyun Jiang 27.62 120.68 397
China (mainland) Coast southwest of Fangcheng 21.58 108.13 484
China (mainland) Coastal wetlands of northern Chongming Dao island 31.47 121.27 374
China (mainland) Daqing He 39.17 118.92
China (mainland) Dongsha Islands 33.12 121.35
China (mainland) Dongshan Wan 23.70 117.38 417
China (mainland) Dongzhaigang Nature Reserve 19.97 110.58 500 Dongzhaigang
China (mainland) Funing Wan 26.90 120.05 410
China (mainland) Futian (Futian-Neilingding) Nature Reserves 22.53 114.03 496
China (mainland) Guangdong Haifeng Wetlands 22.70 115.20 Haifeng Wetlands
China (mainland) Hangzhou Wan 30.30 120.75 382
China (mainland) Houshui Wan 19.88 109.47 502

Intertidal Report • 63
China (mainland) Jiazhouwan 36.18 120.17
China (mainland) Jiuduansha Nature Reserve (Jiu Duan Sha NNR) 31.17 121.85 376
China (mainland) Laizhou Wan 37.17 119.25 328
China (mainland) Lianyungang saltworks (Haizhouwan (Taibei) Saltworks) 34.71 119.23 365
China (mainland) Linghekou 40.87 121.58
China (mainland) Luan He Estuary 39.42 119.25 312
China (mainland) Miao Gang 30.91 121.88
China (mainland) Min Jiang Estuary 26.17 119.50 411
China (mainland) Nandagang Wetland Nature Reserve (South-west Bo Hai Wan) 38.50 117.50 316
China (mainland) Nanhui - Eastern tidal flat of Nanhui 31.03 121.75 377
China (mainland) Nanliu Jiang Estuary 21.60 109.05 486
China (mainland) North Bo Hai Wan 39.08 118.43
China (mainland) Northern Jiangsu Coastline 35.60 119.70
China (mainland) North-west Bo Hai Wan 38.92 117.83
China (mainland) Qidong Northern Yangtze Estuary Nature Reserve 31.49 121.27 373
China (mainland) Qingdao – Rizhao coastal wetland and islands 36.00 120.33 332
China (mainland) Qinglangang Nature Reserve 19.62 110.87 501
China (mainland) Quanzhou Wan and Jin Jiang Estuary 24.87 118.68 416
China (mainland) Rong Jiang Estuary 23.28 116.72 498
China (mainland) Rudong 31.70 121.00
China (mainland) Sanmen Wan 29.17 121.58
China (mainland) Shankou Mangroves Nature Reserve 21.53 109.75 487Shankou Mangrove Nature Reserve
China (mainland) Shi Jiu Tuo/Daqing He 39.13 118.82
China (mainland)Shuangtaizihekou NNR (Shuangtai(zi) Estuary) and Inner Golf of Liaodong 40.84 121.75 52 Shuangtai Estuary
China (mainland) South Bo Hai Wan 38.13 118.20
China (mainland) South-west Bo Hai Wan (incl. Tianjin & Nandagang) 38.47 117.67320/316, part of
China (mainland) Taizhou Wan 28.62 121.58 391
China (mainland) Tangshan / Caofeidian 39.50 118.14
China (mainland) Tianjin - coastal mudflat of Tianjin 38.40 117.40 320
China (mainland) Wafangdian Fuzhou Wan 39.67 121.58 55
China (mainland) Wenzhou Wan 27.88 120.85 396
China (mainland) Wuyumen 29.15 121.70 388
China (mainland) Xiamen coast (Xinghuawan) 24.30 118.09
China (mainland) Xuanmen Wan 28.15 121.28 395
China (mainland) Xuwei Saltworks 34.50 119.72
China (mainland) Yalu Jiang Estuary (Dandong) 39.82 124.11 62
China (mainland) Yancheng Nature Reserve 33.67 120.50 367
Yancheng National Nature Reserve / Dafeng Milu National Nature Reserve
China (mainland) Yellow River (Huang He) Delta Nature Reserve 37.83 119.00 327
China (mainland) Yinggehai Salt Pans 18.52 108.68 511
China (mainland) Yong Jiang Estuary 30.00 121.65 385
China (mainland) Yueqing Wan 28.23 121.17 394
China (mainland) Zhuanghe Coast 39.58 122.75 59
Hong Kong, SAR China Inner Deep Bay (Mai Po) and Shenzhen River catchment area 22.48 114.03 1Mai Po Marshes & Inner Deep Bay
Macao, SAR China Taipa-Coloane Wetland 22.10 113.53 1
Country /Territory IBA name Lat LongIBA number Ramsar Site name

64 • Intertidal Report
Taiwan, Province of China Aogu Wetlands 23.48 120.17 21
Taiwan, Province of China Beimen 23.27 120.12 25
Taiwan, Province of China Budai Wetlands 23.35 120.13 23
Taiwan, Province of China Changhua Coastal Industrial Park 24.07 120.38
Taiwan, Province of China Chihben Wetlands 22.68 121.05 40
Taiwan, Province of China Chiku 23.13 120.08 27
Taiwan, Province of China Chingkunshen 23.20 120.10 26
Taiwan, Province of China Cho-Shui-Hsi S. 23.83 120.22
Taiwan, Province of China Chu’an 24.82 121.78 47
Taiwan, Province of China Chuan-Hsing 24.20 120.45
Taiwan, Province of China Dapingding and Hsutsuo Harbor 25.07 121.18 6
Taiwan, Province of China Hanbao Wetlands 24.02 120.35 14
Taiwan, Province of China Han-Pao 24.05 120.37
Taiwan, Province of China Hsinchu City Coastal Area 24.78 120.97 9
Taiwan, Province of China Hualien River Estuary 23.95 121.60 43
Taiwan, Province of China Kaomei Wetlands 24.32 120.55 11
Taiwan, Province of China Kaoping River 22.50 120.40 37
Taiwan, Province of China Kinmen National Park 24.45 118.40 48
Taiwan, Province of China Kuantu 25.12 121.45 3
Taiwan, Province of China Ku-Liao 24.80 120.92
Taiwan, Province of China Lanyang River Estuary (Lan-Yang-Hsi River) 24.72 121.82 46
Taiwan, Province of China Lin-Pien-Hsi 22.40 120.50
Taiwan, Province of China Pohtzi River Estuary 23.47 120.17 22
Taiwan, Province of China Sitsao Wildlife Refuge 23.05 120.13 29
Taiwan, Province of China Szu-Tsao Wildlife Reserve 23.02 120.13
Taiwan, Province of China Tacheng Wetlands 23.85 120.25 16
Taiwan, Province of China Taipei City Waterbird Refuge 25.05 121.47 4
Taiwan, Province of China Ta-Too-Hsi 24.13 120.41
Taiwan, Province of China Tatu Rivermouth Wildlife Refuge 24.20 120.48 13
Taiwan, Province of China Tseng-Wen-Hsi 23.08 120.08
Taiwan, Province of China Watzuwei Nature Reserve 25.17 121.40 2
Taiwan, Province of China Yungan (Yung-An) 22.83 120.23 30
DPR Korea Amrok River Estuary 39.80 124.23 13
DPR Korea Chongchon River Estuary (including Mundok Nature Reserve) 39.60 125.42 19
DPR Korea Chongdan field 37.97 125.93 32
DPR Korea Daedong Bay 38.58 125.12 28
DPR Korea Kangryong field 37.90 125.60 31
DPR Korea Kumya Bay 39.40 127.42 8
DPR Korea Onchon field 38.83 125.25 21
DPR Korea Ongjin Bay 37.85 125.25 30
DPR Korea Orangchon River Estuary 41.40 129.75 3
DPR Korea Ryonghung River Estuary 39.82 127.50 6
DPR Korea Sogam-do, Daegam-do, Zung-do, Ae-do and Hyengzedo islands 39.24 125.15 17
DPR Korea Taedong River Estuary 38.72 125.25 22
DPR Korea Unryul Kumsanpo 38.58 125.07 27
Appendix 11 cont’d. The 388 sites considered in the IUCN situation analysis to identify key areas.
Country/Territory IBA name Lat LongIBA number Ramsar site name
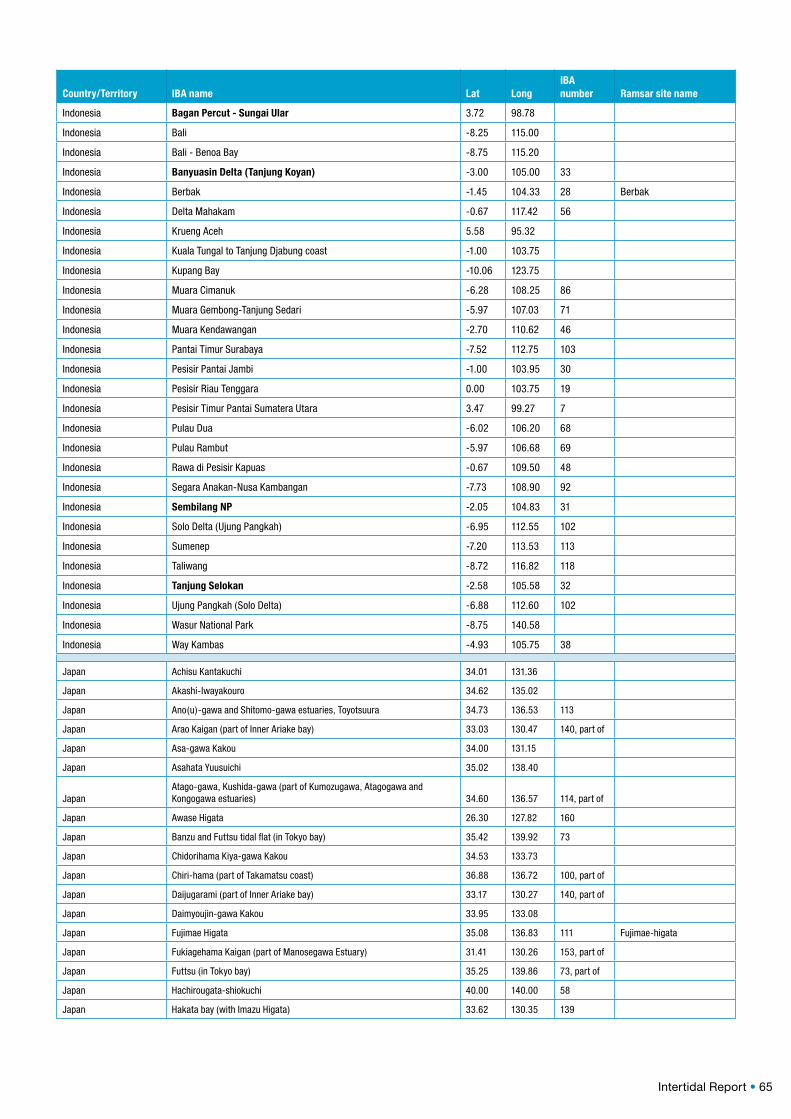
Intertidal Report • 65
Indonesia Bagan Percut - Sungai Ular 3.72 98.78
Indonesia Bali -8.25 115.00
Indonesia Bali - Benoa Bay -8.75 115.20
Indonesia Banyuasin Delta (Tanjung Koyan) -3.00 105.00 33
Indonesia Berbak -1.45 104.33 28 Berbak
Indonesia Delta Mahakam -0.67 117.42 56
Indonesia Krueng Aceh 5.58 95.32
Indonesia Kuala Tungal to Tanjung Djabung coast -1.00 103.75
Indonesia Kupang Bay -10.06 123.75
Indonesia Muara Cimanuk -6.28 108.25 86
Indonesia Muara Gembong-Tanjung Sedari -5.97 107.03 71
Indonesia Muara Kendawangan -2.70 110.62 46
Indonesia Pantai Timur Surabaya -7.52 112.75 103
Indonesia Pesisir Pantai Jambi -1.00 103.95 30
Indonesia Pesisir Riau Tenggara 0.00 103.75 19
Indonesia Pesisir Timur Pantai Sumatera Utara 3.47 99.27 7
Indonesia Pulau Dua -6.02 106.20 68
Indonesia Pulau Rambut -5.97 106.68 69
Indonesia Rawa di Pesisir Kapuas -0.67 109.50 48
Indonesia Segara Anakan-Nusa Kambangan -7.73 108.90 92
Indonesia Sembilang NP -2.05 104.83 31
Indonesia Solo Delta (Ujung Pangkah) -6.95 112.55 102
Indonesia Sumenep -7.20 113.53 113
Indonesia Taliwang -8.72 116.82 118
Indonesia Tanjung Selokan -2.58 105.58 32
Indonesia Ujung Pangkah (Solo Delta) -6.88 112.60 102
Indonesia Wasur National Park -8.75 140.58
Indonesia Way Kambas -4.93 105.75 38
Japan Achisu Kantakuchi 34.01 131.36
Japan Akashi-Iwayakouro 34.62 135.02
Japan Ano(u)-gawa and Shitomo-gawa estuaries, Toyotsuura 34.73 136.53 113
Japan Arao Kaigan (part of Inner Ariake bay) 33.03 130.47 140, part of
Japan Asa-gawa Kakou 34.00 131.15
Japan Asahata Yuusuichi 35.02 138.40
JapanAtago-gawa, Kushida-gawa (part of Kumozugawa, Atagogawa and Kongogawa estuaries) 34.60 136.57 114, part of
Japan Awase Higata 26.30 127.82 160
Japan Banzu and Futtsu tidal flat (in Tokyo bay) 35.42 139.92 73
Japan Chidorihama Kiya-gawa Kakou 34.53 133.73
Japan Chiri-hama (part of Takamatsu coast) 36.88 136.72 100, part of
Japan Daijugarami (part of Inner Ariake bay) 33.17 130.27 140, part of
Japan Daimyoujin-gawa Kakou 33.95 133.08
Japan Fujimae Higata 35.08 136.83 111 Fujimae-higata
Japan Fukiagehama Kaigan (part of Manosegawa Estuary) 31.41 130.26 153, part of
Japan Futtsu (in Tokyo bay) 35.25 139.86 73, part of
Japan Hachirougata-shiokuchi 40.00 140.00 58
Japan Hakata bay (with Imazu Higata) 33.62 130.35 139
Country/Territory IBA name Lat LongIBA number Ramsar site name

66 • Intertidal Report
Japan Hamamatsu-Si Shouwa-cho 34.73 137.58
Japan Hayatsue-gawa Kakou (Inner Ariake bay) 33.15 130.33 140, part of
Japan Hikata Hachimangoku 36.75 140.68
Japan Hikawa Estuary, Shiranui 32.62 130.62 145
Japan Hori-kawa, Magame-gawa (with Nabaki-gawa) 35.49 140.43
Japan Ichinomiya-gawa Kakou 35.39 140.39
Japan Iioka Kaigan (Hazaki coast) 35.70 140.72 70, part of
Japan Ikawazu 34.62 137.13 107
Japan Inba-numa 35.78 140.32
Japan Inbanuma-Cyuuouhaisuiro 35.75 140.25
Japan Inner Ariake bay 33.13 130.25 140
Japan Inner Tokyo bay 35.60 139.88 74 Yatsu-higata
Japan Isahaya Higata (Ariake bay) 32.83 130.08 141
Japan Izumi Kantaku 32.08 130.37 151
Japan Kagawa Kitanoe Kaisaku 34.07 131.03
Japan Kahokugata (Takamatsu coast) 36.67 136.68 100
Japan Kaitsu-cho Nokouchi 35.16 136.66
Japan Kakinoki-cho 35.83 140.78
Japan Kamisu-Chou Takahama (with Ikisu-Omigawa) 35.87 140.63
Japan Kamo-gawa Kakou 33.92 133.17 131
Japan Kasai Kaihinkouen (Inner Tokyo bay) 35.62 139.87 74, part of
Japan Kashima Shingomori (Inner Ariake bay) 33.12 130.10 140, part of
Japan Kashimanada 36.00 140.66
Japan Kikuchi-gawa Kakou (Ariake bay) 32.88 130.53
Japan Kiritappu Shitsugen (Kiritappu marsh, Biwase bay) 43.16 145.18 15 Kiritappu-shitsugen
Japan Komaiko Kaigan, with Neagari Kaigan (Takamatsu coast) 36.47 136.47 102
Japan Komuke-ko (Komukeko and Shibunotsunaiko lake) 44.27 143.48 7
Japan Kujukuri Hama 35.79 140.57 72
Japan Kuma-gawa Kakou / Kumakawa Estuary 32.47 130.57 146
Japan Kumedaike 34.45 135.42
Japan Kumozugawa, Atagogawa and Kongogawa estuaries 34.62 136.55 114
Japan Lake Furenko (Fuuren-ko) and nearby wetlands (Onnetou ohashi) 43.30 145.35 12
Japan Lake Notoroko and Lake Abashiriko 44.05 144.17 8
Japan Lake Tofutsuko 43.93 144.40 9
Japan Makuharinohama (Inner Tokyo bay) 35.65 140.05 74, part of
Japan Manko tidal flat 26.18 127.68 161 Manko
Japan Manosegawa Estuary 31.43 130.30 153
Japan Matsugishi-higata (Hazaki coast) 35.73 140.80 70, part of
Japan Messe Chuushajou (Inner Tokyo bay) 35.65 140.03 74, part of
Japan Mikumo-cho Kaigan Kouhaichi 34.63 136.55
Japan Miyagawakakou, Sotoshirotagawakakou 34.50 136.72
Japan Mogamigawa Estuary 38.90 139.83 61
Japan Morie-wan 33.40 131.67
Japan Morigasakinohana (Inner Tokyo bay) 35.56 139.77 74, part of
Japan Moriyamashi-kogan 35.13 135.92
Japan Mukawa Kakou 42.57 141.93 27
Japan Nagasaki Kaigan (Hazaki coast) 35.70 140.80 70, part of
Appendix 11 cont’d. The 388 sites considered in the IUCN situation analysis to identify key areas.
Country/Territory IBA name Lat LongIBA number Ramsar site name

Intertidal Report • 67
Japan Nakatsu and Usa tidal flats 33.58 131.25 147
Japan Narashino-akanehama (Inner Tokyo bay) 35.65 140.02 74, part of
Japan Naruto-machi Suiden 35.34 140.28
Japan Nisikaminomiya-machi 36.32 139.15
Japan Notsuke bay, Odaito 43.58 145.30 11
Japan Obitsu-gawa Kakou (Tokyo bay) 35.33 139.92 73, part of
Japan Okita-gawa Kakou 32.53 131.68
Japan Okukubi-gawa Kakou 26.43 127.95
Japan Omaezaki-kaigan 34.60 138.23
Japan Onaga Higata 26.15 127.67
Japan Ookubo Noukouchi 35.99 139.03
Japan Oono-gawa, Suna-gawa Kakou (Hikawa Estuary) 32.62 130.65 145, part of
Japan Ootagawa-kakao 34.67 137.90
Japan Osaka Nanko / Nankou Yachouen 34.63 135.47 119
Japan Rokkaku-gawa Kakou (Inner Ariake bay) 33.20 130.22 140, part of
Japan Saigawa-karyuu (Takamatsu coast) 36.60 136.58 100, part of
Japan Sanbanze (Inner Tokyo bay) 35.67 139.98 74, part of
Japan Saroma-ko 44.13 143.83
Japan Shigenobu-gawa Kakou 33.72 132.70
Japan Shimofusa-machi Taka 35.90 140.38
Japan Shiokawa tidal flat (with Jinno Shinden) 34.68 137.30 108
Japan Shiraho, Miyara-wan 24.35 124.21
Japan Shirakata-chou (Takamatsu coast) 36.19 136.13 100, part of
Japan Shirakawa Estuary 32.78 130.60 144
Japan Shoudai ?? ??
Japan Sone tidal flat 33.82 130.97 135
Japan Suzuka-gawa Kakou, Suzuka-hasen Kakou 34.92 136.65
Japan Takamatsu, Kahoku Kaigan (Takamatsu coast) 36.75 136.70 100, part of
Japan Takase-gawa Kakou 40.73 141.42
Japan Teganuma 35.85 140.08
Japan Tennou Kaigan 39.90 139.96
Japan Teruma Higata 26.34 127.91
Japan Tochigi-ken Nanbu, Suiden-chitai 36.28 139.80
Japan Todomekigawa-kakou 35.05 136.88
Japan Tokyo Port Wild Bird Park (Inner Tokyo bay) 35.59 139.78 74, part of
Japan Tonegawa Estuary (Hazaki coast) 35.75 140.83 70
Japan Torinoumi-higata 38.03 140.92
Japan Toukyou-kou Chobokujou (Inner Tokyo bay) 35.62 139.84 74, part of
Japan Toukyou-kou, Yatyouen Shuuhen (Inner Tokyo bay) 35.57 139.77 74, part of
Japan Toyama Shinkou (Toyama coast) 36.79 137.06
Japan Tyuuou-bouhatei Uchi-Sotogawa Umetatechi (Inner Tokyo bay) 35.58 139.82 74, part of
Japan Uchiura Wan 35.07 138.84
Japan Umeda-gawa Kakou 34.72 137.35
Japan Usa Kaigan 33.57 131.43
Japan Wada-chikura Kaigan 34.95 139.97
Japan Wajiro Higata 33.68 130.42 139, part of
Japan Yaeyama islands 24.33 123.83 166
Japan Yahagigawa Estuary 34.82 136.98 109
Country/Territory IBA name Lat LongIBA number Ramsar site name

68 • Intertidal Report
Japan Yahagihuru-kawa Kakou 34.80 137.20
Japan Yatsu Higata (Inner Tokyo bay) 35.68 140.03 74, part of
Japan Yodaura Suiden 35.92 140.53
Japan Yonaha-wan 24.75 125.27
Japan Yone and Gushi tidal flats (Gushi Higata) 26.17 127.65 162
Japan Yoshino-gawa Kakou-higata 34.07 134.58
Malaysia Bako-Buntal Bay (or Buntal Bay) 1.73 110.42 37
Malaysia Batu Maung 5.37 100.30
Malaysia Brunei Bay 4.90 115.15 55
Malaysia Kapar Power Station (North-central Selangor coast) 3.13 101.33 11, part of
Malaysia Klias peninsula 5.21 115.35 28
Malaysia Kuala Gula (Matang coast) 4.93 100.47 5, part of
Malaysia Kuala Kedah to Kuala Sungai coast 6.25 100.22
Malaysia Kuala Kelumpang (Matang coast) 4.87 100.50 5, part of
Malaysia Kuala Mersing 2.42 103.88
Malaysia Kuala Samarahan to Kuala Sadong, coastline 1.60 110.62
Malaysia Matang coast 4.92 100.50 5
Malaysia North-central Selangor coast 3.33 101.25 11
Malaysia Pantai Rasa Sayang (North-central Selangor coast) 3.47 101.13 11, part of
Malaysia Pantai Tanjong Karang ( (North-central Selangor coast) 3.42 101.18 11, part of
Malaysia Papar, Sabah 5.70 115.93
Malaysia Parit 30/ Parit Jawa
Malaysia Pulau Bruit National Park 2.57 111.35 42
Malaysia Pulau Tengah (Klang Islands) 2.97 101.31
Malaysia Sadong-Saribas coast 1.72 110.92 41
Malaysia South-west Johor coast 1.65 103.17 15Tanjung Piai / Pulau Kukup / Sungai Pulai
Malaysia Sungai Air Hitam
Malaysia Sungai Batu Pahat - Sungai Suloh Kechil (South-west Johor coast) 1.75 102.92 15, part of
Malaysia Sungai Betul Bagan Tiang
Malaysia Sungai Larut to Port Weld (Matang coast) 4.83 100.58 5, part of
Malaysia Tanjong Bidadari, Sabah 5.92 118.08
Malaysia Tanjung Datu-Samunsam Protected Area 1.92 109.60 34
Malaysia Tanjung Piai 34, part of?
Malaysia Teluk Air Tawar-Kuala Muda coast 5.52 100.43 3
Malaysia Tempasuk plains 6.43 116.45 33
Myanmar Arrakan (Bay of Arrakan) 19.36 93.38
Myanmar Ayeyarwaddy / Irrawaddy Delta 16.12 94.74 47
Myanmar Central Tanintharyi 12.26 98.37
Myanmar Dawei River in the Tanintharyi coastal zone 14.05 98.12
Myanmar Gulf of Martaban / River mouth area of Sittaung River 16.32 97.36
Myanmar Kaladan Estuary 20.15 92.95
Myanmar Kyetmauktaung Dam 20.80 95.25
Myanmar Labutta (in Ayeyarwaddy / Irrawaddy Delta) 16.12 94.74
Myanmar Letkok Kon (Ayeyarwaddy / Irrawaddy Delta) 16.33 96.17
Myanmar Minhla-Nyaung Lake 20.83 96.03
Appendix 11 cont’d. The 388 sites considered in the IUCN situation analysis to identify key areas.
Country/Territory IBA name Lat LongIBA number Ramsar site name

Intertidal Report • 69
Myanmar Nanthar Island in the Rakhine Coastal Zone 18.45 93.36
Philippines Arevalo-Muanduriao 10.70 122.52
Philippines Buguey wetlands 18.28 121.83 12
Philippines Davao River Mouth 7.03 125.60
Philippines Mactan, Kalawisan and Cansaga Bays (is Cebu-Mactan) 10.33 123.97 70
Philippines Manila Bay 14.50 120.75 10
Philippines Olango Island 10.23 124.03 69Olango Island Wildlife Sanctuary
Philippines Ormoc Intertidal Flat 11.00 124.57
Philippines Pagbilao and Tayabas Bay 13.92 121.72 26
Philippines Panabo 7.30 125.72
Philippines Ragay Gulf 13.75 122.60 28
PhilippinesTalibon Protected Landscape and Seascape, with Banacon, Calituban, Tahong-tahong Islands 10.15 124.15 79
Philippines Talon-Talon Wetland 6.92 122.12
Philippines Tubbataha Reef (National Marine Park) 8.83 119.92 57
Republic of Korea Aphae Island 34.83 126.33
Republic of Korea Asan Bay (including Asan-ho lake and Sapgyo-ho lake) 36.95 126.82 17
Republic of Korea Baeksu Tidal Flat (Paeksu Tidal Flat) 35.27 126.32 24
Republic of Korea Cheonsu Bay (or Seosan) 36.49 126.44 18
Republic of Korea Jido-eup, Shinan-gun (part of contiguous Meian Gun Tidal Flat) 35.05 126.20
Republic of Korea Daebu-do / Daebu island 37.25 126.48 8
Republic of Korea Dongjin Estuary (Saemangeum) 35.78 126.75 22
Republic of Korea Gangjin Bay 34.53 126.80 30
Republic of Korea Geum-gang river and Estuary (Kum Estuary) 36.08 126.75 19
Republic of Korea Gomso Bay 35.35 126.36
Republic of Korea Hado-ri, Jeju 33.50 126.88 39
Republic of Korea Hwangsan-myeon, Haenam-gun 34.42 126.50
Republic of Korea Hampyeong / Hampyong Bay 35.12 126.42 25
Republic of Korea Han-gang Estuary / Han River 37.69 126.68 4
Republic of Korea Gochang-gun 35.42 126.58
Republic of Korea Mangyeong / Mankyung Estuary (Saemangeum) 35.90 126.75 21
Republic of Korea Meian Gun Tidal Flat 35.08 126.33
Republic of Korea Muan Tidal Flat 35.92 126.33 26
Republic of Korea Nakdong-gang Estuary 35.13 128.92 37
Republic of Korea Namhae 34.83 127.83
Republic of Korea Namyang Bay 37.14 126.77 10
Republic of Korea Seongsanpo, Seogwipo 33.45 126.92 40
Republic of Korea Sihwa-ho lake 37.28 126.75 9
Republic of Korea Songdo Tidal Flat 37.42 126.65
Republic of Korea Suncheon Bay 34.83 127.50 31
Republic of Korea Tidal flat area of southern Ganghwa-do island (Kanghwa Island) 37.58 126.40 5
Republic of Korea Tidal flat area of Yeongjong-do (Yong Jong) Island 37.45 126.53 6
Republic of Korea Tongjin River Lagoon and mudflat 35.74 126.63
Republic of Korea Yeongheung-do and Sonje-do islands 37.25 126.50 7
Republic of Korea Yubu-do island (Geum-gang river and estuary) 35.98 126.62 20
Singapore Kranji 1.42 103.72 1
Singapore North-East Conservation Area (with Serangoon Ponds) 1.42 103.97 2
Country/Territory IBA name Lat LongIBA number Ramsar site name

70 • Intertidal Report
Singapore Sungei Buloh Wetland Reserve 1.45 103.72
Thailand Ao Bandon 9.28 99.45 41
Thailand Ao Pattani (Pattani Bay) 6.92 101.27 58
Thailand Inner Gulf of Thailand 13.51 100.53 32 Don Hoi Lot
Thailand Khao (Kato) Sam Roi Yot National Park and surrounding wetlands 12.20 99.97 36
Thailand Ko Libong Non Hunting Area 7.27 99.40 50
Had Chao Mai Marine National Park - Ta Libong Island Non-Hunting Area - Trang River Estuaries
Thailand Ko Pra Thong 9.08 98.28 46
Thailand Laem Pakarang 8.72 98.22 45
Thailand Na Muang Krabi (Krabi Bay) 7.95 98.85 48 Krabi Estuary
Thailand Palian Lang-ngu 7.17 99.68 52
Thailand Thale Noi Non-Hunting Area 7.83 100.13 56Kuan Ki Sian of the Thale Noi Non-Hunting Area
Thailand Thale Sap Songkhla Non Hunting Area and surrounding wetlands 7.88 100.17 57
Timor Timor -10.00 120.50
Vietnam An Hai 20.82 106.75 16
Vietnam Bai Boi ((very close to Dat Mui) 8.70 104.83 1
Vietnam Binh Dai (Hoa Trinh, Ba Tri) 10.13 106.75 62, 63
Vietnam Can Gio 10.52 106.90 51
Vietnam Cat-Tien NP 11.35 107.00
Vietnam Dat Mui (very close to Bai Boi) 8.62 104.73 2
Vietnam Ha Nam 20.87 106.82 60
Vietnam Nghia Hung (Day and Ninh Co Estuary) 19.97 106.17 12
Vietnam Tan Thanh intertidal area & Ngang Island
Vietnam Thai Thuy 20.55 106.63 14
Vietnam Tien Hai 20.30 106.60 13
Vietnam Tien Lang 20.67 106.67 15
Vietnam Tra Co 21.47 108.02 61
Vietnam Xuan Thuy 20.35 106.52 17Xuan Thuy Natural Wetland Reserve
Appendix 11 cont’d. The 388 sites considered in the IUCN situation analysis to identify key areas.
Country/Territory IBA name Lat LongIBA number Ramsar site name

The designation of geographical entities in this book, and the presentation of the material, do not imply the expression of any opinion whatsoever on the part of IUCN or the compilers concerning the legal status of any country, territory, or area, or of its authorities, or concerning the delimitation of its frontiers or boundaries. The views expressed in this publication do not necessarily reflect those of IUCN or other participating organizations.
Published by: IUCN, Gland, Switzerland
Copyright: © 2012 International Union for Conservation of Nature and Natural ResourcesReproduction of this publication for educational or other non-commercial purposes is authorized without prior written permission from the copyright holder provided the source is fully acknowledged. Reproduction of this publication for resale or other commercial purposes is prohibited without prior written permission of the copyright holder.
Citation: MacKinnon, J., Verkuil, Y.I. & Murray, N. 2012. IUCN situation analysis on East and Southeast Asian intertidal habitats, with particular reference to the Yellow Sea (including the Bohai Sea). Occasional Paper of the IUCN Species Survival Commission No. 47. IUCN, Gland, Switzerland and Cambridge, UK. ii + 70 pp.
ISBN: 978-2-8317-1255-0
Photo credits: Tony Mok (cover photo, Seaweed farming on the Xiapu mudflat, Fujian County, China), Jeong Ahn (photo page 13), Jan van der Kam (photo in Fig. 3, page 7), Ju Yung Ki (photos Box 2, page 18), Nick Murray (photos Fig. 10, Appendix 9)
Available from: IUCN (International Union for Conservation of Nature)Publications ServicesRue Mauverney 281196 GlandSwitzerlandTel +41 22 999 0000Fax +41 22 999 [email protected]/publications
Also available at www.iucn.org/asiancoastalwetlands
About IUCNIUCN, International Union for Conservation of Nature, helps the world find pragmatic solutions to our most pressing environment and development challenges. IUCN works on biodiversity, climate change, energy, human livelihoods and greening the world economy by supporting scientific research, managing field projects all over the world, and bringing governments, NGOs, the UN and companies together to develop policy, laws and best practice. IUCN is the world’s oldest and largest global environmental organization, with more than 1,200 government and NGO members and almost 11,000 volunteer experts in some 160 countries. IUCN’s work is supported by over 1,000 staff in 45 offices and hundreds of partners in public, NGO and private sectors around the world. Web: www.iucn.org
IUCN Species Survival CommissionThe Species Survival Commission (SSC) is the largest of IUCN’s six volunteer commissions with a global membership of 8,000 experts. SSC, working with the Global Species Programme of IUCN, advises IUCN and its members on the wide range of technical and scientific aspects of species conservation and is dedicated to securing a future for biodiversity. SSC has significant input into the international agreements dealing with biodiversity conservation. Web: http://www.iucn.org/about/work/programmes/species/about_ssc/index.cfm
IUCN Asia Regional OfficeIUCN’s Asia programme is served by the IUCN Asia Secretariat, based out of the Asia Regional Office (ARO) in Bangkok, Thailand, in close collaboration with IUCN Headquarters in Gland, Switzerland. The IUCN Secretariat has some 300 staff in country and liaison offices in Bangladesh, Cambodia, China, India, Lao PDR, Nepal, Pakistan, Sri Lanka, Thailand and Viet Nam. To address the challenges in managing the large transboundary ecosystems of Asia and respond to the demands of the constituents, the Asia Region has realigned to form three subregional groups: a Southeast Asia Group managed by a Group Head (Cambodia, Indonesia, Lao PDR, Singapore, Thailand, Timor-Leste and Viet Nam); a South Asia Subregional Group (covering all the South Asian countries) headed by one of the IUCN Country Representatives in South Asia on a rotational basis; and a North and East Asia Subregional Group managed directly by the Regional Director working closely with the Country Representative of China (China, Mongolia, Japan, North Korea and South Korea).

IUCN situation analysis on East and Southeast Asian intertidal habitats, with particular reference to the Yellow Sea (including the Bohai Sea)
John MacKinnon, Yvonne I. Verkuil and Nicholas Murray
Occasional Paper of the IUCN Species Survival Commission No. 47
INTERNATIONAL UNIONFOR CONSERVATION OF NATURE
www.iucn.org
Produced with support from