iv infusion charge capture – austin smith radiology pre-authorization project – vanessa calderon...
TRANSCRIPT

Increased Revenue Opportunities
IV Infusion Charge Capture – Austin SmithRadiology Pre-Authorization Project – Vanessa Calderon
Process Improvement (Clinical Quality), IH-DM
IV Infusion Charge CaptureTeam: Executive Sponsor: Maureen Adams – Executive Director – Med/Surg NursingPatty Armstrong – Director of ComplianceSusan Barrett – HIM ManagerAngie Boord – Pharmacy ManagerCrystal Estabrook – Director of Revenue CycleLacy Little – Y7 Adaptive DesignCorey Martin – Central Supply ManagerRoxy Menke – Clinical Informatics SpecialistMary Parks – P5 Nursing ManagerAmber Sandquist – Coding CoordinatorAustin Smith – Process Improvement CoordinatorJan Stipe – Director of Case ManagementChris Wood – N5 Nursing Manager

Revenue Cycle Recovery – IV Infusion
I. Business Case
II. Current Condition
IV. Target Condition (Proposal)
VI. Metrics/Follow-up
Author: Austin Smith Date: 1/10/11
V. Action Plan
What Who When
III. Problem Statement

BackgroundIdentified by: Revenue Cycle team during
auditsProposed/Selected for Process Improvement
ProjectStarted: 1/3/2011
1. $500,000 additional revenue2. Accurate Medical Records3. Reduce Denials Associated with Documentation
Business Case

Current ConditionIV Push: Reimbursement Requirement: Chart, Document Start Time Current Practice: Consistently charted, start time documented Coding: Charges for all IV Pushes
IV Piggyback: Reimbursement Requirement: Chart, Document Start/Stop Time Current Practice: Consistently charted, start time documented, no stop time Coding: No Charges for IV Piggybacks
IV Hydration: Reimbursement Requirement: Chart, Document Start/Stop Time of each bag Current Practice: Seldom Charted, no start/stop time Coding: No Charges for IV Hydration
Problem StatementPatients with “Observation” status are not
currently billed for IV Piggyback or IV Hydration because stop times are not documented.

Target Condition – Short TermDecided to narrow the focus to only IV
PiggybacksCoding charges IV Push for IV Piggyback
without Stop TimesJustification: Push only requires a start time, this
would be under charging
January 1st – September 6th
Charges: $1,379,815Estimated Collections:$434,642

Problem Solving – Target ConditionHow do we document all ACTUAL stop
times?
Options:Nurses remember start time and know when to go back for stop
timeNot accurate, no reminder, hard to ID observation patients
Get the actual stop time from the event log in the IV PumpNo reminder, hard to ID observation patients, time away from
patientsIV Pump interface with CareCast or EPIC
No Capability YETIV Pump Alarm when switching from IV Piggyback to Hydration
No Capability

Only physically possible solution: Nurses manually chart stop times.
We Were at a Stand Still… until…Asked Lacy Little - Younker 7 UBE to help
determine feasibility of options and brainstorm additional solutions.
Found “Done Time” in the charting area of CareCast Investigated to see functionalityIs a calculated time acceptable?Does this field appear where a coder could see it?
Problem Solving – Target Condition
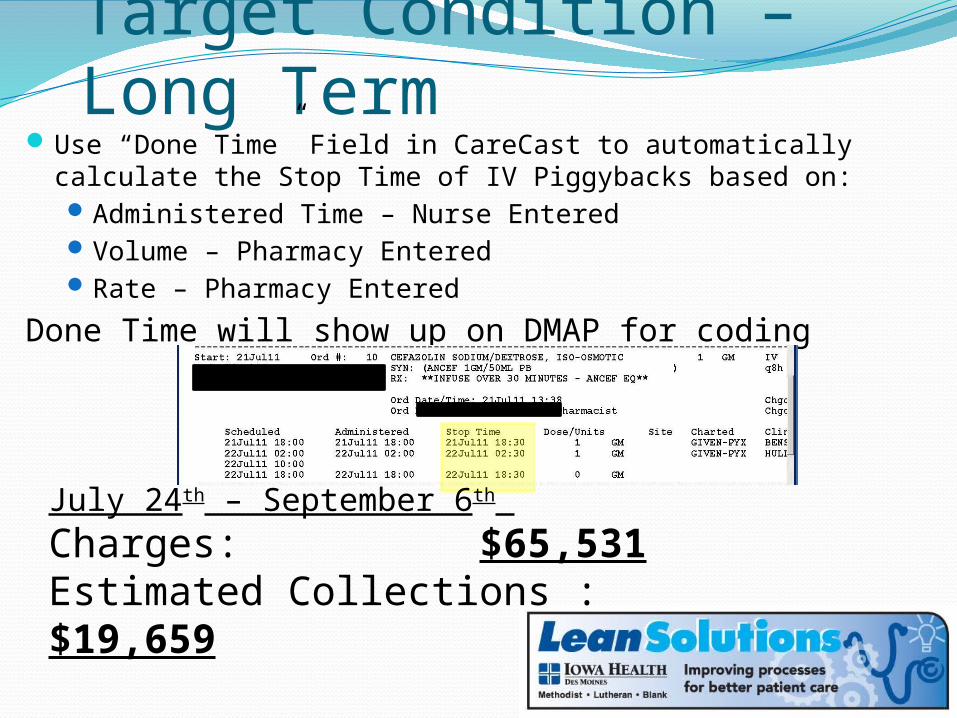
Target Condition – Long TermUse “Done Time” Field in CareCast to automatically calculate
the Stop Time of IV Piggybacks based on:Administered Time – Nurse Entered Volume – Pharmacy Entered Rate – Pharmacy Entered
Done Time will show up on DMAP for coding
July 24th – September 6th
Charges: $65,531Estimated Collections : $19,659
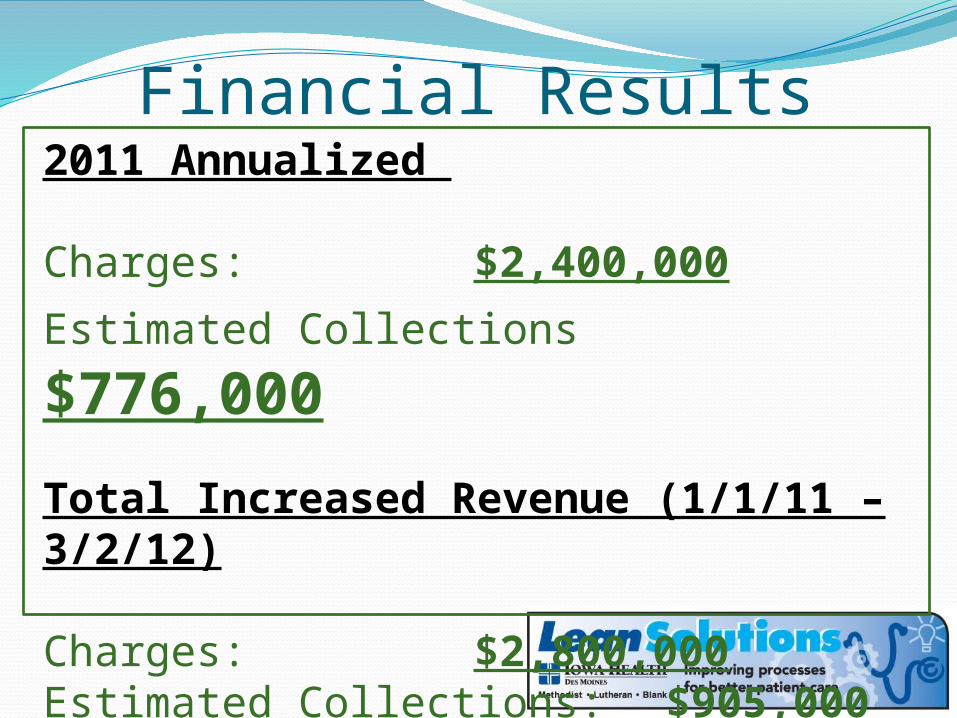
Financial Results2011 Annualized
Charges: $2,400,000
Estimated Collections $776,000
Total Increased Revenue (1/1/11 – 3/2/12)
Charges: $2,800,000Estimated Collections: $905,000


Radiology Pre-Auth ProjectTeam: Sponsors: Todd Kranpitz – Executive Director – Radiology Services
Crystal Estabrook, Director of Revenue CycleAmber Sandquist, Denials CoordinatorMatt Helgeson, Manager Radiology, IH-DMYvonne Grant – Supervisor Radiology, ILH Curtis Waddingham – Supervisor Radiology, MWHMcKenzie Cooper (CT Tech), Lisa Sandin (MRI Tech)Jane Beeman, Manager Pt. Access – SchedulingGlenda Seemiller, Director Pt. AccessAmber Aschan, Michelle Engle (Specialized Schedulers, “Audit Team”)Vanessa Calderon, Process Improvement Coordinator

AgendaProject Background – A3Building the TeamCreating a Manageable ScopeProcess Mapping to Identify IssuesBuilding SolutionsSustaining the Gains
A3: Radiology – Pre-Certification Project
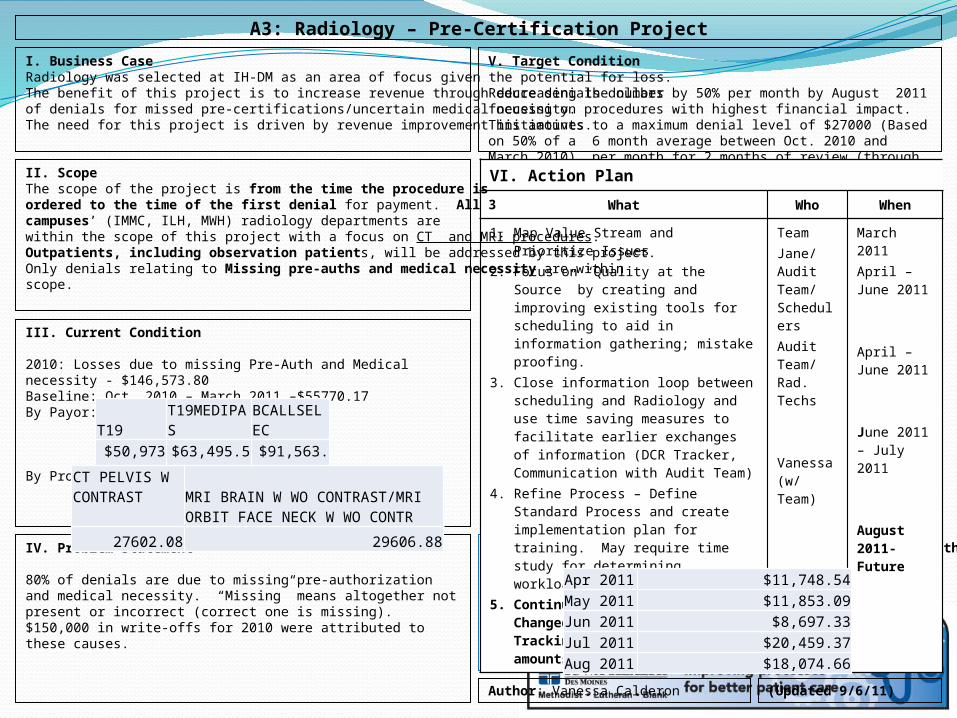
I. Business CaseRadiology was selected at IH-DM as an area of focus given the potential for loss.The benefit of this project is to increase revenue through decreasing the number of denials for missed pre-certifications/uncertain medical necessity.The need for this project is driven by revenue improvement initiatives.
III. Current Condition
2010: Losses due to missing Pre-Auth and Medical necessity - $146,573.80Baseline: Oct. 2010 – March 2011 –$55770.17By Payor:
By Procedure: Top MRI, Top CT Write-Offs
V. Target Condition
Reduce denials dollars by 50% per month by August 2011 focusing on procedures with highest financial impact. This amounts to a maximum denial level of $27000 (Based on 50% of a 6 month average between Oct. 2010 and March 2010) per month for 2 months of review (through September 2011).
VII. Metrics/Follow-up (Current Avg: $14.166.60 for 5 months post-project) or 74.59% reduction
Author: Vanessa Calderon (Updated 9/6/11)
VI. Action Plan
What Who When
1. Map Value Stream and Prioritize Issues2. Focus on “Quality at the Source” by creating
and improving existing tools for scheduling to aid in information gathering; mistake proofing.
3. Close information loop between scheduling and Radiology and use time saving measures to facilitate earlier exchanges of information (DCR Tracker, Communication with Audit Team)
4. Refine Process – Define Standard Process and create implementation plan for training. May require time study for determining workload.
5. Continue Tracking/Reporting Changed Orders. Continue Tracking Monthly Write-off amounts.
TeamJane/Audit Team/ SchedulersAudit Team/ Rad. Techs
Vanessa (w/ Team)
Team
March 2011April – June 2011
April – June 2011
June 2011 – July 2011
August 2011-Future
IV. Problem Statement
80% of denials are due to missing pre-authorization and medical necessity. “Missing” means altogether not present or incorrect (correct one is missing). $150,000 in write-offs for 2010 were attributed to these causes.
II. ScopeThe scope of the project is from the time the procedure is ordered to the time of the first denial for payment. All 3 campuses’ (IMMC, ILH, MWH) radiology departments are within the scope of this project with a focus on CT and MRI procedures. Outpatients, including observation patients, will be addressed by this project. Only denials relating to Missing pre-auths and medical necessity are within scope.
Apr 2011 $11,748.54May 2011 $11,853.09Jun 2011 $8,697.33Jul 2011 $20,459.37Aug 2011 $18,074.66
T19T19MEDIPAS
BCALLSELEC
$50,973.81
$63,495.51
$91,563.14
CT PELVIS W CONTRAST
MRI BRAIN W WO CONTRAST/MRI ORBIT FACE NECK W WO CONTR
27602.08 29606.88

Project BackgroundPre-authorizations often necessary for
proceduresIf procedure changes, new pre-auth must be
obtainedGathering pre-auths can be time consuming
and time by radiology staff should be spent serving patients

Step 1: Gather DataUse Pareto Analysis and Graphs to Narrow
Scope

Step 1: Gather DataDetermine mix of cases being denied (Two-
Factors)
*Focus on CT, MRI (upper left purple area) first, then on specific insurance to capture additional denials (lower pink area)

Step 2: Develop TeamExplore the AreaLook for key players in the processIn addition to Managers, Find Area Leaders:
Radiology Staff McKenzie Cooper (CT Tech), Lisa Sandin (MRI
Tech)Scheduling Staff
Amber Aschan, Michelle Engle (Specialized Schedulers, “Audit Team”)

Step 3: Define ScopeBasic Scope and Problem Statement DefinedPresent Data to Team to Refine Scope
Pinpoint Areas where Low Effort = High Impact
Set Attainable yet Aggressive Goals based on Facts

Step 4: Map the ProcessObservation and Group-Work to Map Process
(Visio)

Step 5: Log IssuesYellow “Kaizen” bursts on map indicate areas
where errors can occur that lead to missing authorizations
Top Issues placed in an Issue Log / Action Item List

Step 6: Build CountermeasuresDevelop Tools to help brainstorm
Countermeasures

Step 7: Construct/Conduct TrialsDocument Steps involved in TrialDetermine timeframe, scope, and players
involvedCommunicate TrialCheck Intermittently and capture Results
Trial: One CT Tech will review all Abdomen/Pelvis orders 3 days before cases to determine if orders need to be changed. Contact Audit Team who will obtain New/Changed Authorization before scheduled case.
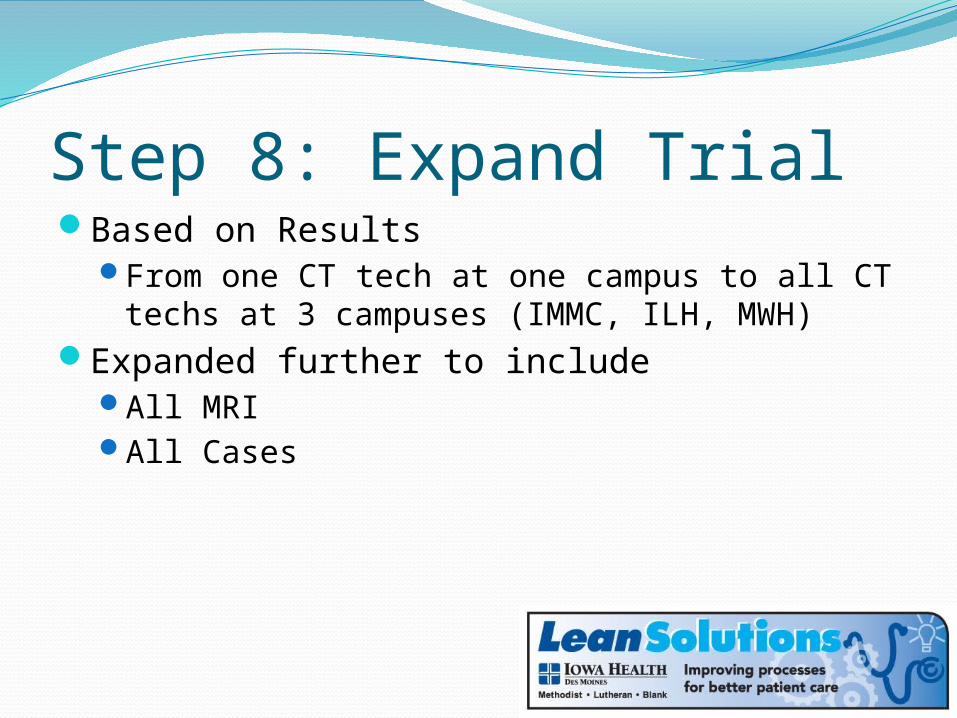
Step 8: Expand TrialBased on Results
From one CT tech at one campus to all CT techs at 3 campuses (IMMC, ILH, MWH)
Expanded further to includeAll MRI All Cases
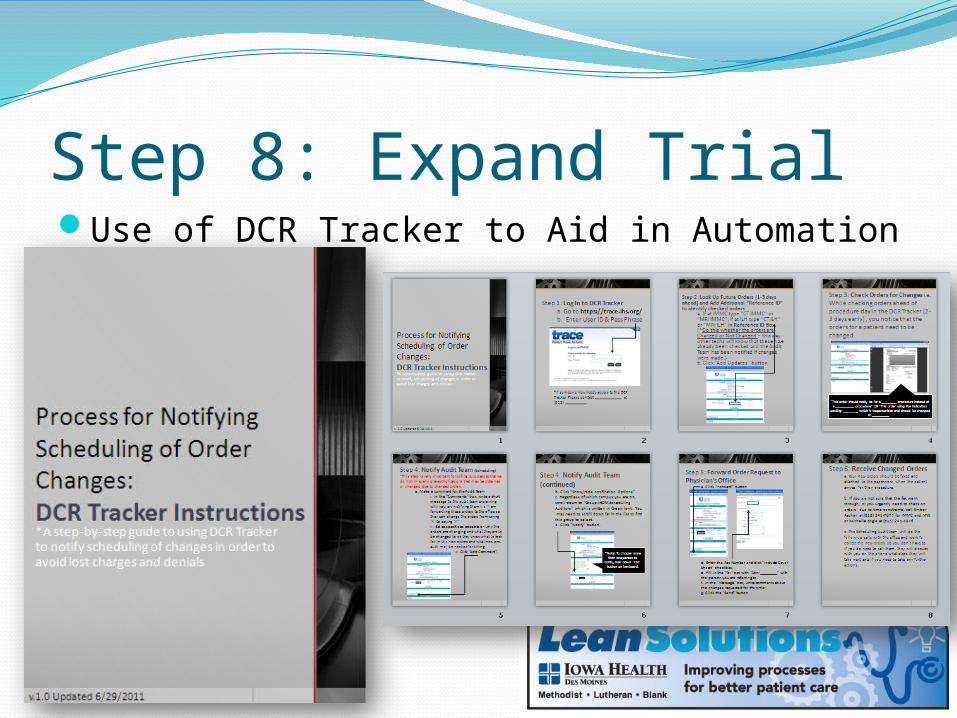
Step 8: Expand TrialUse of DCR Tracker to Aid in Automation of
Process
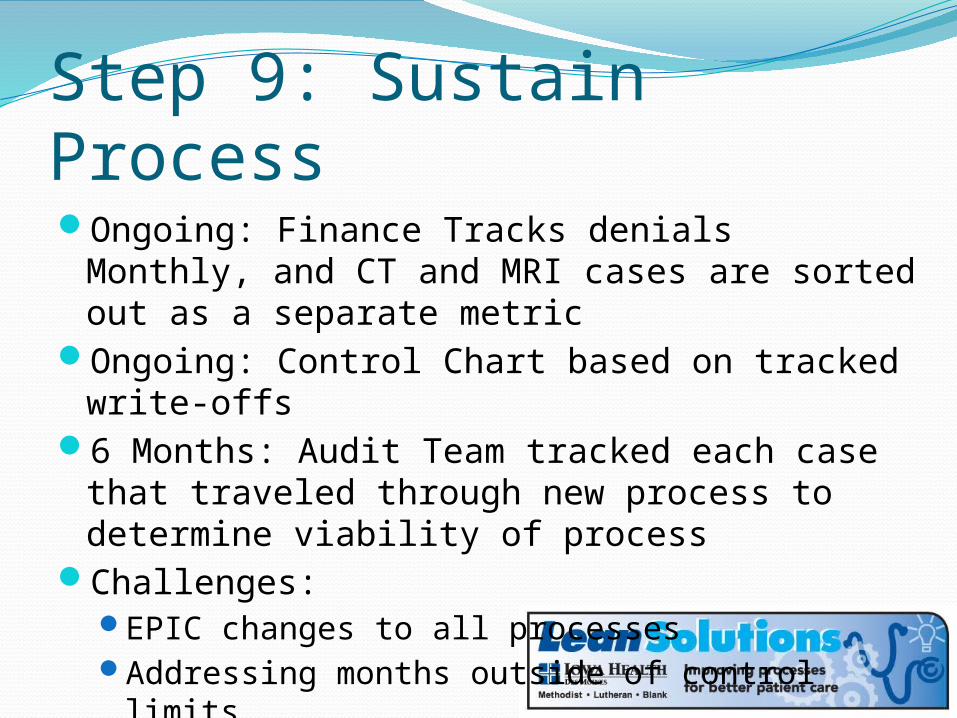
Step 9: Sustain ProcessOngoing: Finance Tracks denials Monthly, and
CT and MRI cases are sorted out as a separate metric
Ongoing: Control Chart based on tracked write-offs
6 Months: Audit Team tracked each case that traveled through new process to determine viability of process
Challenges: EPIC changes to all processesAddressing months outside of control limits

$-
$10,000.00
$20,000.00
$30,000.00
$40,000.00
$50,000.00
$60,000.00
$70,000.00
$80,000.00
$90,000.00
$82,473.27
$46,290.60
$58,182.94 $55,594.87
$56,387.72
$35,691.63
$11,748.54 $11,853.09
$8,697.33
$20,459.37
$18,074.66 $17,951.25
$50,457.93
$13,004.48
$29,195.81
$12,527.84 $3,294.53
Baseline and Post Project Control Chart
(Oct 10 through Mar 11; Apr 11 through Feb 12)
Total DenialsSeries AverageUCLLCL
Wri
te-O
ff D
oll
ars
*Meeting in November to discover barriers for MRI in utilizing process. Learned that two staff members not aware of process steps and the need for additional train-ing discovered.

Final ResultsAvg. Write-Off’s /
Month ($)Write-Off's Over Past 11-Months ($)
Baseline $55,770.17 Projected Write-
Off's using Baseline Average
$613,471.89
After $17,933.17 Actual Write Offs $197,264.83
11 month realized savings (Gross)
$416,207.06

Questions?Vanessa L. Calderon
Process Improvement CoordinatorIowa Health – Des Moines