iv u1uu1111uu 1u1 u11u v1i si* brviflff - wrc home hub documents/research reports/tt-10… · iv...
TRANSCRIPT

IVU1UU1111UU 1U1 U11U 1/ VW1 I 1 1 XXXM. VI r v i w v i v "
S I * BrviflffAD Ceronio • LRJ van Vuuren • APC Warner
GUIDELINES FOR THE DESIGN AND OPERATION OF
SEWAGE SLUDGE DRYING BEDS
by
AD Ceronio
LRJ van Vuuren
APC Warner
Report to the
WATER RESEARCH COMMISSION
by
GFJ (Pty) Ltd
WRC Report No: TT107/99
Obtainable from
Water Research CommissionPO Box 824Pretoria0001
The publication of this report emanates from a project entitled: Guidelines for the Design and Operationof Sewage Sludge Drying Beds (WRC Project No 604).
DISCLAIMER
This report has been reviewed by the Water Research Commission (WRC) and
approved for publication. Approval does not signify that the contents necessarily
reflect the view and policies of the WRC, nor does mention of trade names or
commercial products constitute endorsement or recommendation of use.
ISBN 1 86845 491 6
Printed in the Republic of South Africa
Beria Printers (012) 379-9095/6

Guidelines for sludge drying beds iii
EXECUTIVE SUMMARY
GFJ (Pty) Ltd were approached by the Water Research Commission and requested to compile
guidelines for the design and operation of sludge drying beds in South Africa. The Commission had
identified the need for guidelines after it became apparent that although South African conditions were,
for the most, ideally suited to the use of this dewatering method, designers and operators had difficulty
in optimising its use. An initial investigation indicated that the problem was due to a lack of information.
It was therefore decided to compile this guide in the following manner:
• identify fundamental work done by others that would have a relevance to this guide,
• complement this work with additional experimental work,
• translate the fundamental work into practical design and operational guidelines, and
• determine what the status of sludge bed design and operation is in South Africa, find the
shortcomings and make suggestions toward remedying this, based on the first three steps.
It was found that characterising sewage sludge and predicting its behaviour is a complex matter that has
been receiving continued scientific attention for quite some time. The work was however not nearing
completion. It was decided not to delve too deeply into this, as it would be beyond the scope of this
project.
An understanding of certain fundamentals involved in sludge dewatering is however required to design
and operate the beds. This includes a realisation of the complex nature of sludge and how this
influences the dewatering process. The entire process can be divided into two part, namely drainage
and drying (evaporation) Drainage would not normally take up a large portion of the total drying time
but could account for more than 75% reduction in the water content of the sludge. The drying time is
normally considerably longer.
Mathematical equations and models are found in literature describing both these steps. In general these
models are not suitable for use in design, as samples of the sludge are required for analysis and the
models contain variables that effectively calibrate the model, such as specific resistance to filtration (Rc)
and compressibility (a). Walski (1976) proposed a model that is less dependent on such variables
Furthermore the Walski model takes varying climatic conditions and operational procedures into account
which makes this a valuable design and operational tool.
Executive Summary

Guidelines for sludge drying beds iv
The Walski model does however also need inputs from analysis on existing sludges The experimental
work done during the compilation of this guide was aimed at providing the designer with design
estimates for these parameters It was found that a relationship exists between solids concentration
at the time of application (So), the solids concentration after drainage (S,) and the solids load (SL)
applied to the bed.
Other work done concentrated on verification of parameters or ratios describing the rate of evaporation
from sludge and also the amount of water retained by the sludge should it be subjected to rainfall.
The result of the experimental work done as well as information obtained from the literature was used
in the compilation of design guidelines for sludge drying beds.
Questionnaires were sent out to 536 local authorities, from which there were 121 responses Thirty of
these containing the most useful information were selected Using these 30 responses, and from site
visits and interviews held with operators of sewage treatment plants, it was found that the main problem
areas were;
• a lack of formal training of operators, which leads to operational errors such as overloading,
• insufficient or too much bed capacity, as a result of poor design guidelines, and
*• low productivity and other labour difficulties.
These interviews were followed up by discussions with designers, which led to similar conclusions.
Based on the literature survey, fundamental work, questionnaires, site visits and interviews, a number
of design and operational guidelines could be compiled. The most important conclusions from this study
indicate that:
• designs must be based on site and plant specific variables;
• designs should be based on worst-case scenarios in terms of climatic conditions unless
alternative dewatering procedures were available; and
• plant operators should try to optimise operation through experimentation - a log of activity and
statistics on the beds' performance are crucial in this regard.
It is recommended that future research on sludge drying beds should concentrate on further verification
of the Walski parameters and more detailed guidelines on the media used in sand beds.
Executive Summary

Guidelines for sludge drying beds
ACKNOWLEDGEMENTS
This work was carried out under the guidance of the Water Research Commission who also funded the
project The Steering Committee comprised the following members
• Mr J Bhagwan - Water Research Commission - Chairman
• Dr NP Mjoli - Water Research Commission
• Mr C Chapman - Water Research Commission
• Dr S. Mitchell - Water Research Commission
• Mr GB Saayman - Pretoria City Council
Mr RW Wakefield - Port Elizabeth City Council
• Mr C Olivier - Durban Metro - Waste Water Management
• Mr CS Crawford - Department of Water Affairs and Forestry
• Mr GF Hefer - Department of Water Affairs and Forestry
• Mr ME Mosia - Water Research Commission - (Committee Secretary)
The project team wish to thank the members for their valuable input during the course of this project.
It is also necessary to thank a number of institutions, municipalities, town engineers and plant operators
for assisting the project team during their site visits and experimental work. These include Pretoria,
Centurion, East London, Ermelo, Standerton, Bethal, Babelegi and Erwat, amongst others.
Following on the questionnaires that were sent out a word of gratitude is extended to the respondents
for taking the time to complete the forms as well as for their assistance in the telephonic interviews that
followed. There were more than 120 respondents and this unfortunately makes the list too extensive
to record, but it does not diminish the project team's gratitude.
Executive Summary

Guidelines for sludge drying beds vi
TABLE OF CONTENTS
Page
EXECUTIVE SUMMARY iii
ACKNOWLEDGEMENTS V
LIST OF TABLES ix
LIST OF FIGURES X
LIST OF SYMBOLS xi
CHAPTER 1 : INTRODUCTION
1.1 RELEVANCE OF SLUDGE DRYING BEDS 1-1
1.2 OBJECTIVES OF THE GUIDE 1-2
1.3 PROCEDURES FOLLOWED AND PRESENTATION OF INFORMATION 1-2
CHAPTER 2 : FUNDAMENTALS OF SLUDGE DRYING
2.1 INTRODUCTION 2-1
2.2 SLUDGE CHARACTERISTICS 2-1
2.2.1 Moisture content 2-1
2.2 2 Types of moisture 2-2
2.2.3 Physical, chemical and biological characteristics 2-4
2.2.4 Specific resistance to filtration (Rc) and the compressibility factor (o) 2-5
2.2.5 The effect of solids concentration on Rc 2-7
2 2 6 Other factors affecting Rc 2 7
2.3 DEWATERING MECHANISMS 2-7
2.3.1 Gravity drainage 2-8
2.3.2 Evaporation from sludge 2-9
2.4 DESIGN METHODS AND CRITERIA FOR SIZING OF BEDS 2-11
2.4.1 Swanwick's methods 2-12
2.4.2 Hazeltine empirical design equations (1951) 2-14
2.4.3 Typical WPCF standards for design 2-17
2.4.4 Mathematical model by Adrian (1978) 2-17
2 4 5 Mathematical model by Walski (1976) 2-18
Table of Contents
Guidelines for sludge drying beds vii
TABLE OF CONTENTS (CONTINUED)
Page
CHAPTER 3 : THE WALSKI MODEL
3.1 GENERAL 3-1
3 2 DERIVATION OF THE WALSKI MODEL 3-3
3.3 EXAMPLE CALCULATION 3-5
3.3.1 Demonstration of the effect of solids concentration 3-5
3.3.2 Influence of rainfall and evaporation on area required 3-5
3.3.3 Interpretation 3-7
CHAPTER 4 : LABORATORY AND FULL-SCALE TESTING
4.1 INTRODUCTION 4-1
4.2 DESIGNATION OF SLUDGES USED 4-2
4.3 GRAVITY DRAINAGE TESTS 4-3
4.3.1 Methodology 4-3
4.3.2 Interpretation of drainage results 4-4
4.3.3 Test bed drainage experiments 4-6
4.3.4 Further interpretation of drainage results 4-9
4.4 EVAPORATION TESTS (a-factor) 4-13
4.5 RAINFALL ABSORPTION (b-factor) 4-14
4.5.1 General 4-14
4.5.2 Rainfall absorption by anaerobically digested sludge (experimental) 4-16
4.5.3 Rainfall absorption by activated sludge 4-18
4.5.4 Water absorption capacity of dried sludges (WAC) 4-19
CHAPTER 5 : THE CURRENT SITUATION IN SOUTH AFRICA
5.1 GENERAL 5-1
5.2 QUESTIONNAIRES 5-1
5.3 INTERVIEWS 5-5
5.3.1 Designers 5-5
5.3.2 Plant operators 5-6
CHAPTER 6 : GUIDELINES FOR DESIGN
6 1 GENERAL 6-1
6.2 SLUDGE REMOVAL TECHNIQUES 6-1
Table of Contents

Guidelines for sludge drying beds viii
TABLE OF CONTENTS (CONTINUED)
Page
6 3 DETERMINATION OF BED AREA 6-1
6 3 1 Depth of sludge application (Ho) 6-2
6.3.2 Solids Concentration (So) 6-3
6.3.3 Effective evaporation (aE-bR) 6-3
6.3.4 Solids concentration after drainage (S,) and drainage time (t,) 6-5
6.3.5 Solids concentration at point of removal (S2) 6-6
6.3.6 Calculation of bed area and number of beds 6-6
6.4 PHYSICAL DESIGN CONSIDERATIONS 6-9
6 4 1 Access to the bed 6-9
6 4 2 Ratio of bed length to bed width 6-10
6 4 3 Floors, walls and drainage 6-11
6 4 4 Media 6-13
6.4.5 Sludge application methods 6-15
6.4.6 Bed placement and alignment 6-16
CHAPTER 7 : OPERATIONAL GUIDELINES
7 1 GENERAL 7-1
7.2 APPLICATION OF SLUDGE 7-1
7.3 REMOVAL OF SLUDGE 7-1
7 4 OTHER MAINTENANCE ASPECTS 7-2
7.5 RECORDS 7-2
7.6 PERFORMANCE OPTIMISATION 7-3
7.7 MEDIA 7-4
7 8 HEALTH ASPECTS 7-4
7.9 CRISIS MANAGEMENT 7-4
CHAPTER 8 : RESEARCH NEEDS
8.1 SURVEYS 8-1
8.2 VALUES FOR Tt AND S, 8-1
8.3 RELATIONSHIP BETWEEN SO, S1 AND SL 8-1
8.4 FURTHER DEVELOPMENT OF MEDIA SPECIFICATIONS 8-2
8.5 SLUDGE BED SITE LIMITATIONS 8-2
8 6 SLUDGE PRODUCTION 8-2
LITERATURE CITED 9-1
Table of Contents
Guidelines for sludge drying beds IX
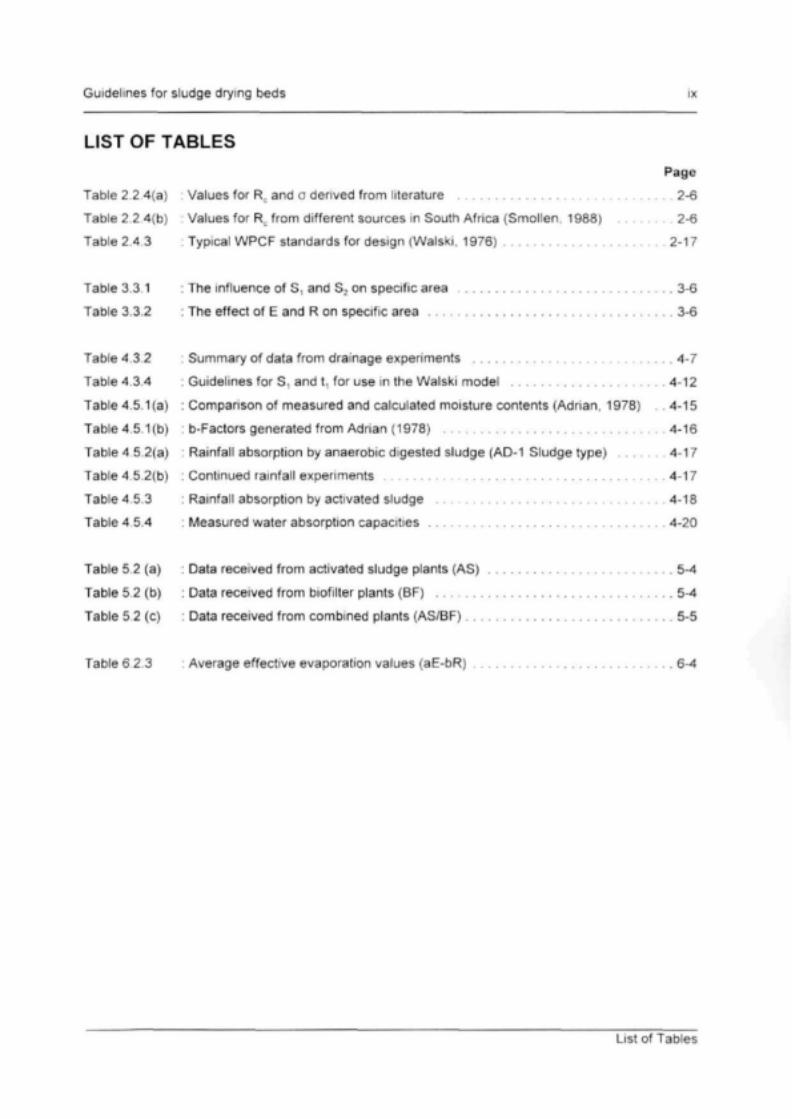
LIST OF TABLES
Page
Table 2.2.4(a) : Values for Rc and a derived from literature 2-6
Table 2 2 4(b) : Values for Rc from different sources in South Africa (Smollen, 1988) 2-6
Table 2.4.3 : Typical WPCF standards for design (Walski, 1976) 2-17
Table 3.3.1 : The influence of S, and S2 on specific area 3-6
Table 3.3.2 : The effect of E and R on specific area 3-6
Table 4.3.2 : Summary of data from drainage experiments 4-7
Table 4.3.4 : Guidelines for S, and t, for use in the Walski model 4-12
Table 4.5.1(a) : Comparison of measured and calculated moisture contents (Adrian, 1978) . 4-15
Table 4.5.1(b) : b-Factors generated from Adrian (1978) 4-16
Table 4.5.2(a) ; Rainfall absorption by anaerobic digested sludge (AD-1 Sludge type) 4-17
Table 4 5.2(b) : Continued rainfall experiments 4-17
Table 4.5.3 : Rainfall absorption by activated sludge 4-18
Table 4.5.4 : Measured water absorption capacities 4-20
Table 5 2 (a) : Data received from activated sludge plants (AS) 5-4
Table 5 2 (b) : Data received from biofilter plants (BF) 5-4
Table 5.2 (c) : Data received from combined plants (AS/BF) 5-5
Table 6 2 3 : Average effective evaporation values (aE-bR) 6-4
List of Tables

Guidelines for sludge drying beds
LIST OF FIGURES
Page
Figure 2.2.2 Types of moisture found in municipal sludges 2-3
Figure 2 3 2 : A typical sludge drying curve 2-10
Figure 2 4.1.1 . Swanwick s data (Adrian, 1978) showing the relationship between bed loading
and specific resistance (Rc) 2-12
Figure 2.4.1.2 : Illustration of Swanwick's graphical method (Adrian, 1978) 2-14
Figure 2.4.2 : Relationship of GBL and NBL to Sn respectively 2-16
Figure 3.2 : Derivation of the Walski model 3-3
Figure 3.3.1 : The influence of S, and S2 on specific area 3-7
Figure 3.3.2 : The influence of E and R on specific area 3-8
Figure 4.1 : Six 52 mm diameter columns used to study the variables that influence sludge
dewatering 4-2
Figure 4.3.2(a) : Results from drainage tests on AD-1 sludge 4-4
Figure 4.3.2(b) Results from drainage curves for AD-2 sludge dilutions 4-5
Figure 4.3.2(c) : Results from drainage curves for AS-3 sludge dilutions 4-5
Figure 4.3.2(d) ; A comparison between AD and AS sludges indicating the effect of solids
load on S, and t, 4-6
Figure 4 3.3(a) : Full-scale drainage test results on AD-1 and AS-1 sludges 4-8
Figure 4.3 3(b) : Full-scale dewatering results on AD-1 and AS-1 sludges 4-8
Figure 4 3 4(a) : Graphical presentation of the regression curves used to determine S t 4-10
Figure 4.3.4(b) . Comparison of Walski's estimated values with Randall and Koch's
experimental data (1968) 4-10
Figure 4 3.4(c) : Percentage water lost by drainage (%Wd) 4-11
Figure 5.2 : Evaluation of questionnaire data 5-3
Figure 6.4.3 Typical activated sludge bed design by Vosloo (1978) 6-15
List of Figures

Guidelines for sludge drying beds xi
LIST OF SYMBOLS
%m = moisture content (%)
%W = percentage water
u = dynamic viscosity (poise)
p = density of sludge (kg/m3)
o = coefficient of compressibil ity
a = surface area of filtration (cm2) (resistance to filtration)
a = evaporation ratio from sludge relative to clean water
A = bed area (m2)
aE-bR = effective evaporation (cm/mo)
AT = total bed area (m2) based on total dewater ing t ime T(d)
AT/q5 = specific bed area (m2/m3.d)
b = slope from t/V vs. V plot (resistance to filtration)
b = fraction of R absorbed by sludge (Walski, 1978)
BLR = bed loading rate (kg/m 2a)
c = weight of solids per unit volume of filtrate (kg/m3)
E = evaporation from clean water (cm/mo)
f = weight of solids per unit volume of filtrate
f* = weight of solids per unit volume of filtration (g/cm2.s2)
g = gravitational acceleration (m/s2)
GBL = gross bed load (kg/m2)
H = depth of sludge cake at t
h0 = effective depth of water at t0
Ho = depth of sludge bed at t0 (cm)
h, = effective depth of water at t,
H, = depth of sludge bed at t ; (cm)
h2 = effective depth of water at t2
H2 = apparent depth of sludge bed at t2 (cm)
Hd = variable depth of drainage (cm) (to - t,)
Hs = variable depth of sludge bed (cm) (t0 • t,)
hw = effective depth of water
Hw = effective depth of water
m = media factor
Mo = moisture content (%) before rain
NBL = nett bed load (kg/m 2d)
ps = density (kg/m3)
List of Symbols

Guidelines for sludge drying beds xii
LIST OF SYMBOLS (CONTINUED)
Q = volumetric sludge flow rate (m3/d)
Qc = current raw sewage flow rate (m3/d)
Qa = design raw sewage f low rate (m3/d)
q, = volume of sludge to drying beds (kf/d)
R, = specific resistance at head h (resistance to filtration)
R = rainfall typical wet month cm (month) (Walski, 1978)
Rc = specific resistance to filtration (m/kg)
Rd = daily rainfall (cm)
S = mass solids (kg)
So = % solids by mass at t0
S, = % solids by mass at t,
S2 = % solids by mass at t2
Sc = % solids of sludge cake (resistance to filtration)
SL = solids load (kg/m2)
Ss = % solids of sludge (resistance to filtration)
Sw = percentage solids at Ha
T = t, + t2 (total dewatering time)
t0 = zero t ime when bed is loaded
t, = drainage t ime (d)
t2 = evaporation time (d)
W = mass of water
% W d = percentage water drained from sludge
AP = pressure loss across a sludge cake (dynes/cm2) or (N/m2)
List of Symbols
Guidelines for sludge drying beds 1-1 Chapter 1
CHAPTER 1
INTRODUCTION
1.1 RELEVANCE OF SLUDGE DRYING BEDS
Sewage sludge drying beds are commonly used throughout the country and across the world
as an effective method of sludge dewatering. The beds may or may not be preceded by a
sludge thickening step. Sludge taken from the beds is normally dumped, but can also be
treated further to deliver a product of beneficial use. Although alternatives to sludge beds,
such as belt presses, have been introduced at some large plants, sludge beds will remain a
viable option for designers and operators because of their relative ease of operation and
relatively low running cost. This is particularly true for smaller plants. For larger scale plants,
mechanical hauling rather than manual removal is preferred For this purpose concrete lined
beds without filter media are often used.
Sewage sludge drying beds are used with varying degrees of success in South Africa. Their
success depends mainly on climatological factors, type of sludge, sludge loading rates and
operating efficiency. Haseltine (1951) summarizes the status quo in stating that drying beds
are the most common means of drying sewage sludge, but despite this fact no phase of
sewage treatment has received less scientific attention or less mention in operating reports.
This lack of scientific approach is evidently due to the large number of variables to be
considered and include:
• the source and type of original sludge;
• the extent of digestion, age, composition and concentration of the sludge;
•• the method of sludge transfer - gravity, type of pumps, etc, and
• the presence or absence of coagulants.
Generally the conditions in South Africa are ideally suited to the use of sludge drying beds.
Factors that contribute are high evaporation rates, fairly low rainfall rates, the availability of
space and also a large available labour force. Despite this a large number of plant operators
prefer not to make use of their beds and dispose of their sludge by means of irrigation and in
lagoons. Reasons given for this include poor design, climatological complications, labour
difficulties, unsuitable sludges and other operational difficulties. Activated sludges of poor
stability are particularly problematic in terms of environmental aspects such as offensive
odours and leachates.
Introduction

Guidelines for sludge drying beds 1-2 Chapter 1
The designs currently used in South Africa are based mainly on past experience and
occasionally use is made of internationally sourced literature which in most cases has limited
relevance to South African conditions. Furthermore limited attention is given to varying
climatic conditions. This situation is aggravated by the fact that research that has been done
on the fundamental aspects of the actual sludge drying processes is seldom translated into
practical design and operational guidelines. A result of this is that plant operators are often
not properly trained in the operation and optimisation of the beds.
1.2 OBJECTIVES OF THE GUIDE
Roughly one fifth of the capital cost of a new sewage treatment plant can be attributed to
sludge drying beds. Despite this, very little local research is accessible to designers, limited
design guidelines are available and even less is available to guide the operator.
It is the purpose of this guide to attempt to address this situation. This guide contains an
evaluation of fundamental research work that has been done on the topic. It also defines and
discusses some fundamental principles that would assist in the design and operational stages
Models proposed for the design of sludge beds are investigated and practical suggestions are
made towards the physical design and detailing of the beds. Furthermore suggestions are
made towards the optimisation of bed operation.
1.3 PROCEDURES FOLLOWED AND PRESENTATION OF INFORMATION
It has been necessary to include some fundamental experimental work along with practical
guidelines in this report due to the fact that very little data was available during the compilation
of this guide. This work is included in this guide as it leads to an understanding of the basic
mechanisms that underlie the (essentially) simple requirements for the successful design and
operation of sludge drying beds.
This guide begins by discussing the fundamentals involved in sludge drying {Chapter 2). From
these fundamentals flow a number of drying models which can be utilized in the design of
sludge beds. Some basic experimental work was done during the compilation of these
guidelines to confirm certain parameters used in a selected model and also to give design
estimates for certain prime parameters in this model. These are contained in Chapters 3
and 4.
Introduction

Guidelines for sludge drying beds 1-3 Chapter 1
In order to determine the extent to which design and operation influence performance a
number of visits were made to treatment plants where interviews were held with the various
operators and designers. Furthermore a questionnaire was sent to more than 520 local
authorities. The conclusions drawn from these interviews and questionnaires are presented
in Chapter 5.
A chapter on design is also presented This discusses the basic points that should be
considered during the design process and covers aspects ranging from sizing to detailing. As
climate plays a key role in the drying process, a study was also made of climatological
variations throughout South Africa. Some references are made to this in the design chapter.
In addition to this the various existing design models are presented in this chapter to compare
and discuss the results.
The operation of a sludge bed contributes as much to its success as does the design. A
chapter on operational and maintenance requirements as well as on optimisation is included.
The Guide concludes with a chapter that summarizes further research needs.
Introduction
Guidelines for sludge drying beds 1-4 Chapter 1
Introduction

Guidelines for sludge drying beds 2-1 Chapter 2
CHAPTER 2
FUNDAMENTALS OF SLUDGE DRYING
2.1 INTRODUCTION
In order to design and operate sludge drying beds optimally it is important to have an
understanding of the fundamentals involved in sludge drying. These fundamentals are
discussed extensively in published papers, reports, case studies, etc. Some of these sources
reflect a highly fundamental approach backed by laboratory and pilot-scale testing. Others are
more empirically based with the focus on particular design aspects or problem areas.
For the purpose of this guide the information most relevant to design has been selected and
summarised. The gross overlap of a large number of parameters and aspects involved
complicates the presentation of the reviewed literature under categories and subsections The
fundamentals are presented under the following main headings:
(i) Sludge characteristics
(ii) Dewatering mechanisms
(iii) Design methods and criteria for sizing of beds.
2.2 SLUDGE CHARACTERISTICS
Dewaterability of sludges depends on a number of characteristics such as physical, chemical
or biochemical properties. These include the water (moisture) content which is present in
various forms. The original source of the sewage and the treatment processes also determine
the type of sludge and its characteristics.
From a practical view point the water content and loading depths are of overriding importance
From a theoretical viewpoint the resistance to filtration, and compressibility are the major
parameters involved.
2.2.1 Moisture content
In environmental engineering the term water content (%W) is usually associated with large
amounts of water and is defined as the mass of water divided by the total mass (solids plus
liquid). The term moisture content (%M) refers to much smaller amounts of water and is defined
as the mass of water per mass of dry solids The term water content is convenient during the
Fundamentals of Sludge Drying

Guidelines for sludge drying beds 2-2 Chapter 2
drainage and early stages of sludge drying, whereas the term moisture content is more
convenient during the later stages of drying (Adrian,1978). Solids content is defined as the
mass of solids divided by the total mass. The term moisture content is generally also used in
the literature for water content as defined above. Thus solids content plus water content is unity.
In mathematical terms:
%W - 1 ^ - 1 0 0 2 2 1<a)
Where %W is the percentage of water
W is the mass of the water, and
S is the mass of the sludge solids
and further
%M = — x 100s 2.2.Kb)
%S (100 %W)
%W and %M are also related as follows:
% M. 100%W =
%M + 1002.2.1(c)
0/.- %w\oo%M100 - % W
2.2.2 Types of moisture
Various disciplines use different nomenclature for the types of water associated with sludges
(Adrian, 1978). On the basis of experimental data, Smollen (1988) distinguished between four
categories of municipal sludge moisture content. These are illustrated schematically in Figure
2.2.2. and are briefly expanded upon below.
Fundamentals of Sludge Drying

Guidelines for sludge drying beds 2-3 Chapter 2
Chemicallybound
L Bound
•
Iota! moisture in sludge sample
Immobilized Free
Figure 2.2.2: Types of moisture found in municipal sludges (Smollen, 1988)
Free moisture - minimally bound to solids, removable by gravity drainage.
• Immobilised water - floe entrapped water characterised by low binding energy,
removable by mechanical methods (vacuum, centrifugation or pressure filtration)
• Bound moisture - strongly absorbed onto individual sludge particles, removable by
processes such as electro-osmotic and thermal drying processes.
• Chemically bound moisture - bound by strong chemical bonds, removable by thermal
drying at temperatures above 105 C.
Smollen concluded that low immobilised moisture content was usually associated with a short
drying time, and that a granular appearance of the dried cake calls for the use of drying beds.
On the other hand a high immobilised moisture content and cohesive sludge cake appearance,
calls for mechanical dewatering methods.
For the purposes of this guide only two types of water (moisture) will be considered. These are:
• water removed by gravity (free or drainable water) and
• water removed by evaporation (bound water).
Fundamentals of Sludge Drying

Guidelines for sludge drying beds 2-6 Chapter 2
The relationship of Rc to head is empirically related as follows:
R - R. 2.2.4(c)
Where R Specific resistance at head h
Specific resistance at head hc
Coefficient of compressibility.
Values for Rc and o derived from the literature are listed in Table 2.2.6(a).
Table 2.2.4 (a) : Values for Rc and o derived from literature
Types of sludge
Primary anaerobic digestedsludqe
Anaerobic digested mixedwith adivaled sludge
Anaerobic digested mixedwith tnckltnq fitter sludge
Aerobically digested sludge
Anaerobically digested sludge
% Solids
9,5
3,6
6 1
4.5
-
RcsVg or m/kg
2,6 x 10¹¹
{*%)
4,8 x 10'°(s'/g)
8,25 x 10"(sJ/g)
1.1 5 x 10⁹
<s*7g)
100-480 x 10' ;
(m/kg)
o
0 68
0 6 6
0 9
0 97
0 5-0.8
P
38.1 cmHg
38 1 cm Hg
38 1 cm Hg
-
Reference
Nebiker
Sanders
Quon
Cummmgs
Adrian
Smollen (1986) also reported Rc values from different sources in South Africa at 49 kPadifferential pressure. The values are summarised in Table 2.2.4(b).
Table 2.2.4(b) : Values for Rc from different sources in South Africa (Smollen,1986)
Sludge description
Primary sludge
Waste activated sludge
DAF waste activated sludge
Primary anaerobic digestedsludge
Anaerobically digested primaryand activated sludqe
Aerobtcally digested sludge
Anaerobically digested humus
Revalues (101Jm/kg)
(100-150), (6-230), (60-200), 215, 14, 174, 19, (100-300)'
(1-8). (3-20), 2,6-28), (0,6-13.4), 4,3 , 40
(10-124), (77-420), (18-24), 29, (40-120)*
(32-388), 38. 58. (30-300)'
(400-2600), (200-620), 138
(2,2-5,5)
64
-USA EPA data
Anaerobically digested mixtures of primary and activated sludge show the highest Revalues.
Good intermediate filtration properties of waste activated sludges are indicated, particularly
Fundamentals of Sludge Drying

Guidelines for sludge drying beds 2-7 Chapter 2
those produced by extended aeration plants. The wide variations as listed above are of little
design significance but broadly indicate better dewaterability of aerobically digested sludges
2.2.5 The effect of solids concentration on Rc
Theoretically Rc should be independent of solids concentration. This has however been found
not to be so in practice. For anaerobically digested sludge Smollen (1986) found an increase
in Rc with a decrease in solids concentration. The opposite appears to apply to activated
sludges.
2.2.6 Other factors affecting Rc
Other factors that affect Rt include particle size distribution, biopolymer formation and
compressibility (Smollen, 1986). When a sludge contains fine particles, Rc is effected by the
blinding by the sludge cake on the support media High blinding was recorded with primary and
anaerobic digested sludges while moderate levels of or no blinding was found with activated
sludges
The quantity of high molecular polymers was found to correlate with dewatering characteristics
in that dewatering improves when the dissolved bio-polymers are removed from the solution
phase. According to Pitman (1975) deterioration in dewaterability of activated sludge is caused
by mobile micro-organisms that maintain fine particles in the liquid phase He suggested that
filtered effluent suspended solids could give a good indication of sludge dewaterability.
2.3 DEWATERING MECHANISMS
As discussed earlier in this chapter, two dewatering mechanisms are of primary importance in
sludge drying beds. The first is the drainage mechanism and the second is evaporation. During
the drainage phase the sludge would, under normal circumstances, lose the bulk of its water
This phase can last from several hours to a number of days depending on the characteristics
of the particular sludge The moisture remaining in the sludge after this phase is then removed
by evaporation to a level where the sludge can be removed from the bed.
Fundamentals of Sludge Drying

Guidelines for sludge drying beds 2-8 Chapter 2
2.3.1 Gravity drainage
Various literature sources were consulted and the models reported for the determination of
drainage times were compared for uniformity in terms of units used and particularly also the
terms effected by the compressibility factor a. It was found that various authors have adopted,
with minor alterations, a model proposed by Adrian (1978) These authors include Lo (1971),
Marklund (1990), and Palmer (1985). The fundamentally derived model is reproduced in
equation 2.3 1 (a).
t — M Rc
Pff (HC
. 5— + H° ' ' - — H n W °a o
2.3.1{a}
This equation is based on c.g.s. units where :
p
g
Ho
H
time (s) (drainage)
viscosity (g/s.cm)
specific resistance (s2/g) at reference pressure Hc {cm;
density (g/cm3)
gravitational acceleration (cm/s2)
depth of sludge (cm) at tg
depth of cake (cm) at t
and also equation 2.3.1(b):
100 100 2.3.Kb)
Where Sois the percentage sludge solids prior to drainage and S-,the percentage sludge solids
after drainage has been completed. Assuming 100/S, is relatively small, equation 2.3.1 (a) can
be simplified to result in equation 2.3.1(c):
t =100
Ha-1
oH0H° 2.3.1(c)
Fundamentals of Sludge Drying

Guidelines for sludge drying beds 2-9 Chapter 2
The denominator 1/(o+1) can be included into the second half of equation 3.2.1(a) giving
equation 2.3.1 (d);
M Reso 2.3.1(d)1OOfS, SQ)H°
Adrian (1978) suggested the use of equation 2.3.1 (c) for wastewater sludges where S 1»S 0 , but
for water treatment sludges, a modified equation 2.3.1(d) is suggested which includes amongst
others a media factor. This modification does, however, not fall into the scope of this guide and
is therefore not included here.
The fundamental problem with this mode! in terms of its use as a design tool is that a sample
of the sludge is required to determine the values for Rc and o. This is, however, impossible
during the design phase of a new sewage treatment plant. Should the drainage time be
required for the extension of an existing plant, it would be much easier, and more accurate, to
measure the drainage time from existing beds than to calculate it.
Of importance to note is that drainage time is relatively short but accounts for a major portion
of the water removed from sludge
2.3.2 Evaporation from sludge
The drying of sludges by evaporation is based on a large number of parameters which are
complexly related and associated with environmental conditions (e.g. humidity, temperature,
wind velocity, etc.), and operational aspects (e.g. depth of loading etc.) For the purpose of this
guide a few of the more important definitions or concepts are briefly outlined below. A typical
drying curve is shown in Figure 2.3.2.
Fundamentals of Sludge Drying

Guidelines for sludge drying beds 2-10 Chapter 2
Eva
pora
tion
rate
E
Critical moisture point start
Falling rate /drying /
f \ i
Constant rate drying
Wci i i i
We WoWater Content (%W)
Figure 2.3.2 : A typical sludge drying curve
• Constant rate drying period
Sludge dewatering by evaporation occurs in two distinct phases. The initial phase is
known as the constant rate drying period (Wo to Wc). Evaporation loss continues at a
constant rate until the free surface moisture is exhausted and can no longer be
replenished by the internal transport of water to the sludge surface.
• Decreasing rate period / Non-linear / Falling / Declining
Further evaporation then occurs in the period known as the falling rate or non-linear
or declining rate period (Wc to We). The falling rate phase may or may not be linear
with time and depends on the nature of the sludge
* Critical moisture
This marks the transition from the constant to the falling rate period and is influenced
by dosing depth amongst other factors.
Fundamentals of Sludge Drying

Guidelines for sludge drying beds 2 11 Chapter 2
• Free water surface
Water evaporates at a higher rate from a free water surface. Since the major portion
of the total drainage is completed rather quickly in relationship to total dewatering time,
it would appear that the constant rate drying period would be of short duration It is
probable that most of the total sludge moisture loss is the result of drainage and the
falling rate of evaporation losses (Jennet and Harris, 1971).
• Evaporation ratio
This is the ratio between water evaporated from a free water surface relative to
additions where the critical moisture content has been reached- This guide uses
Walski's (1978) nomenclature and denotes this by the variable "a".
Marklund (1990) conducted experiments on the evaporation from small bodies of water and
sludges under controlled humidity, temperature and wind conditions. The most important
findings from this work are reproduced below:
"Evaporation from two pilot sludge beds was studied in open air test lasting four months. One
similar bed was tested in a controlled environment. The results showed that above a critical
moisture content between 600 and 1100%. evaporation from sludge equals the evaporation
from a free water surface. Below the critical moisture level the rate decreased rapidly." (Note:
600 to 1100% moisture respectively represents 15 to 8% solids indicating that a factor for
evaporation from sludge only becomes relevant for concentrations of > 10% solids.)
2.4 DESIGN METHODS AND CRITERIA FOR SIZING OF BEDS
Various authors have proposed several models to be used directly in the prediction of sludge
drying and bed sizing. The most relevant models are discussed in the following paragraphs
Fundamentals of Sludge Drying

Guidelines for sludge drying beds 2-12 Chapter 2
2.4.1 Swanwick's methods
2.4.1.1 Swanwick's empirical formulation (Adrian, 1978)
Pilot plant studies in England on sludge dewatering yielded the conclusion that specific
resistance (Re) is related to bed loading (kg/m2a). A plot of Swanwick s data (Fig. 2.4.1.1) is
described by the following equation:
BLR 107
R 0.5 2.4.1.1
Where BLR represents the bed loading rate ((kg.a)/m"2) and Rc (s2/g) specific resistance at
36,9 cm mercury.
Although it is quite possible that a relationship exists between bed loading and specific
Specific resistance 10e-9
Figure 2.4.1.1 : Swanwick's data (Adrian, 1978) showing the relationshipbetween bed loading and specific resistance (Rc)
resistance it is highly improbable that this relationship is precisely described by Swanwick's
formulation {Adrian, 1978). Other factors which are related to bed loading and unrelated to
specific resistance (such as evaporation) most certainly play a considerable role in the
dewatering of sludge.
2.4.1.2 Graphical method by Swanwick (Adrian, 1978)
Fundamentals of Sludge Drying

Guidelines for sludge drying beds 2-13 Chapter 2
Based on the assumption that moisture is evaporated from sludge at a rate that can be related
to the evaporation rate of free water by a constant, and that only a portion of rainfall on a bed
is retained in the sludge, Swanwick proposed a graphical method to determine sludge drying
time and the bed area required. The method, as proposed by Swanwick, is set out below
(Adrian, 1978}:
1. Fill a one-inch diameter glass tube with a sand base with sludge to a depth of 12 to 18
inches (305 to 460 mm).
2. Allow complete drainage of water from sludge (This will usually occur in a period of 12
to 48 hours depending on moisture content and sludge characteristics).
3. Remove the drained sludge plug and measure the moisture content after drainage.
4. Place the plug in an exposed dish for evaporation to occur. Periodically check the plug
until a desired terminal moisture content is reached.
5. Measure the remaining moisture content. The difference in moisture content between
steps 3 and 5 is the water to be evaporated.
6. From local meteorological records, determine the annual evaporation rate and annual
rainfall rate.
7. Plot a cumulative plot of 0,75 times summation of evaporation vs month and 0,57
summation of rainfall vs. month (This is based on experimental evidence that the
average evaporation rate from wet sludge is 75% that of a free water surface, and that
43% of the rainfall is drained through the cake leaving 57% to be evaporated).
8. Prepare an overlay by month, indicating the total length of time a sludge discharge to
a bed must be held for evaporation of any rainfall plus the remaining moisture
calculated from step 5.
9. Prepare a tabulation of the total bed area required for each month. (The required area
will increase during the wet periods of the year.)
10 The design requirement will be the maximum computed in step 9.
Fundamentals of Sludge Drying

Guidelines for sludge drying beds 2-14 Chapter 2
In)
jdg
e(
ion
from
sl
ila
tive
evap
orat
P5 x
Cum
u
O
18
16
14
12
10
8
6
2
0
-
-
:
-
-
j
i
LJ.
I I I I I
M A M J J
Month
If
i i i iA S 0 N
-
-
-
—
20
18
16
14
12
10
8
4
2
D
rain
fall
(In)
x C
umul
ativ
e
LOO
Figure 2.4.1.2: Illustration of Swanwick's graphical method (Adrian, 1978)
2.4.2 Haseltine empirical design equations (1951)
Haseltine (1951) pointed out that although sludge beds were in common use they had not
received a sufficient amount of scientific attention and that this could be due to the large number
of variables involved. The result of this was that the performance of sludge beds was measured
crudely.
The most commonly used units were:
(i) number of fillings per year
(ii) cubic yards of wet sludge drawn per year
(iii) pounds of solids applied per ft2 per year
Haseltine introduced a more logical concept, i.e. mass of solids applied per area per period (say
30 days) of actual bed use. This concept was named Gross Bed Loading (GBL). For example,
if sludge containing 5% of solids is applied 0,3 m deep and removed after 40 days, theGBLper
month would be calculated as follows:
Fundamentals of Sludge Drying

Guidelines for sludge drying beds 2-15 Chapter 2
p.Hn.Sn.Period of evaluationGBL - ° ° —
T
GBL 1000 * * x 0.3m x 5% x 3 - ° * ^ 2 " 4 " 2 ( a )
m 3 40 c/ays
GBL 11,25/cg per 30 days Im2
where p = sludge density (assumed as 1000 kg/m3)
Ho = initial sludge application depth (m)
So = solids concentration during application (%)
T = total dewatering period (days)
In order to take into account the variable solids content of the sludge at the time that the sludge
is removed, a second concept "Net Bed Loading" {NBL) was introduced which was defined as:
NBL - GBL.S2 I 100 2.4.2(c}
Here NBL was multiplied by the percentage solids concentration of the sludge at the point of
sludge removal (S2).
Records of 1 to 14 years for different plants {winter months excluded) were used to calculate
the various plants' GBL and NBL values The sludges included primary sludge, chemically
precipitated sludge, primary and humus sludge, primary and activated sludge, digested in Imhoff
tanks, and heated or unheated single- and two-stage digesters and applied in various depths
to open or glass-covered beds.
Plots of these results showed the following linear relationships:
GBL 0,96 So 1,752.4.2(d)
NBL - 0,35 So 0,52
where GBL is in pounds of solids per ft2 per 30 days of service and NBL is as defined in
equation 2.4.2 (c).
These equations are purely empirical and at best relate to annual averages over a wide
geographical area with numerous climatic variations. Expressed in metric units {(kg/m ?.d)
equation 2.4.2 (d) becomes:
Fundamentals of Sludge Drying

Guidelines for sludge drying beds 2-16 Chapter 2
GBL 0,157 So -0,286
NBL 0,057 Sn- 0,0822.4.2(e)
Vater (Adrian, 1978) analysed the same data used by Haseltine and found that an exponential
curve could better represent the data points. This equation for GBL is presented in metric units
as
GBL = 0,033So16 (kgfm2.d) 2.4.2 (f)
The curve by Vater seems more realistic since it goes through the origin whereas Haseltine's
straight line does not (Figure 2.4.2).
GO
1 00
0.75
0 50
g 0 25
0 4 8 12 16
INITIAL SOLIDS CONTENT So (%)
00 4 8 12 16
INITIAL SOLIDS CONTENT So (%)
Figure 2.4.2 : Relationship of GBL and NBL to So respectively
Haseltine's empirical equations have been used for dimensioning of sludge drying beds but
these formula do not apply to old thoroughly digested or "dead" sludges.
Fundamentals of Sludge Drying
Guidelines for sludge drying beds 2 17 Chapter 2
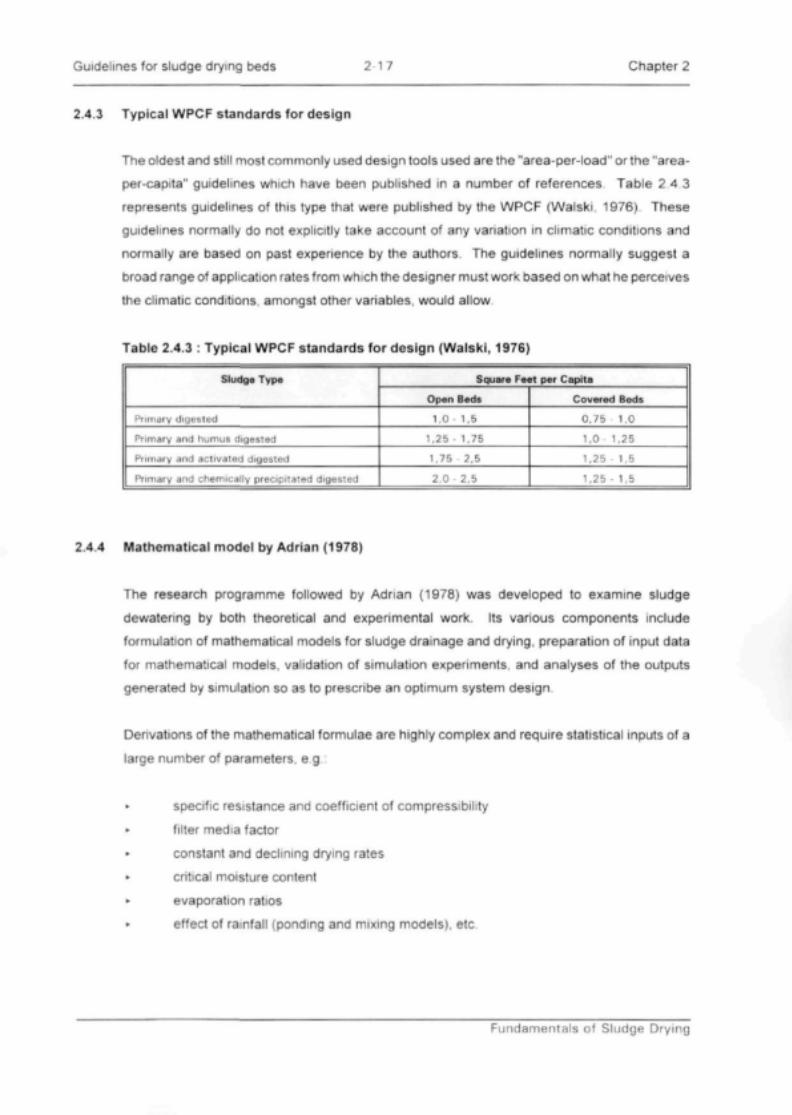
2.4.3 Typical WPCF standards for design
The oldest and still most commonly used design tools used are the "area-per-load"orthe"area-
per-capita" guidelines which have been published in a number of references Table 2.4 3
represents guidelines of this type that were published by the WPCF (Walski, 1976). These
guidelines normally do not explicitly take account of any variation in climatic conditions and
normally are based on past experience by the authors. The guidelines normally suggest a
broad rangeof application rates from which the designer must work based on what he perceives
the climatic conditions, amongst other variables, would allow.
Table 2.4.3 : Typical WPCF standards for design {Walski, 1976)
Sludge Type
Primary digested
Primary and humus digested
Primary and activated digested
Primary and chemically precipitated digested
Square Feet per Capita
Open Beds
1,0 - 1,5
1,25 - 1,75
1,75 2,5
2,0 2,5
Covered Beds
0,75 1,0
1,0 1,25
1,25 - 1,5
1,25 - 1,5
2.4.4 Mathematical model by Adrian (1978)
The research programme followed by Adrian (1978} was developed to examine sludge
dewatering by both theoretical and experimental work. Its various components include
formulation of mathematical models for sludge drainage and drying, preparation of input data
for mathematical models, validation of simulation experiments, and analyses of the outputs
generated by simulation so as to prescribe an optimum system design
Derivations of the mathematical formulae are highly complex and require statistical inputs of a
large number of parameters, e.g.:
*• specific resistance and coefficient of compressibility
• filter media factor
• constant and declining drying rates
• critical moisture content
• evaporation ratios
• effect of rainfall (ponding and mixing models), etc.
Fundamentals of Sludge Drying

Guidelines for sludge drying beds 2-18 Chapter 2
For practical purposes this model is considered too laborious. However, this comprehensive
report provided useful supporting information and references that were consulted in the
development of this guide. A particular effort was made to interpret rainfall absorption data
(Section 4.5).
2.4.5 Mathematical model by Walski (1976)
This model is essentially based on the Swanwick method which takes into account climatic
variations amongst other variables Bed area is calculated from the equation 2.4.5(a);
1.60Q 30 H0S0
aE bRsq.ft 2.5.4fa)
where A
Q
Ho
So
Surface area in ft2
Volumetric sludge flow (US gpd)
Sludge loading depth (in)
Initial % solids
% solids after drainage time t,
% solids after evaporation time t2
30H 0 S 0
aE bR2.5.4{b)
where effective evaporation = aE - bR (in)
with E = clear water evaporation rate (in/month)
R = rainfall in wet month (in/month)
a = correction factor for evaporation from sludge = 0.75 (Swanwick, 1964)
b = fraction of rain absorbed by sludge = 0,57 (Swanwick, 1964)
In order to determine the drainage time (t,) it is again required that the sludge be available to
conduct some experimental work. The model is, however, a simple one which is easily applied
and the information required is normally readily available. This model was therefore selected
tor a more detailed assessment for the purpose of using it as a final design tool This is
discussed in detail in Chapter 3.
Fundamentals of Sludge Drying

Guidelines for sludge drying beds 3-1 Chapter 3
CHAPTER 3
THE WALSKI MODEL
3.1 GENERAL
In this section the mathematical formulation and significance of the relevant parameters of the
Walski model (Walski, 1976) are described. The Walski model was chosen as the model of
preference in this guide because it makes provision for the most important variables It is also
not "run specific" but rather gives a general or average result which would be more suitable
for use in design and since it is fairly simple it would find general acceptability in day-to-day
use.
The original model as published (Walski, 1976) is expressed in terms of US gallons and
Imperial units but these have been converted to metric units for the purpose of the Design
Guide.
Application of the Walski model is essentially aimed at estimating the total bed area (AT) for
dewatering a daily production of sludge (qs) at a bed loading depth (Ho) and total dewatering
time (T), i.e.:
Ar - jfT 3.1(a)f
In this regard an estimate of T is the main feature of the model which implicitly includes solids
concentration and effective evaporation parameters as well as drainage time tv This is the
time it takes for the sludge to lose its free water through drainage.
In metric form the Walski model is formulated as follows:
100.<7 30H0S0 S 0
aE-bR I S, S2
3.Kb)
The symbols have the following meanings:
AT . total bed area (m2)
qs : sludge production (m3/d)
Ho : bed loading depth (cm) at t0
Walski Model

Guidelines for sludge drying beds 3-2 Chapter 3
R
E
a
b
aE-bR
T
gravity drainage time (d)
(to be determined experimentally by laboratory analysis)
evaporation time (d)
% solids concentration at to
% solids concentration at t,
% solids concentration at t2
monthly rainfall (cm)
monthly evaporation (cm)
factor for evaporation from sludge relative to clean water
rainfall absorption factor by sludge
effective evaporation (cm/month)
total dewatering time (t, + t2 days)
The variable t2 is expressed as:
30 HQSQ
~aE bR
The Walski model is essentially developed for use on drying beds that allow sufficient
drainage. The model has not explicitly been tested for use on beds without these facilities.
If it is assumed that S ^ S Q , t, =t0 = 0 and that all the rain that falls on the bed remains on the
sludge (b=1). equation 3.1 (c) reduces to equation 3.1 (d).
T - L =30H, 30H0S0
aE R (aE-R)S,
30 HQ [S2 So]
aE R \SJ3.1 (d)
And equation 3.1 (b) reduces to
3000 qsaE - R
3.1 (e)
Equation 3.1 (e) shows that AT is independent of Ho in these systems, while 3.1 (d) shows a
linear correlation between drying time (t2) and application depth Ho. This is not completely true
as the model does not take the insulation effect of dried sludge over wet sludge into account.
It is therefore recommended that this model only be applied for thin applications (< 100 mm).
Walski Model

Guidelines for sludge drying beds 3 3 Chapter 3
The density of the sludge is assumed to be unity for the purposes of this model and therefore
the effective depth of water (hw) can be calculated for any depth of sludge (H8) using equation
3.1(f). Here Sw denotes the percentage solids at H5.
h.100
(100-Sw)H
100
3.1(0
3.2 DERIVATION OF THE WALSKI MODEL
To illustrate the basis for the equation the derivation thereof is presented below. Figure 3.2
illustrates a sludge in three stages of dewatering. These stages are at the initial bed filling, at
the end of drainage and at the point where the sludge is removed.
to
After applicationof sludge
After the After thedrainage phase evaporation phase
Figure 3.2 : Derivation of the Walski model
Walski Model
Guidelines for sludge drying beds 3-4 Chapter 3
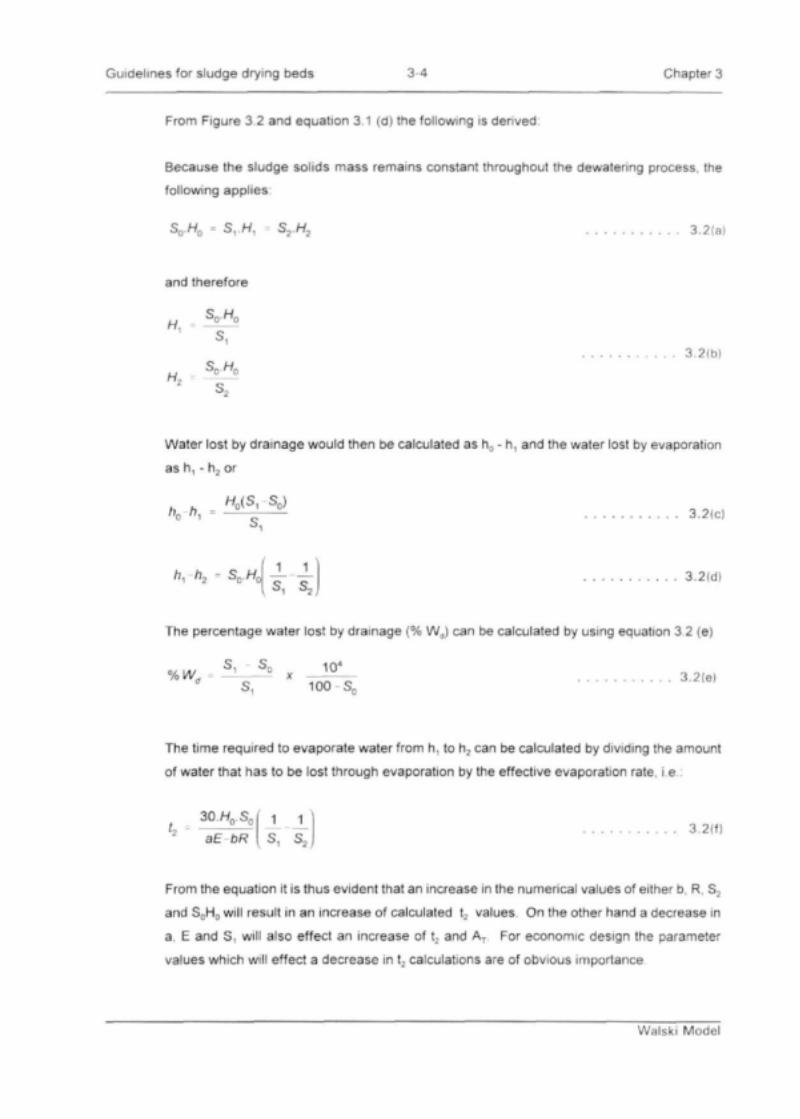
From Figure 3.2 and equation 3.1 (d) the following is derived:
Because the sludge solids mass remains constant throughout the dewatering process, the
following applies:
VH, S2.H2 3.2(a)
and therefore
3.2(b)
Water lost by drainage would then be calculated as h0 - h, and the water lost by evaporation
as h, - h2 or
Q(S, So)3.2(c)
3.2(d)
The percentage water lost by drainage (% Wo) can be calculated by using equation 3.2 (e)
so 104
%Wd =100-S n
3.2(e)
The time required to evaporate water from h, to h2 can be calculated by dividing the amount
of water that has to be lost through evaporation by the effective evaporation rate, i.e.:
3O.HO.SO
aE-bRJL 1_S, S2
3.2(f)
From the equation it is thus evident that an increase in the numerical values of either b, R, S2
and S0H0 will result in an increase of calculated t2 values. On the other hand a decrease in
a, E and S, will also effect an increase of t2 and AT For economic design the parameter
values which will effect a decrease in t2 calculations are of obvious importance.
Walski Model

Guidelines for sludge drying beds 3-5 Chapter 3
An example calculation is included below to further demonstrate the sensitivity of S.. S2, R and
E in application of the Walski model An experimental program was conducted (Chapter 4)
to develop proposed criteria fort,, S,, a and b for the purposes of this guide. The experimental
work is discussed in Chapter 4.
3.3 EXAMPLE CALCULATION
3.3.1 Demonstration of the effect of solids concentration
The example quoted in the reference literature is included in this section using metric units in
order to demonstrate the effect of S. and S2 on specific area AT / q s. The values of the
variables used in this calculation are listed below.
H 0 =t,
sQ =s, =s2 =E
R
a =
b
1000 US
12 in (30
2d
10%
20%
50%
5 in/mo
3 in/mo
0,75
0,57
gpd(3,78m7d)
,48 cm)
(12,7 cm/mo)
(7,62 cm/mo)
AT and A1 /q s are consequently calculated by selecting S, as 12,5%, 15,0%, 17,5% and 20,0%
and varying S2 between 30%, 40% and 50%. The results are listed in Table 3.3.1 and
graphically shown in Figure 3.3.1.
3.3.2 Influence of rainfall and evaporation on area required
The same exercise is repeated to study the influence of rainfall and evaporation on the area
required This is done by selecting E as 10.15 and 20 cm/month and varying rainfall between
2.5 and 10 cm/month. S, and S2 are taken as 20% and 50% respectively in this case. The
results are listed in Table 3.3.2 and are shown graphically in Figure 3.3.2.
Watski Model

Guidelines for sludge drying beds 3-6 Chapter 3
Table 3.3.1 : The influence of S, and S2 on specific area
s,
12,5
12,5
12.5
15.0
15.0
15,0
17,5
17.5
17,5
20.0
20.0
20,0
(%)
30
40
50
30
40
50
30
40
50
30
40
50
1045
1228
1338
754
937
1046
546
728
838
390
572
681
Specific Area<AT/q.)
276
325
354
200
248
277
144
193
222
103
151
180
Table 3.3.2 : The effect of E and R on specific area
E(cm/mo)
10
10
10
10
15
15
15
15
20
20
20
20
Rainfall(cm/mo)
2 5
5 0
7 5
1U
2 5
5 0
7 5
1 0 0
2 5
5 0
7 5
10.0
AT
(m*)
585
756
1079
1914
237
430
512
638
275
305
342
391
Specific area(Ar/qJ
155
200
286
506
98
114
136
169
73
81
90
103
Walski Model

Guidelines for sludge drying beds 3-7 Chapter 3
25
= 12.5% S - 15.0% = 17.5% -X-S -20%
Figure 3.3.1 : The influence of S1 and S2 on a specific area
3.3.3 Interpretation
The equation indicates that the area required is relatively insensitive to the depth of application
Ho. The only effect of depth (if Ho is multiplied through in the denominator) is when t,/H0 is
not constant. As long as t, is proportional to Ho, it is of no significance. As t, is not proportional
toH0, the result implies that some savings in cost can be realised by increasing Ho.
The sensitivity of specific area (AT/qs) on varied solids concentration is shown in Figure 3.3.1.
The figure shows the extreme sensitivity of area on S,. This means that sludges that drain
easily will use significantly less area, indicating the need for accuracy in determining S, in
laboratory analysis.
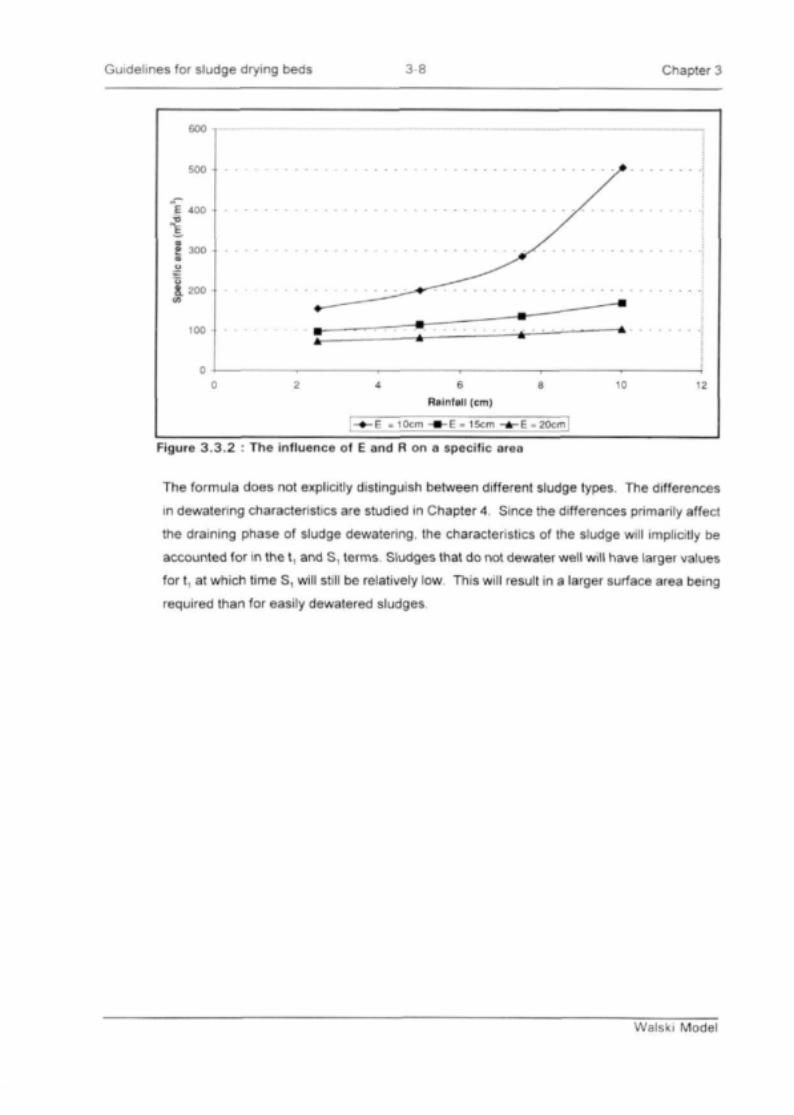
The sensitivity to evaporation factors is shown in Figure 3.3.2. This figure indicates that the
required area increases to infinity as effective evaporation approaches zero In such instances
drying beds would obviously require covers.
Walski Model
Guidelines for sludge drying beds 3-8 Chapter 3
600 -,
500 -
E 400•b
• 3 0 0
200 - • - -
100
10 12
Rainfall (cm)
• E = 10cm •E = 15cm -E = 20cm
Figure 3.3.2 : The influence of E and R on a specific area
The formula does not explicitly distinguish between different sludge types. The differences
in dewatering characteristics are studied in Chapter 4. Since the differences primarily affect
the draining phase of sludge dewatering, the characteristics of the sludge will implicitly be
accounted for in the t, and S, terms. Sludges that do not dewater well will have larger values
for t, at which time S^ will still be relatively low. This will result in a larger surface area being
required than for easily dewatered sludges.
Walski Model

Guidelines for sludge drying beds 4-1 Chapter 4
CHAPTER 4
LABORATORY AND FULL-SCALE TESTING
4.1 INTRODUCTION
The objectives of these tests were aimed at verification or assessment of the prime parameters
required for application of the Walski Design model (Chapter 3). Laboratory scale columns were
used to determine ST and t, for both anaerobic digested (AD) and activated (AS) sludges. Initial
concentrations (So) were varied by dilution or concentration of the original sludge samples. The
laboratory drainage columns used in this study are shown in Figure 4.1.
The complete study is too comprehensive to include in this guide, and is compiled into a set of
working papers which is held in the library of GFJ (Pty) Ltd.
Artificial rainfall (AR) was added during various stages of drainage to estimate the b-factor. The
water absorption capacity (WAC) of air-dried AD and AS sludges was also compared to
determine rainfall absorption under simulated conditions of extreme rainfall and after completion
of the evaporation period (t2). Evaporation dishes were used to determine the evaporation from
sludge relative to clean water (a-factor).
Several reports from the literature were studied to complement the results derived from this
study, particularly on the drainage parameters So, S, and t v
Two full-scale test beds (TB1 and TB2) were also used in parallel to compare dewatering
parameters for AD and AS sludges during a full drying cycle during a dry period. A third test bed
(TB3) charged with AD sludge was also monitored during a period of high monthly rainfall and
compared with TB1
The test results are briefly summarised, discussed and interpreted in this chapter It should be
appreciated that these results are highly empirical and within the limited scope for statistical and
fundamental studies allowed for in the compilation of this guide. It is envisaged, however, that
these results could provide the designer with reasonable guidance in using the Walski model
for the design of sewage sludge drying beds.
Laboratory and Full-scale Testing

Guidelines for sludge drying beds 4-2 Chapter 4
Sludge
Support media
Drained water
Tube used tomeasureevaporation fromsludge columns
Figure 4.1 : Six 52 mm diameter columns used to study the variables that influence sludgedewatering
4.2 DESIGNATION OF SLUDGES USED
The sludges used in laboratory and full-scale tests were sourced from various plants and had
varying characteristics. For the purposes of this chapter the sludges will be referred to as
follows:
AD-1 Anaerobic digested sludge from (Source I) (So = 2,93%), comprising of about 40%
waste activated and 60% primary sludges which were combined in digesters.
This sludge was used for laboratory drainage tests in parallel with TB1.
AD-2 : Anaerobic digested sludge (So = 3,60%). used to prepare dilutions for laboratory
drainage tests, also TB3 (Source I).
AS-1 : Activated sludge DAF thickened (So = 2,57%) and used on TB2. The sludge age
was about 11 days (Source I).
AS-2 ; Waste activated sludge ex Source II (So = 0,4%); thickened to So = 1,0% for
drainage tests. Sludge age > 30 days (well-stabilized).
AS-3 . DAF thickened ex Source III (So = 4,0%); dilutions prepared for drainage tests:
Relatively long sludge age (>20 days).
Laboratory and Full-scale Testing

Guidelines for sludge drying beds 4 3 Chapter 4
DS-1 : Air-dried digested sludge ex Source I for water absorption tests capacity (WAC)
(S2 > 80%).
DS-2 Air-dried activated sludge ex Source I for WAC tests (S? > 80 %).
DS-3 Air-dried anaerobic digested sludge ex Source II for WAC tests (S2 > 80%).
DS-4 . Air-dried activated sludge ex Source II for WAC tests.
4.3 GRAVITY DRAINAGE TESTS
4.3.1 Methodology
Drainage tests were conducted using various sludges The sludges were loaded in the test
columns and the variable depth of sludge above the filter media (Hs) and accumulated drainage
(Hd) were recorded with time. The initial concentration of solids (So) was determined in the
laboratory and the solids concentration during or after drainage (So - S,) was estimated as
follows:
(Ho denotes the depth of sludge (cm) loaded at t0). Equation 4.3.1 (a) is derived based on the
drainage collected from a sample. This estimate was verified using the initial and final depths
of the sludge (i.e. Ho & H,)
T , T T u 4.3.1(a)
In some cases S, was gravimetrically determined in the laboratory (denoted by S*). S, is based
on the assumption that the density of the drained sludge is equal to unity. However. S, , based
on Hd, would be influenced by the leakage water used during the preparation of the columns
which remains in the column when it is charged with fresh sludge. A correction factor for
leakage was estimated from a blank column run in parallel.
Laboratory and Full-scale Testing

Guidelines for sludge drying beds 4-4 Chapter 4
4.3.2 Interpretation of drainage results
The results from the drainage experiments are presented in Figures 4.3.2 (a) to 4.3.2 (c). Figure
4.3.2 (a) depicts the depth of sludge bed (Hs) and drainage (Hd) with time for AD-1 sludge.
Averages of 5 parallel tests are recorded. A close agreement between AH3 and AHd is
demonstrated for this particular sludge.
Drainage curves for AD-2 dilutions with tap water are shown in Figure 4,3,2 (b) with estimates
of t, and S, values The t, and S, values increase So with concentrations
Drainage curves for AS-3 dilutions using DAF underflow for dilution are shown in Figure 4.3.2
(c) with estimates oft, and S,. The t, and S, values also increased with So but were significantly
lower than for AD-2 sludges.
50 i —
45
40 -
3 5 -
30 -
£ 25 -Q.01
Q 20
15 -
10- -
5- -
24 28 31 48 53 69 72 90 123 140 145
•Sludge depth (Hs) -"-Drainage depth (Hd)
Figure 4.3.2(a) : Results from drainage tests on AD-1 sludge
Laboratory and Full-scale Testing

Guidelines for sludge drying beds 4-5 Chapter 4
30
10 20 30 40 50 60
Drainage time (h)
70 80 90 100
•So^O.72% •So-1.80% - ^ -So -3 .60%
Figure 4.3.2(b) : Results from drainage tests on AD-2 sludge
30 T
25
20 30
Drainage time (h)
40 50 60
•So = 0.4% -»-So = 0 8% -A-So = 1 6% -«-So = 4.0%
Figure 4.3.2|c) : Results from drainage tests on AS-3 sludge
Laboratory and Full-scale Testing

Guidelines for sludge drying beds 4-6 Chapter 4
a
6
4
2
c
Si (%)
) 2
o
y
4Sollda
*"
6load
— —
8(SL)
• *
1
10[kg/m2]
t i
O
12
(d
8
6
4
2
14
- © - AD
- ^ - AS
- * - AD
- * • - A8
(81)
(81)
Figure 4.3.2{d| : A comparison between AD and AS sludges indicating the effect of solidsload on Sn and t.
From the drainage curves rough estimates oft, and S, were made. As expected t, is difficult to
define accurately and estimates are made from the declining gradients of the curves.
In the case of dilute sludges the t, values are relatively short and calculated S, values are highly
sensitive to {H0-Hd). A summary of estimated t, and S, values is given in Table 4.3.2 From
these results an attempt was made to graphically present t, and S, values against Solids Load
for AS and AD sludges. (See Figure 4 3 2 (d). From this figure it appears evident that drainage
times t, for AS are significantly less than for AD sludges. However the resultant (S,) is also
comparatively less for AS, i.e. a "wetter" sludge remains to be dewatered during the evaporation
period t, to t2. This could probably be ascribed to a larger fraction of bound water for activated
sludges (AS).
4.3.3 Test bed drainage experiments
Two adjacent sludge drying beds from Sourcel (TB1 and TB2) with a surface area 225 nr each
were filled with AD-1 and AS-1 sludges respectively. Routine daily measurements of sludge
levels were made during a drainage period of about 8 days Because of variations in filter media
depth a number of fixed monitoring points were selected to determine average sludge depths.
The S, and t, values were estimated from variable sludge levels (Ho to H,} (Figure 4.3.3 (a)).
Laboratory and Full-scale Testing

Guidelines for sludge drying beds 4-7 Chapter 4
These tests were done to verify the bench-scale test results for AD-1. Fair agreement was found
as is shown in Table 4.3.2.
Table 4.3.2: Summary of data from drainage experiments
SludgeType
AD-1
AD-2
AD-2
AD-2
AD-2
AS-2
AS-2
AS-3
AS-3
AS-3
AS-3
AS-3
AS-3
AD-1
AS-1
(%)
2 93
0 36
0 72
1.8
3.6
0 34
1 0
4 0
1 6
0.8
0.4
4 0
2 9
2.93
2 57
(mm)
44
26
26
26
26
30 1
30 1
26
26
26
26
26 4
36 4
24 3
22 4
H,(mm)
183
_
_
-
_
20 2
20 0
85
106
(mm)
25 6
22 8
20.4
20 4
14.4
28 6
25.2
9.5
190
20.5
23.0
9 5
16.2
-
-
t,(days)
6 0
2 6
2.9
4 0
4.2
0.3
0.7
1.5
1.1
07
0 25
26
3.2
6 8
7
s,(%)
8 237 04"
2 9
3.3
8 3
8.1
6.8
6.1
6.36.7*
5.9
3 8
3.5
625 2"
655 3*
7 658 37-
6 205 43*
SL(kg/m2)
1 2 9
0 9
1 9
4 7
9 4
(1 0)
(3.0)
104
4 2
2 1
1.0
1 0 6
1 0 6
TB1 7 1
TB2 5.8
* Denotes laboratory results
The increase in solids concentration (Sn) with time is shown in Figure 4.3.3(b} which
demonstrates dewatering for the digested sludge compared to that of the DAF activated sludge.
Samples for laboratory solids determination were taken during the full dewatering cycle After
21 days the AD-1 sludge was at 40% solids compared to 20% for AS-1. The AD-1 sludge had
dried to approximately 90% solids at the time as the AS-1 sludge only had reached 40%
moisture content (Figure 4.3.3 (b)) These results indicate poorer dewatering for the DAF AS-1
than for AD-1 sludge.
Laboratory and Full-scale Testing

Guidelines for sludge drying beds 4 8 Chapter 4
25
5 -
4 5
Drainage time (d)
• AD Sludge • AS Sludge • AD Sludge • AS Sludge—Poly . (AD Sludge)—Poly (AS Sludge)
Figure 4.3.3(a) : Full-scale drainage test results on AD-1 and AS-1 sludges
cat
% S
olid
s
80
60
40
20
1
c 5
/
/
^ 4^^-—^^t i
10 15 20 25
Drying time (d)
j • AD -1 Sludge • AS 1 Sludge |
TB1
/
TB2
* *
30 35
Figure 4.3.3(b) : Full-scale dewatering test results of AD-1 and AS-1 sludges
Laboratory and Full-scale Testing

Guidelines for sludge drying beds 4-9 Chapter 4
The Walski model was applied to these results under conditions of minimal rainfall (b=0) and
using a=0,75 and E=15,3 cm. The calculated T values (the time taken to reach a haulable
sludge of S2 = 40%), were in close agreement (within 1 day) with the experimentally monitored
dewatering time.
It should be noted that the AS-1 in TB2 had a relatively short sludge age of 11 days which partly
explains the inferior dewatering behaviour Obnoxious odours and flybreeding were observed
at this bed The solids loads for TB1 and TB2 were respectively 7,12 and 5,76 kg/m2. It appears
that activated sludges should only be considered for dewatering on drying beds if they are well
stabilized and if they are applied at lower SL than digested sludges.
4.3.4 Further interpretation of drainage results
For application of the Walski model an estimation oft, andS, is essential. As with other models
it is unlikely that these parameters will be known for different sludge types during the design
phase. The drainage data obtained from these studies as well as those derived from the
literature was subjected to regression analyses and exponential equations were fitted to them.
The results for three types of sludges lead to the following empirical relationships where SL
denotes the sludge loading. The correlations are also presented graphically in Figure 4.3.4 (a).
Well stabilised activated sludge (sludge age 20-25 days) (Sludge A):
- 1 - 22.8SL 092 4.3.4{a)
Poorly to medium stabilised activated sludge ( Sludge B )
- i - 9.17SL 068 4.3.4fb)
Anaerobically digested (mixed primary and waste activated sludge) (Sludge C):
- 1 - 9.0SL o-54 4.3.4(c)So
The equations presented in this section are derived from limited data and require further
research and refinement. These empirically derived equations are recommended for estimating
S, which is needed in the Walski model. Ideally a laboratory determination for a particular
sludge would be more accurate but this is of course only possible for an existing sewage works.
Laboratory and Full-scale Testing

Guidelines for sludge drying beds 4-10 Chapter 4
25 -i
20 -
15 -
10
5 -
0 -
-O-Sludge
• Sludge
-A-Sludge
-X- Sludge
- * - Sludge
-©-Sludge
—t— Randal
A{Exp.)
B(Exp.)
C (Exp.)
A (Eq 4.3.4a)
B(Eq. 4.3.4b)
C(Eq. 4.3.4c)
and Koch (1968)
6 8 10
Sludge Load (SL) [kg/m!]
12 14 16
Figure 4.3.4(a) : Graphical representation of the regression curves used to determine S-,
10
9
i 8
W 7
6 -
C. 54)E
• = 4
3 -
2 -
1 -
O
4 6 8
Sludge load (SL) (kg/m2)
O T (Reported data) -M-T (Estimated data)]
10 12
Figure 4.3.4(b) : Comparison of Walski's estimated values with Randall and Koch's {1968)experimental data
Laboratory and Full-scale Testing
Guidelines for sludge drying beds 4-11 Chapter 4
From Fig. 4.3.4 (a) it can be seen that S^SQ decreases with increased SL. A similar curve could
be derived from work done by Randall and Koch (1968) on aerobically digested sludges This
curve is also presented in Fig 4.3.4 (a) and shows a good correlation with other data sets. This
impiies that increasing sludge loads will reduce the percentage of water that drains from the
sludge leaving a larger fraction to be evaporated.
A comparison was made between Randall and Koch (1968) experimental data and the Walski
model This comparison is shown in Figure 4.3.4 (b). The results are obviously dependent on
the accuracy of the input data but for practical purposes the Walski model appears to be valid
although slightly conservative.
As mentioned previously the importance of the drainage phase should not be underestimated.
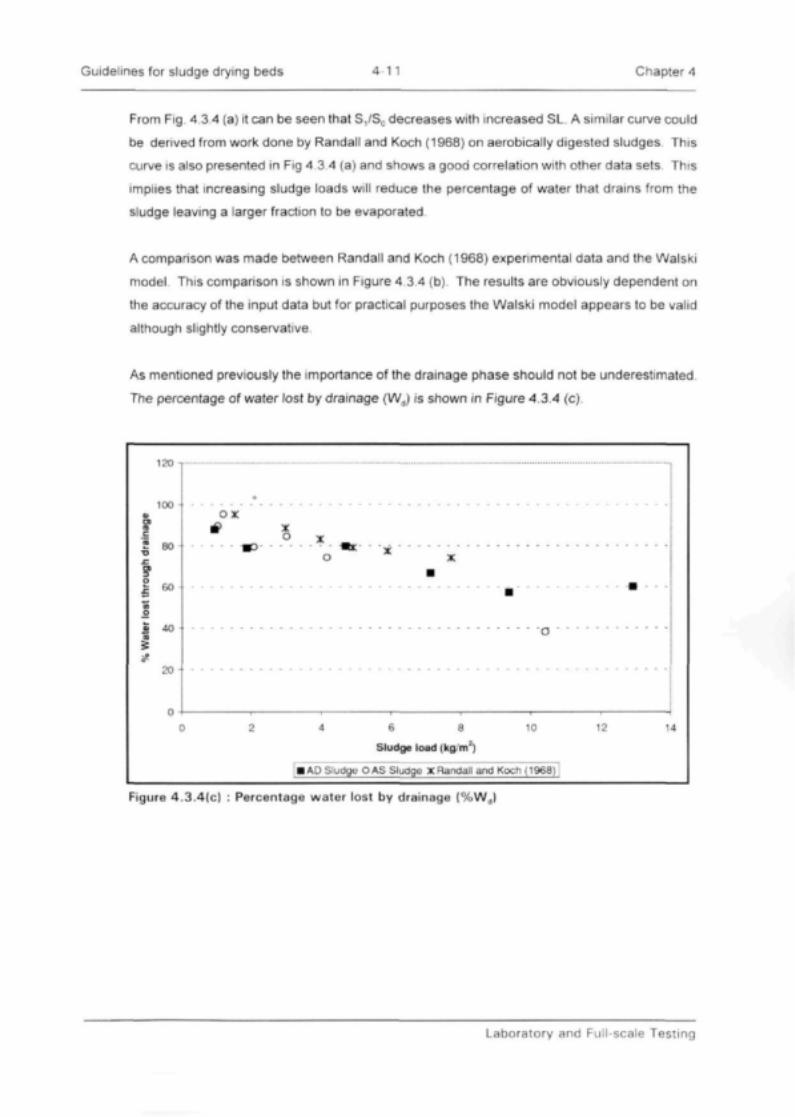
The percentage of water lost by drainage (Wd) is shown in Figure 4.3.4 (c).
120 T
100
cS
•n
iugh
ilo
stte
r
80 -
60 -
40 -
20 -
O
6 8
Sludge load (kg/m1)
10 12 14
I AD Sludge O AS Sludge X Randall and Koch (1968)
Figure 4.3.4(c) : Percentage water lost by drainage (%W(
Laboratory and Full-scale Testing
Guidelines for sludge drying beds 4-12 Chapter 4
For practical purposes % Wa follows the same declining rate with increased SL for both
activated and anaerobically digested sludges.
What is also significant is the amount of water lost in the drainage phase The results confirm
that the drainage mechanism accounts for more than 75% of the water removed from the sludge
over a relatively short drainage period.
Beds that are therefore not provided with adequate drainage facilities are left to evaporate this
water which will lead to vastly extended total dewatering times. Data from the Randall and Koch
(1968) report on aerobically digested sludges is also included.
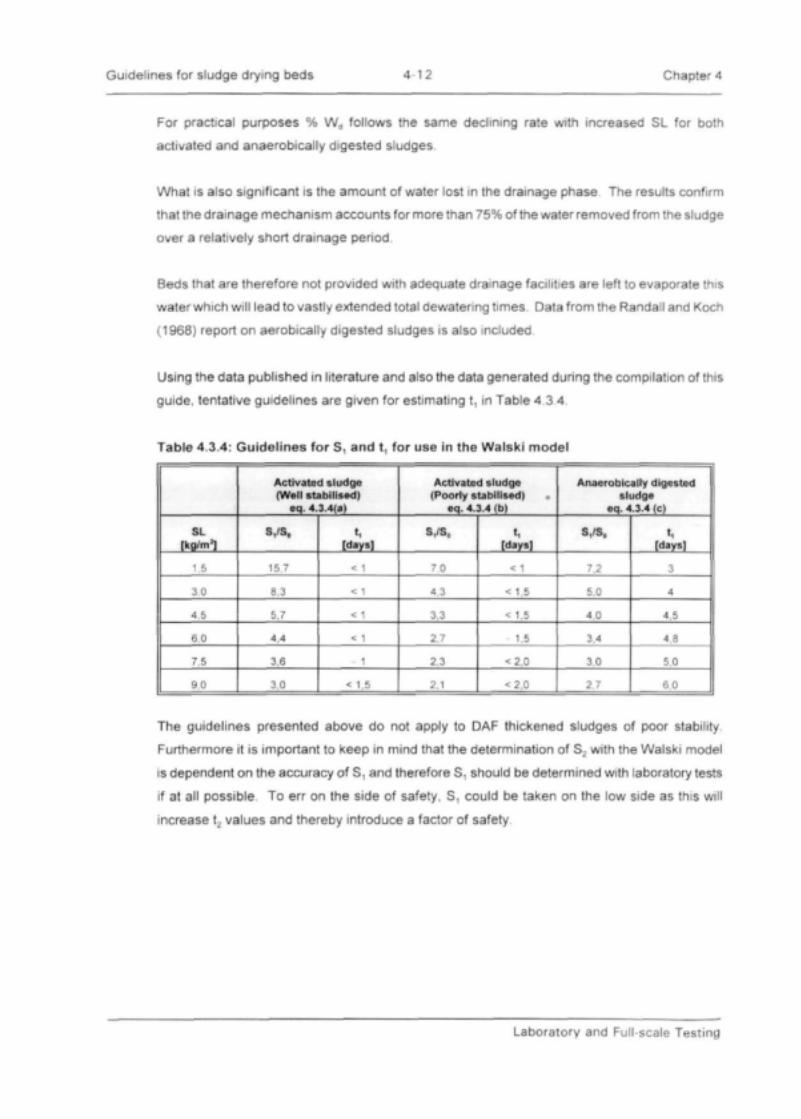
Using the data published in literature and also the data generated during the compilation of this
guide, tentative guidelines are given for estimating t, in Table 4.3.4.
Table 4.3.4: Guidelines for S, and t, for use in the Walski model
SL[kg/m1]
1,5
3,0
4.5
6,0
7.5
9.0
Activated sludge(Well stabilised)
eq. 4.3.4(a>
s,/s0
15.7
8,3
5.7
4.4
3,6
3.0
t,[days]
< 1
< 1
< 1
< 1
1
< 1.5
Activated sludge(Poorly stabilised)
eq. 4.3.4 (b)
s,/s0
7.0
4,3
3.3
2,7
2.3
2,1
t,[days]
< 1
< 1,5
<1,5
1,5
<2,0
<2,0
Anaerobically digestedsludge
eq. 4.3.4 (c)
s,/s0
7.2
5,0
4.0
3,4
3.0
2,7
t,[days]
3
4
4,5
4,8
5.0
6,0
The guidelines presented above do not apply to DAF thickened sludges of poor stability.
Furthermore it is important to keep in mind that the determination of S2 with the Walski model
is dependent on the accuracy of S, and therefore S, should be determined with laboratory tests
if at all possible To err on the side of safety, S, could be taken on the low side as this will
increase t2 values and thereby introduce a factor of safety.
Laboratory and Full-scale Testing

Guidelines for sludge drying beds 4-13 Chapter 4
4.4 EVAPORATION TESTS (a-FACTOR)
Several tests were conducted using different sludges to verify the a-factor for effective
evaporation as used in the Walski Model (a=0,75). This was done by filling two identical
evaporation pans (- 30 cm diameter) with about 5 f1 of sludge and tap water respectively. These
were exposed to the atmosphere and weighed on a daily basis.
Solids concentration (Sn) during evaporation was calculated from the original solids
concentration (So); original sludge mass (Mo), and residual sludge mass Mn.
The a-factor was calculated from the relative mass losses for sludge and water. The results
obtained are briefly summarised below.
AD-1 sludge (So = 2,93%) (SL = 2,2 kg/m2)
The a-factor appeared close to unity up to about 8% Sn content. An "average" value of 0,79 was
estimated for a Sn range of 8% to 46%.
AD-3 sludge (So = 3,58%) (SL = 1.15 kg/m2)
The a-factor up to about 12% Sn was on average 1,19 and for 12% to 36% on average 0,87.
An a-factor that is larger than unity is also reported by a number of other authors (Adrian, 1978).
AS sludge (So = 1,5%) (SL = 0,6 kg/m2)
The a-factor up to about 13% Sn was close to unity. From Sn equal to 13 to 40% the average a-
value was estimated at 0,72.
From these results the proposed value by Walski of a = 0,75 appears acceptable The results
further indicate that the a-factor only becomes relevant at higher solids content of 8 to 13%
which is in fair agreement with the literature. It should be noted that these estimates of the a-
factor are based on relatively low experimental SL-values (0.6 - 2,2 kg/m2). A gradual decrease
in the a-factor is anticipated for increased SL. particularly for AS of poor stability.
Laboratory and Full-scale Testing

Guidelines for sludge drying beds 4-14 Chapter 4
4.5 RAINFALL ABSORPTION (b-FACTOR)
4.5.1 General
The effective evaporation term (aE-bR) for application of the Walski model assumes the b-factor
to be constant. Based on the original work of Swanwick the mean value of b for 15 separate
observations was estimated at 0,57. This value relates to anaerobically digested sludges at 30
cm loading depth indicating a relatively high solids load (SL = 15 kg/m2atanassumedS0 = 5%).
No indication is given of the possibility that the b-factor could be reduced by lowering SL (e.g.
SL = 1,5 kg/m2 assuming So = 0,5%) such as for waste activated sludges. Furthermore the
range for R is unspecified. The assumption that b remains constant for a variable R appears to
be oversimplified.
A number of tests were conducted using the laboratory drainage columns to assess the b-factor.
Rainfall was simulated after completion of gravity drainage (i.e. at t,) as this condition was
assumed to be representative of the worst case scenario. Rainfall prior to t, and prior to the
formation of the blinding layer is thought to act as a simple dilution of the sludge in which case
the bulk of the rainwater would simply drain away.
Should rainfall occur sometime after t,, the sludge would most probably have started to crack.
The rainfall would simply drain through the cracks and would leave a smaller percentage to be
absorbed by the sludge cake. The cake would also have started to lose its water retaining
capacity as will be shown later.
Because of the importance assigned to the b-factor, special attention was devoted to this
aspect. The main findings are briefly summarised and discussed in the following paragraphs.
Adrian (1978) conducted experiments using 500 mf of well mixed sludges and fitted glass
funnels. The sludges were allowed to dewater until they reached the desired moisture ccntent
within the "falling rate" drying phase, i.e. 2 1 % to 36%.
Daily rainfall varying between 0,25 and 10 cm was added and allowed to drain. By regression
analyses the following equation was derived to describe what influence rain had on drying
sludges (equation 4.5.1(a)):
Laboratory and Full-scale Testing
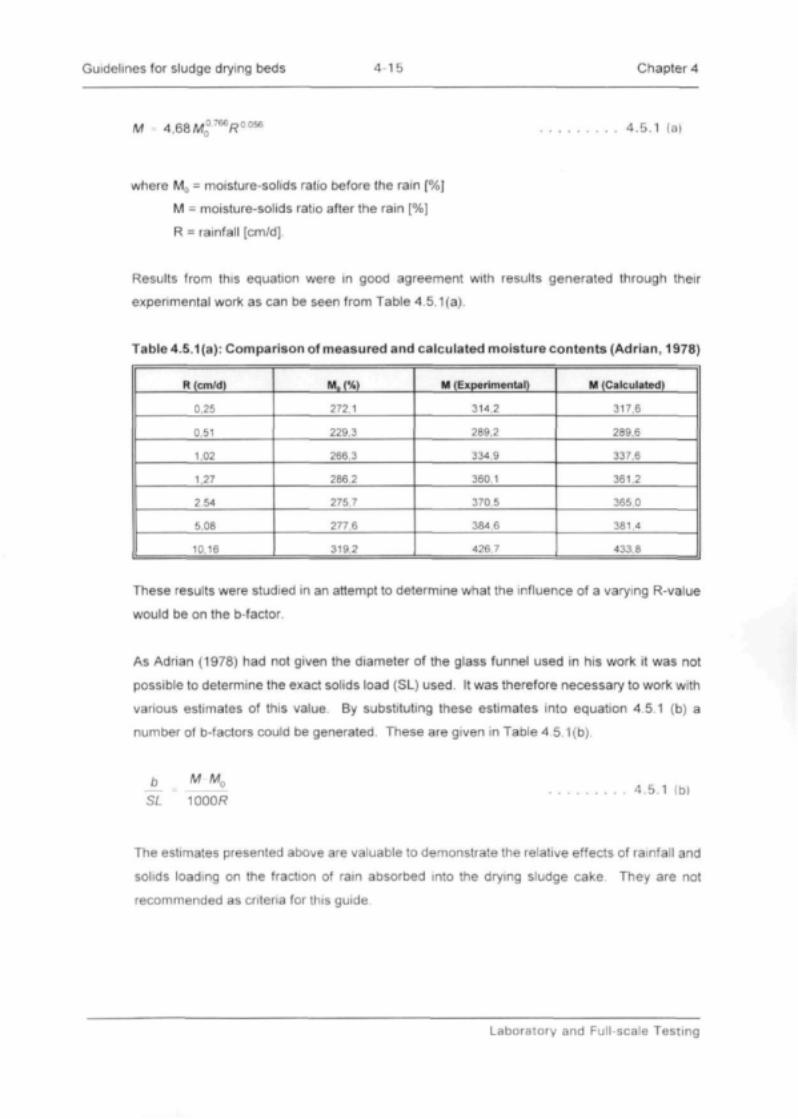
Guidelines for sludge drying beds 4-15 Chapter 4
M - 4,68M00766R0056 4.5,1 (a)
where MQ = moisture-solids ratio before the rain [%]
M = moisture-solids ratio after the rain [%]
R - rainfall [cm/d].
Results from this equation were in good agreement with results generated through their
experimental work as can be seen from Table 4.5.1(a).
Table 4.5.1 (a): Comparison of measured and calculated moisture contents (Adrian, 1978)
R (cm/d)
0,25
0,51
1,02
1,27
2.54
5,08
10,16
Mo (%)
272,1
229,3
266,3
286,2
275,7
277.6
319,2
M (Experimental)
314,2
289,2
334.9
360,1
370,5
384,6
426,7
M (Calculated)
317,6
289,6
337,6
361,2
365,0
381,4
433,8
These results were studied in an attempt to determine what the influence of a varying R-value
would be on the b-factor.
As Adrian (1978) had not given the diameter of the glass funnel used in his work it was not
possible to determine the exact solids load (SL) used- It was therefore necessary to work with
various estimates of this value By substituting these estimates into equation 4.5.1 (b) a
number of b-factors could be generated. These are given in Table 4.5.1(b).
b M Mo
~SL ~ 1000R4.5.1 (b)
The estimates presented above are valuable to demonstrate the relative effects of rainfall and
solids loading on the fraction of rain absorbed into the drying sludge cake. They are not
recommended as criteria for this guide.
Laboratory and Full-scale Testing

Guidelines for sludge drying beds 4-16 Chapter 4
Table 4.5.
R
(cm/d)
0,25
0,51
1,02
1,27
2,54
5,08
10,16
1(b): b-Factors generated from Adrian (1978)
b/SL
(from eq. 4.5.1(b))
0,18
0,12
0,07
0,06
0,035
0.02
0,011
b
(atSL
= 2 kg/m')
0.36
0 24
0,14
0.12
0.07
C.G4
0,022
b
(atSL
= 4 kfl/mJ)
0,72
0,48
0,28
0,24
0.14
0,08
0,04
b
(atSL
= 6 kg/m;)
1,08
0.72
0,42
0 36
0.21
0.12
0,07
Limiting SL
(b = 1)
5 55
8.33
14.3
16.7
28.6
50,0
90.1
The following conclusions could be drawn from the above table.
(i) At constant SL the b-factor decreases with increased R. It should be noted that b
represents the fraction of rainfall absorbed and that increased R implicitly increases the
mass of rain absorbed.
(ii) At constant R, the b-factor increases with SL. For each R there appears to be a limiting
SL-value beyond which all rain is absorbed The value obviously increases with R.
(iii) The rainfall (R) is expressed in cm/d. For the Walski model the rainfall for a typical "wet
month" is required Interpretation or utilisation of the above R and b-values in the Walski
model is rather complex. Maximum annual averages of rainfall in high rainfall areas in
South Africa rarely exceed 2000 mm/a. On a daily average this extreme rainfall hardly
ever averages 5 mm/d. The question arises how rainfall data must be interpreted and
what b-factors must be assigned for use in the Walski model. Evidently appreciable
scope for further research remains.
A further discussion follows in paragraph 6.3.3.
4.5.2 Rainfall absorption by anaerobically digested sludge (experimental)
The results of the initial absorption tests performed on anaerobically digested sludge in the
course of the compilation of this guide are presented in Table 4.5.2(a). The results indicate b-
values of 0,13 to 0,34 for R ranging from 13 to 27 mm per month distributed over a period of 2
to 3 weeks and SL of 12,9 kg/m2.
Laboratory and Full-scale Testing

Guidelines for sludge drying beds 4-17 Chapter 4
Test columns A to E were allowed to drain completely after the rainfall experiments Simulated
rainfall ranging between 1 to 5 cm were applied and total drainage collected after 8 days. The
sludge cakes were then removed and solids concentration determined. The results are shown
in Table 4.5.2 (b).
Results indicate estimated b-factors ranging from 0,2 to 0,47 for incidental rain ranging from 1
to 5 mm. The percentage solids in the sludge cakes significantly decreased with increased
rainfall.
Table 4.5.2 ( a ) :
Column
Time <d)
0
6
12
16
18
23
25
32
Total CorrectionD*
b = R - D*R
R(cm)
Time range(d)
Rainfall absorption by anaerobic digested sludge (AD-1
A
R
0
0
212
0
53
21
0
0
286
D
0
(75)
(25)
185
4
40
5
15
349249
0,13
13,5
13
B
R
212
0
212
0
106
43
0
0
573
D
0
232
38
195
8
76
8
29
586486
0,15
27,0
23
C
R
159
53
0
0
159
64
0
0
435
D
0
195
53
22
10
142
7
34
463363
0,1
20,5
23
D
R
106
53
53
0
212
85
0
0
509
D
0
112
57
60
9
170
?
68
483383
0,26
24,0
23
Sludge type)
E
R
53
53
53
53
0
106
0
0
318
0
D
0
75
48
45
47
12
9
74
310210
34
15,0
23
Where R = Rainfall (cm)So = 2,93% SL = 12,93 kg/m2
D = Drainage collected (cm) Ho = 44 cmNote 1 cm = 21,23 mi in the test columns used
Table 4.5.2 (b): Continued rainfall experiments
Column
Rain (cm)
b-f actor
% Solids
A
1,0
0,29
22.5
B
2.0
0.32
19.7
C
3,0
0,47
18,8
D
4,0
0,20
16.5
E
5,0
0,30
15.8
Laboratory and Full-scale Testing

Guidelines for sludge drying beds 4-18 Chapter 4
4.5.3 Rainfall absorption by activated sludge
Drained activated sludges with solids loads ranging from 1 to 10 kg/m2 were subjected to 10 cm
of rain and drainage was collected after 4 days, at which time further drainage appeared
minimal. The b-factorwas estimated after 4 days. The blinding layer in the media interface was
then disrupted which resulted in further rapid drainage (within 2 - 3 hours). The additional
drainage induced in this way increased the total amount of drainage to levels that compared well
with the amount of "rainfall" applied. The results are shown in Table 4.5.3.
Table 4.5.3 : Rainfall absorption by activated sludge
SLkg/m2
1.04
2,08
4,16
10,40
Rain addedcm
10
10
10
10
Drainage after4 days(cm)
9.4
4.2
3,0
3.5
Apparent b-factor
0 06
0,58
0,70
0,65
Additionaldrainage after
disruption
.
7,4
7,5
7,1
These results point strongly to the blinding layer causing resistance to drainage of rain,
particularly at high SL (2 to 10 kg/m2). Indications are that the b-factor relates to the resistance
to filtration caused by the blinding layer and not by the physical absorption of rain on solids.
Further tests were also conducted with drained anaerobic digested sludge with SL ranging from
0,9 to 9,2 kg/m2 and applying 10 cm of artificial rain. Drainage collected after two days (with
disruption of interface) confirmed virtually complete drainage of rain (b < 0,1). After 4 days the
columns were re-charged with 10 cm of rain. A further 6 days were allowed for drainage (this
time without disruption of the interface) and for all practical purposes the charged rain was
quantitiveiy drained in all experimental columns.
During a period of high rainfall (17,4 cm/month) a further test bed (TB-3) was monitored over
the full dewatering cycle of an AD-1 sludge. Ana-factor of 0,75 was assumed and the b-factor
estimated from the experimentally determined Walski parameters (Ho, So, S,, S2 and T) This
resulted in a b-value of 0,28.
Laboratory and Full-scale Testing

Guidelines for sludge drying beds 4-19 Chapter 4
These results indicate the following:
(a) For AD sludges (SL~10 kg/m2) the b-factor is substantially lower than the value of 0,57
as quoted in the literature A value of b=0,20 is suggested for high rainfall areas (R>10
cm/m). For low rainfall (R<10 cm/m) a value of b = 0,3 is recommended.
(b) For activated sludges b = 0,4 is recommended.
4.5.4 Water absorption capacity of dried sludges (WAC)
Air dried sludges were tested for WAC under conditions simulating extreme rainfall. An
empirical method was used whereby ±100 g sludge was soaked with 1 r of water for 2 to 5 hours
and the mass of water absorbed was determined The objective was to roughly estimate b
during conditions of excessive rain when sludges are already haulable (i.e. after t2, S2).
Results are listed in Table 4.5.4.
Results confirm higher WAC for waste activated than for anaerobic digested sludges For well-
stabilised waste activated (DS-4) the values were lower than for the DAF-thickened DS-2
sludges The WAC appears to have value as a crude estimation of the b-factor. At the very
least it could be used to compare the dewatering ability of various sludges relative to each other.
For example, if 100 g of dried sludge absorbs about 200 me of water from supernatant, the
maximum b-value cannot be higher than 2, i.e. 200 mc/100g.
For a given SL and R assuming WAC of 2,0 the following example applies:
SL
R
WAC
R/m2
R absorbed
b
15 kg/m2
= 10 cm
2,0
0,1 x 1000 = 100 kg
15x2 = 30 kg
30/100 = 0,3
Laboratory and Full-scale Testing

Guidelines for sludge drying beds 4-20 Chapter 4
Table 4.5.4 : Measured water absorption capacities
Sludge TypeRefer par. 4.2
DS-1
DS-2
DS-3
DS-4
Water Absorption Capacity(WAC)
1.671,581,501 64
1.861,992.10
1.22
1 40
Saturation Time (h)
3325
235
3
3
This value is considered conservative because of crack formation in practise. These results
indicate that b-values during the intermediate evaporation stages approaching t2 will not be
excessive especially when well-defined cracks have been formed.
Laboratory and Full-scale Testing

Guidelines for sludge drying beds 5-1 Chapter 5
CHAPTER 5
THE CURRENT SITUATION IN SOUTH AFRICA
5.1 GENERAL
The prime purpose of this guide is to address the problems that designers and operators
currently face in South Africa regarding sludge drying beds. In order to determine what these
problems are and also to try and find some solutions to these problems, questionnaires were
sent out to 536 local authorities, several plants were visited and interviews were held with
designers and operators.
5.2 QUESTIONNAIRES
Of the 536 questionnaires distributed to local authorities 121 were returned. Of these 30
authorities used sludge beds, and these yielded some information that was scrutinised for
points of relevance to design. In order to simplify analysis and comparison the returned
questionnaires were classified under activated sludges (AS), anaerobic digester {AD) and
combined plants (AD). It was evident that some information, especially regarding volumes and
concentration of sludges, were based on rather crude estimates. The data contained in some
of the questionnaires are summarised in Tables 5.2(a), 5.2(b) and 5.2(c), where the variables
have the following meaning.
Qc = Current sewage flow (m3/d)
Qd = Design sewage flow (m3/d)
qs = Approximate volume of wasted sludge (m3/d)
%S 0 = Solids concentration at application (%)
A = Area per bed (m2)
AT = Total area provided (m2)
Ho = Depth of sludge application (m)
Td = Dry season drying times (d)
Tw = Wet season drying times (d)
ATd = Bed area required in dry times (m2)
ATw = Bed area required in wet months (m2)
The Current Situation in South Africa

Guidelines for sludge drying beds 5-2 Chapter 5
Processing of field data in this section was essentially aimed at the following objectives:
(i) to estimate sludge production rates for different plants.
(ii) to estimate and compare sludge bed loading rates and drying cycles, and
(iii) testing of Walski Design model.
The Walski Model was tested by determining the drying time through use of equation 5.2 for
determining the total bed area required.
AT-~T (5.2)
The calculated AT value was compared with the total installed bed area for specific plants (AT).
This comparison should give some perspective of over- and under-design or validity of the
reported values. The T-value can then be compared with reported drying times and used to
calculate AT for comparison with the installed bed areas. The results are included in Tables
5.2 (a), 5.2(b) and 5.2(c). A graph showing the results is presented in Figure 5 2 The
comparison between Walski and the reported data was made for wet and dry periods. If a
perfect correlation existed, all the points would have fallen on the diagonal line. This is,
however, not the case and no correlation exists.
In general the evaluation of the questionnaires received proved to be a difficult exercise. No
strong correlations could be found. Graphs showing typical spreads in data received are
presented in Figure 5.2. This is ascribed mainly to inaccurate reporting by some respondents.
Where the reported values were obviously incorrect, the respondents were contacted and the
issues were discussed In more than one case the obviously "incorrect" values were
confirmed by the respondents. This leads one to mistrust the accuracy of most replies.
The questionnaires have, however, lead to the following valuable findings:
• In several cases where respondents indicated that the beds were not performing
adequately the poor performance could be traced to incorrect bed operation
Overloading of beds was the most common problem. This puts the emphasis on the
need for training. Currently operators receive little or no training in the operation of
drying beds (Basson, 1996, Small, 1997).
The Current Situation in South Africa

Guidelines for sludge drying beds 5-3 Chapter 5
6000
5000 t
Eo§ 4000
3000 -
I 2000
tr1000 -
1000 2000 3000 4000
Bed area reported (x1000m2)
5000 6000
• Walski (wet) • Walski (dry) 100% Correlation
Figure 5.2 : Evaluation of questionnaire data
The replies received, with some exceptions, were mainly from smaller municipalities
and from plants with smaller capacities. This fact correlates well with interviews where
operators reported intensive labour requirements to be one of their primary objections
to the standard bed design. Larger municipalities and plants would therefore prefer not
to make use of sludge drying beds.
The questionnaires have emphasized the degree to which plant designs differ. This
translates into differences in sludge character and also in the way sludge beds are
utilised. This in turn emphasises the need for flexible design criteria, which has been
requested by designers (Hoffman, 1996).
The Current Situation in South Africa

Guidelines for sludge drying beds 5-4 Chapter 5
Table 5.2 (a): Data received from activated sludge plants (AS)
PLANT NO:
Qc rrr/dQd m3/d
q, mVd%SD %A m 'ATm?
H ;m
TddTw d
A.flm?
A r < vm'
A./q,(nr/m3 d)
1
24004300
20
-40
72
720
2
28
28
280280
360
22847
4152
186355550
4270
318002900
3875
90024
310
225750
4
?700
400050
75
2005600
2514
21
28004200
5
2480
4400594
3
264
3168
225
4
6
10561584
£ '>
62200
700025-40
180
360?14
14
28
25005000
144
7
6200
6000
165640
5120
2856
PLANT NO:
Qc rrr/d
Qd mJ/d
Q> m3/d
%Sn %
A m r
A~nr
H3m
T d d
Tw d
A,anT'
AT /q,
(m2/m3.d)
8
5000
7500
95
0,55
110
2100
0 45
2
8,5
4220
1794
221
9
2700
4500
36120
2400
21
35
10
250
11
3461
4000
240
45
2402400
7
9
10
12
18000
26000
300
35
8175
1635035
95
30
38571
25714
681
13
950
1500
2338
104
52022
514
523
1464
226
Table 5.2 (b): Data received from biofilter plants (AD)PLANT NO.
Qc rrr/d
Qd mJ/d
q.nrVd%SO%A m !
ATm"
Hom
Tdd
Twd
A,om :
A™,mJ
AT/q,
(m'/m'.d)
14
5500
5700
500
30910^
47320?
20
30
94 64
15
4000
8100
318-40
127
3816
625
2130
2671
3816
120
16 17
1200
3000
179
70
96
960
2614
24
964
1652
53 6
18
2800
340024
-40
97
173925
25
35
2400
3360
72.5
19
10000
15000
50
-40328
4539
1514
14
46674667
90 8
20
4400
3100
20-40
24
4592?
7
175
229 6
21
1725016400
-60
40561296
2142
-
The Current Situation in South Africa

Guidelines for sludge drying beds 5-5 Chapter 5
Table 5.2(c): Data received from combined plants (AS/BF)PLANT NO:
Qc
Qd
AS/BF
q.%S 0
A
A,
Ho
Td
Tw
22
1100013100
16
685
160
1440
14
35
-
236477
750020
293
3510
14
21
-
24
2335043333
40
10
490
9800
21
21
245
25
5500
23000
36
635
190
1330
7
14
26
54413
5820053
30
-2388806
20
30
-
27 28 29
22000
29000
66
3063007000
15
30
14
25
-
5.3 INTERVIEWS
5.3.1 Designers
In order to evaluate the various design approaches that are currently being employed in the
construction of sludge drying beds, designers were interviewed. It appears that little variation
exists and that the design is based on the following:
• The client indicates whether he prefers manual or mechanical means of sludge removal.
In larger plants where sludge beds are employed, the mechanical methods are preferred,
• From the sludge type and amount of sludge produced, the bed is sized. This is generally
done using fixed area per capita or area per sludge mass ratios. The effect of climate is
not considered quantitatively in this exercise.
• The configuration of underdrains, floors, support media layering, wall construction, inlet and
outlet facilities, etc. is normally based on the consultants' standard designs that have
evolved overtime.
«• The placing of the beds in relation to the rest of the plant is based mainly on pumping and
drainage considerations as well as the surrounding topography. Not all locations are,
however, suited to the ideal placement of the beds and some compromises are inevitably
required. In most cases very little can be done to improve this situation.
The designers approached to date are of the opinion that strict design guidelines are not
appropriate as each plant is unique and requires some special considerations This has been
the case in the past with fixed "load per area" type guidelines The designers have indicated
The Current Situation in South Africa

Guidelines for sludge drying beds 5-6 Chapter 5
that they want flexibility designed into the guidelines in order to allow them to exercise their
judgement.
5.3.2 Plant operators
Following on the questionnaires many plant operators were contacted and telephonic
interviews were held. In general there seems to be little enthusiasm among operators for
sludge drying beds due mainly to the reasons mentioned previously, i.e. poor performance and
labour difficulties. In many cases the operators make use of alternative sludge disposal
methods such as sludge ponds or sludge irrigation although they may have beds available.
Where personal visits were made to plants, it was generally found that operators were aware
of the existence of problems regarding drying bed management. Initiation of monitoring
programmes has, however, received a low priority to date.
Addressing this situation is one of the main goals of the Guide and will be expanded in Chapter
7 The operators should be aware of the advantages sludge beds hold over other disposal
procedures, for example in terms of ground water pollution control. This will become
increasingly more important as the Department of Water Affairs and Forestry introduces
increasingly more stringent requirements for the issuing of sewage treatment plant permits.
The Current Situation in South Africa

Guidelines for sludge drying beds 6-1 Chapter 6
CHAPTER 6
GUIDELINES FOR DESIGN
6.1 GENERAL
There are two main aspects to be considered when designing sludge drying beds. The first
of these is determining the total bed area (AT) required (and the number of beds) and the
second is the actual design detailing. In presenting this chapter the two groups have been
separated It must, however, be understood that certain considerations such as removal
methods influence both aspects.
6.2 SLUDGE REMOVAL TECHNIQUES
In South Africa the removal of sludge from beds has traditionally been a labour-intensive
operation. Due to increased labour cost, labour problems and the gradual increase in plant
size and sludge removal requirements, more and more local authorities are considering using
mechanical methods. Making the decision as to whether manual or automated methods
should be used has, therefore, in most cases, been taken from the hands of the designer.
A decision can, however, still be made based on the basis of economy or efficiency and this
is a complicated exercise. Mechanical methods are generally considered to be faster and
more efficient than manual methods but they also require a higher capital outlay Mechanical
methods may also require structural alterations which may make the structure more
expensive. On the other hand, manual methods are generally used on sand beds. The actual
cost in sand can be high as this does need to be topped up periodically.
In short, capital, maintenance and operational costs should be considered when this type of
analysis is done. Furthermore, this should be done on a design-by-design basis since so
many variables are involved.
6.3 DETERMINATION OF BED AREA
As discussed in Chapter 2, 3 and 4, a number of design models have been presented that can
be used in this exercise. These require various inputs on which the designer has to decide.
It is important to remember that although the various parameters can be manipulated
independently, the drying process is a function of all of the variables combined and that an
alteration to the design might be advantageous seen from one aspect but might be a problem
Guidelines for Design

Guidelines for sludge drying beds 6-2 Chapter 6
seen from another. A designer must consider various combinations of these parameters to
optimise his design. The parameters are discussed separately below.
6.3.1 Depth of sludge application (Ho)
This parameter is normally fixed during design but in most cases the operator can try to
optimise it by altering the operational procedure. As a treatment plant would normally deliver
a fixed production of sludge mass, it would normally be optimised by altering the solids
concentration (So), usually by passing the sludge through a thickening stage As So increases
Ho will therefore decrease {assuming a fixed bed area and mass of sludge). The opposite is
also true. For this reason the sludge mass-per-area design guidelines have traditionally been
used to determine Ho.
Sludge application depths of 200-300 mm on sand beds are considered to be the norm
although many South African plants have been operating at up to 600 mm and more. These
(600 sludge) beds normally do not dewater well. Several attempts have been made to
determine optimal sludge application depths (Jennett and Harris, 1971) The results from
these tests indicate a range of depths from 200-350 mm but these results are highly
dependent on sludge characteristics that vary significantly. It is therefore suggested that each
plant goes through continual optimisation exercises to determine these depths. Hoffman
(1996) states that concrete floored beds should not be loaded deeper than 100-150 mm.
Randall and Koch (1968) studied the influence of Ho on the drying time of aerobically digested
sludge with constant solids content sludges and has shown that sludge applied at various
depths initially drained at the same rate until virtually all the free water was exhausted.
Thinner sludge applications therefore reached the end of their drainage phase sooner As for
the amount of water drained from each, it varied between 70 and 85% depending on the initial
So used. The application depth Ho played no apparent role in the eventual solids concentration
at the end of drainage (S,). Although drainage time would be extended by using deeper
applications, the drainage time is normally a small part of the total drying time and therefore
has a limited influence. It would appear more economical, from a drainage point of view, to
apply well conditioned sludges as deeply as possible. Seen in the light of the rest of the drying
process, this could be counter productive. Vosloo (1978) found that a sludge cake which is
half the thickness of a reference would dry out more than twice as fast. As a rule however,
poorly digested sludges or sludges with poor drainage characteristics should be applied as
Guidelines for Design

Guidelines for sludge drying beds 6-3 Chapter 6
thinly as possible. These include sludges with low sludge ages as well as those which contain
filamentous organisms which inhibit dewatering (Randall and Koch, 1968).
6.3.2 Solids concentration (So)
Traditionally, activated sludges are applied at concentrations varying from 0,4% to 0,7%.
When thickened these may range up to 4%. Anaerobic sludges are normally loaded at a So
of 3% to 4%.
The solids concentration is normally fixed by other process parameters and can only be altered
by post-process thickening. It has already been stated that the sludge mass remains constant
for a given plant. Should So therefore be increased (with a fixed Ho), the total bed area
required can be decreased Randall and Koch (1968) found that aerobically digested sludges
with higher So at application, retained a larger percentage of water after drainage which would
have a significant effect on subsequent drying time. This is expected to be true for other
sludge types.
It is therefore recommended that sludges not be thickened unless they are well stabilized and
have good dewatering characteristics. If sludges are to be thickened the application depths
(Ho) should be kept low to avoid excessive rain water retention complications during the drying
cycle.
6.3.3 Effective evaporation (aE-bR)
Walski (1976) proposed that "typical" wet month rainfall and annual evaporation is to be used
in the determination of bed size. These two climatological conditions rarely occur
simultaneously and also do not necessarily cater for the worst-case scenario.
As an example sludge beds on the highveld normally deliver their poorest performance during
winter and best performance during summer. Using Walski's guidelines the designer would
end up with beds sized for wet months (summer) and would therefore probably encounter
problems during the dry months (winter).
Guidelines for Design
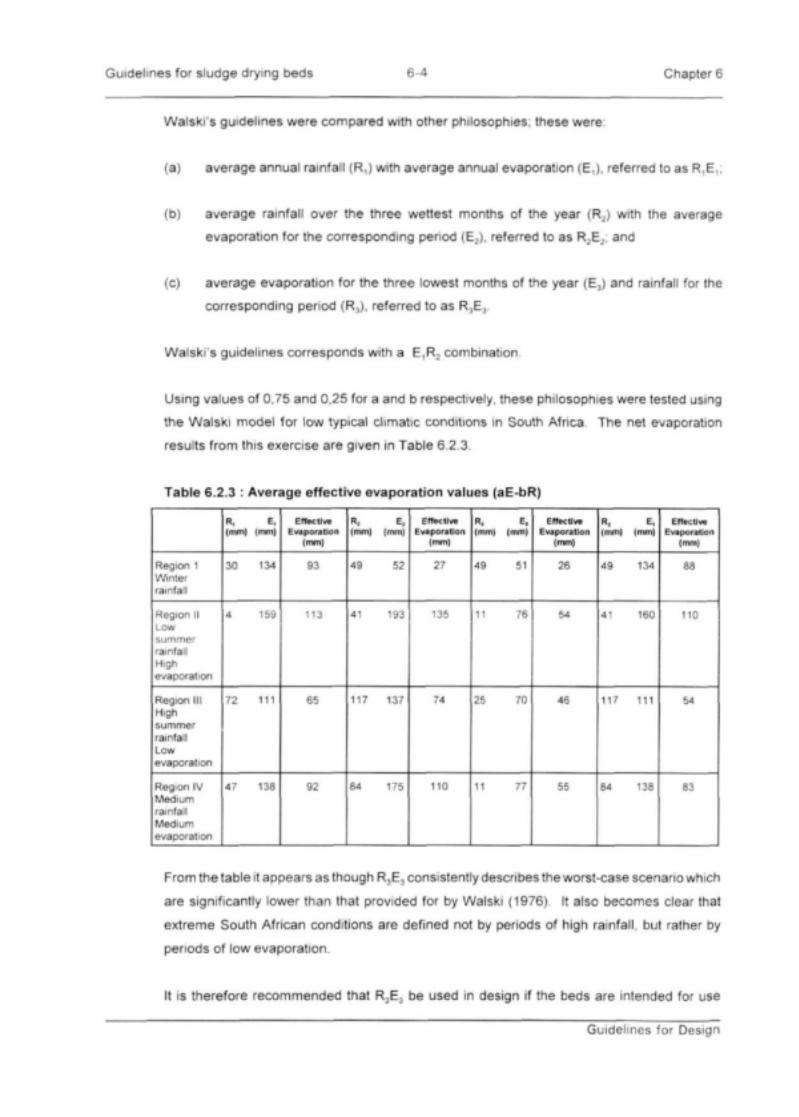
Guidelines for sludge drying beds 6-4 Chapter 6
Walski's guidelines were compared with other philosophies; these were:
(a) average annual rainfall (R.) with average annual evaporation (E,). referred to as R,E,;
(b) average rainfall over the three wettest months of the year <R2) with the average
evaporation for the corresponding period (E2). referred to as R2E2; and
(c) average evaporation for the three lowest months of the year (E3) and rainfall for the
corresponding period (R3), referred to as R3E3.
Walski's guidelines corresponds with a E,R2 combination-
Using values of 0,75 and 0,25 for a and b respectively, these philosophies were tested using
the Walski model for low typical climatic conditions in South Africa. The net evaporation
results from this exercise are given in Table 6.2.3
Table 6.2
Region 1Winterrainfall
Region IILowsummerrainfallHighevaporation
Region IIIHighsummerrainfallLowevaporation
Region IVMediumrainfallMediumevaporation
.3 : Average effective evaporation values (aE-bR)
R, E,(mm) (mm)
30 134
4 159
72 111
47 138
EffectiveEvaporation
(mm)
93
113
65
92
R2 E,{mm) (mm)
49 52
41 193
117 137
84 175
EffectiveEvaporation
(mm)
27
135
74
110
R, E,(mm) (mm)
49 51
11 76
25 70
11 77
EffectiveEvaporation
(mm)
26
54
46
55
R, E,(mm) (mm)
49 134
41 160
117 111
84 138
EffectiveEvaporation
(mm)
88
110
54
83
From the table it appears as though R3E3 consistently describes the worst-case scenario which
are significantly lower than that provided for by Walski (1976) It also becomes clear that
extreme South African conditions are defined not by periods of high rainfall, but rather by
periods of low evaporation.
It is therefore recommended that R3E3 be used in design if the beds are intended for use
Guidelines for Design

Guidelines for sludge drying beds 6-5 Chapter 6
throughout the year. The designer can also repeat this exercise for shorter or longer dry/wet
periods to investigate various scenarios. If the designer chooses to use alternative sludge
dewatering techniques during adverse conditions, it would be up to him to determine what
combination of rainfall and evaporation is to be used.
As an alternative the designer can consider limiting the effect of rainfall by covering the beds.
This would increase the effective evaporation by removing R from the equation. This practice
is common in other countries with wetter climates but is seldom used in South Africa. The
cover (roof) should, however, allow sunlight to pass through as sludge does not dewater well
in shade. Glass or fibre glass is generally used.
6.3.4 Solids concentration after drainage (S,) and drainage time (t,)
This is mainly a function of the character of the sludge and the designer has little influence
here. It does, however, play a critical role in the Walski model and therefore in the
determination of bed size.
As stated in Chapter 4 it is always preferable to determine S, and t, through laboratory
analysis, but this is not always possible since samples of sludge are needed These are not
available when the plant is being designed. Because of this, an alternative approach was
developed during the compilation of this guide. This is discussed in Chapter 4 and is
demonstrated below.
Once the designer has fixed the application depth (HD) and concentration (So), the sludge load
(SL) can be calculated using the following equation (equation 6.2.4)
H SSL = -^-(kglm2) 6.2.4
Where Ho is measured in cm and So in %.
For example, say a well-stabilized activated sludge So = 0,5% is to be applied at Ho= 30 cm,
the sludge load (SL) would be 1,5 kg/m2. The designer could, of course decide to start
designing from the sludge load and then trace back to Ho or So. S, can be determined from
the empirically derived equation 4.3-4 (a) (for a well stabilised activated sludge).
S, - 22,8.SL092.S0
= 22,8.(1.5kg/m2)-092.(0,5%)
Guidelines for Design

Guidelines for sludge drying beds 6-6 Chapter 6
S, = 7,85 %
From this the tentative guidelines for estimating t, in Table 4.3.4 can be used. This indicates
that the sludge mentioned above would dewater in less than one day. It is suggested that t,
be taken as equal to 1 as this would allow a small margin of safety.
6.3.5 Solids concentration at point of removal (S2)
S2 can be varied according to the designer's needs. Generally sludges (activated and
digested) are considered haulable (spadable) at S2 = 40%. This value is then also suggested
when manual labour removal techniques are considered. In some cases the sludges can be
removed at much lower concentrations. At Erwat's treatment plant at Vlakplaas, for example,
the digested sludge is removed at S2 = 10-12% (Basson, 1996). In most cases this would not
be possible but here a front-end loader is used and the bed has a concrete floor. It must,
however, also be pointed out that the sludge takes approximately one month to dewater to this
level. Ordinarily digested sludge would dry to 40% over a similar period of time on a sand bed.
6.3.6 Calculation of bed area and number of beds
Using the sludge defined above and also the S, and t,~values that have been calculated,
Walski's model can be used to calculate the bed area required. The model is stated below
(equation 6 3 6) Assume a worst case scenario design as discussed in paragraph 6.2.3 with
the average lowest evaporation over three months (E) equal to 15 cm/mo and with average
rainfall over the same period (R) as 10 cm/mo The a-factor is taken as 0,75 (refer paragraph
4.4) and the b-factor as 0,4 (refer paragraph 4.5.1).
AT = i°°-qs T withH
30H0S0
aE-bR6.3.6
Guidelines for Design

Guidelines for sludge drying beds 6-7 Chapter 6
Therefore
30(30cm)(0,5%) ( 1 1T - 1
(0,75) (15cm) (0.4) (10cm) \ (8,75%) (40%)
= 6,54d 7 days
As beds are filled and emptied on a daily basis T is rounded up to 7 days For example,
assume that the plant produces 100 m' of sludge per day (qs) at 0,5 %, then the total bed area
requirement would be:
_ 100(75 T = _i 00(100 n _T " Ho 30 cm
A = - ± ° ° ^ - 333 m7 per bed
If sludge is wasted on a daily basis, one bed would be needed for every day of the drying
cycle. A further bed would be required to waste sludge to while cleaning is in progress in
another which is in its seventh day of drying. A total of eight beds (each 333 m2) would
therefore be required in this case.
Should the sludge be thickened to 1% and applied 20 cm deep to increase So, the following
is found:
qs decreases to 50 m3/d
SL increases to 2 kg/m"*S, increases to 12,1 %
t, remains at 1 day
T increases to 7,4 days - 8 days
Ay reduces to 2 000 m? and A to 250 m2.
Allowing one additional bed for maintenance would mean that nine beds are required in this
case This can bring about a significant saving in capital cost, but can only be considered if
the designer is convinced that the sludge will dewater acceptably.
Guidelines for Design

Guidelines for sludge drying beds 6-8 Chapter 6
Vosloo's (1978) design procedure is much simpler but the drying period cannot be determined
from it. Vosloo bases this duration on past experience He suggests a SL of 1.5 - 2.0 kg/m2.
If 100 m3 of sludge is produced per day at 0,5 % solids content, then (at 1 5 kg/m?) the bed
area required could be calculated as follows:
A . (100^(5*9/^) c 3331.5 kg/m2
_ r s j c g / ^ 0 3 0
5 kg/m3
This corresponds with the Walski approach. The difference, however, comes in when Vosloo
(1978) states that the sludge will take approximately 4 days to dry, therefore
AT = A x T = 333 m2 x 4 = 1332 m2
This is significantly less than the 2333 m2 given by Walski's model. It is, however, unclear
whether this is a worst-case design as with the Walski Model and can therefore not be
compared directly. Vosloo also does not allow the designer to do a comparative study as
Walski does since the drying time needs to be known.
Other sizing guidelines such as those of the Water Pollution Control Federation (WPCF)
(Walski, 1976) work on a similar basis as Vosloo's. The daily sludge production of 100 m3 at
0,5% solids deliver 500 kg of solids according to Lue-Hing era/. The production rate of sludge
is 55 (g/cap.d). Therefore 9090 people would be required to produce 500 kg of sludge per
day. WPCF allow 1-2 ft2/cap.d, therefore 845-1690 m2will be required per day. There is no
indication of what type of sludge is catered for or what the drying time will be. These results
cannot be compared with Walski.
Using Vater's model (Adrian, 1978) the Gross Bed Loading (GBL) for the 0,5% sludge is
0,0109 kg/m2.d. The Net Bed Loading (NBL) can be calculated (S2^ 40%) (using equation
2.4.2(c)). This is then equal to 0.0044 kg/m2d The total drying time can then be calculated
by making use of the solids load (SL) which is 1,5 kg/m2 as calculated previously.
SL -r 1,5 kg/m2 . , . . ,= T - : ^ -- 138 days
GBL 0,0109 kg/m2.d
Guidelines for Design

Guidelines for sludge drying beds 6-9 Chapter 6
This does not compare well with Walski's 7 days or even Vosloo's 4 days. There are two
possible reasons for this:
• Haseltine did this work on sludges with S0-values ranging from 4 to 13%. Which lie
substantially above the example used here (0,5%). Haseltine does therefore not cater
for thin sludges
• The model was developed from anaerobically digested sludges under American
conditions. Although Haseltine (1951) does not give adequate information on climatic
conditions, it is expected that these would be significantly different to South African
conditions.
In conclusion it is recommended that Walski's model be used in design and that alternative
models, especially those developed internationally, be discarded until they have been adapted
for South African conditions.
6.4 PHYSICAL DESIGN CONSIDERATIONS
Once the size of the bed has been determined, the physical detailing can commence.
Although all designers have some individual design preferences, some aspects are common.
The various elements of a sludge bed are listed below and some points that could improve the
design of the beds are highlighted.
6.4.1 Access to the bed
The decision made in terms of the method of sludge removal carries over into the physical
design If the sludge is to be removed manually not much is required apart from pedestrian
access and that loading sludge from the bed to a wheelbarrow or trailer should not be unduly
difficult A front end-loader on the other hand would require a sloped access and the bed
configuration should be such that the loader has access to all parts of the bed for effective
sludge removal.
Should more elaborate mechanical removal techniques be considered such as permanently
installed bridges and the like, the requirements of these systems should be borne in mind.
Guidelines for Design
Guidelines for sludge drying beds 6 10 Chapter 6
6.4.2 Ratio of bed length to bed width
A square or even round bed would be the optimum solution if cost were the only consideration.
These shapes have better area-to-circumference ratios than the traditional rectangular beds.
There are, however, a number of other aspects that should be considered and these are briefly
expanded upon below
(a) Sludge flow characteristics
Both digested and activated sludges will separate from the free water that carries them
once they enter a stagnant situation Fresh digested sludge contains gas bubbles which
will force it to float while dead digested sludges (i.e. digested sludges that do not contain
gas bubbles) and activated sludges tend to settle out. Because of this it is sometimes
difficult to get an even distribution of sludge on a bed as sludge will tend to accumulate
in thicker layers at the point of application. This could lead to a situation where one
section of the bed takes significantly longer to dry than the other. This is more
pronounced where thicker sludges are applied.
(b) Accessibility
If the bed is to be cleared using manual methods, the cleaner will have to move a fairly
large volume of material to the wheelbarrow or trailer. It is advisable to keep this
distance short to reduce double handling and to improve on productivity.
(c) Topography
It is sometimes necessary to construct beds on slopes These beds would then be
orientated to minimize the amount of earthworks and terracing required A decrease in
bed width would assist in this.
There are unfortunately no hard and fast guidelines available at present. The general
trend, however, appears to be beds not wider than 6 -7 m and not longer than 30 - 40 m.
There are, however, larger beds that operate successfully
Guidelines for Design

Guidelines for sludge drying beds 6 11 Chapter 6
6.4.3 Floors, walls and drainage
The floors of a sludge bed can be constructed from concrete or can be excavated from the in
situ material. The second option is the cheaper alternative but the designer must be aware
of the following:
(a) The Department of Water Affairs and Forestry requirements in terms of the drainage
water In most cases the Department would insist on the water being returned to the
process to avoid groundwater pollution.
(b) The nature of the in situ material If the material has a significant clay content it will not
drain well The material may also become water-logged and complicate the sludge
removal procedure.
(c) Over time the nature of the (in situ) material will change as it is contaminated by the
sludge. It might loose its permeability and start hindering the drainage of water.
Because of these reasons it is advisable to have a strong, impervious floor - such as one
constructed from concrete.
On a bed that will be cleaned manually, a concrete floor of approximately 75 mm thick would
normally suffice as it would not need to carry high loads. These floors would generally be
supplied with expansion and construction joints to ensure watertightness. On the other hand
the floors that are intended to carry fairly heavy equipment such as front-end loaders would
have to be designed to carry these loads This implies thicker slabs with reinforcing.
Sludge bed walls can be constructed from bricks, concrete or earth embankments The
purpose of the walls is to contain the wet sludge when it is applied and should therefore also
be of a watertight construction. Adequate freeboard is necessary above the sand or floor to
contain the intended sludge level. Generally an additional 100-150 mm is allocated above the
full sludge load. The walls must also protect the drying sludge from stormwater A minimum
wall height of 200-300 mm above the surrounding ground levels must be allowed for this
purpose. If heavy equipment needs access one must ensure that the route does not allow
stormwater to enter the bed. Furthermore the inside faces of the walls should be flush: Where
brick walls are used the mortar should be finished flush with the brick to prevent dried sludge
from clinging to the walls, and where heavy equipment is used to remove sludges, protrusions
into the bed should be avoided to prevent damage to the walls.
Guidelines for Design
Guidelines for sludge drying beds 6-12 Chapter 6
As the drainage phase can rid the sludge of up to 75% of its water it is clear that adequate
drainage facilities must be provided. In a sand bed the drainage has traditionally been placed
under the media. Drainage can consist of a network of perforated pipes spaced 2,5 to 6 m
apart These could be vitrified clay or uPVC pipes. Lately these pipes have been replaced by
drainage channels due to the relatively high breakage rate of the pipes. The channels are
covered with bricks with a 5 to 8 mm spacing and overlain with coarse gravel. The floors are
generally sloped toward the channels to facilitate the drainage process. The drains normally
lead to an open sump. This facilitates cleaning and allows the operator a visible indication of
what is happening
The designer can also take advantage of the fact that sludge tends to separate from its free
water. In activated sludge beds and beds that will take dead digested sludges, a structure can
be incorporated to decant the supernatant as was suggested by Vosloo (1976) Vosloo's detail
is presented in Figure 6.4.3. The most important feature of this detail is the ability to decant
water from various levels, starting at the top and working down. This is to prevent the draw-off
from scouring sludge from the bed's surface during the decanting process.
The main feature of this type of bed is that the whole end wall, opposite the inlet, is
constructed as an overflow weir, with its top 300 mm above sand level and about 75 mm
below the level of the other three walls Downstream of the weir, a collecting trough is
constructed which delivers the overflow into the underdrain system of the bed.
Upstream of the main overflow weir a second weir is constructed forming a channel about 150
- 300 mm wide between the two, running the full width of the bed. This channel has its floor
about 50 mm below sand level and is divided into 5 troughs of equal lengths by means of short
cross walls. Each trough can be drained by a 50 mm pipe and valve through the bottom of the
main overflow weir, discharging into the main overflow collecting trough. The 5 sections of the
upstream weir discharging into the 5 separate compartments, are of different heights, these
heights being respectively 75, 120, 165, 210 and 255 mm above sand level.
Before filling all 5 valves will be closed. When full, clear water will decant over the main weir
until the required bed load has been applied. The remaining surface water is then decanted
by progressive opening of the valves from the highest to the lowest upstream weirs.
Numerous variations around this principle are possible.
Guidelines for Design

Guidelines for sludge drying beds 6 13 Chapter 6
For anaerobically digested sludges a syphon arrangement can be included to draw the water
from under the floating sludge. This works particularly well on beds where no media is used
and no other drainage is facilitated as is the case with Vlakplaas (Basson, 1996).
6.4.4 Media
Media on a sludge bed performs as a support for the sludge and not as a filter as is commonly
believed. The filtration is done by the sludge blinding layer which is formed when sludge is
applied {Clewit and Handyside, 1976) The sand does, however, fulfil an important drainage
function. Randall and Koch (1968) compared the drainage from a sand bed with that from a
concrete floor with a centre drain and found that a 200 mm application on sand had drained
and cracked after 8 hours while the application on the concrete floor still had a 25 mm layer
of free water on the sludge after 10 days.
Typical specifications for sand lie in the order of d10 = 0,2 to 0,3 mm with a uniformity
coefficient (UC) smaller than 4. {Palmer, 1988). The effective size or d10 size implies that 10%
of the sample is smaller than this size. The uniformity coefficient is defined as d60/d10 The
sand depth is normally specified between 150 mm and 300 mm (Palmer, 1988 and
Anonymous. 1978) The sand is sometimes underlain by a coarse sand, fine gravel and
coarse gravel layers (Vosloo, 1976) These layers are normally between 50 and 100 mm deep
(Vosloo, 1978). No fixed guideline exists on the ratio of grain sizes between the various layers
and there exists scope for further work in this regard as some of the layers can be expensive.
The top layer of sand should contain small grains to prevent sludge penetration into the beds.
If sludges were to penetrate a substantial amount of sand would be lost every time sludge is
removed. The sand would then have to be topped up more frequently. If, however, the media
can be procured cheaply or for free, the penetration of sludge would not be such a big
problem. The Daspoort treatment plant at Pretoria uses ash which it collects from a local
power plant at no cost (Saayman, 1995). Although their media losses are quite high, this does
not present them with a problem.
It is generally accepted that the media cannot support heavy equipment, and therefore is not
used when automated sludge removal is intended. The American experience has been that
the concrete floor beds did not dewater well, even though drainage channels were provided
(Randall and Koch, 1968) Subsequently concrete slabs or runners were provided so that the
equipment could run on these, but this also did not work well (Banks and Lederman, 1990).
Guidelines for Design

Guidelines for sludge drying beds 6-14 Chapter 6
These tracks limited the access of the equipment and also decreased the effective drainage
area.
Banks and Lederman (1990) suggested a high-density polyethylene cellular confinement
system that was placed in the media. The hexagonally shaped tubes extended the full depth
of the top layer. The system provides the media with structural support by preventing lateral
slippage or shear of the confined material In addition to allowing a small front-end loader
access to the bed it also provided a handy reference for sludge removal as it prevented the
loader from removing excessive amounts of sand
Another alternative (Anon, 1975) would be to use a small track-type loader as opposed to a
balloon-wheeled loader. The wheel loader tended to press down on its front wheels whereas
the track type loader distributed its load over its entire track.
6.4.5 Sludge application methods
The method of sludge application is fairly standard Each bed is provided with an outlet
through which the sludge is pumped into the bed. The inlet normally points into a stilling basin
which prevents the flow from disturbing the media surface.
6.4.6 Bed placement and alignment
It has been mentioned previously that beds are often constructed against slopes. In most
cases the optimisation of earthworks and minimisation terracing will dictate the beds'
alignment. It is, however, important to bear in mind that sludge beds that are not exposed to
direct sunlight will dewater poorly. This would imply that beds should not be constructed on
steep southern slopes, or close to other structures or trees that might cast a shadow on the
beds Even sludge bed walls cast shadows that prevent portions of the sludge from
dewatering This is especially true for beds with a direct east-west alignment where the sludge
against the northern wall will be in shade all day during winter. This sludge does not dry out.
The optimum alignment has been found to be northeast-southwest or northwest-southeast
With such an alignment the entire bed will be exposed to direct sunlight at some point during
the day.
Guidelines for Design

Guidelines for sludge drying beds 6-15 Chapter 6
-
-
EI I25 m
J
SCHEMATIC PLAN
300 300
tt25 m
SECTION A-A
PLAN OF SUPERNATANTOVERFLOW
FILTERThickness
of layer
0-100mm50mm50mm
250mm
MEDIA
Type ofMedia
10mm stone5mm stone
Coarse sandFine sand
20mm STONE
SECTION B-B
Figure 6.4.3 : Typical activated sludge bed design by Vosloo (1978)
A further consideration is the placement of the beds in relation to the rest of the plant. Sludge
can either be delivered by gravity onto beds or pumped there. This would mean that the
supernatant and filtrate would be pumped back or drained back respectively. The second
alternative is preferred as it allows more control over the sludge wasting procedure.
Guidelines for Design

Guidelines for sludge drying beds 6-16 Chapter 6
Guidelines for Design

Guidelines for sludge drying beds 7-1 Chapter 7
CHAPTER 7
OPERATIONAL GUIDELINES
7.1 GENERAL
The operation of a sludge drying bed is essentially a simple exercise, it is however crucial to
the success of any bed design, as poor operational procedures would turn the best designs
into failures. A common misconception is that the operation consists only of the application
and removal of sludge, while maintenance and optimisation are often neglected.
7.2 APPLICATION OF SLUDGE
Sludge applied to drying beds must be stable and should be applied in depths that will dewater
adequately. Overloading a sludge bed could lead to extended dewatering cycles due to slower
evaporation from the sludge cake and also increased water retention after rain. Furthermore,
new or fresh sludge should not be placed over dried or partially dried sludge. This would have
an effect similar to overloading the bed. It would be preferable to remove the partially dried
sludge and to spread it over a slab or clearing to continue with its drying cycle if bed area is
urgently required for fresh sludge.
7.3 REMOVAL OF SLUDGE
The timeous and regular removal of sludge seems to be the largest problem encountered by
plant operators. Sludge should be removed immediately after it has reached its required solids
content level. It is always the preferred situation to have beds spare than to have to make
difficult decisions because no beds are clean or ready to accept sludge. This is valid for plants
where mechanical as well as labour-intensive methods for sludge removal are employed
Many plant operators state that their removal difficulties stem from poor performance by
labour. This problem could possibly be overcome by the employment of day labour or task
labour to fulfil this function Different labourers can be employed every day and their payment
can be based on the amount of work done rather than on a fixed wage. This management
principle has been employed successfully by some municipalities Consideration can even
be given to contracting this function to a member of the local community who would in turn
also appoint other people from the community. Payment to the contractor should be made on
a performance basis.
Operational Guidelines

Guidelines for sludge drying beds 7-2 Chapter 7
Important aspects of sludge drying bed maintenance are the raking and levelling of the bed.
Water that drains from sludge will cement media particles This will lead to increased
resistance to filtration in the media and eventually blockage thereof. During site visits made
in the course of the compilation of this guide, empty sand beds were encountered that retained
rainwater on the surface These beds then act as beds with no drainage facility. Beds should
be scarified and raked to a depth of 100 mm after every drying cycle to prevent this from
happening. This is not such a time-consuming procedure as one would think. Long nails
driven through a plant at regular intervals could be weighed down and pulled by hand across
a bed. Two or more of these in tandem one behind the other should be adequate. This must,
however, be done after every clearing exercise.
Levelling is necessary to allow the sludge to settle in an even layer across the bed. Beds are
often scoured out in the centre or around the application point- This allows a thicker depth of
sludge to settle there, which will take much longer to dewater sufficiently. The raking exercise
described above would also fulfil a levelling function. It might, however, be necessary to do
some finishing work.
7.4 OTHER MAINTENANCE ASPECTS
The walls and floors of beds will need to be inspected regularly and maintained. Cracks that
form due to settlement or for any other reason should be repaired as soon as possible to
prevent leakage of sludge or drainage water. Unwanted plant growth around structures should
be removed to prevent damage to the structure and access ways and to avoid shadows on the
sludge.
7.5 RECORDS
In order to assess the performance of sludge drying beds it is necessary to maintain a
complete record of the activity on every bed. These records must contain the following:
*• sludge application date,
»• sludge application thickness (Ho),
»• solids concentration at application (So),
• sludge removal date and length of drying cycle (T),
*• solids content at removal (S2),
• rainfall record, and
• notes on other factors that might influence the bed's performance.
Operational Guidelines

Guidelines for sludge drying beds 7-3 Chapter 7
These records will assist in the early identification of problems, as they will make it easy to
trace trends in bed performance and will also assist in the design of extensions to the plant.
7.6 PERFORMANCE OPTIMISATION
Despite the fact that operational procedures need to be fixed during design, the operator will,
in most cases, have the ability to vary these parameters to some degree. The parameters
include:
• sludge age,
• solids content at application (So). especially if a sludge thickening process step is
provided before the sludge beds,
• sludge application depth (Ho), and
• solids concentration at removal (S2).
The impact of these parameters changes on bed performance can be measured using
Haseltine's (1951) GBL and NBL concepts as is illustrated below.
Assume from the example in paragraph 6.3.6 that 8 beds of 333 mzeach have been provided
for the activated sludge (0,5% So) and that the sludge dries on average over 7 days according
to the operator's records. The sludge is removed at S2 = 40%. The values for GBL and NBL
would then be:
GBL - ° ° - < I ^ « < ^ 3 m)(0.5K)T 16
NBL - GBLS2 - 0.214 kg!m2.d x 40% - 0,086 kg/m2.d
Assume the plant operator decides to thicken the sludge and he applies the sludge at 1% (So).
His records indicate that the sludge dries in 8 days. The dewatering of the sludge prior to
application has decreased the sludge volume to 50 m3. The sludge application depth (Ho) is
now 50 m3/233 m2 = 0,215 m and the corresponding GBL and NBL are
GBL - (
NBL - 0,269 kg/m2d x 40% 0.108 kglnr.d
Operational Guidelines

Guidelines for sludge drying beds 7-4 Chapter 7
Comparing the GBL and NBL values for the two scenarios the operator can now see that the
sludge drying rate is higher if the sludge is applied after it has been thickened. He can now
investigate the effect of varying other parameters which could result in saving both time and
money. He could then also be in a position to assist the designer in determining what
additional bed area is required when the plant is expanded.
7.7 MEDIA
The media used on some drying beds can be very expensive. Operators should endeavour
to identify possible media sources and alternative media types in the proximity of the plant.
The alternative media sources can be tested by topping up the existing media over 10-20 m2
sof bed area A comparison can then easily be drawn between the existing media and any
new sources and also what alternative procedures should be considered.
7.8 HEALTH ASPECTS
Sludge applied to drying beds will always contain viable organisms that will expose workers
to some risk. This is the same anywhere else on a treatment plant. The workers should
therefore be informed and educated in these matters. Labourers working in or around sludge
beds must at the very least be provided with gumboots and gloves which should be kept clean.
7.9 CRISIS MANAGEMENT
It is difficult to give precise guidelines on crisis management as problems that arise on a plant
can normally be traced to inadequate bed space or improper operation. Operational difficulties
normally manifest themselves over a period of time and can normally be identified-timeously
if a proper log of bed operation is kept. These problems can then be solved at the source
through investigating various operational alternatives. If the bed area still proves to be
insufficient after this, additional beds will have to be constructed. As an alternative the
application of coagulants can be considered to improve the sludge's dewatering
characteristics. Vosloo (1978) has, however, stated that the application of coagulants does
not really improve the dewatering time of well-stabilized sludges. If this route is considered,
a detailed investigation must be made to compare the initial capital cost of additional beds with
the increased long-term expense of applying coagulants.
Operational Guidelines
Guidelines for sludge drying beds 8-1 Chapter 8
CHAPTER 8
RESEARCH NEEDS
8.1 SURVEYS
During the compilation of this guide an effort was made to retrieve practical information on
design and operational parameters by distributing questionnaires to a number of authorities
using drying beds. The feed-back was highly unsatisfactory in that no logical pattern could be
found in the data. This endorses the need for accurate surveys.
8.2 VALUES FOR t, AND S,
The basis of the manual was essentially to use the Walski model for design purposes. Limited
experimental work was conducted with some activated and anaerobically digested sludges.
The limited results were subjected to regression analysis to estimate:
(a) drainage time (tt), and
(b) solids concentration after drainage (S,).
It is evident that regression equations should be further refined. It is recommended that further
work be done in this regard.
8.3 RELATIONSHIP BETWEEN So, S, and SL
An important contribution made in this study was to show the relationship between the solids
concentration at application and after drainage (So and S,) and solids load (SL), which is:
1 a SL
Thisrelationshipwasempiricallyquantifiedforwell-digested activated sludges, poorly digested
activated sludges and anaerobically digester sludges. These relationships should be verified
further with much larger data sets and could be quantified for other sludges.
Research Needs

Guidelines for sludge drying beds 8-2 Chapter 8
8.4 FURTHER DEVELOPMENT OF MEDIA SPECIFICATIONS
As stated previously, the media used in sand beds contribute towards a large portion of the
capital outlay, yet no guidelines on this exists. Three of the most important questions that
need to be answered are:
(a) What is the optimum grain size and grain size distribution for sludge bed applications
and what are the results if the designer moves away from these optimum points.
(b) What should the ratio be for grain sizes and size distributions between various levels
of media to ensure long-term stability of the media layers while at the same time
allowing the designer to use the least number of sand layers.
(c) Other media types and sources.
8.5 SLUDGE BED SIZE LIMITATIONS
No clear guidelines could be found on the optimal size and shape of sludge depths. Sludge
will settle irregularly over any bed due to the separation of sludge from the water carrying it
Should the bed be too long, sludge will settle in a thick layer on the entrance side of the bed
and no sludge will be carried to the draw-off side. It is not clear at this point what the
maximum dimensions should be. Further work could be done in this regard
8.6 SLUDGE PRODUCTION
Appreciable scope remains for prediction of sludge fluxes for various types of sewage works
design This should be based on raw sewage quality and parameters relating to process
design and operation.
Research Needs

Guidelines for sludge drying beds 9-1
LITERATURE CITED
1. Adrian DD (1978) Sludge dewatering and drying on sand beds. US EPA Report No. EPA-6002-78-141
2. Anonymous (1975) Sludge removal from drying beds Public Works JnL Nov p. 64
3. Anonymous (1977) Sludge dewatering - a task the right equipment makes easier. The AmericanCity & County, p.49.
4. Banks JA and Lederman WK (1990) Innovative sludge drying bed design Public Works Jnl.Sept. p.112.
5. Barnes D, Bliss PJ. Gould BW and Valentine HR (1981) Water and Watewater EngineeringSystems. The Pitman Press, Bath
6. Basson H (Jnr) (1996) Erwat, Pers. comm.
7. Basson H (Snr) (1996) Erwat (Retired), Pers. comm.
8. Clewett MA and Handyside RN (1976) Asphaltic concrete sludge drying beds. Water. 3 (3)pp.15-17.
9. Department of Environmental Affairs, Weather Bureau (1988) Climate of South Africa, Climatestatistics up to 1984 Pretoria.
10. GFJ (Pty) Ltd. (1999) Working Papers to "Guidelines for the design and operation of sewagesludge drying beds", Pretoria.
11. Haseltine TR (1951) Measurement of sludge drying bed performance. Sew. & Ind. Wastes,September, pp. 1065-1083
12. Hoffman R (1996) Wates Meiring Barnard, Pers. Comm.
13. Jacke R (1976) Polymer cuts disposal costs. Water & Sew Wks. p.99.
14. Jennett JC and Harris DJ (1971 ) Environmental factors in design and operation of waste watersludge drying beds, Missouri Water Resources Research Centre, University of Missouri-Rolla.
15 Lue Hing C, Zeng DR and Kuchenvither R Municipal (date unknown) Sewage sludge manage-ment: processing, utilization and disposal. Technomic Publishing Co. inc., Lancaster.
16. Macaulay RA (1976) Chemical conditioning of sludges. Workshop session on sludgedewatering as treatment. Inst Water Pollut Contr S. Afr. Branch, Durban pp. 1-8.
17. Marklund S (1990) Dewatering of sludge by natural methods. Water Sci. Tech 22 (3,4) pp. 239-246
18. Mignone NA (1977) Survey of anaerobic digestion supernatant treatment alternatives. Water& Sew. Wks. p. 42.
19 Novak JT and Langford M (1977) The use of polymers for improving chemical sludgedewatering on sand beds. Ind. Waste Conf, 30 th, Purdue Univ., Ann Arbor Sci. Pub. pp. 94-106.
Literature Cited

Guidelines for sludge drying beds 9-2
20 Ohara GT. Raksit SK and Olson DR (1978) Sludge dewatering studies at Hyperion TreatmentPlant. Journal WPCF. May pp. 912-925
21. Palmer I (1985) Some options for the treatment of alum sludges. Paper presented at the Bien-nial Conference of the IWPC, SA Branch, pp. 1-11.
22 Palmer I (1988) Sludge drying beds WISA Sludge management working group seminar, Min.Trade fair.
23 Pitman AR (1975) Bioflocculation as means of improving the dewatering characteristics ofactivated sludges Water Poflut. Contr 74 (6) p. 688
24 Randall CW and Koch CT (1968) Drying characteristics ofaerobically digested sludge. NationalTechnical Information Service, Springfield. Va.
25 Saayman G (1995) Pretoria Town Council, Pers. comm.
26 Schmidtke NW (1978) Sludge thickening, conditioning and dewatering Canada OntarioAgreement on Great Lakes water quality, Conference Proceedings 6 Canada EPA Ottowapp.173-216
27. Small A (1997) Technisa lecturer. Pers comm
28 Smollen M (1986) Dewaterability of municipal sludges 1 : A comparative study of specificresistance to filtration and capability suction time as dewaterability parameters. Water SAM (3)p.127.
29. Smollen M (1986) Dewaterability of municipal sludges 2: Sludge characterisation and behaviourin terms of SRF and CST parameters. Water SA 12 (3) p.133.
30 Smollen M (1988) Moisture retention characteristics and volume reduction of municipal sludgesWater SA 14(1). p. 25.
29. Swanwick JD, Lussignea FW and Baskerville RC (1964) Recent work on the treatment anddewatering of sewage sludge. Advances in Water Pollution Control, 2 Pergamon Press,pp. 387-417.
30 Vosloo PBB (1978) Design of drying beds for activated sludge. Water Pollut. Control p.71.
31. WalskiM (1976) Mathematical model simplifies design of sludge drying beds. Water Sew. Wks.Jnl. April, p.64.
Literature Cited