iw html5 controls pack - tmssoftware.biz intraweb... · tms software tms intraweb html5 controls...
TRANSCRIPT

TMS SOFTWARE
TMS IntraWeb HTML5 Controls Pack
DEVELOPERS GUIDE
1
April 2017
Copyright © 2011-2017 by tmssoftware.com bvba
Web: http://www.tmssoftware.com
Email: [email protected]
TMS IntraWeb HTML5 Controls Pack
DEVELOPERS GUIDE

TMS SOFTWARE
TMS IntraWeb HTML5 Controls Pack
DEVELOPERS GUIDE
2
Table of contents
Introduction ............................................................................................................................................. 4
Availability ............................................................................................................................................... 4
List of included components ................................................................................................................... 6
Online references .................................................................................................................................... 6
TTIWHTML5Chart .................................................................................................................................... 7
TTIWHTML5Chart description ............................................................................................................. 7
TTIWHTML5Chart features .................................................................................................................. 7
TTIWHTML5Chart architecture ........................................................................................................... 8
TTIWHTML5Chart use.......................................................................................................................... 8
HTML5 Doctype ................................................................................................................................... 9
Chart Types .................................................................................................................................... 10
General chart settings ....................................................................................................................... 16
Chart series ........................................................................................................................................ 16
Chart series properties ...................................................................................................................... 19
Chart annotations .............................................................................................................................. 21
Hints for series values ....................................................................................................................... 23
Chart item layer ................................................................................................................................. 23
Chart legend ...................................................................................................................................... 25
Chart script events ............................................................................................................................ 26
Chart X-Axis ....................................................................................................................................... 28
Chart Y-Axis ....................................................................................................................................... 29
Chart bands ....................................................................................................................................... 30
Chart methods ................................................................................................................................... 30
Chart events ...................................................................................................................................... 31
THTML5Chart Advanced techniques ................................................................................................. 36
THTML5Chart demos ......................................................................................................................... 38
TTIWHTML5PieChart ............................................................................................................................. 42
TTIWHTML5PieChart description ...................................................................................................... 42
TTIWHTML5PieChart features ........................................................................................................... 42

TMS SOFTWARE
TMS IntraWeb HTML5 Controls Pack
DEVELOPERS GUIDE
3
TTIWHTML5PieChart architecture .................................................................................................... 43
TTIWHTML5PieChart use ................................................................................................................... 43
HTML5 Doctype ................................................................................................................................. 44
General PieChart settings .................................................................................................................. 45
TTIWHTML5PieChart demos ............................................................................................................. 52
TTIWHTML5Gauge description ......................................................................................................... 55
TTIWHTML5Gauge features .............................................................................................................. 55
TTIWHTML5Gauge architecture ........................................................................................................ 56
TTIWHTML5Gauge use ...................................................................................................................... 57
HTML5 Doctype ................................................................................................................................. 57
General gauge settings ...................................................................................................................... 59
Gauge Arc .......................................................................................................................................... 61
Gauge Needle .................................................................................................................................... 61
Gauge Sections .................................................................................................................................. 62
Gauge SetPoints ................................................................................................................................ 63
Chart methods ................................................................................................................................... 65
Gauge script events ........................................................................................................................... 65
Gauge events ..................................................................................................................................... 66
TTIWHTML5Gauge demo .................................................................................................................. 67
TTIWHTML5LocalStorage ...................................................................................................................... 69
TTIWHTML5LocalStorage description ............................................................................................... 69
TTIWHTML5LocalStorage features .................................................................................................... 69
TTIWHTML5LocalStorage use ............................................................................................................ 69
HTML5 Doctype ................................................................................................................................. 69
General LocalStorage settings ........................................................................................................... 71
TTIWHTML5LocalStorage demos ...................................................................................................... 73
TMS SOFTWARE
TMS IntraWeb HTML5 Controls Pack
DEVELOPERS GUIDE
4
Introduction
The TMS HTML5 Controls Pack currently includes the TTIWHTML5Chart, TTIWHTML5PieChart,
TTIWHTML5Gauge and TIWHTML5LocalStorage components.
The TTIWHTML5Chart is a chart component for web application development with the IntraWeb
framework. The TTIWHTML5Chart uses HTML5/CSS3 to render data as various chart types: bar, line,
area, stacked bar, stacked area and combinations of these chart types. By using the HTML5 Canvas
and JavaScript code to render charts in any modern browser, no images are used and therefore
bandwidth usage is minimal. The chart also heavily implements asynchronous updates and events.
Chart series data, chart series properties and general chart properties can all be asynchronously
updated. The TTIWHTML5PieChart has similar possibilities but represents pie charts that can have
configurable start and end angles. This enables to show 360° pie charts, 180° pie charts or other
variations.
The TMS TTIWHTML5Gauge is a gauge component for web application development with the
IntraWeb framework. The TTIWHTML5Gauge uses HTML5/CSS3 to render a value in a circular or
linear gauge. By using the HTML5 Canvas and JavaScript code to render a gauge in any modern
browser, no images are used and therefore bandwidth usage is minimal. The gauge also heavily
implements asynchronous updates and events. All properties can be updated asynchronously.
In this document you will find an overview of the components and their features, code snippets to
quickly start using the component and an overview of properties, methods and events.
Availability
TMS HTML5 Controls Pack is available as VCL component for Delphi and C++Builder.
TMS HTML5 Controls Pack is available for
- Delphi 2009,2010,XE,XE2,XE3,XE4,XE5,XE6,XE7,XE8,10 Seattle,10.1 Berlin,10.2 Tokyo
- C++Builder 2009,2010,XE,XE2,XE3,XE4,XE5,XE6,XE7,XE8,10 Seattle,10.1 Berlin,10.2 Tokyo
The IntraWeb framework 12.0, 12.1, 12.2 or 14.0.x is required
TMS HTML5 Controls Pack has been designed for and tested with: Windows Vista, and Windows 7, 8,
10.

TMS SOFTWARE
TMS IntraWeb HTML5 Controls Pack
DEVELOPERS GUIDE
5
Current version of the TMS HTML5 Controls Pack has been designed for and tested with Microsoft
Internet Explorer 9, Google Chrome 19, Firefox 5, Apple Safari for Mac OS-X, Apple Safari for iOS,
Opera 11, WebKit.
TMS SOFTWARE
TMS IntraWeb HTML5 Controls Pack
DEVELOPERS GUIDE
6
List of included components
TTIWHTML5Chart: core chart component
TTIWHTML5PieChart: core pie chart component
TTIWHTML5Gauge: core gauge component
TTIWHTML5LocalStorage: core local storage component
Online references
TMS software website: http://www.tmssoftware.com TMS HTML5 Controls Pack page: http://www.tmssoftware.com/site/IWHTML5Controls.asp TMS IntraWeb products page: http://www.tmssoftware.com/site/products.asp?t=iw

TMS SOFTWARE
TMS IntraWeb HTML5 Controls Pack
DEVELOPERS GUIDE
7
TTIWHTML5Chart
TTIWHTML5Chart description
The TMS TTIWHTML5Chart component is designed to render various chart types in a browser using
HTML5/CSS3/JavaScript. The component currently offers following chart types: bar, area, line,
stacked area and stacked bar. Multiple series can be simultaneously shown in the chart.
TTIWHTML5Chart features
- Different chart modes: area, bar, line, stacked area, stacked bar, xy.
- Automatic display of a legend in both vertical and horizontal mode.
- Annotations and value labels can be added to series points for any chart type.
- A 3D effect can be optionally applied to each chart type.
- Square, circle, rectangle or image markers on series points can be set for chart types: line,
area, stacked area and xy.
- A separate item layer is available to add any type of additional information on the chart at a
position of choice, either on top of the series or below.
- Customizable text in X-axis, Y-axis and different X-axis, Y-axis per series.
- Automatic Y-axis range calculation or configurable range.
- Configurable helper lines and color banding.
- Asynchronous updatable single series point or entire series and asynchronous updates of
series properties, chart properties.
- Different asynchronous events to handle clicks on various parts of the chart.
- Display of series points values as hint on mouse-over.
- Full asynchronous update support.

TMS SOFTWARE
TMS IntraWeb HTML5 Controls Pack
DEVELOPERS GUIDE
8
TTIWHTML5Chart architecture
The core part of the TTIWHTML5Chart is the series collection (1). As many series as required can be
added to the chart via this collection. Each series in this collection can be separately configured. For
each series, an X-axis (2) and Y-axis (3) can be displayed. Further, a legend (4), caption (5) and status
line (6) are available. Finally, an item layer is a collection of items (7) that can be displayed along the
series, either below or on top of the series is available.
TTIWHTML5Chart use
Getting started
From the Delphi repository select a new IntraWeb application template.
This is done by choosing: File -> New ->Other-> VCL for the Web Application Wizard.
From the component palette, select TTIWHTML5Chart and drop it on a form. This shows an empty
chart. Add series via the collection editor shown upon clicking the property TTIWHTML5Chart.Series.
The chart type for each series can here be set via THTML5ChartSerie.SerieType.

TMS SOFTWARE
TMS IntraWeb HTML5 Controls Pack
DEVELOPERS GUIDE
9
HTML5 Doctype
To correctly enable the use of HTML5 code in a browser that supports this technology, it is required
to include the HTML5 Doctype: “<!DOCTYPE html>”.
In IntraWeb 11.0.47 or later this can be achieved by setting the DocType property of the
ServerController form.
Example:
procedure TIWServerController.IWServerControllerBaseCreate(Sender:
TObject);
begin
DocType := '<!DOCTYPE HTML>';
end;
In earlier version of IntraWeb this can be achieved by setting the PageContext.DocType property in
your Form’s Render procedure.
Example:
procedure TIWForm1.IWAppFormRender(Sender: TObject);
begin
PageContext.DocType := '<!DOCTYPE html>';
end;
When using a TIWTemplateProcessorHTML control as the Form’s LayoutMgr, the Doctype definition
must be placed on the first line in the template html file.
Example:
<!DOCTYPE html>
<HTML>
<HEAD>
<TITLE> My Template </TITLE>
</HEAD>
<BODY>
{%TIWHTML5Chart1%}
</BODY>
</HTML>
Please note that including the HTML5 Doctype on a form can influence the appearance and
functionality of other controls on the same form which are not compatible or not fully compatible
with this Doctype!

TMS SOFTWARE
TMS IntraWeb HTML5 Controls Pack
DEVELOPERS GUIDE
10
Chart Types
This is an overview of the chart types that can currently be set for each series in the chart:
- stArea
The screenshot below shows an example of an area chart type. The chart displays three area
series with 3D option enabled, with opacity and with value labels. One item is added on the
item layer to show the text “Sales 2011” in a rectangle. The location of the legend is set with
Chart.Legend.Position = lpAbsolute and coordinates set via Chart.Legend.Left /
Chart.Legend.Top.

TMS SOFTWARE
TMS IntraWeb HTML5 Controls Pack
DEVELOPERS GUIDE
11
- stBar
Below is an example of a bar chart type. This chart displays two series of data, with positive
and negative values. A legend is added and legend items are displayed horizontally, set with
Chart.Legend.Orientation = oHorizontal. One annotation is added to the series 0 at point 5.
Note also that in this sample, for each series, the range is set to the same value +80 / -80.
This is done via Chart.Series[index].RangeFrom / Chart.Series[index].RangeTo. By specifying
an identical range for all series, the chart has for each series an equal division of values along
the Y-axis. If values of different series are in an entirely different range, it is no problem to
define different values for Chart.Series[index].RangeFrom / Chart.Series[index].RangeTo for
each series. The Y-axis can in such case display multiple ranges, i.e. a range for each
displayed series instead of one common Y-axis as in the sample above.

TMS SOFTWARE
TMS IntraWeb HTML5 Controls Pack
DEVELOPERS GUIDE
12
- stLine
On the screenshot are 3 series of the line chart type. Square marker type was set for each
series and value labels are shown. Note also the use of banding in the chart background.
Banding is enabled with Chart.Bands.Enabled = true and colors for even bands and odd
bands are set with Chart.Bands.PrimaryColor / Charts.Bands.SecondaryColor. The color of
the helper lines is set with Charts.Series[index].Yaxis. Color = clWebRed.

TMS SOFTWARE
TMS IntraWeb HTML5 Controls Pack
DEVELOPERS GUIDE
13
- stStackedArea
On the screenshot below, a stacked area chart is shown consisting of 3 series. The areas
represent simply the sum of values of the series. The first series values are shown at the
bottom, the last series values at the top. In this sample, annotations have been added to
each point in each series.
Example code on how to fill the annotations with the values from each series can be found in the
samples paragraph.
TMS SOFTWARE
TMS IntraWeb HTML5 Controls Pack
DEVELOPERS GUIDE
14
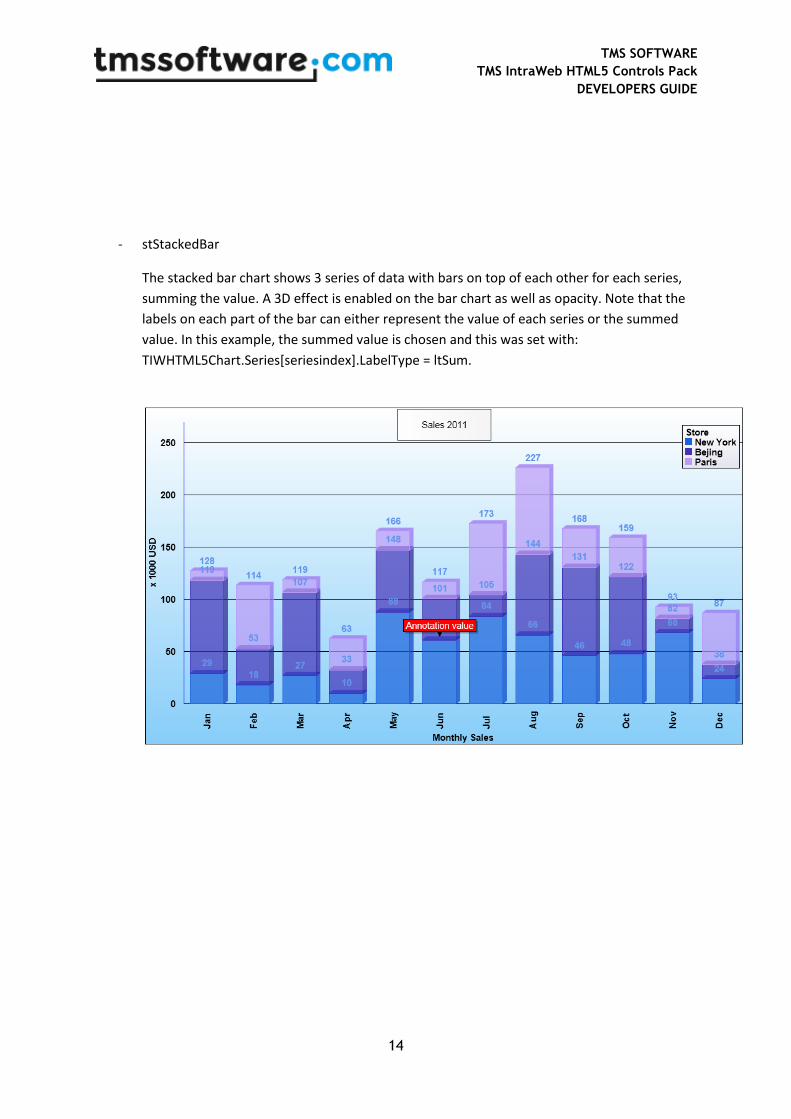
- stStackedBar
The stacked bar chart shows 3 series of data with bars on top of each other for each series,
summing the value. A 3D effect is enabled on the bar chart as well as opacity. Note that the
labels on each part of the bar can either represent the value of each series or the summed
value. In this example, the summed value is chosen and this was set with:
TIWHTML5Chart.Series[seriesindex].LabelType = ltSum.

TMS SOFTWARE
TMS IntraWeb HTML5 Controls Pack
DEVELOPERS GUIDE
15
- stXY
On the screenshot are 3 series of the XY chart type. Circular marker type was set for each
series. For XY chart types vertical lines are also displayed. Note also the use of positive and
negative values for both the X and Y axis.
TMS SOFTWARE
TMS IntraWeb HTML5 Controls Pack
DEVELOPERS GUIDE
16
General chart settings
TIWHTML5Chart properties
- BGColor: Sets start color of the gradient for the chart background.
- BGColorTo: Sets end color of the gradient for the chart background.
- BGGradientDirection: Sets the gradient direction for the chart background. The gradient direction can be gdVertical or gdHorizontal.
- Caption: Sets the text for the chart.
- CommonZeroAxis: When set to true, all zero lines are forced to one position on the chart. This makes sense when comparison of different series is demanded in a chart with positive and negative values.
- HTML5Warning: Sets the message displayed when the browser that is used to render the
control does not support HTML5.
- SelectedSerieIndex: Sets or gets the index of the selected series. Note that the selected value point within a series is set via TIWHTML5Chart.Series[SelectedSerieIndex].SelectedIndex: integer.
- ShowAnimation: When set to true, the charts are displayed with animation. This means that when values are shown, an animation effect will show these from zero till the actual value. Note that for performance reasons, animation has been disabled for iOS. The CPU of these
mobile devices is not sufficiently powerful to display a smooth animation.
- Spacing.Horizontal: Sets the horizontal spacing between the chart and the left/right border
of the control.
- Spacing.Vertical: Sets the vertical spacing between the chart and the left/right border of the control.
Chart series
Adding/Removing series values
First open the series collection editor by clicking the TTIWHTML5Chart.Series property in the Object
Inspector. From here, series can be added or removed.

TMS SOFTWARE
TMS IntraWeb HTML5 Controls Pack
DEVELOPERS GUIDE
17
The equivalent in code is:
Adding a series:
var
cs: THTML5ChartSerie:
begin
cs := TIWHTML5Chart1.Series.Add;
cs.SerieType := stArea;
cs.Name := ‘January’;
cs.YAxis.visible := False;
Removing a series:
TIWHTML5Chart1.Series.Delete(serieindex);
Select a series from the collection and its properties will be shown. The values for a series are
organized under THTML5ChartSerie.Items. Click the property Items to open the series items
collection editor and from here values can be added or removed. The value is set via
THTML5ChartSerieItem.Value: double property and the X-axis text is set via
THTML5ChartSerieItem.XAxis: string property.

TMS SOFTWARE
TMS IntraWeb HTML5 Controls Pack
DEVELOPERS GUIDE
18
To add a new value or remove an existing value programmatically, use the code as shown in the
example below:
Adding a value to a series:
var
csv: THTML5ChartSerieItem;
csv := TIWHTML5Chart1.Series[seriesindex].Items.Add;
csv.Value := Random(1000);
Removing a value from a series:
TIWHTML5Chart1.Series[seriesindex].Items.Delete(pointindex);
Customizing series appearance
The appearance of series can be further controlled via its properties. The following sample sets
gradient start and end color, the opacity as well as the line color for the first series of an area chart. It
also sets the delta between values displayed on the Y-axis for this series to a fixed value of 100.
begin
TIWHTML5Chart1.Series[0].BGColor := clWebRed;
TIWHTML5Chart1.Series[0].BGColorTo := clWebYellow;
TIWHTML5Chart1.Series[0].LineColor := clWebBlack;
TIWHTML5Chart1.Series[0].YAxis.Delta := 100;
TIWHTML5Chart1.Series[0].Opacity := 200;
end;
The following code snippet sets the values that will be displayed in the X-axis for a series and by
setting the XAxis.Rotate property to true, instructs that the chart should render these labels in

TMS SOFTWARE
TMS IntraWeb HTML5 Controls Pack
DEVELOPERS GUIDE
19
vertical direction:
for x := 0 to 11 do
begin
TIWHTML5Chart1.Series[0].Items[x].XAxis := Months[x];
TIWHTML5Chart1.Series[0].XAxis.Rotate := True;
end;
Chart series properties
For each series in the chart, an extensive configuration is possible. This is done via the
THTML5ChartSerie class for instances in the TTIWHTML5Chart.Series collection.
THTML5ChartSerie properties
- BGColor: Sets start color of the gradient for the series background, i.e. color of bars in a bar chart or color of area in an area chart.
- BGColorTo: Sets end color of the gradient for the series background.
- BGGradientDirection: Sets the gradient direction for the series background. The gradient direction can be gdVertical or gdHorizontal.
- ItemAlignment: Determines the alignment of the item. Now fixed on iaCenter.
- THTML5ChartSerieItem
o Defined: Indicates if the item is displayed on the chart.
o Name: Can hold a name for the item.
o Tag: Stores an integer value. Tag is an integer property that has no predefined meaning. It can be used for storing an additional integer value, or it can be typecast to any value such as a component reference or a pointer.
o Value: Stores the Y-axis chart value for the actual chart item.
o XValue: Stores the X-axis chart value for the actual chart item. *
- LabelColor: Sets the label text color.
- LabelType: Sets the label type. Following types are defined: ltNormal, ltSum. When ltSum is chosen with a stacked area or stacked bar chart, the shown labels are the sum up to that point in the chart. With ltNormal, the individual values are shown.

TMS SOFTWARE
TMS IntraWeb HTML5 Controls Pack
DEVELOPERS GUIDE
20
- LineColor: Sets the color of the lines in line series types or the border color for bar or area charts.
- LineWidth: Sets the width of the line in line series or the border width for bar or area charts.
- MarkerColor: Sets the color for series point markers when used in line or area charts.
- MarkerImageUrl: Sets the URL of the image file to use for the marker (when MarkerType is set to mtImage).
- MarkerSize: Sets the size of the marker.
- MarkerType: Sets the type of marker to use at series points for line or area charts. Following values are defined: mtNone: No marker is displayed. mtCircle: A circular marker is displayed. mtSquare: A square marker is displayed. mtTriangle: A triangular marker is displayed. mtImage: An image is used as marker.
- Name: Sets the name for the chart series. The name is used in the legend of the chart.
- Opacity: Sets the opacity for the bar or area of a series when these types are used. Opacity is a value between 0 and 255. 0 means fully transparent, 255 means fully opaque.
- RangeFrom: Sets the minimum Y-Axis value of a series.
- RangeTo: Sets the maximum Y-Axis value of a series. This property can be used to create manually some headroom on top of the chart, leaving enough space to display a legend.
- SelectedBGColor: Sets the color for the series point when it is in selected state.
- SelectedIndex: Sets or gets the index of the selected series point.
- SelectedMarkerColor: Sets the color of the marker when the series point is in selected state.
- SerieType: Sets the chart series type. Following types are defined: stArea, stBar, stLine, stStackedArea, stStackedBar. See the paragraph on series types for more information.
- Show3D: When set to true, shows the different series types with a 3D effect.
- ShowLabels: When set to true, shows text labels with the series point value.
- Tag: Stores an integer value. Tag is an integer property that has no predefined meaning. It can be used for storing an additional integer value, or it can be typecast to any value such as a component reference or a pointer.
- XAxis:

TMS SOFTWARE
TMS IntraWeb HTML5 Controls Pack
DEVELOPERS GUIDE
21
o Delta: Sets the delta between values where the value and a vertical helper line is displayed. When delta is set to zero, this delta is internally calculated as the maximum series value minus the minimum series value in the series divided by 10. *
o Font: Sets the default font that will be used for the X-Axis values for the series.
o Rotate: When set to true, rotates the X-Axis values 90 degrees left for the series.
o ShowLines: When set to true vertical lines are displayed for the series. *
o Visible: When set to true, X-Axis values are displayed for the series.
- XRangeFrom: Sets the minimum X-Axis value of a series. *
- XRangeTo: Sets the maximum X-Axis value of a series. *
- YAxis:
o Color: Sets the color of the helper lines
o Delta: Sets the delta between values where the value and a horizontal helper line is displayed. When delta is set to zero, this delta is internally calculated as the maximum series value minus the minimum series value in the series divided by 10.
o Font: Sets the default font that will be used for the Y-Axis.
o Position: Defines the position of the Y-Axis. Possible choices are: apLeft and apRight.
o ShowLines: When set to true horizontal lines are displayed for the series.
o Visible: When set to true, Y-Axis values are displayed for the series.
o ZeroLineColor: Sets the color of the zero line.
o ZeroLineWidth: Sets the width of the zero line.
* For XY chart types only.
Chart annotations
Annotations offer a way to show additional information, other than the value to a series point. An
annotation can be set as text, displayed in a rectangle with a background colour that can be specified
and positioned near the series point. All annotations for the chart are bundled in the annotations
collection and accessible via the property: TTIWHTML5Chart.Annotations.
The sample below shows an area chart with one red annotation for one individual value (data point 5
in series 0).

TMS SOFTWARE
TMS IntraWeb HTML5 Controls Pack
DEVELOPERS GUIDE
22
Programmatically, an annotation can be added with the following code:
var
ca: THTML5ChartAnnotation;
begin
ca := TIWHTML5Chart1.Annotations.Add;
ca.SerieIndex := 0;
ca.PointIndex := 5;
ca.Caption := 'Annotation value';
ca.BGColor := clWebRED;
ca.BGColorTo := clWebRED;
ca.BorderColor := clWebBLACK;
end;
THTML5ChartAnnotation properties
- BGColor: Sets start color of the gradient for the annotation background.
- BGColorTo: Sets end color of the gradient for the annotation background.
- BGGradientDirection: Sets the gradient direction for the annotation background. The gradient direction can be gdVertical or gdHorizontal.

TMS SOFTWARE
TMS IntraWeb HTML5 Controls Pack
DEVELOPERS GUIDE
23
- BorderColor: Defines the border color for the annotation.
- Caption: Sets the text for the annotation.
- Font: Sets the default font that will be used for the annotation.
- Name: Can be set to give the annotation a name.
- PointIndex: Sets the data point index within a series to which the annotation belongs.
- SerieIndex: Sets the index of the series to which the annotation belongs.
- Tag: Stores an integer value. Tag is an integer property that has no predefined meaning. It can be used for storing an additional integer value, or it can be typecast to any value such as a component reference or a pointer.
Hints for series values
It is possible to show the values of series points only when the mouse hovers over the points. This
capability is enabled by setting TTIWHTML5Chart.Hint.Visible to true. Further control over the
appearance of these hints is found under TTIWHTML5Chart.Hint.
THTML5Hint properties
- BGColor: Sets start color of the gradient for the hint background.
- BGColorTo: Sets end color of the gradient for the hint background.
- BGGradientDirection: Sets the gradient direction for the hint background. The gradient direction can be gdVertical or gdHorizontal.
- Caption: Sets the text for the hint.
- Font: Sets the default font that will be used for the hint.
- LineColor: Sets the color of the border of the hint.
- LineWidth: Sets the width of the border of the hint.
- Visible: When set to true, enables showing hints for series points.
Chart item layer

TMS SOFTWARE
TMS IntraWeb HTML5 Controls Pack
DEVELOPERS GUIDE
24
The TTIWHTML5Chart.ItemLayer is a collection of items that are positioned on the chart. An item can
show text or an image. The item can be shown below the chart series or above the chart series.
Further, the position and the size of the item can be set with Top, Left, Height, Width properties.
Note that when Height and Width are zero, the size of the item is calculated automatically to fit the
text set for the item.
Adding/Removing item layer items
Adding or removing an item layer item can be done either programmatically or at design-time.
Double-click the TTIWHTML5Chart.ItemLayer property and the default collection editor will popup,
allowing you to add new or remove existing item layer items.
To add a new or remove an existing item layer item programmatically use the code below.
Adding an item layer item:
var
ili: THTML5ChartItemLayerItem;
begin
ili := TIWHTML5Chart1.ItemLayer.Add;
ili.Caption := 'Sales 2011';
ili.Top := 1;
ili.Height := 50;
ili.Width := 150;
ili.Position := pBack;
ili.Left := (TIWHTML5Chart1.Width - TIWHTML5Chart1.ItemLayer[0].Width)
div 2;
end;

TMS SOFTWARE
TMS IntraWeb HTML5 Controls Pack
DEVELOPERS GUIDE
25
Removing an itemlayer.item:
TIWHTML5Chart1.Itemlayer.Delete(itemindex);
THTML5ChartItemLayerItem properties
- BGColor: Sets start color of the gradient for the item layer item background.
- BGColorTo: Sets end color of the gradient for the item layer item background.
- BGGradientDirection: Sets the gradient direction for the item layer item. The gradient direction can be gdVertical or gdHorizontal.
- BorderColor: Defines the border color for the item layer item.
- Caption: Sets the text for the item layer item.
- Font: Sets the default font that will be used for the item layer item.
- Height: Sets the height for the item layer item.
- ImageUrl: Sets the URL for a picture for the item layer item (when Shape = sImage).
- Left: Sets the left position for the item layer item.
- Name: Sets the name for the item layer item.
- Position: Defines if the item layer item is displayed on top of the chart series (pFront) or below the chart series (pBack).
- Shape: Selects the shapes for the item, possible choices are: rectangle, circle, image or square.
- Tag: Stores an integer value. Tag is an integer property that has no predefined meaning. It can be used for storing an additional integer value, or it can be typecast to any value such as a component reference or a pointer.
- Top: Sets the top position for the item layer item.
- Width: Sets the width for the item layer item.
Chart legend
TMS SOFTWARE
TMS IntraWeb HTML5 Controls Pack
DEVELOPERS GUIDE
26
TTIWHTML5Chart can show a legend for its series in the chart. The names of series as shown in the legend-box, is set via the chart series THTML5ChartSerie.Name property. Together with the series name, a small box is shown in front of the name in the same color as the series.
THTML5Legend properties
- BGColor: Sets start color of the gradient for the legend background.
- BGColorTo: Sets end color of the gradient for the legend background.
- BGGradientDirection: Sets the gradient direction for the legend background. The gradient direction can be gdVertical or gdHorizontal.
- Caption: Sets the header text for the legend.
- Font: Sets the default font that will be used for the legend.
- Left: Sets the left position for the legend (when Position = lpAbsolute).
- LineColor: Sets the color of the border of the legend.
- LineWidth: Sets the width of the border of the legend.
- Opacity: Sets the opacity for the legend area. Opacity is a value between 0 and 255. 0 means fully transparent, 255 means fully opaque.
- Orientation: Sets the orientation of the legend. The orientation can be oVertical or oHorizontal.
- Position: Sets the position of the legend in the chart. The position can be lpLeft, lpRight, lpAbsolute or lpNone: lpLeft: Show the legend top left in the chart. lpRight: Show the legend top right in the chart. lpNone: Do not show the legend. lpAbsolute: Show the legend at position TIWHTML5Chart.Legend.Left, TIWHTML5Chart.Legend.Top.
- Top: Sets the top position for the legend (when Position = lpAbsolute).
Chart script events
It is possible to associate JavaScript code when specific events occur in the chart. This way, custom code can be called from the browser to extend functionality without requiring communication with the server. This saves bandwidth and increases the responsiveness of the web application. The place where the JavaScript code can be specified is all grouped under the class property TTIWHTML5Chart.ScriptEvents. These are simple TStringList instances holding the JavaScript code

TMS SOFTWARE
TMS IntraWeb HTML5 Controls Pack
DEVELOPERS GUIDE
27
that will be executed.
THTML5ChartScriptEvents properties
- AnnotationClick(annotationIndex): Holds JavaScript code executed when an annotation is
clicked. The returned value is an integer with the index of the annotation in the
TIWHTML5Chart.Annotations collection.
- Click: Holds JavaScript code executed when the chart area is clicked.
- DoubleClick: Event occurs when the chart is double-clicked.
- ItemLayerClick(itemLayerIndex): Holds JavaScript code executed when the ItemLayer item is clicked. The returned value is an integer with the index of the Item in the ItemLayer collection.
- LegendClick(serieIndex, itemIndex): Holds JavaScript code executed when the legend is clicked. Returned values are the index of the series within the series collection, and the index of the item within the items collection.
- SerieClick(serieIndex, itemIndex): Holds JavaScript code executed when clicked on a series. Returned values are the index of the series within the series collection, and the index of the item within the items collection.
- SerieDoubleClick(serieIndex, itemIndex): Holds JavaScript code executed when a series is double-clicked. Returned values are the index of the series within the series collection, and the index of the item within the items collection.

TMS SOFTWARE
TMS IntraWeb HTML5 Controls Pack
DEVELOPERS GUIDE
28
Chart X-Axis
Other than the series X-axis values, a common X-axis text can be specified for the chart. If for multiple series X-axis values are set, the common X-axis text will be displayed at the bottom. The settings for this common X-axis text are grouped under TTIWHTML5Chart.XAxis.
THTML5ChartXAxis properties
- Caption: Sets the text for the X-axis.
- Color: Sets the color for the X-axis lines.
- DecimalPrecision: Sets the number of decimals to use for the X-axis automatically generated values. *
- Font: Sets the default font that will be used for the X-axis text.
- LineWidth: Sets the width of the lines drawn for each series point on the X-axis.
- Visible: When set to true, the X-axis caption will be displayed.
* For XY chart types only.

TMS SOFTWARE
TMS IntraWeb HTML5 Controls Pack
DEVELOPERS GUIDE
29
Chart Y-Axis
Other than the series Y-axis values, a common Y-axis text can be specified for the chart. If for multiple series Y-axis values are displayed, the common Y-axis text will be displayed at the left most position. The settings for this common Y-axis text are grouped under TTIWHTML5Chart.YAxis.
THTML5ChartYAxis Properties
- Caption: Sets the text for the Y-axis.
- Color: Sets the color for the Y-axis lines.
- DecimalPrecision: Sets the number of decimals to use for the Y-axis automatically generated values.
- Font: Sets the default font that will be used for the Y-axis.
- LineWidth: Sets the width of the border of the Y-axis.
- Visible: When set to true, the common Y-axis text is displayed.

TMS SOFTWARE
TMS IntraWeb HTML5 Controls Pack
DEVELOPERS GUIDE
30
Chart bands
The bands property offers the opportunity to define alternating colors for the chart background.
THTML5Bands Properties
- Enabled: When true, colour banding is applied.
- PrimaryColor: Sets the colour of odd bands.
- SecundaryColor: Sets the colour of even bands.
Chart methods
procedure AsyncUpdateAllValues();
Sends all series values asynchronously to the browser.
The following example shows how to change all series types for a chart.
for seriesidx := 0 to MaxSeries-1 do
TIWHTML5Chart1.Series[seriesidx].SerieType := stBar;
TIWHTML5Chart1.AsyncUpdateAllValues();
procedure AsyncUpdateChangedValues();
Sends back all series values that were changed between the previous asynchronous update call and the new AsyncUpdateChangedValues() call.
procedure AsyncUpdateSingleValue(SerieIndex, ItemIndex: integer; Value: double);
Sends a single value at ItemIndex position in the values collection of series SerieIndex in the Series collection to the browser.
TIWHTML5Chart1.AsyncUpdateSingleValue(0,2, random(1000));
Please notice that “Async*” methods can only be used from within asynchronous events!
Those asynchronous events may come from any IntraWeb Control (even IWHTML5Chart).
From non-asynchronous events, no specific update calls are required as the chart will be
automatically fully re-rendered.

TMS SOFTWARE
TMS IntraWeb HTML5 Controls Pack
DEVELOPERS GUIDE
31
Example of valid code:
procedure TIWForm4.IWButton5AsyncClick(Sender: TObject;
EventParams: TStringList);
begin
TIWHTML5Chart1.Series[0].Items[5].Value := 5;
TIWHTML5Chart1.AsyncUpdateAllValues;
end;
Chart events
There are two types of events: synchronous and asynchronous events. Synchronous events trigger a
complete page refresh. Asynchronous events on the other hand only transfer specific data to the
server without invoking a full page refresh. It will depend on the event handling code for
asynchronous events how the control will be updated.
- OnAnnotationClick(Sender: TObject; AnnotationIndex: Integer):
Event triggered when an annotation is clicked. The parameter AnnotationIndex returns the index of the annotation in the TTIWHTML5Chart.Annotations collection.
- OnAsyncAnnotationClick: Asynchronous version of the OnAnnotationClick event.
- OnClick(Sender: Tobject): Event triggered when the chart background is clicked.
- OnAsyncClick: Asynchronous version of the OnClick event.
- OnDoubleClick(Sender: TObject): Event triggered when the chart background is double-clicked.
- OnAsyncDoubleClick: Asynchronous version of the OnDoubleClick event.
- OnItemLayerClick(Sender: TObject; ItemLayerIndex: Integer):
Event triggered when an item in the ItemLayer collection is clicked. The ItemLayerIndex parameter returns the index of this item in the ItemLayer collection.
- OnAsyncItemLayerClick: Asynchronous version of the OnItemLayerClick event.
- OnSerieClick(Sender: TObject; SerieIndex, PointIndex: integer):
Event triggered when a data point of a series is clicked. The SerieIndex parameter returns the index of the series in the TTIWHTML5Chart.Series collection and the PointIndex returns the index of the data point in the TTIWHTML5Chart.Series[SerieIndex].Items collection.

TMS SOFTWARE
TMS IntraWeb HTML5 Controls Pack
DEVELOPERS GUIDE
32
- OnAsyncSerieClick: Asynchronous version of the OnSerieClick event.
- OnLegendClick(Sender: TObject; SerieIndex: Integer):
Event triggered when a series name is clicked in the legend. The SerieIndex parameter returns the index of the series in the TTIWHTML5Chart.Series collection.
- OnAsyncLegendClick: Asynchronous version of the OnLegendClick event.
- OnSerieDoubleClick(Sender: TObject; SerieIndex, PointIndex: integer):
Event triggered when a data point of a series is double-clicked. The SerieIndex parameter returns the index of the series in the TTIWHTML5Chart.Series collection and the PointIndex returns the index of the data point in the TTIWHTML5Chart.Series[SerieIndex].Items collection.
- OnAsyncSerieDoubleClick: Asynchronous version of the OnSerieDoubleClick event.

TMS SOFTWARE
TMS IntraWeb HTML5 Controls Pack
DEVELOPERS GUIDE
33
THTML5Chart Sample code
Sample 1
This sample code adds values to all series in the chart and sets a common RangeFrom/RangeTo for all
series based on the minimum and maximum value in all chart series:
var
ChartMin, ChartMax, ChartVal: Double
xidx, yidx: integer;
begin
ChartMin := 100;
ChartMax := 0;
for yidx := 0 to MaxSeries-1 do
begin
for xidx := 0 to 11 do
begin
chartval := Random(100);
if chartval < ChartMin then
ChartMin := chartval;
if chartval > ChartMax then
ChartMax := chartval;
TIWHTML5Chart1.Series[yidx].Items[xidx].Value := chartval;
end;
end;
for yidx := 0 to MaxSeries-1 do
begin
TIWHTML5Chart1.Series[yidx].RangeFrom := ChartMin;
TIWHTML5Chart1.Series[yidx].RangeTo := ChartMax;
end;
TIWHTML5Chart1.AsyncUpdateAllValues();
end;
Sample 2
In this code snippet, annotations are created that contain the series values:
var
ca: THTML5ChartAnnotation;
xidx, yidx: integer;

TMS SOFTWARE
TMS IntraWeb HTML5 Controls Pack
DEVELOPERS GUIDE
34
begin
TIWHTML5Chart1.Annotations.Clear;
for yidx := 0 to MaxSeries-1 do
begin
for xidx := 0 to 11 do
begin
ca := TIWHTML5Chart1.Annotations.Add;
ca.SerieIndex := yidx;
ca.PointIndex := xidx;
ca.Caption := FloatToStr(TIWHTML5Chart1.Series[ca.SerieIndex
].Items[ca.PointIndex].Value);
ca.BGColor := clWebOldLace;
ca.BGColorTo := TIWHTML5Chart1.Series[yidx].BGColor;
ca.BorderColor := clWebBLACK;
ca.Font.Color := clWebBLACK;
end;
end;
end;
Sample 3
Configuring the chart to display a Y-Axis for each series and change its color and font color:
var
yidx: integer;
begin
for yidx := 0 to AtlSeries-1 do
begin
TIWHTML5Chart1.Series[Yidx].YAxis.Visible := True;
TIWHTML5Chart1.Series[Yidx].Yaxis.Color :=
TIWHTML5Chart1.Series[Yidx].BGColor;
TIWHTML5Chart1.Series[Yidx].YAxis.Font.Color :=
TIWHTML5Chart1.Series[Yidx].BGColor;
IWButton14.Caption := 'Multi Y-Axis';
end;
TIWHTML5Chart1.AsyncUpdateAllValues();
end;
TMS SOFTWARE
TMS IntraWeb HTML5 Controls Pack
DEVELOPERS GUIDE
35
Sample 4
Setting different chart types for different series:
const
Charts: array[0..4] of TTIWSerieType =(stArea,stBar,stLine,stStackedArea,stStackedBar);
var
yidx: integer;
begin
for yidx := 0 to 4 do
TIWHTML5Chart1.Series[yidx].SerieType := charts[yidx];
end;

TMS SOFTWARE
TMS IntraWeb HTML5 Controls Pack
DEVELOPERS GUIDE
36
THTML5Chart Advanced techniques
When designing a chart without connection between the values of the different series, each series
will use a maximum of the drawing area. This can be confusing, because values of different weights
can stand one next to another. As shown in the next example, one has the possibility to show
multiple Y-Axis and (colored) helper lines to improve readability.
An example on how to do this in program code can be found in the samples paragraph.

TMS SOFTWARE
TMS IntraWeb HTML5 Controls Pack
DEVELOPERS GUIDE
37
Each series can have their specific chart type.
An example on how to do this in program code can be found in the samples paragraph.

TMS SOFTWARE
TMS IntraWeb HTML5 Controls Pack
DEVELOPERS GUIDE
38
THTML5Chart demos
TTIWHTML5Chart configuration demo
The TMSIWHTML5ChartConfigDemo program shows the various configuration possibilities of the
TTIWHTML5Chart component. It allows to interactively set various properties and the changes will be
immediately reflected via asynchronous updates in the displayed chart.
Main screen:

TMS SOFTWARE
TMS IntraWeb HTML5 Controls Pack
DEVELOPERS GUIDE
39
Main screen after some property value changes:
TTIWHTML5Chart drill down demo
The TMSIWHTML5ChartDemo program shows a typical single level drill down scenario with
TTIWHTML5Chart.
The chart is shown in 3D bar series style. Other series type can be selected in the IWComboBox in
this demo.
When a column of the chart is clicked, via drill down, a detailed chart is shown, in this case the sales
distribution among brands for the selected month. Clicking on a column asynchronously adds an
annotation to a series point with some extra information on the bar represented value. Clicking

TMS SOFTWARE
TMS IntraWeb HTML5 Controls Pack
DEVELOPERS GUIDE
40
outside a bar will move back to the main chart.
Main screen

TMS SOFTWARE
TMS IntraWeb HTML5 Controls Pack
DEVELOPERS GUIDE
41
Drill down chart after a column was clicked. A click on one bar in this chart displays an annotation on
the selected series value.

TMS SOFTWARE
TMS IntraWeb HTML5 Controls Pack
DEVELOPERS GUIDE
42
TTIWHTML5PieChart
TTIWHTML5PieChart description
The TMS TTIWHTML5PieChart component is designed to render pie charts in a browser using
HTML5/CSS3/JavaScript. The component can display a full circle or a partial circle chart.
TTIWHTML5PieChart features
- Display one or more exploded segments.
- Display pie chart as a full circle or a partial circle.
- Automatic display of a legend in both vertical and horizontal mode.
- A shadow effect can be optionally applied.
- Apply different animation effects.
- Display segment values as hint on mouse-over.
- Asynchronous events to handle clicks on segments.
- Full asynchronous update support.

TMS SOFTWARE
TMS IntraWeb HTML5 Controls Pack
DEVELOPERS GUIDE
43
TTIWHTML5PieChart architecture
1) Optional caption text
2) Automatically generated and configurable legend
3) Exploded pie segment
4) Default pie segment
5) Optional label
TTIWHTML5PieChart use
Getting started
From the Delphi repository select a new IntraWeb application template.
This is done by choosing: File -> New ->Other-> VCL for the Web Application Wizard.
From the component palette, select TTIWHTML5PieChart and drop it on a form. This shows an empty
chart. Add segments via the collection editor shown upon clicking the property
TTIWHTML5PieChart.Segments.

TMS SOFTWARE
TMS IntraWeb HTML5 Controls Pack
DEVELOPERS GUIDE
44
HTML5 Doctype
To correctly enable the use of HTML5 code in a browser that supports this technology, it is required
to include the HTML5 Doctype: “<!DOCTYPE html>”.
In IntraWeb 11.0.47 or later this can be achieved by setting the DocType property of the
ServerController form.
Example:
procedure TIWServerController.IWServerControllerBaseCreate(Sender:
TObject);
begin
DocType := '<!DOCTYPE HTML>';
end;
In earlier version of IntraWeb this can be achieved by setting the PageContext.DocType property in
your Form’s Render procedure.
Example:
procedure TIWForm1.IWAppFormRender(Sender: TObject);
begin
PageContext.DocType := '<!DOCTYPE html>';
end;
When using a TIWTemplateProcessorHTML control as the Form’s LayoutMgr, the Doctype definition
must be placed on the first line in the template html file.
Example:
<!DOCTYPE html>
<HTML>
<HEAD>
<TITLE> My Template </TITLE>
</HEAD>
<BODY>
{%TIWHTML5Chart1%}
</BODY>
</HTML>
Please note that including the HTML5 Doctype on a form can influence the appearance and
functionality of other controls on the same form which are not compatible or not fully compatible
with this Doctype!

TMS SOFTWARE
TMS IntraWeb HTML5 Controls Pack
DEVELOPERS GUIDE
45
General PieChart settings
TIWHTML5PieChart properties
- AnimationType: Sets the type of animation that is used when the pie chart is displayed.
o atNone: No animation is used
o atEndAngle: The EndAngle is animated
o atRadius: The Radius is animated
- BGColor: Sets start color of the gradient of the control background.
- BGColorTo: Sets end color of the gradient of the control background.
- BGGradientDirection: Sets the gradient direction of the controls background. The gradient direction can be gdVertical or gdHorizontal.
- Caption: Sets the caption text for the control.
- ExplodedOffset: Sets the offset of a Segment when the State property is set to ssExploded.
- HTML5Warning: Sets the message displayed when the browser that is used to render the control does not support HTML5.
- PieCenterX: Sets the left position of the pie chart center coordinate. When set to -1, the left position is automatically set to the center of the control width.
- PieCenterY: Sets the top position of the pie chart center coordinate. When set to -1, the top position is automatically set to the middle of the control height.
- PieEndAngle: Sets the ending angle of the pie chart circle.
- PieRadius: Sets the radius of the pie chart circle.
- PieStartAngle: Sets the starting angle of the pie chart circle.
- SelectedIndex: Sets the index of the currently selected segment.
- ShowShadow: Sets if a shadow effect is applied to the pie chart.
Hints for segments
It is possible to show the values of segments when the mouse hovers over them. This capability is
enabled by setting TTIWHTML5PieChart.Hint.Visible to true. Further control over the appearance of
these hints is found under TTIWHTML5PieChart.Hint.

TMS SOFTWARE
TMS IntraWeb HTML5 Controls Pack
DEVELOPERS GUIDE
46
THTML5Hint properties
- BGColor: Sets start color of the gradient for the hint background.
- BGColorTo: Sets end color of the gradient for the hint background.
- BGGradientDirection: Sets the gradient direction for the hint background. The gradient direction can be gdVertical or gdHorizontal.
- Caption: Sets the text for the hint.
- Font: Sets the default font that will be used for the hint.
- LineColor: Sets the color of the border of the hint.
- LineWidth: Sets the width of the border of the hint.
- Visible: Sets if a hint is displayed when the mouse is hovering a segment.
PieChart legend
TTIWHTML5PieChart can show a legend for its segments in the chart. The text of a segment as shown in the legend-box, is set via the segment THTML5PieChartSegment.Text property. Together with the segment text, a small box is shown in front of the name in the same color as the segment.
THTML5Legend properties
- BGColor: Sets start color of the gradient for the legend background.
- BGColorTo: Sets end color of the gradient for the legend background.
- BGGradientDirection: Sets the gradient direction for the legend background. The gradient direction can be gdVertical or gdHorizontal.
- Caption: Sets the header text for the legend.
- Font: Sets the default font that will be used for the legend.
- Left: Sets the left position for the legend (when Position = lpAbsolute).
- LineColor: Sets the color of the border of the legend.
- LineWidth: Sets the width of the border of the legend.
- Opacity: Sets the opacity for the legend area. Opacity is a value between 0 and 255. 0 means fully transparent, 255 means fully opaque.

TMS SOFTWARE
TMS IntraWeb HTML5 Controls Pack
DEVELOPERS GUIDE
47
- Orientation: Sets the orientation of the legend. The orientation can be oVertical or oHorizontal.
- Position: Sets the position of the legend in the chart. The position can be lpLeft, lpRight, lpAbsolute or lpNone: lpLeft: Show the legend top left in the chart. lpRight: Show the legend top right in the chart. lpNone: Do not show the legend. lpAbsolute: Show the legend at position TIWHTML5PieChart.Legend.Left, TIWHTML5PieChart.Legend.Top.
- Top: Sets the top position for the legend (when Position = lpAbsolute).
PieChart segments
Adding/Removing segment values
First open the segments collection editor by clicking the TTIWHTML5PieChart.Segments property in
the Object Inspector. From here, segments can be added or removed.
The equivalent in code is:
Adding a series:
var
cs: THTML5ChartSegment:
begin
cs := TIWHTML5PieChart1.Segments.Add;

TMS SOFTWARE
TMS IntraWeb HTML5 Controls Pack
DEVELOPERS GUIDE
48
cs.Value := 10;
end;
Removing a series:
TIWHTML5PieChart1.Segments.Delete(segmentindex);
Customizing segment appearance
The appearance of segments can be further controlled via its properties. The following sample sets
gradient start and end color, the line color for the first segment of a pie chart. It also makes the
segment label visible.
begin
TIWHTML5PieChart1.Segments[0].BGColor := clWebRed;
TIWHTML5PieChart1.Segments[0].BGColorTo := clWebYellow;
TIWHTML5PieChart1.Segments[0].LineColor := clWebBlack;
TIWHTML5PieChart1.Segments[0].ShowLabel := True;
end;
PieChart segment properties
The segment configuration is done via the THTML5PieChartSegment class for instances in the
TTIWHTML5PieChart.Segments collection.
THTML5PieChartSegment properties
- BGColor: Sets start color of the gradient for the series background.
- BGColorTo: Sets end color of the gradient for the series background.
- HintText: Sets the text that is displayed in the hint of the segment.
- LabelFont: Sets the label font.
- LegendText: Sets the text that is displayed in the legend item relative to the segment.
- LineColor: Sets the color of the lines in line series types or the border color for bar or area charts.
- LineWidth: Sets the width of the line in line series or the border width for bar or area charts.
TMS SOFTWARE
TMS IntraWeb HTML5 Controls Pack
DEVELOPERS GUIDE
49
- Name: Sets the name for the chart series.
- Opacity: Sets the opacity for the segment. Opacity is a value between 0 and 255. 0 means fully transparent, 255 means fully opaque.
- ShowLabel: When set to true, shows a text label next to the segment.
- Tag: Stores an integer value. Tag is an integer property that has no predefined meaning. It can be used for storing an additional integer value, or it can be typecast to any value such as a component reference or a pointer.
- Text: Sets the text that is displayed in the Label of the segment.
- Value: The value of the segment. This value defines the size of the segment relative to the other segments.
PieChart methods
procedure AsyncUpdateAllValues(Animated: boolean);
Sends all property values asynchronously to the browser. The Animated parameter sets if the updated control is displayed using an animation effect as configured with the AnimationType property.
The following example shows how to change the value of a segment:
procedure TIWForm4.IWButton5AsyncClick(Sender: TObject;
EventParams: TStringList);
begin
TIWHTML5PieChart1.Segments[0].Value := 20;
TIWHTML5PieChart1.AsyncUpdateAllValues(false);
end;
PieChart script events
It is possible to associate JavaScript code when specific events occur in the control. This way, custom code can be called from the browser to extend functionality without requiring communication with the server. This saves bandwidth and increases the responsiveness of the web application. The place where the JavaScript code can be specified is all grouped under the class property TTIWHTML5PieChart.ScriptEvents. These are simple TStringList instances holding the JavaScript code that will be executed.
THTML5PieChartScriptEvents properties

TMS SOFTWARE
TMS IntraWeb HTML5 Controls Pack
DEVELOPERS GUIDE
50
- LegendClick(index): Holds JavaScript code executed when the legend is clicked. Returned value is the index of the segment within the segments collection.
- SegmentClick(index): Holds JavaScript code executed when a segment is clicked. Returned value is the index of the segment within the segments collection.
PieChart events
There are two types of events: synchronous and asynchronous events. Synchronous events trigger a
complete page refresh. Asynchronous events on the other hand only transfer specific data to the
server without invoking a full page refresh. It will depend on the event handling code for
asynchronous events how the control will be updated.
- OnSegmentClick(Sender: TObject; Index: integer):
Event triggered when a segment is clicked. The Index parameter returns the index of the segment in the TTIWHTML5PieChart.Segments collection.
- OnAsyncSegmentClick: Asynchronous version of the OnSegmentClick event.
- OnLegendClick(Sender: TObject; Index: Integer):
Event triggered when a segment name is clicked in the legend. The Index parameter returns the index of the segment in the TTIWHTML5PieChart.Segments collection.
- OnAsyncLegendClick: Asynchronous version of the OnLegendClick event.
Example:
TMS SOFTWARE
TMS IntraWeb HTML5 Controls Pack
DEVELOPERS GUIDE
51
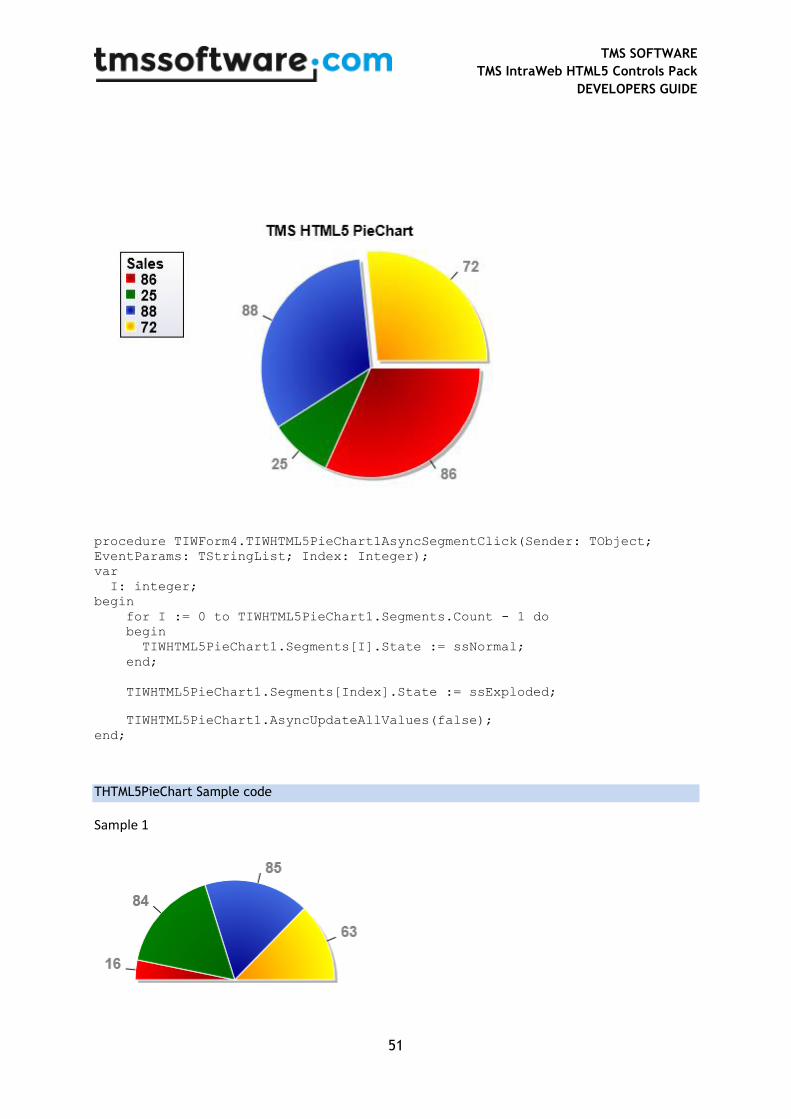
procedure TIWForm4.TIWHTML5PieChart1AsyncSegmentClick(Sender: TObject;
EventParams: TStringList; Index: Integer);
var
I: integer;
begin
for I := 0 to TIWHTML5PieChart1.Segments.Count - 1 do
begin
TIWHTML5PieChart1.Segments[I].State := ssNormal;
end;
TIWHTML5PieChart1.Segments[Index].State := ssExploded;
TIWHTML5PieChart1.AsyncUpdateAllValues(false);
end;
THTML5PieChart Sample code
Sample 1

TMS SOFTWARE
TMS IntraWeb HTML5 Controls Pack
DEVELOPERS GUIDE
52
This sample code demonstrates how to create a half-circle pie chart:
TIWHTML5PieChart1.PieStartAngle := 180;
TIWHTML5PieChart1.PieEndAngle := 360;
TTIWHTML5PieChart demos
TMSIWHTML5PieChartConfigDemo
The TMSIWHTML5PieChartConfigDemo program shows the various configuration possibilities of the
TTIWHTML5PieChart component. It allows to interactively set various properties and the changes will
be immediately reflected via asynchronous updates.
Main screen:
Main screen after some property changes:
TMS SOFTWARE
TMS IntraWeb HTML5 Controls Pack
DEVELOPERS GUIDE
53
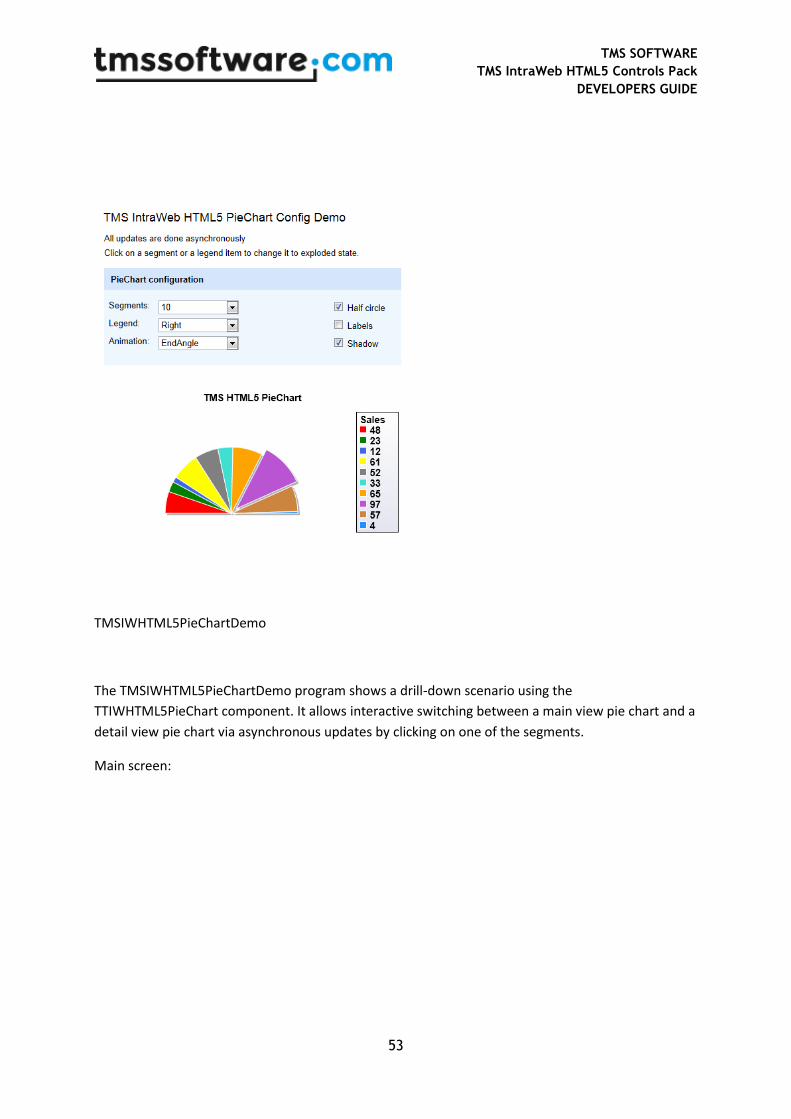
TMSIWHTML5PieChartDemo
The TMSIWHTML5PieChartDemo program shows a drill-down scenario using the
TTIWHTML5PieChart component. It allows interactive switching between a main view pie chart and a
detail view pie chart via asynchronous updates by clicking on one of the segments.
Main screen:

TMS SOFTWARE
TMS IntraWeb HTML5 Controls Pack
DEVELOPERS GUIDE
54
Detail screen:

TMS SOFTWARE
TMS IntraWeb HTML5 Controls Pack
DEVELOPERS GUIDE
55
TTIWHTML5Gauge
TTIWHTML5Gauge description
The TMS TTIWHTML5Gauge component is designed to render various gauge types in a browser using
HTML5/CSS3/JavaScript. The component currently offers following gauge types: circular, linear
horizontal and linear vertical. Multiple Sections and SetPoints can also be displayed.
The gauge can be used as a read-only control but also features optional mouse interaction to change
the needle position.
TTIWHTML5Gauge features
- Different gauge types: circular, linear horizontal and linear vertical
- Triangle, arrow, line, double line or image needle type can be set for linear gauge types
- Triangle, square, circle or line SetPoints types can be set for all gauge types
- Multiple configurable sections can be added for all gauge types
- Minimum and maximum with divisions and subdivisions
- Informative DialText and formatted value display
- Asynchronous event to handle clicks on the gauge
- Full asynchronous update support

TMS SOFTWARE
TMS IntraWeb HTML5 Controls Pack
DEVELOPERS GUIDE
56
TTIWHTML5Gauge architecture
1) Needle: The needle can be fully customized and points to the current value.
2) DialText (gtCircular only): The DialText can be useful to provide information on the purpose of
the gauge. Some samples: Speed, C°, KPH, MPH …
3) Value (gtCircular only): The value is displayed below the DialText. The value can optionally be
formatted or hidden.
4) The minimum and maximum values can be changed and the property DivisionCount allows
setting the number of divisions from minimum to maximum.
5) The property DivisionCount also specifies the tick marks. The property SubDivisionCount is the
number of tick marks between two divisions.
6) Sections: the Sections collection is used to mark special areas where the value in that range has a
different meaning than the value outside that range by means of a special background color.
7) SetPoints: the SetPoints collection can be used to indicate special values on the gauge.

TMS SOFTWARE
TMS IntraWeb HTML5 Controls Pack
DEVELOPERS GUIDE
57
TTIWHTML5Gauge use
Getting started
From the Delphi repository select a new IntraWeb application template.
This is done by choosing: File -> New ->Other-> VCL for the Web Application Wizard.
From the component palette, select TTIWHTML5Gauge and drop it on a form. Set the desired Value
and GaugeType.
HTML5 Doctype
To correctly enable the use of HTML5 code in a browser that supports this technology, it is required
to include the HTML5 Doctype: “<!DOCTYPE html>”.
In IntraWeb 11.0.47 or later this can be achieved by setting the DocType property of the
ServerController form.
Example:
procedure TIWServerController.IWServerControllerBaseCreate(Sender:
TObject);
begin
DocType := '<!DOCTYPE HTML>';
end;
In earlier version of IntraWeb this can be achieved by setting the PageContext.DocType property in
your Form’s Render procedure.
Example:
procedure TIWForm1.IWAppFormRender(Sender: TObject);
begin
PageContext.DocType := '<!DOCTYPE html>';
end;
When using a TIWTemplateProcessorHTML control as the Form’s LayoutMgr, the Doctype definition
must be placed on the first line in the template html file.
Example:

TMS SOFTWARE
TMS IntraWeb HTML5 Controls Pack
DEVELOPERS GUIDE
58
<!DOCTYPE html>
<HTML>
<HEAD>
<TITLE> My Template </TITLE>
</HEAD>
<BODY>
{%TIWHTML5Chart1%}
</BODY>
</HTML>
Please note that including the HTML5 Doctype on a form can influence the appearance and
functionality of other controls on the same form which are not compatible or not fully compatible
with this Doctype!

TMS SOFTWARE
TMS IntraWeb HTML5 Controls Pack
DEVELOPERS GUIDE
59
General gauge settings
TIWHTML5Gauge properties
- BGColor: Sets start color of the gradient for the gauge background.
- BGColorTo: Sets end color of the gradient for the gauge background. Setting the BGColorTo value to clNone means a solid color will be used as background color.
- BGGradientDirection: Sets the gradient direction for the gauge background. The gradient direction can be gdVertical or gdHorizontal.
- DecimalPrecision: Sets the number of decimals used for the Division text labels.
- DialText: Sets the text for the gauge, displayed when the gauge type is gtCircular.
- DivisionColor: Sets the color of the division tick marks.
- DivisionCount: Sets the number of divisions displayed between the minimum and maximumvalue.
- DivisionWidth: Sets the width of the division tick marks.
- EndAngle: (gtCircular only) Sets the ending angle of the gauge circle.
- GaugeType: Sets the type of gauge that is displayed. gtCircular:
gtLinearHorizontal:

TMS SOFTWARE
TMS IntraWeb HTML5 Controls Pack
DEVELOPERS GUIDE
60
gtLinearVertical:
- HTML5Warning: Sets the message displayed when the browser that is used to render the control does not support HTML5.
- MaximumValue: Sets the maximum value displayed on the gauge.
- MinimumValue: Sets the minimum value displayed on the gauge.
- Padding: (gtLinearHorizontal & gtLinearVertical only) Sets the padding size between the border and the first/last division.
- ShowDialText: (gtCircular only) Sets if the DialText is displayed or not.
- ShowValue: (gtCircular only) Sets if the Value is displayed or not.
- StartAngle: (gtCircular only) Sets the starting angle of the gauge circle.
- SubDivisionColor: Sets the color of the subdivision tick marks.
- SubDivisionCount: Sets the number of subdivision tick marks between each division tick mark.
- SubDivisionWidth: Sets the width of the subdivision tick marks.
- Value: Sets the value, i.e. position where the needle is displayed. For gtCircular gauges the value can also be displayed as text on the gauge.
- ValueFormat: (gtCircular only) Sets the formatting of the value displayed below the DialText

TMS SOFTWARE
TMS IntraWeb HTML5 Controls Pack
DEVELOPERS GUIDE
61
Gauge Arc
The Arc properties are used to configure the arc on which the Gauge is displayed. For the circular gauge type the arc is displayed between the StartAngle and EndAngle, for the linear
gauge types the arc always covers the full width or height of the control.
Gauge Arc properties
THTML5GaugeArc properties
- BGColor: Sets the background color of the arc.
- EndAngle: (gtCircular only) Sets the end angle in degrees of the Arc.
- StartAngle: (gtCircular only) Sets the start angle in degrees of the Arc.
- Width: Sets the width of the spacing above the tick marks that is available for Sections and
SetPoints.
Gauge Needle
The needle can be fully customized and points to the current value.
Gauge Needle properties
THTML5GaugeNeedle properties
- BGColor: Sets the background color of the Needle.
- ImageURL: (gtLinearHorizontal & gtLinearVertical only) Sets the image used to display the
Needle, if Shape is set to nsImage.
- InnerCenterColor: (gtCircular only) Sets the background color of the Needle’s inner circle.
- InnerCenterColorTo: (gtCircular only) Sets the gradient background color of the Needle’s
inner circle.
- InnerCenterOpacity: (gtCircular only) Sets the opacity of the Needle’s inner circle.
- OuterCenterColor: (gtCircular only) Sets the background color of the Needle’s outer circle.

TMS SOFTWARE
TMS IntraWeb HTML5 Controls Pack
DEVELOPERS GUIDE
62
- OuterCenterColorTo: (gtCircular only) Sets the gradient background color of the Needle’s
outer circle.
- OuterCenterOpacity: (gtCircular only) Sets the opacity of the Needle’s outer circle.
- Shape: (gtLinearHorizontal & gtLinearVertical only) Sets the shape of the needle: nsArrow,
nsDoubleLine, nsImage, nsLine, nsTriangle.
- ShineColor: (gtCircular only) Sets the secondary “shine” color of the Needle.
Gauge Sections
Sections are displayed as a colored band above the division tick marks. Each section has
customizable StartValue and EndValue, the section is displayed between these values.
Adding/Removing Sections
First open the Sections collection editor by clicking the TTIWHTML5Gauge.Sections property in the
Object Inspector. From here, Sections can be added or removed.

TMS SOFTWARE
TMS IntraWeb HTML5 Controls Pack
DEVELOPERS GUIDE
63
The equivalent in code is:
Adding a section:
var
gs: THTML5GaugeSection;
begin
gs := TIWHTML5Gauge1.Sections.Add;
gs.StartValue := 75;
gs.EndValue := 100;
gs.BGColor := clWebRed;
Removing a section:
TIWHTML5Gauge1.Sections.Delete(sectionindex);
Gauge Section properties
THTML5GaugeSection properties
- BGColor: Sets background color of the Section.
- EndValue: Sets the end value (as absolute number between minium & maximum) of the
Section.
- StartValue: Sets the start value (as absolute number between minium & maximum) of the
Section.
- Visible: Defines whether the Section is displayed or not.
Gauge SetPoints
SetPoints are used to indicate special values and are displayed above the division tick marks. Each
SetPoint has a customizable Value which indicates where the SetPoint will be displayed.

TMS SOFTWARE
TMS IntraWeb HTML5 Controls Pack
DEVELOPERS GUIDE
64
Adding/Removing SetPoints
First open the SetPoints collection editor by clicking the TTIWHTML5Gauge.SetPoints property in the
Object Inspector. From here, SetPoints can be added or removed.
The equivalent in code is:
Adding a SetPoint:
var
sp: THTML5GaugeSetPoint;
begin
sp := TIWHTML5Gauge1.SetPoints.Add;
sp.Value := 50;
sp.BGColor := clWebBlack;
sp.Shape := psTriangle;
Removing a section:

TMS SOFTWARE
TMS IntraWeb HTML5 Controls Pack
DEVELOPERS GUIDE
65
TIWHTML5Gauge1.SetPoints.Delete(setpointindex);
Gauge SetPoints properties
THTML5GaugeSetPoints properties
- BGColor: Sets the background color of the SetPoint.
- Shape: Sets the shape of the SetPoint: psCircle, psLine, psSquare, psTriangle.
- Value: Sets the value of the SetPoint.
- Visible: Defines whether the SetPoint is displayed or not.
Chart methods
procedure AsyncUpdateAllValues();
Sends back all property values asynchronously to the browser. The gauge is completely re-rendered asynchronously.
Please notice that the AsyncUpdateAllValues method can only be used from within asynchronous
events!
Those asynchronous events may come from any IntraWeb Control (even IWHTML5Gauge).
From non-asynchronous events, no specific update calls are required as the chart will be
automatically fully re-rendered.
Example:
procedure TIWForm4.IWButton5AsyncClick(Sender: TObject;
EventParams: TStringList);
begin
TIWHTML5Gauge1.Value := 10;
TIWHTML5Gauge1.AsyncUpdateAllValues;
end;
Gauge script events
It is possible to associate JavaScript code when a click event occurs in the gauge. This way, custom code can be called from the browser to extend functionality without requiring communication with

TMS SOFTWARE
TMS IntraWeb HTML5 Controls Pack
DEVELOPERS GUIDE
66
the server. This saves bandwidth and increases the responsiveness of the web application. The place where the JavaScript code can be specified is all grouped under the class property TTIWHTML5Chart.ScriptEvents. These are simple TStringList instances holding the JavaScript code that will be executed.
THTML5ChartScriptEvents properties
- Click(value): Holds JavaScript code executed when the gauge is clicked. The returned value
contains the corresponding Value of the position where the click event occurred.
Gauge events
There are two types of events: synchronous and asynchronous events. Synchronous events trigger a
complete page refresh. Asynchronous events on the other hand only transfer specific data to the
server without invoking a full page refresh. It will depend on the event handling code for
asynchronous events how the control will be updated.
- OnClick(Value: Double): Event triggered when the gauge is clicked. The Value parameter
contains the corresponding Value of the position where the click event occurred.
- OnAsyncClick: Asynchronous version of the OnClick event.
Example:
procedure TIWForm4.TIWHTML5Gauge1AsyncClick(Sender: TObject;
EventParams: TStringList; Value: Double);
begin
TIWHTML5Gauge1.Value := Value;
TIWHTML5Gauge1.AsyncUpdateAllValues;
end;

TMS SOFTWARE
TMS IntraWeb HTML5 Controls Pack
DEVELOPERS GUIDE
67
THTML5Gauge Sample code
Sample 1
This sample code demonstrates how to create a half-circle gauge:
with TIWHTML5Gauge1 do
begin
MaximumValue := 100;
MinimumValue := 0;
StartAngle := 180;
EndAngle := 360;
Arc.StartAngle := 190;
Arc.EndAngle := 350;
DivisionCount := 5;
ShowDialText := false;
ShowValue := false;
end;
TTIWHTML5Gauge demo
The TMSIWHTML5GaugeDemo program shows the various configuration possibilities of the
TTIWHTML5Gauge component. It allows to interactively set various properties and the changes will
be immediately reflected via asynchronous updates in the displayed gauges.
Main screen:

TMS SOFTWARE
TMS IntraWeb HTML5 Controls Pack
DEVELOPERS GUIDE
68
Main screen after some property value changes:
TMS SOFTWARE
TMS IntraWeb HTML5 Controls Pack
DEVELOPERS GUIDE
69
TTIWHTML5LocalStorage
TTIWHTML5LocalStorage description
The TMS TTIWHTML5LocalStorage component is designed to store client-side data in a browser using
HTML5/CSS3/JavaScript. This is a non-visual component.
TTIWHTML5LocalStorage features
- Access the browser’s local storage data from an IntraWeb application.
- Full asynchronous read, write, update and remove support.
TTIWHTML5LocalStorage use
Getting started
From the Delphi repository select a new IntraWeb application template.
This is done by choosing: File -> New ->Other-> VCL for the Web Application Wizard.
From the component palette, select TTIWHTML5LocalStorage and drop it on a form.
HTML5 Doctype
To correctly enable the use of HTML5 code in a browser that supports this technology, it is required
to include the HTML5 Doctype: “<!DOCTYPE html>”.
In IntraWeb 11.0.47 or later this can be achieved by setting the DocType property of the
ServerController form.
Example:
procedure TIWServerController.IWServerControllerBaseCreate(Sender:
TObject);
begin
DocType := '<!DOCTYPE HTML>';
end;

TMS SOFTWARE
TMS IntraWeb HTML5 Controls Pack
DEVELOPERS GUIDE
70
In earlier version of IntraWeb this can be achieved by setting the PageContext.DocType property in
your Form’s Render procedure.
Example:
procedure TIWForm1.IWAppFormRender(Sender: TObject);
begin
PageContext.DocType := '<!DOCTYPE html>';
end;
When using a TIWTemplateProcessorHTML control as the Form’s LayoutMgr, the Doctype definition
must be placed on the first line in the template html file.
Example:
<!DOCTYPE html>
<HTML>
<HEAD>
<TITLE> My Template </TITLE>
</HEAD>
<BODY>
{%TIWHTML5Chart1%}
</BODY>
</HTML>
Please note that including the HTML5 Doctype on a form can influence the appearance and
functionality of other controls on the same form which are not compatible or not fully compatible
with this Doctype!
TMS SOFTWARE
TMS IntraWeb HTML5 Controls Pack
DEVELOPERS GUIDE
71
General LocalStorage settings
TIWHTML5LocalStorage properties
- HTML5Warning: Sets the message displayed when the browser that is used to render the control does not support HTML5 local storage.
LocalStorage methods
procedure ClearItems();
Removes all items that are currently stored in the browser’s local storage.
procedure GetItem(Name: string);
Retrieves the item from local storage for which the name is equal to the Name parameter value. Once the item has been retrieved, the OnAsyncGetItem event gets fired.
procedure GetItems(Names: TStringList);
Retrieves the items from local storage for which the name is equal to one of the string values in the Names parameter. Once the items have been retrieved, the OnAsyncGetItems event gets fired.
procedure GetAllItems();
Retrieves all items that are currently stored in the browser’s local storage. Once all items have been retrieved, the OnAsyncGetAllItems event gets fired.
procedure RemoveItem(Name: string);
Removes the item from local storage for which the name is equal to the Name parameter value.
procedure SetItem(Name, Value: string);
Updates the value of the item in local storage with the Value parameter value for which the name is equal to the Name parameter value. If no corresponding item is found in local storage, a new item is automatically inserted using the Name and Value parameter values.
Note that since all data is stored client-side, it will only be available on a per browser basis. Data stored in one browser can’t be accessed in another browser. The data is also domain dependent, which means data that is saved by a web application located on a certain domain will not be available for a web application on another domain.

TMS SOFTWARE
TMS IntraWeb HTML5 Controls Pack
DEVELOPERS GUIDE
72
LocalStorage events
- OnAsyncGetItem(Sender: TObject; EventParams: TStringList, Name, Value: string):
Asynchronously triggered event after the GetItem procedure has been called. Returns the Name and Value of the requested item.
- OnAsyncGetItems(Sender: TObject; EventParams, Items: TStringList):
Asynchronously triggered event after the GetItems procedure has been called. Returns a TStringList containing the name-value pairs of all requested items.
- OnAsyncGetAllItems(Sender: TObject; EventParams, Items: TStringList):
Asynchronously triggered event after the GetAllItems procedure has been called. Returns a TStringList containing the name-value pairs of all items currently stored in local storage.
- OnAsyncHTML5Error(Sender: TObject; EventParams: TStringList, ErrorMessage: string):
Asynchronously triggered event if a JavaScript error occurs while accessing local storage. Returns the error message. For example, an error can be raised when the local storage functionality has been disabled in the browser preferences or when the preserved space for local storage data has been exceeded.
TTIWHTML5LocalStorage sample code
Sample 1
This sample code demonstrates how to save and/or update items in local storage:
TIWHTML5LocalStorage1.SetItem('Name', editName.Text);
TIWHTML5LocalStorage1.SetItem('Street', editStreet.Text);
TIWHTML5LocalStorage1.SetItem('City', editCity.Text);
TIWHTML5LocalStorage1.SetItem('Zip', editZip.Text);
Sample 2
This sample code demonstrates how to load multiple items from local storage:
1. Add the name of all required items to a TStringList which is passed to GetItems as a
parameter.

TMS SOFTWARE
TMS IntraWeb HTML5 Controls Pack
DEVELOPERS GUIDE
73
procedure LoadItems;
var
items: TStringList;
begin
items := TStringList.Create;
try
items.Add('Name');
items.Add('Street');
items.Add('City');
items.Add('Zip');
TIWHTML5LocalStorage1.GetItems(items);
finally
items.Free;
end;
end;
2. Assign the OnAsyncGetItems event and use the Items parameter to retrieve the values of the
requested items.
procedure TIWHTML5LocalStorage1AsyncGetItems(Sender: TObject;
EventParams, Items: TStringList);
var
I: Integer;
begin
for I := 0 to Items.Count - 1 do
begin
if Items.Names[I] = 'Name' then
editName.Text := Items.ValueFromIndex[I];
if Items.Names[I] = 'Street' then
editStreet.Text := Items.ValueFromIndex[I];
if Items.Names[I] = 'City' then
editCity.Text := Items.ValueFromIndex[I];
if Items.Names[I] = 'Zip' then
editZip.Text := Items.ValueFromIndex[I];
end;
end;
TTIWHTML5LocalStorage demos
TMSIWHTML5LocalStorageDemo
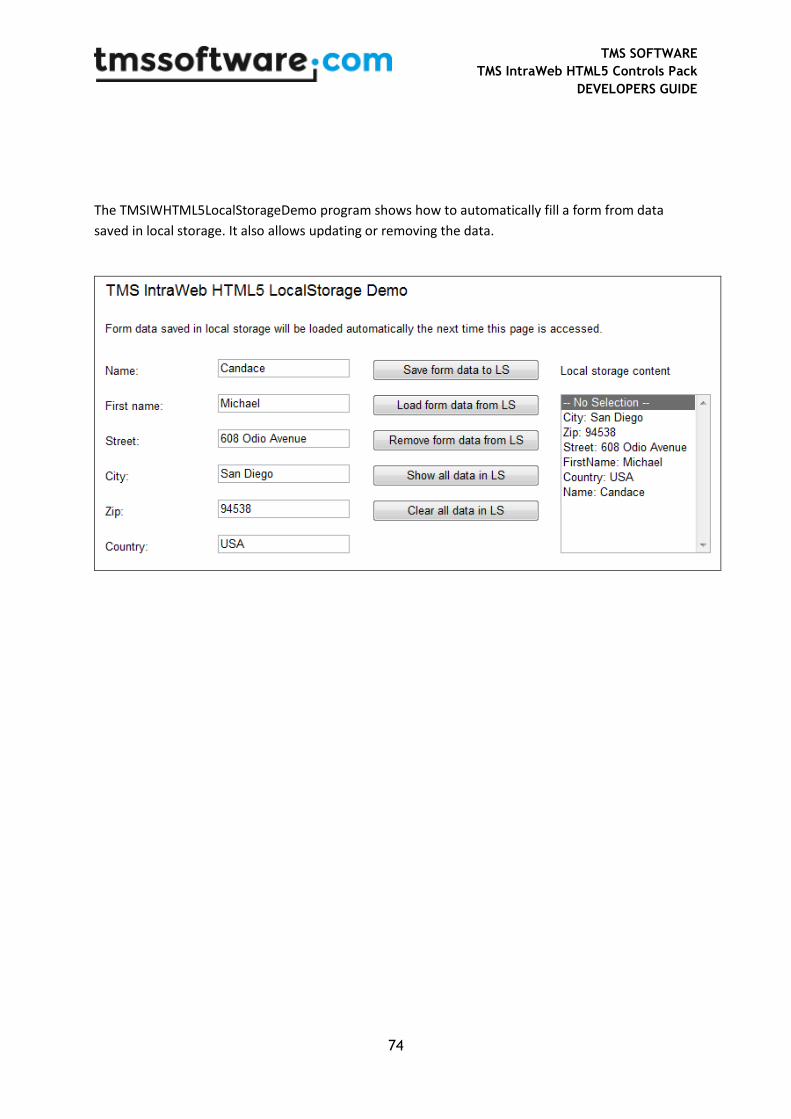
TMS SOFTWARE
TMS IntraWeb HTML5 Controls Pack
DEVELOPERS GUIDE
74
The TMSIWHTML5LocalStorageDemo program shows how to automatically fill a form from data
saved in local storage. It also allows updating or removing the data.