j. a. siefert, b. m. leister & j. n. dupontinmatsci/faculty/dupont/docs/considerations_in... ·...
TRANSCRIPT
Full Terms & Conditions of access and use can be found athttp://www.tandfonline.com/action/journalInformation?journalCode=ymst20
Download by: [Lehigh University] Date: 06 June 2016, At: 08:28
Materials Science and Technology
ISSN: 0267-0836 (Print) 1743-2847 (Online) Journal homepage: http://www.tandfonline.com/loi/ymst20
Considerations in development of CCT diagramsfor complex ferritic materials
J. A. Siefert, B. M. Leister & J. N. DuPont
To cite this article: J. A. Siefert, B. M. Leister & J. N. DuPont (2015) Considerations indevelopment of CCT diagrams for complex ferritic materials, Materials Science and Technology,31:6, 651-660, DOI: 10.1179/1743284714Y.0000000626
To link to this article: http://dx.doi.org/10.1179/1743284714Y.0000000626
Published online: 05 Aug 2014.
Submit your article to this journal
Article views: 114
View related articles
View Crossmark data
Citing articles: 1 View citing articles
Considerations in development of CCTdiagrams for complex ferritic materials
J. A. Siefert*1, B. M. Leister2 and J. N. DuPont2
A recent literature review of available data for the bainitic creep strength enhanced ferritic steel
grade 23 revealed significant variations among available continuous cooling transformation (CCT)
diagrams. Substantial differences in these diagrams were noted with respect to the observed
transformation products, reported transformation temperatures and the data provided with the
CCT diagram. While it is recognised that grade 23 is a complex material exhibiting up to three
transformations on-cooling from austenitisation, there does not seem to be a standardised or
uniform procedure for the development of CCT diagrams for such metallurgically diverse
materials. This paper details development of a CCT diagram for this material through integration
of results from thermal analysis, hardness measurements and microstructural observations.
Keywords: Continuous cooling transformation diagram, Creep strength enhanced ferritic steel, Grade 23, T/P23
IntroductionGrade 23 was developed as a tubing material forutilisation in supercritical and ultra supercritical fossilfired units.1 It is part of a larger class of materials knownas creep strength enhanced ferritic (CSEF) steels andone of two bainitic CSEF steels approved by theAmerican Society for Mechanical Engineers (ASME)Boiler and Pressure Vessel Code (the other being grade24). Today, grade 23 is actively being utilised in a widerange of applications including waterwall tubing, super-heater tubing, reheater tubing, thick section pipingapplications and replacement components for elevatedtemperature conditions including cyclic operating modessuch as those present in heat recovery steam generators.The chemical composition of this material per ASMEBoiler and Pressure Vessel Section I Code Caseno. 2199-6 is provided in Table 1.
Since its introduction to the ASME Code in 1995,grade 23 has seen six code revisions.2 Based on theauthor’s best knowledge, there are at least four USpatents that contain various amounts of informationpertinent to the development of grade 23.3–6 Therevisions and patents attest to the complexity of thismaterial and the difficulty in fundamentally under-standing this bainitic CSEF steel. A recent review ofgrade 23 revealed significant differences among fivecontinuous cooling transformation (CCT) diagramsreported in the literature.7 The five CCT diagrams werecompared for the types of provided information(Table 2), the measured and provided transformationtemperatures (Table 3) and the position of the ferrite
nose (Fig. 1).8–12 While it is recognised that variations inthe transformation behaviour can be expected from thesame nominal alloy due to differences in, for example,composition variations permitted within the specifica-tion, peak austenitising temperature, starting grain size,etc., the variations shown in Fig. 1 appear particularlysignificant. As shown in these tables and figure, theinformation was found to be vastly different leading totwo, obvious possibilities:
(i) the grade 23 chemical composition range is largeand typical variations among suppliers, withinthe specification, can lead to variations intransformation behaviour
(ii) the lack of a standardised approach for develop-ing a CCT diagram results in experimentalinconsistencies in the reported data.
With respect to the second claim, there were discrepan-cies in the type and quantity of reported data, and it alsoappeared that different procedures may have beenutilised for the austenitisation of the material anddevelopment of the CCT diagram. Examples of thedeviation in the reported data include the chemicalcomposition, grain size of the base material, basematerial condition, the hardness test performed andthe hardness load. Important types of data were neverreported, such as the method for measuring thetransformation temperatures (Gleeble thermomechani-cal simulator, etc.), the sample size of the hardnessindentation data (and whether it was averaged) and theheating rate to austenitisation. While it is recognisedthat different procedures may be utilised in theexamination of the phase transformation behaviour ofa given material, it is imperative that such data areprovided to ensure accurate interpretation.
The differences in the data can be realised when theferrite ‘nose’ is plotted for the five references (Fig. 1).Note that the position of the ferrite nose varies from avalue of 70–2000 s on the logarithmic time scale axis
1Electric Power Research Institute, 1300 West W. T. Harris Blvd,Charlotte, NC 28262, USA2Department of Materials Science & Engineering, Lehigh University, 5East Packer Ave. Bethlehem, PA 18015, USA
*Corresponding author, email [email protected]
� 2015 Institute of Materials, Minerals and MiningPublished by Maney on behalf of the InstituteReceived 17 March 2014; accepted 23 July 2014DOI 10.1179/1743284714Y.0000000626 Materials Science and Technology 2015 VOL 31 NO 6 651
Dow
nloa
ded
by [
Leh
igh
Uni
vers
ity]
at 0
8:28
06
June
201
6
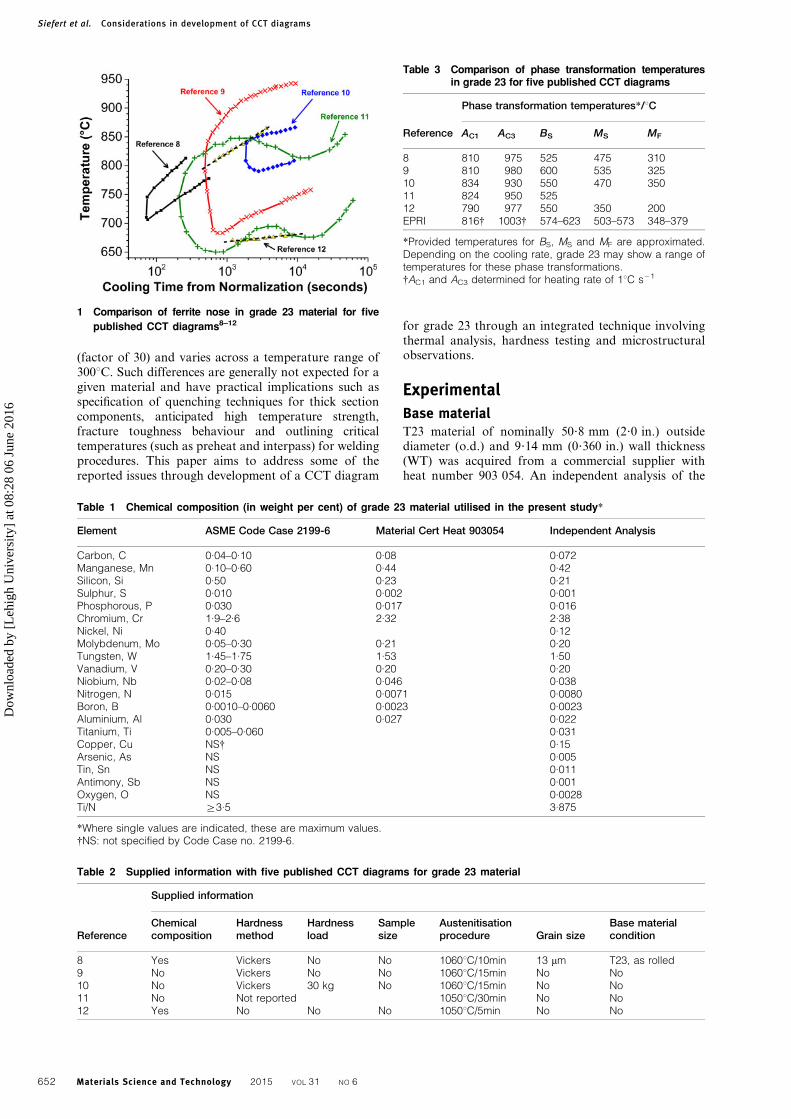
(factor of 30) and varies across a temperature range of300uC. Such differences are generally not expected for agiven material and have practical implications such asspecification of quenching techniques for thick sectioncomponents, anticipated high temperature strength,fracture toughness behaviour and outlining criticaltemperatures (such as preheat and interpass) for weldingprocedures. This paper aims to address some of thereported issues through development of a CCT diagram
for grade 23 through an integrated technique involvingthermal analysis, hardness testing and microstructuralobservations.
Experimental
Base materialT23 material of nominally 50?8 mm (2?0 in.) outsidediameter (o.d.) and 9?14 mm (0?360 in.) wall thickness(WT) was acquired from a commercial supplier withheat number 903 054. An independent analysis of the
Table 2 Supplied information with five published CCT diagrams for grade 23 material
Reference
Supplied information
Chemicalcomposition
Hardnessmethod
Hardnessload
Samplesize
Austenitisationprocedure Grain size
Base materialcondition
8 Yes Vickers No No 1060uC/10min 13 mm T23, as rolled9 No Vickers No No 1060uC/15min No No10 No Vickers 30 kg No 1060uC/15min No No11 No Not reported 1050uC/30min No No12 Yes No No No 1050uC/5min No No
Table 1 Chemical composition (in weight per cent) of grade 23 material utilised in the present study*
Element ASME Code Case 2199-6 Material Cert Heat 903054 Independent Analysis
Carbon, C 0.04–0.10 0.08 0.072Manganese, Mn 0.10–0.60 0.44 0.42Silicon, Si 0.50 0.23 0.21Sulphur, S 0.010 0.002 0.001Phosphorous, P 0.030 0.017 0.016Chromium, Cr 1.9–2.6 2.32 2.38Nickel, Ni 0.40 0.12Molybdenum, Mo 0.05–0.30 0.21 0.20Tungsten, W 1.45–1.75 1.53 1.50Vanadium, V 0.20–0.30 0.20 0.20Niobium, Nb 0.02–0.08 0.046 0.038Nitrogen, N 0.015 0.0071 0.0080Boron, B 0.0010–0.0060 0.0023 0.0023Aluminium, Al 0.030 0.027 0.022Titanium, Ti 0.005–0.060 0.031Copper, Cu NS{ 0.15Arsenic, As NS 0.005Tin, Sn NS 0.011Antimony, Sb NS 0.001Oxygen, O NS 0.0028Ti/N §3.5 3.875
*Where single values are indicated, these are maximum values.{NS: not specified by Code Case no. 2199-6.
Table 3 Comparison of phase transformation temperaturesin grade 23 for five published CCT diagrams
Reference
Phase transformation temperatures*/uC
AC1 AC3 BS MS MF
8 810 975 525 475 3109 810 980 600 535 32510 834 930 550 470 35011 824 950 52512 790 977 550 350 200EPRI 816{ 1003{ 574–623 503–573 348–379
*Provided temperatures for BS, MS and MF are approximated.Depending on the cooling rate, grade 23 may show a range oftemperatures for these phase transformations.{AC1 and AC3 determined for heating rate of 1uC s21
1 Comparison of ferrite nose in grade 23 material for five
published CCT diagrams8–12
Siefert et al. Considerations in development of CCT diagrams
652 Materials Science and Technology 2015 VOL 31 NO 6
Dow
nloa
ded
by [
Leh
igh
Uni
vers
ity]
at 0
8:28
06
June
201
6
chemical composition was performed and found to be ingood agreement with the supplied material certification.Both data, as well as the chemical composition specifiedin ASME Code Case no. 2199-6, are given in Table 1.
The cylindrical specimens for dilatometry wereelectrodischarge machined from the acquired tubingmaterial to a diameter of 6 mm (0?24 in.) and a finallength of 70 mm (2?76 in.) per ASTM 1033-10.13 Forcooling rates exceeding 50uC s2-1, a modified specimengeometry was utilised. This modified specimen (consis-tent with specimen geometry provided in Fig. 4 inRef. 13) was machined with a reduced section gaugediameter of 6 mm (0?24 in.) and 10 mm (0?394 in.)diameter hollow ends to facilitate the increased coolingrates. The heating and cooling rates were controlled by aGleeble 3500 thermomechanical simulator, and dilationwas measured using a linear variable differentialtransformer dilatometer with quartz contact rods.
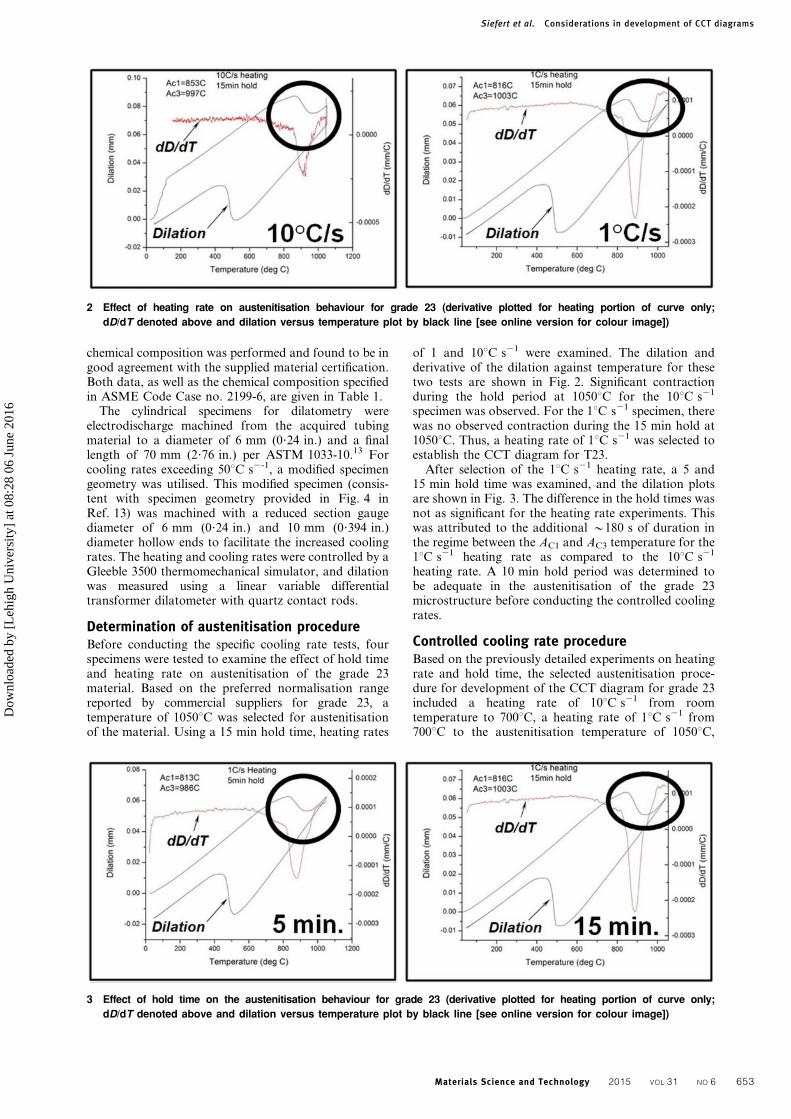
Determination of austenitisation procedureBefore conducting the specific cooling rate tests, fourspecimens were tested to examine the effect of hold timeand heating rate on austenitisation of the grade 23material. Based on the preferred normalisation rangereported by commercial suppliers for grade 23, atemperature of 1050uC was selected for austenitisationof the material. Using a 15 min hold time, heating rates
of 1 and 10uC s21 were examined. The dilation andderivative of the dilation against temperature for thesetwo tests are shown in Fig. 2. Significant contractionduring the hold period at 1050uC for the 10uC s21
specimen was observed. For the 1uC s21 specimen, therewas no observed contraction during the 15 min hold at1050uC. Thus, a heating rate of 1uC s21 was selected toestablish the CCT diagram for T23.
After selection of the 1uC s21 heating rate, a 5 and15 min hold time was examined, and the dilation plotsare shown in Fig. 3. The difference in the hold times wasnot as significant for the heating rate experiments. Thiswas attributed to the additional y180 s of duration inthe regime between the AC1 and AC3 temperature for the1uC s21 heating rate as compared to the 10uC s21
heating rate. A 10 min hold period was determined tobe adequate in the austenitisation of the grade 23microstructure before conducting the controlled coolingrates.
Controlled cooling rate procedureBased on the previously detailed experiments on heatingrate and hold time, the selected austenitisation proce-dure for development of the CCT diagram for grade 23included a heating rate of 10uC s21 from roomtemperature to 700uC, a heating rate of 1uC s21 from700uC to the austenitisation temperature of 1050uC,
2 Effect of heating rate on austenitisation behaviour for grade 23 (derivative plotted for heating portion of curve only;
dD/dT denoted above and dilation versus temperature plot by black line [see online version for colour image])
3 Effect of hold time on the austenitisation behaviour for grade 23 (derivative plotted for heating portion of curve only;
dD/dT denoted above and dilation versus temperature plot by black line [see online version for colour image])
Siefert et al. Considerations in development of CCT diagrams
Materials Science and Technology 2015 VOL 31 NO 6 653
Dow
nloa
ded
by [
Leh
igh
Uni
vers
ity]
at 0
8:28
06
June
201
6
followed by a 10 min hold time at 1050uC. The reportedAC1 temperature in the literature (Table 2) was suffi-ciently above 700uC (790–834uC) to avoid any transfor-mation during the fast heating rate to 700uC.Furthermore, ASTM 1033-10 allows for a heating rateof 10uC s21 to 700uC for the examination of phasetransformations in low alloy steels.13 Cooling ratesobtained using cylindrical specimens varied from 240 to0?1uC s21 with delineations at 200, 100, 50, 25, 10, 5, 3,1, 0?8, 0?5 and 0?3uC s21.
Analysis of cooling curvesThe data acquired from the Gleeble was in the form ofdilation (mm) versus temperature (uC). To accuratelydetermine the transformation temperatures, the deriva-tive of the dilation as a function of temperature (dD/dT)versus temperature (uC) was plotted. The currentmethod used for determining the start of a phase changeutilises the derivative of the dilation curve as a functionof temperature. A deviation from a constant derivative
indicates the start of the phase change, and the return toa constant derivative indicates the finish of the phasechange. The method described in ASTM A1033 suggeststhat a line be drawn on the dilation curve, such that itoverlays the region of the dilation curve where thematerial is cooling but is still entirely austenite. Thedeviation of the dilation curve from this supplementaryline indicates the start of the phase transformation. Thederivative method utilised in the present work was usedin order to minimise subjectivity associated withidentifying the first deviation from the local baseline, apoint discussed in the analysis of cooling curves inRef. 14. Using the derivative provides an alternativemeans to determine these temperatures as compared tooverlaying simple lines on the dilation versus tempera-ture graph as detailed in ASTM A1033-10, Section10?5.13
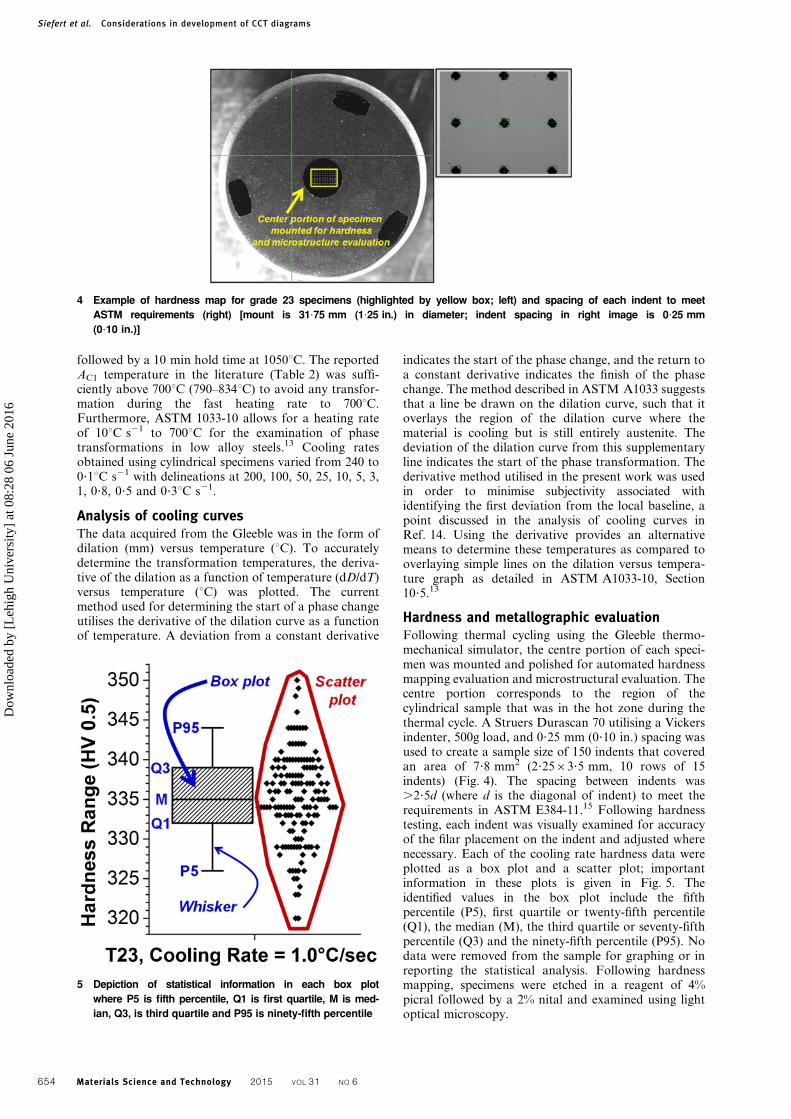
Hardness and metallographic evaluationFollowing thermal cycling using the Gleeble thermo-mechanical simulator, the centre portion of each speci-men was mounted and polished for automated hardnessmapping evaluation and microstructural evaluation. Thecentre portion corresponds to the region of thecylindrical sample that was in the hot zone during thethermal cycle. A Struers Durascan 70 utilising a Vickersindenter, 500g load, and 0?25 mm (0?10 in.) spacing wasused to create a sample size of 150 indents that coveredan area of 7?8 mm2 (2?2563?5 mm, 10 rows of 15indents) (Fig. 4). The spacing between indents was.2?5d (where d is the diagonal of indent) to meet therequirements in ASTM E384-11.15 Following hardnesstesting, each indent was visually examined for accuracyof the filar placement on the indent and adjusted wherenecessary. Each of the cooling rate hardness data wereplotted as a box plot and a scatter plot; importantinformation in these plots is given in Fig. 5. Theidentified values in the box plot include the fifthpercentile (P5), first quartile or twenty-fifth percentile(Q1), the median (M), the third quartile or seventy-fifthpercentile (Q3) and the ninety-fifth percentile (P95). Nodata were removed from the sample for graphing or inreporting the statistical analysis. Following hardnessmapping, specimens were etched in a reagent of 4%picral followed by a 2% nital and examined using lightoptical microscopy.
4 Example of hardness map for grade 23 specimens (highlighted by yellow box; left) and spacing of each indent to meet
ASTM requirements (right) [mount is 31?75 mm (1?25 in.) in diameter; indent spacing in right image is 0?25 mm
(0?10 in.)]
5 Depiction of statistical information in each box plot
where P5 is fifth percentile, Q1 is first quartile, M is med-
ian, Q3, is third quartile and P95 is ninety-fifth percentile
Siefert et al. Considerations in development of CCT diagrams
654 Materials Science and Technology 2015 VOL 31 NO 6
Dow
nloa
ded
by [
Leh
igh
Uni
vers
ity]
at 0
8:28
06
June
201
6
Results
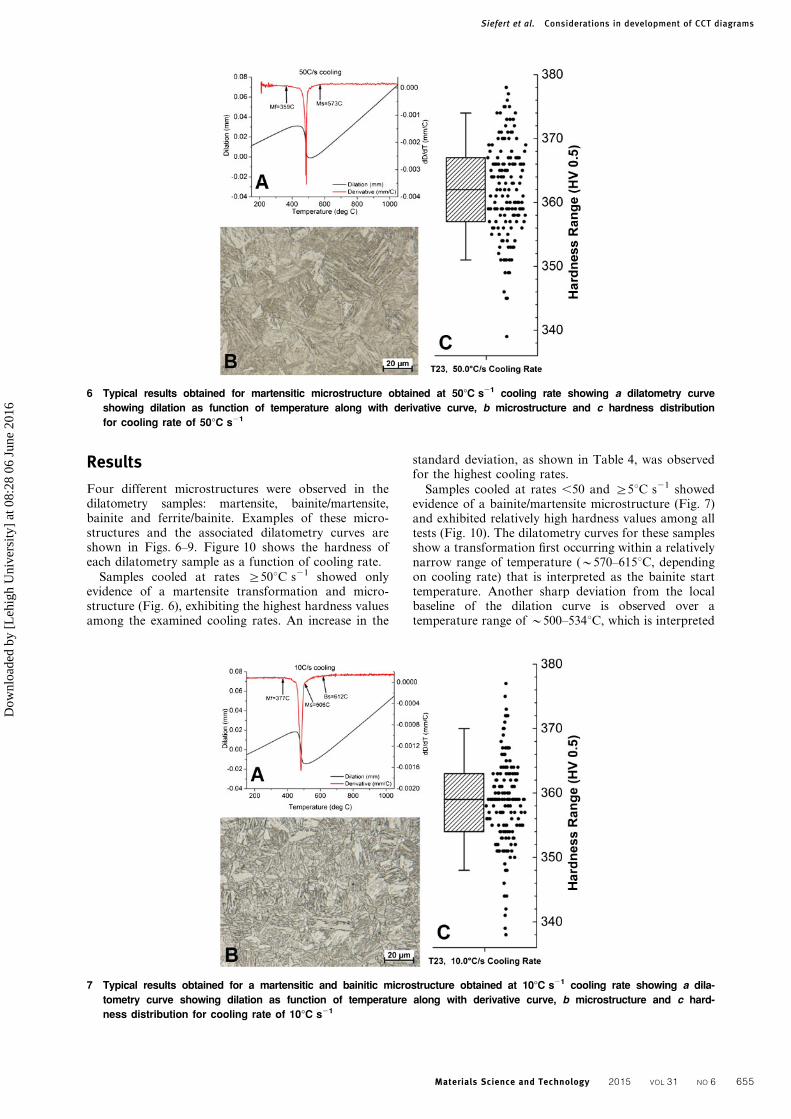
Four different microstructures were observed in thedilatometry samples: martensite, bainite/martensite,bainite and ferrite/bainite. Examples of these micro-structures and the associated dilatometry curves areshown in Figs. 6–9. Figure 10 shows the hardness ofeach dilatometry sample as a function of cooling rate.
Samples cooled at rates §50uC s21 showed onlyevidence of a martensite transformation and micro-structure (Fig. 6), exhibiting the highest hardness valuesamong the examined cooling rates. An increase in the
standard deviation, as shown in Table 4, was observedfor the highest cooling rates.
Samples cooled at rates ,50 and §5uC s21 showedevidence of a bainite/martensite microstructure (Fig. 7)and exhibited relatively high hardness values among alltests (Fig. 10). The dilatometry curves for these samplesshow a transformation first occurring within a relativelynarrow range of temperature (y570–615uC, dependingon cooling rate) that is interpreted as the bainite starttemperature. Another sharp deviation from the localbaseline of the dilation curve is observed over atemperature range of y500–534uC, which is interpreted
6 Typical results obtained for martensitic microstructure obtained at 50uC s21 cooling rate showing a dilatometry curve
showing dilation as function of temperature along with derivative curve, b microstructure and c hardness distribution
for cooling rate of 50uC s21
7 Typical results obtained for a martensitic and bainitic microstructure obtained at 10uC s21 cooling rate showing a dila-
tometry curve showing dilation as function of temperature along with derivative curve, b microstructure and c hard-
ness distribution for cooling rate of 10uC s21
Siefert et al. Considerations in development of CCT diagrams
Materials Science and Technology 2015 VOL 31 NO 6 655
Dow
nloa
ded
by [
Leh
igh
Uni
vers
ity]
at 0
8:28
06
June
201
6
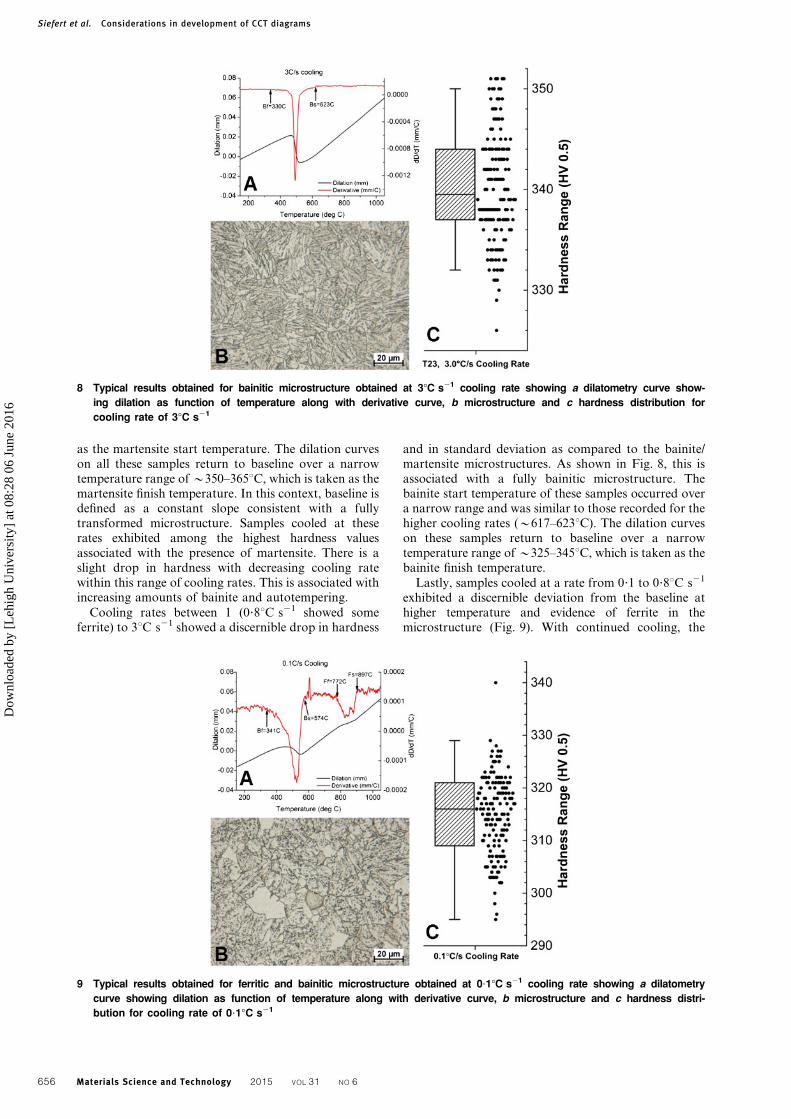
as the martensite start temperature. The dilation curveson all these samples return to baseline over a narrowtemperature range of y350–365uC, which is taken as themartensite finish temperature. In this context, baseline isdefined as a constant slope consistent with a fullytransformed microstructure. Samples cooled at theserates exhibited among the highest hardness valuesassociated with the presence of martensite. There is aslight drop in hardness with decreasing cooling ratewithin this range of cooling rates. This is associated withincreasing amounts of bainite and autotempering.
Cooling rates between 1 (0?8uC s21 showed someferrite) to 3uC s21 showed a discernible drop in hardness
and in standard deviation as compared to the bainite/martensite microstructures. As shown in Fig. 8, this isassociated with a fully bainitic microstructure. Thebainite start temperature of these samples occurred overa narrow range and was similar to those recorded for thehigher cooling rates (y617–623uC). The dilation curveson these samples return to baseline over a narrowtemperature range of y325–345uC, which is taken as thebainite finish temperature.
Lastly, samples cooled at a rate from 0?1 to 0?8uC s21
exhibited a discernible deviation from the baseline athigher temperature and evidence of ferrite in themicrostructure (Fig. 9). With continued cooling, the
8 Typical results obtained for bainitic microstructure obtained at 3uC s21 cooling rate showing a dilatometry curve show-
ing dilation as function of temperature along with derivative curve, b microstructure and c hardness distribution for
cooling rate of 3uC s21
9 Typical results obtained for ferritic and bainitic microstructure obtained at 0?1uC s21 cooling rate showing a dilatometry
curve showing dilation as function of temperature along with derivative curve, b microstructure and c hardness distri-
bution for cooling rate of 0?1uC s21
Siefert et al. Considerations in development of CCT diagrams
656 Materials Science and Technology 2015 VOL 31 NO 6
Dow
nloa
ded
by [
Leh
igh
Uni
vers
ity]
at 0
8:28
06
June
201
6
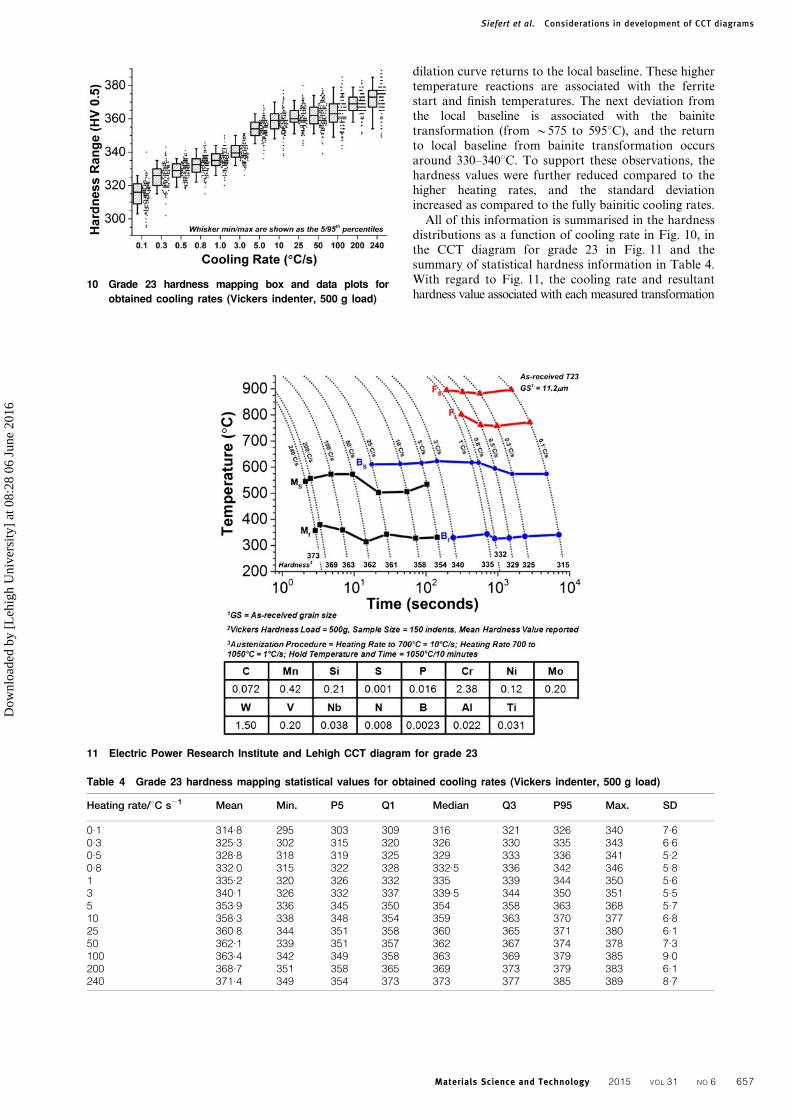
dilation curve returns to the local baseline. These highertemperature reactions are associated with the ferritestart and finish temperatures. The next deviation fromthe local baseline is associated with the bainitetransformation (from y575 to 595uC), and the returnto local baseline from bainite transformation occursaround 330–340uC. To support these observations, thehardness values were further reduced compared to thehigher heating rates, and the standard deviationincreased as compared to the fully bainitic cooling rates.
All of this information is summarised in the hardnessdistributions as a function of cooling rate in Fig. 10, inthe CCT diagram for grade 23 in Fig. 11 and thesummary of statistical hardness information in Table 4.With regard to Fig. 11, the cooling rate and resultanthardness value associated with each measured transformation
10 Grade 23 hardness mapping box and data plots for
obtained cooling rates (Vickers indenter, 500 g load)
Table 4 Grade 23 hardness mapping statistical values for obtained cooling rates (Vickers indenter, 500 g load)
Heating rate/uC s21 Mean Min. P5 Q1 Median Q3 P95 Max. SD
0.1 314.8 295 303 309 316 321 326 340 7.60.3 325.3 302 315 320 326 330 335 343 6.60.5 328.8 318 319 325 329 333 336 341 5.20.8 332.0 315 322 328 332.5 336 342 346 5.81 335.2 320 326 332 335 339 344 350 5.63 340.1 326 332 337 339.5 344 350 351 5.55 353.9 336 345 350 354 358 363 368 5.710 358.3 338 348 354 359 363 370 377 6.825 360.8 344 351 358 360 365 371 380 6.150 362.1 339 351 357 362 367 374 378 7.3100 363.4 342 349 358 363 369 379 385 9.0200 368.7 351 358 365 369 373 379 383 6.1240 371.4 349 354 373 373 377 385 389 8.7
11 Electric Power Research Institute and Lehigh CCT diagram for grade 23
Siefert et al. Considerations in development of CCT diagrams
Materials Science and Technology 2015 VOL 31 NO 6 657
Dow
nloa
ded
by [
Leh
igh
Uni
vers
ity]
at 0
8:28
06
June
201
6
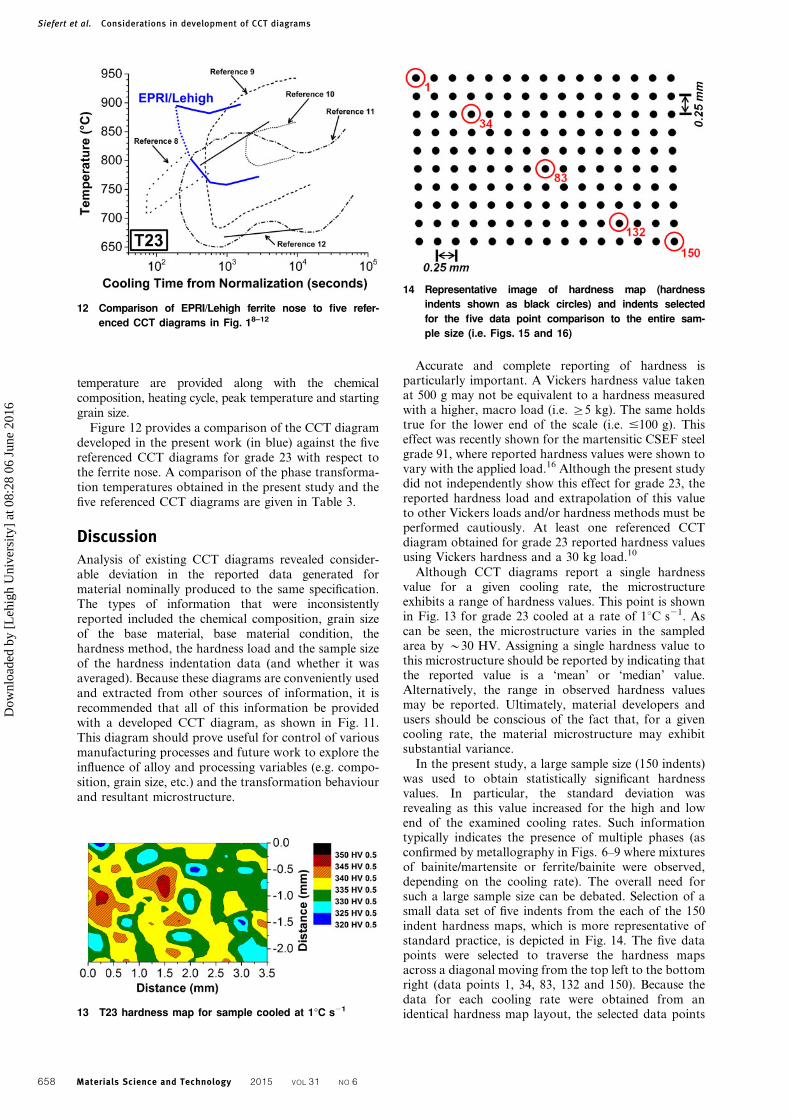
temperature are provided along with the chemicalcomposition, heating cycle, peak temperature and startinggrain size.
Figure 12 provides a comparison of the CCT diagramdeveloped in the present work (in blue) against the fivereferenced CCT diagrams for grade 23 with respect tothe ferrite nose. A comparison of the phase transforma-tion temperatures obtained in the present study and thefive referenced CCT diagrams are given in Table 3.
DiscussionAnalysis of existing CCT diagrams revealed consider-able deviation in the reported data generated formaterial nominally produced to the same specification.The types of information that were inconsistentlyreported included the chemical composition, grain sizeof the base material, base material condition, thehardness method, the hardness load and the sample sizeof the hardness indentation data (and whether it wasaveraged). Because these diagrams are conveniently usedand extracted from other sources of information, it isrecommended that all of this information be providedwith a developed CCT diagram, as shown in Fig. 11.This diagram should prove useful for control of variousmanufacturing processes and future work to explore theinfluence of alloy and processing variables (e.g. compo-sition, grain size, etc.) and the transformation behaviourand resultant microstructure.
Accurate and complete reporting of hardness isparticularly important. A Vickers hardness value takenat 500 g may not be equivalent to a hardness measuredwith a higher, macro load (i.e. §5 kg). The same holdstrue for the lower end of the scale (i.e. #100 g). Thiseffect was recently shown for the martensitic CSEF steelgrade 91, where reported hardness values were shown tovary with the applied load.16 Although the present studydid not independently show this effect for grade 23, thereported hardness load and extrapolation of this valueto other Vickers loads and/or hardness methods must beperformed cautiously. At least one referenced CCTdiagram obtained for grade 23 reported hardness valuesusing Vickers hardness and a 30 kg load.10
Although CCT diagrams report a single hardnessvalue for a given cooling rate, the microstructureexhibits a range of hardness values. This point is shownin Fig. 13 for grade 23 cooled at a rate of 1uC s21. Ascan be seen, the microstructure varies in the sampledarea by y30 HV. Assigning a single hardness value tothis microstructure should be reported by indicating thatthe reported value is a ‘mean’ or ‘median’ value.Alternatively, the range in observed hardness valuesmay be reported. Ultimately, material developers andusers should be conscious of the fact that, for a givencooling rate, the material microstructure may exhibitsubstantial variance.
In the present study, a large sample size (150 indents)was used to obtain statistically significant hardnessvalues. In particular, the standard deviation wasrevealing as this value increased for the high and lowend of the examined cooling rates. Such informationtypically indicates the presence of multiple phases (asconfirmed by metallography in Figs. 6–9 where mixturesof bainite/martensite or ferrite/bainite were observed,depending on the cooling rate). The overall need forsuch a large sample size can be debated. Selection of asmall data set of five indents from the each of the 150indent hardness maps, which is more representative ofstandard practice, is depicted in Fig. 14. The five datapoints were selected to traverse the hardness mapsacross a diagonal moving from the top left to the bottomright (data points 1, 34, 83, 132 and 150). Because thedata for each cooling rate were obtained from anidentical hardness map layout, the selected data points
12 Comparison of EPRI/Lehigh ferrite nose to five refer-
enced CCT diagrams in Fig. 18–12
13 T23 hardness map for sample cooled at 1uC s21
14 Representative image of hardness map (hardness
indents shown as black circles) and indents selected
for the five data point comparison to the entire sam-
ple size (i.e. Figs. 15 and 16)
Siefert et al. Considerations in development of CCT diagrams
658 Materials Science and Technology 2015 VOL 31 NO 6
Dow
nloa
ded
by [
Leh
igh
Uni
vers
ity]
at 0
8:28
06
June
201
6
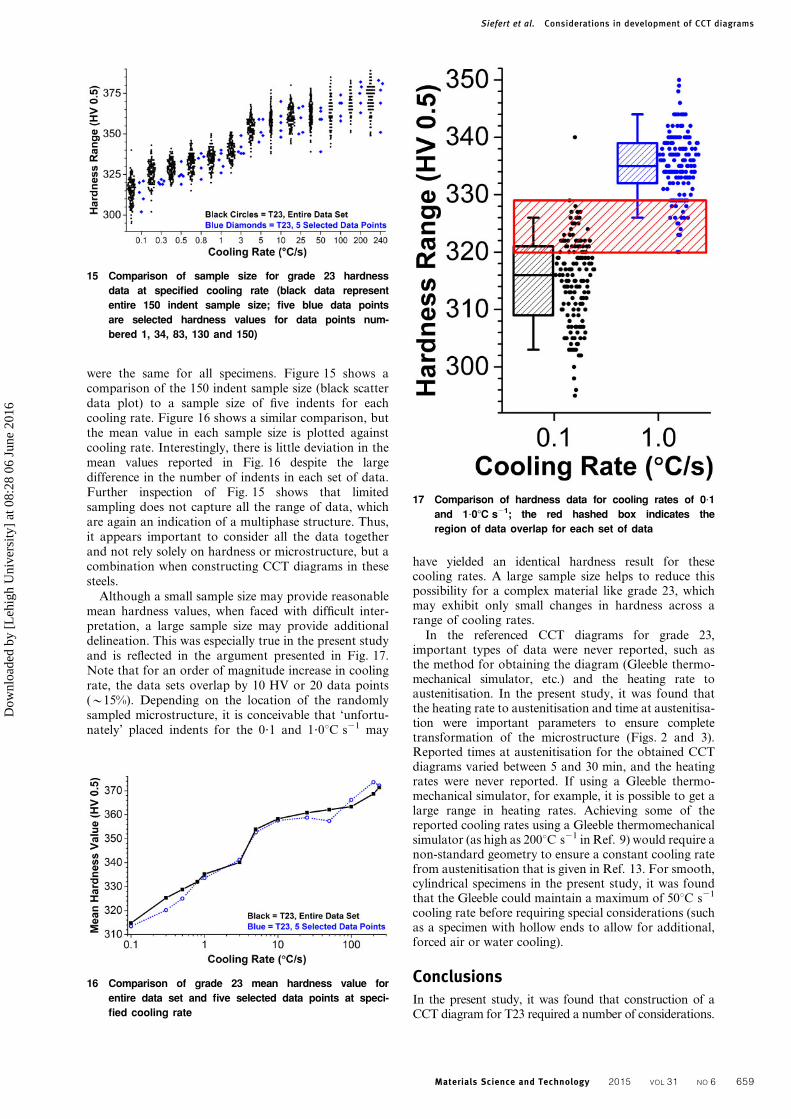
were the same for all specimens. Figure 15 shows acomparison of the 150 indent sample size (black scatterdata plot) to a sample size of five indents for eachcooling rate. Figure 16 shows a similar comparison, butthe mean value in each sample size is plotted againstcooling rate. Interestingly, there is little deviation in themean values reported in Fig. 16 despite the largedifference in the number of indents in each set of data.Further inspection of Fig. 15 shows that limitedsampling does not capture all the range of data, whichare again an indication of a multiphase structure. Thus,it appears important to consider all the data togetherand not rely solely on hardness or microstructure, but acombination when constructing CCT diagrams in thesesteels.
Although a small sample size may provide reasonablemean hardness values, when faced with difficult inter-pretation, a large sample size may provide additionaldelineation. This was especially true in the present studyand is reflected in the argument presented in Fig. 17.Note that for an order of magnitude increase in coolingrate, the data sets overlap by 10 HV or 20 data points(y15%). Depending on the location of the randomlysampled microstructure, it is conceivable that ‘unfortu-nately’ placed indents for the 0?1 and 1?0uC s21 may
have yielded an identical hardness result for thesecooling rates. A large sample size helps to reduce thispossibility for a complex material like grade 23, whichmay exhibit only small changes in hardness across arange of cooling rates.
In the referenced CCT diagrams for grade 23,important types of data were never reported, such asthe method for obtaining the diagram (Gleeble thermo-mechanical simulator, etc.) and the heating rate toaustenitisation. In the present study, it was found thatthe heating rate to austenitisation and time at austenitisa-tion were important parameters to ensure completetransformation of the microstructure (Figs. 2 and 3).Reported times at austenitisation for the obtained CCTdiagrams varied between 5 and 30 min, and the heatingrates were never reported. If using a Gleeble thermo-mechanical simulator, for example, it is possible to get alarge range in heating rates. Achieving some of thereported cooling rates using a Gleeble thermomechanicalsimulator (as high as 200uC s21 in Ref. 9) would require anon-standard geometry to ensure a constant cooling ratefrom austenitisation that is given in Ref. 13. For smooth,cylindrical specimens in the present study, it was foundthat the Gleeble could maintain a maximum of 50uC s21
cooling rate before requiring special considerations (suchas a specimen with hollow ends to allow for additional,forced air or water cooling).
ConclusionsIn the present study, it was found that construction of aCCT diagram for T23 required a number of considerations.
15 Comparison of sample size for grade 23 hardness
data at specified cooling rate (black data represent
entire 150 indent sample size; five blue data points
are selected hardness values for data points num-
bered 1, 34, 83, 130 and 150)
16 Comparison of grade 23 mean hardness value for
entire data set and five selected data points at speci-
fied cooling rate
17 Comparison of hardness data for cooling rates of 0?1
and 1?0uC s21; the red hashed box indicates the
region of data overlap for each set of data
Siefert et al. Considerations in development of CCT diagrams
Materials Science and Technology 2015 VOL 31 NO 6 659
Dow
nloa
ded
by [
Leh
igh
Uni
vers
ity]
at 0
8:28
06
June
201
6
Simple approaches utilising limited hardness data or visualobservations of thermosimulation were insufficient. Instead,pre-experiment testing to ensure data accuracy as well asanalytical assessments of produced cooling curves wasnecessary to obtain valid experimental data. Statisticalanalysis of large hardness datasets confirmed multiphasestructures with the support of optical metallography. Basedon these findings, the authors propose that additionalguidance needs to be provided to the industry, potentially ina standard or code of practice to ensure the consistency ofthe provided data among various diagrams. Such adocument should contain:
1. limitations/controls on heating rate to austenitisation
2. establishing proper austenitisation temperaturesand hold times before testing
3. considerations for accelerated cooling when required
4. minimum hardness criterion (with regard to mini-mum load, data sample size and/or accepted hardnessmethods)
5. appropriate analysis procedures for cooling ratecurves
6. reporting of results including chemical composi-tion, grain size, base metal condition, hardness method,hardness load, clarification on the reported hardnessvalue (such as mean, median or range) and austenitisa-tion procedure (if not to a future standard).
Additional considerations in the development of CCTdiagrams should be considered by the researcher. In thecase of grade 23, the resultant microstructure exhibitedthree unique phases despite having a consistent meanhardness value across a large range of cooling rates. Inthis case, the use of large sample sizes for the hardnessanalysis using simple statistics, such as the standarddeviation and scatter data plots, provided confidence inthe reported phase transformations and associatedtemperature ranges. Ultimately, this research has shownthat, for a complex material, the development of anaccurate CCT diagram was only made possible throughthe combined interpretation of the derivative of thedilation curve as a function of temperature, detailedlight optical microscopy and large hardness sample sizesto establish statistical values for each cooling rate.
References1. F. Masuyama, A. Iseda, Y. Sawaragi and T. Yokoyama:
‘Development of tungsten strengthened low alloy steel with
improved weldability’, in ‘Service experience and reliability
improvement: nuclear fossil and petrochemical plants’, (ed. W.
H. Bamford et al.), 141–146; 1994, Minneapolis, MN, American
Society of Mechanical Engineers.
2. ‘2?25Cr–1?6W–V–Cb material’, Code Case 2199, ASME, New
York, USA, 2012.
3. F. Masuyama and H. Mitsuura: ‘High strength heat-resistant low
alloy steels’, US patent no. 5,084,238, 28 January 1992.
4. A. Iseda, Y. Sawaragi, F. Masuyama and T. Yokoyama: ‘Low-
alloy heat-resistant steel having improved creep strength and
toughness’, US patent no. 5,211,909, 18 May 1993.
5. A. Iseda, Y. Sawaragi, F. Masuyama and T. Yokoyama: ‘Low-
chromium ferritic heat-resistant steel with improved toughness and
creep strength’, US patent no. 5,407,635, 18 April 1995.
6. N. Komai, F. Masuyama, T. Yokoyama, H. Hirata, K. Kawano
and T. Kan: ‘High strength, low alloy, heat resistant steel’, US
patent no. 6,379,611, 30 April 2002.
7. ‘Relationship between alloy chemistry, hardenability, and creep
behavior of Code Case 2199 (T23)’, Report no. 1024753, Electric
Power Research Institute, Palo Alto, CA, USA, 2011.
8. A. Poli, C. Rosellini, A. Bertoni and G. Liberati: ‘Fabrication and
weldability of grade 23 tubing and piping’, Proc. 1st Int. Conf. on
‘Super high strength steels’, Rome, Italy, November 2005,
Associazione Italiana Di Metallurgia, 1–12.
9. J. C. Valliant, B. Vandenberghe, C. Zakine, J. Gabrel and W.
Bendick: ‘The T23/P23 Book’, 17; 2006, Boulogne-sur-Mer,
Vallourec and Mannesmann Tubes.
10. A. Laarmann: ‘New CCT-diagrams for grade T23 according to
ASME Code Case 2199-4’, Presented to the ASME SG-SFA (sub
group on strength of ferrous alloys), San Diego, CA, USA, May
2009, ASME, 1–14.
11. N. Komai, T. Imazato and F. Masuyama: ‘Continuously cooled
microstructure and creep rupture strength of low C–2?25Cr–1?6W–
V–Nb steel’, ISIJ Int. Suppl., 2001, 41, S91–S96.
12. F. Masuyama: ‘T23 (Code case 2199) specification and properties’,
Presented to the ASME SG-SFA (sub group on strength of ferrous
alloys), Montreal, Canada, February 2009, ASME, 1–35.
13. ‘Standard practice for quantitative measurement and reporting of
hypoeutectoid carbon and low-alloy steel phase transformation’,
A1033-10, ASTM, West Conshohocken, PA, USA, 2010.
14. H. S. Yang and H. K. D. H. Bhadeshia: ‘Uncertainties in
dilatometric determination of martensite start temperature’,
Mater. Sci. Technol., 2007, 23, 556–560.
15. ‘Standard test method for Knoop and Vickers hardness of
materials’, E384-11, ASTM, West Conshohocken, PA, USA, 2011.
16. J. A. Siefert, J. P. Shingledecker and J. D. Parker: ‘Optimization of
Vickers hardness parameters for micro and macro indentation of
grade 91 steel,’ J. Test. Eval., 2013, 41, 778–787.
Siefert et al. Considerations in development of CCT diagrams
660 Materials Science and Technology 2015 VOL 31 NO 6
Dow
nloa
ded
by [
Leh
igh
Uni
vers
ity]
at 0
8:28
06
June
201
6