j. matthew grassman, naval surface warfare center ... · during the rv triton project, ......
TRANSCRIPT

J. Matthew Grassman, Naval Surface Warfare Center, Carderock Division (NSWCCD) and Gregory Alan Hildstrom, George Washington University (GWU)
Structural Trials of the RV Triton – a Status Update and Quick-Look Report
ABSTRACT
The purpose of this paper is to provide the audience with information about the status of the Trimaran Demonstrator Program. This status update/quick-look report includes overviews of the Trimaran Demonstrator Program, trials conducted, completed analysis, and future analysis. The result of the Trimaran Demonstrator Program is the ship Research Vessel (RV) Triton. The goal of the technology demonstrator is to minimize the risk of trimaran hull forms for warship applications.
The RV Triton has successfully completed several months of rough water sea trials. The ship experienced a wide variety of speeds, headings, and sea states up to sea state 7 and is still currently operating with no significant damage or stability problems.
INTRODUCTION The purpose of this paper is to provide the
audience with information about the status of the Trimaran Demonstrator Program. This status update/quick-look report includes overviews of the Trimaran Demonstrator Program, trials conducted, completed analysis, and future analysis.
The RV Triton was constructed for the Trimaran Demonstrator Project, a joint program between the United Kingdom and the United States, to assess the trimaran hull form for implementation
in future warship designs and to reduce the risks associated with the introduction of trimaran ships into either the UK or US fleets (Marshall 2000). In order to fully define the work to be completed during the RV Triton project, the U.S. and British governments signed a Memorandum of Understanding (MOU) in September 1997. The United States Navy provided a full suite of sensors and acquisition hardware located throughout the ship under the MOU. The Trimaran Trials Project office tasked NSWC, Code 65 to perform the data reduction and analysis of the data collected during the rough water sea trials. This task is on going.
RV Triton was designed as a trimaran technology demonstrator. The RV Triton is a 1200-ton steel constructed vessel, 318 ft in overall length, 295 ft between perpendiculars, and 73.8 ft in beam length, which is about two-thirds the length of the Royal Navy’s Future Surface Combatant (FSC) frigate requirement. The contract for the build was awarded in the fall of 1998. The first steel was cut in January of 1999. RV Triton was launched in May 2000, with delivery to Defense Evaluation and Research Agency (DERA) in September. The first trials began in October 2000 in Rosyth, Scotland.
The RV Triton was built using Det Norske Veritas (DNV) high-speed light craft rules and was designed and built by Vosper-Thornycroft in the Woolston Southampton yard.
RV Triton is made from steel that has yield strain of 1335 uStrain.
A number of tests of the RV Triton have been undertaken during the past two years. Some of these tests include structural trials, towing, seakeeping trials, helicopter landings, underwater visualization studies, speed and powering, and a transatlantic crossing. This battery of tests was conducted from October 2000 to December 2002.
The RV Triton underwent eight weeks of structural calibration trials in dry dock at the Rosyth dockyard. The calibration trials were followed by dedicated structural sea trials conducted over four

Figure 1. Cross Deck Shear Strain Raw Time History time periods. During the sea trials the ship was operated up to high sea state 7 conditions. Over 200 strain gages and accelerometers measured the condition on the ship.
DESCRIPTION OF THE INSTRUMENTATION SYSTEM AND INSTALLED SENSORS
All of the Triton Trials Data (TTD) were recorded by a data acquisition system developed by the United States at the Naval Surface Warfare Center, Carderock Division (NSWCCD). The Trials Instrumentation System (TIS) recorded data at three different sample rates: 20 Hz, 200 Hz, and 2000 Hz. The 20 Hz data were recorded continuously during trials and contained data channels that were quasi-static or low frequency. The 200 Hz data were also recorded continuously during trials and contained structural strain channels, which have a higher frequency requirement. The 2000 Hz or 2 kHz data, also known as slam shot data, were recorded only when triggered during trials. The 2 kHz data consists mostly of pressure panel data during high speed or heavy sea state. Figure 1 shows an example 200 Hz time history plot of cross deck shear strain.
The measurements being recorded fall into three categories; ship systems and navigation, ship motions, and structural response. There are 116 digital channels recorded directly from the ship
machinery control and navigation systems. The ship machinery systems include information on the power being produced from the generators, power being used by the electric drive system, control settings for the propulsion system, and fuel state. The navigation systems provide speed and course information. The ships motion data includes seven tri-axial accelerometers, and a Watson meter for measuring pitch and roll rate. The structural response instrumentation makes up the bulk of the data being recorded. There are thirty-seven longitudinal strain measurements, twenty transverse strain measurements, thirty-nine bulkhead strain measurements including axial and shear, four main hull torsion measurements, and twenty-three stress concentration measurements. There are an additional thirty-two locations instrumented to measure the structural response to wave impacts.
STRUCTURAL TRIALS OVERVIEW
The RV Triton has completed an exhaustive trials program that has been underway since October 2000. There were two types of trials that comprised the structural trials; calibration trials and sea trials.
Upon delivery of the ship, she went to the Rosyth Royal Dockyard for 2 months of calibration trials. The main purpose of the structural calibration trials was to calculate scale factors that allow
conversion from measured strain to known applied loads or bending moments. Additionally, it was an opportunity to debug the strain gage instrumentation installed on the ship to ensure that they were wired correctly and responding to applied loads. Another purpose of the calibration trials was to perform set of modal analysis tests, which helped us determine the natural frequency of the ship.
After completion of the calibration trials, RV Triton went to sea to begin filling in the trials matrix with different speed, heading, and sea state combinations. The sea trials also involved towing and sea-keeping tests, helicopter landings, underwater visualization studies, speed and powering, and a transatlantic crossing.
CALIBRATION TRIALS The calibration trials were split into two
categories; primary and secondary structure. The primary structure calibration consisted of applying known horizontal and vertical loads to the outriggers. The secondary structure trials consisted of applying loads to individual stiffeners on the wet deck.
Primary Structure Calibration Trials The primary structure calibration trials were by
far the most time consuming to setup. The weather in Scotland during the months of October and November are far from ideal for this type of trial. The former Defense Evaluation and Research
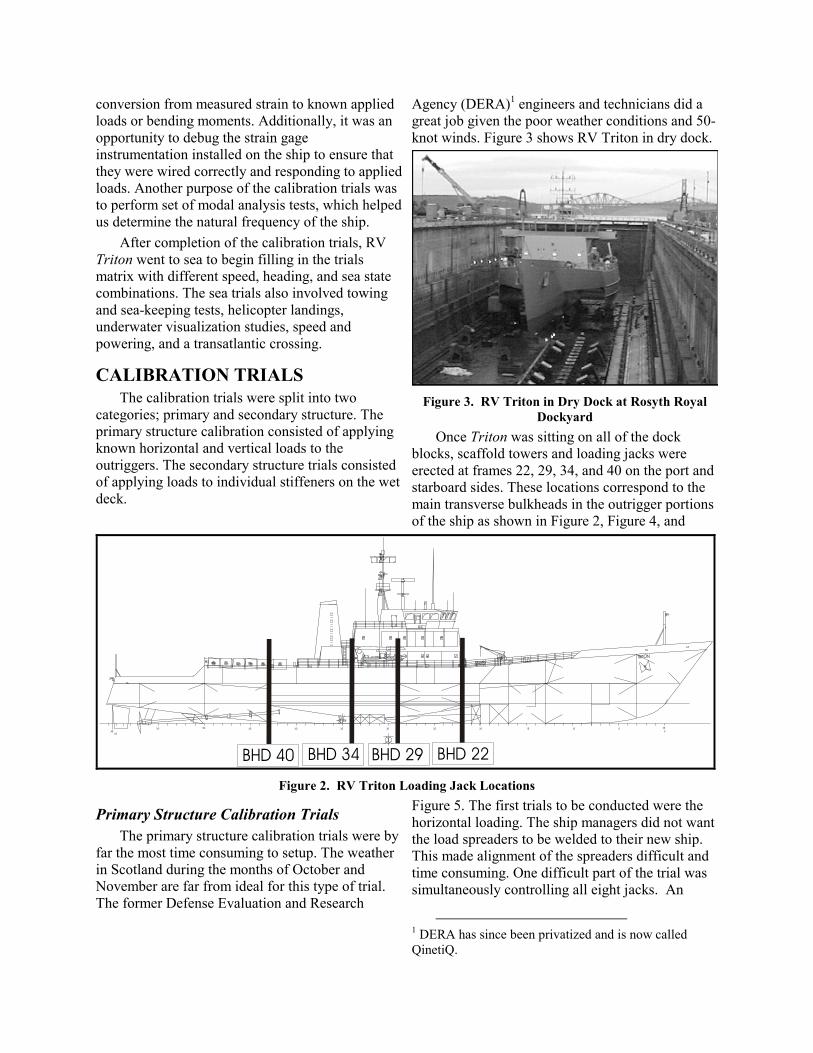
Agency (DERA)1 engineers and technicians did a great job given the poor weather conditions and 50-knot winds. Figure 3 shows RV Triton in dry dock.
Figure 3. RV Triton in Dry Dock at Rosyth Royal
Dockyard Once Triton was sitting on all of the dock
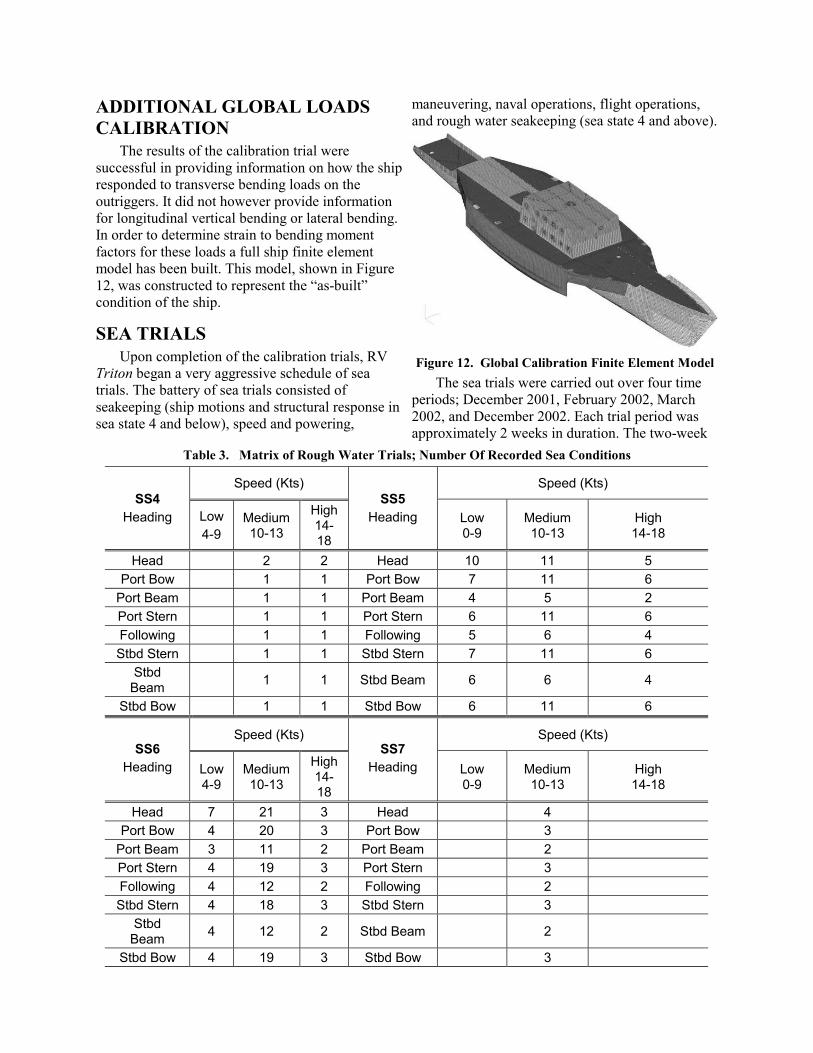
blocks, scaffold towers and loading jacks were erected at frames 22, 29, 34, and 40 on the port and starboard sides. These locations correspond to the main transverse bulkheads in the outrigger portions of the ship as shown in Figure 2, Figure 4, and
Figure 5. The first trials to be conducted were the horizontal loading. The ship managers did not want the load spreaders to be welded to their new ship. This made alignment of the spreaders difficult and time consuming. One difficult part of the trial was simultaneously controlling all eight jacks. An
TRITON
APFP
60
55 50 45 40 35 30 25 20 15 10 50
BHD 40 BHD 29 BHD 22BHD 34
Figure 2. RV Triton Loading Jack Locations
1 DERA has since been privatized and is now called QinetiQ.

added degree of complexity was that there were two types of hydraulic actuators. The control unit was able to control the jacks properly but was unable to rebroadcast the load and displacement information to the TIS system for two of the jacks. Load was recorded using one Data Acquisition System (DAS) and the strain was recorded on another, while keeping written records of applied load.
Figure 4. RV Triton Horizontal Loading Jack
Cad Work Upon completion of the horizontal trials the
jacks were repositioned to apply vertical load to the outrigger at the same locations; as described in Figure 6 and Figure 7. The vertical loads were applied to the port and starboard simultaneously. Vertical load was also applied to torque the outriggers. Vertical load was applied at frame 22 port and frame 40 starboard and vice versa. All of the load cases are summarized in Table 1.
Figure 5. RV Triton Horizontal Loading Jack
Assembly
Figure 6. RV Triton Vertical Loading Jack Cad
Work
Figure 7. RV Triton Vertical Loading Jack Assembly
A third primary structure trial was attempted. This consisted of applying a vertical load to the center hull of the ship. This was not successful due to limitation in the load spreading system and time constraints did not permit modification to the fixture.
During the calibration trials, load versus strain was plotted primarily to monitor the condition of the ship and to verify strain gage response to the applied load. After consolidating the actual applied loads with the measured strains into a complete data set a rigorous data reduction was performed.

Secondary Structure Calibration Trials
Figure 8. Secondary Loading Finite Element Model
The purpose of the secondary structure calibration was to validate the finite element models, shown in Figure 8, which were being used to determine equivalent static pressure response to a wave impact. The load fixture, shown in Figure 9, consisted of a “foot” that went over the stiffener, a housing for the hydraulic jack and extension pipe to support the fixture from the overhead. Static loads were applied in increments and the corresponding strain values recorded using the TIS. From these results, load per unit strain terms were calculated. These terms were compared with the results from
the finite element analysis. Based on the comparison of the results, the finite element model mesh was refined until the results differed by less than 10%. Results from these calibrated models were used to convert measured structural responses into equivalent uniform static pressure, suitable for design evaluation.
Table 1. Loading Sequences and Maximum Loadsfor the Global Response Trials Load Cases Max Load KN (kip)
Horizontal - 22 Port 500 (112.4) Horizontal - 29 Port 700 (157.4) Horizontal - 34 Port 700 (157.4) Horizontal - 40 Port 500 (112.4) Horizontal - 22 Starboard 500 (112.4) Horizontal - 29 Starboard 900 (202.3) Horizontal - 34 Starboard 800 (179.8) Horizontal - 40 Starboard 500 (112.4) Horizontal - All Port 813.2 (182.8) Horizontal - All Starboard 999.3 (224.6) Horizontal - All 8 Jacks 518.3 (116.5) Vertical - 22 Port and Starboard 800 (179.8) Vertical - 29 Port and Starboard 1400 (314.7) Vertical - 34 Port and Starboard 1400 (314.7) Vertical - 40 Port and Starboard 1200 (269.8) Vertical - Torsion 22P+40S 1000 (224.8) Vertical - Torsion 22S+40P 1000 (224.8) Vertical - 29+34 1400 (314.7) Vertical - All 8 Jacks 1352 (303.9)
Figure 9. Secondary Structure
Calibration Jack Assembly
Data Analysis of Primary Structure Calibration Trials
The data reduction consisted of a linear regression of load versus strain for every channel; an example is shown in Figure 11. Ideally, only selected channels would respond to a given load condition to assure independence of the calibration matrix. This was in fact the case. The longitudinal strain measurements did not respond to transverse bending and vice versa. The responses from a set of gages were used to develop a load response matrix. This matrix will be used later when processing the sea trials data; when converting measured strains to seaway loads.

Bulkhead 22600 Series
Figure 10. Bulkhead 22 Cad Drawing and Gage Locations
121123119122120 104 105
106
704
600
713
601
707710
The completed response matrix was sub-divided, by channel and ship location; an example of this is shown in Table 2, where the red numbers represent strain gage locations and the corresponding gage number. The example channels 600 and 601 are located in the cross deck structure that connects the center hull to the outriggers and are visible in Figure 10.
0
100
200
300
400
500
600
700
800
900
020406080100120BHD 22 Shear Strain (uStrain)
Appl
ied
Load
(kn)
.
LoadingUnloadingLinear (Both)Linear (Loading)Linear (Unloading)
Figure 11. Typical Plot of Applied Load
vs Measured Strain
Table 2. Calibration Trials Example Response Matrix
uStrain per Newton BHD 22 Load Case Gage
ORC 600 Gage
ORC 601 Horizontal – 22 Port -14.03 0 Horizontal – 29 Port 24.20 0 Horizontal – 34 Port 44.92 0 Horizontal – 40 Port 0 0 Horizontal – 22 Starboard 0 -12.84 Horizontal – 29 Starboard 0 22.68 Horizontal – 34 Starboard 0 42.66 Horizontal – 40 Starboard 0 0 Horizontal – All Port 0 0 Horizontal – All Starboard 0 0 Horizontal – All 8 Jacks 0 0 Vertical – 22 Both 8.03 7.80 Vertical – 29 Both 25.98 25.22 Vertical – 34 Both 63.06 59.92 Vertical – 40 Both 0 0 Vertical – Torsion 22P+40S 7.60 0 Vertical – Torsion 22S+40P 0 7.26 Vertical – 29+34 36.36 34.40 Vertical – All 8 Jacks 22.85 21.76
ADDITIONAL GLOBAL LOADS CALIBRATION
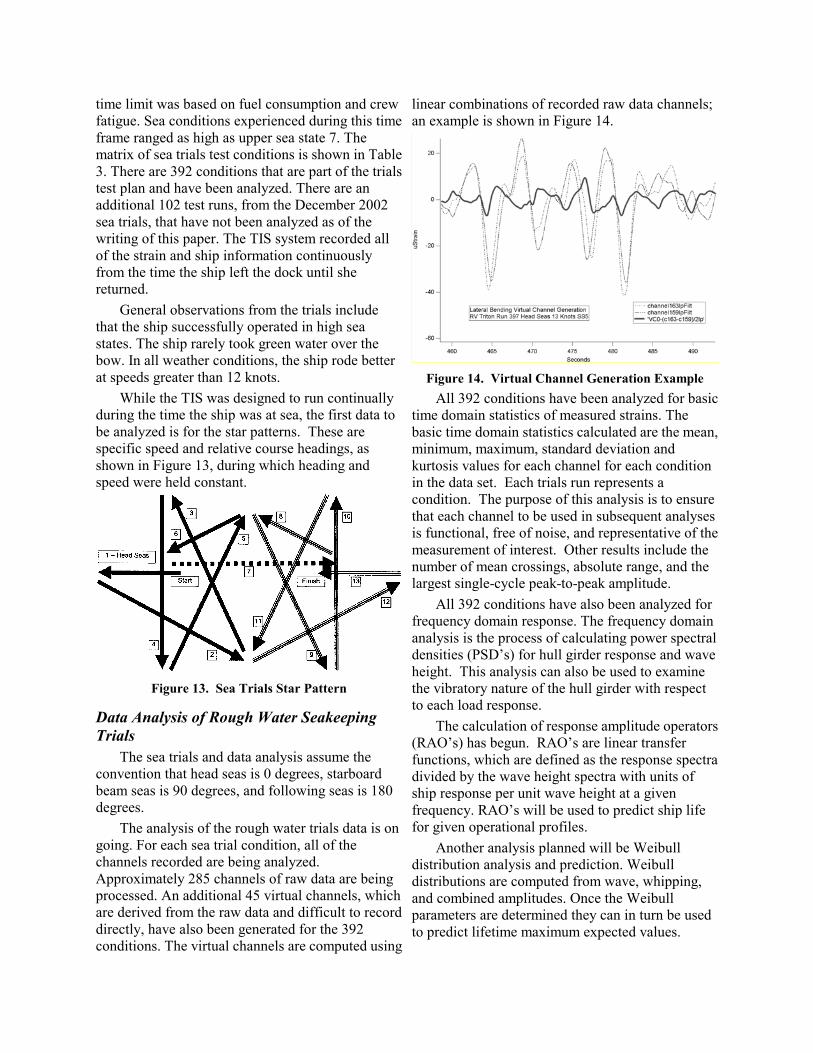
The results of the calibration trial were successful in providing information on how the ship responded to transverse bending loads on the outriggers. It did not however provide information for longitudinal vertical bending or lateral bending. In order to determine strain to bending moment factors for these loads a full ship finite element model has been built. This model, shown in Figure 12, was constructed to represent the “as-built” condition of the ship.
SEA TRIALS Upon completion of the calibration trials, RV
Triton began a very aggressive schedule of sea trials. The battery of sea trials consisted of seakeeping (ship motions and structural response in sea state 4 and below), speed and powering,
maneuvering, naval operations, flight operations, and rough water seakeeping (sea state 4 and above).
Figure 12. Global Calibration Finite Element Model
The sea trials were carried out over four time periods; December 2001, February 2002, March 2002, and December 2002. Each trial period was approximately 2 weeks in duration. The two-week
Table 3. Matrix of Rough Water Trials; Number Of Recorded Sea Conditions
Speed (Kts) Speed (Kts) SS4
Heading Low 4-9
Medium 10-13
High 14-18
SS5 Heading Low
0-9 Medium 10-13
High 14-18
Head 2 2 Head 10 11 5 Port Bow 1 1 Port Bow 7 11 6
Port Beam 1 1 Port Beam 4 5 2 Port Stern 1 1 Port Stern 6 11 6 Following 1 1 Following 5 6 4 Stbd Stern 1 1 Stbd Stern 7 11 6
Stbd Beam 1 1 Stbd Beam 6 6 4
Stbd Bow 1 1 Stbd Bow 6 11 6
Speed (Kts) Speed (Kts) SS6
Heading Low 4-9
Medium 10-13
High 14-18
SS7 Heading Low
0-9 Medium 10-13
High 14-18
Head 7 21 3 Head 4 Port Bow 4 20 3 Port Bow 3
Port Beam 3 11 2 Port Beam 2 Port Stern 4 19 3 Port Stern 3 Following 4 12 2 Following 2 Stbd Stern 4 18 3 Stbd Stern 3
Stbd Beam 4 12 2 Stbd Beam 2
Stbd Bow 4 19 3 Stbd Bow 3
time limit was based on fuel consumption and crew fatigue. Sea conditions experienced during this time frame ranged as high as upper sea state 7. The matrix of sea trials test conditions is shown in Table 3. There are 392 conditions that are part of the trials test plan and have been analyzed. There are an additional 102 test runs, from the December 2002 sea trials, that have not been analyzed as of the writing of this paper. The TIS system recorded all of the strain and ship information continuously from the time the ship left the dock until she returned.
General observations from the trials include that the ship successfully operated in high sea states. The ship rarely took green water over the bow. In all weather conditions, the ship rode better at speeds greater than 12 knots.
While the TIS was designed to run continually during the time the ship was at sea, the first data to be analyzed is for the star patterns. These are specific speed and relative course headings, as shown in Figure 13, during which heading and speed were held constant.
Figure 13. Sea Trials Star Pattern
Data Analysis of Rough Water Seakeeping Trials
The sea trials and data analysis assume the convention that head seas is 0 degrees, starboard beam seas is 90 degrees, and following seas is 180 degrees.
The analysis of the rough water trials data is on going. For each sea trial condition, all of the channels recorded are being analyzed. Approximately 285 channels of raw data are being processed. An additional 45 virtual channels, which are derived from the raw data and difficult to record directly, have also been generated for the 392 conditions. The virtual channels are computed using
linear combinations of recorded raw data channels; an example is shown in Figure 14.
Figure 14. Virtual Channel Generation Example
All 392 conditions have been analyzed for basic time domain statistics of measured strains. The basic time domain statistics calculated are the mean, minimum, maximum, standard deviation and kurtosis values for each channel for each condition in the data set. Each trials run represents a condition. The purpose of this analysis is to ensure that each channel to be used in subsequent analyses is functional, free of noise, and representative of the measurement of interest. Other results include the number of mean crossings, absolute range, and the largest single-cycle peak-to-peak amplitude.
All 392 conditions have also been analyzed for frequency domain response. The frequency domain analysis is the process of calculating power spectral densities (PSD’s) for hull girder response and wave height. This analysis can also be used to examine the vibratory nature of the hull girder with respect to each load response.
The calculation of response amplitude operators (RAO’s) has begun. RAO’s are linear transfer functions, which are defined as the response spectra divided by the wave height spectra with units of ship response per unit wave height at a given frequency. RAO’s will be used to predict ship life for given operational profiles.
Another analysis planned will be Weibull distribution analysis and prediction. Weibull distributions are computed from wave, whipping, and combined amplitudes. Once the Weibull parameters are determined they can in turn be used to predict lifetime maximum expected values.

Data Analysis Software Our primary data analysis solution for the RV
Triton rough water trials has been our High Volume Data Analysis Suite (HVDAS), which is a suite of parallelized statistical analysis software packages for Linux clusters and is written in C++. The most recent HVDAS version is 11-18-2002, which was developed by the Naval Surface Warfare Center Carderock Division (NSWCCD) Code 653 and George Washington University. HVDAS was designed and built on a seven-node i686-based Linux cluster.
The HVDAS suite of data analysis software packages consists of HVDALibrary, HVDAMMMAnalysis, HVDAPSDAnalysis, HVDARAOAnalysis, and HVDAWeibullAnalysis. Each of these software packages is designed to run as an automated process to analyze data in bulk.
HVDALibrary contains most of the code that is common to the different analysis programs. HVDALibrary also contains most of the complex analysis functions used by each of the different analysis programs.
HVDAMMMAnalysis computes basic time domain statistics like mean, max, min, max-mean, min-mean, absolute range, maximum peak-to-peak amplitude, standard deviation, and kurtosis. HVDAMMMAnalysis can also convert data file formats and compute virtual channel data files.
HVDAPSDAnalysis computes the PSD of selected data channels, using the Finite Fourier Transform Method Segment Averaging Method (Hardin 1986) (PSDFFTMSAM).
HVDARAOAnalysis computes the Square Root Response Amplitude Operator, which is computed by sqrt(RAO)2=PSDFFTMSAM(Vertical Bending)/PSDFFTMSAM(Wave Height). When analyzing surface ship structures, the RAO is usually used to compute ship bending transfer functions based on wave height.
HVDAWeibullAnalysis computes Weibull distribution statistics on data channel amplitudes. You can choose the method of Weibull computation from 2 Parameter Linear Regression, 3 Parameter Linear Regression, 2 Parameter Moment Method, or 3 Parameter Moment Method. Weibull statistics are useful for calculating maximum lifetime loads.
All of the HVDAS programs allow you to apply scale factors, subtract initial condition zero values,
smooth, Finite Impulse Response (FIR) filter, select data files, select channels, name channels, name conditions, select output locations, and read multiple data file formats.
We developed HVDAS out of a need to automate complicated and repetitive data analysis techniques. We chose C++ and Linux because of raw speed, portability, and object oriented design. HVDAS eliminates most of the human errors associated with point and click bulk data analysis. HVDAS has also performed basic time domain statistics on model and full-scale raw (no software filters) data over twenty times faster than real time.
We developed HVDAS Data Extractor (DE) as a back end post processor to the results from the Linux cluster. DE is written in Microsoft Visual Basic for Microsoft Excel. DE allows us to filter vast amounts of results using a graphical point and click interface to generate trends quickly and accurately.
QUICK OBSERVATIONS FROM SEA TRIALS DATA
Time Domain Response The Vertical STRain (VSTR) series gages were
installed so as to respond to longitudinal vertical ship bending from bow to stern. The VSTR gages experience significant wave-induced (low-frequency) and vibratory or slamming energy (high-frequency). The mid-ship keel gage, VSTR116, experienced a maximum strain amplitude of 411 uStrain in 12-knot sea state 6 condition. The high-frequency and low-frequency components of the recorded strain channels can be separated by using High-Pass (HP) Finite Impulse Response (FIR) filtering and Low-Pass (LP) FIR filtering respectively. We chose a crossover frequency, the frequency where the LP FIR filter starts to attenuate high-frequency energy and the HP FIR filter starts to attenuate low-frequency energy, of 1.55 Hz, which lies between the wave-induced energy and the first mode vibratory response on a PSD plot. The first mode vibratory response is clearly visible in Figure 23.This maximum VSTR strain amplitude contained a 104 uStrain slamming and vibration induced component. The low-frequency wave induced component is significant and clearly evident in the 98-uStrain standard deviation calculated from raw recorded data. The general

trend for VSTR gages is increased strain resulting from increased significant wave height, which is evident in Figure 15 and Figure 16.
We determined that the higher first mode frequency maximums were mostly slamming induced by inspecting time history plots and computing very small high-frequency standard deviations of 7 uStrain or below. The high (maximum-mean)/(standard deviation) ratio is a solid indicator for this type of behavior.
VSTR116 Raw Max-Mean
0
50
100
150
200
250
300
350
400
450
0 2 4 6Significant Wave Height (m)
uStra
in
VSTR116
8 ORC601 Raw Max-Mean
0
100
200
300
400
500
600
700
0 2 4 6 8Significant Wave Height (m)
uStra
in
ORC601
Figure 15. Mid-Ship Keel Gage Max-Mean vs Significant Wave Height
VSTR116 Raw Standard Deviation
0
20
40
60
80
100
120
0 2 4 6 8Significant Wave Height (m)
uStra
in
VSTR116
Figure 16. Mid-Ship Keel Gage Standard Deviation
vs Significant Wave Height The Transverse STRain (TSTR) series gages
respond to transverse ship bending from port outrigger to starboard outrigger. The largest TSTR
amplitude was 95 uStrain with a 73 uStrain high frequency slamming and vibration component.
The leading transverse bulkhead (frame 22), shown in Figure 10, experiences the highest strains in the ship. Inspection of the time histories shows a significant number of impacts taking place. The best example of these impacts is the cross deck shear gage OutRigger Connecting (ORC) ORC601, which is visible in Figure 1. These slams occurred during a 12-knot sea state 7 head seas run. ORC600 and ORC601 are located in the cross deck structures, which connect the outriggers to the center hull. The maximum ORC strain amplitude was 635 uStrain with a 484 uStrain slamming and vibration component. The general trend for ORC gages is increased strain resulting from increased significant wave height, which is evident in Figure 17, Figure 18, and Figure 19. The ORC gages are interesting because they experience their maximum strains in head seas conditions, not in quartering or beam seas as one might expect, which is evident in Figure 20 and Figure 21.
Figure 17. ORC Raw Max-Mean vs Significant Wave Height

ORC601 Raw Standard Deviation
0
5
10
15
20
25
30
0 2 4 6Significant Wave Height (m)
uStra
inORC601
8
ORC601 Raw Max-Mean
0
100
200
300
400
500
600
700
0 100 200 300 400Heading (Degrees)
uStra
in
ORC601
Figure 18. ORC Raw Standard Deviation
vs Significant Wave Height
ORC601 High-Pass Filtered Vibration and Slamming Max-Mean
0
100
200
300
400
500
600
0 2 4 6Significant Wave Height (m)
uStra
in
ORC601
8
ORC601 High-Pass Filtered Max-Mean
0
100
200
300
400
500
600
0 100 200 300 400Heading (Degrees)
uStra
inORC601
Figure 19. ORC High-Pass Filtered Max-Mean vs Significant Wave Height
Frequency Domain Response The results of the modal analysis calibration
trial found the first mode vertical bending response to be 2.9 Hz and the second mode to be 5.4 Hz. These correlated well to the finite element model predictions of 3.67(dry) and 2.96(wet) Hz for first mode and 6.9 (dry) and 5.58 (wet) Hz for second mode. The results of the PSD analysis, from trials data for mid-ship keel location, found the first mode to be 2.9 Hz, as shown in Figure 22, and second mode to be 5.4 Hz. Figure 23 shows an amplified and distorted finite element model result of first mode vertical longitudinal bending response.
Figure 20. ORC Raw Max-Mean vs Heading
Figure 21. ORC High-Pass Filtered Max-Mean vs Heading
CONCLUSIONS The Trimaran Demonstrator Program was
developed to minimize the risk of the trimaran hull form for warship application. This program has met this objective by the successful operation of the ship in design conditions. The current analysis of measured strains shows moderate structural response relative to yield. However, not all of the analysis is complete, so we cannot fully categorize the performance of the RV Triton to current U.S. warship design.

PSD Mid-Ship Keel Head Sea
0
50
100
150
200
250
300
350
400
450
500
0.000 1.000 2.000 3.000 4.000 5.000 6.000Frequency (Hz)
PSD
(uSt
ra^2
*Hz)
Figure 22. Power Spectral Density Mid-Ship Keel
Gage First Mode Response
Figure 23. First Mode Amplified Deflection
Finite Element Model The outrigger connecting gages, in the cross
deck structure between the outriggers and the center hull, show the maximum strains experienced by the RV Triton to be 635 uStrain amplitude with a 484 uStrain slamming and vibration component in head seas. This maximum strain is theorized to be a result of wave impact due to either wake effect from the center hull, direct sea wave impact, or a combination of both, during a head seas run, in combination with buoyant forces acting on the individual outriggers.
The trimaran demonstrator program was a successful MOU. In a short period of time, two governments and industry came together designed, built, and tested a novel hull form. The RV Triton has demonstrated that a large trimaran is a viable ship configuration with application toward a true warship. All of the analysis is not yet complete, but the results will be used to further develop design guides and rules for future trimaran ships.
REFERENCES Hardin, Jay C., “Introduction to Time Series
Analysis”, NASA Reference Publication 1145, 1986.
Marshall, B. R., et al. “Trimaran Hullform Demonstrator High Speed Data Acquisition System,” Naval Engineers Journal, pp. 167-175, July.
ACKNOWLEDGEMENTS We would like to acknowledge the crew of the
RV Triton for taking the ship into very heavy seas to gather data and the UK trials teams who recorded an enormous amount of data without major incident. We would like to thank Mr. Daniel Gaies for his work on the HVDAS Data Extractor, Messer’s Tom Brady and Richard Lewis for their help in developing data analysis algorithms, Mr. Steven Ray for his foresight to include one status channel per distributed recording device and data management onboard the ship.
J. Matthew Grassman has been with the Naval Surface Warfare Center Carderock Division (NSWCCD) since he received his B.S. degree in ocean engineering in 1987. He is currently the U.S. structures lead for the Trimaran Demonstrator Project. He was awarded the Meritorious Civilian Service Award for his work on this project and is also the only American to transit the Atlantic Ocean aboard the RV Triton. His other involvements include finite element methods for the design and analysis of naval ships, SWATHs and advanced double hull ships and ultimate strength analysis for design and analysis of naval ships.
Gregory Alan Hildstrom studied computer engineering at Virginia Tech (VT) for three years. The Naval Surface Warfare Center Carderock Division (NSWCCD) hired him as an engineering technician. He developed automated data analysis software, for Microsoft Windows, Linux, and Linux Clusters. In May 2002 he designed 5.2 GHz directional antennas and achieved 500m at 50mph, with a 50mW signal. After attending VT, he was hired by George Washington University to work on a Navy contract for NSWCCD. He is continuing development of performance enhancements and adding new analysis programs to the High Volume Data Analysis Suite (HVDAS) Linux Cluster software.
