j00415 community satisfaction survey 2016 · j00415 community satisfaction survey 2016 –bass...
TRANSCRIPT
2
J00415 Community Satisfaction Survey 2016 – Bass Coast Shire Council
Background and objectives
Survey methodology and sampling
Further information
Key findings & recommendations
Summary of findings
Detailed findings
• Key core measure: Overall performance
• Key core measure: Customer service
• Key core measure: Council direction indicators
• Individual service areas
• Detailed demographics
Appendix A: Detailed survey tabulations
Appendix B: Further project information
3
J00415 Community Satisfaction Survey 2016 – Bass Coast Shire Council
Welcome to the report of results and recommendations for the 2016 State-wide Local
Government Community Satisfaction Survey for Bass Coast Shire Council.
Each year Local Government Victoria (LGV) coordinates and auspices this State-wide
Local Government Community Satisfaction Survey throughout Victorian local government
areas. This coordinated approach allows for far more cost effective surveying than would
be possible if councils commissioned surveys individually.
Participation in the State-wide Local Government Community Satisfaction Survey is
optional and participating councils have a range of choices as to the content of the
questionnaire and the sample size to be surveyed, depending on their individual
strategic, financial and other considerations.
The main objectives of the survey are to assess the performance of Bass Coast Shire
Council across a range of measures and to seek insight into ways to provide improved or
more effective service delivery. The survey also provides councils with a means to fulfil
some of their statutory reporting requirements as well as acting as a feedback
mechanism to LGV.
4
J00415 Community Satisfaction Survey 2016 – Bass Coast Shire Council
This survey was conducted by Computer Assisted Telephone Interviewing (CATI) as a
representative random probability survey of residents aged 18+ years in Bass Coast Shire
Council.
Survey sample matched to the demographic profile of Bass Coast Shire Council as determined
by the most recent ABS population estimates was purchased from an accredited supplier of
publicly available phone records, including up to 10% mobile phone numbers to cater to the
diversity of residents within Bass Coast Shire Council, particularly younger people.
A total of n=400 completed interviews were achieved in Bass Coast Shire Council. Survey
fieldwork was conducted in the period of 1st February – 30th March, 2016.
The 2016 results are compared with previous years, as detailed below:
Please note that in 2013 and 2012 Bass Coast Shire Council elected to sample residents and
non-resident ratepayers. As Bass Coast has sampled residents only in 2014-2016, the results
of these surveys are not comparable to previous iterations and should be considered as stand-
alone response sets. For this reason, comparisons to 2013 and 2012 have not been included
in this report.
• 2015, n=401 completed interviews, conducted in the period of 1st February – 30th March.
• 2014, n=400 completed interviews, conducted in the period of 31st January – 11th March.
5
J00415 Community Satisfaction Survey 2016 – Bass Coast Shire Council
Minimum quotas of gender within age groups were applied during the fieldwork phase. Post-
survey weighting was then conducted to ensure accurate representation of the age and gender
profile of the Bass Coast Shire Council area.
Any variation of +/-1% between individual results and net scores in this report or the detailed
survey tabulations is due to rounding. In reporting, ‘—’ denotes not mentioned and ‘0%’
denotes mentioned by less than 1% of respondents. ‘Net’ scores refer to two or more response
categories being combined into one category for simplicity of reporting.
6
J00415 Community Satisfaction Survey 2016 – Bass Coast Shire Council
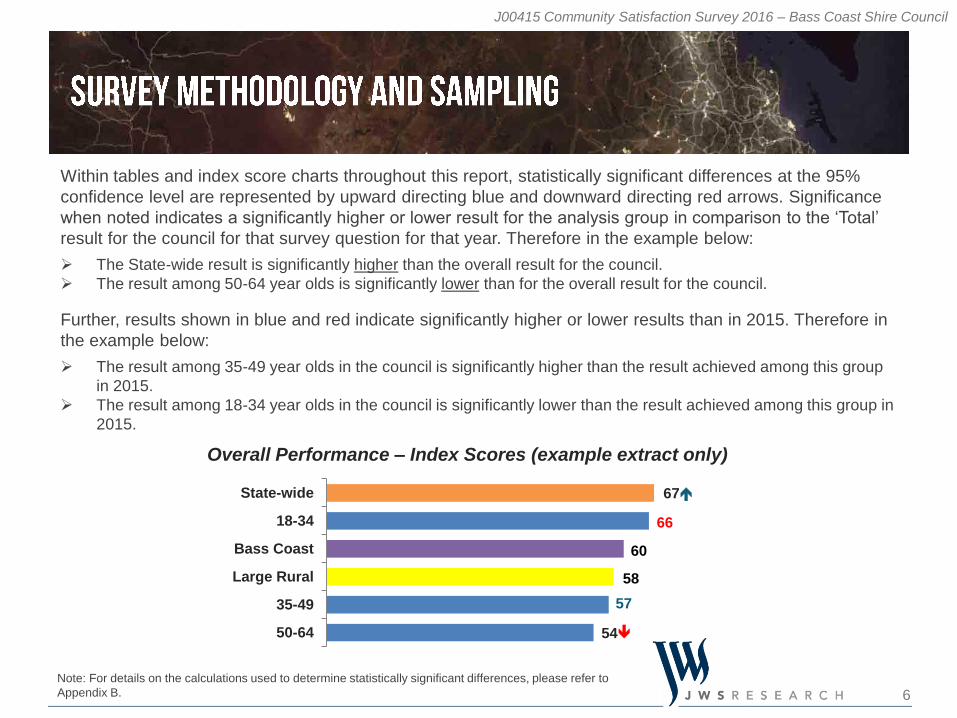
Within tables and index score charts throughout this report, statistically significant differences at the 95%
confidence level are represented by upward directing blue and downward directing red arrows. Significance
when noted indicates a significantly higher or lower result for the analysis group in comparison to the ‘Total’
result for the council for that survey question for that year. Therefore in the example below:
The State-wide result is significantly higher than the overall result for the council.
The result among 50-64 year olds is significantly lower than for the overall result for the council.
Further, results shown in blue and red indicate significantly higher or lower results than in 2015. Therefore in
the example below:
The result among 35-49 year olds in the council is significantly higher than the result achieved among this group
in 2015.
The result among 18-34 year olds in the council is significantly lower than the result achieved among this group in
2015.
54
57
58
60
67
66
50-64
35-49
Large Rural
Bass Coast
18-34
State-wide
Overall Performance – Index Scores (example extract only)
Note: For details on the calculations used to determine statistically significant differences, please refer to
Appendix B.
7
J00415 Community Satisfaction Survey 2016 – Bass Coast Shire Council
Further Information
Further information about the report and explanations about the State-wide Local
Government Community Satisfaction Survey can be found in Appendix B, including:
Background and objectives
Margins of error
Analysis and reporting
Glossary of terms
Contacts
For further queries about the conduct and reporting of the 2016 State-wide Local
Government Community Satisfaction Survey, please contact JWS Research on
(03) 8685 8555.
9
J00415 Community Satisfaction Survey 2016 – Bass Coast Shire Council
With the exception of Sealed Local Roads, all core performance measures are
lower in 2016 than in both 2014 and 2015. Ratings on most core measures have
been on the decline since 2014, though losses were greater this year than in the
previous year’s survey.
As a result, Bass Coast lags significantly behind the average for other Large
Rural Shires, as well as State-wide averages, on all core measures.
By exception, ratings for Sealed Local Roads have improved by eight points in
the last two years – starting with an index score of 33 in 2014 and climbing to a
score of 41 this year.
Unfortunately, a decrease in positive ratings combined with an increase in negative
ratings on most measures is responsible for declining index scores, rather than a shift
to the center (more neutral ratings).
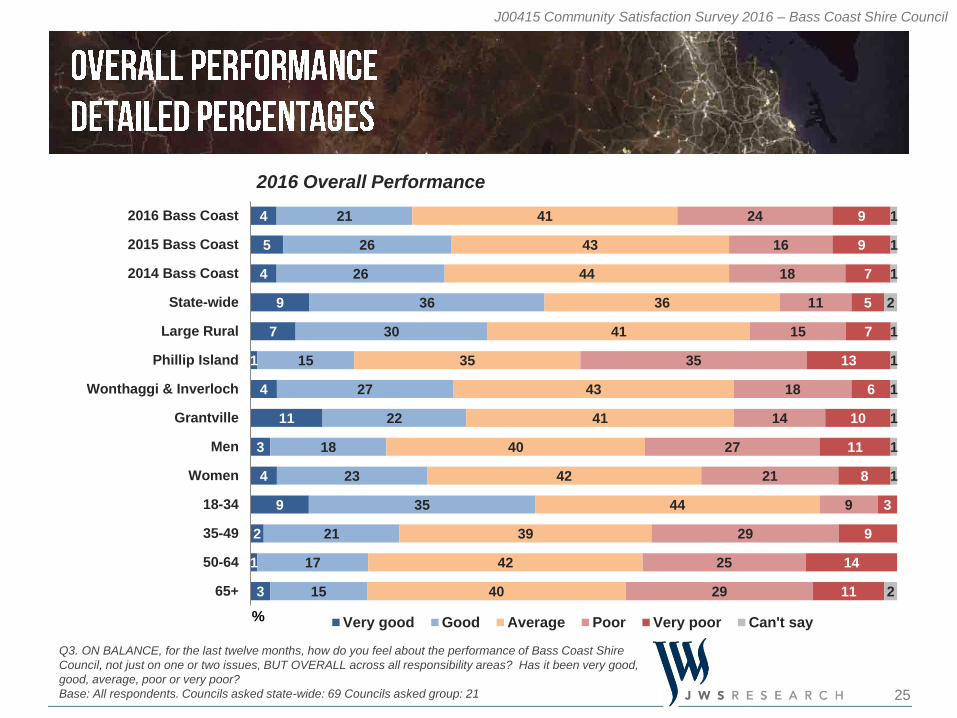
For example, in 2016 25% awarded Bass Coast a rating of ‘very good’ or ‘good’
on Overall Performance, 41% awarded a rating of average and 33% a rating of
‘very poor’ or ‘poor’. This is compared with 31%, 43% and 25% respectively in
2015.
10
J00415 Community Satisfaction Survey 2016 – Bass Coast Shire Council
Declines in ratings are largely driven by men and older residents (particularly older
men), and while ratings on most core measures are lower – and have continued to
drop – among residents aged 50 and older, the worst declines are seen among
residents aged 65 and older.
In general, geographic, generational, and gender differences exist within Bass
Coast Shire Council. Grantville residents and 18 to 34 year olds tend to rate Council
highest, while men, residents over the age of 50, and Phillip Island residents rate
Council lowest. Demographic and geographic trends are in keeping with 2015 results
with these same groups occupying the highest and lowest ends of the ratings scale.
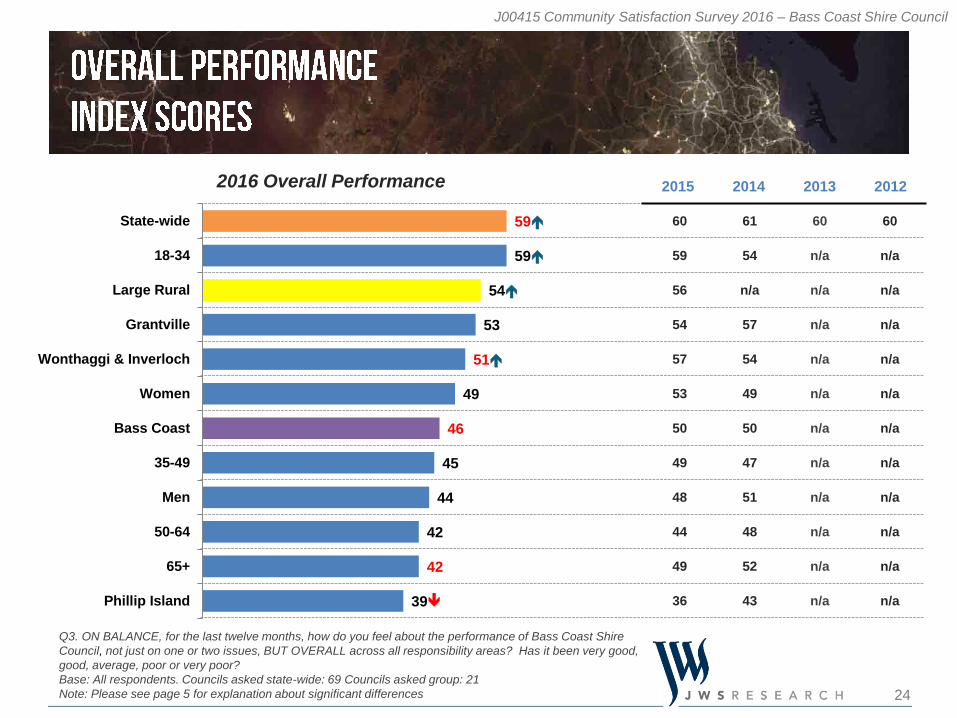
The Overall Performance index score of 46 represents a four point decline on the
2015 and 2014 results (50 both years). Bass Coast Shire Council lags the average for
other Large Rural Shires by eight points (54) and the State-wide average by 13 points
(59).
11
J00415 Community Satisfaction Survey 2016 – Bass Coast Shire Council
By way of illustration of demographic and geographic differences, Grantville
residents rate Council seven points higher than the average (53) for Overall
Performance, while Phillip Island residents rate Council seven points lower (39).
Overall performance ratings among adults aged 65+ have dropped 10 points in
the past two years from a high of 52 in 2014 to 42 this year (49 in 2015). Adults
aged 50 to 64 experienced a similar, but not quite as large, decline (48 in 2014,
44 in 2015, 42 in 2016).
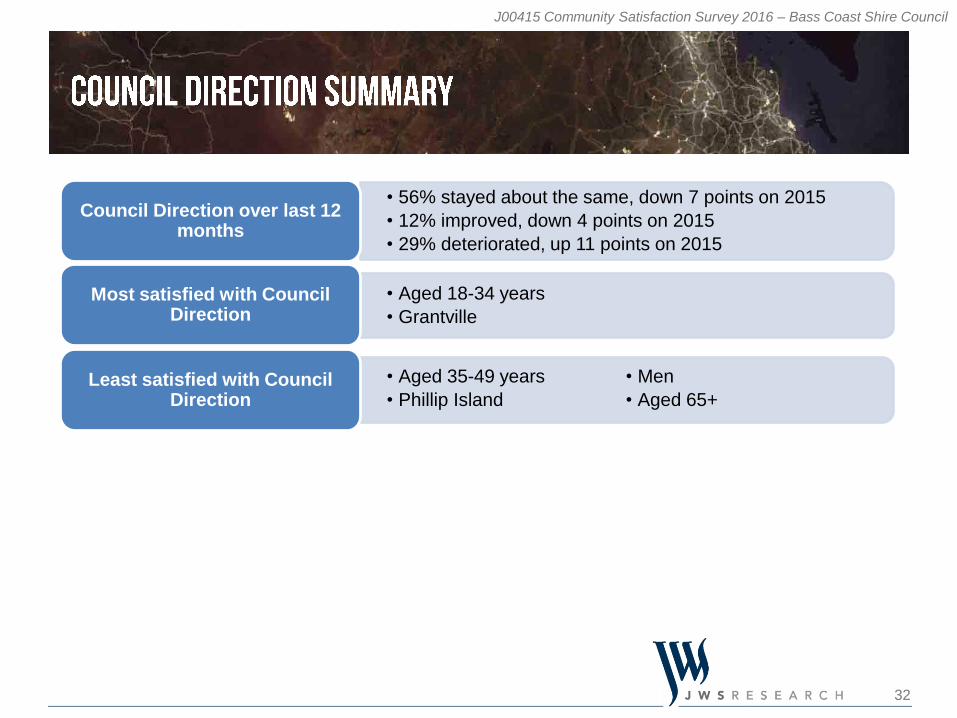
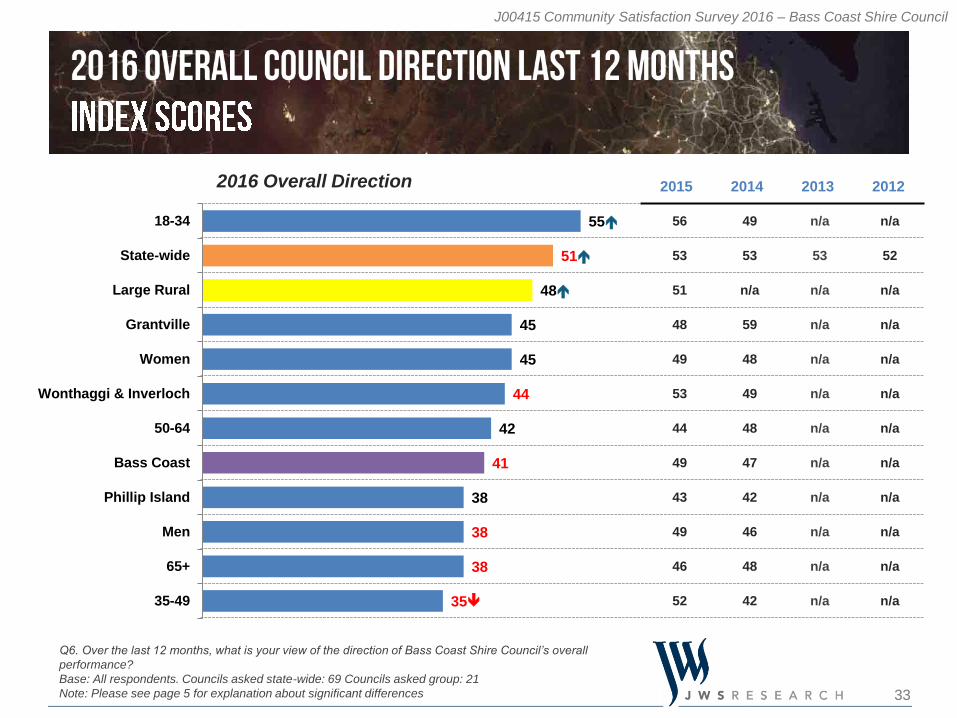
The largest decline in ratings occurred on Overall Council Direction, which dropped
eight points from 2015 to 2016 (49 to 41). This reflects a six point difference from
2014 scores (47).
Ratings on Council Direction have decreased across demographic groups, with
the worst declines among men (38, -11 from 2015), residents aged 65+ (38, -8
from 2015), and residents aged 35 to 49 (35, -17 from 2015). In this case,
concerns about Council performance span the age spectrum.
12
J00415 Community Satisfaction Survey 2016 – Bass Coast Shire Council
While ratings declined in other areas over the course of the past two years, index
scores for the condition of Sealed Local Roads have been on the upswing,
increasing by eight points in the past two years (33 in 2014, 36 in 2015, and 41 in
2016).
Ratings on this measure are more in line with the average (44) for other Large
Rural Shires than on other measures, though they remain 13 points behind the
State-wide average (54).
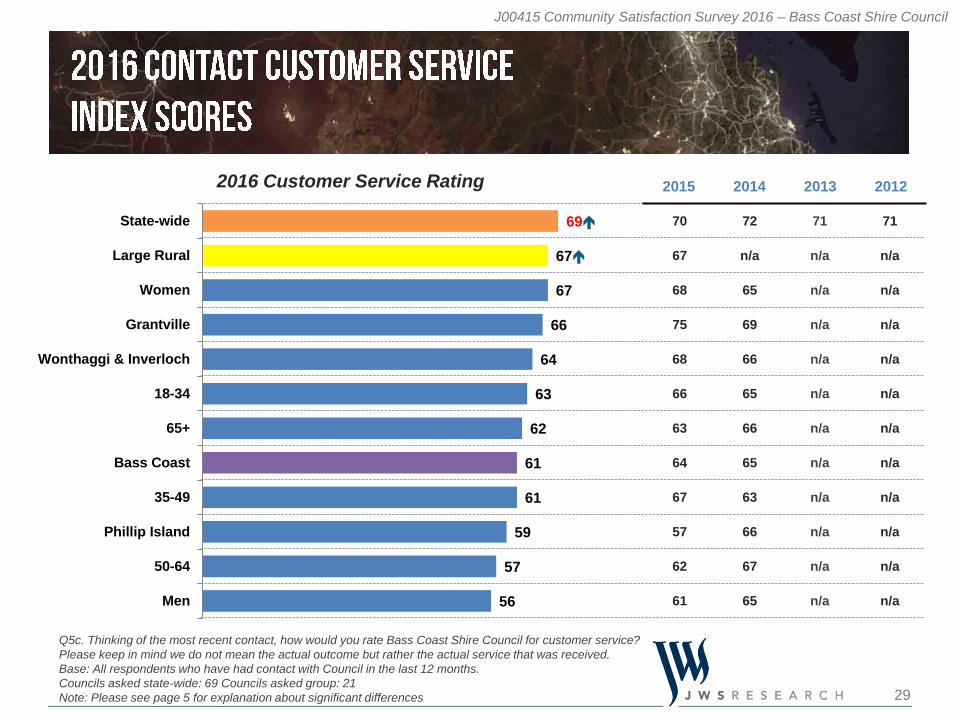
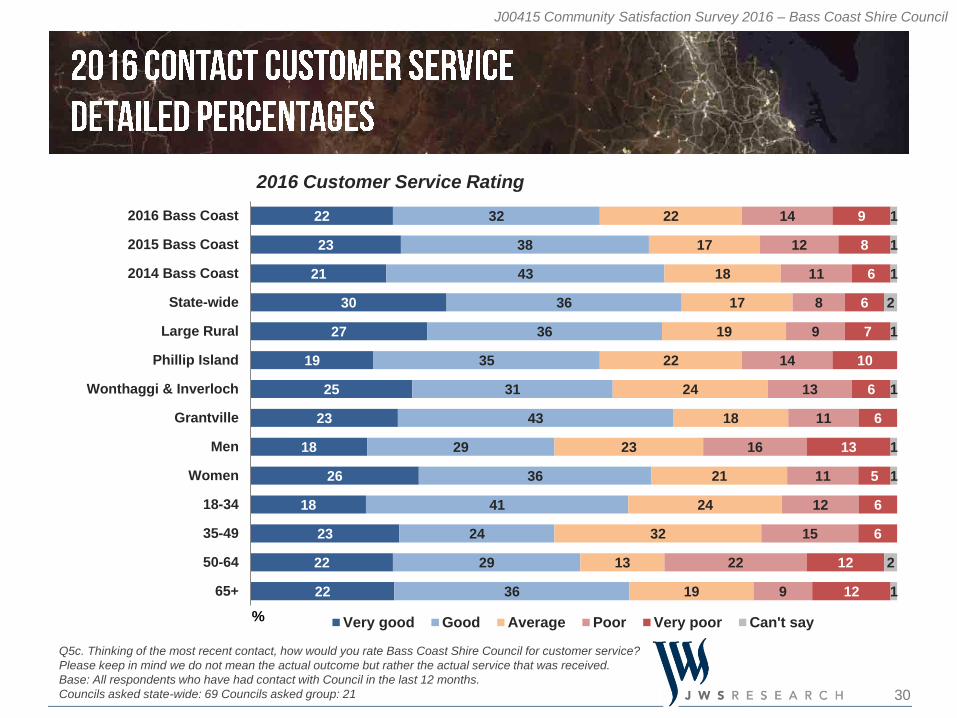
Customer Service is the area where Bass Coast continues to perform most
strongly (index score of 61). One in five (22%) rate Council’s Customer Service as
‘very good’, with a further 33% rating Customer Service as ‘good’.
Women (index score of 67) and Grantville residents (66) have had the most
positive customer service interactions.
Conversely, men (56) and 50 to 64 year olds (57) have had the least positive
customer service interactions. Further, residents aged 50 to 64 years were one
of the groups who had most contact with Council in the preceding year.
13
J00415 Community Satisfaction Survey 2016 – Bass Coast Shire Council
Bass Coast Shire Council should pay extra attention to areas and cohorts where it is
underperforming in comparison with other areas and cohorts (men, residents over
the age of 50, and Phillip Island residents).
An approach we recommend is to further mine the survey data to better understand
the profile of these over and under-performing demographic groups. This can be
achieved via additional consultation and data interrogation, or self-mining the SPSS
data provided or via the dashboard portal available to the council.
A complimentary personal briefing by senior JWS Research representatives is
also available to assist in providing both explanation and interpretation of the
results. Please contact JWS Research on 03 8685 8555.
14
J00415 Community Satisfaction Survey 2016 – Bass Coast Shire Council
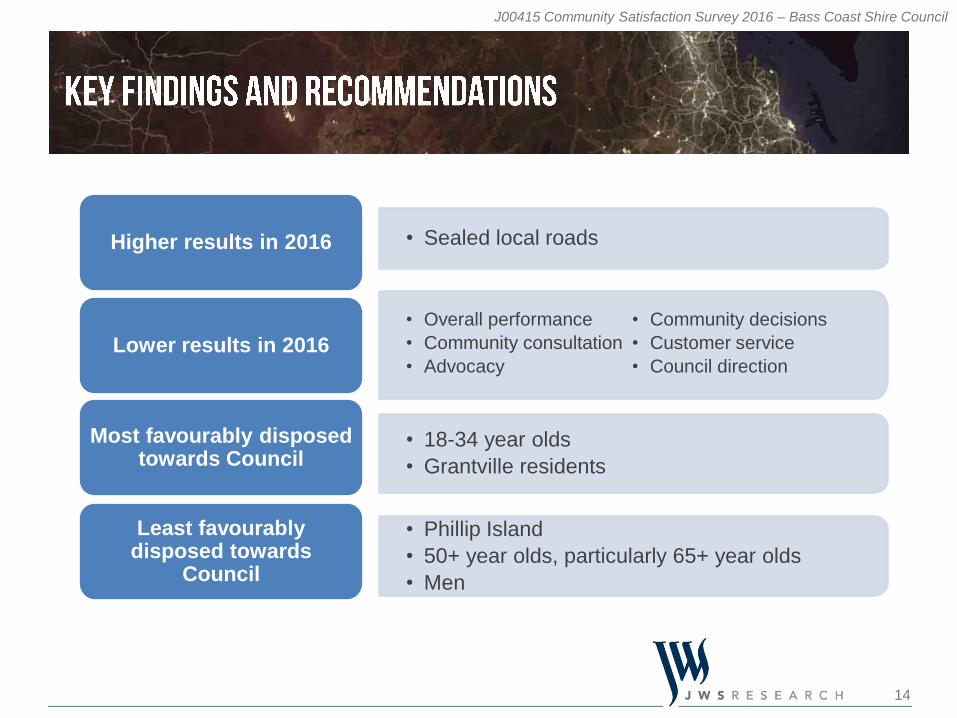
Higher results in 2016
Lower results in 2016
Most favourably disposed towards Council
Least favourably disposed towards
Council
• Sealed local roads
• Overall performance
• Community consultation
• Advocacy
• Community decisions
• Customer service
• Council direction
• 18-34 year olds
• Grantville residents
• Phillip Island
• 50+ year olds, particularly 65+ year olds
• Men
16
J00415 Community Satisfaction Survey 2016 – Bass Coast Shire Council
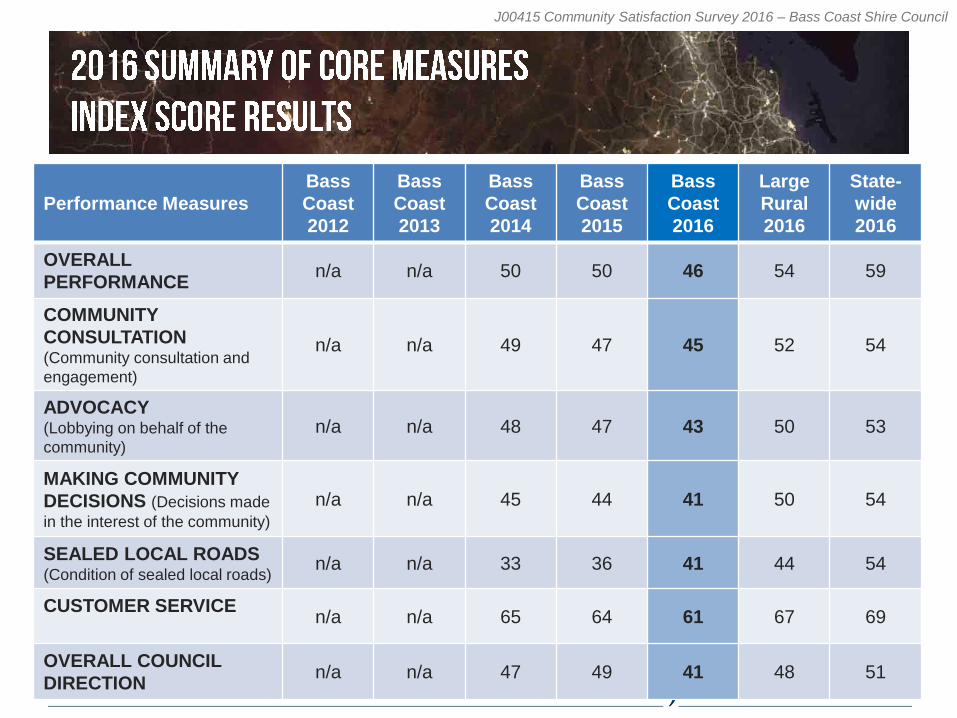
Performance Measures
Bass
Coast
2012
Bass
Coast
2013
Bass
Coast
2014
Bass
Coast
2015
Bass
Coast
2016
Large
Rural
2016
State-
wide
2016
OVERALL
PERFORMANCEn/a n/a 50 50 46 54 59
COMMUNITY
CONSULTATION(Community consultation and
engagement)
n/a n/a 49 47 45 52 54
ADVOCACY(Lobbying on behalf of the
community)
n/a n/a 48 47 43 50 53
MAKING COMMUNITY
DECISIONS (Decisions made
in the interest of the community)
n/a n/a 45 44 41 50 54
SEALED LOCAL ROADS (Condition of sealed local roads)
n/a n/a 33 36 41 44 54
CUSTOMER SERVICEn/a n/a 65 64 61 67 69
OVERALL COUNCIL
DIRECTIONn/a n/a 47 49 41 48 51
17
J00415 Community Satisfaction Survey 2016 – Bass Coast Shire Council
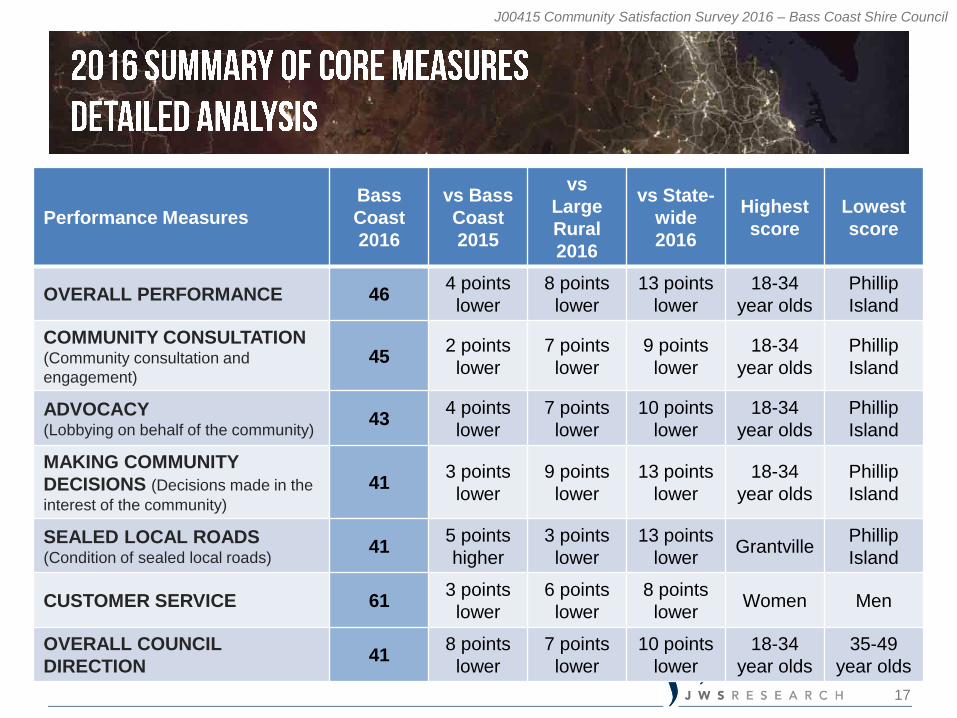
Performance Measures
Bass
Coast
2016
vs Bass
Coast
2015
vs
Large
Rural
2016
vs State-
wide
2016
Highest
score
Lowest
score
OVERALL PERFORMANCE 464 points
lower
8 points
lower
13 points
lower
18-34
year olds
Phillip
Island
COMMUNITY CONSULTATION(Community consultation and
engagement)
452 points
lower
7 points
lower
9 points
lower
18-34
year olds
Phillip
Island
ADVOCACY(Lobbying on behalf of the community)
434 points
lower
7 points
lower
10 points
lower
18-34
year olds
Phillip
Island
MAKING COMMUNITY
DECISIONS (Decisions made in the
interest of the community)
413 points
lower
9 points
lower
13 points
lower
18-34
year olds
Phillip
Island
SEALED LOCAL ROADS (Condition of sealed local roads)
415 points
higher
3 points
lower
13 points
lowerGrantville
Phillip
Island
CUSTOMER SERVICE 613 points
lower
6 points
lower
8 points
lowerWomen Men
OVERALL COUNCIL
DIRECTION41
8 points
lower
7 points
lower
10 points
lower
18-34
year olds
35-49
year olds
18
J00415 Community Satisfaction Survey 2016 – Bass Coast Shire Council
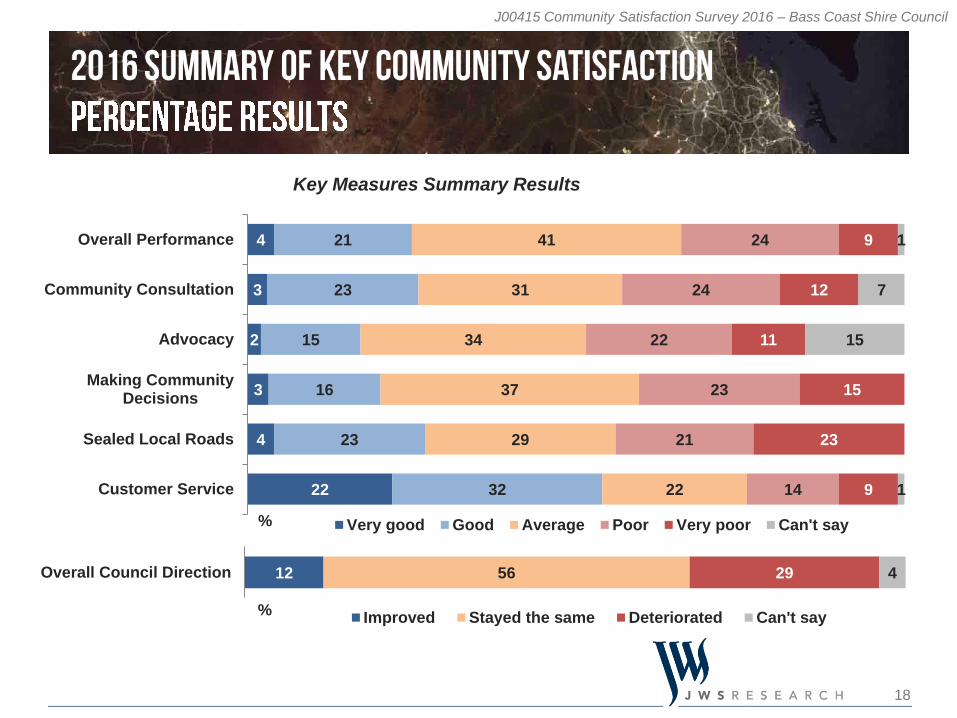
4
3
2
3
4
22
21
23
15
16
23
32
41
31
34
37
29
22
24
24
22
23
21
14
9
12
11
15
23
9
1
7
15
1
Overall Performance
Community Consultation
Advocacy
Making CommunityDecisions
Sealed Local Roads
Customer Service
% Very good Good Average Poor Very poor Can't say
Key Measures Summary Results
12 56 29 4Overall Council Direction
%Improved Stayed the same Deteriorated Can't say
19
J00415 Community Satisfaction Survey 2016 – Bass Coast Shire Council
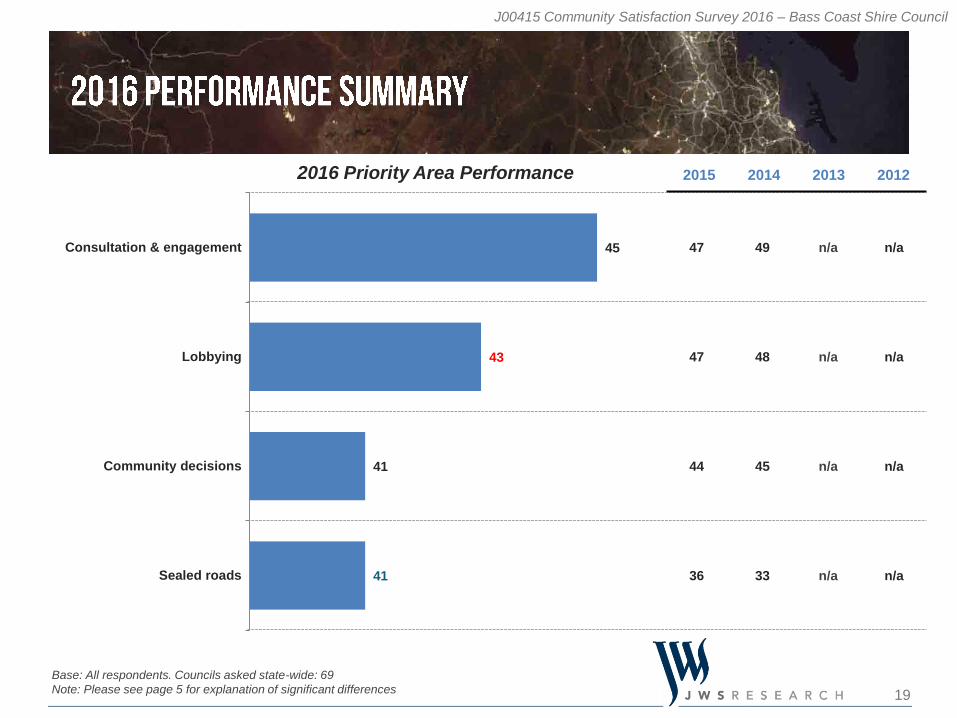
47
47
44
36
49
48
45
33
n/a
n/a
n/a
n/a
n/a
n/a
n/a
n/a
2015 2014 2013 2012
45
43
41
41
Consultation & engagement
Lobbying
Community decisions
Sealed roads
Base: All respondents. Councils asked state-wide: 69
Note: Please see page 5 for explanation of significant differences
2016 Priority Area Performance
20
J00415 Community Satisfaction Survey 2016 – Bass Coast Shire Council
Sig
nif
ica
ntl
y h
igh
er
tha
n s
tate
-wid
e
ave
rag
e
Sig
nific
an
tly lo
we
r tha
n s
tate
-wid
e
ave
rag
e
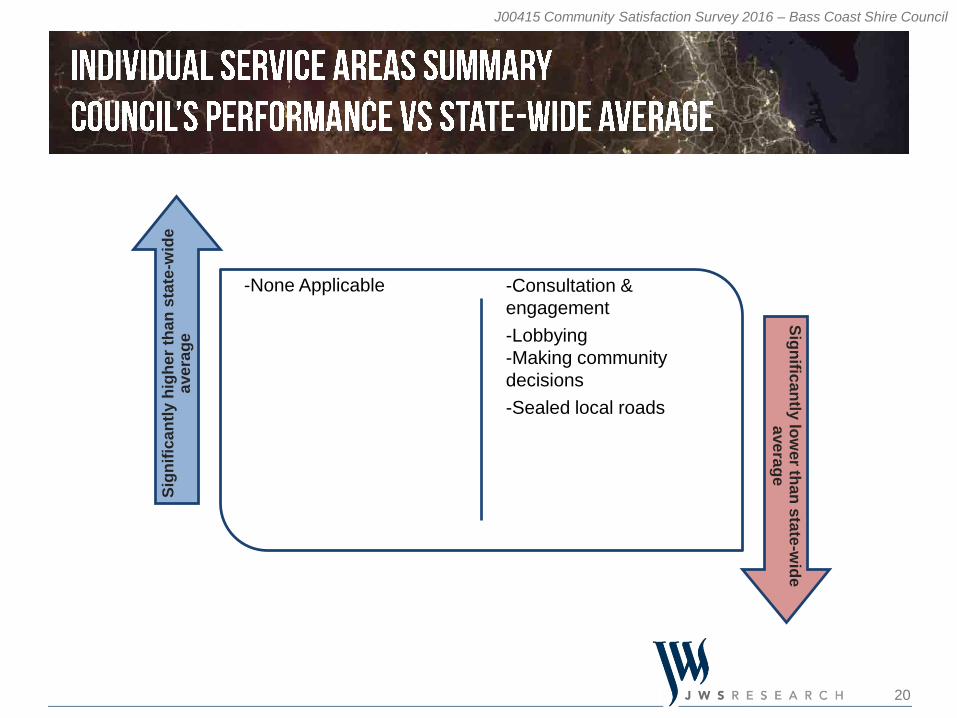
-None Applicable -Consultation &
engagement
-Lobbying
-Making community
decisions
-Sealed local roads
21
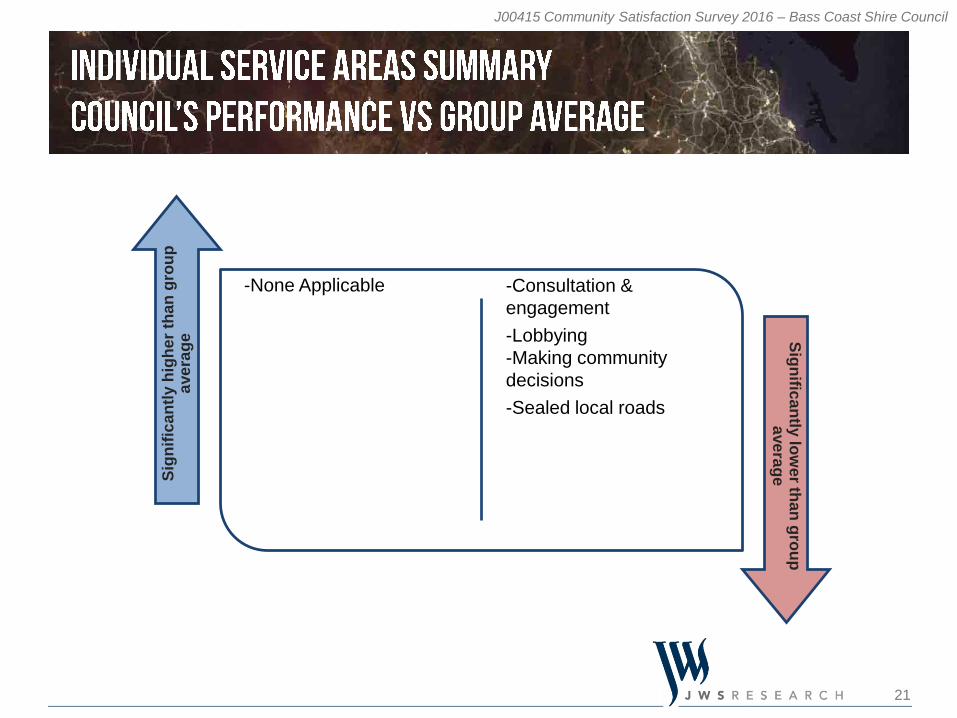
J00415 Community Satisfaction Survey 2016 – Bass Coast Shire Council
Sig
nif
ica
ntl
y h
igh
er
tha
n g
rou
p
ave
rag
e Sig
nific
an
tly lo
we
r tha
n g
rou
p
ave
rag
e
-None Applicable -Consultation &
engagement
-Lobbying
-Making community
decisions
-Sealed local roads
24
J00415 Community Satisfaction Survey 2016 – Bass Coast Shire Council
2016 Overall Performance
Q3. ON BALANCE, for the last twelve months, how do you feel about the performance of Bass Coast Shire
Council, not just on one or two issues, BUT OVERALL across all responsibility areas? Has it been very good,
good, average, poor or very poor?
Base: All respondents. Councils asked state-wide: 69 Councils asked group: 21
Note: Please see page 5 for explanation about significant differences
60
59
56
54
57
53
50
49
48
44
49
36
61
54
n/a
57
54
49
50
47
51
48
52
43
60
n/a
n/a
n/a
n/a
n/a
n/a
n/a
n/a
n/a
n/a
n/a
60
n/a
n/a
n/a
n/a
n/a
n/a
n/a
n/a
n/a
n/a
n/a
2015 2014 2013 2012
59
59
54
53
51
49
46
45
44
42
42
39
State-wide
18-34
Large Rural
Grantville
Wonthaggi & Inverloch
Women
Bass Coast
35-49
Men
50-64
65+
Phillip Island
25
J00415 Community Satisfaction Survey 2016 – Bass Coast Shire Council
Q3. ON BALANCE, for the last twelve months, how do you feel about the performance of Bass Coast Shire
Council, not just on one or two issues, BUT OVERALL across all responsibility areas? Has it been very good,
good, average, poor or very poor?
Base: All respondents. Councils asked state-wide: 69 Councils asked group: 21
4
5
4
9
7
1
4
11
3
4
9
2
1
3
21
26
26
36
30
15
27
22
18
23
35
21
17
15
41
43
44
36
41
35
43
41
40
42
44
39
42
40
24
16
18
11
15
35
18
14
27
21
9
29
25
29
9
9
7
5
7
13
6
10
11
8
3
9
14
11
1
1
1
2
1
1
1
1
1
1
2
2016 Bass Coast
2015 Bass Coast
2014 Bass Coast
State-wide
Large Rural
Phillip Island
Wonthaggi & Inverloch
Grantville
Men
Women
18-34
35-49
50-64
65+
% Very good Good Average Poor Very poor Can't say
2016 Overall Performance
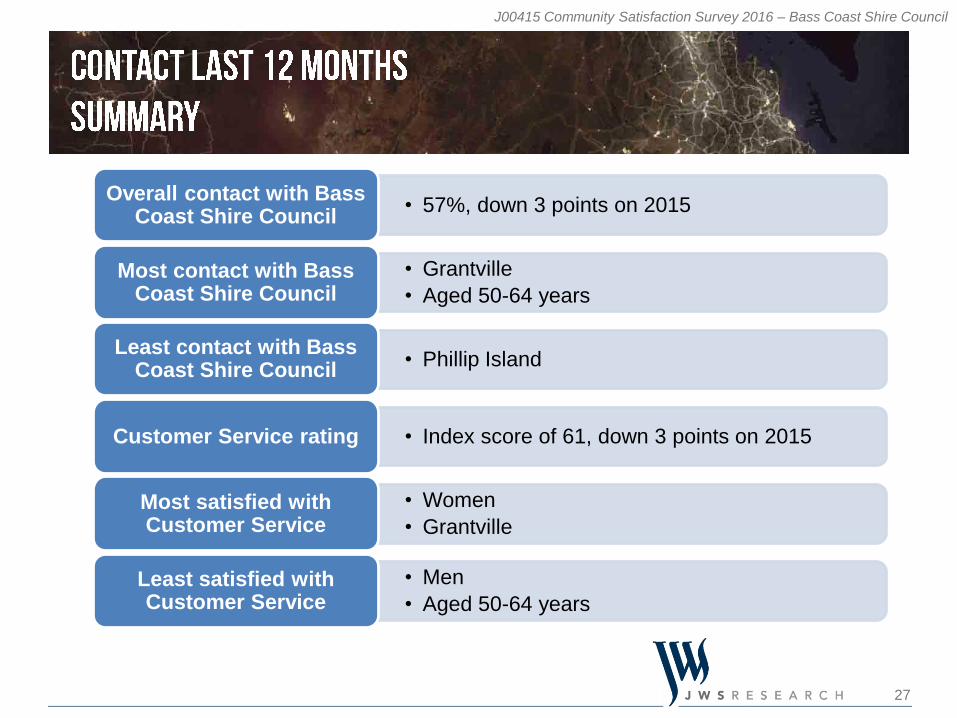
27
J00415 Community Satisfaction Survey 2016 – Bass Coast Shire Council
• 57%, down 3 points on 2015 Overall contact with Bass
Coast Shire Council
• Grantville
• Aged 50-64 years
Most contact with Bass Coast Shire Council
• Phillip IslandLeast contact with Bass
Coast Shire Council
• Index score of 61, down 3 points on 2015 Customer Service rating
• Women
• Grantville
Most satisfied with Customer Service
• Men
• Aged 50-64 years
Least satisfied with Customer Service
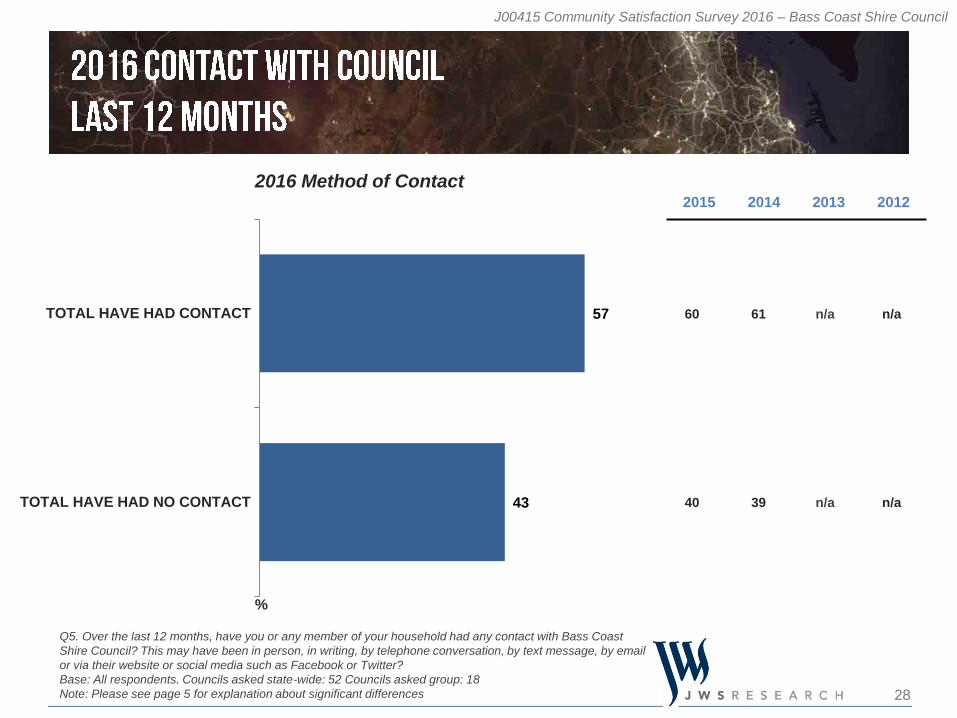
28
J00415 Community Satisfaction Survey 2016 – Bass Coast Shire Council
60
40
61
39
n/a
n/a
n/a
n/a
57
43
TOTAL HAVE HAD CONTACT
TOTAL HAVE HAD NO CONTACT
2015 2014 2013 2012
Q5. Over the last 12 months, have you or any member of your household had any contact with Bass Coast
Shire Council? This may have been in person, in writing, by telephone conversation, by text message, by email
or via their website or social media such as Facebook or Twitter?
Base: All respondents. Councils asked state-wide: 52 Councils asked group: 18
Note: Please see page 5 for explanation about significant differences
2016 Method of Contact
%
29
J00415 Community Satisfaction Survey 2016 – Bass Coast Shire Council
70
67
68
75
68
66
63
64
67
57
62
61
72
n/a
65
69
66
65
66
65
63
66
67
65
71
n/a
n/a
n/a
n/a
n/a
n/a
n/a
n/a
n/a
n/a
n/a
71
n/a
n/a
n/a
n/a
n/a
n/a
n/a
n/a
n/a
n/a
n/a
69
67
67
66
64
63
62
61
61
59
57
56
State-wide
Large Rural
Women
Grantville
Wonthaggi & Inverloch
18-34
65+
Bass Coast
35-49
Phillip Island
50-64
Men
Q5c. Thinking of the most recent contact, how would you rate Bass Coast Shire Council for customer service?
Please keep in mind we do not mean the actual outcome but rather the actual service that was received.
Base: All respondents who have had contact with Council in the last 12 months.
Councils asked state-wide: 69 Councils asked group: 21
Note: Please see page 5 for explanation about significant differences
2016 Customer Service Rating 2015 2014 2013 2012
30
J00415 Community Satisfaction Survey 2016 – Bass Coast Shire Council
22
23
21
30
27
19
25
23
18
26
18
23
22
22
32
38
43
36
36
35
31
43
29
36
41
24
29
36
22
17
18
17
19
22
24
18
23
21
24
32
13
19
14
12
11
8
9
14
13
11
16
11
12
15
22
9
9
8
6
6
7
10
6
6
13
5
6
6
12
12
1
1
1
2
1
1
1
1
2
1
2016 Bass Coast
2015 Bass Coast
2014 Bass Coast
State-wide
Large Rural
Phillip Island
Wonthaggi & Inverloch
Grantville
Men
Women
18-34
35-49
50-64
65+
% Very good Good Average Poor Very poor Can't say
Q5c. Thinking of the most recent contact, how would you rate Bass Coast Shire Council for customer service?
Please keep in mind we do not mean the actual outcome but rather the actual service that was received.
Base: All respondents who have had contact with Council in the last 12 months.
Councils asked state-wide: 69 Councils asked group: 21
2016 Customer Service Rating
32
J00415 Community Satisfaction Survey 2016 – Bass Coast Shire Council
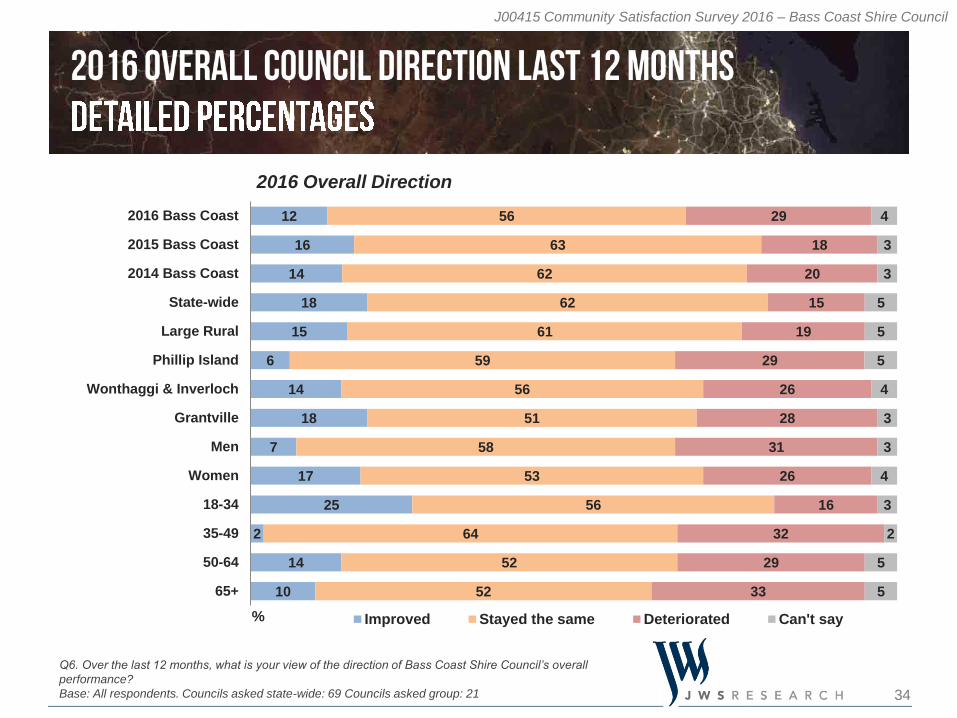
• 56% stayed about the same, down 7 points on 2015
• 12% improved, down 4 points on 2015
• 29% deteriorated, up 11 points on 2015
Council Direction over last 12 months
• Aged 18-34 years
• Grantville
Most satisfied with Council Direction
• Aged 35-49 years
• Phillip Island
• Men
• Aged 65+Least satisfied with Council
Direction
33
J00415 Community Satisfaction Survey 2016 – Bass Coast Shire Council
56
53
51
48
49
53
44
49
43
49
46
52
49
53
n/a
59
48
49
48
47
42
46
48
42
n/a
53
n/a
n/a
n/a
n/a
n/a
n/a
n/a
n/a
n/a
n/a
n/a
52
n/a
n/a
n/a
n/a
n/a
n/a
n/a
n/a
n/a
n/a
55
51
48
45
45
44
42
41
38
38
38
35
18-34
State-wide
Large Rural
Grantville
Women
Wonthaggi & Inverloch
50-64
Bass Coast
Phillip Island
Men
65+
35-49
Q6. Over the last 12 months, what is your view of the direction of Bass Coast Shire Council’s overall
performance?
Base: All respondents. Councils asked state-wide: 69 Councils asked group: 21
Note: Please see page 5 for explanation about significant differences
2016 Overall Direction 2015 2014 2013 2012
34
J00415 Community Satisfaction Survey 2016 – Bass Coast Shire Council
12
16
14
18
15
6
14
18
7
17
25
2
14
10
56
63
62
62
61
59
56
51
58
53
56
64
52
52
29
18
20
15
19
29
26
28
31
26
16
32
29
33
4
3
3
5
5
5
4
3
3
4
3
2
5
5
2016 Bass Coast
2015 Bass Coast
2014 Bass Coast
State-wide
Large Rural
Phillip Island
Wonthaggi & Inverloch
Grantville
Men
Women
18-34
35-49
50-64
65+
% Improved Stayed the same Deteriorated Can't say
Q6. Over the last 12 months, what is your view of the direction of Bass Coast Shire Council’s overall
performance?
Base: All respondents. Councils asked state-wide: 69 Councils asked group: 21
2016 Overall Direction
36
J00415 Community Satisfaction Survey 2016 – Bass Coast Shire Council
56
54
53
50
55
49
47
41
44
48
45
43
57
n/a
53
50
48
48
49
47
50
46
50
48
57
n/a
n/a
n/a
n/a
n/a
n/a
n/a
n/a
n/a
n/a
n/a
57
n/a
n/a
n/a
n/a
n/a
n/a
n/a
n/a
n/a
n/a
n/a
54
52
52
50
46
46
45
44
43
43
42
37
State-wide
Large Rural
18-34
Wonthaggi & Inverloch
Grantville
Women
Bass Coast
50-64
Men
35-49
65+
Phillip Island
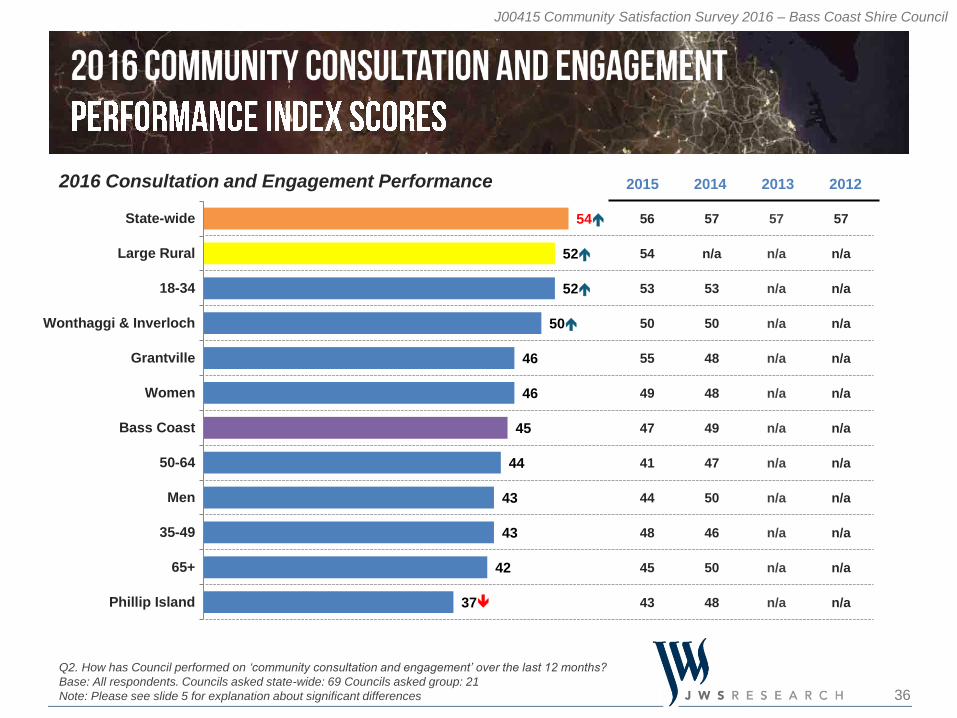
Q2. How has Council performed on ‘community consultation and engagement’ over the last 12 months?
Base: All respondents. Councils asked state-wide: 69 Councils asked group: 21
Note: Please see slide 5 for explanation about significant differences
2016 Consultation and Engagement Performance 2015 2014 2013 2012
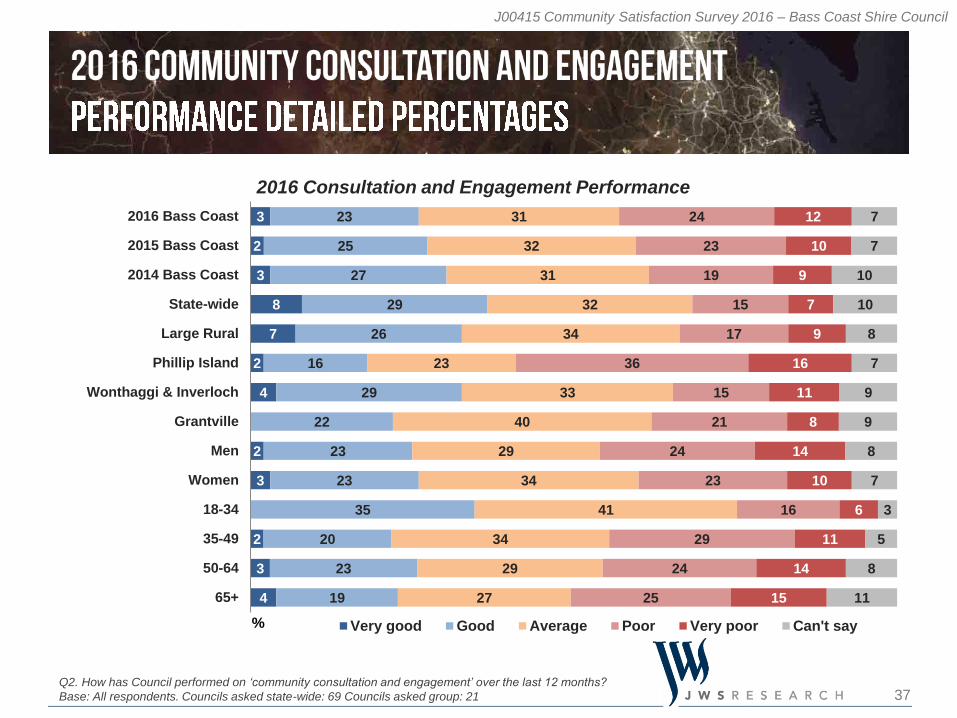
37
J00415 Community Satisfaction Survey 2016 – Bass Coast Shire Council
3
2
3
8
7
2
4
2
3
2
3
4
23
25
27
29
26
16
29
22
23
23
35
20
23
19
31
32
31
32
34
23
33
40
29
34
41
34
29
27
24
23
19
15
17
36
15
21
24
23
16
29
24
25
12
10
9
7
9
16
11
8
14
10
6
11
14
15
7
7
10
10
8
7
9
9
8
7
3
5
8
11
2016 Bass Coast
2015 Bass Coast
2014 Bass Coast
State-wide
Large Rural
Phillip Island
Wonthaggi & Inverloch
Grantville
Men
Women
18-34
35-49
50-64
65+
% Very good Good Average Poor Very poor Can't say
Q2. How has Council performed on ‘community consultation and engagement’ over the last 12 months?
Base: All respondents. Councils asked state-wide: 69 Councils asked group: 21
2016 Consultation and Engagement Performance
38
J00415 Community Satisfaction Survey 2016 – Bass Coast Shire Council
55
55
53
52
53
49
47
47
45
39
46
36
56
53
n/a
51
55
47
48
48
48
46
44
40
55
n/a
n/a
n/a
n/a
n/a
n/a
n/a
n/a
n/a
n/a
n/a
55
n/a
n/a
n/a
n/a
n/a
n/a
n/a
n/a
n/a
n/a
n/a
53
51
50
48
47
45
43
42
41
40
39
37
State-wide
18-34
Large Rural
Wonthaggi & Inverloch
Grantville
Women
Bass Coast
65+
Men
50-64
35-49
Phillip Island
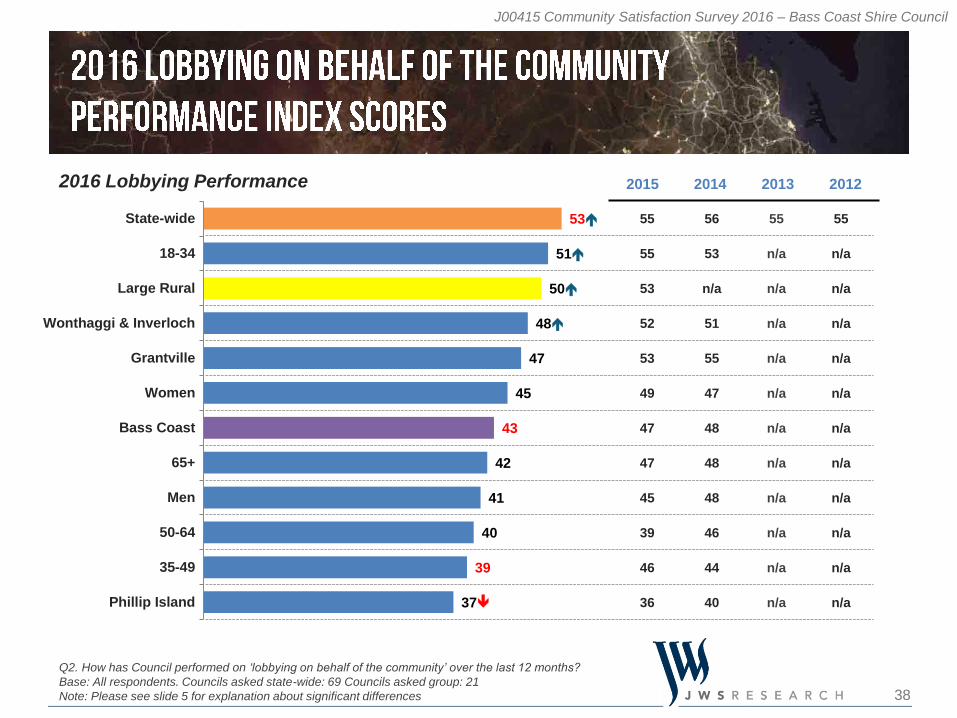
Q2. How has Council performed on ‘lobbying on behalf of the community’ over the last 12 months?
Base: All respondents. Councils asked state-wide: 69 Councils asked group: 21
Note: Please see slide 5 for explanation about significant differences
2016 Lobbying Performance 2015 2014 2013 2012
39
J00415 Community Satisfaction Survey 2016 – Bass Coast Shire Council
2
3
3
5
5
2
11
2
3
6
2
2
15
21
19
23
21
11
20
9
13
17
22
16
9
14
34
33
30
31
33
34
36
30
36
33
37
30
43
31
22
21
21
13
15
30
16
21
21
23
19
30
17
21
11
8
6
5
7
15
8
10
14
8
6
14
12
11
15
15
21
22
20
10
18
19
14
16
9
7
19
21
2016 Bass Coast
2015 Bass Coast
2014 Bass Coast
State-wide
Large Rural
Phillip Island
Wonthaggi & Inverloch
Grantville
Men
Women
18-34
35-49
50-64
65+
% Very good Good Average Poor Very poor Can't say
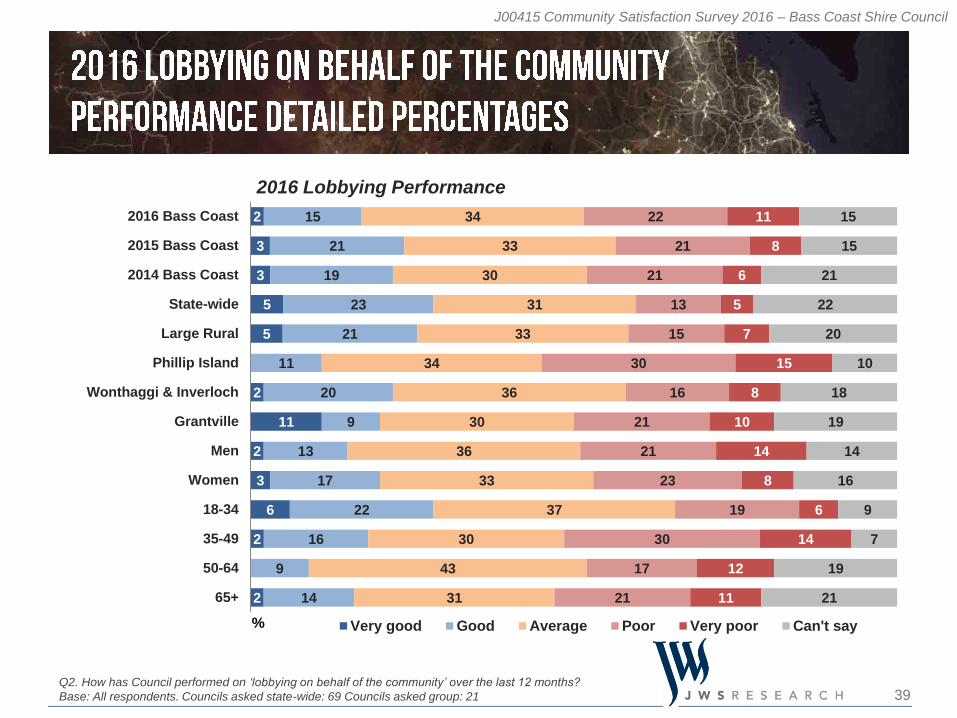
Q2. How has Council performed on ‘lobbying on behalf of the community’ over the last 12 months?
Base: All respondents. Councils asked state-wide: 69 Councils asked group: 21
2016 Lobbying Performance
40
J00415 Community Satisfaction Survey 2016 – Bass Coast Shire Council
55
57
52
50
49
45
44
42
43
38
41
33
57
46
n/a
51
48
45
45
45
44
44
47
40
n/a
n/a
n/a
n/a
n/a
n/a
n/a
n/a
n/a
n/a
n/a
n/a
n/a
n/a
n/a
n/a
n/a
n/a
n/a
n/a
n/a
n/a
n/a
n/a
54
53
50
48
47
42
41
41
41
39
37
33
State-wide
18-34
Large Rural
Grantville
Wonthaggi & Inverloch
Women
Bass Coast
Men
35-49
50-64
65+
Phillip Island
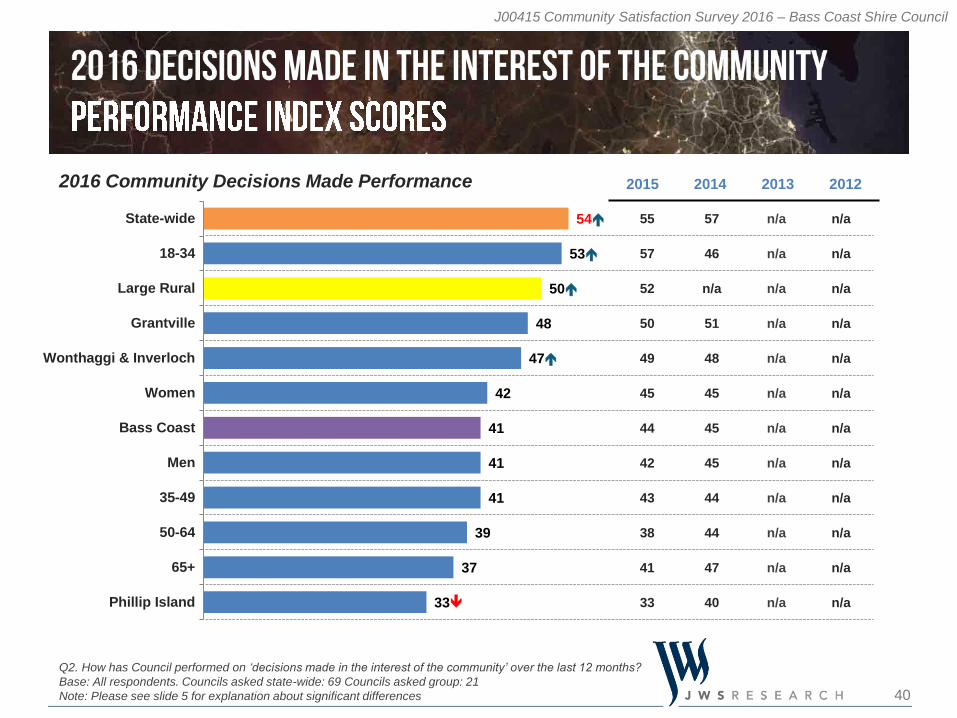
Q2. How has Council performed on ‘decisions made in the interest of the community’ over the last 12 months?
Base: All respondents. Councils asked state-wide: 69 Councils asked group: 21
Note: Please see slide 5 for explanation about significant differences
2016 Community Decisions Made Performance 2015 2014 2013 2012
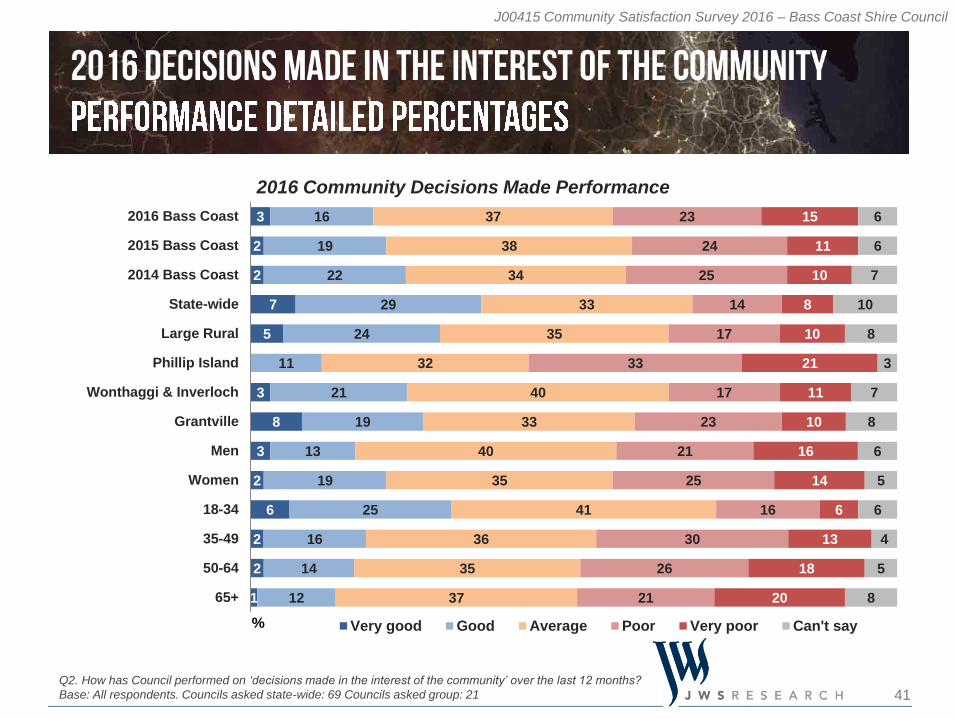
41
J00415 Community Satisfaction Survey 2016 – Bass Coast Shire Council
3
2
2
7
5
3
8
3
2
6
2
2
1
16
19
22
29
24
11
21
19
13
19
25
16
14
12
37
38
34
33
35
32
40
33
40
35
41
36
35
37
23
24
25
14
17
33
17
23
21
25
16
30
26
21
15
11
10
8
10
21
11
10
16
14
6
13
18
20
6
6
7
10
8
3
7
8
6
5
6
4
5
8
2016 Bass Coast
2015 Bass Coast
2014 Bass Coast
State-wide
Large Rural
Phillip Island
Wonthaggi & Inverloch
Grantville
Men
Women
18-34
35-49
50-64
65+
% Very good Good Average Poor Very poor Can't say
Q2. How has Council performed on ‘decisions made in the interest of the community’ over the last 12 months?
Base: All respondents. Councils asked state-wide: 69 Councils asked group: 21
2016 Community Decisions Made Performance
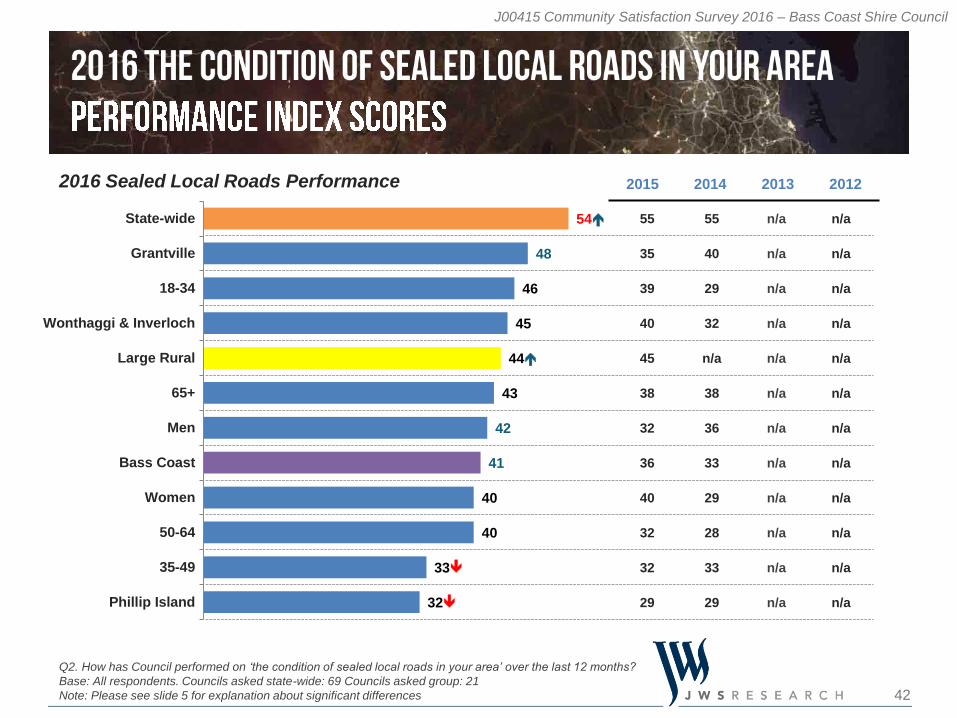
42
J00415 Community Satisfaction Survey 2016 – Bass Coast Shire Council
55
35
39
40
45
38
32
36
40
32
32
29
55
40
29
32
n/a
38
36
33
29
28
33
29
n/a
n/a
n/a
n/a
n/a
n/a
n/a
n/a
n/a
n/a
n/a
n/a
n/a
n/a
n/a
n/a
n/a
n/a
n/a
n/a
n/a
n/a
n/a
n/a
54
48
46
45
44
43
42
41
40
40
33
32
State-wide
Grantville
18-34
Wonthaggi & Inverloch
Large Rural
65+
Men
Bass Coast
Women
50-64
35-49
Phillip Island
Q2. How has Council performed on ‘the condition of sealed local roads in your area’ over the last 12 months?
Base: All respondents. Councils asked state-wide: 69 Councils asked group: 21
Note: Please see slide 5 for explanation about significant differences
2016 Sealed Local Roads Performance 2015 2014 2013 2012
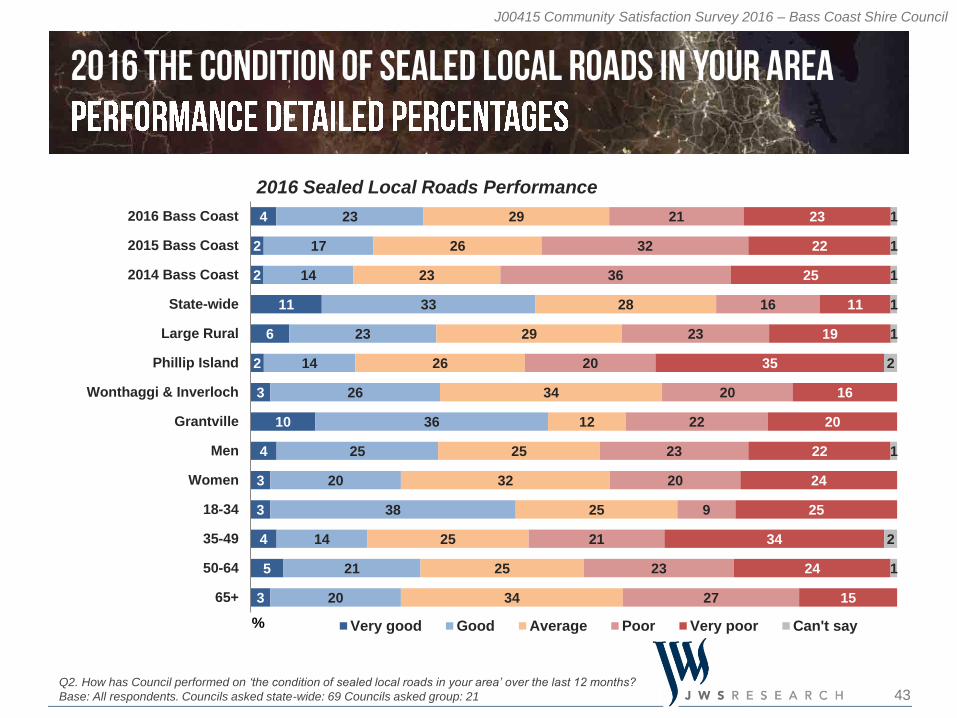
43
J00415 Community Satisfaction Survey 2016 – Bass Coast Shire Council
4
2
2
11
6
2
3
10
4
3
3
4
5
3
23
17
14
33
23
14
26
36
25
20
38
14
21
20
29
26
23
28
29
26
34
12
25
32
25
25
25
34
21
32
36
16
23
20
20
22
23
20
9
21
23
27
23
22
25
11
19
35
16
20
22
24
25
34
24
15
1
1
1
1
1
2
1
2
1
2016 Bass Coast
2015 Bass Coast
2014 Bass Coast
State-wide
Large Rural
Phillip Island
Wonthaggi & Inverloch
Grantville
Men
Women
18-34
35-49
50-64
65+
% Very good Good Average Poor Very poor Can't say
Q2. How has Council performed on ‘the condition of sealed local roads in your area’ over the last 12 months?
Base: All respondents. Councils asked state-wide: 69 Councils asked group: 21
2016 Sealed Local Roads Performance

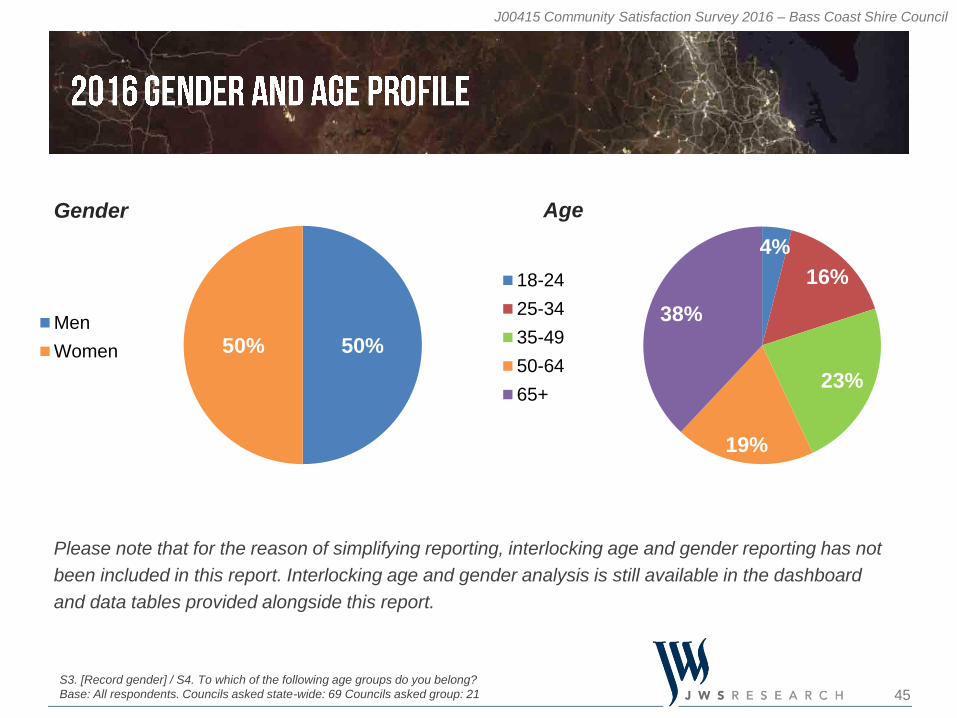
45
J00415 Community Satisfaction Survey 2016 – Bass Coast Shire Council
50%50%Men
Women
4%
16%
23%
19%
38%
18-24
25-34
35-49
50-64
65+
Please note that for the reason of simplifying reporting, interlocking age and gender reporting has not
been included in this report. Interlocking age and gender analysis is still available in the dashboard
and data tables provided alongside this report.
S3. [Record gender] / S4. To which of the following age groups do you belong?
Base: All respondents. Councils asked state-wide: 69 Councils asked group: 21
Gender Age


48
J00415 Community Satisfaction Survey 2016 – Bass Coast Shire Council
The survey was revised in 2012. As a result:
The survey is now conducted as a representative random probability survey of residents aged 18
years or over in local councils, whereas previously it was conducted as a ‘head of household’
survey.
As part of the change to a representative resident survey, results are now weighted post survey to
the known population distribution of Bass Coast Shire Council according to the most recently
available Australian Bureau of Statistics population estimates, whereas the results were
previously not weighted.
The service responsibility area performance measures have changed significantly and the rating
scale used to assess performance has also changed.
As such, the results of the 2012 State-wide Local Government Community Satisfaction Survey should
be considered as a benchmark. Please note that comparisons should not be made with the State-wide
Local Government Community Satisfaction Survey results from 2011 and prior due to the
methodological and sampling changes. Comparisons in the period 2012-2016 have been made
throughout this report as appropriate.
49
J00415 Community Satisfaction Survey 2016 – Bass Coast Shire Council
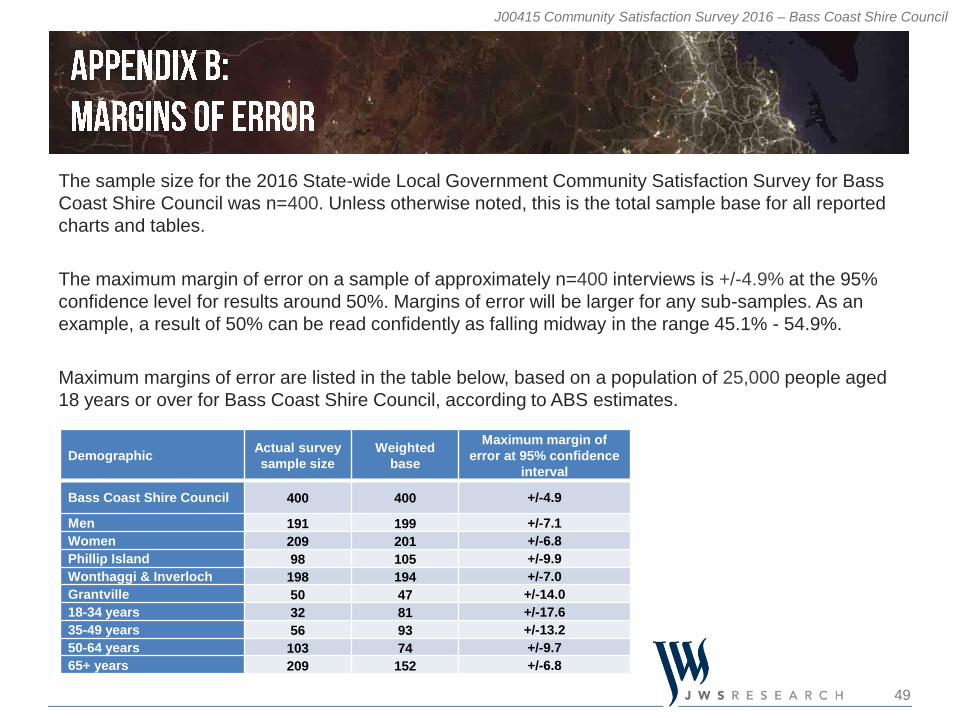
Demographic Actual survey
sample size
Weighted
base
Maximum margin of
error at 95% confidence
interval
Bass Coast Shire Council 400 400 +/-4.9
Men 191 199 +/-7.1
Women 209 201 +/-6.8
Phillip Island 98 105 +/-9.9
Wonthaggi & Inverloch 198 194 +/-7.0
Grantville 50 47 +/-14.0
18-34 years 32 81 +/-17.6
35-49 years 56 93 +/-13.2
50-64 years 103 74 +/-9.7
65+ years 209 152 +/-6.8
The sample size for the 2016 State-wide Local Government Community Satisfaction Survey for Bass
Coast Shire Council was n=400. Unless otherwise noted, this is the total sample base for all reported
charts and tables.
The maximum margin of error on a sample of approximately n=400 interviews is +/-4.9% at the 95%
confidence level for results around 50%. Margins of error will be larger for any sub-samples. As an
example, a result of 50% can be read confidently as falling midway in the range 45.1% - 54.9%.
Maximum margins of error are listed in the table below, based on a population of 25,000 people aged
18 years or over for Bass Coast Shire Council, according to ABS estimates.
50
J00415 Community Satisfaction Survey 2016 – Bass Coast Shire Council
All participating councils are listed in the State-wide report published on the DELWP website. In 2016,
69 of the 79 Councils throughout Victoria participated in this survey. For consistency of analysis and
reporting across all projects, Local Government Victoria has aligned its presentation of data to use
standard council groupings. Accordingly, the council reports for the community satisfaction survey
provide analysis using these standard council groupings. Please note that councils participating across
2012-2016 vary slightly.
Council Groups
Bass Coast Shire Council is classified as a Large Rural council according to the following classification
list:
Metropolitan, Interface, Regional Centres, Large Rural & Small Rural
Councils participating in the Large Rural group are: Bass Coast, Baw Baw, Campaspe, Colac Otway,
Corangamite, East Gippsland, Glenelg, Golden Plains, Horsham, Macedon Ranges, Mitchell, Moira,
Moorabool, Mount Alexander, Moyne, South Gippsland, Southern Grampians, Surf Coast, Swan Hill,
Wangaratta and Wellington.
Wherever appropriate, results for Bass Coast Shire Council for this 2016 State-wide Local Government
Community Satisfaction Survey have been compared against other participating councils in the Large
Rural group and on a state-wide basis. Please note that council groupings changed for 2015, and as
such comparisons to council group results before that time can not be made within the reported charts.
51
J00415 Community Satisfaction Survey 2016 – Bass Coast Shire Council
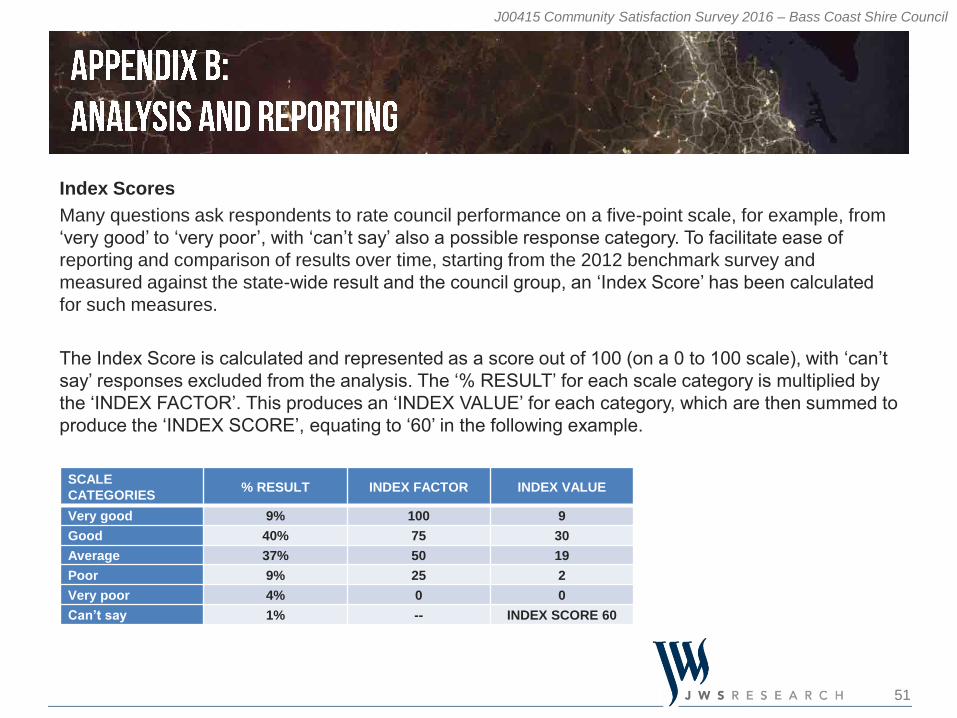
Index Scores
Many questions ask respondents to rate council performance on a five-point scale, for example, from
‘very good’ to ‘very poor’, with ‘can’t say’ also a possible response category. To facilitate ease of
reporting and comparison of results over time, starting from the 2012 benchmark survey and
measured against the state-wide result and the council group, an ‘Index Score’ has been calculated
for such measures.
The Index Score is calculated and represented as a score out of 100 (on a 0 to 100 scale), with ‘can’t
say’ responses excluded from the analysis. The ‘% RESULT’ for each scale category is multiplied by
the ‘INDEX FACTOR’. This produces an ‘INDEX VALUE’ for each category, which are then summed to
produce the ‘INDEX SCORE’, equating to ‘60’ in the following example.
SCALE
CATEGORIES% RESULT INDEX FACTOR INDEX VALUE
Very good 9% 100 9
Good 40% 75 30
Average 37% 50 19
Poor 9% 25 2
Very poor 4% 0 0
Can’t say 1% -- INDEX SCORE 60
52
J00415 Community Satisfaction Survey 2016 – Bass Coast Shire Council
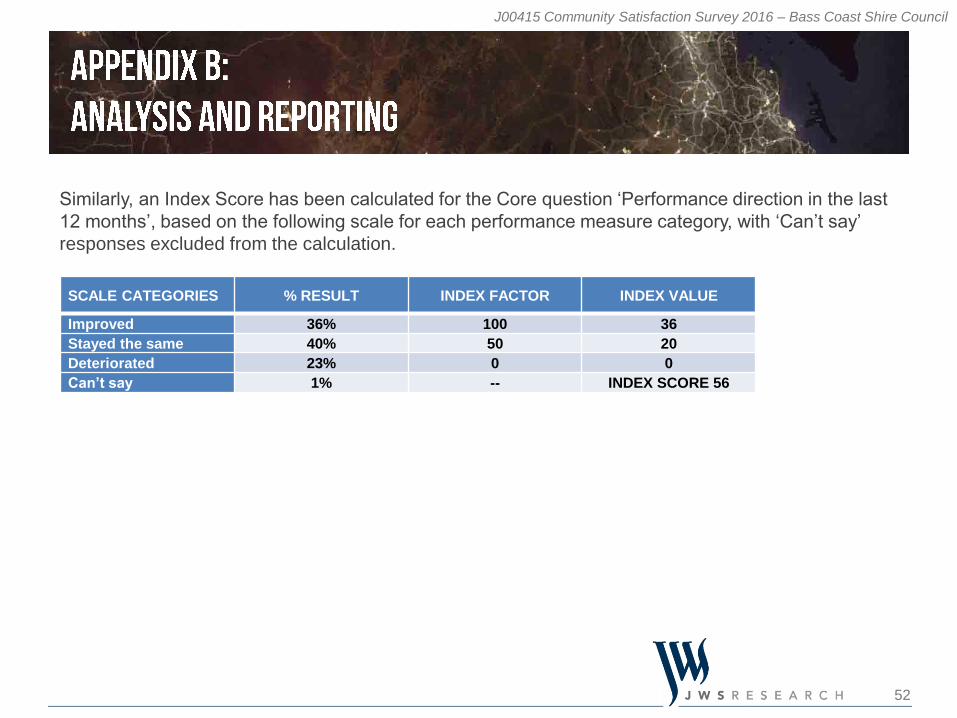
Similarly, an Index Score has been calculated for the Core question ‘Performance direction in the last
12 months’, based on the following scale for each performance measure category, with ‘Can’t say’
responses excluded from the calculation.
SCALE CATEGORIES % RESULT INDEX FACTOR INDEX VALUE
Improved 36% 100 36
Stayed the same 40% 50 20
Deteriorated 23% 0 0
Can’t say 1% -- INDEX SCORE 56
53
J00415 Community Satisfaction Survey 2016 – Bass Coast Shire Council
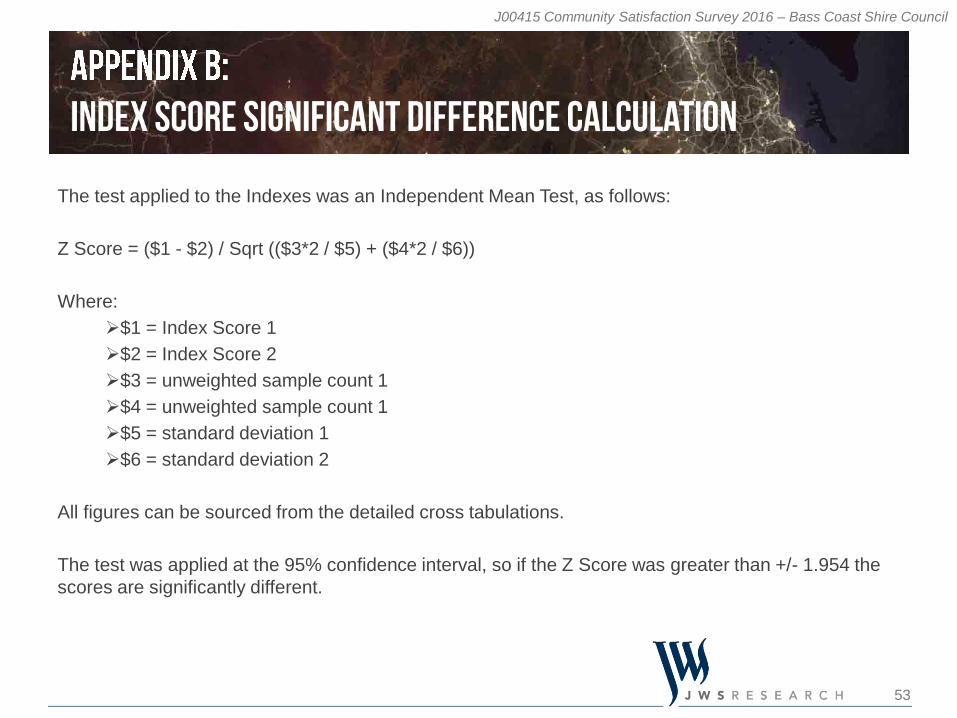
The test applied to the Indexes was an Independent Mean Test, as follows:
Z Score = ($1 - $2) / Sqrt (($3*2 / $5) + ($4*2 / $6))
Where:
$1 = Index Score 1
$2 = Index Score 2
$3 = unweighted sample count 1
$4 = unweighted sample count 1
$5 = standard deviation 1
$6 = standard deviation 2
All figures can be sourced from the detailed cross tabulations.
The test was applied at the 95% confidence interval, so if the Z Score was greater than +/- 1.954 the
scores are significantly different.
54
J00415 Community Satisfaction Survey 2016 – Bass Coast Shire Council
Core, Optional and Tailored Questions
Over and above necessary geographic and demographic questions required to ensure sample representativeness, a base set of questions for the 2016 State-wide Local Government Community Satisfaction Survey was designated as ‘Core’ and therefore compulsory inclusions for all participating Councils.
These core questions comprised:
Overall performance last 12 months (Overall performance)
Lobbying on behalf of community (Advocacy)
Community consultation and engagement (Consultation)
Decisions made in the interest of the community (Making community decisions)
Condition of sealed local roads (Sealed local roads)
Contact in last 12 months (Contact)
Rating of contact (Customer service)
Overall council direction last 12 months (Council direction)
Reporting of results for these core questions can always be compared against other participating councils in the council group and against all participating councils state-wide. Alternatively, some questions in the 2016 State-wide Local Government Community Satisfaction Survey were optional. Councils also had the ability to ask tailored questions specific only to their council.
55
J00415 Community Satisfaction Survey 2016 – Bass Coast Shire Council
Reporting
Every council that participated in the 2016 State-wide Local Government Community Satisfaction
Survey receives a customised report. In addition, the state government is supplied with a state-wide
summary report of the aggregate results of ‘Core’ and ‘Optional’ questions asked across all council
areas surveyed.
Tailored questions commissioned by individual councils are reported only to the commissioning council
and not otherwise shared unless by express written approval of the commissioning council.
The overall State-wide Local Government Community Satisfaction Report is available at
http://www.delwp.vic.gov.au/local-government/strengthening-councils/council-community-satisfaction-
survey.
56
J00415 Community Satisfaction Survey 2016 – Bass Coast Shire Council
Core questions: Compulsory inclusion questions for all councils participating in the CSS.
CSS: 2016 Victorian Local Government Community Satisfaction Survey.
Council group: One of five classified groups, comprising: metropolitan, interface, regional centres, large rural and
small rural.
Council group average: The average result for all participating councils in the council group.
Highest / lowest: The result described is the highest or lowest result across a particular demographic sub-group e.g.
men, for the specific question being reported. Reference to the result for a demographic sub-group being the highest or
lowest does not imply that it is significantly higher or lower, unless this is specifically mentioned.
Index score: A score calculated and represented as a score out of 100 (on a 0 to 100 scale). This score is sometimes
reported as a figure in brackets next to the category being described, e.g. men 50+ (60).
Optional questions: Questions which councils had an option to include or not.
Percentages: Also referred to as ‘detailed results’, meaning the proportion of responses, expressed as a percentage.
Sample: The number of completed interviews, e.g. for a council or within a demographic sub-group.
Significantly higher / lower: The result described is significantly higher or lower than the comparison result based on
a statistical significance test at the 95% confidence limit. If the result referenced is statistically higher or lower then this
will be specifically mentioned, however not all significantly higher or lower results are referenced in summary reporting.
State-wide average: The average result for all participating councils in the State.
Tailored questions: Individual questions tailored by and only reported to the commissioning council.
Weighting: Weighting factors are applied to the sample for each council based on available age and gender
proportions from ABS census information to ensure reported results are proportionate to the actual population of the
council, rather than the achieved survey sample.