jahan, monira (2012) educational influences on student...
TRANSCRIPT

Jahan, Monira (2012) Educational influences on student academic attainment: a multi-level analysis in the context of Bangladesh. PhD thesis, University of Nottingham.
Access from the University of Nottingham repository: http://eprints.nottingham.ac.uk/12824/7/Appendix_8_8-8_14.pdf
Copyright and reuse:
The Nottingham ePrints service makes this work by researchers of the University of Nottingham available open access under the following conditions.
This article is made available under the University of Nottingham End User licence and may be reused according to the conditions of the licence. For more details see: http://eprints.nottingham.ac.uk/end_user_agreement.pdf
For more information, please contact [email protected]

APPENDIX 8.8
CORRELATION OUTPUT FOR SDQ II CORRELATIONS /VARIABLES=Bengali English /PRINT=TWOTAIL NOSIG /MISSING=PAIRWISE. Correlations
Notes
Output Created 30-Aug-2011 00:35:37
Comments
Input Data C:\Users\Monira\Desktop\Data file very final\ASDQ
correlation.sav
Active Dataset DataSet0
Filter <none>
Weight <none>
Split File <none>
N of Rows in Working Data
File
25
Missing Value Handling Definition of Missing User-defined missing values are treated as missing.
Cases Used Statistics for each pair of variables are based on all the
cases with valid data for that pair.
Syntax CORRELATIONS
/VARIABLES=Bengali English
/PRINT=TWOTAIL NOSIG
/MISSING=PAIRWISE.
Resources Processor Time 0:00:00.016
Elapsed Time 0:00:00.016
Correlations
Bengali English
Bengali Pearson Correlation 1 .791**
Sig. (2-tailed) .000
N 25 25
English Pearson Correlation .791** 1
Sig. (2-tailed) .000
N 25 25
**. Correlation is significant at the 0.01 level (2-tailed).

APPENDIX 8.9
List of items that have missing cases:
Note: *(1) Missing N = 20 (1.1%); Not respond (N) = 705 (28.3%). (2) Missing N = 4 (0.2%); No respond (N) = 704 (28.6%). (3) Missing N = 26 (1.5%); No respond (N) = 702 (28.1%).
Variables Missing cases (%)
Background factors: Age
3 (0.1)
Other educational materials:
Use reference book Encyclopaedia Dictionary Magazine
103 (4.2) 110 (4.5) 59 (2.4) 37 (1.5)
Learning opportunity:
Access to computer Subjects study
51 (2.1) 57 (2.3)
Parental encouragement: Extracurricular activity
49 (2.0)
Family constellation*: Family type (1) Number of siblings (2) Birth order (3) Family structure
725 (29.4) 708 (28.8) 728 (29.6) 75 (3.0)
Teacher characteristics: In-service training Job rank
6 (4.9) 1 (0.8)
Classroom context: Class size
2 (1.6)
Head teacher characteristics: Age Educational training Teaching experience Experience as head
1 (2.2) 1 (2.2) 1 (2.2) 1 (2.2)
School context: Number of trained teachers
1 (2.2)

APPENDIX 8.10 Website for SSC Result: www.gov,bd,com or http://www.educationboardresults.gov.bd/.
Additional Information: 1) Exam Result Archive; 2) Board: Dhaka; 3) Exam type: SSC/Dakhil; 4)
Year: 2009 & 5) SSC ExamRoll No School Name: ST. JOSEPH HIGH SCHOOL Police Station: Mohammadpur School Code: A-7
Head teacher’s Name: Brother Jhon Rojario C.S.C Tel: 9112917
SL No
Clas
s
Roll
Name
Result of class Nine (IX)
Group SSC
Rag. No
SSC Exam
Roll No
Result of SSC
Mark Grade
Mark Grade
397 2 Md. Mahdi Salehin Feroz 5.00 A+ Science 952933 108100 5.00 A+
398 3 Prattay Deepta Kairy 5.00 A+ Science 952903 108114 5.00 A+
399 4 Md. Arif Istiaque Khan 5.00 A+ Science 952923 108105 5.00 A+
400 5 Syed Muntafir Rahman 4.88 A Science 354857 108193 5.00 A+
401 6 Hisham Abdul Majeed 4.98 A Science 952929 108102 5.00 A+
402 7 Rajat Ghosh 5.00 A+ Science 952927 108103 5.00 A+
403 8 Touhid Bin Anwar 4.89 A Science 952884 108123 5.00 A+
404 9 Salman Amir 4.99 A Science 952919 108107 5.00 A+
405 10 Amit Acharjee 4.88 A Science 952913 108110 5.00 A+
406 11 Siam Rahman 4.78 A Science 952921 108106 5.00 A+
407 12 Sakib Shadman 5.00 A+ Science 952901 108115 5.00 A+
408 14 Md. Mohaimenul Islam 5.00 A+ Science 952886 108122 5.00 A+
409 15 Rakib Hasan Ayon 4.88 A Science 952899 108116 5.00 A+
410 17 Muntaseer Bunian 3.78 A- Science 952897 108117 5.00 A+
411 18 Sadman Sakib 4.00 A Science 952909 108112 5.00 A+
412 19 Tanveer Reza 4.25 A Science 952917 108108 5.00 A+
413 20 Sanim Safuan Kabir 4.32 A Science 952907 108154 5.00 A+
414 21 Nafis Zubair Khan 4.50 A Science 952915 108109 5.00 A+
415 22 Charles Amit Mohonto 4.70 A Science 952882 108124 5.00 A+
416 25 Taseen Tawsif Rahman 4.23 A Science 952851 108140 5.00 A+
417 26 Naim-Ul-Hasan 4.00 A Science 952888 108121 5.00 A+
418 27 Saleh Muhammed Mohiuddin Chowdhury
4.25 A Science 952891 108120 5.00 A+
419 28 Nafees Maharuf Shafakat 4.42 A Science 952828 108155 5.00 A+
420 29 Prince Suvro Biswas 3.75 A- Science 952893 108119 5.00 A+
421 30 Md. Masud Sadeek 4.00 A Science 952876 108127 5.00 A+
422 31 Kazi Injamamul Haque 3.21 B Science 952831 108153 5.00 A+
423 32 Mir Samin Haque 4.00 A Science 952833 108151 5.00 A+
424 33 Sifat Raihan Khan 4.21 A Science 952834 108150 5.00 A+
425 34 Khandker Mushfiqul Islam
3.99 A Science 952845 108143 5.00 A+
426 36 Faisal Mahmud 4.00 A Science 952895 108118 5.00 A+
427 37 Tanzir Rahman Khan 3.25 B Science 952855 108138 5.00 A+
428 39 Akif Matin 3.30 B Science 952865 108133 5.00 A+
429 40 Sadman Rafi 4.00 A Science 952857 108137 5.00 A+
430 42 Asif Mahmud 3.24 B Science 952847 108142 5.00 A+
431 43 Ibrahim Redwan 4.00 A Science 952867 108132 5.00 A+

432 44 S.M. Iqtidar Amin 3.42 B Science 952843 108144 5.00 A+
433 45 Fazlul Karim Chowdhury 3.57 A- Science 952872 108129 5.00 A+
434 46 Syed Ishtiaq Hossain 4.23 A Science 952878 108126 5.00 A+
435 48 Md. Asif Jahan Shuvro 3.00 B Science 952853 108139 5.00 A+
436 50 Elias Zihan Khan 3.42 B Science 952859 108136 5.00 A+
437 51 Rory Richard Desai 4.50 A Science 952861 108135 5.00 A+
438 52 Rafsan Jani Farooque 4.00 A Science 952837 108147 5.00 A+
439 53 Musawer Ahmad Saqif 3.21 B Science 952925 108104 5.00 A+
440 54 Md. Tasnim Rahman 4.00 A Science 952863 108134 5.00 A+
441 55 Clinton Peter Gomes 4.00 A Science 952836 108148 5.00 A+
442 56 Muhaimen Muhebb 3.00 B Science 952849 108141 5.00 A+
443 57 Bareed Mohammad Nur 4.00 A Science 952832 108152 5.00 A+
444 58 Arif Hasnat 4.00 A Science 952841 108145 4.81 A
445 24 Rohan Sarker 3.20 B Science 952931 108101 5.00 A+
446 41 Farhan Tanvir 3.00 B Science 952869 108131 5.00 A+
447 47 Arafat Hossain 4.00 A Science 952839 108146 5.00 A+
448 16 Nafi Aman 4.00 A Science 952871 108130 5.00 A+
449 1 Arif Hassan Asraful Noor 5.00 A+ Com. 952816 412232 5.00 A+
450 2 Mopasha Samaddar 5.00 A+ Com. 952824 412224 5.00 A+
451 3 Noel Nicholas Rodrigues 5.00 A+ Com. 952805 412243 4.88 A
452 4 Ignatius Evans Gomes 5.00 A+ Com. 952827 412221 5.00 A+
453 5 Debbrota Sen 4.98 A Com. 952825 412223 5.00 A+
454 6 Richard Subro Baroi 4.88 A Com. 952823 412225 5.00 A+
455 7 Shawon Alfred Cruze 4.88 A Com. 952822 412226 5.00 A+
456 8 Promit Pius Gomes 4.87 A Com. 952819 412229 5.00 A+
457 9 Quazi Omar Iftekhar 4.56 A Com. 952821 412227 4.81 A
458 10 Samin Ishtiaque 4.78 A Com. 952820 412228 5.00 A+
459 11 Gabriel Biki Gomes 4.50 A Com. 952826 412222 5.00 A+
460 12 Nafis Ahmed 4.00 A Com. 952796 412247 5.00 A+
461 13 Nafiz Imtiaz Haque 3.87 A- Com. 952811 412237 5.00 A+
462 14 Sabbir Ahmed 4.00 A Com. 952808 412240 5.00 A+
463 21 George Nibir Gomes 3.30 B Com. 952815 412233 5.00 A+
464 23 Md. Abdullah-Al-Nayem 3.67 A- Com. 952813 412235 5.00 A+
465 24 Shouherdya Ahmed 2.65 C Com. 952803 412245 5.00 A+
466 25 Norman proloy Sarkar 3.00 B Com. 952806 412242 5.00 A+
467 26 Victor Jerry Rozario 3.00 B Com. 952807 412241 4.81 A
468 27 Shomee Jonas Razario 2.57 C Com. 952804 412244 5.00 A+

APPENDIX 8.11
Output of Descriptive Analysis
[DataSet1] C:\Users\Monira\Desktop\Finally used data\Student data after viva fimnally used.sav
Statistics
Students' age in month study time Study place No of text book
N Valid 2459 2462 2462 2462
Missing 3 0 0 0
Mean 182.8221 2.7067 2.0394 1.19
Std. Deviation 11.62190 .82334 .63013 .495
Range 98.10 3.00 2.00 3
Minimum 156.00 1.00 1.00 1
Maximum 254.10 4.00 3.00 4
Study place
Frequency Percent Valid Percent
Cumulative
Percent
Valid No study place 442 18.0 18.0 18.0
Share with siblings 1481 60.2 60.2 78.1
Separate study place 539 21.9 21.9 100.0
Total 2462 100.0 100.0
study time
Frequency Percent Valid Percent
Cumulative
Percent
Valid 1-2 hours 155 6.3 6.3 6.3
3-4 hours 836 34.0 34.0 40.3
5-6 hours 1047 42.5 42.5 82.8
7-8 hours or more 424 17.2 17.2 100.0
Total 2462 100.0 100.0

Statistics
teacher/coaching
note
guide/note
book
Note collected from
others'
Note prepared by the
students'
N Valid 2462 2462 2462 2462
Missing 0 0 0 0
Mean .6799 .7539 .4094 .4435
Std. Deviation .46660 .43085 .49183 .49690
Range 1.00 1.00 1.00 1.00
Minimum .00 .00 .00 .00
Maximum 1.00 1.00 1.00 1.00
Statistics
Use reference
book Encyclopaedia Dictionary Magazine
N Valid 2359 2352 2403 2425
Missing 103 110 59 37
Mean .2861 .2364 .9484 .1233
Std. Deviation .45205 .42496 .22127 .32885
Range 1.00 1.00 1.00 1.00
Minimum .00 .00 .00 .00
Maximum 1.00 1.00 1.00 1.00
No of text book
Frequency Percent Valid Percent
Cumulative
Percent
Valid All text books 2092 85.0 85.0 85.0
Almost all text books 290 11.8 11.8 96.8
Few books 64 2.6 2.6 99.4
None 16 .6 .6 100.0
Total 2462 100.0 100.0

Frequency Table
teacher/coaching note
Frequency Percent Valid Percent Cumulative Percent
Valid No 788 32.0 32.0 32.0
Yes 1674 68.0 68.0 100.0
Total 2462 100.0 100.0
Note collected from others'
Frequency Percent Valid Percent Cumulative Percent
Valid No 1454 59.1 59.1 59.1
Yes 1008 40.9 40.9 100.0
Total 2462 100.0 100.0
Use reference book
Frequency Percent Valid Percent Cumulative Percent
Valid No 1684 68.4 71.4 71.4
Yes 675 27.4 28.6 100.0
Total 2359 95.8 100.0
Missing System 103 4.2
Total 2462 100.0
guide/note book
Frequency Percent Valid Percent Cumulative Percent
Valid No 606 24.6 24.6 24.6
Yes 1856 75.4 75.4 100.0
Total 2462 100.0 100.0
Note prepared by the students'
Frequency Percent Valid Percent Cumulative Percent
Valid No 1370 55.6 55.6 55.6
Yes 1092 44.4 44.4 100.0
Total 2462 100.0 100.0

Encyclopaedia
Frequency Percent Valid Percent Cumulative Percent
Valid No 1796 72.9 76.4 76.4
Yes 556 22.6 23.6 100.0
Total 2352 95.5 100.0
Missing System 110 4.5
Total 2462 100.0
Statistics
Access to
computer private tutoring
subject study at coaching center or
private tutors
N Valid 2411 2462 2405
Missing 51 0 57
Mean 2.2522 2.3022 2.7713
Std. Deviation .93273 .81960 1.05982
Range 2.00 3.00 3.00
Dictionary
Frequency Percent Valid Percent Cumulative Percent
Valid No 124 5.0 5.2 5.2
Yes 2279 92.6 94.8 100.0
Total 2403 97.6 100.0
Missing System 59 2.4
Total 2462 100.0
Magazine
Frequency Percent Valid Percent Cumulative Percent
Valid No 2126 86.4 87.7 87.7
Yes 299 12.1 12.3 100.0
Total 2425 98.5 100.0
Missing System 37 1.5
Total 2462 100.0

Minimum 1.00 1.00 1.00
Maximum 3.00 4.00 4.00
Frequency Table
private tutoring
Frequency Percent Valid Percent Cumulative Percent
Valid home private tutor 509 20.7 20.7 20.7
coaching center 758 30.8 30.8 51.5
both 1137 46.2 46.2 97.6
none of the facility 58 2.4 2.4 100.0
Total 2462 100.0 100.0
Access to computer
Frequency Percent Valid Percent Cumulative Percent
Valid Computer 821 33.3 34.1 34.1
Computer with internet 161 6.5 6.7 40.7
None 1429 58.0 59.3 100.0
Total 2411 97.9 100.0
Missing System 51 2.1
Total 2462 100.0
subject study at coaching center or private tutors
Frequency Percent Valid Percent Cumulative Percent
Valid all or some core subjects 523 21.2 21.7 21.7
all or some group subjects 119 4.8 4.9 26.7
some core and gropu
subjects
1148 46.6 47.7 74.4
all subjects 615 25.0 25.6 100.0
Total 2405 97.7 100.0
Missing System 57 2.3
Total 2462 100.0

Statistics
subscribe news paper Watching TV Family structure recode Extra curricular activities
N Valid 2462 2462 2387 2413
Missing 0 0 75 49
Mean 1.37 2.4448 2.4826 .6515
Std.
Deviation
.483 .82966 .54934 .47660
Range 1 3.00 2.00 1.00
Minimum 1 1.00 1.00 .00
Maximum 2 4.00 3.00 1.00
Frequency Table
Watching TV
Frequency Percent Valid Percent Cumulative Percent
Valid Not watch 344 14.0 14.0 14.0
1 hour or less 878 35.7 35.7 49.6
2-3 hours 1041 42.3 42.3 91.9
4 hours or more 199 8.1 8.1 100.0
Total 2462 100.0 100.0
subscribe news paper
Frequency Percent Valid Percent Cumulative Percent
Valid Yes 1550 63.0 63.0 63.0
No 912 37.0 37.0 100.0
Total 2462 100.0 100.0
Family structure recode
Frequency Percent Valid Percent Cumulative Percent
Valid lesezfair 62 2.5 2.6 2.6
Democratic 1111 45.1 46.5 49.1
Autocratic 1214 49.3 50.9 100.0
Total 2387 97.0 100.0
Missing System 75 3.0
Total 2462 100.0

Extra curricular activities
Frequency Percent Valid Percent Cumulative Percent
Valid No 841 34.2 34.9 34.9
Yes 1572 63.9 65.1 100.0
Total 2413 98.0 100.0
Missing System 49 2.0
Total 2462 100.0
Family type
Frequency Percent Valid Percent Cumulative Percent
Valid joint family 191 7.8 11.0 11.0
nuclear family 1399 56.8 80.5 91.5
single (either father or
mother)
147 6.0 8.5 100.0
Total 1737 70.6 100.0
Missing System 725 29.4
Total 2462 100.0
Descriptive Statistics
N Range Minimum Maximum Mean Std. Deviation
Total siblings 1754 9.00 1.00 10.00 3.0428 1.50750
Birth order 1734 9.00 1.00 10.00 2.0473 1.32579
Valid N (listwise) 1734
Statistics
Family type
N Valid 1737
Missing 725
Mean 1.9747
Std. Deviation .44052
Range 2.00
Minimum 1.00
Maximum 3.00

Statistics
School category
N Valid 2462
Missing 0
[DataSet2] C:\Users\Monira\Desktop\Finally used data\Only for teacher.sav
Statistics
Gender
N Valid 122
Missing 0
Gender
Frequency Percent Valid Percent Cumulative Percent
Valid Male 83 68.0 68.0 68.0
Female 39 32.0 32.0 100.0
Total 122 100.0 100.0
Descriptive Statistics
N Range Minimum Maximum Mean Std. Deviation
Age in year 122 35.75 28.50 64.25 44.6011 9.04356
Valid N (listwise) 122
School category
Frequency Percent Valid Percent
Cumulative
Percent
Valid Cat-A 1077 43.7 43.7 43.7
Cat-B 845 34.3 34.3 78.1
cat-C 540 21.9 21.9 100.0
Total 2462 100.0 100.0

Statistics
qualification
Teaching
experience Job Rank
Training on
pedagogy
In-service
training
N Valid 122 122 121 122 116
Missing 0 0 1 0 6
Frequency Table
Qualification
Frequency Percent Valid Percent Cumulative Percent
Valid BA/BSC/BCOM 34 27.9 27.9 27.9
MA/MSC/MCOM 82 67.2 67.2 95.1
Others 6 4.9 4.9 100.0
Total 122 100.0 100.0
Training on pedagogy
Frequency Percent Valid Percent Cumulative Percent
Valid Med 37 30.3 30.3 30.3
Bed 66 54.1 54.1 84.4
C in ed 1 .8 .8 85.2
None 18 14.8 14.8 100.0
Total 122 100.0 100.0
Job Rank
Frequency Percent Valid Percent Cumulative Percent
Valid Assistant teacher 49 40.2 40.5 40.5
Senior teacher 70 57.4 57.9 98.3
Junior teacher 2 1.6 1.7 100.0
Total 121 99.2 100.0
Missing System 1 .8
Total 122 100.0

In-service training
Frequency Percent Valid Percent Cumulative Percent
Valid Yes 88 72.1 75.9 75.9
No 28 23.0 24.1 100.0
Total 116 95.1 100.0
Missing System 6 4.9
Total 122 100.0
Statistics
Teacher salary
N Valid 122
Missing 0
Teacher salary
Frequency Percent Valid Percent Cumulative Percent
Valid 5,000 or less 14 11.5 11.5 11.5
5,001-10,000 65 53.3 53.3 64.8
10,001-15,000 30 24.6 24.6 89.3
15,001 or more 13 10.7 10.7 100.0
Total 122 100.0 100.0
Descriptive Statistics
N Range Minimum Maximum Mean Std. Deviation
Teaching experience 122 43.00 1.00 44.00 16.9836 9.68426
Valid N (listwise) 122

Descriptive Statistics
N Range Minimum Maximum Mean Std. Deviation
Lesson plan 122 6.00 .00 6.00 1.8279 1.53576
Valid N (listwise) 122
Statistics
Assign homework
N Valid 122
Missing 0
Statistics
Total number of student
N Valid 120
Missing 2
Descriptive Statistics
N Range Minimum Maximum Mean Std. Deviation
Time spend on home work 122 2.00 1.00 3.00 1.6230 .64703
Valid N (listwise) 122
Assign homework
Frequency Percent Valid Percent Cumulative Percent
Valid Everyday 35 28.7 28.7 28.7
Frequently 61 50.0 50.0 78.7
Sometimes 26 21.3 21.3 100.0
Total 122 100.0 100.0
Descriptive Statistics
N Range Minimum Maximum Mean Std. Deviation
Total number of student 120 60.00 20.00 80.00 54.1500 12.68006
Valid N (listwise) 120

[DataSet3] C:\Users\Monira\Desktop\Finally used data\Head final 45.sav
Frequency Table
Statistics
qualification Training on pedagogy
N Valid 45 44
Missing 0 1
Mean 3.80 1.8636
Std. Deviation .505 .90453
Range 2 3.00
Minimum 3 1.00
Maximum 5 4.00
Frequency Table
Statistics
Gender Age
N Valid 45 44
Missing 0 1
Mean 1.33 52.5316
Std. Deviation .477 6.04378
Range 1 23.39
Minimum 1 40.61
Maximum 2 64.00
Gender
Frequency Percent Valid Percent Cumulative Percent
Valid Male 30 66.7 66.7 66.7
Female 15 33.3 33.3 100.0
Total 45 100.0 100.0
qualification
Frequency Percent Valid Percent Cumulative Percent
Valid BA/BSC/BCOM 11 24.4 24.4 24.4
MA/MSC/MCOM 32 71.1 71.1 95.6
Others 2 4.4 4.4 100.0
Total 45 100.0 100.0

Training on pedagogy
Frequency Percent Valid Percent Cumulative Percent
Valid MEd 16 35.6 36.4 36.4
BEd 23 51.1 52.3 88.6
None 5 11.1 11.4 100.0
Total 44 97.8 100.0
Missing System 1 2.2
Total 45 100.0
Statistics
student ratio No of trained teacher
N Valid 45 44
Missing 0 1
Mean 31.20 38.30
Std. Deviation 7.491 24.823
Range 30 151
Minimum 20 4
Maximum 50 155
Statistics
teaching
experience
Experience as
head
Total no of
teacher Total no of student
N Valid 44 44 45 45
Missing 1 1 0 0
Mean 26.07 12.16 49.76 1580.04
Std. Deviation 7.602 8.195 28.486 1023.319
Range 28 27 151 4200
Minimum 10 1 10 327
Maximum 38 28 161 4527

Laboratory facility
Frequency Percent Valid Percent Cumulative Percent
Valid No laboratory 4 8.9 8.9 8.9
Yes, but not good 22 48.9 48.9 57.8
Yes, with modern ad well
equipement
19 42.2 42.2 100.0
Total 45 100.0 100.0
Statistics
School category
N Valid 45
Missing 0
Mean 2.0000
Std. Deviation .82572
Range 2.00
Statistics Frequency Table
Laboratory facility PTA meeting No of Books at Library
N Valid 45 45 45
Missing 0 0 0
Mean 2.3333 2.33 2515.18
Std. Deviation .63960 .707 4178.837
Range 2.00 2 26000
Minimum 1.00 1 0
Maximum 3.00 3 26000
PTA meeting
Frequency Percent Valid Percent Cumulative Percent
Valid once in every month 6 13.3 13.3 13.3
Once/twice in every six
month
18 40.0 40.0 53.3
Once/twice in a year 21 46.7 46.7 100.0
Total 45 100.0 100.0
Minimum 1.00
Maximum 3.00
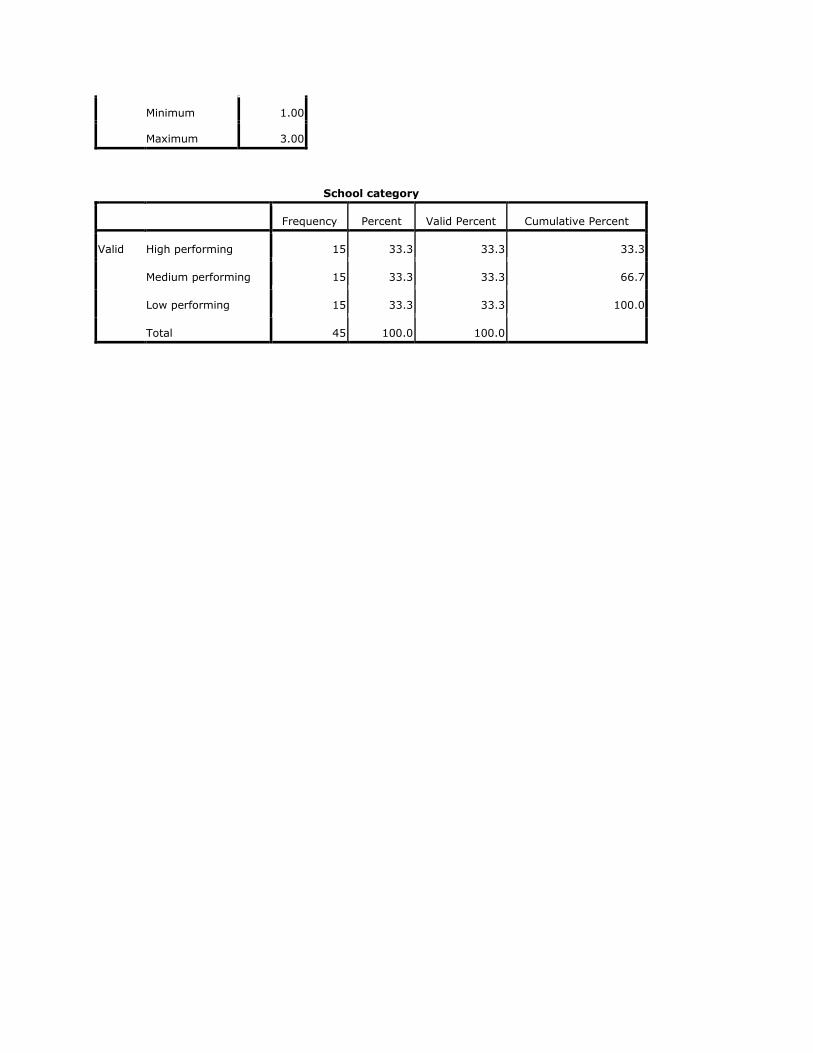
School category
Frequency Percent Valid Percent Cumulative Percent
Valid High performing 15 33.3 33.3 33.3
Medium performing 15 33.3 33.3 66.7
Low performing 15 33.3 33.3 100.0
Total 45 100.0 100.0

APPENDIX 8.12
Output of Chi-square
[DataSet1] C:\Users\Monira\Desktop\Student data after viva fimnally used.sav
Scale Statistics
Mean Variance Std. Deviation N of Items
19.0866 17.875 4.22790 5
Scale: ALL VARIABLES
Case Processing Summary
N %
Cases Valid 1732 70.3
Excludeda 730 29.7
Total 2462 100.0
a. Listwise deletion based on all variables in the
procedure.
Item Statistics
Mean Std. Deviation N
father education 4.8736 1.49006 1732
Mother education 3.9642 1.69237 1732
Household income 2.7102 1.14225 1732
Father occupation 3.8430 1.14144 1732
Item-Total Statistics
Scale Mean if
Item Deleted
Scale Variance if
Item Deleted
Corrected Item-
Total Correlation
Cronbach's Alpha
if Item Deleted
father education 10.5173 9.529 .794 .639
Mother education 11.4267 8.795 .737 .677
Household income 12.6807 13.454 .513 .788
Father occupation 11.5479 14.029 .436 .817
Reliability Statistics
Cronbach's Alpha N of Items
.795 4

Scale Statistics
Mean Variance Std. Deviation N of Items
15.3909 19.057 4.36548 4
SES category * School category
Chi-Square Tests
Value Df
Asymp. Sig. (2-
sided)
Pearson Chi-Square 539.089a 8 .000
Likelihood Ratio 633.550 8 .000
Linear-by-Linear Association 458.619 1 .000
N of Valid Cases 1732
a. 0 cells (.0%) have expected count less than 5. The minimum
expected count is 12.07.
Symmetric Measures
Value Approx. Sig.
Nominal by Nominal Phi .558 .000
Cramer's V .394 .000
Contingency Coefficient .487 .000
N of Valid Cases 1732
Case Processing Summary
Cases
Valid Missing Total
N Percent N Percent N Percent
SES category * School
category
1732 70.3% 730 29.7% 2462 100.0%
SES category * Access to
computer
1697 68.9% 765 31.1% 2462 100.0%
SES category * private
tutoring
1732 70.3% 730 29.7% 2462 100.0%

SES category * Access to computer
Chi-Square Tests
Value Df
Asymp. Sig. (2-
sided)
Pearson Chi-Square 198.353a 8 .000
Likelihood Ratio 206.799 8 .000
Linear-by-Linear Association 158.328 1 .000
N of Valid Cases 1697
a. 1 cells (6.7%) have expected count less than 5. The minimum
expected count is 3.53.
Symmetric Measures
Value Approx. Sig.
Nominal by Nominal Phi .342 .000
Cramer's V .242 .000
Contingency Coefficient .324 .000
N of Valid Cases 1697
SES category * private tutoring
Chi-Square Tests
Value df
Asymp. Sig. (2-
sided)
Pearson Chi-Square 26.911a 12 .008
Likelihood Ratio 26.270 12 .010
Linear-by-Linear Association 5.610 1 .018
N of Valid Cases 1732
a. 2 cells (10.0%) have expected count less than 5. The minimum
expected count is 1.30.
Symmetric Measures
Value Approx. Sig.
Nominal by Nominal Phi .125 .008
Cramer's V .072 .008
Contingency Coefficient .124 .008
N of Valid Cases 1732

Case Processing Summary
Cases
Valid Missing Total
N Percent N Percent N Percent
SES category * School
category
1732 97.6% 43 2.4% 1775 100.0%
SES category * Access to
computer
1697 95.6% 78 4.4% 1775 100.0%
SES category * private
tutoring
1732 97.6% 43 2.4% 1775 100.0%
SES category * School category
Chi-Square Tests
Value df
Asymp. Sig. (2-
sided)
Pearson Chi-Square 539.089a 8 .000
Likelihood Ratio 633.550 8 .000
Linear-by-Linear Association 458.619 1 .000
N of Valid Cases 1732
a. 0 cells (.0%) have expected count less than 5. The minimum
expected count is 12.07.
Symmetric Measures
Value Approx. Sig.
Nominal by Nominal Phi .558 .000
Cramer's V .394 .000
N of Valid Cases 1732
SES category * Access to computer
Chi-Square Tests
Value df
Asymp. Sig. (2-
sided)
Pearson Chi-Square 198.353a 8 .000
Likelihood Ratio 206.799 8 .000
Linear-by-Linear Association 158.328 1 .000
N of Valid Cases 1697

Chi-Square Tests
Value df
Asymp. Sig. (2-
sided)
Pearson Chi-Square 198.353a 8 .000
Likelihood Ratio 206.799 8 .000
Linear-by-Linear Association 158.328 1 .000
N of Valid Cases 1697
a. 1 cells (6.7%) have expected count less than 5. The minimum
expected count is 3.53.
Symmetric Measures
Value Approx. Sig.
Nominal by Nominal Phi .342 .000
Cramer's V .242 .000
N of Valid Cases 1697
SES category * private tutoring
Chi-Square Tests
Value df
Asymp. Sig. (2-
sided)
Pearson Chi-Square 26.911a 12 .008
Likelihood Ratio 26.270 12 .010
Linear-by-Linear Association 5.610 1 .018
N of Valid Cases 1732
a. 2 cells (10.0%) have expected count less than 5. The minimum
expected count is 1.30.
Symmetric Measures
Value Approx. Sig.
Nominal by Nominal Phi .125 .008
Cramer's V .072 .008
N of Valid Cases 1732

APPENDIX 8.13
Output of Factor Analysis
[DataSet1] C:\Users\Monira\Desktop\Finally used data\Student data used for final Factor analysis.sav Scale: ALL VARIABLES
Reliability Statistics
Cronbach's Alpha N of Items
.805 10
[DataSet1] C:\Users\Monira\Desktop\Finally used data\Student data used for final Factor analysis.sav
Scale: ALL VARIABLE
Case Processing Summary
N %
Cases Valid 2462 100.0
Excludeda 0 .0
Total 2462 100.0
a. Listwise deletion based on all variables in the
procedure.
Reliability Statistics
Cronbach's Alpha N of Items
.710 9
Item-Total Statistics
Item Statistics
Mean Std. Deviation N
teachers' treat me fair 1.75 .891 2462
Praise me 1.78 .999 2462
Do mu homework 1.94 1.068 2462
understand my lesson 1.88 1.034 2462
What I say 2.22 1.137 2462
encourage me 1.72 1.011 2462
homework useful 1.98 1.116 2462
Feedback me 1.99 1.058 2462
Teaching boring 3.63 1.213 2462

Scale Mean if
Item Deleted
Scale Variance if
Item Deleted
Corrected Item-
Total Correlation
Cronbach's Alpha
if Item Deleted
teachers' treat me fair 17.14 22.581 .491 .669
Praise me 17.11 21.968 .487 .667
Do mu homework 16.95 21.160 .532 .656
understand my lesson 17.01 20.716 .610 .642
What I say 16.67 20.800 .524 .656
encourage me 17.17 21.228 .567 .651
homework useful 16.91 21.815 .429 .676
Feedback me 16.90 21.249 .529 .657
Teaching boring 15.26 31.338 -.389 .826
[DataSet1] C:\Users\Monira\Desktop\Finally used data\Student data used for final Factor analysis.sav Scale: ALL VARIABLES
Item Statistics
Mean Std. Deviation N
teachers' treat me fair 1.75 .891 2462
Praise me 1.78 .999 2462
Do mu homework 1.94 1.068 2462
understand my lesson 1.88 1.034 2462
Scale Statistics
Mean Variance Std. Deviation N of Items
18.89 27.529 5.247 9
Case Processing Summary
N %
Cases Valid 2462 100.0
Excludeda 0 .0
Total 2462 100.0
a. Listwise deletion based on all variables in the
procedure.
Reliability Statistics
Cronbach's Alpha N of Items
.826 8

What I say 2.22 1.137 2462
encourage me 1.72 1.011 2462
homework useful 1.98 1.116 2462
Feedback me 1.99 1.058 2462
Item-Total Statistics
Scale Mean if
Item Deleted
Scale Variance if
Item Deleted
Corrected Item-
Total Correlation
Cronbach's Alpha
if Item Deleted
teachers' treat me fair 13.51 25.819 .522 .810
Praise me 13.48 25.196 .513 .811
Do mu homework 13.32 24.305 .559 .805
understand my lesson 13.38 23.728 .649 .792
What I say 13.04 24.006 .542 .808
encourage me 13.54 24.368 .596 .800
homework useful 13.28 24.908 .466 .818
Feedback me 13.27 24.382 .559 .805
[DataSet1] C:\Users\Monira\Desktop\Finally used data\Student data used for final Factor analysis.sav Scale: ALL VARIABLES
Case Processing Summary
N %
Cases Valid 1697 68.9
Excludeda 765 31.1
Total 2462 100.0
a. Listwise deletion based on all variables in the
procedure.
Reliability Statistics
Cronbach's Alpha N of Items
.297 5
Scale Statistics
Mean Variance Std. Deviation N of Items
15.26 31.338 5.598 8

Item Statistics
Mean Std. Deviation N
father education 4.8821 1.48388 1697
Mother education 3.9747 1.68545 1697
Father occupation 2.1520 1.13913 1697
Mother occupation 3.6700 .87254 1697
Household income 2.7118 1.14051 1697
Item-Total Statistics
Scale Mean if
Item Deleted
Scale Variance if
Item Deleted
Corrected Item-
Total Correlation
Cronbach's Alpha
if Item Deleted
father education 12.5085 5.605 .458 -.142a
Mother education 13.4160 4.734 .470 -.233a
Father occupation 15.2387 13.152 -.415 .613
Mother occupation 13.7207 11.546 -.216 .451
Household income 14.6788 6.440 .567 -.137a
a. The value is negative due to a negative average covariance among items. This violates
reliability model assumptions. You may want to check item codings.
Scale Statistics
Mean Variance Std. Deviation N of Items
17.3907 11.025 3.32035 5
[DataSet1] C:\Users\Monira\Desktop\Finally used data\Student data used for final Factor analysis.sav Scale: ALL VARIABLES
Case Processing Summary
N %
Cases Valid 1732 70.3
Excludeda 730 29.7
Total 2462 100.0
a. Listwise deletion based on all variables in the
procedure.

Reliability Statistics
Cronbach's Alpha N of Items
.795 4
Item-Total Statistics
Scale Mean if
Item Deleted
Scale Variance if
Item Deleted
Corrected Item-
Total Correlation
Cronbach's Alpha
if Item Deleted
father education 10.5173 9.529 .794 .639
Mother education 11.4267 8.795 .737 .677
Household income 12.6807 13.454 .513 .788
Father occupation 11.5479 14.029 .436 .817
Scale Statistics
Mean Variance Std. Deviation N of Items
15.3909 19.057 4.36548 4
[DataSet1] C:\Users\Monira\Desktop\Finally used data\Student data after viva fimnally used.sav
Descriptive Statistics
Mean Std. Deviation N
SSC exam GPA 4.0721 1.39172 2390
Total SDQ scale 52.5321 9.06420 2462
Total SES scale 15.3909 4.36548 1732
Total Teacher interaction
scale
15.2600 5.59806 2462
Correlations
SSC exam GPA Total SDQ scale
SSC exam GPA Pearson Correlation 1 .457**
Item Statistics
Mean Std. Deviation N
father education 4.8736 1.49006 1732
Mother education 3.9642 1.69237 1732
Household income 2.7102 1.14225 1732
Father occupation 3.8430 1.14144 1732

Sig. (2-tailed) .000
N 2390 2390
Total SDQ scale Pearson Correlation .457** 1
Sig. (2-tailed) .000
N 2390 2462
Total SES scale Pearson Correlation .551** .381**
Sig. (2-tailed) .000 .000
N 1686 1732
Total Teacher interaction
scale
Pearson Correlation .098** -.078**
Sig. (2-tailed) .000 .000
N 2390 2462
**. Correlation is significant at the 0.01 level (2-tailed).
Correlations
Total SES scale
Total Teacher
interaction scale
SSC exam GPA Pearson Correlation .551** .098**
Sig. (2-tailed) .000 .000
N 1686 2390
Total SDQ scale Pearson Correlation .381** -.078**
Sig. (2-tailed) .000 .000
N 1732 2462
Total SES scale Pearson Correlation 1 .064**
Sig. (2-tailed) .008
N 1732 1732
Total Teacher interaction
scale
Pearson Correlation .064** 1
Sig. (2-tailed) .008
N 1732 2462
**. Correlation is significant at the 0.01 level (2-tailed).
[DataSet1] C:\Users\Monira\Desktop\Finally used data\Student data after viva fimnally used.sav
Case Processing Summary
Cases

Included Excluded Total
N Percent N Percent N Percent
SSC exam GPA * Total SDQ
scale
2390 97.1% 72 2.9% 2462 100.0%
Report
SSC exam GPA
Total
SDQ
scale Mean N Std. Deviation
20.00 2.3800 1 .
22.00 3.6250 2 .09192
24.00 3.8800 1 .
25.00 3.8150 2 .53033
26.00 2.8800 1 .
27.00 2.9400 2 .08485
28.00 3.6250 2 .61518
29.00 2.3600 4 1.61189
30.00 1.1888 8 1.64648
31.00 2.6240 5 1.55285
32.00 2.3629 14 1.87012
33.00 1.4900 12 1.70721
34.00 2.1521 19 1.98096
35.00 2.4215 26 1.84095
36.00 2.1800 29 1.94905
37.00 2.5225 20 1.98851
38.00 2.3163 19 1.85833
39.00 3.2761 28 1.65529
40.00 3.3665 26 1.61794
41.00 3.5217 30 1.49324
42.00 3.5585 39 1.36104
43.00 3.1605 59 1.79819
44.00 3.6235 55 1.26744
45.00 3.7665 72 1.39023

46.00 3.6146 80 1.59140
47.00 3.5159 91 1.69940
48.00 3.5836 107 1.57772
49.00 3.8943 105 1.33751
50.00 4.0554 117 1.15989
51.00 3.9778 95 1.55635
52.00 4.2778 101 1.28894
53.00 4.2800 95 1.16904
54.00 4.4038 100 .79157
55.00 4.3270 107 1.10044
56.00 4.5688 88 .70286
57.00 4.4371 94 1.09264
58.00 4.5809 95 .84064
59.00 4.6316 91 .69519
60.00 4.5177 77 1.02501
61.00 4.6209 80 .85036
62.00 4.6390 59 .79145
63.00 4.7802 57 .42219
64.00 4.6769 45 1.04078
65.00 4.8279 42 .38039
66.00 4.7971 42 .44082
67.00 4.9131 35 .18346
68.00 4.8552 31 .49700
69.00 4.9875 20 .04387
70.00 4.9583 12 .08601
71.00 4.9471 14 .10284
72.00 4.9615 13 .09703
73.00 4.9167 6 .13456
74.00 4.9775 8 .04464
75.00 5.0000 1 .
76.00 5.0000 3 .00000
77.00 5.0000 2 .00000
79.00 5.0000 1 .
Total 4.0721 2390 1.39172

[DataSet1] C:\Users\Monira\Desktop\Finally used data\Student data after viva fimnally used.sav
Case Processing Summary
Cases
Included Excluded Total
N Percent N Percent N Percent
SSC exam GPA * Total SES
scale
1686 68.5% 776 31.5% 2462 100.0%
SSC exam GPA * Total
Teacher interaction scale
2390 97.1% 72 2.9% 2462 100.0%
SSC exam GPA * Total SES scale
SSC exam GPA
Total
SES
scale Mean N Std. Deviation
4.00 3.3800 2 .70711
5.00 2.7633 48 1.77499
6.00 2.0671 34 1.80842
7.00 2.4508 36 1.70959
8.00 2.6744 50 1.66339
9.00 2.6825 56 1.92877
10.00 2.9696 49 1.62684
11.00 3.6986 43 1.17309
12.00 3.4932 62 1.44204
13.00 3.9935 89 1.23011
14.00 3.6616 107 1.58353
15.00 4.1708 125 1.11476
16.00 4.2063 134 1.08992
17.00 4.2725 172 1.22155
18.00 4.6030 184 .69569
19.00 4.8109 190 .36158
20.00 4.8695 176 .32783
21.00 4.9444 129 .18702
Total 4.1079 1686 1.35915

SSC exam GPA * Total Teacher interaction
scale
SSC exam GPA
Total
Teacher
interacti
on scale Mean N Std. Deviation
8.00 3.9470 206 1.50746
9.00 3.9088 132 1.66342
10.00 3.9306 154 1.51181
11.00 3.9877 176 1.44986
12.00 4.0242 220 1.48133
13.00 4.0960 189 1.36517
14.00 4.1479 175 1.19195
15.00 3.9771 168 1.59717
16.00 3.9361 165 1.42680
17.00 4.0132 115 1.37029
18.00 4.1092 102 1.43587
19.00 4.1007 98 1.32778
20.00 4.3247 66 .85002
21.00 4.3468 72 .98738
22.00 4.0666 70 1.31594
23.00 4.0540 50 1.40519
24.00 3.9886 65 1.33893
25.00 4.6141 37 .88585
26.00 4.4952 23 1.07221
27.00 4.2707 29 1.33646
28.00 4.4640 15 .74852
29.00 4.6786 14 .51067
30.00 4.8442 12 .36500
31.00 4.6122 9 .59793
32.00 4.5760 5 .94809
33.00 5.0000 9 .00000

34.00 4.9375 4 .08958
35.00 4.6520 5 .59335
36.00 4.5600 1 .
39.00 5.0000 2 .00000
40.00 5.0000 2 .00000
Total 4.0721 2390 1.39172
Scale: ALL VARIABLES
Case Processing Summary
N %
Cases Valid 2462 100.0
Excludeda 0 .0
Total 2462 100.0
a. Listwise deletion based on all variables in the
procedure.
Reliability Statistics
Cronbach's Alpha
Cronbach's Alpha
Based on
Standardized
Items N of Items
.800 .805 8
Item Statistics
Mean Std. Deviation N
SDQ1 4.92 1.588 2462
SDQ2 5.47 1.631 2462
SDQ3 6.23 1.476 2462
SDQ4 5.30 1.303 2462
SDQ5 4.98 1.751 2462
SDQ6 4.86 1.787 2462
SDQ7 5.05 1.474 2462
SDQ8 5.23 1.263 2462
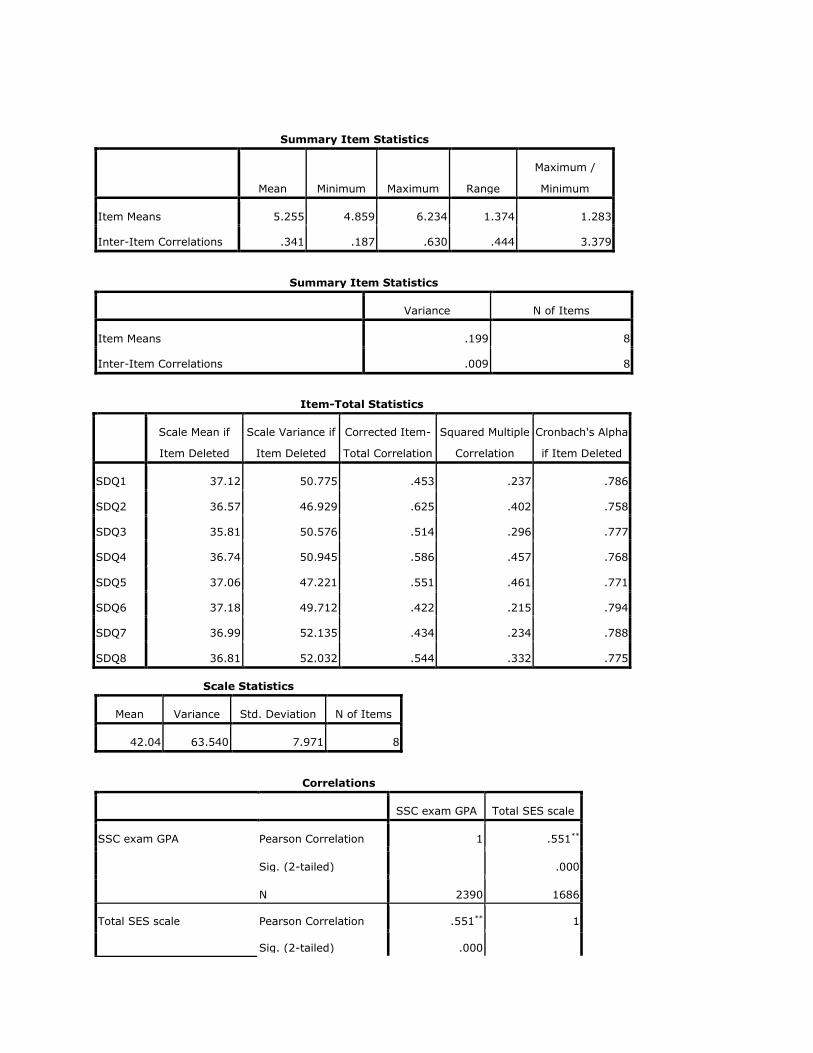
Summary Item Statistics
Mean Minimum Maximum Range
Maximum /
Minimum
Item Means 5.255 4.859 6.234 1.374 1.283
Inter-Item Correlations .341 .187 .630 .444 3.379
Summary Item Statistics
Variance N of Items
Item Means .199 8
Inter-Item Correlations .009 8
Scale Statistics
Mean Variance Std. Deviation N of Items
42.04 63.540 7.971 8
Correlations
SSC exam GPA Total SES scale
SSC exam GPA Pearson Correlation 1 .551**
Sig. (2-tailed) .000
N 2390 1686
Total SES scale Pearson Correlation .551** 1
Sig. (2-tailed) .000
Item-Total Statistics
Scale Mean if
Item Deleted
Scale Variance if
Item Deleted
Corrected Item-
Total Correlation
Squared Multiple
Correlation
Cronbach's Alpha
if Item Deleted
SDQ1 37.12 50.775 .453 .237 .786
SDQ2 36.57 46.929 .625 .402 .758
SDQ3 35.81 50.576 .514 .296 .777
SDQ4 36.74 50.945 .586 .457 .768
SDQ5 37.06 47.221 .551 .461 .771
SDQ6 37.18 49.712 .422 .215 .794
SDQ7 36.99 52.135 .434 .234 .788
SDQ8 36.81 52.032 .544 .332 .775

N 1686 1732
SDQscale score Pearson Correlation .452** .382**
Sig. (2-tailed) .000 .000
N 2390 1732
Total Teacher interaction
scale
Pearson Correlation .098** .064**
Sig. (2-tailed) .000 .008
N 2390 1732
**. Correlation is significant at the 0.01 level (2-tailed).
Correlations
SDQscale score
Total Teacher
interaction scale
SSC exam GPA Pearson Correlation .452** .098**
Sig. (2-tailed) .000 .000
N 2390 2390
Total SES scale Pearson Correlation .382** .064**
Sig. (2-tailed) .000 .008
N 1732 1732
SDQscale score Pearson Correlation 1 -.069**
Sig. (2-tailed) .001
N 2462 2462
Total Teacher interaction
scale
Pearson Correlation -.069** 1
Sig. (2-tailed) .001
N 2462 2462
**. Correlation is significant at the 0.01 level (2-tailed).
[DataSet2] C:\Users\Monira\Desktop\Finally used data\Teacher used for factor analysis.sav
KMO and Bartlett’s Test
Kaiser-Meyer-Olkin Measure
of Sampling Adequacy.
.731
Bartlett's Test of Sphericity Approx. Chi-Square 203.042
df 36
Sig. .000

Communalities
Initial Extraction
Text book 1.000 .491
Note book 1.000 .449
Use chart 1.000 .462
Use picture 1.000 .631
Lecture method 1.000 .338
Group discussion 1.000 .397
Group project 1.000 .551
Memorization 1.000 .667
Reconde no talking 1.000 .407
Extraction Method: Principal Component
Analysis.
Total Variance Explained
Compon
ent
Initial Eigenvalues
Total % of Variance Cumulative %
1 2.883 32.028
2 1.509 16.772
3 .876 9.733 58.534
4 .816 9.068 67.601
5 .754 8.380 75.981
6 .666 7.404 83.385
7 .619 6.881 90.266
8 .534 5.937 96.203
9 .342 3.797 100.000
Extraction Method: Principal Component Analysis.
Total Variance Explained
Compon
ent
Initial
Eigenvalues Extraction Sums of Squared Loadings
Rotation Sums of
Squared
Loadingsa
Cumulative % Total % of Variance Cumulative % Total
1 32.028 2.883 32.028 32.028 2.541

2 48.800 1.509 16.772 48.800 2.125
Extraction Method: Principal Component Analysis.
a. When components are correlated, sums of squared loadings cannot be added to obtain a
total variance.
Component Matrixa
Component
1 2
Text book .635 .295
Note book .653 .150
Use chart -.367 .572
Use picture -.508 .610
Lecture method .569 .119
Group discussion -.616 .134
Group project -.623 .403
Memorization .667 .471
Reconde no talking .350 .533
Extraction Method: Principal Component
Analysis.
a. 2 components extracted.
Pattern Matrixa
Component
1 2
Text book .685 -.063
Note book .599 -.200
Use chart .112 .694
Use picture .031 .800
Lecture method .513 -.185
Group discussion -.376 .433
Group project -.197 .675
Memorization .829 .077
Reconde no talking .631 .294

Extraction Method: Principal Component
Analysis. Rotation Method: Oblimin with Kaiser
Normalization.
a. Rotation converged in 8 iterations.
Structure Matrix
Component
1 2
Text book .698 -.206
Note book .641 -.325
Use chart -.033 .671
Use picture -.136 .793
Lecture method .552 -.293
Group discussion -.467 .512
Group project -.339 .716
Memorization .813 -.097
Reconde no talking .570 .162
Extraction Method: Principal Component
Analysis. Rotation Method: Oblimin with Kaiser
Normalization.
Component Correlation
Matrix
Compon
ent 1 2
1 1.000 -.210
2 -.210 1.000
Extraction Method: Principal
Component Analysis. Rotation
Method: Oblimin with Kaiser
Normalization.
[DataSet2] C:\Users\Monira\Desktop\Finally used data\Teacher used for factor analysis.sav Scale: ALL VARIABLES
Case Processing Summary
N %

Cases Valid 122 100.0
Excludeda 0 .0
Total 122 100.0
a. Listwise deletion based on all variables in the
procedure.
Reliability Statistics
Cronbach's Alpha N of Items
.681 5
[DataSet2] C:\Users\Monira\Desktop\Finally used data\Teacher used for factor analysis.sav Scale: ALL VARIABLES
Case Processing Summary
N %
Cases Valid 122 100.0
Excludeda 0 .0
Total 122 100.0
a. Listwise deletion based on all variables in the
procedure.
Reliability Statistics
Cronbach's Alpha N of Items
.647 4
[DataSet2] C:\Users\Monira\Desktop\Finally used data\Teacher used for factor analysis.sav
KMO and Bartlett’s Test
Kaiser-Meyer-Olkin Measure
of Sampling Adequacy.
.829
Bartlett's Test of Sphericity Approx. Chi-Square 396.290
df 91
Sig. .000
Communalities
Initial Extraction
Friendly 1.000 .293

Effective discussion 1.000 .577
Accept others' idea 1.000 .608
Inform school process 1.000 .439
Monitor teacher & student 1.000 .500
Ask teacher 1.000 .515
Guide line 1.000 .470
Keep pressure 1.000 .671
Pressure to be competent 1.000 .511
Up to date 1.000 .545
Act with consultation 1.000 .556
Teachers' capacity 1.000 .341
Do not like to change recode 1.000 .318
Engage teachers' in hard
work
1.000 .679
Extraction Method: Principal Component Analysis.
Total Variance Explained
Compon
ent
Initial Eigenvalues
Total % of Variance Cumulative %
1 4.259 30.419
2 1.530 10.932
3 1.233 8.805
4 .953 6.809 56.965
5 .875 6.251 63.216
6 .857 6.122 69.338
7 .703 5.022 74.359
8 .685 4.895 79.254
9 .618 4.413 83.667
10 .561 4.006 87.673
11 .466 3.328 91.001
12 .465 3.319 94.320
13 .445 3.179 97.499
14 .350 2.501 100.000

Extraction Method: Principal Component Analysis.
Total Variance Explained
Compon
ent
Initial
Eigenvalues Extraction Sums of Squared Loadings
Rotation Sums of
Squared
Loadingsa
Cumulative % Total % of Variance Cumulative % Total
1 30.419 4.259 30.419 30.419 3.651
2 41.351 1.530 10.932 41.351 1.609
3 50.155 1.233 8.805 50.155 3.045
Extraction Method: Principal Component Analysis.
a. When components are correlated, sums of squared loadings cannot be added to obtain a
total variance.
Component Matrixa
Component
1 2 3
Friendly .487 -.156 -.177
Effective discussion .692 -.265 .168
Accept others' idea .629 -.274 .370
Inform school process .601 .153 -.234
Monitor teacher & student .549 .120 -.429
Ask teacher .591 -.219 .344
Guide line .658 .170 -.087
Keep pressure .327 .676 .326
Pressure to be competent .486 .264 .452
Up to date .695 -.158 -.192
Act with consultation .629 .036 -.399
Teachers' capacity .517 .121 -.242
Do not like to change recode .442 .161 .311
Engage teachers' in hard
work
-.131 .808 -.100
Extraction Method: Principal Component Analysis.
a. 3 components extracted.
Pattern Matrixa
Component
1 2 3
Friendly .467 -.194 .047
Effective discussion .298 -.336 .477
Accept others' idea .080 -.348 .646
Inform school process .629 .105 .073
Monitor teacher & student .758 .085 -.148
Ask teacher .083 -.288 .606
Guide line .544 .111 .247
Keep pressure .021 .631 .537
Pressure to be competent -.027 .200 .703

Up to date .622 -.216 .133
Act with consultation .777 -.007 -.086
Teachers' capacity .576 .082 .021
Do not like to change recode .053 .107 .534
Engage teachers' in hard
work
.090 .822 -.093
Extraction Method: Principal Component Analysis.
Rotation Method: Oblimin with Kaiser Normalization.
a. Rotation converged in 16 iterations.
Structure Matrix
Component
1 2 3
Friendly .503 -.236 .250
Effective discussion .526 -.378 .614
Accept others' idea .380 -.377 .692
Inform school process .651 .049 .333
Monitor teacher & student .689 .026 .168
Ask teacher .361 -.317 .651
Guide line .638 .057 .471
Keep pressure .193 .610 .523
Pressure to be competent .251 .177 .685
Up to date .696 -.273 .402
Act with consultation .741 -.070 .240
Teachers' capacity .578 .033 .260
Do not like to change recode .268 .083 .552
Engage teachers' in hard
work
-.018 .818 -.085
Extraction Method: Principal Component Analysis.
Rotation Method: Oblimin with Kaiser Normalization.
Component Correlation Matrix

Compon
ent 1 2 3
1 1.000 -.084 .420
2 -.084 1.000 -.036
3 .420 -.036 1.000
Extraction Method: Principal Component
Analysis. Rotation Method: Oblimin with
Kaiser Normalization.
RELIABILITY /VARIABLES=q8 q11 q12 q14 q17 q18 q19 /SCALE('ALL VARIABLES') ALL /MODEL=ALPHA. [DataSet2] C:\Users\Monira\Desktop\Finally used data\Teacher used for factor analysis.sav Scale: ALL VARIABLES
Case Processing Summary
N %
Cases Valid 122 100.0
Excludeda 0 .0
Total 122 100.0
a. Listwise deletion based on all variables in the
procedure.
Reliability Statistics
Cronbach's Alpha N of Items
.772 7
RELIABILITY /VARIABLES=q15 q21 /SCALE('ALL VARIABLES') ALL /MODEL=ALPHA. [DataSet2] C:\Users\Monira\Desktop\Finally used data\Teacher used for factor analysis.sav Scale: ALL VARIABLES
Case Processing Summary
N %
Cases Valid 122 100.0
Excludeda 0 .0
Total 122 100.0
a. Listwise deletion based on all variables in the
procedure.
Reliability Statistics

[DataSet2] C:\Users\Monira\Desktop\Finally used data\Teacher used for factor analysis.sav Scale: ALL VARIABLES
Case Processing Summary
N %
Cases Valid 122 100.0
Excludeda 0 .0
Total 122 100.0
a. Listwise deletion based on all variables in the
procedure.
Reliability Statistics
Cronbach's Alpha N of Items
.695 5
Correlation Matrix
Administrational
behavior
supportive or
encouraging
Correlation Facility for Professional
Development
-.292
Motivate to increase
Teachers' skill
-.302
Expectation from teachers' -.400
Link between teachers &
admin
.459
Teaching & learning facilities .646
Administrational help .752
Administrational behavior
supportive or encouraging
1.000
Cronbach's Alpha N of Items
.493 2

Sig. (1-tailed) Facility for Professional
Development
.001
Motivate to increase
Teachers' skill
.000
Expectation from teachers' .000
Link between teachers &
admin
.000
Teaching & learning facilities .000
Administrational help .000
KMO and Bartlett’s Test
Kaiser-Meyer-Olkin Measure
of Sampling Adequacy.
.811
Bartlett's Test of Sphericity Approx. Chi-Square 289.207
Df 21
Sig. .000
Communalities
Initial Extraction
Facility for Professional
Development
1.000 .232
Motivate to increase
Teachers' skill
1.000 .711
Expectation from teachers' 1.000 .674
Link between teachers &
admin
1.000 .521
Teaching & learning facilities 1.000 .720
Administrational help 1.000 .747
Administrational behavior
supportive or encouraging
1.000 .746
Extraction Method: Principal Component Analysis.
Total Variance Explained
Compon Initial Eigenvalues

ent Total % of Variance Cumulative %
1 3.297 47.095
2 1.054 15.056
3 .876 12.510 74.661
4 .627 8.954 83.615
5 .576 8.230 91.845
6 .343 4.893 96.738
7 .228 3.262 100.000
Extraction Method: Principal Component Analysis.
Total Variance Explained
Compon
ent
Initial
Eigenvalues Extraction Sums of Squared Loadings
Rotation Sums of
Squared
Loadingsa
Cumulative % Total % of Variance Cumulative % Total
1 47.095 3.297 47.095 47.095 3.141
2 62.151 1.054 15.056 62.151 1.905
Extraction Method: Principal Component Analysis.
a. When components are correlated, sums of squared loadings cannot be added to obtain a
total variance.
Component Matrixa
Component
1 2
Facility for Professional
Development
-.482 .023
Motivate to increase
Teachers' skill
-.495 .683
Expectation from teachers' -.552 .608
Link between teachers &
admin
.649 .316
Teaching & learning facilities .817 .227
Administrational help .834 .227

Pattern Matrixa
Component
1 2
Facility for Professional
Development
-.396 .162
Motivate to increase
Teachers' skill
.033 .855
Expectation from teachers' -.065 .794
Link between teachers &
admin
.765 .144
Teaching & learning facilities .850 .004
Administrational help .864 .000
Administrational behavior
supportive or encouraging
.812 -.117
Extraction Method: Principal Component Analysis.
Rotation Method: Oblimin with Kaiser Normalization.
a. Rotation converged in 4 iterations.
Structure Matrix
Component
1 2
Facility for Professional
Development
-.458 .315
Motivate to increase
Teachers' skill
-.298 .843
Expectation from teachers' -.372 .819
Link between teachers &
admin
.709 -.151
Teaching & learning facilities .848 -.324
Administrational help .864 -.334
Administrational behavior
supportive or encouraging
.857 -.431
Administrational behavior
supportive or encouraging
.855 .122
Extraction Method: Principal Component Analysis.
a. 2 components extracted.

Structure Matrix
Component
1 2
Facility for Professional
Development
-.458 .315
Motivate to increase
Teachers' skill
-.298 .843
Expectation from teachers' -.372 .819
Link between teachers &
admin
.709 -.151
Teaching & learning facilities .848 -.324
Administrational help .864 -.334
Administrational behavior
supportive or encouraging
.857 -.431
Extraction Method: Principal Component Analysis.
Rotation Method: Oblimin with Kaiser Normalization.
Component Correlation
Matrix
Compon
ent 1 2
1 1.000 -.386
2 -.386 1.000
Extraction Method: Principal
Component Analysis. Rotation
Method: Oblimin with Kaiser
Normalization.
KMO and Bartlett’s Test
Kaiser-Meyer-Olkin Measure
of Sampling Adequacy.
.796
Bartlett's Test of Sphericity Approx. Chi-Square 271.613
Df 15
Sig. .000

Communalities
Initial Extraction
Motivate to increase
Teachers' skill
1.000 .721
Expectation from teachers' 1.000 .673
Link between teachers &
admin
1.000 .510
Teaching & learning facilities 1.000 .737
Administrational help 1.000 .771
Administrational behavior
supportive or encouraging
1.000 .764
Extraction Method: Principal Component Analysis.
Total Variance Explained
Compon
ent
Initial Eigenvalues
Total % of Variance Cumulative %
1 3.123 52.053
2 1.054 17.564
3 .670 11.174 80.791
4 .582 9.694 90.484
5 .343 5.709 96.194
6 .228 3.806 100.000
Extraction Method: Principal Component Analysis.
Total Variance Explained
Compon
ent
Initial
Eigenvalues Extraction Sums of Squared Loadings
Rotation Sums of
Squared
Loadingsa
Cumulative % Total % of Variance Cumulative % Total
1 52.053 3.123 52.053 52.053 2.942
2 69.617 1.054 17.564 69.617 1.848
Extraction Method: Principal Component Analysis.

Total Variance Explained
Compon
ent
Initial
Eigenvalues Extraction Sums of Squared Loadings
Rotation Sums of
Squared
Loadingsa
Cumulative % Total % of Variance Cumulative % Total
1 52.053 3.123 52.053 52.053 2.942
2 69.617 1.054 17.564 69.617 1.848
Extraction Method: Principal Component Analysis.
a. When components are correlated, sums of squared loadings cannot be added to obtain a
total variance.
Component Matrixa
Component
1 2
Motivate to increase
Teachers' skill
-.501 .686
Expectation from teachers' -.551 .608
Link between teachers &
admin
.639 .318
Teaching & learning facilities .829 .223
Administrational help .850 .222
Administrational behavior
supportive or encouraging
.866 .117
Extraction Method: Principal Component Analysis.
a. 2 components extracted.
Pattern Matrixa
Component
1 2
Motivate to increase
Teachers' skill
.034 .861
Expectation from teachers' -.059 .797
Link between teachers &
admin
.749 .123

Teaching & learning facilities .845 -.035
Administrational help .862 -.042
Administrational behavior
supportive or encouraging
.807 -.155
Extraction Method: Principal Component Analysis.
Rotation Method: Oblimin with Kaiser Normalization.
a. Rotation converged in 4 iterations.
Structure Matrix
Component
1 2
Motivate to increase
Teachers' skill
-.276 .849
Expectation from teachers' -.346 .819
Link between teachers &
admin
.705 -.146
Teaching & learning facilities .858 -.339
Administrational help .877 -.352
Administrational behavior
supportive or encouraging
.862 -.445
Extraction Method: Principal Component Analysis.
Rotation Method: Oblimin with Kaiser Normalization.
Component Correlation
Matrix
Compon
ent 1 2
1 1.000 -.360
2 -.360 1.000
Extraction Method: Principal
Component Analysis. Rotation
Method: Oblimin with Kaiser
Normalization.
[DataSet2] C:\Users\Monira\Desktop\Finally used data\Teacher used for factor analysis.sa Scale: ALL VARIABLES

Case Processing Summary
N %
Cases Valid 122 100.0
Excludeda 0 .0
Total 122 100.0
a. Listwise deletion based on all variables in the
procedure.
Reliability Statistics
Cronbach's Alpha N of Items
.833 4
[DataSet2] C:\Users\Monira\Desktop\Finally used data\Teacher used for factor analysis.sav Scale: ALL VARIABLES
Case Processing Summary
N %
Cases Valid 122 100.0
Excludeda 0 .0
Total 122 100.0
a. Listwise deletion based on all variables in the
procedure.
Reliability Statistics
Cronbach's Alpha N of Items
.573 2
[DataSet1] C:\Users\Monira\Desktop\Finally used data\Student data used for final Factor analysis.sav
Correlation Matrixa
Parents'
discussion Father help
Mother helping
hour
Correlation Parents' discussion 1.000 -.181 -.080
Father help -.181 1.000 .134
Mother helping hour -.080 .134 1.000
others' helpig hour -.022 .026 .078
parents' reward -.115 .086 .049

Sig. (1-tailed) Parents' discussion .000 .000
Father help .000 .000
Mother helping hour .000 .000
others' helpig hour .141 .099 .000
parents' reward .000 .000 .008
a. Determinant = .920
Correlation Matrixa
others' helpig
hour parents' reward
Correlation Parents' discussion -.022 -.115
Father help .026 .086
Mother helping hour .078 .049
others' helpig hour 1.000 -.051
parents' reward -.051 1.000
Sig. (1-tailed) Parents' discussion .141 .000
Father help .099 .000
Mother helping hour .000 .008
others' helpig hour .006
parents' reward .006
a. Determinant = .920
KMO and Bartlett’s Test
Kaiser-Meyer-Olkin Measure
of Sampling Adequacy.
.566
Bartlett's Test of Sphericity Approx. Chi-Square 204.866
df 10
Sig. .000
Communalities
Initial Extraction
Parents' discussion 1.000 .429
Father help 1.000 .449

Mother helping hour 1.000 .413
others' helpig hour 1.000 .643
parents' reward 1.000 .472
Extraction Method: Principal Component
Analysis.
Total Variance Explained
Compon
ent
Initial Eigenvalues
Total % of Variance Cumulative %
1 1.338 26.758
2 1.069 21.371
3 .900 18.003 66.131
4 .891 17.819 83.951
5 .802 16.049 100.000
Extraction Method: Principal Component Analysis.
Total Variance Explained
Compon
ent
Initial
Eigenvalues Extraction Sums of Squared Loadings
Rotation Sums of
Squared
Loadingsa
Cumulative % Total % of Variance Cumulative % Total
1 26.758 1.338 26.758 26.758 1.331
2 48.128 1.069 21.371 48.128 1.078
Extraction Method: Principal Component Analysis.
a. When components are correlated, sums of squared loadings cannot be added to obtain a
total variance.
Component Matrixa
Component
1 2
Parents' discussion -.640 .141
Father help .670 .017
Mother helping hour .514 .386

others' helpig hour .144 .789
parents' reward .441 -.527
Extraction Method: Principal Component
Analysis.
a. 2 components extracted.
Pattern Matrixa
Component
1 2
Parents' discussion -.656 .040
Father help .655 .121
Mother helping hour .431 .461
others' helpig hour -.010 .802
parents' reward .534 -.452
Extraction Method: Principal Component
Analysis. Rotation Method: Oblimin with Kaiser
Normalization.
a. Rotation converged in 11 iterations.
Structure Matrix
Component
1 2
Parents' discussion -.654 .016
Father help .659 .145
Mother helping hour .448 .477
others' helpig hour .020 .802
parents' reward .518 -.433
Extraction Method: Principal Component
Analysis. Rotation Method: Oblimin with Kaiser
Normalization.
Component CorrelationMatrix
Compon
ent 1 2

1 1.000 .037
2 .037 1.000
Extraction Method: Principal
Component Analysis. Rotation
Method: Oblimin with Kaiser
Normalization.
Scale: ALL VARIABLES
Case Processing Summary
N %
Cases Valid 2462 100.0
Excludeda 0 .0
Total 2462 100.0
a. Listwise deletion based on all variables in the
procedure.
Reliability Statistics
Cronbach's Alpha N of Items
.042 5
Correlation Matrixa
Parents'
discussion Father help
Mother helping
hour parents' reward
Correlation Parents' discussion 1.000 -.181 -.080 -.115
Father help -.181 1.000 .134 .086
Mother helping hour -.080 .134 1.000 .049
parents' reward -.115 .086 .049 1.000
Sig. (1-tailed) Parents' discussion .000 .000 .000
Father help .000 .000 .000
Mother helping hour .000 .000 .008
parents' reward .000 .000 .008
a. Determinant = .929

KMO and Bartlett’s Test
Kaiser-Meyer-Olkin Measure
of Sampling Adequacy.
.575
Bartlett's Test of Sphericity Approx. Chi-Square 180.791
df 6
Sig. .000
Communalities
Initial Extraction
Parents' discussion 1.000 .417
Father help 1.000 .451
Mother helping hour 1.000 .244
parents' reward 1.000 .220
Extraction Method: Principal Component
Analysis.
Total Variance Explained
Compon
ent
Initial Eigenvalues
Total % of Variance Cumulative %
1 1.333 33.322
2 .963 24.078 57.400
3 .898 22.456 79.856
4 .806 20.144 100.000
Extraction Method: Principal Component Analysis.
Total Variance Explained
Compon
ent
Initial
Eigenvalues Extraction Sums of Squared Loadings
Cumulative % Total % of Variance Cumulative %
1 33.322 1.333 33.322 33.322
Extraction Method: Principal Component Analysis.

Component Matrixa
Component
1
Parents' discussion -.646
Father help .672
Mother helping hour .494
parents' reward .470
Extraction Method: Principal
Component Analysis.
a. 1 components extracted.
Correlation Matrixa
Father help
Mother helping
hour
Correlation Father help 1.000 .134
Mother helping hour .134 1.000
parents' reward .086 .049
Parent discussion in reverse
way
.250 .111
Sig. (1-tailed) Father help .000
Mother helping hour .000
parents' reward .000 .008
Parent discussion in reverse
way
.000 .000
a. Determinant = .898
Correlation Matrixa
parents' reward
Parent
discussion in
reverse way
Correlation Father help .086 .250
Mother helping hour .049 .111
parents' reward 1.000 .117

Parent discussion in reverse
way
.117 1.000
Sig. (1-tailed) Father help .000 .000
Mother helping hour .008 .000
parents' reward .000
Parent discussion in reverse
way
.000
a. Determinant = .898
KMO and Bartlett’s Test
Kaiser-Meyer-Olkin Measure
of Sampling Adequacy.
.578
Bartlett's Test of Sphericity Approx. Chi-Square 264.113
df 6
Sig. .000
Communalities
Initial Extraction
Father help 1.000 .489
Mother helping hour 1.000 .236
parents' reward 1.000 .177
Parent discussion in reverse
way
1.000 .494
Extraction Method: Principal Component Analysis.
Total Variance Explained
Compon
ent
Initial Eigenvalues
Total % of Variance Cumulative %
1 1.396 34.896
2 .957 23.918 58.814
3 .901 22.522 81.336
4 .747 18.664 100.000
Extraction Method: Principal Component Analysis.

Total Variance Explained
Compon
ent
Initial
Eigenvalues Extraction Sums of Squared Loadings
Cumulative % Total % of Variance Cumulative %
1 34.896 1.396 34.896 34.896
Extraction Method: Principal Component Analysis.
Component Matrixa
Component
1
Father help .699
Mother helping hour .486
parents' reward .420
Parent discussion in reverse
way
.703
Scale: ALL VARIABLES
Case Processing Summary
N %
Cases Valid 2462 100.0
Excludeda 0 .0
Total 2462 100.0
a. Listwise deletion based on all variables in the
procedure.
Reliability Statistics
Cronbach's Alpha N of Items
.042 5
Scale: ALL VARIABLES
Case Processing Summary
N %
Cases Valid 2462 100.0

Excludeda 0 .0
Total 2462 100.0
a. Listwise deletion based on all variables in the
procedure.
Reliability Statistics
Cronbach's Alpha N of Items
.001 4
Scale: ALL VARIABLES
Case Processing Summary
N %
Cases Valid 2462 100.0
Excludeda 0 .0
Total 2462 100.0
a. Listwise deletion based on all variables in the
procedure.
Reliability Statistics
Cronbach's Alpha N of Items
.347 4

APPENDIX 8.14
OUTPUT FROM MLWin
1: Research Question one:
Correlation
School level
Class level

Student level
With prior attainment

Correlation
School
Class

Student
5.2. ANSWERING THE SECOND RESEARCH QUESTION: How much students’
personal and family (background) characteristics influence i) grade 10 students’
academic attainment and academic self-concept and ii) progress (taking account
of prior attainment):
Academic attainment

With missing data

Academic self-concept

With missing data (self-concept)

Progress ( 3 level analysis)

Progress (no missing data)

5.3. ANSWERING THE THIRD RESEARCH QUESTION: How much teacher
characteristics influence students’ attainment or self-concept, after control of the
influence of prior attainment and background factor?
A) Teacher characteristics influence students’ attainment, after control of
the influence of prior attainment and background factor?

No Missing data

B) Teacher characteristics influence students’ self-concept, after control
of the influence of prior attainment and background factor?


Table with no missing data

Research question 4:

A. With Large sample


Reduced sample size

