jama | originalinvestigation ... · copyright 2016 american medical association. all rights...
TRANSCRIPT

Copyright 2016 American Medical Association. All rights reserved.
Implementation of a Value-Driven Outcomes Programto Identify High Variability in Clinical Costs and Outcomesand Association With Reduced Cost and Improved QualityVivian S. Lee, MD, PhD, MBA; Kensaku Kawamoto, MD, PhD, MHS; Rachel Hess, MD, MS; Charlton Park, MBA, MHSM; Jeffrey Young, MS;Cheri Hunter, BS; Steven Johnson, LSMBB, MBA; Sandi Gulbransen, BSIE; Christopher E. Pelt, MD; Devin J. Horton, MD;Kencee K. Graves, MD; Tom H. Greene, PhD; Yoshimi Anzai, MD, MPH; Robert C. Pendleton, MD
IMPORTANCE Transformation of US health care from volume to value requires meaningfulquantification of costs and outcomes at the level of individual patients.
OBJECTIVE To measure the association of a value-driven outcomes tool that allocates costs ofcare and quality measures to individual patient encounters with cost reduction and healthoutcome optimization.
DESIGN, SETTING, AND PARTICIPANTS Uncontrolled, pre-post, longitudinal, observationalstudy measuring quality and outcomes relative to cost from 2012 to 2016 at University ofUtah Health Care. Clinical improvement projects included total hip and knee jointreplacement, hospitalist laboratory utilization, and management of sepsis.
EXPOSURES Physicians were given access to a tool with information about outcomes, costs(not charges), and variation and partnered with process improvement experts.
MAIN OUTCOMES AND MEASURES Total and component inpatient and outpatient direct costsacross departments; cost variability for Medicare severity diagnosis related groups measuredas coefficient of variation (CV); and care costs and composite quality indexes.
RESULTS From July 1, 2014, to June 30, 2015, there were 1.7 million total patient visits, including34 000 inpatient discharges. Professional costs accounted for 24.3% of total costs for inpatientepisodes ($114.4 million of $470.4 million) and 41.9% of total costs for outpatient visits($231.7 million of $553.1 million). For Medicare severity diagnosis related groups with the highesttotal direct costs, cost variability was highest for postoperative infection (CV = 1.71) and sepsis(CV = 1.37) and among the lowest for organ transplantation (CV � 0.43). For total jointreplacement, a composite quality index was 54% at baseline (n = 233 encounters) and 80%1 year into the implementation (n = 188 encounters) (absolute change, 26%; 95% CI, 18%-35%;P < .001). Compared with the baseline year, mean direct costs were 7% lower in theimplementation year (95% CI, 3%-11%; P < .001) and 11% lower in the postimplementation year(95% CI, 7%-14%; P < .001). The hospitalist laboratory testing mean cost per day was $138(median [IQR], $113 [$79-160]; n = 2034 encounters) at baseline and $123 (median [IQR],$99 [$66-147]; n = 4276 encounters) in the evaluation period (mean difference, −$15; 95% CI, −$19to −$11; P < .001), with no significant change in mean length of stay. For a pilot sepsis intervention,themeantimetoanti-infectiveadministrationfollowingfulfillmentofsystemicinflammatoryresponsesyndrome criteria in patients with infection was 7.8 hours (median [IQR], 3.4 [0.8-7.8] hours;n = 29 encounters) at baseline and 3.6 hours (median [IQR], 2.2 [1.0-4.5] hours; n = 76 encounters)in the evaluation period (mean difference, −4.1 hours; 95% CI, −9.9 to −1.0 hours; P = .02).
CONCLUSIONS AND RELEVANCE Implementation of a multifaceted value-driven outcomes toolto identify high variability in costs and outcomes in a large single health care system wasassociated with reduced costs and improved quality for 3 selected clinical projects. There maybe benefit for individual physicians to understand actual care costs (not charges) andoutcomes achieved for individual patients with defined clinical conditions.
JAMA. 2016;316(10):1061-1072. doi:10.1001/jama.2016.12226
Editorial page 1047
Author Audio Interview
Supplemental content
CME Quiz atjamanetworkcme.com
Author Affiliations: University ofUtah, Salt Lake City.
Corresponding Author: Vivian S.Lee, MD, PhD, MBA, University ofUtah Senior Vice President’s Office,175 N Medical Dr E, ClinicalNeurosciences Bldg, Salt Lake City,UT 84132 ([email protected]).
Research
JAMA | Original Investigation | INNOVATIONS IN HEALTH CARE DELIVERY
(Reprinted) 1061
Copyright 2016 American Medical Association. All rights reserved.
Downloaded From: on 09/08/2018
Copyright 2016 American Medical Association. All rights reserved.
F ee-for-service payment models reward care volume overvalue.1,2 Under fee-for-service models, health care costsare increasing at a rate of 5.3% annually, accounted for
17.7% of the US gross domestic product in 2014, and are pro-jected to increase to 19.6% of the gross domestic product by2024.3 Value-based payment models and alternative pay-ment models incentivize the provision of efficient, high-quality, patient-centered care through financial penalties andrewards.4 Under alternative payment models, clinicians willtheoretically deliver higher-quality care that results in betteroutcomes, fewer complications, and reduced health carespending. To implement alternative payment models effec-tively, physicians must understand actual care costs (notcharges) and outcomes achieved for individual patients withdefined clinical conditions—the level at which they can mostdirectly influence change.
Few large health care organizations have accurately mea-sured total care costs at the individual patient level and haverelated costs to quality.5,6 In 2012, University of Utah HealthCare initiated an enterprise-wide effort to improve clinical out-comes and reduce costs and built a management and report-ing tool, called value-driven outcomes, that allows cliniciansand managers to analyze actual system costs and outcomes atthe level of individual encounters and by department, physi-cian, diagnosis, and procedure.7
This report describes how the value-driven outcomestool was used to (1) identify overall care costs across the healthcare system, (2) measure cost variability across Medicareseverity diagnosis related groups (MS-DRGs) to identify thegreatest opportunities for cost reduction and outcome opti-mization, and (3) support value improvement initiatives for se-lected conditions.
MethodsThe project was reviewed by the University of Utah Institu-tional Review Board and was deemed not to meet the defini-tion of human subjects research. It was therefore exempt frominstitutional review board oversight, and informed consent wasnot required.
Value-Driven OutcomesThe value-driven outcomes tool uses the definition of valueby Porter and Teisberg8: health outcomes achieved per dollarspent, in which outcomes are measured in terms of quality met-rics, such as the patient’s overall health status and the avoid-ance of hospital-acquired morbidities. The value-driven out-comes tool is a modular, extensible framework that allocatescare costs to individual patient encounters. It draws informa-tion from the health care system’s enterprise data ware-house, which includes data on patient encounters; nationalquality metrics and clinician-defined metrics; supply, phar-macy, imaging, and laboratory utilization; human resource uti-lization; and the general ledger (ie, the organization’s com-plete record of financial transactions). The value-drivenoutcomes tool uses these data to calculate and integrate costinformation with relevant quality and outcome measures.7
Identifying Overall Health Care System CostsAccurately assigning costs is complex and can take multipleperspectives, including those of the health care system, payer,patient, or society. To understand the role of prospective pay-ment in the health care system context, the value-driven out-comes cost accounting approach takes the health care systemperspective and identifies costs attributable to direct patientcare. Certain large groups of costs, such as space, equipment,labor, and professional time, are allocated based on a pa-tient’s estimated use of those resources, whereas costs for sup-plies, medications, and contracted services are based on thehealth care system’s actual acquisition costs. Physician costsare allocated according to work relative value units (wRVUs)as follows: physician salary and benefits are multiplied by thepercentage of effort devoted to clinical care; education, re-search, and service (eg, committee and administrative work)are not included in the percentage of effort. Annual clinicalcompensation divided by annual wRVUs produces a measureof cost (in dollars) per wRVU for each physician7 (Table 1). Forthe analysis of overall health system costs, total direct care costsfor inpatient admissions and outpatient visits were deter-mined overall and by major departments from July 1, 2014,through June 30, 2015.
Identifying the Greatest Opportunities for Cost Reductionand Outcome OptimizationIdentifying Cost VariabilityFor every MS-DRG (such as MS-DRG 470, major joint replace-ment of the lower extremity without major complications orcomorbidities, and MS-DRG 871, sepsis), the overall cost perunit or cost per case, the components of that cost (Table 1),and cost variability were identified. Variability was calculatedusing the coefficient of variation (CV; standard deviationdivided by mean) to standardize the measure of dispersionacross conditions. Highly variable, high-cost conditions wereidentified as potential areas for care standardization andvalue improvement.
Defining OutcomesClinical teams consisting of physicians, nurses, administra-tors, and quality improvement staff defined clinically relevant
Key PointsQuestion Is use of an analytic tool that allocates clinical care costsand quality measures to individual patient encounters in a healthcare system associated with reduced costs and improved patientoutcomes?
Findings In this observational study in a health care system with1.7 million patient visits per year, costs of care varied considerably.In pre-post comparisons, implementation of the analytic tool wasassociated with a significant decrease in costs (7%-11% for totaljoint replacement and 11% for laboratory testing) andimprovement in quality.
Meaning Implementation of a tool that provides physicianswith information about the costs of clinical care and quality forindividual patients with defined conditions was associated witha reduction in costs and improvement in quality.
Research Original Investigation Value-Driven Outcomes Program and Health Care Cost and Quality
1062 JAMA September 13, 2016 Volume 316, Number 10 (Reprinted) jama.com
Copyright 2016 American Medical Association. All rights reserved.
Downloaded From: on 09/08/2018

Copyright 2016 American Medical Association. All rights reserved.
and patient-centered outcomes, which were then queriedfrom the data warehouse. Outcomes included risk-adjustedmortality,9 patient safety measures (eg, hospital-acquired in-fections), clinical process measures, and unplanned hospitalreadmissions or emergency department visits. Patient satis-faction data10 and patient-reported outcomes (including physi-cal and emotional functioning) were collected directly frompatients using surveys such as the Patient-Reported Out-comes Measurement Information System.11 Elements of careprovision, including key quality indexes, were collected on ev-ery case.
Additionally, the care team selected key quality and out-come variables that were combined into a single binary mea-sure termed perfect care. If a continuous variable was chosenas a key variable, the team established an evidence-basedthreshold (for example, for time receiving mechanical venti-lation following coronary artery bypass grafting surgery, <24hours of time would be considered perfect care). If a compos-ite index was included (such as Surgical Care ImprovementProject [SCIP] composite), it was treated as an all-or-none mea-sure; 1 SCIP failure would result in a perfect care score of 0.Perfect care was set to 1 for an encounter only if the care teamaccomplished all the key elements. The perfect care index isreported as the percentage of perfect care encounters per pe-riod of measurement (see eTable 1 in the Supplement for ex-amples of perfect care indexes).
Using Value-Driven Outcomes to Improve CareMultidisciplinary value improvement teams included clini-cians, administrative leaders, and process engineers. Afterthese teams defined the key metrics for quality and perfectcare, they viewed and monitored care costs and quality met-rics (Table 2) using institutional web-based value-driven out-comes visualization tools. The data were used to provide feed-back to clinicians monthly on an individual patient basis oraggregated at the clinician or service-line level to facilitatebroader understanding of variations in cost and quality. Ex-amples of individual patient–specific reports are included ineFigure 1 and eFigure 2 in the Supplement. Cost and outcomevariability among physicians were used to identify opportu-nities for clinical improvement.
Three of the initial 5 pilot improvement projects are re-ported herein: total joint replacement of the lower extremity(hip and knee), hospitalist laboratory utilization, and sepsis
management. Total joint replacement and sepsis were iden-tified as initial pilots based on an opportunity assessment oftotal volume, total cost, and high variation using the value-driven outcomes cost variation analyses. Laboratory utiliza-tion was selected as an initiative to use value-driven out-comes data to improve care across clinical conditions withina specific direct cost category and was based on the ChoosingWisely campaign12 and interinstitutional benchmarking
Table 1. Value-Driven Outcomes Approach to Assigning Direct Costfor a Given Area
Area of Cost Sources of Cost DataMethod of CostAssignment
Facilityutilizationa
All facility-paid general ledgerexpenses for operating a clinicalunit where patients can belocated (eg, emergencydepartment, cardiology inpatientward, family medicine clinic),including nursing, space,and equipment costsb
For inpatient units,time the patientspent on the unit;for outpatient clinics,average facilityexpenses for a visitto that clinic
Imagingc All facility-paid general ledgerexpenses for operating animaging unit (eg, magneticresonance imaging unit,computed tomography unit),including equipment, space,and technician costsb
Time-based forpatient use
Laboratorytestingc
Existing contracts Actual patient use
Therapy services All facility-paid general ledgerexpenses associated withoperating a therapy service(eg, respiratory therapy, physicaltherapy), including personneland equipment costsb
Patient use ofservices as identifiedfrom billing charges
Medicationsadministeredc
Acquisition costs Actual patient use
Supplies Acquisition costs Actual patient use
Professionalservices
Physician human resource costsfor clinical care, as well as othergeneral ledger clinical expensespaid by physicians and theirrepresentatives (eg, medicalassistant costs paid by medicalgroup), grouped by unit(eg, cardiology)b
wRVU billing byphysician
Abbreviation: wRVU, work relative value unit.a Costs related to maintenance, renovation, and new construction are
considered indirect costs and are not included in the direct costs.b General ledger expenses for clinical units refer to all expenses recorded in the
organization’s complete record of financial transactions.c Outpatient laboratory, pharmacy (medications administered), and imaging
costs include only that care delivered at the University of Utah.
Table 2. Examples of Value-Driven Outcomes Metrics
Metric Measure Description Visualization TechniqueOpportunityindex
Coefficient ofvariation multipliedby total direct cost
At the MS-DRG level, standard deviation of totaldirect costs of care across patients divided bymean of total direct costs per encounter, thenmultiplied by total direct costs for the systemacross all patients for this MS-DRG per year
Tables and bubble charts
Physician carecosts
Mean cost For a given patient, the total wRVUs attributedto a physician multiplied by the cost (in dollars)per wRVU calculated for that physicianfor that year
Tables, column charts,and bubble charts
Perfect careindex
Aggregate ofmultiple quality andoutcome measures
For each patient, attainment of all quality andoutcome measures achieves a perfect care scoreof 1; failure in any area means a perfect carescore of 0; index is reported as % of patientencounters in which perfect care is achieved
Tables and charts,typically plotted againsttime, alongside cost data Abbreviations: MS-DRG, Medicare
severity diagnosis related group;wRVU, work relative value unit.
Value-Driven Outcomes Program and Health Care Cost and Quality Original Investigation Research
jama.com (Reprinted) JAMA September 13, 2016 Volume 316, Number 10 1063
Copyright 2016 American Medical Association. All rights reserved.
Downloaded From: on 09/08/2018

Copyright 2016 American Medical Association. All rights reserved.
through the University HealthSystem Consortium. The 2 pi-lot projects not discussed herein were coronary artery bypassgrafting surgery and hip fracture care, owing to delays in proj-ect initiation.
Statistical AnalysisAll evaluations were based on direct comparisons of outcomesbetween designated time intervals preceding and following theexposures without adjustment for covariates (such as age, sex,race, and socioeconomic status).
Total Joint ReplacementChanges in mean costs and length of stay after exposureswere assessed using a 12-month baseline period of April 1,2012, to March 31, 2013, and successive 12-month evalua-tion periods of April 1, 2013, to March 31, 2014, and April 1,2014, to March 31, 2015. Costs were normalized to the meancost during the baseline period. The proportions of patientsmeeting initial and modified perfect care criteria were com-pared between designated 4-month intervals. Two patientswhose costs exceeded the mean cost by more than 5 SDs onthe log scale were excluded from cost analyses. Only attend-ing physicians who practiced during the entire study periodwere included.
Hospitalist Laboratory UtilizationChanges in daily laboratory utilization, daily laboratory costs,length of stay, and risk of 30-day readmission were assessedbetween a baseline period of July 1, 2012, to January 31, 2013,and an evaluation period of February 1, 2013, to April 30, 2014,which followed exposure to education (a 30-minute baselinedidactic lecture on laboratory overuse and associated cost im-plications and provision of a pocket card outlining cost differ-ences between common laboratory tests).
Sepsis Value ImprovementThe primary evaluation of the sepsis value improvementproject was the time from systemic inflammatory responsesyndrome (SIRS) criteria13 being met to first anti-infectiveagent administration. Criteria for SIRS have historically beenused to diagnose sepsis in the context of infection. Allpatients evaluated in this analysis were selected by Interna-tional Classification of Diseases, Ninth Revision codes andInternational Statistical Classification of Diseases and RelatedHealth Problems, Tenth Revision codes for sepsis; as such, allwere presumed to have infection and should have receivedan anti-infective agent. Patients who did not have a diagnos-tic code for sepsis were not considered in this analysis. Forpatients who received anti-infective agents prior to meetingSIRS criteria, the time to anti-infective agent administrationwas considered to be 0 hours. Secondary evaluation mea-sures included length of stay, mortality, and total direct costnormalized to the baseline mean cost. The proportions ofpatients with anti-infective agents administered within 24hours of meeting SIRS criteria for nosocomial and multidrug-resistant infections as well as community-acquired infectionswere measured to assess whether the pattern of anti-infective agent use changed. The baseline period was July 1,
2014, to December 31, 2014, and the evaluation period wasNovember 2, 2015, to February 29, 2016. Potential sepsiscases were identified through billing data and confirmed byphysician medical record audit. Patients were excluded ifthey never received anti-infective agents, did not have docu-mentation of infection or sepsis (based on diagnostic code),or were transferred from another hospital while receivinganti-infective agents.
Details of Statistical ModelsDescriptive summaries are provided as counts and percent-ages for binary variables and as means and standard devia-tions for numeric variables, with medians and interquartileranges (IQRs) also provided for highly skewed continuousvariables. Proportions of deaths were compared between theevaluation and baseline periods of the sepsis project usingFisher exact tests; generalized linear models14 were used toanalyze changes between the baseline and evaluation periodsfor all other outcomes. The generalized linear models usedbinary outcomes for comparisons of perfect care indexes,30-day mortality, and the proportions of patients with anti-infective agents administered for nosocomial and multidrug-resistant infections and for community-acquired infections.Gamma outcomes were used for costs, length of stay, andtime to administration of anti-infective agents.
For each of these outcomes, log and identity link func-tions were used to evaluate relative change and absolutechange, respectively. Negative binomial outcome models withlog link functions and offset equal to log length of stay wereused to analyze relative changes in the number of tests or-dered per day, including basic metabolic panels, completemetabolic panels, and complete blood counts. A Taylor seriesapproximation was applied to the results of these analyses toevaluate absolute changes in numbers of laboratory tests perday. In the joint replacement and laboratory utilization proj-ects, statistical inferences were performed using asymptoticlikelihood ratio or Wald statistics. To account for positive skew-ness and smaller sample sizes, confidence intervals in the sep-sis project were obtained using the bias-correction and accel-erated bootstrap method15 with 1000 bootstrap samples, andP values were computed using permutation tests.
The joint replacement and laboratory utilization analy-ses were conducted using SAS version 9.4 statistical software(SAS Institute Inc). The sepsis analysis was performed usingR version 3.3.0 statistical software (R Foundation). All hypoth-esis tests were performed using 2-sided α = .05 without ad-justment for multiple comparisons.
ResultsOverall Care CostsDuring the fiscal year from July 1, 2014, to June 30, 2015(Table 3), University of Utah Health Care had approximately34 000 inpatient discharges, 52 000 emergency departmentvisits, and 1.7 million total patient visits.
Inpatient total direct care costs ($470.4 million) ac-counted for 46.0% of total direct costs, and outpatient direct
Research Original Investigation Value-Driven Outcomes Program and Health Care Cost and Quality
1064 JAMA September 13, 2016 Volume 316, Number 10 (Reprinted) jama.com
Copyright 2016 American Medical Association. All rights reserved.
Downloaded From: on 09/08/2018

Copyright 2016 American Medical Association. All rights reserved.
costs ($553.1 million) accounted for 54.0%. For inpatient care,facility utilization (37.7%) and professional services (24.3%)were the largest cost components. Table 3 also shows total an-nual direct costs by discharge department (inpatient). Re-source use varied considerably by both department and carelocation. With $151.4 million in inpatient costs, the surgery de-partment had the highest overall costs among departments.Together, the surgery and internal medicine departments con-stituted 51.8% of total inpatient costs.
Cost components (eg, laboratory tests, supplies, profes-sional costs) for inpatient and outpatient care varied consid-erably across departments (Table 3). Among inpatient epi-sodes, professional costs accounted for 24.3% of total costs andexceeded 30% for obstetrics and gynecology (47.5%) and neu-rosurgery (32.9%). Supply costs represented 32.0% of all or-thopedic surgery inpatient costs and 16.8% of all neurosur-gery inpatient costs. Laboratory costs also varied considerably.For example, 7.0% of inpatient costs in internal medicine wereattributable to laboratory testing, compared with 2.8% for neu-rosurgery and 2.6% for orthopedic surgery.
Table 3 also shows total annual direct costs by physiciandepartment for outpatient visits. With $107.2 million in out-patient costs, the surgery department had the highest overallcosts among departments. Together, the surgery and internalmedicine departments constituted 49.3% of total outpatientcosts. For outpatient care, professional services (41.9%),facility utilization (18.4%), and therapy services (eg, physicaland respiratory therapy; 14.2%) were the largest components(Table 3). Among outpatient visits, professional costsaccounted for 41.9% of total costs overall, with pediatrics(78.6%), dermatology (77.3%), and family and preventivemedicine (62.4%) exceeding 60%; however, these 3 depart-ments had among the lowest supply and medication costs.
Cost VariabilityTotal professional and facility costs for the MS-DRG dischargediagnoses with the highest total direct costs over 1 year and theirCVs across hospitalizations are shown in Table 4. The total costand CV provided an assessment of the largest potential oppor-tunities for value improvement through care standardization.
Table 3. Inpatient and Outpatient Total Direct Care Costs Overall and by Major Departments, From July 1, 2014, to June 30, 2015
Department
Cost, $ in Millions (% of Total Department)FacilityUtilization Imaginga Laboratorya
TherapyServices
AdministeredMedicationsa Supply
TotalProfessional Total
Inpatient
Internal medicine 30.0 (32.5) 1.1 (1.2) 6.4 (7.0) 15.9 (17.3) 14.1 (15.3) 6.6 (7.1) 18.1 (19.6) 92.2
Neurology 2.5 (32.9) 0.2 (2.8) 0.3 (3.5) 1.7 (22.6) 0.7 (9.4) 0.2 (2.8) 1.9 (26.0) 7.5
Neurosurgery 13.5 (25.7) 1.2 (2.3) 1.5 (2.8) 7.6 (14.6) 2.6 (5.0) 8.8 (16.8) 17.3 (32.9) 52.5
Obstetrics and gynecology 7.4 (32.3) 0.1 (0.4) 0.7 (3.1) 1.5 (6.7) 1.8 (7.7) 0.5 (2.2) 10.9 (47.5) 23.0
Orthopedic surgery 13.0 (25.5) 0.8 (1.5) 1.3 (2.6) 4.3 (8.5) 2.3 (4.4) 16.3 (32.0) 13.0 (25.4) 51.0
Physical medicine andrehabilitation
5.9 (49.5) 0.0 (0.4) 0.2 (1.5) 3.5 (29.7) 0.5 (3.8) 0.2 (1.8) 1.6 (13.3) 11.9
Radiology 4.0 (31.7) 0.4 (3.3) 0.7 (5.8) 1.9 (15.1) 1.5 (11.6) 1.2 (9.9) 2.8 (22.7) 12.6
Surgery 54.7 (36.1) 0.9 (0.6) 7.5 (5.0) 15.5 (10.3) 12.6 (8.3) 26.5 (17.5) 33.7 (22.3) 151.4
Other departments 41.8 (62.4) 0.2 (0.3) 1.5 (1.7) 5.0 (7.4) 2.3 (3.4) 1.3 (1.9) 15.3 (22.9) 66.9
All departments 177.1 (37.7) 4.5 (1.0) 20.0 (4.2) 55.4 (11.8) 37.8 (8.0) 61.2 (13.0) 114.4 (24.3) 470.4
Outpatient
Dermatology 1.8 (7.8) 0.0 (0.1) 0.3 (1.2) 1.3 (5.5) 1.7 (8.0) 0.0 (0.1) 18.0 (77.3) 23.1
Family and preventive medicine 6.2 (20.1) 1.4 (4.4) 2.1 (6.9) 1.1 (3.6) 0.8 (2.5) 0.1 (0.1) 19.2 (62.4) 30.7
Internal medicine 20.1 (12.2) 4.0 (2.4) 8.8 (5.3) 30.0 (18.1) 50.8 (30.7) 8.6 (5.2) 43.4 (26.2) 165.6
Neurology 3.6 (22.0) 0.8 (4.8) 0.5 (3.0) 1.6 (9.9) 4.0 (24.6) 0.1 (0.2) 5.8 (35.6) 16.4
Neurosurgery 2.9 (18.9) 0.8 (5.5) 0.1 (0.6) 0.9 (5.6) 1.4 (9.4) 4.0 (25.8) 5.3 (34.3) 15.4
Obstetrics and gynecology 6.3 (23.3) 1.4 (5.2) 1.7 (6.4) 2.8 (10.6) 0.9 (3.5) 0.6 (2.1) 13.1 (48.9) 26.8
Ophthalmology 9.1 (23.5) 0.1 (0.1) 0.1 (0.2) 2.9 (7.4) 6.2 (16.0) 1.8 (4.6) 18.6 (48.2) 38.6
Orthopedic surgery 8.1 (24.2) 1.3 (3.9) 0.2 (0.6) 1.2 (3.5) 1.5 (4.4) 3.6 (10.7) 17.7 (52.9) 33.4
Pathology 0.0 (8.5) 0.0 (3.3) 0.1 (9.8) 0.0 (5.1) 0.2 (32.6) 0.0 (0.0) 0.2 (40.6) 0.5
Pediatrics 1.9 (5.4) 0.2 (0.6) 0.5 (1.4) 1.5 (4.3) 3.2 (9.0) 0.3 (0.7) 27.9 (78.6) 35.6
Physical medicine andrehabilitation
1.5 (25.7) 0.4 (6.8) 0.1 (0.6) 0.1 (2.0) 1.3 (22.6) 0.1 (1.4) 2.4 (41.0) 5.9
Radiation oncology 0.2 (1.7) 0.3 (1.9) 0.1 (0.2) 9.8 (65.8) 0.1 (0.7) 0.2 (1.2) 4.3 (28.5) 14.9
Radiology 0.9 (11.3) 1.1 (13.6) 0.1 (1.7) 0.6 (7.4) 0.2 (2.7) 2.7 (33.9) 2.4 (29.5) 8.0
Surgeryb 30.8 (28.7) 3.1 (2.9) 2.1 (2.0) 16.6 (15.5) 3.2 (3.0) 8.6 (8.0) 42.7 (39.9) 107.2
Other departments 8.6 (27.9) 1.2 (3.9) 0.5 (1.5) 8.0 (25.9) 0.9 (2.9) 0.9 (2.8) 10.8 (35.1) 30.7
All departments 102.0 (18.4) 16.1 (2.9) 17.1 (3.1) 78.4 (14.2) 76.6 (13.9) 31.2 (5.6) 231.7 (41.9) 553.1a Outpatient laboratory, pharmacy (medications administered), and imaging costs include only that care delivered at the University of Utah.b Emergency department is included in the department of surgery.
Value-Driven Outcomes Program and Health Care Cost and Quality Original Investigation Research
jama.com (Reprinted) JAMA September 13, 2016 Volume 316, Number 10 1065
Copyright 2016 American Medical Association. All rights reserved.
Downloaded From: on 09/08/2018

Copyright 2016 American Medical Association. All rights reserved.
As shown in Table 4, patient conditions with the highestCV included postoperative infection (MS-DRG 853; CV = 1.71;magnitude of difference between lowest and highest total di-rect cost per patient = $225 927) and sepsis (MS-DRG 871;CV = 1.37; magnitude of difference between lowest and high-est total direct cost per patient = $210 679), both areas of cur-rent clinical improvement work. For the highest-volumeelective procedures, component cost variability was also ex-amined. Total joint replacement of the lower extremity(MS-DRG 470) showed an overall CV of 0.33. However, the 2largest component costs, supply costs (CV = 0.66; magnitudeof difference between lowest and highest total supply directcost per patient = $20 966) and facility utilization costs(CV = 0.44; magnitude of difference between lowest and high-est total facility utilization direct cost per patient = $12 085),illustrated higher variability, suggesting an important focus areafor improvement.
Selected Clinical Improvement ProjectsThe clinical characteristics of the patients in the baseline pe-riod and in the evaluation period for each of the 3 clinical im-provement projects are provided in eTable 2 in the Supple-ment. Results from the 3 projects are provided in Table 5.
Total Joint ReplacementOrthopedic surgeons identified lower extremity joint replace-ment (MS-DRG 470) as a high-volume elective procedure as-sociated with variability in supply and facility utilization costs(Table 4). In November 2012, a team led by an orthopedic sur-geon and facilitated by a process engineer developed a con-sensus clinical pathway for patients undergoing hip and kneejoint replacement (eFigure 3 in the Supplement).
The multidisciplinary team defined a perfect care indexfor joint replacement comprising 6 nationally and locally de-fined quality indicators: (1) 30-day readmission; (2) SCIPcomposite16; (3) 35 Hospital Acquired Condition/Patient SafetyIndicator measures17,18; (4) admission to the orthopedic acutecare unit during hospitalization; (5) early mobility (out of bedon day of surgery); and (6) emergency department visit within90 days of discharge.
Care process redesign began in April 2013 and included 1component of the care pathway intervention, early mobility,19,20
as has been previously reported.21 After 1 year, the 4-monthmean perfect care index increased from 54% to 80% (26% in-crease; 95% CI, 18%-35%; P < .001). Because several compo-nents of the initial perfect care index were consistently beingmet (readmission, SCIP composite, early mobility), the team
Table 4. MS-DRG Diagnoses With Highest Total Direct Costsa
MS-DRGMost Common Primary ICD-9Discharge Diagnosis
CV ofDirect Costsb
DischargingPhysicians,No.c
TotalDirect Cost, $
853, Postoperative infection 038.9, Unspecified septicemia 1.71 78 6 367 587
871, Sepsis 038.9, Unspecified septicemia 1.37 195 10 277 210
791, Prematurity (neonate) V30.00, Single livebornwithout cesarean delivery
1.11 45 3 563 059
927, Extensive burns 943.31, Full-thickness skin lossdue to burn of forearm
1.05 4 4 217 139
765, Cesarean delivery 654.21, Cesarean deliverywithout antepartum condition
0.87 61 3 501 422
790, Extreme immaturityor RDS (neonate)
V30.01, Single livebornby cesarean delivery
0.86 45 11 156 500
945, Rehabilitation V57.89, Other specifiedrehabilitation procedure
0.78 47 11 940 543
003, ECMO or ventilation 430, Subarachnoid hemorrhage 0.73 54 18 152 760
025, Craniotomy,endovascular procedure
225.2, Benign neoplasm ofcerebral meninges
0.73 26 8 766 040
014, Allogeneic bonemarrow transplant
204.00, Acute lymphoid leukemiawithout achieved remission
0.58 11 3 595 457
897, Alcohol or drug abuse 291.81, Alcohol withdrawal 0.56 56 4 746 488
775, Vaginal delivery 645.11, Postterm deliverywithout antepartum condition
0.54 122 6 103 694
219, Cardiac valve 424.1, Aortic valve disorders 0.50 6 3 929 829
005, Liver transplant 070.44, Chronic hepatitis Cwith hepatic coma
0.43 4 6 863 669
001, Heart transplantor implant
428.23, Acute on chronic systolicheart failure
0.43 3 11 388 979
473, Cervical spinal fusion 721.1, Cervical spondylosiswith myelopathy
0.37 15 3 392 178
460, Spinal fusion(except cervical)
724.03, Spinal stenosis of lumbarregion with neurogenicclaudication
0.37 14 8 913 159
470, Major joint replacement(lower extremity)
715.36, Localized osteoarthrosisof lower leg
0.33 17 10 602 664
652, Kidney transplant 403.91, Hypertensive chronickidney disease, unspecified
0.14 3 8 164 310
Abbreviations: CV, coefficient ofvariation; ECMO, extracorporealmembrane oxygenation;ICD-9, International Classificationof Diseases, Ninth Revision;MS-DRG, Medicare severity diagnosisrelated group; RDS, respiratorydistress syndrome.a The opportunity index described
in Table 2 is derived by multiplyingthe CV of direct costs by the totaldirect costs.
b The CVs (standard deviation dividedby mean) are shown for direct costsof care across all patient episodesfrom July 1, 2014, to June 30, 2015,for the conditions accounting forhighest total direct costs of carefor the organization.
c Discharging physicians data reflectthe number of physicians whodischarged patients under eachselected MS-DRG.
Research Original Investigation Value-Driven Outcomes Program and Health Care Cost and Quality
1066 JAMA September 13, 2016 Volume 316, Number 10 (Reprinted) jama.com
Copyright 2016 American Medical Association. All rights reserved.
Downloaded From: on 09/08/2018

Copyright 2016 American Medical Association. All rights reserved.
Table 5. Results From Value Improvement Projects
Outcome Measure
Period Descriptive SummaryaStatistical Comparison of Evaluationvs Baseline Periods
Baseline Evaluation Baseline EvaluationAbsolute Change(95% CI)b
Relative Change,% (95% CI)c P Valued
Total Joint Replacement
Perfect care encounters,No. (%)e
Definition 1 12/2012-3/2013 1/2014-4/2014 126 (54)(n = 233)
151 (80)(n = 188)
26 (18 to 35) 49 (30 to 71) <.001
Definition 2 5/2013-8/2013 12/2014-3/2015 112 (50)(n = 222)
138 (65)(n = 211)
15 (6 to 24) 30 (10 to 53) .002
Length of stay,mean (SD), d
First evaluation year 4/2012-3/2013 4/2013-3/2014 3.50 (1.53)(n = 636)
3.17 (1.21)(n = 637)
−0.33(−0.47 to −0.20)
−9.5(−13.0 to −5.8)
<.001
Second evaluation year 4/2012-3/2013 4/2014-3/2015 3.50 (1.53)(n = 636)
2.88 (1.16)(n = 658)
−0.63(−0.76 to −0.50)
−18.0(−21.1 to −14.6)
<.001
Cost per admission,normalized to meanat baseline, mean (SD)
First evaluation year 4/2012-3/2013 4/2013-3/2014 1.00 (0.50)(n = 634)
0.93 (0.39)(n = 637)
NAf −7 (−11 to −3) <.001
Second evaluation year 4/2012-3/2013 4/2014-3/2015 1.00 (0.50)(n = 634)
0.89 (0.38)(n = 658)
NAf −11 (−14 to −7) <.001
Hospitalist Laboratory Utilization
Metabolic panels,mean (SD), No./d
Basic 7/2012-1/2013 2/2013-4/2014 0.75 (1.03)(n = 2034)
0.63 (1.05)(n = 4276)
−0.13(−0.16 to −0.10)g
−17(−20 to −14)
<.001
Complete 7/2012-1/2013 2/2013-4/2014 0.32 (0.68)(n = 2034)
0.23 (0.58)(n = 4276)
−0.10(−0.13 to −0.07)g
−29(−33 to −25)
<.001
Complete blood counttests, mean (SD), No./d
7/2012-1/2013 2/2013-4/2014 0.92 (0.79)(n = 2034)
0.64 (0.76)(n = 4276)
−0.28(−0.31 to −0.26)g
−30(−32 to −28)
<.001
Length of stay, d 7/2012-1/2013 2/2013-4/2014 (n = 2034) (n = 4276)
Mean (SD) 4.48 (5.12) 4.54 (4.67) 0.06(−0.11 to 0.23)
1 (−2 to 5) .48
Median (IQR) 3.17(2.02-5.00)
3.20(2.10-5.14)
Cost/d, $ 7/2012-1/2013 2/2013-4/2014 (n = 2034) (n = 4276)
Mean (SD) 138 (233) 123 (213) −15 (−19 to −11) −11 (−14 to −8) <.001
Median (IQR) 113 (79-160) 99 (66-147)
30-d readmission,No. (%)
7/2012-1/2013 2/2013-4/2014 280 (14)(n = 2034)
491 (11)(n = 4276)
−2 (−4 to −1) −17 (−27 to −4) .01
Sepsis Value Improvementh
Time to administrationof anti-infective agents, h
Comparison 1 7/2014-12/2014 11/2015-2/2016 (n = 29) (n = 76)
Mean (SD) 7.8 (11.0) 3.6 (4.7) −4.1(−9.9 to −1.0)i
−53(−73 to −11)i
.02j
Median (IQR) 3.4 (0.8-7.8) 2.2 (1.0-4.5)
Comparison 2 7/2014-12/2014 11/2015-2/2016 (n = 157) (n = 76)
Mean (SD) 8.1 (14.4) 3.6 (4.7) −4.5(−7.8 to −2.5)i
−54(−69 to −31)i
<.001j
Median (IQR) 3.7 (1.2-7.8) 2.2 (1.0-4.5)
Length of stay, d
Comparison 1 7/2014-12/2014 11/2015-2/2016 (n = 29) (n = 76)
Mean (SD) 6.0 (7.1) 4.4 (4.5) −1.6(−5.7 to 0.6)i
−27(−58 to 11)i
.20j
Median (IQR) 3.9 (2.9-6.0) 3.0 (2.1-5.1)
Comparison 2 7/2014-12/2014 11/2015-2/2016 (n = 157) (n = 76)
Mean (SD) 6.7 (5.9) 4.4 (4.5) −2.3(−3.5 to −0.9)i
−34(−48 to −12)i
.002j
Median (IQR) 4.9 (3.0-7.9) 3.0 (2.1-5.1)
(continued)
Value-Driven Outcomes Program and Health Care Cost and Quality Original Investigation Research
jama.com (Reprinted) JAMA September 13, 2016 Volume 316, Number 10 1067
Copyright 2016 American Medical Association. All rights reserved.
Downloaded From: on 09/08/2018

Copyright 2016 American Medical Association. All rights reserved.
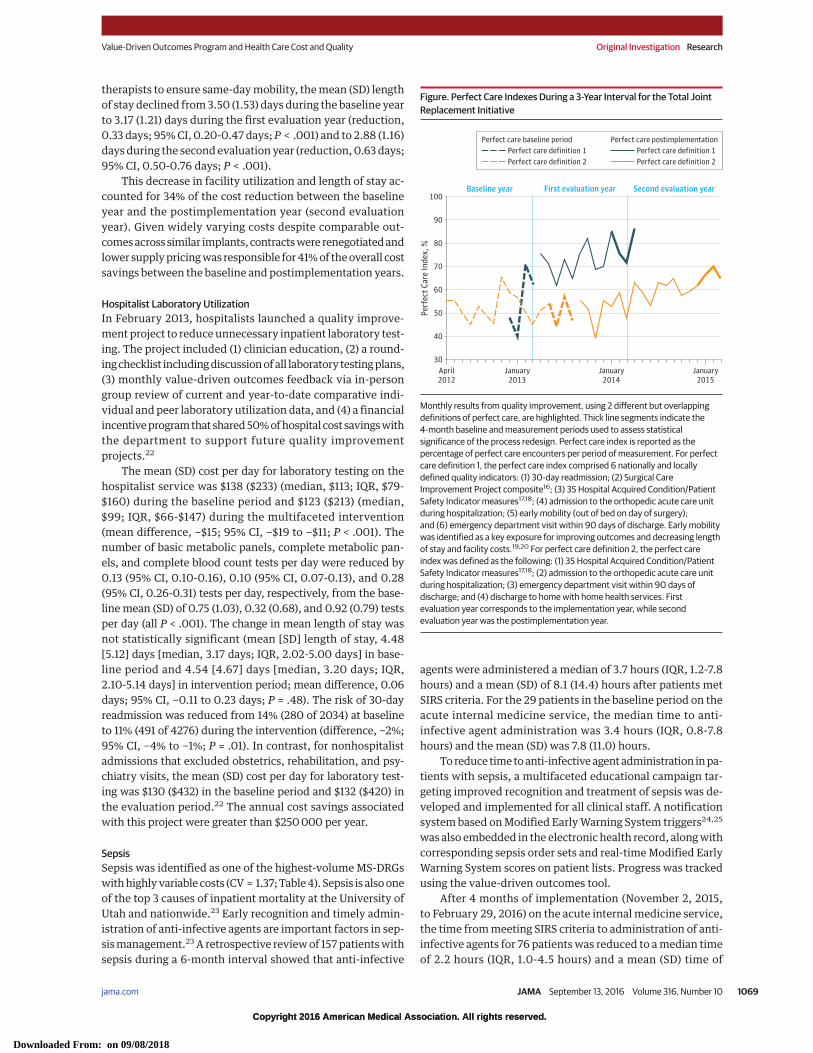
undertook a second stage of continuous improvement and inSeptember 2013 defined a new perfect care index comprisingmeasures 3, 4, and 6 from the original index plus a new mea-sure, successful discharge of the patient to home, supportedby home health services. The 4-month mean for the revisedperfect care index increased from 50% during May throughAugust 2013 to 65% during December 2014 through March 2015(15% absolute increase; 95% CI, 6%-24%; P = .002) (Figure andTable 5).
Compared with the baseline year (n = 634 admissions),mean direct costs were reduced by 7% (95% CI, 3%-11%;P < .001) during the implementation year (first evaluation year,n = 637 admissions) and by 11% (95% CI, 7%-14%; P < .001) be-tween the baseline year and the postimplementation year (sec-ond evaluation year, n = 658 admissions).
During the first improvement cycle, early mobility (out ofbed on the day of surgery) showed the greatest improve-ment. After modifying the schedules of in-house physical
Table 5. Results From Value Improvement Projects (continued)
Outcome Measure
Period Descriptive SummaryaStatistical Comparison of Evaluationvs Baseline Periods
Baseline Evaluation Baseline EvaluationAbsolute Change(95% CI)b
Relative Change,% (95% CI)c P Valued
Mortality, No. (%)
Comparison 1 7/2014-12/2014 11/2015-2/2016 0(n = 29)
3 (4)(n = 76)
NAk NAk .56l
Comparison 2 7/2014-12/2014 11/2015-2/2016 8 (5)(n = 157)
3 (4)(n = 76)
NAk NAk >.99l
Anti-infective agentsin 24 h, No. (%)
For nosocomial andmultidrug-resistantinfectionsm
Comparison 1 7/2014-12/2014 11/2015-2/2016 14 (48)(n = 29)
45 (59)(n = 76)
11 (−11 to 33)i 23 (−18 to 93)i .31j
Comparison 2 7/2014-12/2014 11/2015-2/2016 95 (61)(n = 157)
45 (59)(n = 76)
−1 (−17 to 13)i −2 (−24 to 21)i .85j
For community-acquired infectionsn
Comparison 1 7/2014-12/2014 11/2015-2/2016 17 (59)(n = 29)
50 (66)(n = 76)
7.2 (−12.7 to 31.0)i 12 (−19 to 65)i .48j
Comparison 2 7/2014-12/2014 11/2015-2/2016 96 (61)(n = 157)
50 (66)(n = 76)
4.6 (−9.0 to 18.2)i 8 (−14 to 31)i .48j
Cost per admission,normalized to meanat baseline, mean (SD)
Comparison 1 7/2014-12/2014 11/2015-2/2016 1.0 (1.5)(n = 29)
0.8 (1.0)(n = 76)
NAf −21 (−58 to 40)i .47j
Comparison 2 7/2014-12/2014 11/2015-2/2016 1.0 (1.4)(n = 157)
0.5 (0.7)(n = 76)
NAf −49 (−64 to −23)i <.001j
Abbreviations: IQR, interquartile range; NA, not applicable.a Medians and IQRs are provided for highly skewed continuous variables.b Absolute changes in means or percentages between the baseline and
evaluation periods are presented in the original units of the data and wereestimated using generalized linear models appropriate to each outcomevariable with identity link functions. Wald or likelihood ratio 95% confidenceintervals are presented unless indicated otherwise.
c Relative changes in means or percentages between the baseline andevaluation periods are presented as a percentage change from baseline andwere estimated using generalized linear models appropriate to each outcomevariable with logarithmic link functions. Wald or likelihood ratio 95%confidence intervals are presented unless indicated otherwise.
d P values are from the analyses of relative change unless indicated otherwise.e Definition 1 of the perfect care index comprised 6 nationally and locally
defined quality indicators: (1) 30-day readmission; (2) Surgical CareImprovement Project composite16; (3) 35 Hospital Acquired Condition/PatientSafety Indicator measures17,18; (4) admission to the orthopedic acute care unitduring hospitalization; (5) early mobility (out of bed on day of surgery); and (6)emergency department visit within 90 days of discharge. Early mobility wasidentified as a key exposure for improving outcomes and decreasing length ofstay and facility costs.19,20 Definition 2 of the perfect care index was definedas the following: (1) 35 Hospital Acquired Condition/Patient Safety Indicatormeasures17,18; (2) admission to the orthopedic acute care unit duringhospitalization; (3) emergency department visit within 90 days of discharge;and (4) discharge to home with home health services.
f Absolute data and changes are not provided for cost data owing to thesensitive business nature of these data.
g Wald 95% confidence intervals were constructed by applying a Taylor seriesapproximation to the estimated log-transformed means and standard errors.
h Comparison 1 is restricted to patients within the pilot acute internal medicineservice for both the baseline and evaluation periods. Comparison 2 isrestricted to patients within the acute internal medicine service for theevaluation period but includes the full hospital at baseline.
i Confidence intervals were obtained using the bias-correction and acceleratedbootstrap method with 1000 bootstrap replications.
j Obtained by applying permutation tests to the differences in thelog-transformed means or percentages from the analyses of relative change.
k Omitted owing to insufficient sample size.l Obtained by Fisher exact test.mAnti-infective agents for nosocomial and multidrug-resistant infections
included cefepime hydrochloride, ceftazidime sodium, piperacillin–tazobactam sodium, meropenem sodium, vancomycin hydrochloride, andmetronidazole hydrochloride based on local prescribing patterns.
n Anti-infective agents for community-acquired infections included ceftriaxonesodium, cefazolin sodium, ampicillin–sulbactam sodium, ciprofloxacinhydrochloride, levofloxacin hydrochloride, moxifloxacin hydrochloride,azithromycin dihydrate, oseltamivir phosphate, acyclovir sodium, andvalacyclovir hydrochloride based on local prescribing patterns.
Research Original Investigation Value-Driven Outcomes Program and Health Care Cost and Quality
1068 JAMA September 13, 2016 Volume 316, Number 10 (Reprinted) jama.com
Copyright 2016 American Medical Association. All rights reserved.
Downloaded From: on 09/08/2018
Copyright 2016 American Medical Association. All rights reserved.
therapists to ensure same-day mobility, the mean (SD) lengthof stay declined from 3.50 (1.53) days during the baseline yearto 3.17 (1.21) days during the first evaluation year (reduction,0.33 days; 95% CI, 0.20-0.47 days; P < .001) and to 2.88 (1.16)days during the second evaluation year (reduction, 0.63 days;95% CI, 0.50-0.76 days; P < .001).
This decrease in facility utilization and length of stay ac-counted for 34% of the cost reduction between the baselineyear and the postimplementation year (second evaluationyear). Given widely varying costs despite comparable out-comes across similar implants, contracts were renegotiated andlower supply pricing was responsible for 41% of the overall costsavings between the baseline and postimplementation years.
Hospitalist Laboratory UtilizationIn February 2013, hospitalists launched a quality improve-ment project to reduce unnecessary inpatient laboratory test-ing. The project included (1) clinician education, (2) a round-ing checklist including discussion of all laboratory testing plans,(3) monthly value-driven outcomes feedback via in-persongroup review of current and year-to-date comparative indi-vidual and peer laboratory utilization data, and (4) a financialincentive program that shared 50% of hospital cost savings withthe department to support future quality improvementprojects.22
The mean (SD) cost per day for laboratory testing on thehospitalist service was $138 ($233) (median, $113; IQR, $79-$160) during the baseline period and $123 ($213) (median,$99; IQR, $66-$147) during the multifaceted intervention(mean difference, −$15; 95% CI, −$19 to −$11; P < .001). Thenumber of basic metabolic panels, complete metabolic pan-els, and complete blood count tests per day were reduced by0.13 (95% CI, 0.10-0.16), 0.10 (95% CI, 0.07-0.13), and 0.28(95% CI, 0.26-0.31) tests per day, respectively, from the base-line mean (SD) of 0.75 (1.03), 0.32 (0.68), and 0.92 (0.79) testsper day (all P < .001). The change in mean length of stay wasnot statistically significant (mean [SD] length of stay, 4.48[5.12] days [median, 3.17 days; IQR, 2.02-5.00 days] in base-line period and 4.54 [4.67] days [median, 3.20 days; IQR,2.10-5.14 days] in intervention period; mean difference, 0.06days; 95% CI, −0.11 to 0.23 days; P = .48). The risk of 30-dayreadmission was reduced from 14% (280 of 2034) at baselineto 11% (491 of 4276) during the intervention (difference, −2%;95% CI, −4% to −1%; P = .01). In contrast, for nonhospitalistadmissions that excluded obstetrics, rehabilitation, and psy-chiatry visits, the mean (SD) cost per day for laboratory test-ing was $130 ($432) in the baseline period and $132 ($420) inthe evaluation period.22 The annual cost savings associatedwith this project were greater than $250 000 per year.
SepsisSepsis was identified as one of the highest-volume MS-DRGswith highly variable costs (CV = 1.37; Table 4). Sepsis is also oneof the top 3 causes of inpatient mortality at the University ofUtah and nationwide.23 Early recognition and timely admin-istration of anti-infective agents are important factors in sep-sis management.23 A retrospective review of 157 patients withsepsis during a 6-month interval showed that anti-infective
agents were administered a median of 3.7 hours (IQR, 1.2-7.8hours) and a mean (SD) of 8.1 (14.4) hours after patients metSIRS criteria. For the 29 patients in the baseline period on theacute internal medicine service, the median time to anti-infective agent administration was 3.4 hours (IQR, 0.8-7.8hours) and the mean (SD) was 7.8 (11.0) hours.
To reduce time to anti-infective agent administration in pa-tients with sepsis, a multifaceted educational campaign tar-geting improved recognition and treatment of sepsis was de-veloped and implemented for all clinical staff. A notificationsystem based on Modified Early Warning System triggers24,25
was also embedded in the electronic health record, along withcorresponding sepsis order sets and real-time Modified EarlyWarning System scores on patient lists. Progress was trackedusing the value-driven outcomes tool.
After 4 months of implementation (November 2, 2015,to February 29, 2016) on the acute internal medicine service,the time from meeting SIRS criteria to administration of anti-infective agents for 76 patients was reduced to a median timeof 2.2 hours (IQR, 1.0-4.5 hours) and a mean (SD) time of
Figure. Perfect Care Indexes During a 3-Year Interval for the Total JointReplacement Initiative
100
90
80
70
60
50
40
30April2012
January2013
Perf
ect C
are
Inde
x, %
Baseline year First evaluation year Second evaluation year
January2015
January2014
Perfect care baseline periodPerfect care definition 1Perfect care definition 2
Perfect care postimplementationPerfect care definition 1Perfect care definition 2
Monthly results from quality improvement, using 2 different but overlappingdefinitions of perfect care, are highlighted. Thick line segments indicate the4-month baseline and measurement periods used to assess statisticalsignificance of the process redesign. Perfect care index is reported as thepercentage of perfect care encounters per period of measurement. For perfectcare definition 1, the perfect care index comprised 6 nationally and locallydefined quality indicators: (1) 30-day readmission; (2) Surgical CareImprovement Project composite16; (3) 35 Hospital Acquired Condition/PatientSafety Indicator measures17,18; (4) admission to the orthopedic acute care unitduring hospitalization; (5) early mobility (out of bed on day of surgery);and (6) emergency department visit within 90 days of discharge. Early mobilitywas identified as a key exposure for improving outcomes and decreasing lengthof stay and facility costs.19,20 For perfect care definition 2, the perfect careindex was defined as the following: (1) 35 Hospital Acquired Condition/PatientSafety Indicator measures17,18; (2) admission to the orthopedic acute care unitduring hospitalization; (3) emergency department visit within 90 days ofdischarge; and (4) discharge to home with home health services. Firstevaluation year corresponds to the implementation year, while secondevaluation year was the postimplementation year.
Value-Driven Outcomes Program and Health Care Cost and Quality Original Investigation Research
jama.com (Reprinted) JAMA September 13, 2016 Volume 316, Number 10 1069
Copyright 2016 American Medical Association. All rights reserved.
Downloaded From: on 09/08/2018

Copyright 2016 American Medical Association. All rights reserved.
3.6 (4.7) hours (mean difference from baseline to implemen-tation, −4.1 hours; 95% CI, −9.9 to −1.0 hours; P = .02). Addi-tional details on time to anti-infective agent administration andsecondary measures are provided in Table 5, both in compari-son with the whole-hospital baseline audit sample and a sub-set of this sample restricted to the acute internal medicine ser-vice. There was no significant change in the use of anti-infective agents for nosocomial and multidrug-resistantinfections within 24 hours of SIRS criteria being met, and therewas no significant difference in mortality.
DiscussionImplementing an analytic tool that allocates clinical care costsand quality measures to individual patient encounters was as-sociated with significant improvements in value of care de-livered across 3 clinical conditions that showed high cost varia-tion at baseline. For total joint replacement, a composite qualityindex increased during the 2-year intervention period, andmean direct costs were 7% to 11% lower. The initiative to re-duce hospitalist laboratory testing was associated with 11%lower costs, with no significant change in length of stay and alower 30-day readmission rate. A sepsis intervention was as-sociated with reduced mean times to anti-infective adminis-tration following fulfillment of SIRS criteria in patients withinfection.
As identified by an Institute of Medicine report,2 variabil-ity in the delivery of health care is one of the greatest oppor-tunities to improve quality and reduce costs through processimprovement and standardization. With component cost analy-ses, the underlying drivers of cost variability can be identi-fied and allow targeted interventions, such as supply negotia-tions or staff management in the case of the total jointreplacement initiative. The capacity to measure the quality andcost implications of interventions in real time facilitates phy-sician engagement and assurance that cost-reduction initia-tives can lead to quality improvement and vice versa.
The value-driven outcomes tool can quantify quality interms of blended indexes that incorporate both nationally en-dorsed and validated measures as well as local physician- andpatient-defined outcome measures. Clinician-defined qual-ity indexes have the advantage of securing greater physicianengagement in quality improvement processes, leveraging lo-cal drivers of quality,26 and providing a simple framework thatcan be modified over time and across practice sites. This frame-work also allows efficient incorporation of new standardizedmeasurement sets and tailored risk adjustment. For ex-ample, 8 patient satisfaction survey instruments and 39 pa-tient-reported outcome survey instruments have recently beenincorporated into the value-driven outcomes program. Thesemeasures play an increasing role in the assessment of valueof clinical care from patients’ perspectives. Ongoing efforts in-clude risk adjustment in patient quality and outcome mea-sures and broadening the definition of outcome measures toinclude patient experience and patient-reported outcomes.
Health systems and individual physicians are increas-ingly held accountable for both the quality and cost of care they
provide as is evident by the recent Medicare Access and CHIPReauthorization Act of 2015 (MACRA),27 but recent researchon cost reform primarily focuses on cost from the payer’s per-spective. Charge transparency is embraced by payers as a strat-egy to drive cost reduction through informed consumer choiceand price competition. For example, ProMedica28 posts de-tailed price sheets online for each of their hospitals and clin-ics for most services. Other efforts, such as those ongoing inMaryland, require public and private payers to pay the samerates, leading to reduced costs for private payers and success-ful cost containment.29 However, without quality and out-come transparency, such as that championed by the Centersfor Medicare & Medicaid Services,18 patients are not able tomake truly informed health care choices.
While patients as consumers can create market forces toreduce health care costs, clinicians and health care systemshave the greatest opportunity, the most knowledge, and theresponsibility to improve value.30-32 A study of 696 trauma ad-missions to the University of Michigan concluded that 35% ofthe total costs per patient were under the immediate controlof physicians.33 Alternative payment models shift the focusfrom charges to the cost of care delivery. Within this context,there is an alternative, complementary strategy to managingcosts while also attending to quality: transparency of cost andoutcome data to physicians at the level of individual encoun-ters and conditions.
This work to measure and improve care value builds onothers’ work on the use of data and performance feedback toimprove clinical practice.34 Regular feedback through thevalue-driven outcomes tool is critical to monitoring status; de-fining clear targets, action plans, and supportive tools; and pro-viding peer comparison data (eFigure 1 and eFigure 2 in theSupplement).
This work also builds on others’ efforts to improve care valueat the enterprise level.2,35 Best practices in value improvementthat have been adopted include top-level leadership focus onvalue improvement; a culture of continuous improvement; le-veraging information technology to identify opportunities, trackprogress, and support evidence-based care; and engaging mul-tidisciplinary teams to redesign care processes, reduce unwar-ranted variation, and improve care value.
The tools needed to understand variation in costs and out-comes at a unit of analysis that is actionable (individual pa-tients with specific clinical conditions) have not been gener-ally available to date. The value-driven outcomes costingmethod relies on a combination of actual costs measured fromsources such as the supply management system, time-basedallocations (per minute or per hour in the intensive care unit,operating room, or emergency department, for example), andwRVU-based allocations (physician costs).7 By creating peer-to-peer physician comparisons and by targeting areas with thehighest variability across the enterprise, we create opportu-nities to systematically deliver more affordable, higher-quality care.
There are alternative, more precise, and also more labor-intensive costing methods. With time-driven activity-basedcosting,6 process mapping is undertaken for specific clinicalconditions, and costing is determined by an average capacity
Research Original Investigation Value-Driven Outcomes Program and Health Care Cost and Quality
1070 JAMA September 13, 2016 Volume 316, Number 10 (Reprinted) jama.com
Copyright 2016 American Medical Association. All rights reserved.
Downloaded From: on 09/08/2018
Copyright 2016 American Medical Association. All rights reserved.
cost rate (dollars per minute) for each clinical resource and per-sonnel, multiplied by the time spent by each resource in-volved in the process. Unlike time-driven activity-based cost-ing wherein costs are determined individually for eachclinical condition, the value-driven outcomes approach pro-vides a scalable measurement solution across diagnoses andthe entire health care enterprise. Moreover, with the value-driven outcomes tool, all allocated costs for a given period rec-oncile to the actual hospital accounting expenses (general led-ger) for that same period. Our costing method, like most costaccounting systems,36 also enables assessment of system-wide resource allocations and facilitates analysis of trends inservice demand.
However, this approach and this study have several limi-tations. First, the data and approach lack insight into care pro-vided outside the health care organization, particularly forpharmacy, laboratory, and imaging services. Based on pa-tients within the University of Utah health insurance plan, anestimated 40% of laboratory services and 30% of imaging ser-vices are provided outside the health care organization. Sec-ond, Utah has unique population characteristics—the popu-lation is younger and more physically active compared withthe national average,37 so the findings may not be completelygeneralizable to health systems in other states. Third, the clini-cal improvement studies used pre-post designs generallywithout concurrent control groups or statistical adjustment forpotential confounding factors, so causality cannot be estab-lished. Fourth, continuous quality improvement includes apackage of changes that can be adapted over time. As such, thediscrete component that contributes most to change cannotbe isolated.
Fifth, physicians were not blinded to the interventions, butrather were aware of the outcomes being assessed as part ofthe process. For example, the orthopedic surgeons and physi-cal therapists knew that early mobility was a key componentof perfect care following total joint replacement. This compo-nent of the quality improvement process likely influenced theobserved outcomes. Sixth, exposing outcomes and costs pub-licly could lead to unintended consequences, such as clini-cians shifting away from providing care to higher-cost, higher-risk patients. Risk adjustment in quality and outcome measuresmay mitigate these effects. The analytic framework currently
has limited risk adjustment; consequently, changes in costs andoutcomes may be confounded by unaccounted changes in pa-tient risk profiles. To date, the overall case mix index at theUniversity of Utah has remained relatively stable, although on-going evaluation will be needed.
Seventh, the value-driven outcomes tool includes only di-rect costs. Indirect overhead costs such as information tech-nology, administrative staff, hospital operations, and mainte-nance are generally estimated to represent almost half of totalhospital costs, increasing more rapidly than medical infla-tion during the past decade.38 Similar tools are needed to as-sess the relationship of indirect costs with quality and care. Fur-thermore, direct costs per admission or per outpatient visit arenot reported owing to the sensitive business nature of thesedata. Finally, there is also a need to further demonstrate thegeneralizability and scalability of the value-driven outcomesapproach across many more conditions and units, both at theUniversity of Utah and at other health care systems.
These limitations reflect the complexity of transforminga health care system from one based on volume to one basedon value. Health care systems and their related hospitals arecomplex organizations, particularly those in academic medi-cal centers where clinical care encounters competing agen-das such as research and education. The variable distributionof costs of clinical services (as shown in Table 3 and Table 4)reflects the University of Utah experience and most likely willvary according to institution. The goals of the value-driven out-comes program were to estimate and increase awareness ofthis variation across units, departments, and clinicians; at-tempt to reduce that variation; and thereby reduce costs andimprove quality.
ConclusionsImplementation of a multifaceted value-driven outcomes toolto identify high variability in costs and outcomes in a largesingle health care system was associated with reduced costsand improved quality for 3 selected clinical projects. There maybe benefit for physicians to understand actual care costs (notcharges) and outcomes achieved for individual patients withdefined clinical conditions.
ARTICLE INFORMATION
Author Contributions: Dr Lee and Mr Park had fullaccess to all of the data in the study and takeresponsibility for the integrity of the data and theaccuracy of the data analysis.Concept and design: Lee, Kawamoto, Johnson, Pelt,Pendleton.Acquisition, analysis, or interpretation of data:Kawamoto, Hess, Park, Young, Hunter, Johnson,Gulbransen, Pelt, Horton, Graves, Greene, Anzai,Pendleton.Drafting of the manuscript: Lee, Kawamoto, Hess,Hunter, Johnson, Gulbransen, Pelt, Horton, Greene,Pendleton.Critical revision of the manuscript for importantintellectual content: Lee, Kawamoto, Hess, Park,Young, Johnson, Gulbransen, Pelt, Horton, Graves,Anzai, Pendleton.
Statistical analysis: Kawamoto, Young, Greene.Administrative, technical, or material support: Lee,Kawamoto, Park, Young, Hunter, Johnson,Gulbransen, Anzai, Pendleton.Study supervision: Park, Pelt, Pendleton.
Conflict of Interest Disclosures: All authors havecompleted and submitted the ICMJE Form forDisclosure of Potential Conflicts of Interest. TheUniversity of Utah Health Sciences Center iscurrently exploring potential options formaximizing the adoption and effects of the value-driven outcomes analytical tool, includingpotentially the provision of commercial productsand services based on the tool; Drs Lee andKawamoto, Messrs Park and Young, and Ms Hunterwere codevelopers of the tool. Messrs Park andYoung reported being a nonequity coinventor oftechnologies for delivering health care data
applications using multitenant clouds and softwareagents and having patents pending for“Multi-tenant Cloud for Healthcare Data ApplicationDelivery” and “Agent for Healthcare DataApplication Delivery.” Dr Pelt reported receivingpersonal fees and research support outside thesubmitted work related to consulting, speaker’sbureaus, and unrelated research from ZimmerBiomet. No other disclosures were reported.
Funding/Support: The statistical analyses weresupported by the University of Utah Study Designand Biostatistics Center, with funding in part fromthe National Center for Research Resources and theNational Center for Advancing TranslationalSciences, National Institutes of Health, throughgrant 5UL1TR001067-02.
Value-Driven Outcomes Program and Health Care Cost and Quality Original Investigation Research
jama.com (Reprinted) JAMA September 13, 2016 Volume 316, Number 10 1071
Copyright 2016 American Medical Association. All rights reserved.
Downloaded From: on 09/08/2018

Copyright 2016 American Medical Association. All rights reserved.
Role of the Funder/Sponsor: The funders had norole in the design and conduct of the study;collection, management, analysis, andinterpretation of the data; preparation, review, orapproval of the manuscript; and decision to submitthe manuscript for publication.
Additional Contributions: We thank the teamsfrom the University of Utah Enterprise DataWarehouse, Decision Support, Department ofBiomedical Informatics, administrative staff,physicians, and care teams who contributed to thedevelopment of the value-driven outcomes tooland its implementation. Angela Presson, PhD,University of Utah, Salt Lake City, assisted withstatistical analyses for sepsis quality improvement;Polina Kukhareva, MPH, MS, University of Utah,Salt Lake City, assisted with statistical analysesfor laboratory testing improvement; and DanielleSample, MPH, and Joe Borgenicht, University ofUtah, Salt Lake City, provided editorial assistance;they received no additional compensationfor this work.
REFERENCES
1. Conway PH. Value-driven health care:implications for hospitals and hospitalists. J Hosp Med.2009;4(8):507-511.
2. Institute of Medicine. Best care at lower cost:the path to continuously learning health care inAmerica. http://www.nationalacademies.org/hmd/Reports/2012/Best-Care-at-Lower-Cost-The-Path-to-Continuously-Learning-Health-Care-in-America.aspx. Published September 6, 2012.Accessed February 19, 2016.
3. Keehan SP, Cuckler GA, Sisko AM, et al. Nationalhealth expenditure projections, 2014-24: spendinggrowth faster than recent trends. Health Aff(Millwood). 2015;34(8):1407-1417.
4. Alternative Payment Model Framework andProgress Tracking (APM FPT) Work Group.Alternative Payment Model (APM) Framework.https://hcp-lan.org/groups/alternative-payment-model-apm-framework-and-progress-tracking-work-group/. Accessed February 12, 2016.
5. Mandigo M, O’Neill K, Mistry B, et al.A time-driven activity-based costing model toimprove health-care resource use in Mirebalais,Haiti. Lancet. 2015;385(suppl 2):S22.
6. Kaplan RS, Witkowski M, Abbott M, et al. Usingtime-driven activity-based costing to identify valueimprovement opportunities in healthcare. J HealthcManag. 2014;59(6):399-412.
7. Kawamoto K, Martin CJ, Williams K, et al. ValueDriven Outcomes (VDO): a pragmatic, modular, andextensible software framework for understandingand improving health care costs and outcomes.J Am Med Inform Assoc. 2015;22(1):223-235.
8. Porter ME, Teisberg EO. Redefining Health Care:Creating Value-Based Competition on Results. Boston,MA: Harvard Business School Press; 2006.
9. University HealthSystem Consortium. Mortalityrisk adjustment methodology for University Health
System’s Clinical Data Base. http://archive.ahrq.gov/professionals/quality-patient-safety/quality-resources/tools/mortality/Meurer.pdf. AccessedFebruary 18, 2016.
10. Lee VS, Miller T, Daniels C, Paine M, Gresh B,Betz AL. Creating the exceptional patientexperience in one academic health system. Acad Med.2016;91(3):338-344.
11. Cella D, Yount S, Rothrock N, et al; PROMISCooperative Group. The Patient-ReportedOutcomes Measurement Information System(PROMIS): progress of an NIH Roadmapcooperative group during its first two years. MedCare. 2007;45(5)(suppl 1):S3-S11.
12. ABIM Foundation. Society of Hospital Medicine:adult hospital medicine. http://www.choosingwisely.org/societies/society-of-hospital-medicine-adult/. Accessed January 29, 2016.
13. Bone RC, Balk RA, Cerra FB, et al. Definitions forsepsis and organ failure and guidelines for the useof innovative therapies in sepsis. Chest. 1992;101(6):1644-1655.
14. McCullagh P, Nelder JA. Generalized LinearModels. 2nd ed. London, England: Chapman &Hall/CRC; 1989.
15. DiCiccio TJ, Efron B. Bootstrap confidenceintervals. Stat Sci. 1996;11(3):189-228. doi:10.1214/ss/1032280214.
16. The Joint Commission. Surgical CareImprovement Project. https://www.jointcommission.org/surgical_care_improvement_project/. Accessed January 10, 2016.
17. Agency for Healthcare Research and Quality.Patient Safety Indicators Technical SpecificationsUpdates, Version 5.0, March 2015. http://www.qualityindicators.ahrq.gov/modules/PSI_TechSpec.aspx. Accessed January 10, 2016.
18. Centers for Medicare & Medicaid Services.Hospital Compare. https://www.medicare.gov/hospitalcompare/Data/Hospital-Acquired-Conditions.html?AspxAutoDetectCookieSupport=1.Accessed January 10, 2016.
19. Munin MC, Rudy TE, Glynn NW, Crossett LS,Rubash HE. Early inpatient rehabilitation afterelective hip and knee arthroplasty. JAMA. 1998;279(11):847-852.
20. Tayrose G, Newman D, Slover J, Jaffe F, HunterT, Bosco J III. Rapid mobilization decreaseslength-of-stay in joint replacement patients. BullHosp Jt Dis (2013). 2013;71(3):222-226.
21. Pelt CE, Anderson MB, Pendleton R, Foulks M,Peters CL, Gililland JM. Improving value in primarytotal joint arthroplasty care pathways: changes ininpatient physical therapy staffing [publishedonline March 23, 2016]. Arthroplasty Today.doi:10.1016/j.artd.2016.02.003.
22. Yarbrough PM, Kukhareva PV, Horton D,Edholm K, Kawamoto K. Multifaceted interventionincluding education, rounding checklistimplementation, cost feedback, and financialincentives reduces inpatient laboratory costs.J Hosp Med. 2016;11(5):348-354.
23. Dellinger RP, Levy MM, Rhodes A, et al;Surviving Sepsis Campaign Guidelines CommitteeIncluding the Pediatric Subgroup. Surviving sepsiscampaign: international guidelines for managementof severe sepsis and septic shock: 2012. Crit Care Med.2013;41(2):580-637.
24. Prytherch DR, Smith GB, Schmidt PE,Featherstone PI. ViEWS—towards a national earlywarning score for detecting adult inpatientdeterioration. Resuscitation. 2010;81(8):932-937.
25. Subbe CP, Kruger M, Rutherford P, Gemmel L.Validation of a modified Early Warning Score inmedical admissions. QJM. 2001;94(10):521-526.
26. Berwick DM, Feeley D, Loehrer S. Change fromthe inside out: health care leaders taking the helm.JAMA. 2015;313(17):1707-1708.
27. Burwell SM. Setting value-based paymentgoals: HHS efforts to improve U.S. health care.N Engl J Med. 2015;372(10):897-899.
28. ProMedica. Patient pricing request. https://www.promedica.org/Pages/patient-pricing-request.aspx.Accessed December 4, 2015.
29. Murray R. Setting hospital rates to control costsand boost quality: the Maryland experience. HealthAff (Millwood). 2009;28(5):1395-1405.
30. Eisenberg JM, Rosoff AJ. Physicianresponsibility for the cost of unnecessary medicalservices. N Engl J Med. 1978;299(2):76-80.
31. Eisenberg JM. Physician utilization: the state ofresearch about physicians’ practice patterns. MedCare. 1985;23(5):461-483.
32. Lowet PF, Eisenberg JM. Can information oncost improve clinicians’ behavior? lessons fromhealth care trials and management theory. Int JTechnol Assess Health Care. 1997;13(4):553-561.
33. Taheri PA, Butz D, Griffes LC, Morlock DR,Greenfield LJ. Physician impact on the total cost ofcare. Ann Surg. 2000;231(3):432-435.
34. Kiefe CI, Allison JJ, Williams OD, Person SD,Weaver MT, Weissman NW. Improving qualityimprovement using achievable benchmarks forphysician feedback: a randomized controlled trial.JAMA. 2001;285(22):2871-2879.
35. Cosgrove DM, Fisher M, Gabow P, et al.Ten strategies to lower costs, improve quality, andengage patients: the view from leading healthsystem CEOs. Health Aff (Millwood). 2013;32(2):321-327.
36. Shepard DS, Hodgkin D, Anthony YE. Analysisof hospital costs: a manual for managers.http://apps.who.int/iris/bitstream/10665/42197/1/9241545283.pdf. Accessed February 14, 2016.
37. Utah Department of Health. Public HealthIndicator Based Information System (IBIS).http://ibis.health.utah.gov/indicator/index/alphabetical.html. Accessed May 20, 2016.
38. Kalman NS, Hammill BG, Schulman KA,Shah BR. Hospital overhead costs: the neglecteddriver of health care spending? J Health Care Finance.2015;41(4):1-15.
Research Original Investigation Value-Driven Outcomes Program and Health Care Cost and Quality
1072 JAMA September 13, 2016 Volume 316, Number 10 (Reprinted) jama.com
Copyright 2016 American Medical Association. All rights reserved.
Downloaded From: on 09/08/2018